
China Air Quality Management Assessment Report (2015)
Lite Edition
This series applies CAAC management and evaluation tools to support Chinese provinc-
es and cities to systematically evaluate their air quality management systems. The goal is to
assist them in a sustainable manner to construct and ameliorate their quality management
systems, and to select and implement efficient air quality management measures. This se-
ries of reports is compiled together by CAAC secretariat, CAAC member provinces and cities
and CAAC experts.
CAAC Clean Air Management Report
AuthorsInnovation Center for Clean-air Solutions (ICCS)
Tonny Xie, Lisha Wang, Xuan Ling, Xin Shen, Mudan Wang, Tianyang Fu
Contributing ExpertsProf. Hao Jiming, Academician, China Academy of Engi-neering, Tsinghua University
Prof. Chen Jianmin, Dean, Department of Environment Sci-ence and Engineering, Fudan University
Mr. Jia Feng, Director, Center for Environmental Education and Communications of MEP
Mr. Lei Yu, Deputy Director, Chinese Academy for Environmental Planning
Prof. Mao Xianqiang, Director, Center for Global Environ-mental Policy, Beijing Normal University
Mr. Ren Hongyan, Deputy Director General, Appraisal Center of Environmental Engineering of MEP
Prof. Tang Dagang, Professor, Chinese Research Academy of Environmental Sciences
Mr. Xue Wenbo, Research Director, Chinese Academy for Environmental Planning
Prof. Yang Jintian, Deputy Chief Engineer, China Academy of Environmental Planning
AcknowledgementCAAC Steering Committee
Chinese Academy of Environmental Planning
Shenzhen Academy of Environmental Sciences
Energy Foundation
Disclaimer: The views expressed in this report are based
on the analysis and summary of the public documents
and do not necessarily reflect the views and policies of
CAAC and its members. CAAC does not guarantee the
accuracy of the data included in this publication and
accepts no responsibility for any consequence of their
use. CAAC encourages printing or copying information
exclusively for personal and noncommercial use with
proper acknowledgement of CAAC. Users are restricted
from reselling, redistributing, or creating derivative
works for commercial purpose without the express,
written consent of CAAC Secretariat.
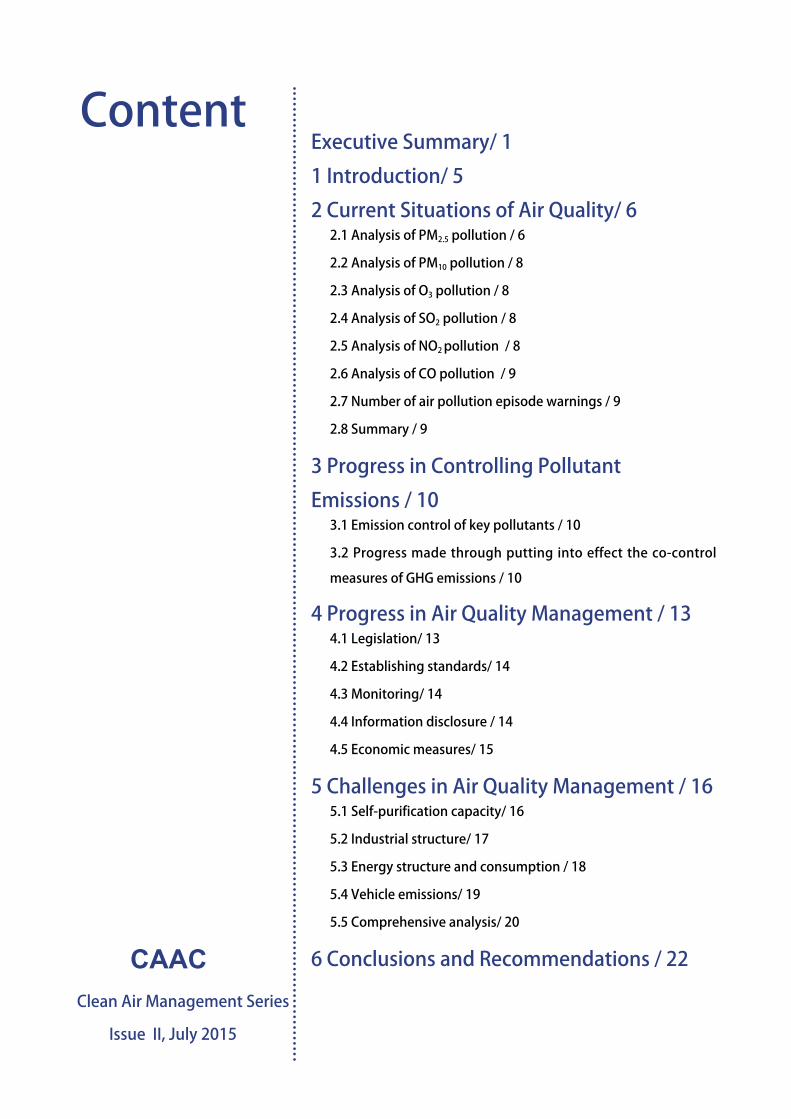
ContentExecutive Summary/ 1
1 Introduction/ 5
2 Current Situations of Air Quality/ 6 2.1 Analysis of PM2.5 pollution / 6
2.2 Analysis of PM10 pollution / 8
2.3 Analysis of O3 pollution / 8
2.4 Analysis of SO2 pollution / 8
2.5 Analysis of NO2 pollution / 8
2.6 Analysis of CO pollution / 9
2.7 Number of air pollution episode warnings / 9
2.8 Summary / 9
3 Progress in Controlling Pollutant
Emissions / 103.1 Emission control of key pollutants / 10
3.2 Progress made through putting into effect the co-control
measures of GHG emissions / 10
4 Progress in Air Quality Management / 134.1 Legislation/ 13
4.2 Establishing standards/ 14
4.3 Monitoring/ 14
4.4 Information disclosure / 14
4.5 Economic measures/ 15
5 Challenges in Air Quality Management / 165.1 Self-purification capacity/ 16
5.2 Industrial structure/ 17
5.3 Energy structure and consumption / 18
5.4 Vehicle emissions/ 19
5.5 Comprehensive analysis/ 20
6 Conclusions and Recommendations / 22 CAACClean Air Management Series
Issue II, July 2015
2015 C h i n a A i r Q u a l i t y M a n a g e m e n t A s s e s s m e n t R e p o r t
1
图片
Executive Summary
In recent years, the dire air pollution in China
has aroused extensive concerns from both the
government and the general public as well as attracted
attentions from international community. In 2013,
the State Council officially promulgated the "Air
Pollution Prevention and Control Action Plan (2013-
2017)" (hereafter referred to as the "Ten Measures
of Air"). As a result of this Plan, all provinces,
autonomous regions and municipalities directly under
the central government (hereinafter referred to as
"provinces/cities") made unprecedented efforts to
control air pollution in order to meet the targets set in
the Ten Measures of Air.
One year after the launch of Ten Measures
of Air, China's overall air quality has improved
greatly. In 2014, the annual average concentration
of PM2.5 fell by 11.92% across ten provinces/cities/
region (Beijing, Tianjin, Hebei, Shandong, Shanxi,
Shanghai, Jiangsu, Zhejiang, Pearl River Delta and
Chongqing) in key PM2.5 control areas. Among 74
key cities, the number of the cities with air quality
that attained China's Ambient Air Quality Standards
(AAQS GB 3095-2012) has increased from three to
eight1. The annual average concentrations of PM2.5,
PM10, SO2 and NO2 in these 74 cities also declined
since 20132. Through the joint efforts of Beijing and
its surrounding provinces, Beijing's average PM2.5
concentration has decreased 40% 3(compared with
the business as usual level) during the 2014 APEC
conference, reaching 43 µg/m3.
According to international experiences,
sustainable air quality improvement requires
scientific tools and systematic management support.
This report analyzes air quality conditions, efforts
around emission control (including co-control
of greenhouse gases emissions) and air quality
management, as well as various challenges faced in
2014 across 30 provinces/cities in mainland China
except Tibet, which was not included due to data
availability. The report serves to provide information
to help provinces/ci t ies improve air quali ty
management strategies.
Major findings of this report include:
▲ China’s overall air quality significantly
improved in 2014
The annual average PM2.5 concentration in
1. Ministry of Environmental Protection http://www.zhb.gov.cn/gkml/hbb/qt/201502/t20150202_295333.
htm?COLLCC=3600076364&
2. Data from The State of Environment in China in 2014
3. Beijing Municipal Environmental Protection Bureau http://www.bjepb.gov.cn/bjepb/324122/416697/index.html
2015C h i n a A i r Q u a l i t y M a n a g e m e n t A s s e s s m e n t R e p o r t
2
pollution category was PM pollution, closely
followed by O3 and NO2 pollution. In northern
regions, excessive SO2 concentration occured
frequently during winter heating seasons.
Areas with serious PM2.5 pollution were
Beijing, Tianjin, Hebei (also known as the Jing-Jin-
Ji regions) and their surrounding regions and Henan,
among which Henan was one of the most polluted
provinces. Some areas in Hubei, Hunan, Shichuan
and Chongqing were also heavily polluted by PM2.5,
and experienced concentrations higher than that of
the Yangtze River Delta region.
The Jing-Jin-Ji and their surrounding regions had
the highest concentrations in China for all six major
pollutants (regulated by the AAQS standards) and had
also most frequently issued warnings for air pollution
episodes. Therefore, these areas were facing higher
pressure to take control of regional air quality all met
AAQS standards; and out of 27 provinces/cities that
published annual average NO2 concentrations, five
exceeded upper limits of the AAQS standards. All 9
provinces/cities that published the annual average CO
concentrations met AAQS standards.
▲ S O 2 a n d N O X e m i s s i o n s r e d u c e d
significantly. Improvements were also made in
controlling mercury emissions and the co-control of
greenhouse gas emissions.
the majority of key PM2.5 control areas decreased
significantly from 2013 levels. The average PM2.5
reduction across ten major provinces/cities/region
including Beijing, Tianjin, Hebei, Shandong, Shanxi,
Shanghai, Jiangsu, Zhejiang, Pearl River Delta and
Chongqing reached 11.92%. PM2.5 annual average
concentrations in Shanxi, Shandong and Shanghai
all declined more than 16% when compared to 2013
levels and were significantly closer to the PM2.5
targets for 2017. Out of the 27 provinces/cities that
published annual average PM10 concentrations, six
met AAQS secondary standards. Looking at other
major pollutants, out of nine provinces/cities that
published the annual average O3 concentrations4, only
one exceeded the upper limits of AAQS standards;
out of 27 provinces/cities that published annual
average SO2 concentrations, all met AAQS standards;
and out of 27 provinces/cities that published annual
average NO2 concentrations, five exceeded upper
limits of the AAQS standards. All 9 provinces/cities
that published the annual average CO concentrations5
met AAQS standards.
▲ PM pollution posed the most significant
problem with pollution levels varying widely in
different areas. Some regions still faced enormous
challenges in the future
Among 30 provinces/cities, the most server
4. According to the annual evaluation calculation method given by the Code of Ambient Air Quality Evaluation Technologies
(Pilot Version), the 90th percentile of the moving average value of daily maximum eight hours is taken as the annual average
concentration of O3.
5. According to the annual evaluation calculation method given by the Code of Ambient Air Quality Evaluation Technologies
(Pilot Version), the 95th percentile of the mean concentration over 24 hours is taken as the annual average concentration of CO.
2015 C h i n a A i r Q u a l i t y M a n a g e m e n t A s s e s s m e n t R e p o r t
3
When compared to 2013 levels, national
SO2 and NOX emissions in 2014 were reduced by
3.4% and 6.7%, respectively4. Most provinces/
cities achieved significant SO2 and NOX emissions
reductions, especially Xinjiang. An increasing
amount of attention was paid to mercury emissions;
six provinces/cities promulgated Implementation
Plans for Mercury Pollution Control. Moreover,
more measures for co-controlling greenhouse gas
emissions were developed. A negative growth of total
coal consumption—2.9% decrease from 2013—was
seen throughout China for the first time over the past
15 years6, and 14 provinces/cities set up targets to
control total coal consumption. All tasks of removing
outdated vehicles and yellow-label vehicles that do
not meet emission requirements were completed.
▲ Central and local legislation and standards
improved dramatically. Progress was made in
monitoring systems, information disclosure efforts
and economic mechanisms.
The 2014 revised Environmental Protection
Law is known as the most stringent environmental
law in the history of China. Recently, the new Law of
Prevention and Control of Air Pollution also passed
the first review by National People's Congress.
Altogether, 15 national air pollution standards were
issued and 15 new local standards were implemented
in 2014. The whole country is one year ahead
of schedule for executing new urban air quality
monitoring system. Some progress was seen around
information disclosure efforts, especially in Tianjin,
Shandong and Jiangsu. Gaps for transparency still
remained in releasing historical monitoring data
and review of air pollution control implementation
plans. There was also progress around economic
mechanisms to enforce policies, such as pollution
discharge fees and administrative penalties.
▲ There are obvious discrepancies among
regions when looking at upcoming challenges in
air quality control. Industrial structure, energy
consumption and vehicle emission are facing
increasing reform pressures.
Industrial structure, energy consumption and
vehicle emissions all have the potential to affect
regional air pollution levels. Therefore, it is necessary
to assess, plan and manage pollution sources from
the beginning. Industrial structure in Beijing,
Shanghai and Guangdong perform relatively well in
terms of impact on air quality, but other provinces/
cities are facing large pressures to change industrial
structure. There are seven provinces/cities where
heavily polluting industries contribute to more than
60% of local GDP. Additionally, seven provinces/
cities have more than 80% of their primary energy
needs provided by coal. Coal consumption per square
kilometer differs greatly among these regions, as well
as consumption per unit GDP—Ningxia, for example
has a relatively higher consumption.
6.Data from The State of Environment in China in 2014
7. Data from Statistical Communiqué on National Economic and Social Development 2014

2015C h i n a A i r Q u a l i t y M a n a g e m e n t A s s e s s m e n t R e p o r t
4
In terms of transportation, vehicles retained per
capita in 29 provinces/cities (except for Beijing) were
at least 13% higher in 2013 than in 2012, highlighting
the pollution control pressures. Some provinces/cities
including Beijing, Shanghai, Jiangsu and Guangdong
introduced stricter vehicle gasoline/diesel standards.
Shenzhen is the only mega city with over 10
million populations that attained the AAQS standards
in China in 2014. While strengthening pollution
control efforts, Shenzhen continues to regulate
its industrial structure and energy systems and
vigorously promotes new-energy vehicles. The city’s
work to meet air quality standards while maintaining
economic development is worth of recognition.

2015 C h i n a A i r Q u a l i t y M a n a g e m e n t A s s e s s m e n t R e p o r t
5
Chapter 1 Introduction
With the support of experts of the Clean Air
Alliance of China (CAAC), the Innovation Center
for Clean-air Solutions (ICCS) analyzed current air
quality conditions and progress in efforts around
pollutant emission control and management. The
study looked at 30 provinces/cities in mainland
China except for Tibet, which was not included due
to data availability. The objectives of this report are:
to provide references for air quality management
strategies, to help individual province/city understand
the status quo of its pollution and to discover
pollution control difficulties and challenges. By using
existing cases, provinces/cities can push for larger
improvements in air quality.
The China Air Quality Management Assessment
Report is a series of documents that include national,
provincial and municipal level reports. The China Air
Quality Management Assessment Report (2015) Lite
Edition is a national report in the series. The default
data the report uses are collected during year 2014.
Since some data are unavailable, data collected in
2013 or 2012 are used in some places in the report
with footnote. China Air Quality Management
Assessment Report (2015) Complete Edition will be
released at the end of 2015. The data in the report will
then be updated, and more contents will be included.

2015C h i n a A i r Q u a l i t y M a n a g e m e n t A s s e s s m e n t R e p o r t
6
Chapter 2 Current Situations of Air Quality
composing of Jing-Jin-Ji and their surrounding
regions, and Henan were severely polluted by PM2.5.
Of this area, Beijing and south of Beijing were most
heavily polluted. Parts of Henan had PM2.5 annual
average concentrations close to 150 mg/m3.
Parts of Hubei, Hunan, Sichuan and Chongqing were
more polluted than the Yangtze River Delta.
Fig 2-1 shows that parts of Hubei, Hunan,
Sichuan and Chongqing were two additional areas
with heavy PM2.5 pollution that were more severe than
that of the Yangtze River Delta. The Yangtze River
Delta and the Pearl River Delta also had notable PM2.5
pollution.
In 2014, the average PM2.5 reduction across ten major
provinces/municipalities/autonomous regions was
11.92%, when compared to that of 2013. The regions
were Beijing, Tianjin, Hebei, Shandong, Shanxi,
Shanghai, Jiangsu, Zhejiang, Pearl River Delta and
Chongqing.
In order to analyze the air quality in each
individual province/city in China, this report
investigates the annual average concentrations of six
air pollutants (PM2.5, PM10, O36, SO2, NO2 and CO7)
and the warnings for air pollution episodes mainly
based on the Report on the State of the Environment
released by each individual province/city.
2.1 Analysis of PM2.5 pollutionPM2.5 pollution varied greatly among different areas
The satellite inversion graph on the ground level
PM2.5 concentration throughout China in 2014 is
shown in Fig 2-1. The figure shows that China's PM2.5
pollution varied in different areas and was especially
severe in several regions.
A large continuous area composing of Jing-Jin-
Ji and their surrounding regions, and Henan were
seriously polluted by PM2.5, of which Henan Province
is especially polluted
Fig. 2-1 shows that a large continuous area

2015 C h i n a A i r Q u a l i t y M a n a g e m e n t A s s e s s m e n t R e p o r t
7
According to the data released by each province/
city on the Report on the State of the Environment,
the annual average PM2.5 concentration in Tianjin,
Hebei, Shandong and Shanxi9 in Jing-Jin-Ji and
their surrounding regions decreased by more than
10% in 2014 when compared to 2013 data, of which
Shanxi and Shandong decreased PM2.5 by more than
16%. Beijing’s PM2.5 was reduced by only 4%. In
the Yangtze River Delta, Shanghai achieved the
largest PM2.5 reduction with 16.1%, and Zhejiang and
Jiangsu reduced PM2.5 by around 10%. The annual
average PM2.5 concentration in the Pearl River Delta
was lower than that of the regions around Jing-Jin-
Ji and the Yangtze River Delta. With a 10% decrease
in 2014, Pearl River Delta’s PM2.5 concentration was
closest to meeting national standards10. Chongqing
also decreased its annual average PM2.5 concentration.
8.The bright, reflective ground surfaces in desert and snowy regions can affect satellites' efforts to pick up information about
particle concentrations. As a result, the high levels of PM2.5 concentration depicted in West China deviate significantly from
real-life situations.
9.Data of Shanxi are gathered not from the Report on the State of the Environment, but from news.cn: http://news.xinhuaet.
com/local/2015-01/16/c_1114021310.htm
10. The national standards for the six pollutants mentioned in this report are derived from the Ambient Air Quality Standard
(GB3095-2012) (also known as the "New Standards on Air Quality").
Fig 2-1. Satellite inversion graph of ground level PM2.5 concentrations throughout China in 20148
PM2.5 concentration (µg/m3)
150
24South ChinaSea Islands

2015C h i n a A i r Q u a l i t y M a n a g e m e n t A s s e s s m e n t R e p o r t
8
2.2 Analysis of PM10 pollutionSince 2013, 10 provinces/cities increased annual
average PM10 concentrations in 2014.
Of the 27 provinces/cities that have released
their annual average PM10 concentrations in 2014, six
provinces met standards, which were Hainan, Yunnan,
Guangdong, Guizhou, Heilongjiang and Guangxi.
Between 2013 and 2014, of the 20 provinces/cities
that failed to meet the standards, 10 provinces/
cities lowered their PM10 concentrations, and are
ranked starting from Zhejiang with the biggest drop
in pollution levels, to Shanghai, Hebei, Tianjin,
Shandong, Jiangsu, Chongqing, Sichuan, Anhui
and Jiangxi with the smallest. However, the PM10
concentrations in 10 provinces/cites increased. They
were Ningxia, Shaanxi, Liaoning, Inner Mongolia,
Hubei, Gansu, Beijing, Xinjiang, Henan and Jilin.
These provinces/cities are mainly located in the
central, northeast and west of China.
2.3 Analysis of O3 pollutionMost of the 9 provinces/cities that released annual
average O3 concentrations had values that were
close to the standard limit, but Beijing failed to meet
standard
Of the 9 provinces/cities that have released
their annual average O3 concentrations, Beijing was
the only one that failed to meet standard, exceeding
upper limits by 23.25%. The O3 concentrations in 8
provinces/cities, including Hebei, Tianjin, Jiangsu,
Zhejiang, Shanghai, Guangdong, Chongqing and
Liaoning, were near the upper-limit.
2.4 Analysis of SO2 pollutionAll of the 27 provinces/cities that have released their
annual average SO2 concentrations met standards,
but the data given by Shandong and Hebei were close
to the upper limit. The excessive SO2 concentrations
during winter heating seasons in northern China
should not be ignored.
In 2014, annual average SO2 concentrations
released by 27 provinces/cities all met national
standards. This shows that China has made great
achievements in SO2 control. However, the annual
average SO2 concentrations in Shandong and Hebei
were very close to the standard limit. Since the main
source of SO2 emission comes from burning sulfur
coal, the excessive SO2 concentrations occurred
during the heating seasons in North China, such as
Shandong, should not be taken lightly.
2.5 Analysis of NO2 pollutionOf 27 provinces/cities that have released annual
average NO2 data, most met national standards.
However, Beijing, Tianjin, Hebei, Shandong and
Shanghai (altogether 5 provinces/cities) exceeded
standard. Of the non-compliant cities, Beijing,
Tianjin, Hebei and Shandong are located in the Jing-
Jin-Ji and the surrounding areas. Beijing and Tianjin
were over-limit the most, exceeding standards by
42% and 35%, respectively. Located in the Yangtze
River Delta, Shanghai also exceeded limits by 10%.

2015 C h i n a A i r Q u a l i t y M a n a g e m e n t A s s e s s m e n t R e p o r t
9
11. This conclusion is only valid for provinces/cities that have released data in their individual Report on the State of the
Environment (2014) by July 2015.
2.6 Analysis of CO pollutionThe annual average CO concentrations in all of
the 9 provinces/cities that have released their data met
the standards.
2 .7 Number of a i r pol lu t ion
episode warningsThe Jing-Jin-Ji regions issued warnings most
frequently
According to the Report on the State of the
Environment of China (2014), more than 170
warnings of air pollution episodes were issued
throughout China in 2014, of which, the Jing-Jin-Ji
regions issued more than 60 warning that were yellow
or above.
According to local province/city's Report on the
State of the Environment (2014), only Beijing and
Chongqing have counted and released the number of
warnings of air pollution episodes in 2014. Beijing
issued 18 warnings and Chongqing issued 8 warnings.
2.8 Summary
This chapter states that among the 6 main
pollutants in 30 provinces/cities, PM2.5 and PM10 were
the most severe pollutants, followed by O3 and NO2,
while SO2 and CO both met the standards11.
In 2014, the annual average PM2.5 concentrations
in most key control areas significantly decreased
since 2013. The average decrease was 11.92% in
10 provinces/cities/regions: Beijing, Tianjin, Hebei,
Shandong, Shanxi, Shanghai, Jiangsu, Zhejiang, Pearl
River Delta and Chongqing. PM2.5 pollution varied
greatly among different areas. A large continuous
area composing of Jing-Jin-Ji and their surrounding
regions, and Henan were seriously polluted by PM2.5,
of which Henan was heavily polluted. PM2.5 pollution
in parts of Hubei , Hunan, Sichuan and Chongqing
were also relatively serious, and were even more
severe than that of the Yangtze River Delta.
Jing-Jin-Ji and their surrounding areas had the
highest concentrations of the six major pollutants
and the highest number of issuances of air pollution
episode warnings. These regions are facing intense
pressure to treat their situation.
2015C h i n a A i r Q u a l i t y M a n a g e m e n t A s s e s s m e n t R e p o r t
10
Chapter 3 Progress in Controlling Pollutant Emissions
12. Data are collected from the Report on the State of the Environment of China (2014).
13. HU Tao (2015) Implementation of Co-control over Multiple Pollutants and Greenhouse Gases. Strategic Suggestion
Collection of Prevention and Treatment of Air Pollution Specified in the "13th Five Year Plan" (Discussion Draft), 11-13.http://
www.cleanairchina.org/product/7222.html
This chapter analyzes the progress in air
pollution emission reduction of the whole country
and each individual province/city from the aspects of
control of SO2, NOX and mercury emissions, and co-
control of GHG emissions.
3 .1 Emiss ion contro l of key pollutants
China has made prominent progress in reducing
air pollutant emission in 2014. The SO2 and NOX
emissions in China were reduced by 3.4% and 6.7%,
respectively12 in 2014 compared with that in 2013.
Compared with the situation in 2013, most provinces/
cities have significantly reduced their SO2 and NOX
emissions, among which Xinjiang made the most
outstanding achievements.
The Minamata Convention on Mercury signed
by China in October 2013 specifies regulations on
the production and discarge of mercury among all
mercury-related stages. In order to better control
the mercury emission, the Emission Standard of Air
Pollutants for Thermal Power Plants (GB 13223-
2011), the Emission Standard of Air Pollutants for
Boiler (GB13271-2014), the Standard for Pollution
Control on the Municipal Solid Waste Incineration
(GB18485-2014), and the pollutant emission
standards of the non-ferrous metal industry issued
by China all have regulations on emission limit of
mercury. By the end of 2014, 6 provinces/cities,
including Shaanxi, Shanxi, Qinghai , Gansu, Beijing
and Shanghai have released their Implementation
Schemes of the Prevention and Treatment of Mercury
Pollution.
3.2 Progress made through putting into effect the co-control measures of GHG emissions
Whi le Ch ina i s r educ ing a i r po l lu t an t
emissions, it is also facing the pressure imposed
by the international community on GHG emissions
reduction. It should seek for low sulfur emissions, low
nitrogen emissions, low particle emissions, as well
as low carbon emissions13. Therefore, the co-control
of GHGs and multiple air pollutants is a new way
of protecting the environment, which suits China's
current industrial conditions and characteristics.

2015 C h i n a A i r Q u a l i t y M a n a g e m e n t A s s e s s m e n t R e p o r t
11
Since air pollutants and GHGs are largely
produced by the same sources, the measures taken to
reduce emission of both kinds of gases are usually
consistent. For instance, some measures to control
total coal consumption, such as the replacement of
coal by clean energy resources and the elimination
of small boilers, can reduce not only the emission
of SO2, NOX and particles, but also the emission of
GHGs, such as CO2. The elimination of yellow-label
vehicles and outdated vehicles can not only reduce
the emission of NOX, particles and GHGs (such as
CO2), but also decrease the emission and production
of short-lived climate pollutants (SLCPs), such as
black carbon and O3. Volatile organic chemicals
(VOCs) themselves are a kind of air pollutants. As a
VOC, CH4 is also a kind of SLCP. In addition, since
VOCs are important precursors of the formation of O3
(an SLCP), the control over VOC emission is also a
co-control measure.
3.2.1 Setting goals for controlling the total coal
consumption
Chinese total coal consumption exhibits a negative
growth in 2014
According to the data given by the National
Economy and Social Development Statistical Bulletin
(2014), a negative growth of total coal consumption
in 2014—2.9% decrease from 2013—was seen
throughout China for the first time over the past 15
years
In order to improve air quality, the State Council
Air Pollution Prevention and Control Action Plan
requires the formulation of a national mid and long-
term goal to control total coal consumption, and
achieve by target-oriented responsibility management.
By 2017, the percentage of coal in total energy
consumption should be reduced to less than 65%,and
the Jing-Jin-Ji, the Yangtze River Delta and the Pearl
River Delta regions should seek to achieve negative
growth in the total coal consumption.
Controlling the total coal consumption is also
conducive to reducing greenhouse gas emissions. The
article, Enhanced Actions on Climate Change: China’s
Intended Nationally Determined Contributions
published by China in 2015 clearly states that
controlling total coal consumption is an important
measure to reduce greenhouse gas emissions.
Fourteen provinces/cities have set goals to
control total coal consumption by 2014, including
Beijing, Tianjin, Hebei, Liaoning, Shanghai, Jiangsu,
Zhejiang, Fujian, Shandong, Henan, Hubei, Hunan,
Guangdong and Chongqing. These goals can
effectively attract concerns from all walks of life
about the control over coal consumption, and can
promote energy restructuring. They are conducive to
the improvement of air quality and emission reduction
of GHGs.
2015C h i n a A i r Q u a l i t y M a n a g e m e n t A s s e s s m e n t R e p o r t
12
3.2.2 Removal of yellow-label vehicles and
outdated vehicles
By the end of 2013, China has more than 130
million yellow-label vehicles, accounting for about
10% of the car owership. Pollutants emitted by these
vehicles account for around 50% of total pollutant
emissions by vehicles14. Therefore, accelerating
the removal of yellow-label vehicles and outdated
vehicles is an important means to improve air quality.
In the meantime, the removal of those vehicles also
has the co-benefit of reducing GHG emissions, such
as CO2 and black carbon.
The tasks of removing outdated vehicles and yellow-
label vehicles that do not meet emission requirements
were over-fullfilled. The over-fulfillment ratio in ten
provinces/cities were more than 120%.
In 2014, the State Council of PRC assigned the
mission of eliminating altogether 6 million yellow-
label vehicles and outdated vehicles14. In 2014, 28
provinces/cities that have released their progress in
removing the yellow-label vehicles and outdated
vehicles all accomplished the mission, of which 10
provinces/cities, including Hainan, Jiangsu, Qinghai,
Shaanxi, Shandong, Zhejiang, Liaoning, Yunnan,
Hebei and Beijing, completed the task with an over-
fullfillment ratio of above 120%.
14. Ministry of Environmental Protection of PRC http://www.zhb.gov.cn/gkml/hbb/qt/201406/t20140610_276685.htm
2015 C h i n a A i r Q u a l i t y M a n a g e m e n t A s s e s s m e n t R e p o r t
13
Chapter 4 Progress in Air Quality Management
This chapter analyzes the central government
and the provincial/municipal governments' progress
in managing air quality from the following five
aspects: legislation, standard formulation, monitoring,
information disclosure and economic measures.
4.1 Legislation
4.1.1 State-level legislations
The new Environmental Protection Law of PRC was
issued in 2014, and the Law on Prevention of Air
Pollution of PRC began amendment processes.
2014 is a very crucial year in the history of
China's environmental protection legislation. On
April 24 2014, the Eighth Session of the Standing
Committee of the Twelfth National People’s Congress
voted to approve the new Environmental Protection
Law of PRC. The new law changes the low cost
of violating environmental protection laws for
companies, addresses the balance of governments'
rights and responsibilities, and promotes public
engagement efforts.
On September 9 2014, the Legislative Affairs
Office of the State Council of PRC asked for public
opinions on the Law on Prevention of Air Pollution
of PRC (Revised Draft for Public Review). On
November 26, the executive meeting of the State
Council approved the Law on Prevention of Air
Pollution of PRC (Revised Draft). On December
22, the revised draft of the Law on Prevention of
Air Pollution of PRC was submitted to Standing
Committee of the National People's Congress for
initial review.
4.1.2 Local legislations
By the end of 2014, Shaanxi, Beijing and Shanghai
issued local Regulations on Prevention of Air
Pollution.
Along with the issuance of the State Council
Air Pollution Prevention and Control Action Plan,
and a series of state-level legislation activities such
as the release of the Environmental Protection Law
of PRC and the amendment of Law on Prevention of
Air Pollution of PRC, Shaanxi, Beijing and Shanghai
updated and implemented their new local Regulations
on Prevention of Air Pollution in 2014.

2015C h i n a A i r Q u a l i t y M a n a g e m e n t A s s e s s m e n t R e p o r t
14
4.2 Establishing standards
4.2.1 State-level standards
China has issued 15 environmental standards
regarding air pollution in 2014
In 2014, China issued 15 standards on air
pollution, consisting of sampling and monitoring
standards for volatile organic chemicals/semi-
volatile organic chemicals, emission standards
for industries/facilities, exhaust gas monitoring
standards for stationary pollution sources and other
ambient airborne substances, and emission quantity
and monitoring standards for off-road mobile diesel
engines.
4.2.2 Local-level standards
In 2014, 7 provinces/cities, which are Beijing,
Tianjin, Hebei, Heilongjiang, Shanghai, Zhejiang
and Guizhou, have put into effect 15 new local
environmental standards regarding air pollution
In 2014, 7 provinces/cities, which are Beijing,
Tianjin, Hebei, Heilongjiang, Shanghai, Zhejiang
and Guizhou, enacted 15 new air pollution standards.
These standards mainly involve pollution industries/
facilities, motor vehicles, hazardous wastes/municipal
solid waste incineration, volatile organic chemicals
produced by industrial enterprises, etc.
4.3 MonitoringAll air quality monitoring network stations have been
built or updated to meet requirements for urban air
quality monitoring, as stated by the State Council Air
Pollution Prevention and Control Action Plan.
The Ambient Air Quality Standards (GB3095-
2012) were issued in 2012. To comply with new
Ambient Air Quality Standards, many regions in
China have started to build or update air quality
monitoring network stations accordingly. By the
end of 2014, 1,436 monitoring network stations
in 338 prefecture-level or above cities have were
established, and real-time monitoring data of six
controlled pollutants (PM10, PM2.5, SO2, NO2, O3
and CO) and the air quality index (AQI) are now
available to the public. This symbolizes the successful
implementation of new standards.
4.4 Information disclosureTianjin, Shandong and Jiangsu are the top three
provinces/cities in terms of air quality management
information disclosure.
In 2014, the average score of 30 provinces/cities
for air quality information disclosure was 5.95 out of
10. Tianjin, Shandong and Jiangsu were the top three
provinces/cities with the best scores of 8.5, 8.0 and
8.0.
The following aspects regarding information
disclosure need further improvements:
Among the 30 provinces/cities, Tianjin was
the first to attempt to release evaluation reports of
the city’s work. It is suggested that in the future, the
working progress of air pollution prevention and
control measures should be opened to the public.

2015 C h i n a A i r Q u a l i t y M a n a g e m e n t A s s e s s m e n t R e p o r t
15
By the end of 2014, official websites of all
provincial/municipal environmental protection offices
have released real-time monitoring data of ambient
air quality, yet no access were found to keep historical
monitoring data. It is suggested that each province/
city should improve its air quality data tracking
system to help the public learn about previous air
quality conditions.
By the end of 2014, 9 provinces/cities, including
Tianjin, Shandong, Jiangsu, Anhui, Hunan, Henan,
Jiangxi, Chongqing and Shaanxi have involved
public engagement when formulating air pollution
regulations, standards and planning. It is suggested
that all provinces/cities should improve public
engagement mechanisms to expand information
disclosure content and channels, and make efforts to
analyze and respond to public suggestions.
4.5 Economic measures
4.5.1 Increasing the standards of pollution
discharge fees
The Notice on Adjusting Pollution Charge
Standards and Related Issues, released on September
1, 2014, specifies pollution discharge fee standards
of SO2 and NOX exhaust gases should be doubled by
the end of June 2015, to push enterprises to reduce
emissions.
By the end of 2014, 7 provinces/cities have raised the
discharg fee standards in advance. Beijing and Tianjin
have raised the standards to a level far higher than the
national requirements.
By the end of 2014, 7 provinces/cities have
raised pollution discharge fees before national
deadlines. Beijing and Tianjin have significantly
increased the standards of the discharg fees of national
requirements. Beijing raised standards by 15.87
times and the Tianjin raised by 9.5 times. Jiangsu has
doubled its standards since 2007. Ningxia, Xinjiang,
Guangdong and Zhejiang have accomplished national
requirements for raising standards ahead of time by
doubling their discharg fee standards in 2012, 2012,
2013 and 2014, respectively.
4.5.2 Changes in fines
Most provinces/cities' environmental fine sums in
2014 were higher than that in 2013. Fine sums in
Shaanxi, Beijing, Henan and Sichuan have more than
doubled
Eleven provinces/cities have released sums
of collected fines in 2013 and 2014, and the fine’s
growth rate between 2013 and 2014 in the Report
on the State of the Environment of China. Most of
provinces/cities increased their fine sums from 2013
to 2014. Shaanxi, Beijing, Henan and Sichuan’s fine
sums have increased by more than twice.

2015C h i n a A i r Q u a l i t y M a n a g e m e n t A s s e s s m e n t R e p o r t
16
Chapter 5 Challenges in Air Pollution Control
This charpter investigates the challenges and
difficulties in addressing air pollution control in
different regions in four dimensions: air pollution
purification capacity, industrial structure, energy use,
and vehicle emissions.
5.1 Self-purification capacityAir pollution in a region is related to the region’s self-
purification capacity, but also the emission level and
regional transport of pollutants.
The self-purification capacity measures the
comprehensive capability of diffusion, and dilution
without considering pollutant emissions. The
capacity refers to the self-purification of atmospheric
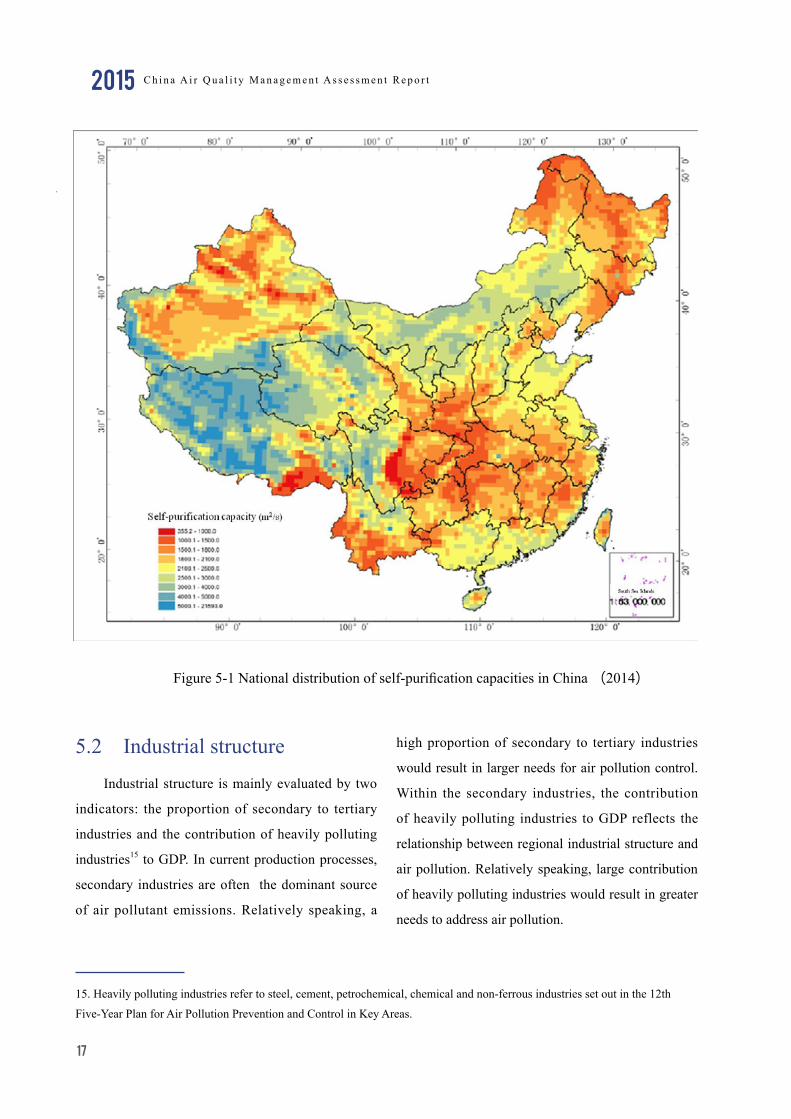
pollutants under natural climatic and geographical
conditions. The national distribution of self-
purification capacities in 2014 is shown in Figure 5-1.
Comparing Figure 5-1 and Figure 2-1, it can
be found that the self-purification capacities are
low in areas that are heavily polluted by PM2.5, as
indicated in Figure 2-1. The areas include Beijing,
Tianjin, Hebei and the surrounding areas, Henan,
Hubei, Hunan, Sichuan and Chongqing, as well as
the Yangtze River Delta. However, low-capacity
areas in Figure 5-1 do not completely overlap the
PM2.5 polluted areas, indicating that the level of air
pollution in a region is subject to emission levels and
transport mechanisms, in addition to the natural self-
purification capacity.
2015 C h i n a A i r Q u a l i t y M a n a g e m e n t A s s e s s m e n t R e p o r t
17
5.2 Industrial structureIndustrial structure is mainly evaluated by two
indicators: the proportion of secondary to tertiary
industries and the contribution of heavily polluting
industries15 to GDP. In current production processes,
secondary industries are often the dominant source
of air pollutant emissions. Relatively speaking, a
high proportion of secondary to tertiary industries
would result in larger needs for air pollution control.
Within the secondary industries, the contribution
of heavily polluting industries to GDP reflects the
relationship between regional industrial structure and
air pollution. Relatively speaking, large contribution
of heavily polluting industries would result in greater
needs to address air pollution.
15. Heavily polluting industries refer to steel, cement, petrochemical, chemical and non-ferrous industries set out in the 12th
Five-Year Plan for Air Pollution Prevention and Control in Key Areas.
Figure 5-1 National distribution of self-purification capacities in China (2014)
2015C h i n a A i r Q u a l i t y M a n a g e m e n t A s s e s s m e n t R e p o r t
18
5.2.1 Proportion of secondary to tertiary
industries
Beijing, Shanghai and Guangdong had obvious
advantages in industrial structure, and Hainan and
Guizhou should consider balancing industrial
structures in their economic development processes.
According to the analysis of 30 provinces/cities
(municipalities) in 2013, the proportion of secondary
to tertiary industries was lowest in Beijing, Hainan,
Shanghai, Guizhou, and Guangdong. Taking per
capita GDP into account, Beijing, Shanghai, and
Guangdong delivered superior performance in both
economic development and industrial restructuring.
In contrast, Hainan and Guizhou suffered relatively
low per capita GDP levels, with Guizhou experienced
the lowest in the nation. Therefore, efforts to balance
the industrial structure are needed in the process of
economic development.
Great pressure on industrial structure adjustment in
some provinces/cities
Qinghai, Henan, Anhui, Shaanxi, and Jiangxi
registered the highest proportion of secondary to
tertiary industries in 2013, but had lower per capita
GDP than that of the national average. These regions
should adjust their industrial structures to reduce
excess capacity and strive for innovation-driven
economic development.
5.2.2 Contribution of heavily polluting industries
to GDP
Heavily polluting industries accounted for more than
60% of GDP in Shandong, Jiangxi, Liaoning, Hebei,
Ningxia, Qinghai, and Jiangsu
According to the analysis of GDP data in 17
provinces (municipalities) with high proportion of
secondary to tertiary industries, the contribution of
heavily polluting industries to GDP exceeded 60%
in Shandong, Jiangxi, Liaoning, Hebei, Ningxia, and
Qinghai in 2013, which placed great pressure of air
pollution control
5.3 E n e r g y s t r u c t u r e a n d
consumptionEnergy use is examined through three indicators:
the share of coal in primary energy, coal consumption
per unit of area, and energy consumption per 10,000
RMB of GDP
5.3.1 Share of Coal in Primary Energy
Coal took up more than 80% of the primary energy
in Shanxi, Inner Mongolia, Ningxia, Guizhou, Anhui,
Hebei, and Shaanxi.
Among the observed 30 provinces/cities, in
2012, coal provided for 80% or more of primary
energy consumption in Shanxi, Inner Mongolia,
Ningxia, Guizhou, Anhui, Hebei, and Shaanxi, and
lower than 40% in Beijing, Hainan, and Shanghai.
Beijing had the lowest level of less than 30%.
5.3.2 Coal consumption per unit of area
The coal consumption per unit of area differed among
provinces/cities

2015 C h i n a A i r Q u a l i t y M a n a g e m e n t A s s e s s m e n t R e p o r t
19
Among the observed 30 provinces/cities, the 10
areas with the highest coal consumption per unit area
in 2012 were Tianjin, Shanghai, Shandong, Shanxi,
Hebei, Beijing, Henan, Jiangsu, and Zhejiang. In
these areas, the emissions from coal consumption
pose huge air quality challenges. Shanghai, Jiangsu,
and Zhejiang ranked the 1st, 3rd and 8th respectively
and formed a coal-intensive region that creates great
challenges for air quality control in the Yangtze
River Delta. When air dispersion is poor, this area
is likely to put a very large pressure on air quality
management systems.
5.3.3 Energy consumption per 10,000 RMB of
GDP
The energy consumption per 10,000 RMB of GDP
was small in economically developed areas like
Beijing, but large in the less economically developed
areas like Ningxia
5.4 Vehicle emissions
5.4.1 Number of vehicles per 100 Persons
With the continued rapid development of
economy and improvement of living standards, the
vehicle population has massively expanded in recent
years and brought prominent air pollution problems.
According to the latest source apportionment of urban
pollutants, vehicle emissions were responsible for
31.1% of the PM2.5 pollution in Beijing16 and mobile
sources, including motor vehicles, account for 29.2%
of the PM2.5 pollution in Shanghai17. Motor vehicles
have risen as a major source of urban air pollution.
China faces unprecedented pressure to control motor
vehicle pollution as the number of vehicles increased
by more than 13% in all of the observed 30 provinces/
cities except Beijing
Among these 30 provinces/cities, the number of
vehicles per 100 persons averaged 7.75 in 2013. In
Beijing, Tianjin and Zhejiang, the number was around
twice the national average, posing huge pressures
on vehicle emissions control. Introducing license-
plate lottery, Beijing began controlling vehicles
and achieved the lowest vehicle growth in China,
increasing by only 2.5% from 2012 to 2013. while
Tianjin and Zhejiang had growths of 16% and 18%,
respectively.
5.4.2 Sulfur content of motor gasoline / diesel
As fuel upgrades impact both current and new
vehicles, implementing more stringent fuel standards
will produce more significant effects than raising
emission standards for new vehicles. Improving
fuel quality, such as reducing sulfur content, is a
precondition for tightening emissions standards and
for applying advanced pollution control technologies.
For example, in order to use diesel particulate filter
(DPF) and achieve high efficiency, low sulfur content
in the diesel is a prerequisite.
16. Beijing Environmental Protection Bureau http://www.bjepb.gov.cn/bjepb/323474/331443/331937/333896/396191/index.html
17. Shanghai Environmental Protection Bureau http://www.sepb.gov.cn/fa/cms/shhj//shhj2272/shhj2159/2015/01/88463.htm

2015C h i n a A i r Q u a l i t y M a n a g e m e n t A s s e s s m e n t R e p o r t
20
The gasoline/diesel standards for motor vehicles
in Beijing, Shanghai, Jiangsu, and Guangdong are
higher than the national average.
By the end of 2014, in all the observed 30
provinces /cities, gasoline and diesel fuel met standard
IV and III, respectively, so that the sulfur content was
less than 50ppm and 350ppm. In addition, in Beijing,
Shanghai, some prefecture-level cities in Jiangsu and
Guangdong, gasoline standard V (sulfur content less
than 10ppm) and diesel standards IV and V (sulfur
content less than 50 and 10ppm) were implemented.
Therefore, fuel sulfur content was reduced by more
than 80% in these areas .
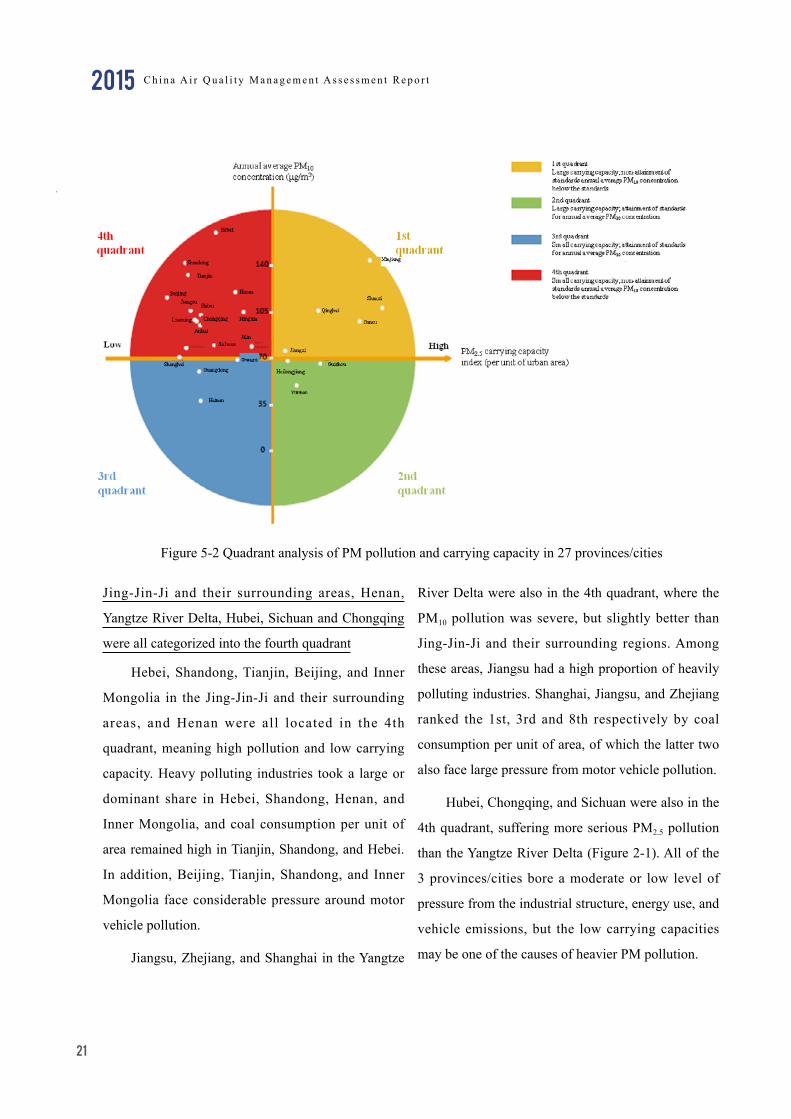
5.5 Comprehensive analysisTo help comprehensively analyze air pollution
conditions and governance challenges in different
provinces/cites, the report introduced the PM2.5
Carrying Capacity Index in the study on PM
pollution. The Index reflects the maximum allowable
emissions allowed to still meet national standards for
average annual PM2.5 concentration (for attainment
areas, the current emission caps prevail according
to the Principle of Anti-degradation)18. Figure
5-2 shows, by quadrants, the annual average PM10
concentrations (which represent the PM pollution
level since data on PM2.5 concentration are limited)
and per unit area PM2.5 carrying capacity index of 27
provinces/cities.
Through detailed analysis of provinces/cities in
each quadrant, covering per capita GDP, industrial
structure, energy use and vehicle emissions, the report
made some preliminary key conclusions around air
pollution control in some provinces/cities.
Beijing had the lowest PM2.5 carrying capacity index
per unit urban area.
Among the observed provinces/cities, Beijing
exhibited the lowest PM2.5 carrying capacity per unit
urban area and faced the greatest air pollution control
challenge.
18. PM2.5 Carrying Capacity Index is calculated according to the Simulation of Atmospheric Environmental Capacity Based
on the National Attainment of Urban PM2.5 Standards. Using the WRF-CAMx model and the National Emission Inventory,
this paper obtains through iterative calculations the environmental capacities of key components of PM2.5 (sulfates, nitrates,
primary PM2.5, and ammonium salt) in 31 provinces/cities under the premise that all 333 cities in the country meet the
requirements for annual average PM2.5 concentration in the Ambient Air Quality Standards (GB3095-2012) (for cities attaining
the PM2.5 standards in 2010, the emission caps for 2010 prevail according to the Principle of Anti-Degradation). Based on
the results and the average shares of key components in 333 cities in 2010, the paper calculated the conversion factors and
ultimately the PM2.5 carrying capacity index in 31 provinces/cities.
2015 C h i n a A i r Q u a l i t y M a n a g e m e n t A s s e s s m e n t R e p o r t
21
Jing-Jin-Ji and their surrounding areas, Henan,
Yangtze River Delta, Hubei, Sichuan and Chongqing
were all categorized into the fourth quadrant
Hebei, Shandong, Tianjin, Beijing, and Inner
Mongolia in the Jing-Jin-Ji and their surrounding
areas, and Henan were all located in the 4th
quadrant, meaning high pollution and low carrying
capacity. Heavy polluting industries took a large or
dominant share in Hebei, Shandong, Henan, and
Inner Mongolia, and coal consumption per unit of
area remained high in Tianjin, Shandong, and Hebei.
In addition, Beijing, Tianjin, Shandong, and Inner
Mongolia face considerable pressure around motor
vehicle pollution.
Jiangsu, Zhejiang, and Shanghai in the Yangtze
River Delta were also in the 4th quadrant, where the
PM10 pollution was severe, but slightly better than
Jing-Jin-Ji and their surrounding regions. Among
these areas, Jiangsu had a high proportion of heavily
polluting industries. Shanghai, Jiangsu, and Zhejiang
ranked the 1st, 3rd and 8th respectively by coal
consumption per unit of area, of which the latter two
also face large pressure from motor vehicle pollution.
Hubei, Chongqing, and Sichuan were also in the
4th quadrant, suffering more serious PM2.5 pollution
than the Yangtze River Delta (Figure 2-1). All of the
3 provinces/cities bore a moderate or low level of
pressure from the industrial structure, energy use, and
vehicle emissions, but the low carrying capacities
may be one of the causes of heavier PM pollution.
Figure 5-2 Quadrant analysis of PM pollution and carrying capacity in 27 provinces/cities

2015C h i n a A i r Q u a l i t y M a n a g e m e n t A s s e s s m e n t R e p o r t
22
Chapter 6 C o n c l u s i o n s a n d Recommendations
▲ China’s air quality significantly improved
in 2014. PM pollution remained prominent with
pollution levels varying widely in different areas, and
some regions will still face enormous challenges in
the future
In 2014, China’s overall air quality improved
signif icant ly from 2013. The average PM2.5
concentration fell by 11.92% in ten major provinces/
cities/regions, including Beijing, Tianjin, Hebei,
Shandong, Shanxi, Shanghai, Jiangsu, Zhejiang, Pearl
River Delta and Chongqing. The average annual
concentrations of PM2.5, PM10, SO2 and NO2 also
decreased in 74 key provinces/cities, among which,
eight met the ambient air quality standards, which
was five more than the previous year.
On a national scale, the most severe pollutant
was PM, followed by O3 and NO2, while the SO2
pollution persisted during the heating season in the
northern region. The areas with the most severe PM2.5
pollution were Jing-Jin-Ji and their surrounding areas,
and notably Henan. Areas in Hubei, Hunan, Sichuan
and Chongqing were also confronted with PM2.5
problems and suffered higher PM2.5 concentrations
than the Yangtze River Delta. Among all these
areas, the Jing-Jin-Ji and their surrounding regions
registered the highest concentrations of the six major
pollutants (regulated by the ambient air quality
standards) and issued the highest number of warnings
on air pollution episodes, implying high pressure to
control air quality.
▲ The co-control of both air pollutants and
GHGs should be beefed up based on the current
intense efforts to control emissions
In 2014, the national SO2 and NOX emissions
were cut by 3.4% and 6.7%, respectively, over the
previous year. SO2 and NOX reductions were seen in
the majority of provinces/cities, notably Xinjiang.
Mercury emissions control also received increasing
attention, with the introduction of the Implementation
Plan for Mercury Pollution Prevention and Control in
six provinces/cities. The total coal consumption was
also brought under control, and effective measures
to phase out yellow-label vehicles and outdated cars
were taken.
In the future, co-control of air pollutants and
GHGs should be furthered, with emission reduction
targets and energy saving targets properly coordinated
to maximize benefits for all parties.

2015 C h i n a A i r Q u a l i t y M a n a g e m e n t A s s e s s m e n t R e p o r t
23
▲ P r o g r e s s w a s m a d e i n a i r q u a l i t y
management. In the future, systemic air quality
improvement / compliance management should be
extended to local levels
A newly revised environmental protection
law that was known as the most stringent one of
its kind was unveiled in 2014; the new ambient air
quality law passed the first review in the National
People's Congress. Additionally, 15 national air
pollution standards were issued and 15 local ones
were implemented. Urban air quality monitoring
tasks, in line with the requirements of the Action
Plan for Air Pollution Prevention and Control, were
completed one year before deadline. Progress was
seen in information disclosure, particularly in Tianjin,
Shandong, and Jiangsu. Economic mechanisms
covering pollution discharge fees and administrative
penalties have also produced results.
Ai r qua l i ty improvement / compl iance
management is the core of air quality management.
In this model, the local governments bear primary
responsibility to manage air quality in a scientific
way through designing and assessing various laws
and measures. Systematically managing air quality
involves the seeing of linkages between pollution
source control and air quality improvement, and
assessing costs and benefits of abatement measures.
On this basis, appropriate air quality compliance
plans and reasonable emission reduction strategies
are designed to accomplish the Action Plan for Air
Pollution Prevention and Control and ultimately
ambient air quality standards.
▲ Overall air pollution control remains
difficult, and the priorities will be industrial
restructuring, total coal consumption control and
vehicle emissions control
Currently, China has an industry heavy economic
structure. In more than half of the provinces/cities,
the proportion of secondary to tertiary industries was
up to 1.2; in some provinces/cities, heavily polluting
industries are the major contributor to GDP. It is
therefore necessary to initiate industrial restructuring,
such as prospecting measures that encompass strict
controls of heavily polluting industries, economic
policies such as differentiated discharge fees and
differentiated energy prices, and incentives to
reduce emission and discharge of heavy polluting
enterprises. Looking at the dominance of coal in
most areas, provinces/cities should set out targets and
plans to control total coal consumption, and introduce
incentive schemes to the development and use of
clean energy sources for the purpose of energy mix
optimization. To address the fast-growing vehicle
emissions, more stringent emission standards and oil
standards should be combined with the strategies for
controlling the population of motor vehicles.

2015C h i n a A i r Q u a l i t y M a n a g e m e n t A s s e s s m e n t R e p o r t
24
Clean Air Alliance of China (CAAC)
To address the air pollution challenge in China, ten leading Chinese technical institutions in the air quality
field joined hands to launch the Clean Air Alliance of China (CAAC). It is envisioned that CAAC will provide
an integrated platform for provinces and cities to access the international experience, tools and practices on
the one hand; and facilitate the communication and collaboration among provinces and cities on the other. The
overarching goal is to improve air quality of Chinese provinces and cities and mitigate the negative impacts
on public health due to air pollution. CAAC will be led and supervised by the alliance steering committee,
and be managed by the alliance secretariat regarding general operation and coordination.
Ten Founding Members
Tsinghua University, Appraisal Center for Environment & Engineering of MEP, Chinese Academy for
Environmental Planning (CAEP), Nanjing University, Beijing Normal University, Fudan University, Chinese
Research Academy of Environmental Sciences (CRAES), Peking University, Renmin University of China,
Vehicle Emission Control Center (VECC) of MEP
Founding Supporter
The Energy Foundation
Electronic copies of this report are available by contacting [email protected]

Innovation Center for Clean-air Solutions (CAAC Secretariat)Suite 709, East Ocean Center, 24A Jianguomenwai street, Beijing 100004
Tel: +86-10-65155838
Email: [email protected]


