
Characterization of Indiana’s Coal Resource: Availability of the Reserves,
Physical and Chemical Properties of the Coal, and the Present and Potential
UsesMaria Mastalerz, Agnieszka Drobniak,John Rupp, and Nelson Shaffer
Indiana Geological SurveyIndiana University
Center for Coal Technology Research
Indiana Department of Commerce

OBJECTIVESOBJECTIVES
• Provide assessment how much coal is available for mining• Characterize quality of coal for those unique properties to
utilize it in an efficient and environmentally sound manner;
• Characterize current use of coal;• Characterize production and use of Coal Combustion
Products;• Characterize limestones and dolomites for Flue Gas
Desulphurization• Provide basis for potential uses of Indiana coals (CBM,
CO2 sequestration, non-traditional uses of CCP)
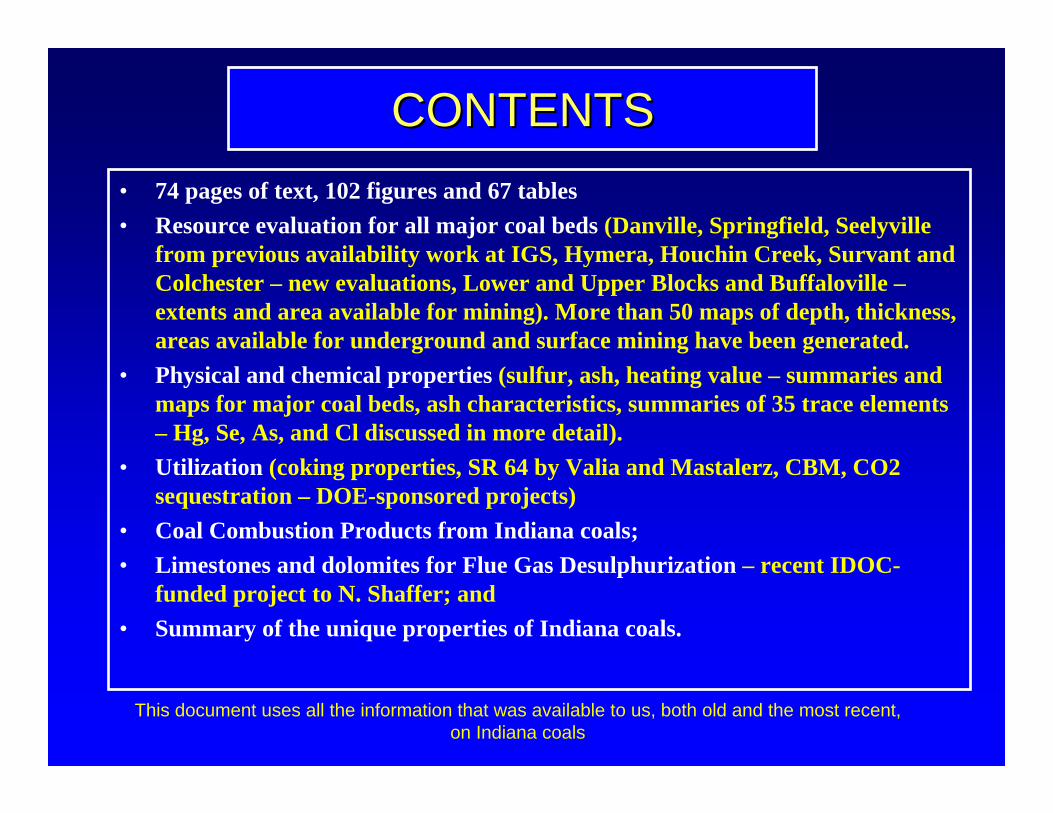
CONTENTSCONTENTS• 74 pages of text, 102 figures and 67 tables• Resource evaluation for all major coal beds (Danville, Springfield, Seelyville
from previous availability work at IGS, Hymera, Houchin Creek, Survant and Colchester – new evaluations, Lower and Upper Blocks and Buffaloville –extents and area available for mining). More than 50 maps of depth, thickness, areas available for underground and surface mining have been generated.
• Physical and chemical properties (sulfur, ash, heating value – summaries and maps for major coal beds, ash characteristics, summaries of 35 trace elements – Hg, Se, As, and Cl discussed in more detail).
• Utilization (coking properties, SR 64 by Valia and Mastalerz, CBM, CO2 sequestration – DOE-sponsored projects)
• Coal Combustion Products from Indiana coals;• Limestones and dolomites for Flue Gas Desulphurization – recent IDOC-
funded project to N. Shaffer; and • Summary of the unique properties of Indiana coals.
This document uses all the information that was available to us, both old and the most recent, on Indiana coals

Coal Production in Indiana 1879-1998
0
5,000,000
10,000,000
15,000,000
20,000,000
25,000,000
30,000,000
35,000,000
40,000,000
1879 1889 1899 1909 1919 1929 1939 1949 1959 1969 1979 1989
Sho
rt To
ns
Underground Surface Total
2002
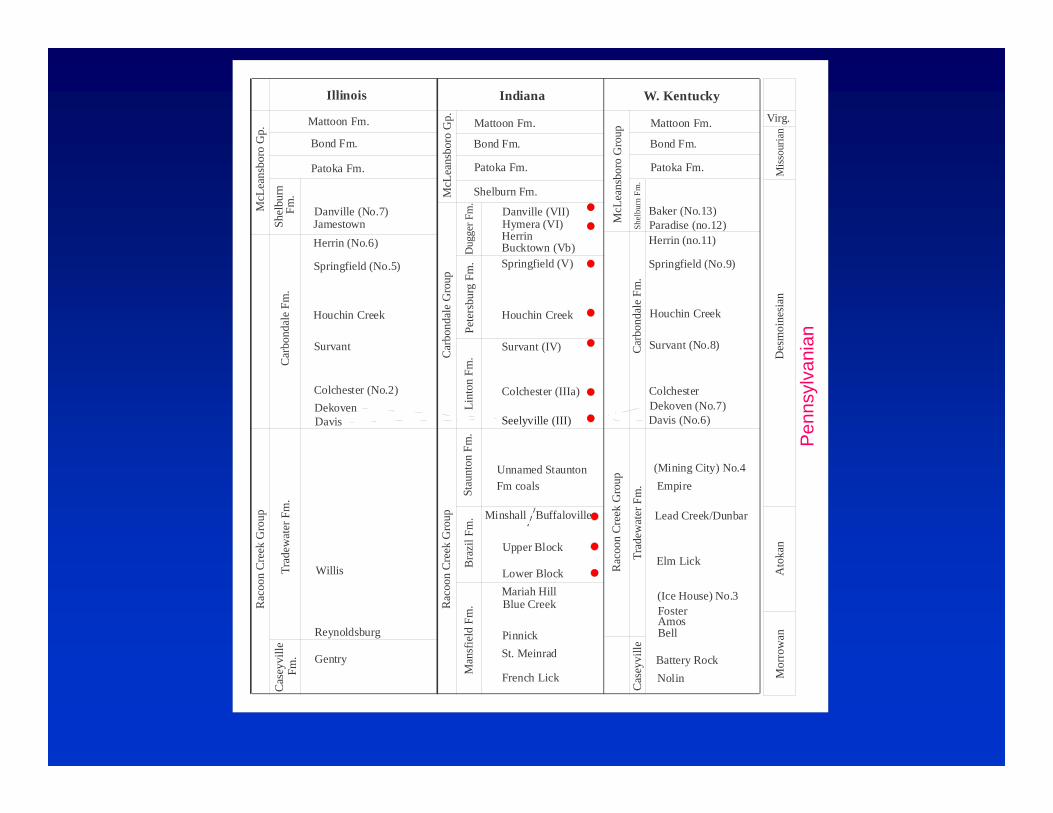
Illinois Indiana W. Kentucky
Mattoon Fm.
Bond Fm.
Patoka Fm.
Danville (No.7)JamestownHerrin (No.6)
Springfield (No.5)
Houchin Creek
Survant
Colchester (No.2)DekovenDavis
Willis
Reynoldsburg
Gentry
Cas
eyvi
lleFm
.Tr
adew
ater
Fm.
Rac
oon
Cre
ekG
roup
Rac
oon
Cre
ekG
roup
Car
bond
ale
Fm.
Shel
burn
Fm.
McL
eans
boro
Gp.
McL
eans
boro
Gp.
Car
bond
ale
Gro
up
Mattoon Fm.
Bond Fm.
Patoka Fm.
Shelburn Fm.
Danville (VII)Hymera (VI)HerrinBucktown (Vb)Springfield (V)
Houchin Creek
Survant (IV)
Colchester (IIIa)
Seelyville (III)
Unnamed StauntonFm coals
Minshall Buffaloville
Upper Block
Lower BlockMariah HillBlue Creek
PinnickSt. Meinrad
French Lick
Rac
oon
Cre
ekG
roup
Cas
eyvi
lleTr
adew
ater
Fm.
Car
bond
ale
Fm.
Shel
burn
Fm.
Mattoon Fm.
Bond Fm.
Patoka Fm.
Baker (No.13)Paradise (no.12)Herrin (no.11)
Springfield (No.9)
Houchin Creek
Survant (No.8)
Colchester Dekoven (No.7)Davis (No.6)
(Mining City) No.4Empire
Lead Creek/Dunbar
Elm Lick
(Ice House) No.3FosterAmosBell
Battery RockNolin M
orro
wan
Ato
kan
Des
moi
nesi
anM
issou
rian
Virg.
Man
sfie
ldFm
.B
razi
lFm
.St
aunt
onFm
.Li
nton
Fm.
Pete
rsbu
rgFm
.D
ugge
rFm
.
McL
eans
boro
Gro
up
Pen
nsyl
vani
an

Pennsylv anian System(coal-bear ing str ata)
Surf ace Mined AreaUnderg round Mined Area
10 0 20 Miles
10 0 30 Kilometers
I L
L I
N O
I S
K E N T U C K Y
WAB
ASH
RIVER
OHIORIV
ER
PatokaLake
EastFork
WhiteRiver
White
R iver
Wabash
River
MonroeLake
POSEY VANDER-BURGH
WARRICK
SPENCER
PERRY
CRAWFORD
DUBOISPIKEGIBSON
KNOX DAVIESS MARTIN
ORANGE
LAWRENCE
MONROE
BRO
WN
GREENE
SULLIVAN
VIGO
OWEN
CLAY
MORGAN
HENDRICKSPUTNAM
PARKEVERM
ILLI
ON
BOONEMONTGOMERY
FOUNTAIN
BENTON
WARREN
TIPPECANOE
WHITECARROLL
CLINTON
HO
WAR
D
CASSDelphi
Lafayette
Covington
Newport
WilliamsportFrankfort
LebanonCrawfordsville
DanvilleRockville
Greencastle
BrazilTerreHaute
Martins-ville
Spencer
Bloomington
BloomfieldSullivan
Bedford
Vincennes
Washing-ton
Shoals
Petersburg
PrincetonJasper
Paoli
English
CanneltonRockport
BoonvilleEvansville
MountVernon
INDIANA
! 1
!2
! 3
! 4 !5
!6
!7
!8 !9!10 ! 11
!12
! 13 !14 ! 15!16 ! 1721
! 23! 24!25!26
! 28 !29 !30
! 32! 33!34!35
! 36 !37! 38
! 39
!39
1819
20 !22
27
31
40
Mine ID Number
Active Underg round Coal Mine
Active Surf ace Coal Mine
Map of southwestern Indiana showing the active coal mines, and mined-out areas.
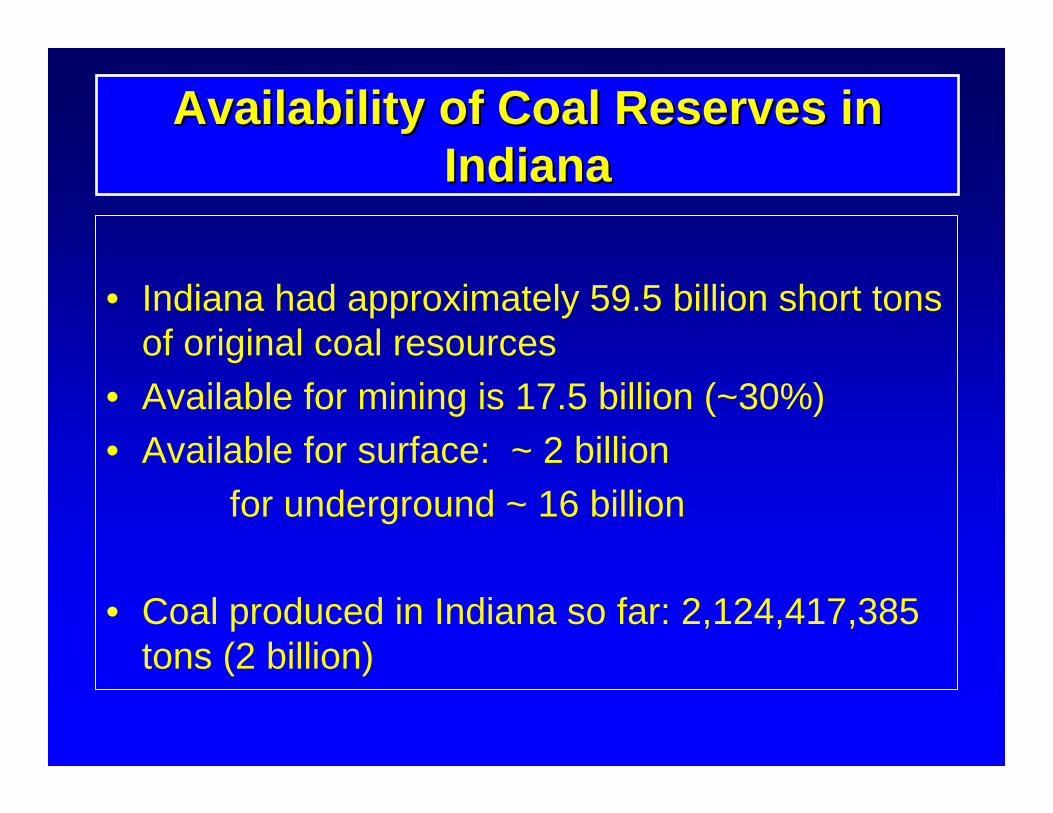
Availability of Coal Reserves in Availability of Coal Reserves in IndianaIndiana
• Indiana had approximately 59.5 billion short tons of original coal resources
• Available for mining is 17.5 billion (~30%)• Available for surface: ~ 2 billion
for underground ~ 16 billion
• Coal produced in Indiana so far: 2,124,417,385 tons (2 billion)
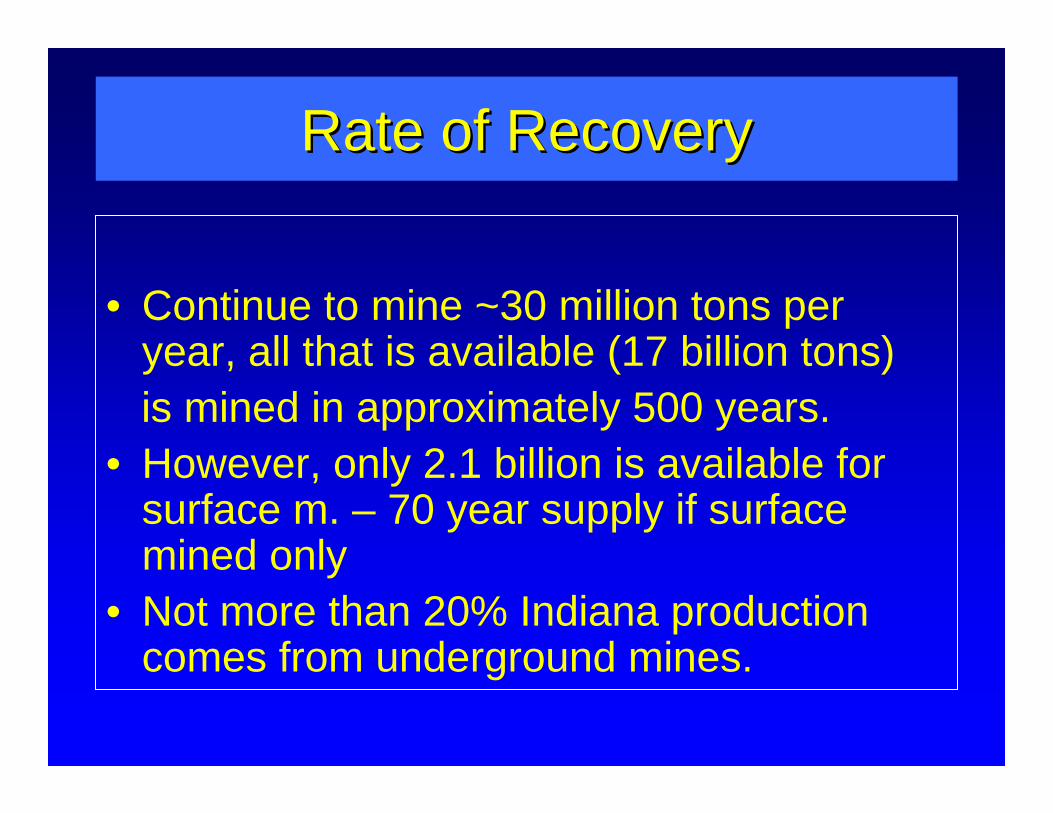
Rate of RecoveryRate of Recovery
• Continue to mine ~30 million tons per year, all that is available (17 billion tons)is mined in approximately 500 years.
• However, only 2.1 billion is available for surface m. – 70 year supply if surface mined only
• Not more than 20% Indiana production comes from underground mines.
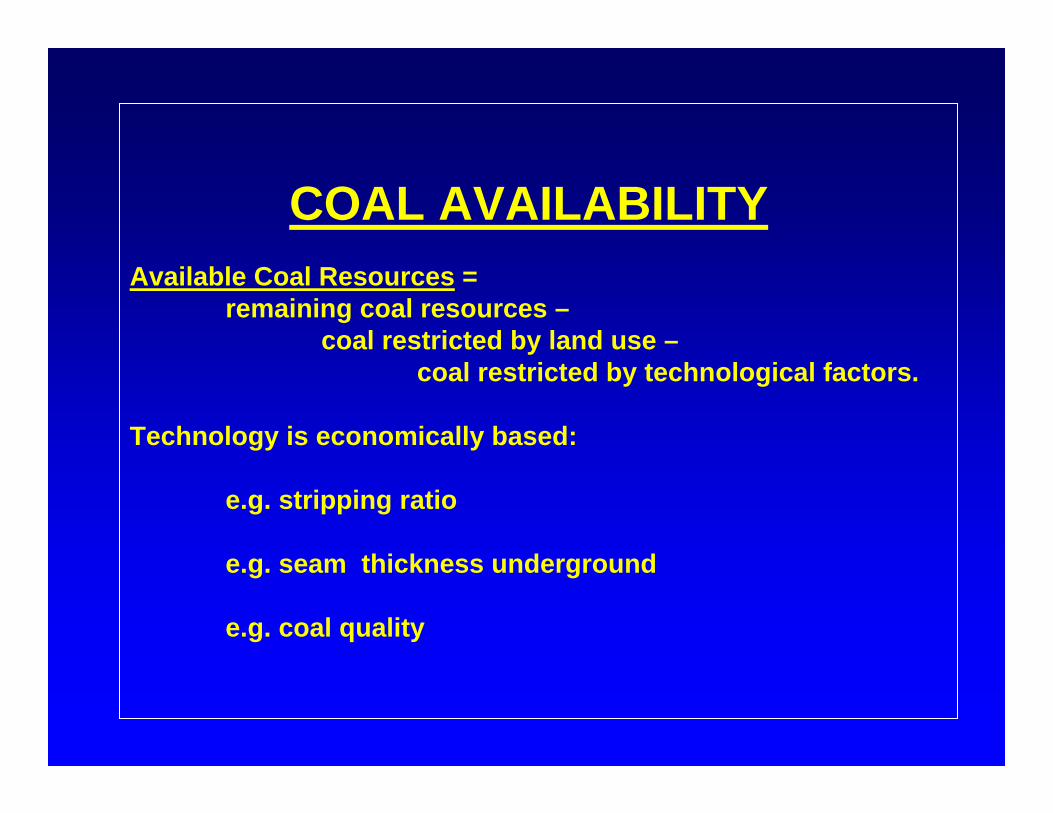
COAL AVAILABILITYAvailable Coal Resources =
remaining coal resources –coal restricted by land use –
coal restricted by technological factors.
Technology is economically based:
e.g. stripping ratio
e.g. seam thickness underground
e.g. coal quality
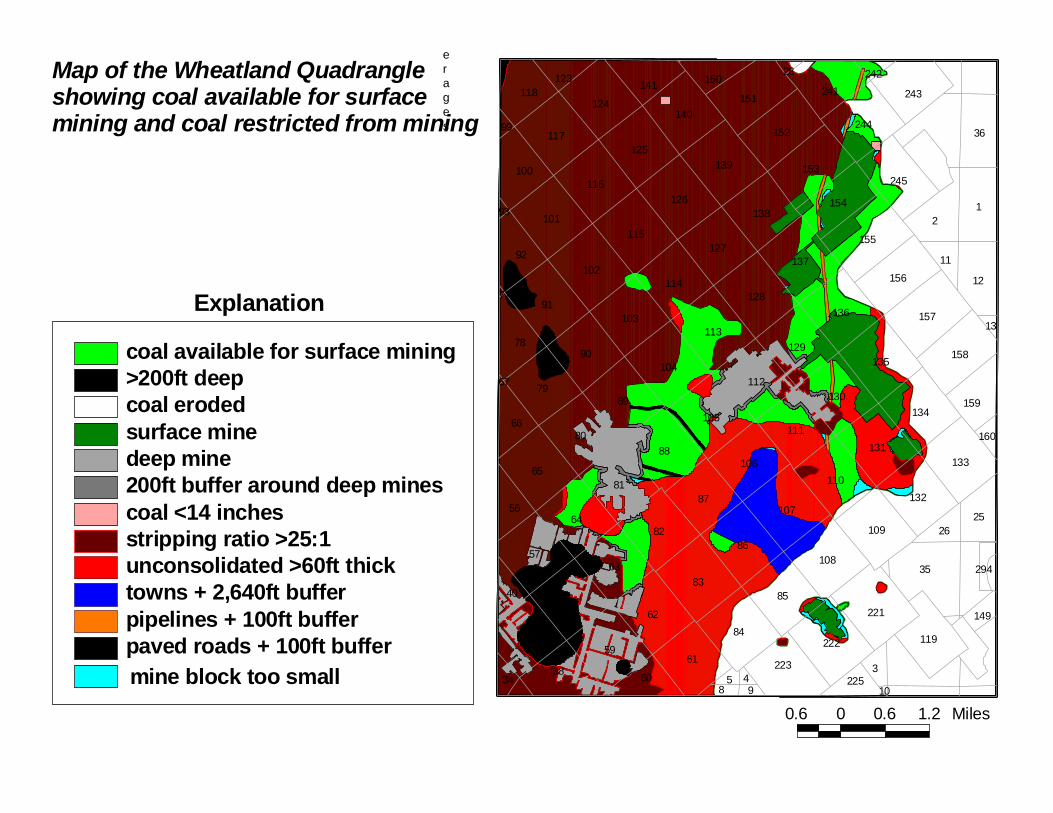
Original extent of the coalCoal too deep for surface miningCoal removed by surface miningCoal removed by deep miningCoal too thin for surface miningStripping ratio > 25 : 1Unconsolidated dep. > 60 ft. thickWithin 200 ft. of deep minesMining restricted within townsMining restricted near pipelinesMining restricted near roadsMining block too small
coal available for surface mining>200ft deepcoal erodedsurface minedeep mine200ft buffer around deep minescoal <14 inchesstripping ratio >25:1unconsolidated >60ft thicktowns + 2,640ft bufferpipelines + 100ft bufferpaved roads + 100ft buffermine block too small
12
3583
59
88
91
84
85
62
8682
57
65
89
64
80
81
58
39
61
90
63
79
87
38
155
36
12
105
222
221
157
104
107
137
139
108
102
115
113
133
128
135
126
151
134
153
158
136
117
140
101
124
152
116
110
244
109
131
132
130
125
245
129
92
78
106
112
103
156
223
111
114
127
138
119
243
154
241
25
100
118
66
60
159
56
3
141
40
26
11
150
8225
123
5349
149
4
294
160
242
13
99
28
93
10
77
67
coal available for surface mining>200ft deepcoal erodedsurface minedeep mine200ft buffer around deep minescoal <14 inchesstripping ratio >25:1unconsolidated >60ft thicktowns + 2,640ft bufferpipelines + 100ft bufferpaved roads + 100ft buffermine block too small
0.6 0 0.6 1.2 Miles
Explanation
Map of the Wheatland Quadrangleshowing coal available for surface mining and coal restricted from mining
erages

Extent of Danville coal Extent of Pennsylvanian SystemSurface minesUnderground mines
Map of southwestern Indiana showing the extent of the Danville coal, the PennsylvanianSystem, and distribution of the Danville coal surface and underground mines (from Conolly, 2001).
Posey
Vanderburgh
Gibson
Knox
Daviess
Sullivan
Greene
VigoClay Owen
Putnam
Parke
Verm
illio
n
Martin
DuboisPike
Warrick
Spencer
Perry
Fountain
Warren
0 10 miles
1 : 1,250,000
Map scale
Indiana
Danville coal
Extent and mined out areas
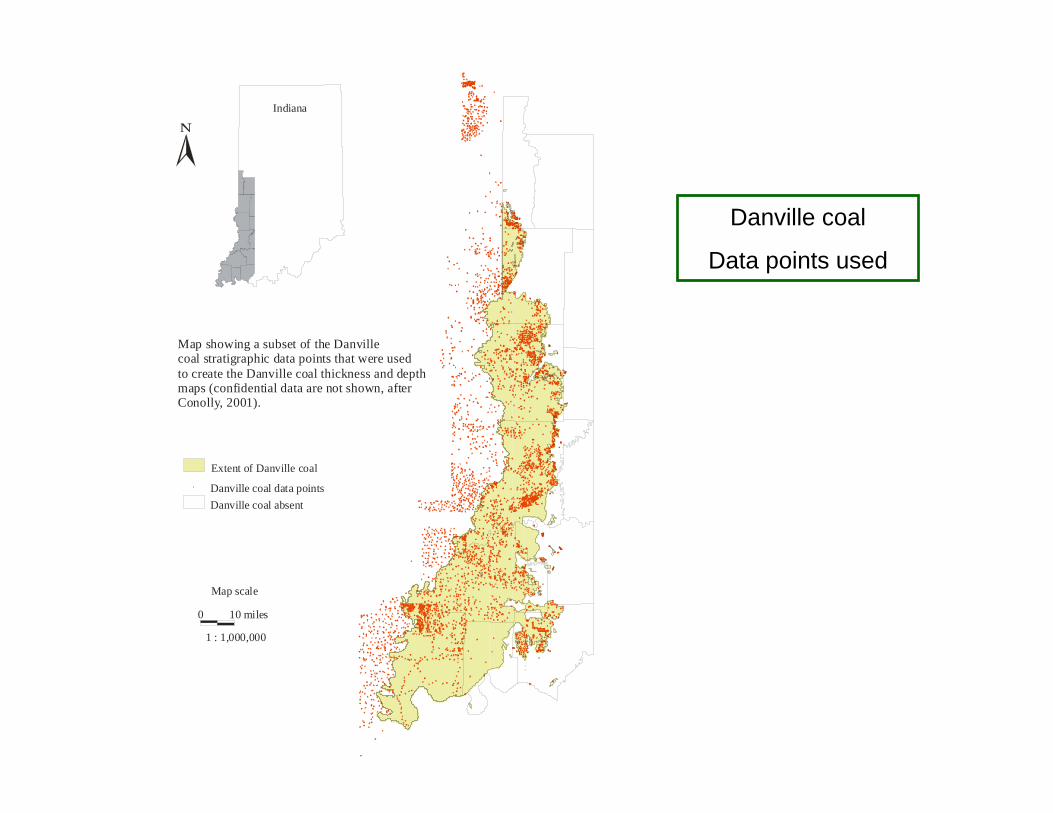
Map showing a subset of the Danville coal stratigraphic data points that were used to create the Danville coal thickness and depth maps (confidential data are not shown, afterConolly, 2001).
Extent of Danville coal
Danville coal data points
0 10 miles
1 : 1,000,000
Map scale
Danville coal absent
Indiana
Danville coal
Data points used
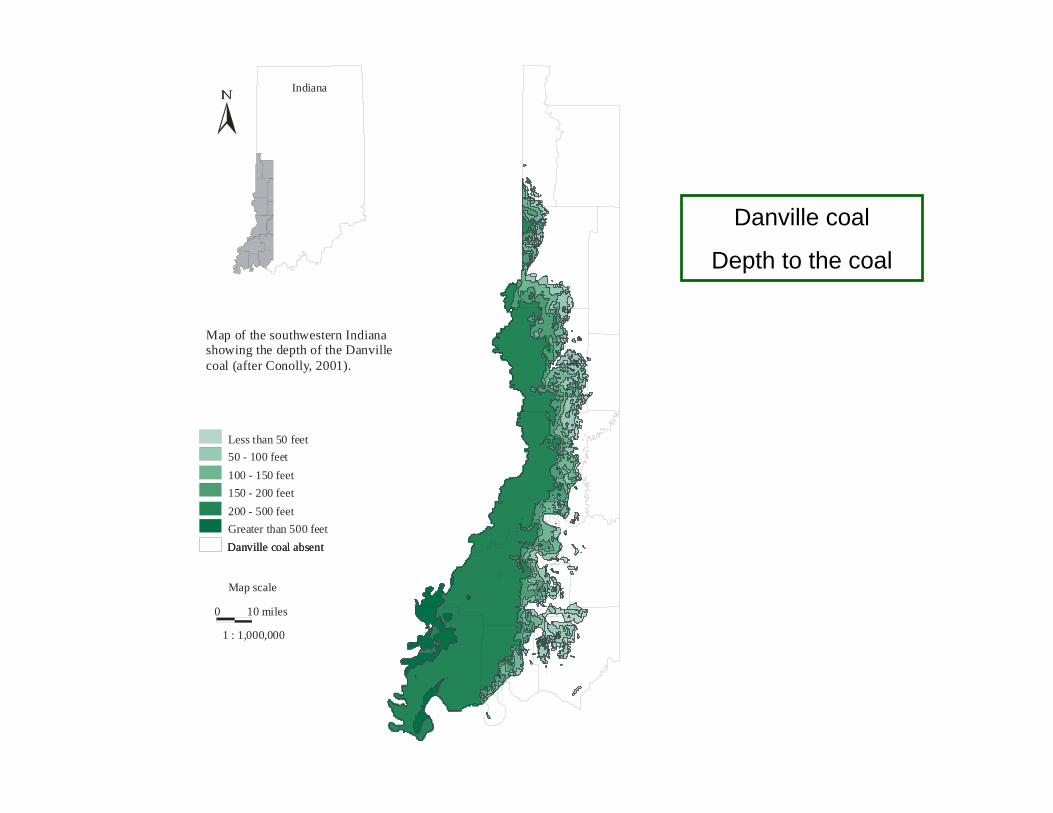
Map of the southwestern Indiana showing the depth of the Danville coal (after Conolly, 2001).
Less than 50 feet50 - 100 feet100 - 150 feet150 - 200 feet200 - 500 feetGreater than 500 feet
0 10 miles
1 : 1,000,000
Map scale
Danville coal absentDanville coal absent
Indiana
Danville coal
Depth to the coal
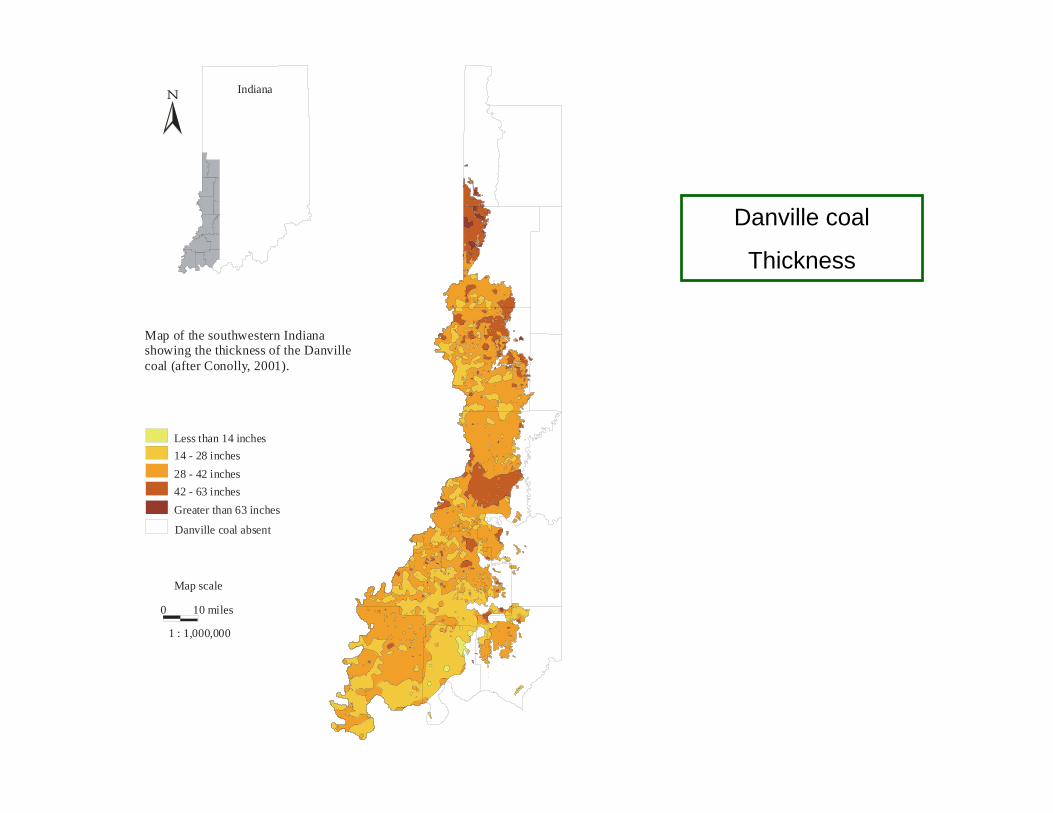
Map of the southwestern Indiana showing the thickness of the Danville coal (after Conolly, 2001).
Less than 14 inches14 - 28 inches28 - 42 inches42 - 63 inchesGreater than 63 inches
Danville coal absent
0 10 miles
1 : 1,000,000
Map scale
Indiana
Danville coal
Thickness
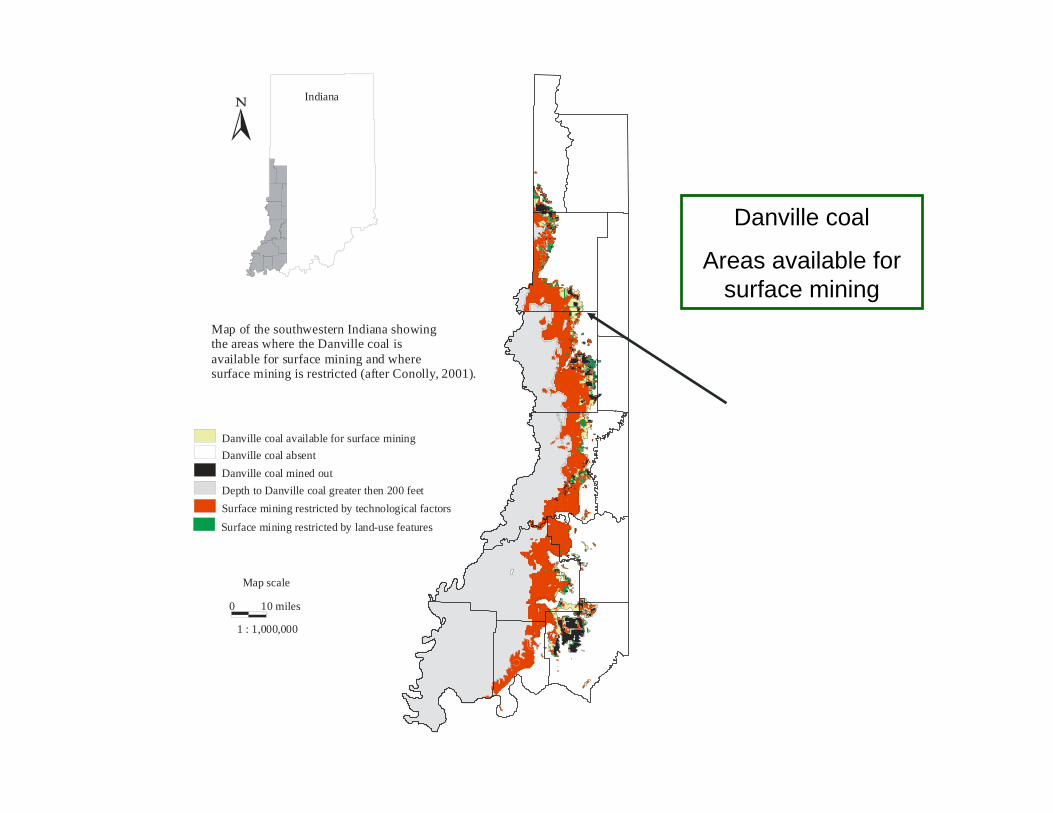
Danville coal available for surface miningDanville coal absentDanville coal mined outDepth to Danville coal greater then 200 feet
Surface mining restricted by land-use features
0 10 miles
1 : 1,000,000
Map scale
Surface mining restricted by technological factors
Map of the southwestern Indiana showing the areas where the Danville coal is available for surface mining and where surface mining is restricted (after Conolly, 2001).
Indiana
Danville coal
Areas available for surface mining
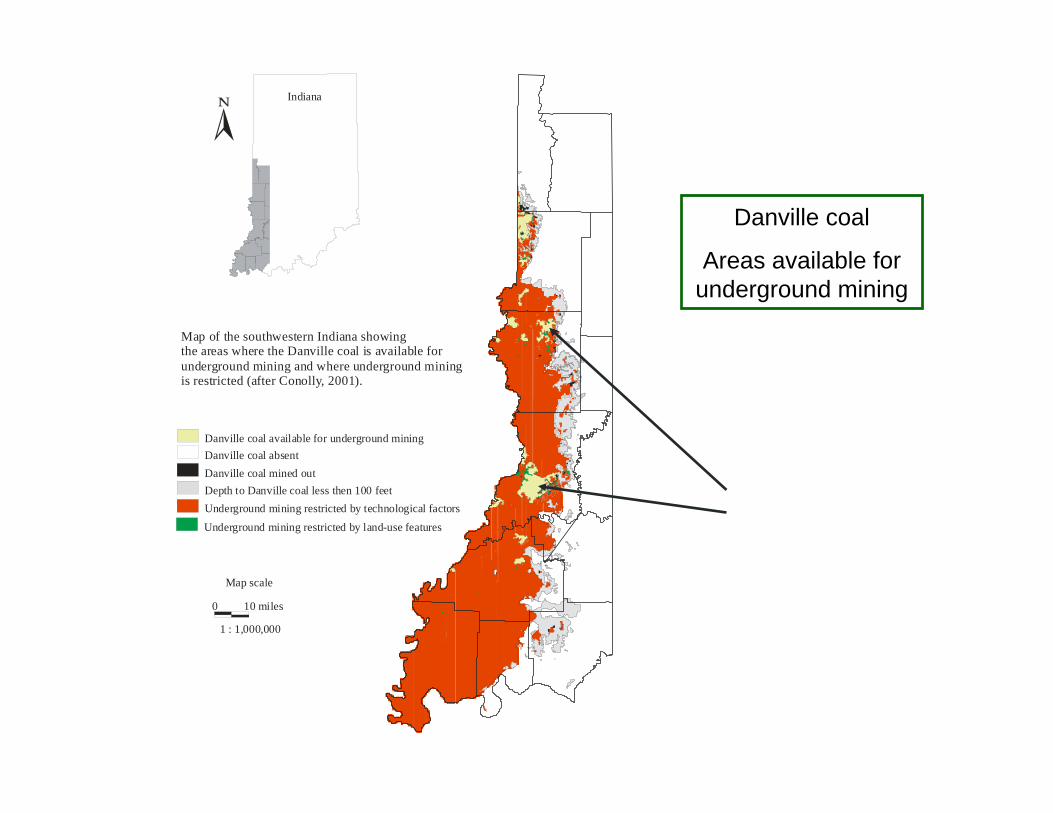
Map of the southwestern Indiana showing the areas where the Danville coal is available for underground mining and where underground mining is restricted (after Conolly, 2001).
Danville coal available for underground miningDanville coal absentDanville coal mined outDepth to Danville coal less then 100 feet
Underground mining restricted by land-use features
0 10 miles
1 : 1,000,000
Map scale
Underground mining restricted by technological factors
Indiana
Danville coal
Areas available for underground mining
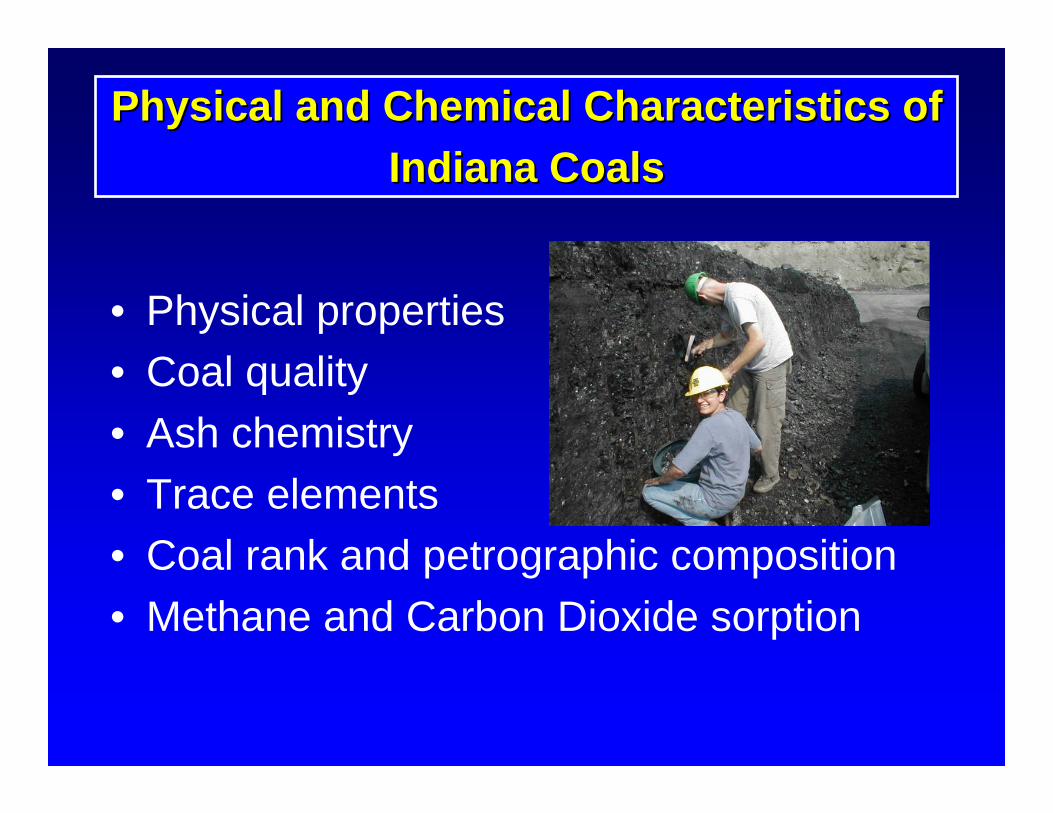
Physical and Chemical Characteristics of Physical and Chemical Characteristics of Indiana CoalsIndiana Coals
• Physical properties• Coal quality• Ash chemistry• Trace elements• Coal rank and petrographic composition• Methane and Carbon Dioxide sorption
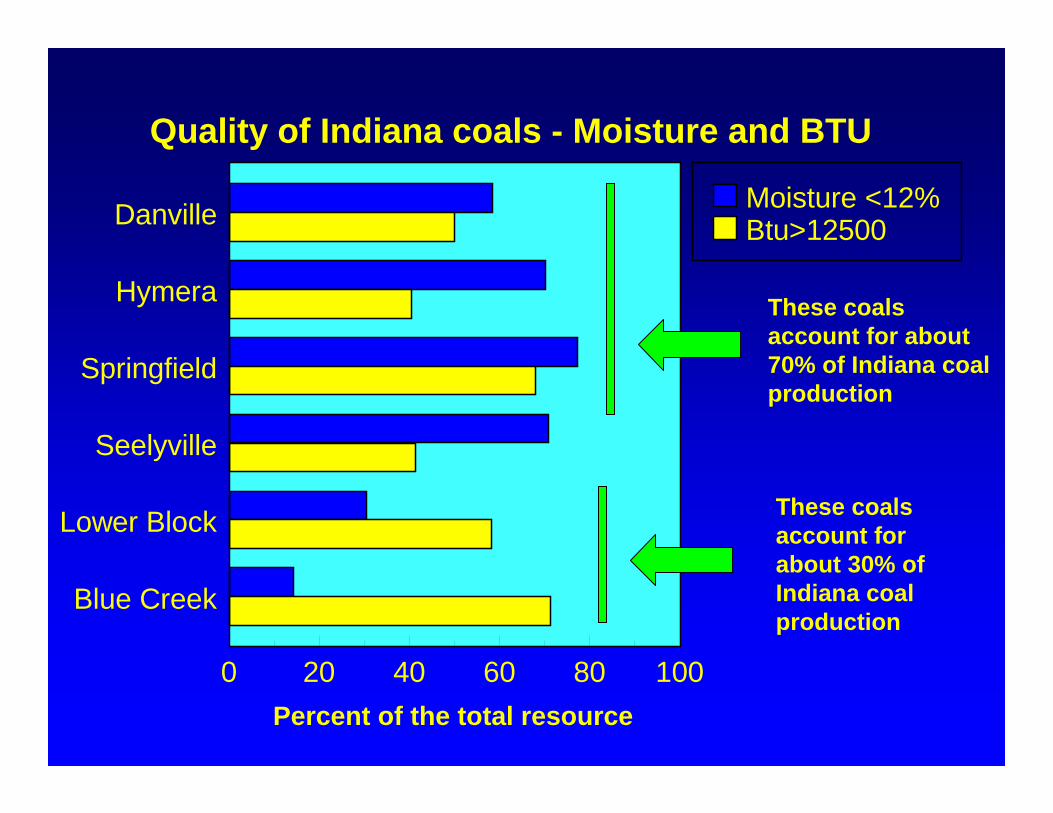
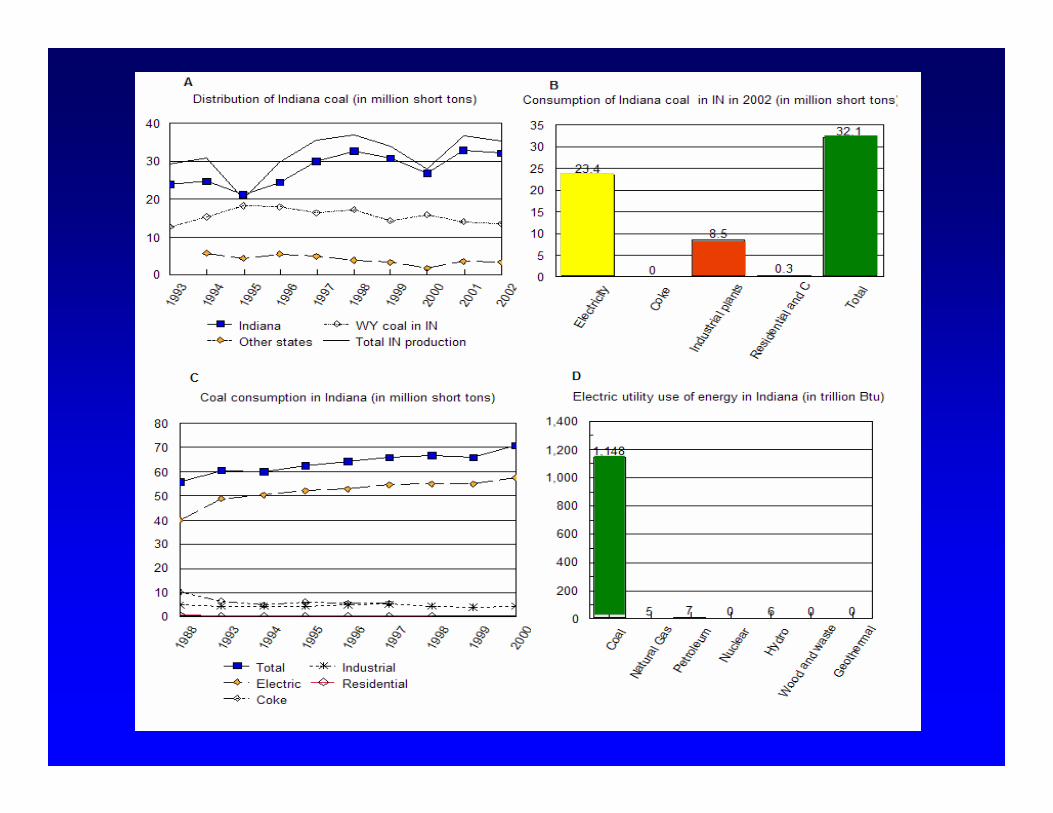
Quality of Indiana coals - Moisture and BTU
Danville
Hymera
Springfield
Seelyville
Lower Block
Blue Creek
0 20 40 60 80 100
Moisture <12%Btu>12500
Percent of the total resource
These coals account for about 30% of Indiana coal production
These coals account for about 70% of Indiana coal production

Quality of Indiana coal - Sulfur and ash
Danville
Hymera
Springfield
Seelyville
Lower Block
Blue Creek
0 20 40 60 80 100
Sulfur <2%Ash <10%
Percent of the total resource
These coals account for about 30% of Indiana coal production
These coals account for about 70% of Indiana coal production
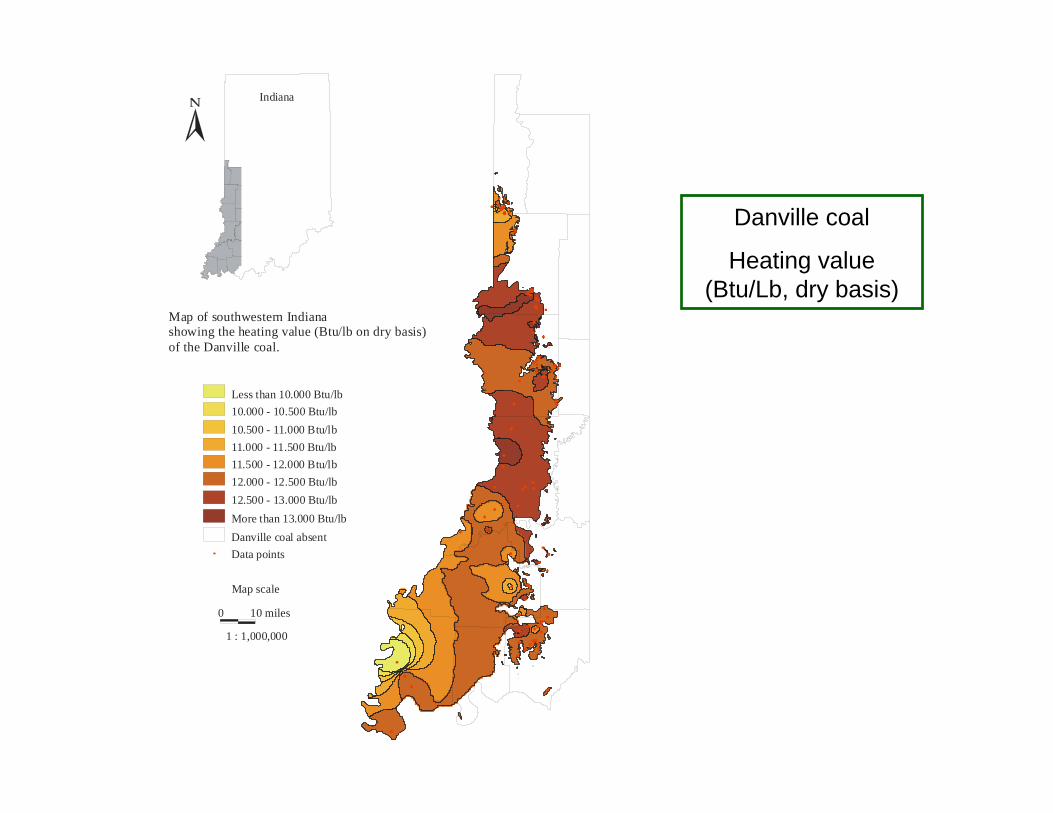
Map of southwestern Indiana showing the heating value (Btu/lb on dry basis) of the Danville coal.
Less than 10.000 Btu/lb10.000 - 10.500 Btu/lb
11.500 - 12.000 Btu/lb12.000 - 12.500 Btu/lb12.500 - 13.000 Btu/lb
Danville coal absent
0 10 miles
1 : 1,000,000
Map scale
More than 13.000 Btu/lb
Data points
10.500 - 11.000 Btu/lb11.000 - 11.500 Btu/lb
Indiana
Danville coal
Heating value (Btu/Lb, dry basis)
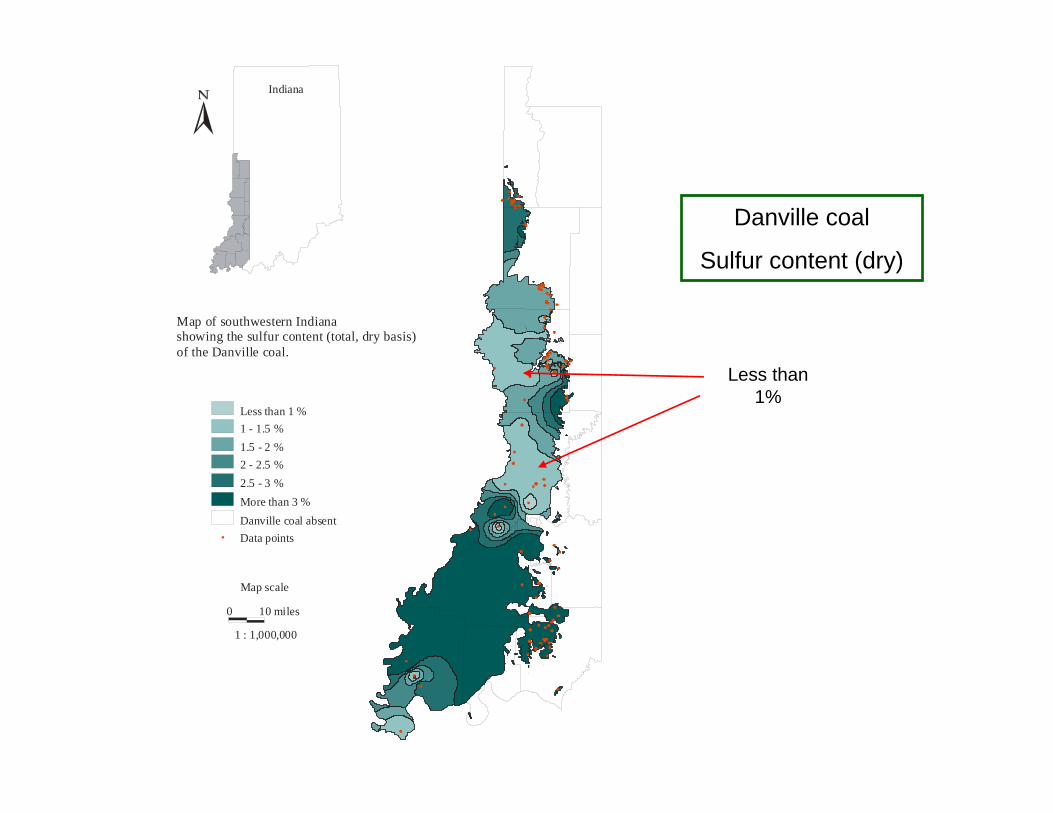
Map of southwestern Indiana showing the sulfur content (total, dry basis) of the Danville coal.
Less than 1 %1 - 1.5 %1.5 - 2 %2 - 2.5 %2.5 - 3 %
Danville coal absent
0 10 miles
1 : 1,000,000
Map scale
More than 3 %
Data points
Indiana
Danville coal
Sulfur content (dry)
Less than 1%

Map of southwestern Indiana showing the sulfur content (total, dry basis) of the Springfield coal.
Less than 1 %1 - 1.5 %1.5 - 2 %2 - 2.5 %2.5 - 3 %
Springfield coal absent
0 10 miles
1 : 1,000,000
Map scale
More than 3 %
Data points
Indiana
Springfield coal
Sulfur content (dry)
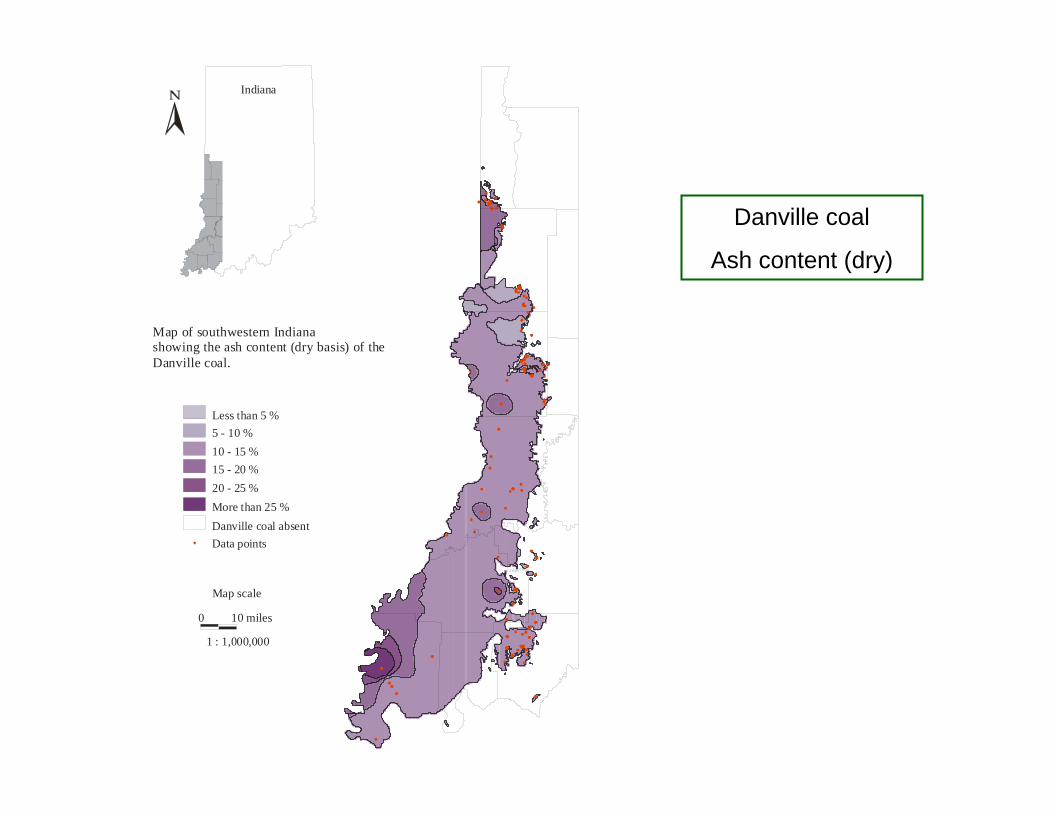
Map of southwestern Indiana showing the ash content (dry basis) of the Danville coal.
Less than 5 %5 - 10 %10 - 15 %15 - 20 %20 - 25 %
Danville coal absent
0 10 miles
1 : 1,000,000
Map scale
More than 25 %
Data points
Indiana
Danville coal
Ash content (dry)
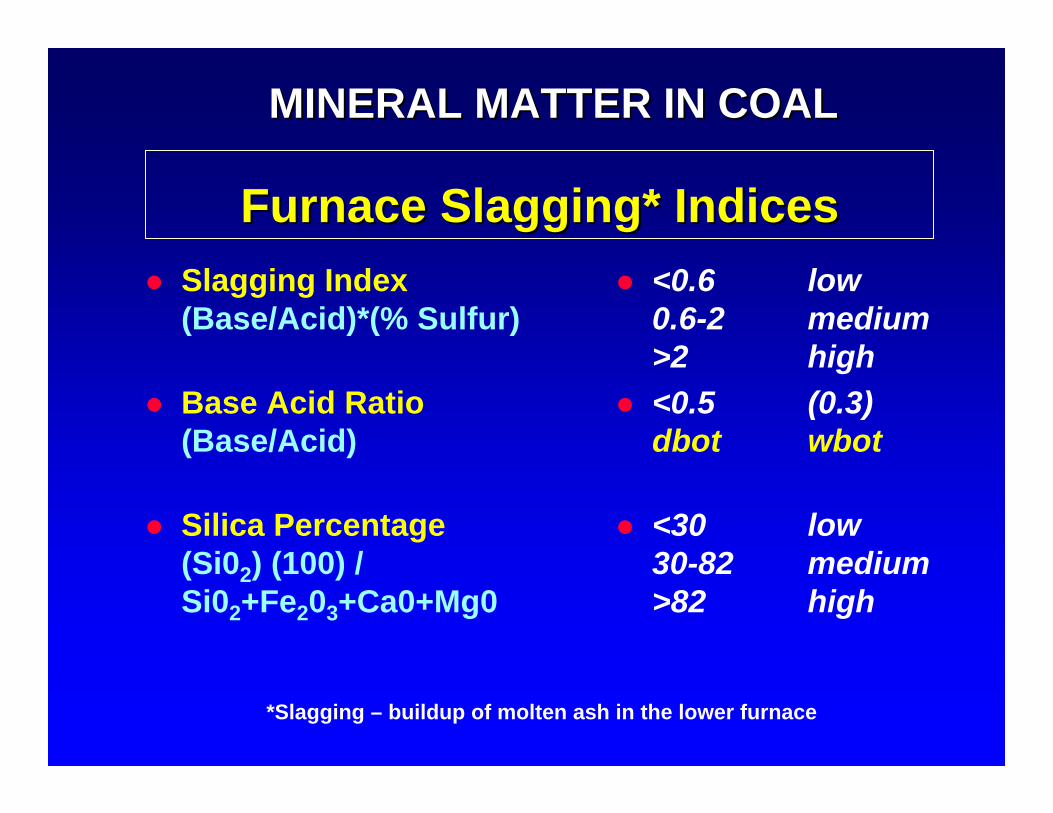
Furnace Furnace SlaggingSlagging* Indices* IndicesSlagging Index(Base/Acid)*(% Sulfur)
Base Acid Ratio(Base/Acid)
Silica Percentage(Si02) (100) /Si02+Fe203+Ca0+Mg0
<0.6 low0.6-2 medium>2 high<0.5 (0.3)dbot wbot
<30 low30-82 medium>82 high
*Slagging – buildup of molten ash in the lower furnace
MINERAL MATTER IN COALMINERAL MATTER IN COAL
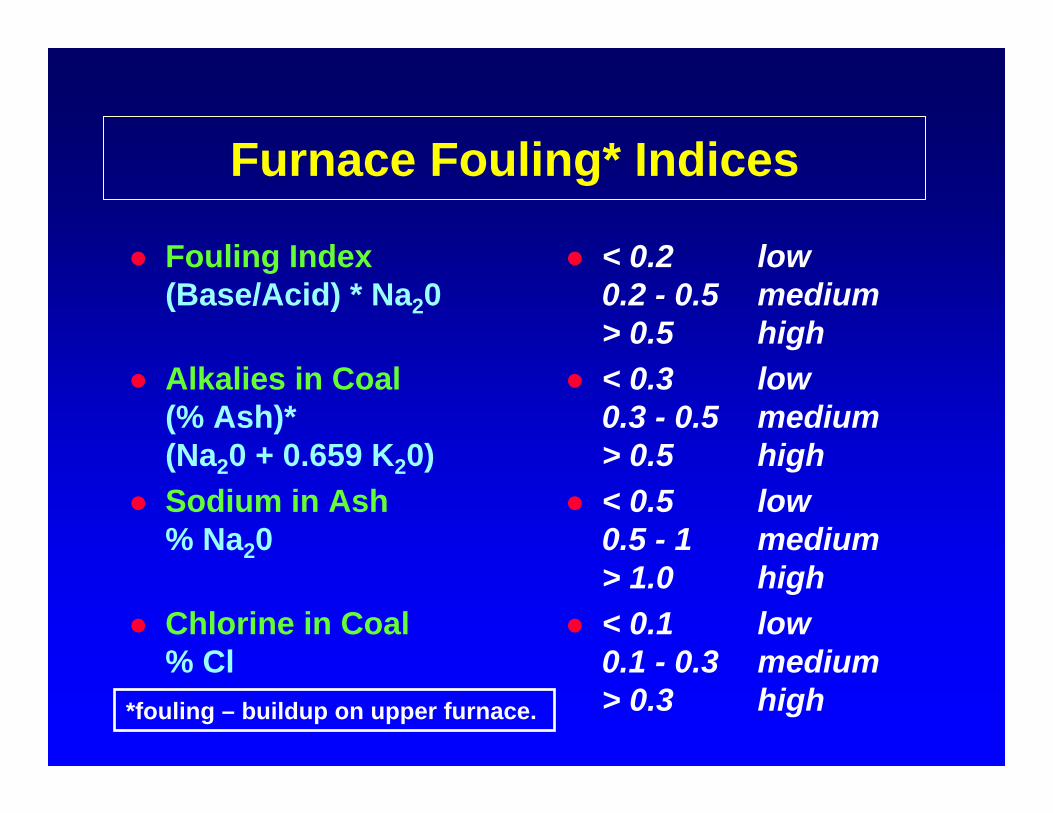
Furnace Fouling* Indices
Fouling Index(Base/Acid) * Na20
Alkalies in Coal(% Ash)*(Na20 + 0.659 K20)Sodium in Ash% Na20
Chlorine in Coal% Cl
< 0.2 low0.2 - 0.5 medium> 0.5 high< 0.3 low0.3 - 0.5 medium> 0.5 high< 0.5 low0.5 - 1 medium> 1.0 high< 0.1 low0.1 - 0.3 medium> 0.3 high*fouling – buildup on upper furnace.

0.9
1.61
1.84
2.02
2.93
4.3
0.42
0.43
Danville
Hymera
Springfield
Houchin Creek
Survant
Colchester
Seelyville
Upper Block
Lower Block
0 1 2 3 4 5
Slagging index
0.19
0.17
0.22
0.36
0.33
0.43
0.08
0.13
Danville
Hymera
Springfield
Houchin Creek
Survant
Colchester
Seelyville
Upper Block
Lower Block
0 0.1 0.2 0.3 0.4 0.5
Fouling index
Ash fusion T – low may cause slag deposits
Slagging index – low - below 0.6medium – 0.6-2.0high - above 2.0
Fouling index – low - below 0.2medium – 0.2-0.5high above 0.5

0 1 2 3 4 5 6 7WKY #18/Lisman
WKY #13 (Baker)
WKY #11 (Herrin)
WKY #9 (Springfield)
WKY#6 (DeKovan)
WKY #4
Dunbar/Lead Creek
Bell
SlaggingSlagging Index Index –– western Kentuckywestern Kentucky
< 0.6 = Low 0.6-2.0 = Medium > 2.0 = High
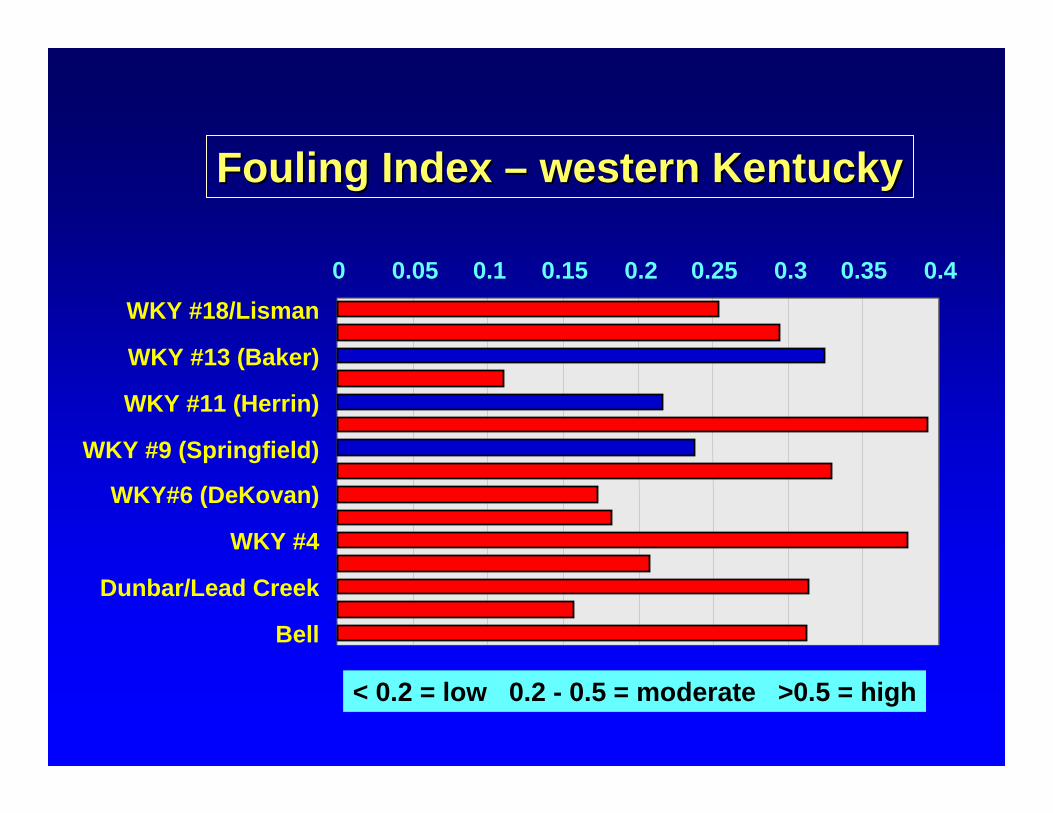
0 0.05 0.1 0.15 0.2 0.25 0.3 0.35 0.4WKY #18/Lisman
WKY #13 (Baker)
WKY #11 (Herrin)
WKY #9 (Springfield)
WKY#6 (DeKovan)
WKY #4
Dunbar/Lead Creek
Bell
Fouling Index Fouling Index –– western Kentuckywestern Kentucky
< 0.2 = low 0.2 - 0.5 = moderate >0.5 = high
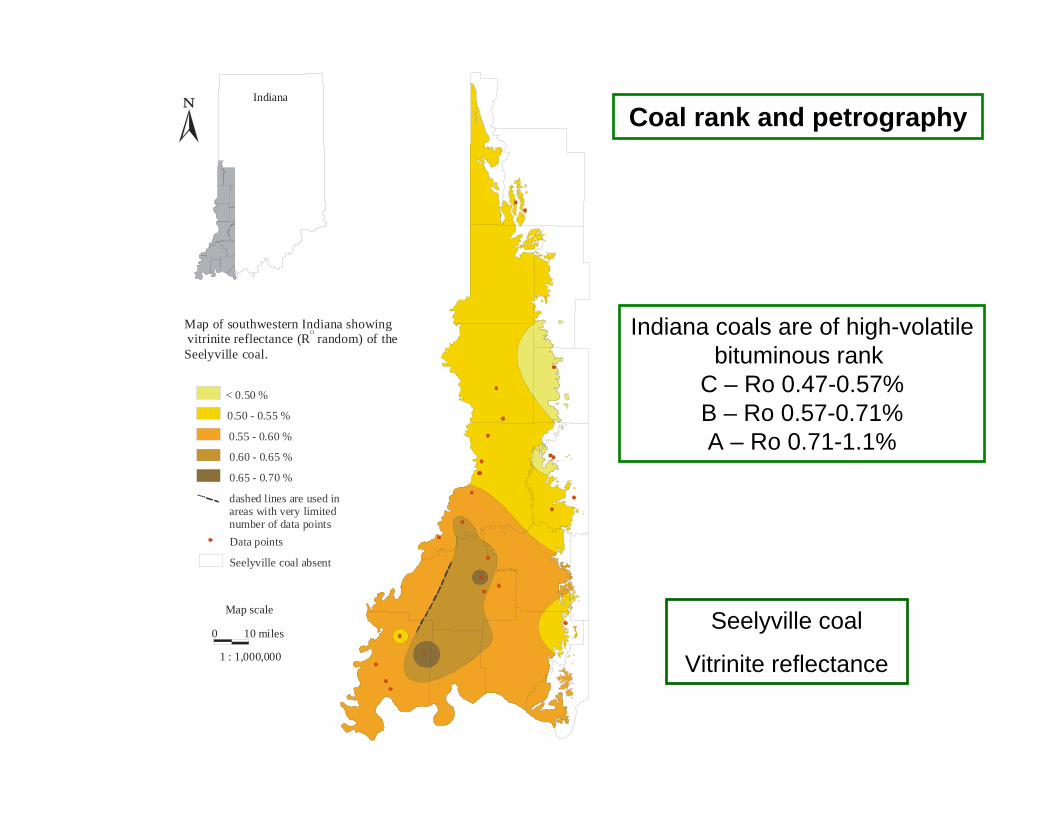
Map of southwestern Indiana showing vitrinite reflectance (R random) of the Seelyville coal.
0 10 miles
1 : 1,000,000
Map scale
O
0.50 - 0.55 %
0.55 - 0.60 %
0.60 - 0.65 %
< 0.50 %
Seelyville coal absent
0.65 - 0.70 %
Data points
dashed lines are used in areas with very limited number of data points
Indiana
Seelyville coal
Vitrinite reflectance
Coal rank and petrography
Indiana coals are of high-volatilebituminous rank
C – Ro 0.47-0.57%B – Ro 0.57-0.71%A – Ro 0.71-1.1%
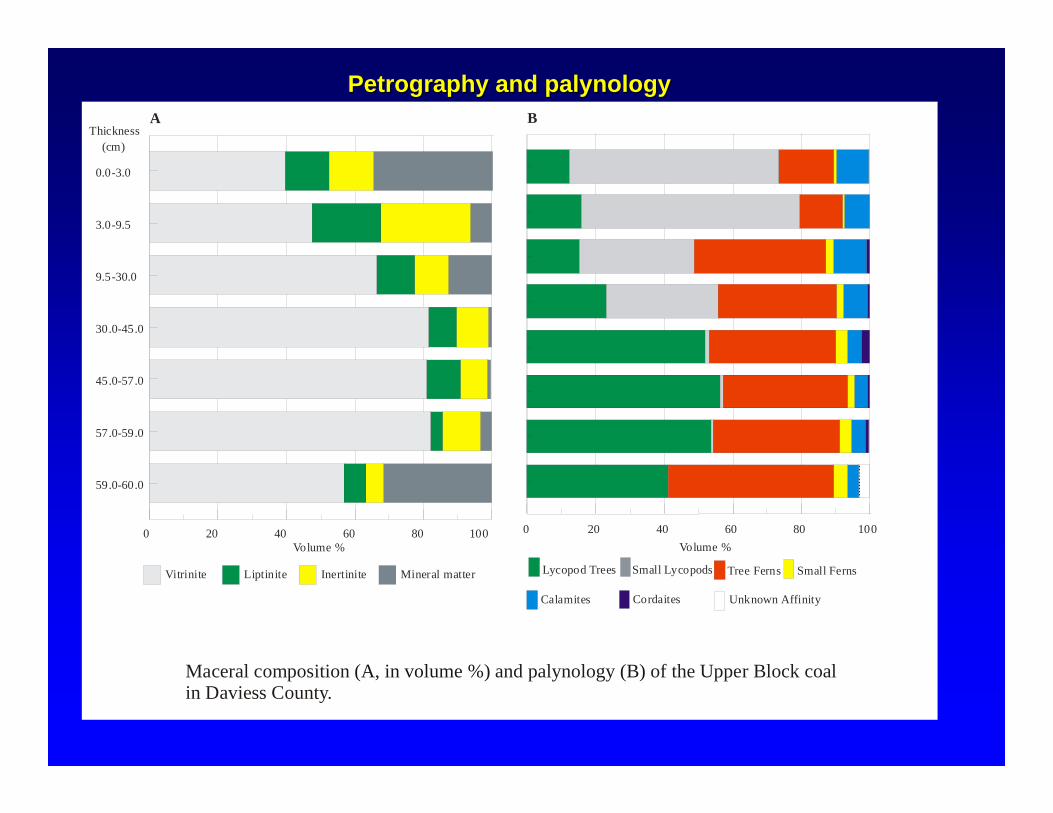
0 20 40 60 80
Lycopod Trees Small Lycopods Tree Ferns Small Ferns
Calamites Cordaites Unknown Affinity
Volume %
B
100
0.0-3.0
3.0-9.5
9.5-30.0
30.0-45.0
45.0-57.0
57.0-59.0
59.0-60.0
0 20 40 60 80 100
Vitrinite Liptinite Inertinite Mineral matter
Thickness (cm)
Volume %
A
Maceral composition and palynology of the Upper Block coal in Daviess County.
(A, in volume %) (B)
Petrography and Petrography and palynologypalynology
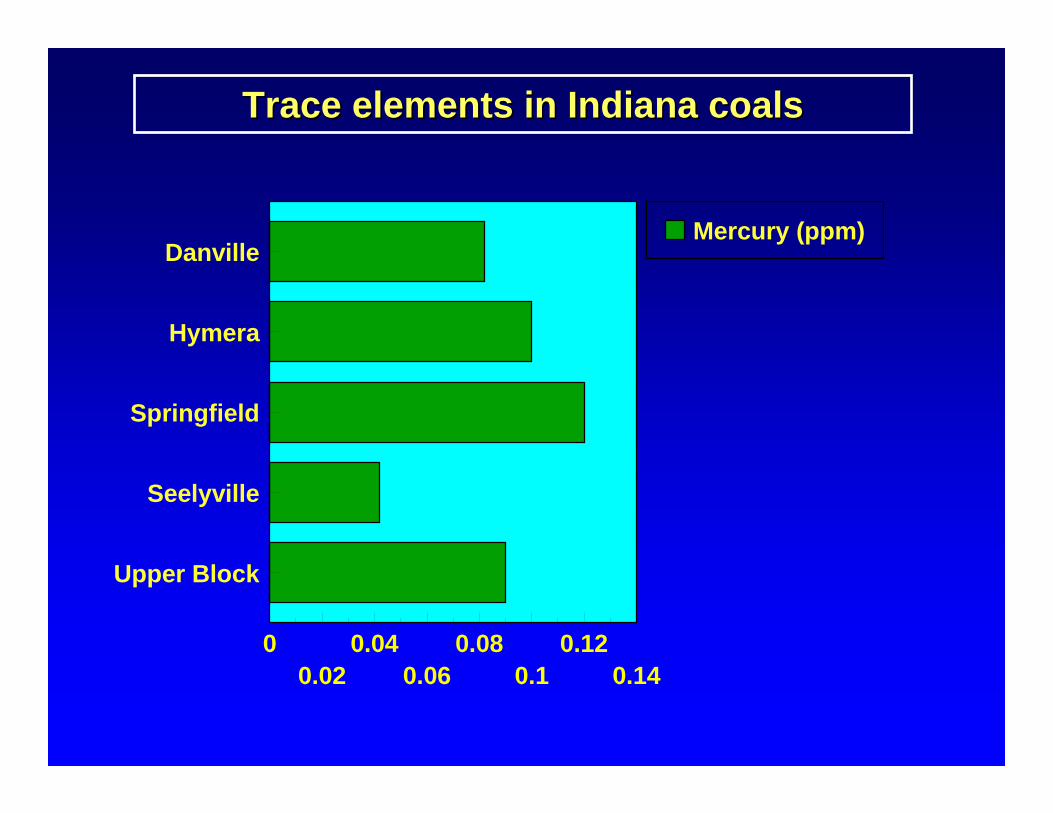
Danville
Hymera
Springfield
Seelyville
Upper Block
00.02
0.040.06
0.080.1
0.120.14
Mercury (ppm)
Trace elements in Indiana coalsTrace elements in Indiana coals

Map of southwestern Indiana showing the mercury content of the Danville coal.
Less than 0.05 ppm0.05 - 0.10 ppm0.10 - 0.15 ppm
Danville coal absent
0 10 miles
1 : 1,000,000
Map scale
More than 0.15 ppm
Data points
Indiana
Danville coal
Mercury content (ppm)
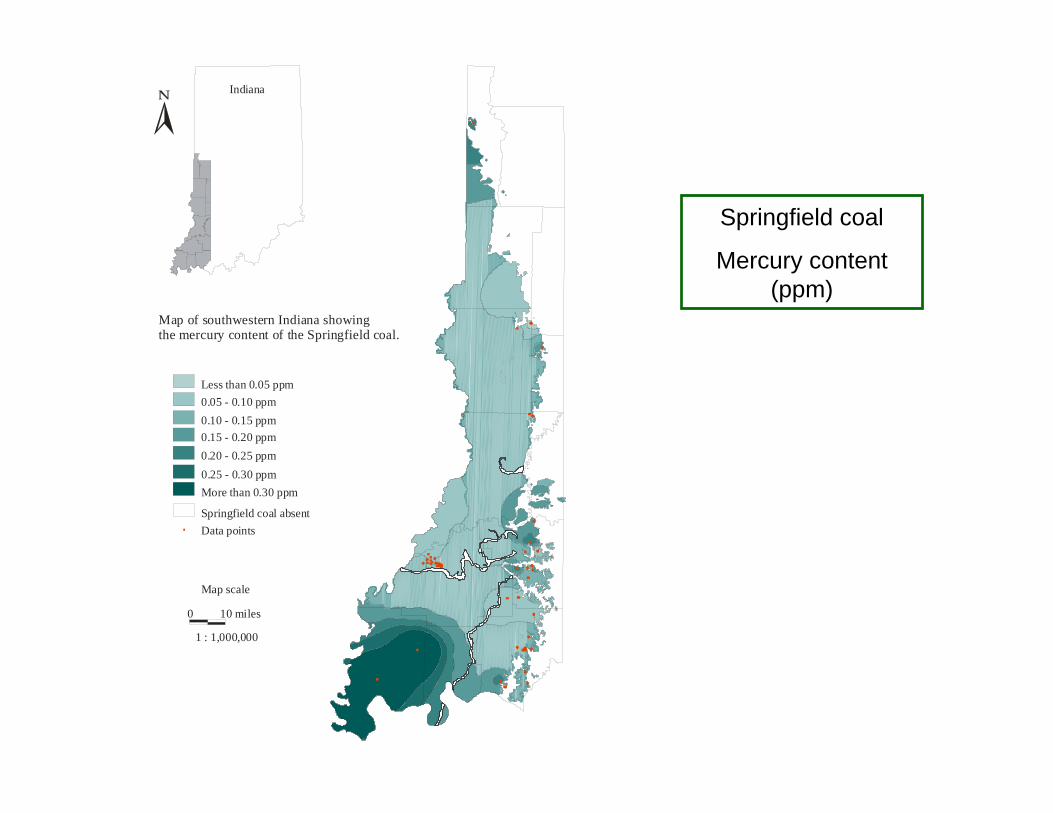
Map of southwestern Indiana showing the mercury content of the Springfield coal.
Less than 0.05 ppm0.05 - 0.10 ppm0.10 - 0.15 ppm
Springfield coal absent
0 10 miles
1 : 1,000,000
Map scale
More than 0.30 ppm
Data points
0.15 - 0.20 ppm0.20 - 0.25 ppm0.25 - 0.30 ppm
Indiana
Springfield coal
Mercury content (ppm)
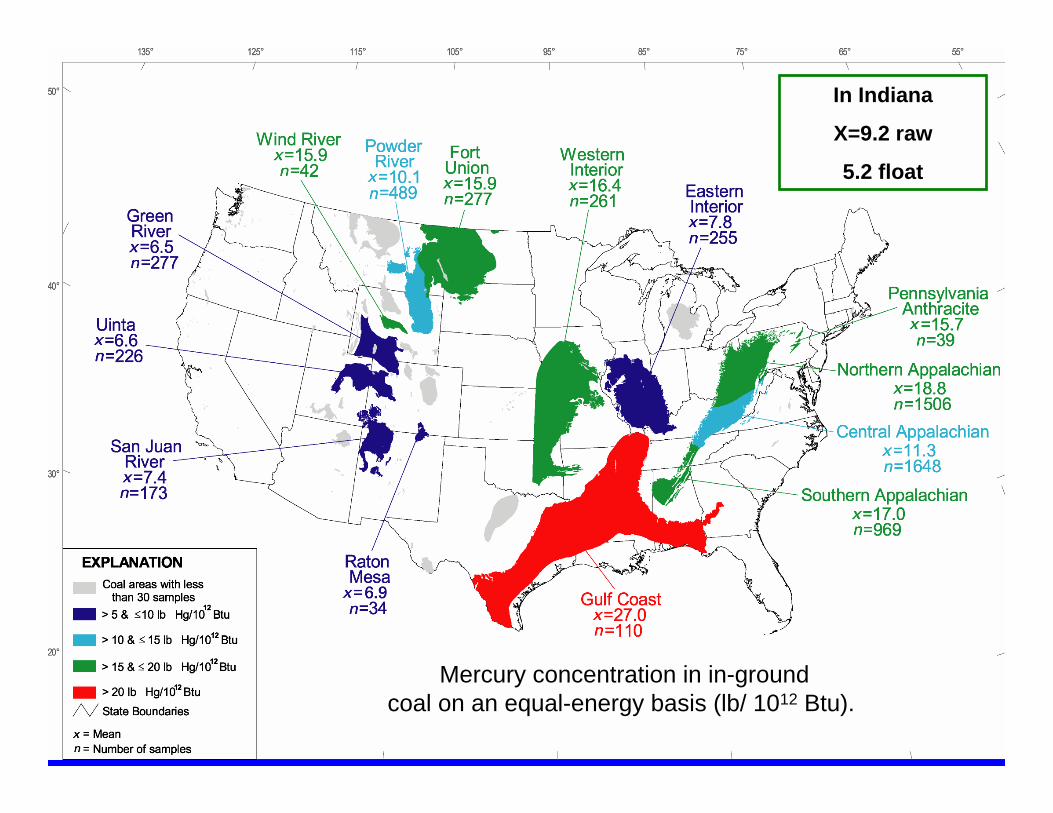
Mercury concentration in in-ground coal on an equal-energy basis (lb/ 1012 Btu).
In Indiana
X=9.2 raw
5.2 float

Regulatory approachesRegulatory approaches
• Bituminous – 2/TBtu• Subbituminous 5.8/TBtu• Lignite – 9.2/TBtu
• MACT – Compliance data – 08
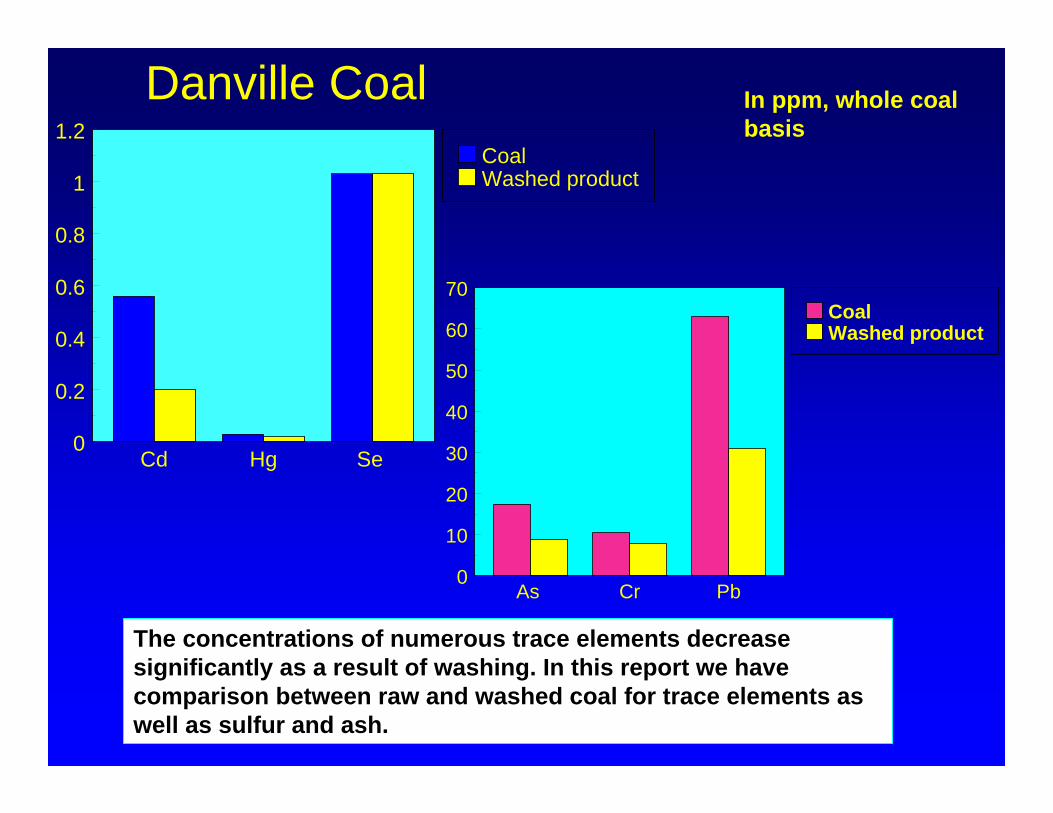
Danville Coal
The concentrations of numerous trace elements decrease significantly as a result of washing. In this report we have comparison between raw and washed coal for trace elements as well as sulfur and ash.
Cd Hg Se 0
0.2
0.4
0.6
0.8
1
1.2CoalWashed product
As Cr Pb0
10
20
30
40
50
60
70CoalWashed product
In ppm, whole coal basis
<50 50-70 70-90 >90Gas content (scf/t, raw basis)
0
10
20
30
40
A. Springfield
<50 50-70 70-90 90-110 >1100
5
10
15
20
25
30
35
B. Seelyville
Gas content (scf/t, raw basis)
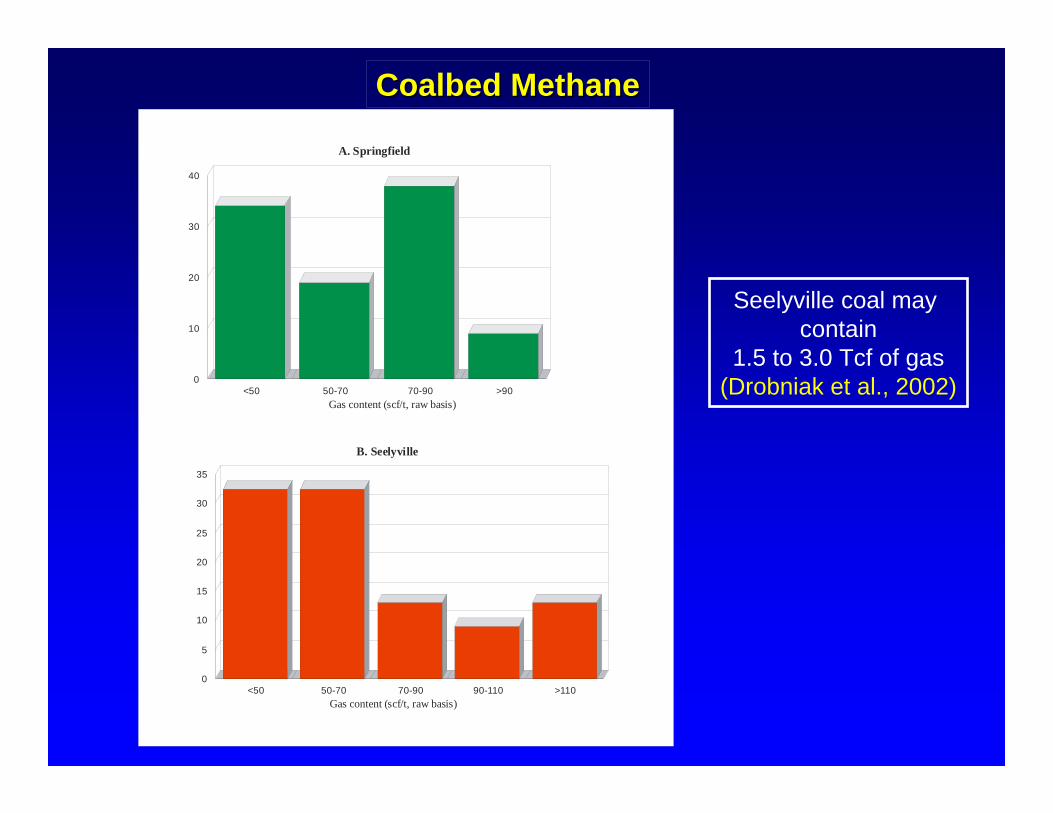
Coalbed MethaneCoalbed Methane
Seelyville coal may contain
1.5 to 3.0 Tcf of gas(Drobniak et al., 2002)
Seelyville - Posey County
0100200300400500600700800900
0 500 1000 1500 2000
Pressure (PSI)
CO2
CH4
Springfield - Warrick County
0
200
400
600
800
1000
0 500 1000 1500 2000
Pressure (PSI)
CO2
CH4
Danville - Sullivan County
0100
200300
400500
600700
800
0 200 400 600 800 1000 1200 1400
Pressure (psi)
CO2
CH4
Danville - Knox County
0100200300400500600700800900
0 500 1000 1500
Pressure (psi)
CO2
CH4
Upper Block - Parke County
0
100
200
300
400
500
600
700
0 500 1000 1500
Pressure (PSI)
CO2
CH4
Upper Block - Parke County
0
100
200
300
400
500
600
700
0 500 1000 1500
Pressure (PSI)
CO2
CH4
3.44.4
4.8 5.0
3.73.9
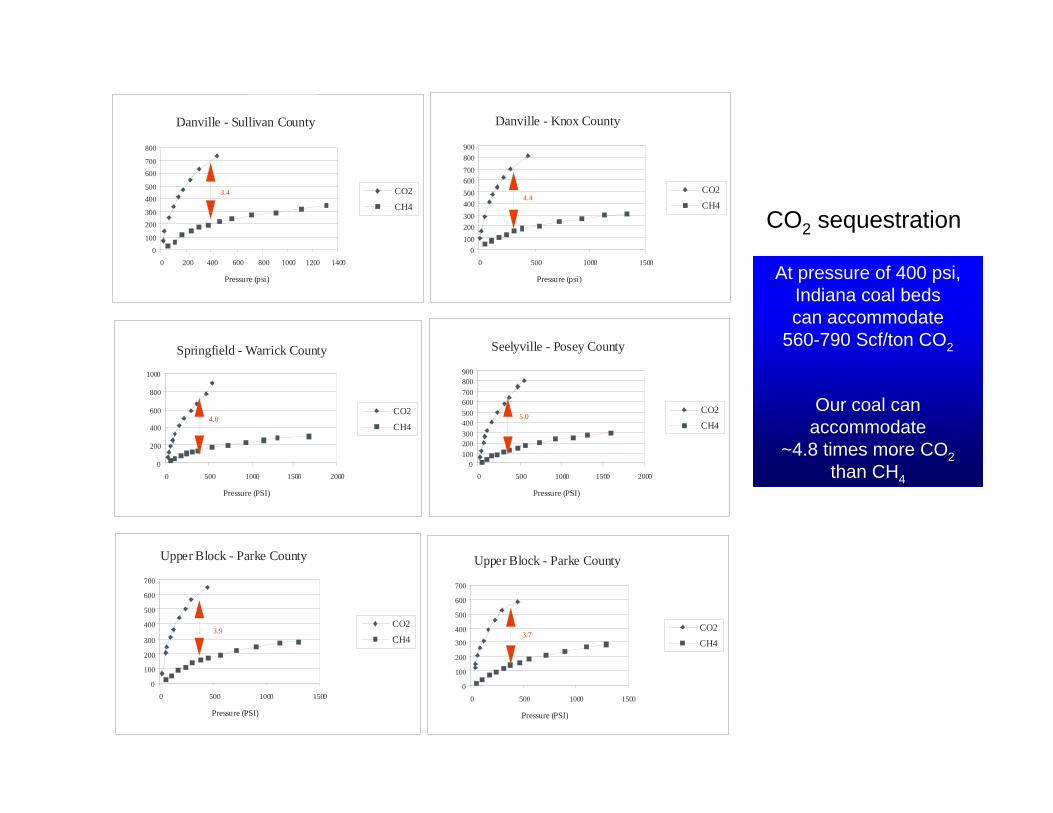
CO2 sequestration
At pressure of 400 psi,Indiana coal beds can accommodate
560-790 Scf/ton CO2
Our coal can accommodate
~4.8 times more CO2than CH4
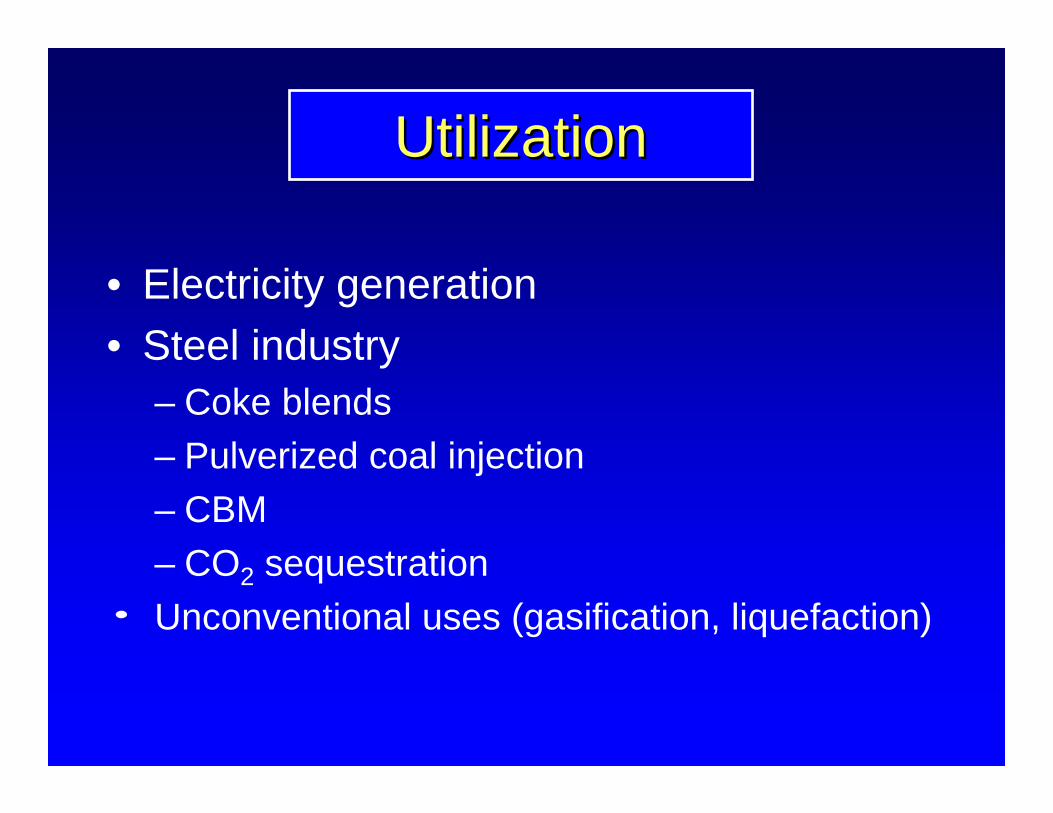
UtilizationUtilization
• Electricity generation• Steel industry
– Coke blends– Pulverized coal injection– CBM– CO2 sequestrationUnconventional uses (gasification, liquefaction)
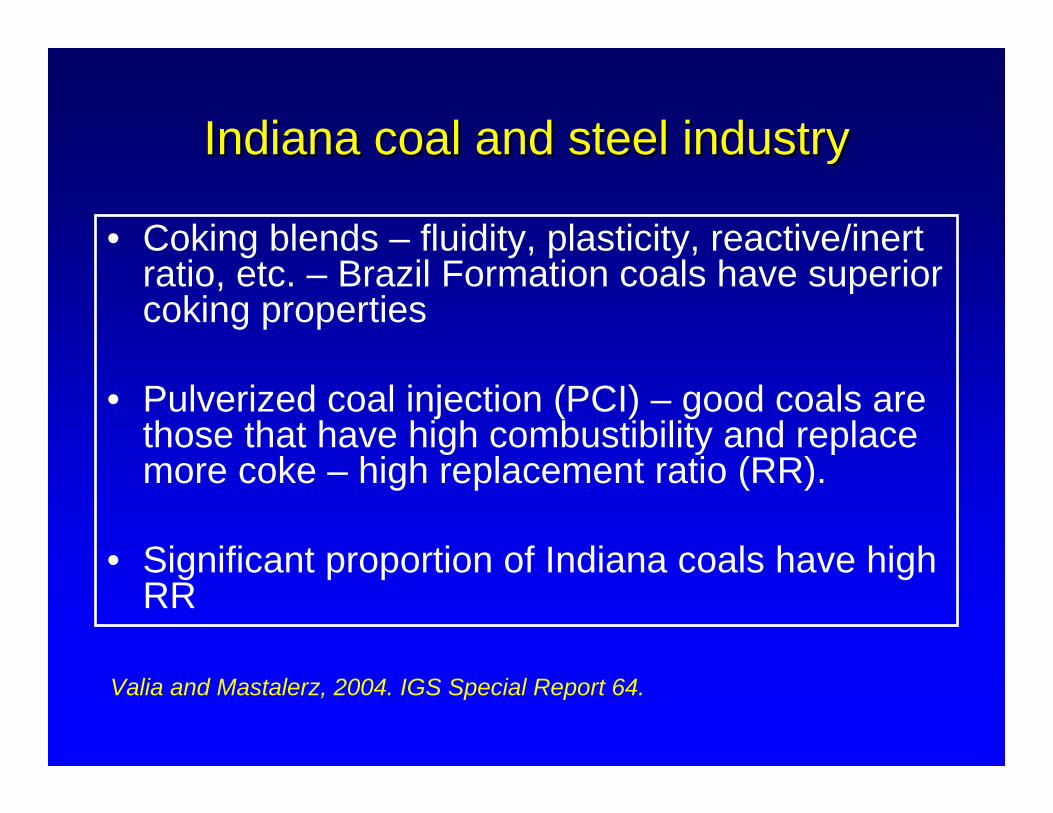
Indiana coal and steel industryIndiana coal and steel industry
• Coking blends – fluidity, plasticity, reactive/inert ratio, etc. – Brazil Formation coals have superior coking properties
• Pulverized coal injection (PCI) – good coals are those that have high combustibility and replace more coke – high replacement ratio (RR).
• Significant proportion of Indiana coals have high RR
Valia and Mastalerz, 2004. IGS Special Report 64.

Non-coking, but some good for PCIe.g. Danville coal
Superior coking propertiesLower Block coal
240 micrometers
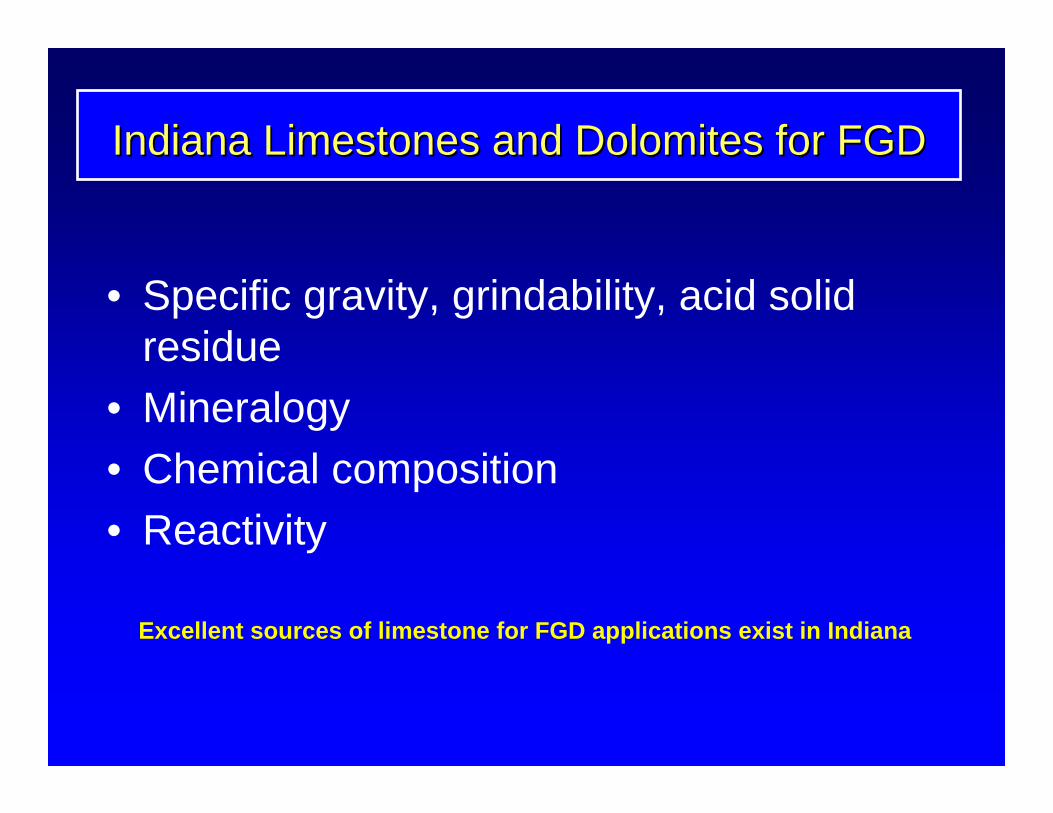
Indiana Limestones and Dolomites for FGDIndiana Limestones and Dolomites for FGD
• Specific gravity, grindability, acid solid residue
• Mineralogy• Chemical composition• Reactivity
Excellent sources of limestone for FGD applications exist in Indiana
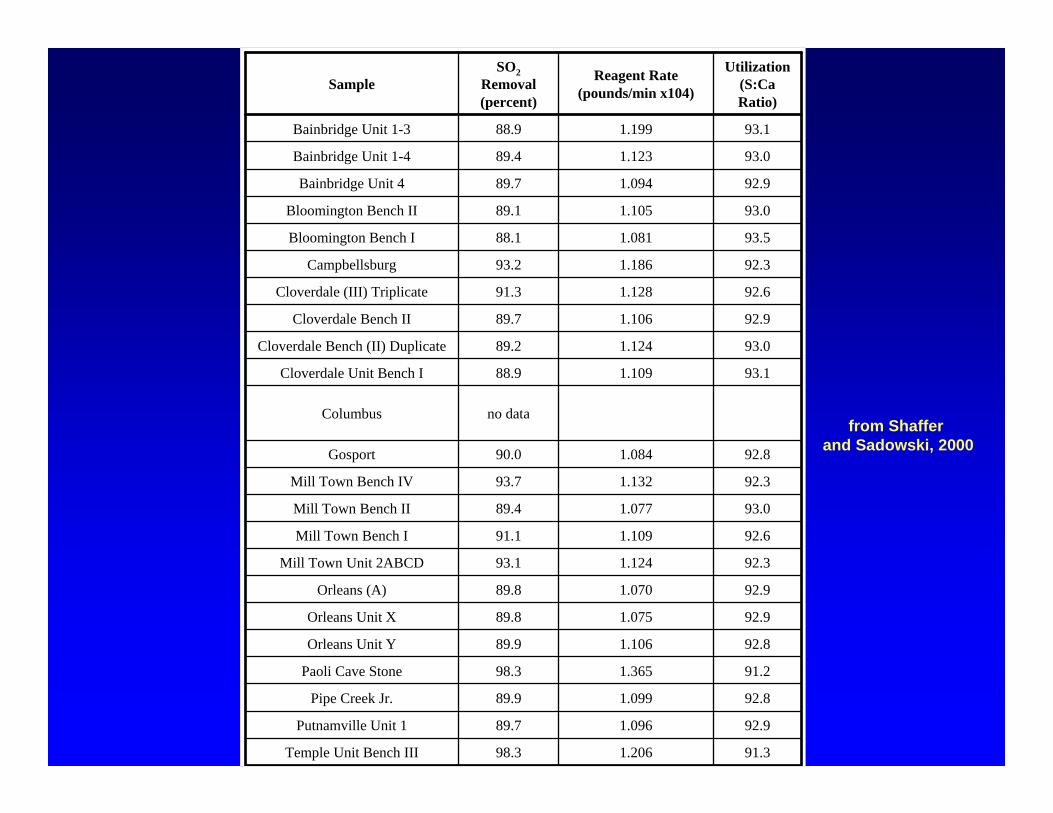
91.31.20698.3Temple Unit Bench III
92.91.09689.7Putnamville Unit 1
92.81.09989.9Pipe Creek Jr.
91.21.36598.3Paoli Cave Stone
92.81.10689.9Orleans Unit Y
92.91.07589.8Orleans Unit X
92.91.07089.8Orleans (A)
92.31.12493.1Mill Town Unit 2ABCD
92.61.10991.1Mill Town Bench I
93.01.07789.4Mill Town Bench II
92.31.13293.7Mill Town Bench IV
92.81.08490.0Gosport
no dataColumbus
93.11.10988.9Cloverdale Unit Bench I
93.01.12489.2Cloverdale Bench (II) Duplicate
92.91.10689.7Cloverdale Bench II
92.61.12891.3Cloverdale (III) Triplicate
92.31.18693.2Campbellsburg
93.51.08188.1Bloomington Bench I
93.01.10589.1Bloomington Bench II
92.91.09489.7Bainbridge Unit 4
93.01.12389.4Bainbridge Unit 1-4
93.11.19988.9Bainbridge Unit 1-3
Utilization(S:CaRatio)
Reagent Rate(pounds/min x104)
SO2Removal(percent)
Sample
from Shaffer and Sadowski, 2000
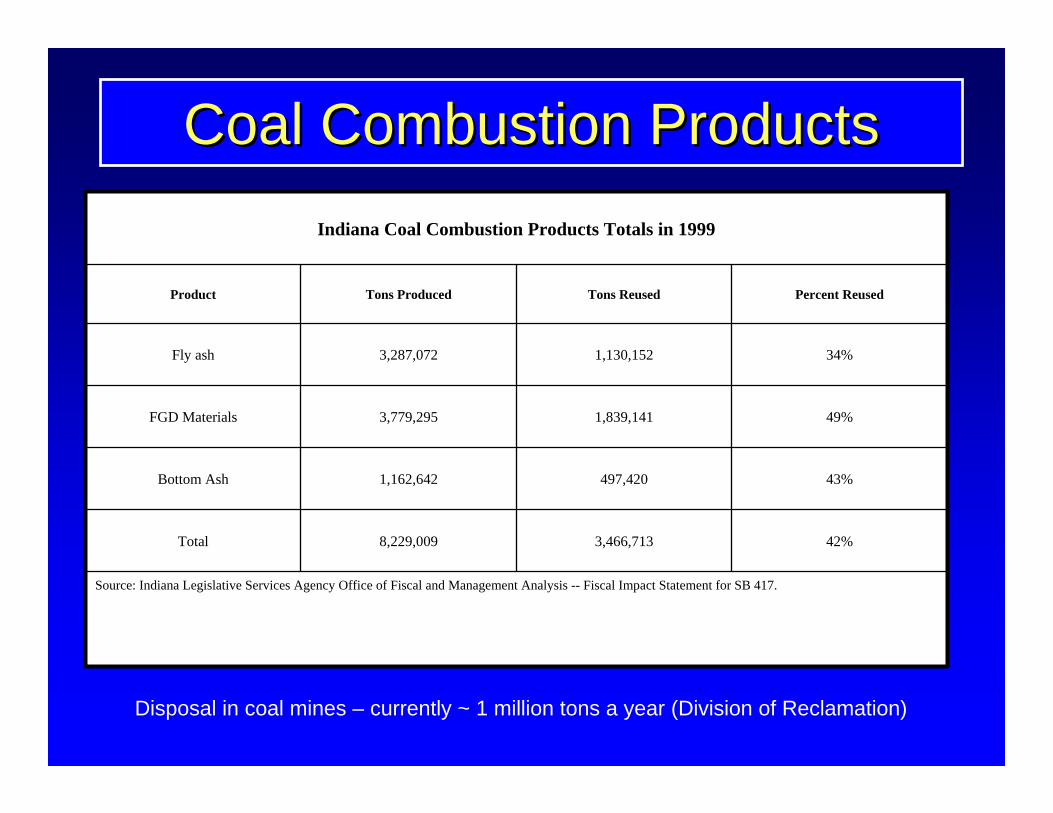
Coal Combustion ProductsCoal Combustion Products
Source: Indiana Legislative Services Agency Office of Fiscal and Management Analysis -- Fiscal Impact Statement for SB 417.
42%3,466,7138,229,009Total
43%497,4201,162,642Bottom Ash
49%1,839,1413,779,295FGD Materials
34%1,130,1523,287,072Fly ash
Percent ReusedTons ReusedTons ProducedProduct
Indiana Coal Combustion Products Totals in 1999
Disposal in coal mines – currently ~ 1 million tons a year (Division of Reclamation)

Unconventional applications
-Low-grade ore
-Carbon whiskers
-Composites
-Fullerenes
SUMMARY: Availability SUMMARY: Availability Coal availability studies shows:
17-18 billion short tons of coal are available for mining (surface and underground) in Indiana.At current production rate, this reserve would
last for more than 500 years.But this can only be accomplished by a significant increase in the percentage produced by underground mining.Production using current practices (80% surface -20% underground) will last only 100 years.
Indiana coals, being part of the Illinois Basin, have many common characteristics with the coals of Illinois and western Kentucky.
Similar coalification level; high volatile bituminous rank dictates such properties as calorific value, moisture, carbon content, etc.
High volatile bituminous rank: very suitable for combustion, but also useful for gasification or liquefaction because of their reactivity.
SUMMARY: SUMMARY: BasinwideBasinwideCharacteristics Characteristics

SUMMARY: Heating Value
Indiana coals (and those of the entire Illinois Basin) have good heating value
Better than most Western coals but lower than Appalachian coals.Compared to western coals, we need to burn
less Indiana coal to get the same amount of energy.
SUMMARY: Heating Value SUMMARY: Heating Value
Most of Indiana coal is high in sulfurSignificant portions of the Danville and the
Brazil Fm. coals are low-sulfur compliance coals.Illinois and western Kentucky do not have this
low sulfur resource.Availability of good quality limestones (for
FGD) close to our power plants helps utilize high sulfur coals.
SUMMARY: Sulfur Content SUMMARY: Sulfur Content
SUMMARY: Trace Elements SUMMARY: Trace Elements
Trace elements in Indiana coals are usually on the low side for Illinois Basin coals and low in other elements in comparison with Western coals.
Mercury is generally low. Washing results in significant reduction not only sulfur but numerous trace elements as well.
SUMMARY: Alternative Uses SUMMARY: Alternative Uses
There is an increasing interest in CBM and CO2 sequestration potential of Indiana coalsPrevious and current projects provide
more data and indicate some potential areasMore research needed

ACKNOWLEDGMENTS
To the Center for Coal Technology Research andIndiana Department of Commerce for
sponsoring the project.
To industrial cooperators in Indiana for assistance and access to coal mines, especially to
Black Beauty Coal Company for financial support and coal quality analyses.
To our colleagues: Phil Ames, Kathy Shaffer, Paul Irwin, Sally Letsinger,
Rachel Walker, and Amy Foster
CHARACTERIZATION OF INDIANA’S COAL RESOURCE: AVAILABILITY OF THE RESERVES,
PHYSICAL AND CHEMICAL PROPERTIES OF THE COAL, AND THE PRESENT AND POTENTIAL USES.
Maria Mastalerz, Agnieszka Drobniak, John Rupp, and Nelson Shaffer
Indiana Geological SurveyIndiana University
611 North Walnut GroveBloomington, IN 47405-2208
Open-File Study 04-02


