122
Profitability Analysis
• Introduction
• Trend Analysis
• Concentration Indices
• Ratio Analysis
• Overall Profitability Performances
• Conclusions
• References
Chapter-IV
123
Introduction
The term profit is an accounting concept which shows the
excess of income over expenditure viewed during a specified period
of time. Profit is the main reason for the continued existence of every
commercial organization. On the other hand, the term profitability is
a relative measure where profit is expressed as a ratio, generally as a
percentage. Profitability depicts the relationship of the absolute
amount of profit with various other factors. Profitability is a relative
concept which is quite useful in decision-making. Another main issue
here is profit planning, which consists of various steps to be taken to
improve the profitability of the bank.
Profit is the very reason for the continued existence of every
commercial organization. The rate of profitability and volume of
profits are therefore, rightfully considered as indicators of efficiency
in the deployment of resources of banks.1
Profitability indicates earning capacity of the banks. It
highlights the managerial competency of the banks. It also portrays
work culture, operating efficiency of the bank.2

124
Profitability is the most important and reliable indicator as it
gives a broad indication of the ability of a bank to raise its income
level. Profitability of banks is affected by a number of factors. Some
of these are endogenous, some are exogenous and yet structural.
Changes in policies made by RBI are exogenous to the system. This
includes changes in momentary policy, changes in quantitative credit
control like changes in CRR, SLR, manipulation of bank rates,
qualitative credit controls like selective credit control measures, C/D
ratio, regionwise guidelines on lending to priority sectors, changes in
interest rates on deposits and advances, levy of tax on interest income
etc. Various other factors like careful control of expenditure, timely
recovery of loans are endogenous. Various structural factors include
geographical spread of bank branches, decentralization in the
management and structural changes in deposits and advances.
Banking structure and profitability structure of banking system
across countries have a bearing on the profitability of banks.3 The
profitability of banks is affected one way or the other by these factors,
either individually or jointly. Bank profitability is causing concern to
all. After libralisation, profitability has regained its lost importance.
Now efforts are being directed to achieve the profitability targets. The
profitability of public sector banks has been indicating a fast
declining trend in the past and the situation in future may not be
different if all the concerned do not take timely preventive measures
before the situation goes out of control. Since all the banks in the
country function under similar environments, the low performance

125
of any bank can be attributed to a larger extent to their managerial
inefficiency and structural deficiency. Certain populistic Central
Government disregarding the basic banking principles, coupled with
lethargic attitude of the management of nationalized banks lead to
inefficiency, in-competency and deceleration in performance.4 The
major reasons for this declining profitability can be summarized as
under:
1. Non-Performing advances leading to bad debts..
2. Legal Expenses to recovers the bad debts..
3. Cut Throat competition among banks to lure deposits.
4. Narrowing Spread.
5. Branch Expansion on unviable consideration.
6. Ineffective organizational restructuring.
7. Lack of proper management of resources.
8. More concentration on deposit orientation than profit
orientation.
9. Increasing burden of administrative expenses.
10. Increasing establishment expenses.
11. Ineffective marketing strategies resulting in reduction in
market share.
12. No turn-over strategies.
13. Ineffective cost-oriented strategies.
14. Subsidized service charges like concession granted.
15. Ineffective environment scanning.
126
The problem of low profitability and designing profitability has
been historical to the banking system. “The banks are virtually
suffering from scissors crisis, with a declining rate of increase in
earnings and rising costs.5”
The profitability analysis of commercial banks used to be a
frustrating experience as the financial statements of banks concealed
much and revealed less. But now-a-days, after liberalization under
pressure from regulatory agencies and the public, the trend has
changed. So now the profitability analysis of commercial banks
means something. The financial statements of commercial banks are
now prepared keeping in mind are the various changes, so they
reveal each and every aspect.
Profits have been, and are under tremendous pressure.
Declining trends in profits and profitability have become a major
cause of concern for all and in order to ensure the survival and
growth of this vital sector of economy, it becomes essential to identify
various factors which have studiedly contributed towards the decline
in bank profitability so that corrective action can be taken and future
profitability is ensured. The major factors that have a bearing on the
financial viability of the banks are:
1. Priority Sector Lending.
2. Credit Policies.
3. Massive Geographical Expansion.
4. Industrial Sickness.
5. Growing Competition.
127
6. Deposit Composition.
7. Increasing Establishment Expenses.
8. Low Income from Ancillary Business.
9. Spread and Burden – Their Backward Linkages and
Movements.
10. Miscellaneous Factors (Like declining credit AND mounting
overdue).6
The present trend of low and declining profitability can be
arrested and reversed if the remedial measures are tried in right
direction to ease the pressure on profitability.7
The profit rates obtained by using sales or value added as
denominators will therefore give us a short-term perspective of
profitability. The return on capital employed on investments or total
assets or fixed assets as variously defined, on the other hand will give
us long-term perspective of profitability8.
As far as, profitability analysis is concerned, the present study
employs the following methods. These are:
1. Trend Analysis
2. Concentration Index
3. Ratio Analysis
Trend Analysis
Trend Analysis becomes imperative to evaluate the overall
profits and profitability performance of commercial banks. It clearly
indicates the magnitude and direction of operations over a period of
time; it also helps to identify certain banks in respect of their level of
128
efficiency in operations. It shows the trend pattern in order to
identify the historical development. The study attempts to assess the
profits and profitability of banks, through trend analysis of the
following parameters:-
1. Net Profit
2. Total Income
3. Total Expenditure
4. Spread
5. Burden
6. Working Funds
7. Advances
8. Deposits
1. Net Profit:
Every business exists in order to earn profit. Without profit no
commercial activity can sustain for a long period. Similarly, profit
earning has become the main motive of commercial banks operating
in India. Profit earning and timely growth in the profit earning is an
essential feature for the continued success of a bank. On the basis of
trends in net profits of all the 27 PSBs under study, as shown in the
Table 4.1, the maximum growth rate (exponential) was witnessed by
SB. While the minimum exponential growth rate was witnessed by IB
i.e. 27.54 per cent followed by DB i.e. 17.78 per cent An analysis of
data on the basis of percentage growth rate (as shown in Table 4.2)
over the base year i.e. 1996 shows that the maximum percentage
growth rate was recorded in the case of BOB i.e. 169 per cent followed

129
by PNB i.e. 157.35 per cent and for the same period lowest growth
rate was shown by PSB i.e. -28.42 per cent and SB i.e. -15.04 per cent
respectively. In absolute terms SBI recorded the highest total income
among all the 27 PSBs in all the years under study i.e. from 1996 to
2007.
2. Total Income
The total income of a bank depends upon the interest and
discount earned, commission, exchange and brokerage and the other
miscellaneous receipts. On the basis of trends in total income of all
the 27 PSBs under study, as shown in the Table 4.3, the maximum
growth rate (exponential) was witnessed by CB i.e. 25.59 per cent
followed by OBC i.e. 24.73 per cent While the minimum exponential
growth rate was witnessed by IB i.e. 7.21 per cent followed by UCB
i.e. 8.64 per cent An analysis of data on the basis of percentage
growth rate (as shown in Table 4.4) over the base year i.e. 1996 shows
that the maximum percentage growth rate was recorded in the case
of BOI i.e. 83 per cent followed by SBH i.e. 68 per cent and for the
same period minimum growth rate was shown by SB i.e. 12.16 per
cent followed by 13.42 per cent in the case of VB. In absolute terms
SBI recorded the highest total income among all the 27 PSBs in all the
years under study i.e. from 1996 to 2007.
3. Total Expenditure

130
As far as the expenditure of public sector banks is concerned, it
is fixed to a large extent because these banks cannot reduce labour
force as the other industries can do in order to minimize their
expenditure but in the recent years banks have taken some steps in
this respect. The main components of the bank expenditure are
interest on deposit, establishment expenditure and other expenditure.
On the basis of trends in total expenditure of all the 27 PSBs under
study, as shown in the Table 4.5, the maximum growth rate
(exponential) was witnessed by OBC i.e. 24.82 per cent followed by
CB i.e. 23.76 per cent. While the minimum exponential growth rate
was witnessed by UCB i.e. 7.36 per cent followed by IB i.e. 7.54 per
cent An analysis of data on the basis of percentage growth rate (as
shown in Table 4.6) over the base year i.e. 1996 shows that the
maximum percentage growth rate was recorded in the case of SBS i.e.
33.69 per cent followed by IB i.e. 31.52 and the minimum growth rate
for the same period was witnessed by SB i.e. 8.06 per cent followed by
VB i.e. 9.265. In absolute terms SBI recorded the highest total
expenditure among all the 27 PSBs in all the years under study i.e.
from 1996 to 2007.
4. Spread
Spread, which is the difference between the interest earned on
loans and advances and interest paid on deposits and borrowings by
the banks. It is the net amount available to banks for meeting the

131
various expenses. To make an analysis of the profitability of
commercial banks, it is necessary to make a study of exponential
growth rate of trends. On the basis of trends in total spread of all the
27 PSBs under study, as shown in the Table 4.7, the maximum
growth rate (exponential) was witnessed by UntBI i.e. 29.67 per cent
followed by 24.80 per cent in the case of IOB. While the minimum
exponential growth rate was witnessed by IB i.e. 6.79 per cent
followed by 12.52 per cent in case of UBI. An analysis of data on the
basis of percentage growth rate (as shown in Table 4.8) over the base
year i.e. 1996 shows that the maximum percentage growth rate was
recorded in the case of SBP i.e. 391.26 per cent followed by BOB i.e.
213.78 per cent whereas for the same period, the lowest growth rate
was shown by UntBI i.e. 6.78 per cent and SB i.e. 9.6 per cent
respectively. In absolute terms SBI recorded the highest total spread
among all the 27 PSBs in all the years under study i.e. from 1996 to
2007.
5. Burden
It is a difference between non-interest expenditure and non-
interest of a commercial bank. While making an profitability analysis
of commercial banks, burden plays an important role. On the basis of
trends in total burden of all the 27 PSBs under study, as shown in the

132
Table 4.9, the maximum growth rate (exponential) was witnessed by
IOB i.e. 17.47 per cent followed by BOB i.e. 16.18 per cent. While the
minimum exponential growth rate was witnessed by COB i.e. -8.03
per cent followed by CB i.e. 4,86 per cent. An analysis of data on the
basis of percentage growth rate (as shown in Table 4.10) over the base
year i.e. 1996 shows that the maximum percentage growth rate was
recorded in the case of SBP i.e. 75.39 per cent followed by UCB i.e.
42.68 per cent and for the same period minimum growth rate was SBI
i.e. -32.26 per cent followed by – 29.78 per cent in the case of CB.
6. Working funds
In order to refine the study, the trend of working funds has also
been taken into consideration. All the 27 banks have been put under
the study to know the exponential growth rate of the working funds.
On the basis of trends in total working funds of all the 27 PSBs under
study, as shown in the Table 4.11, the maximum growth rate
(exponential) was witnessed by COB i.e. 24.44 per cent followed by
OBC i.e. 23.57 per cent. While the minimum exponential growth rate
was witnessed by UCB i.e. 7.68 per cent followed by IB i.e. 9.09 per
cent. An analysis of data on the basis of percentage growth rate over
133
the base year i.e. 1996 shows that the maximum percentage growth
rate (as shown in Table 4.12) was recorded in the case of SBM i.e.
18.92% followed by SBT i.e. 15.99 per cent and for the same period the
lowest growth rate was witnessed by VB i.e. -23.31 per cent and -6.78
per cent in case of CB respectively. In absolute terms SBI recorded the
highest total working funds among all the 27 PSBs in all the years
under study i.e. from 1996 to 2007.
7. Advances
The main earning of a commercial bank is from the advances
provided to the public and the industry. Ultimately, the interest is to
be earned from this major factor only. Interest constitutes the main
part of the total income of the commercial bank. So the exponential
growth rate of advances of various PSBs under study has been taken
into consideration. On the basis of trends in total advances of all the
27 PSBs under study, as shown in the Table 4.13, the maximum
growth rate (exponential) was witnessed by CB i.e. 27.3 per cent
followed by OBC i.e. 22.86 per cent. While the minimum exponential
growth rate was witnessed by UCB i.e. 1.52 per cent followed by IB
i.e. 4.05 per cent. An analysis of data on the basis of percentage
growth rate (as shown in Table 4.14 ) over the base year i.e. 1996
shows that the maximum percentage growth rate was recorded in the

134
case of UCB i.e. 21.15 per cent followed by SBH i.e. 20.23 per cent and
for the same period minimum growth rate was shown by VB i.e. -7.10
per cent followed by SB i.e. -2.39 per cent. In absolute terms SBI
recorded the highest total advances among all the 27 PSBs in all the
years under study i.e. from 1996 to 2007.
8. Deposits
It is the main component of the liability side of the balance
sheet of a bank. Interest is to be paid on the deposits received from
the public and the other parties. Interest paid constitutes the major
part of the total expenditure of a commercial bank. Keeping in mind
the significance of this factor, the EGR of deposits has been
computed. On the basis of trends in total deposits of all the 27 PSBs
under study, as shown in the Table 4.15, the maximum growth rate
(exponential) was witnessed by OBC i.e. 23.95 per cent followed by
COB i.e. 23.86 per cent. While the minimum exponential growth rate
was witnessed by UCB i.e. 9.98 per cent followed by IB i.e. 9.58 per
cent and for the same period, the lowest growth rate was shown by
SBP i.e. -9.63 per cent and -5.6 per cent in case of SBBJ respectively.
An analysis of data on the basis of percentage growth rate (as shown
in Table 4.16) over the base year i.e. 1996 shows that the maximum
percentage growth rate was recorded in the case of SBS i.e. 33.69 per
cent followed by IB i.e. 31.52 per cent. In absolute terms SBI recorded

135
the highest total deposit among all the 27 PSBs in all the years under
study i.e. from 1996 to 2007.
Concentration Indices
In order to judge the overall performance of all the PSBs, it
becomes imperative to know the relative efficiency of each bank. For
this purpose Herfindhal’s index of concentration has been computed.
The results of the study are as under:
1. Performance in Sharing Total Income
Table 4.17 shows that SBI made maximum contribution i.e.
70.97 per cent followed by BOI i.e. 5.66 per cent. However, the trend
differed in the other years fo other banks excluding SBI which
maintained its position throughout the period under study. In the
year 2002, again maximum contribution to the overall index was
made by SBI i.e. 74.15 per cent followed by BOB i.e. 4.27 per cent. The
overall index of total income had also witnessed ups and downs over
the years. It has moved from 0.1.0874 in 1996 to 0.11094 in 2007. Thus
from the above analysis of concentration indices, it becomes clear that
among the 27 public sector banks, SBI and CB had the maximum
relative share; and SBS and SBIn had the minimum relative share in
2007. Another main observation is that there was no sudden change
in the performance of sharing total income by all the PSBs. Over the
period under study i.e. from 1996 to 2007, the share of SBI, PNB, OBC
and UntBI in the total concentration index has gone up, whereas it
has come down in the case of BOB, BOI, CBI and IB.
136
2. Performance in Sharing Net Profit
Table 4.18 presents the concentration indices of relative
performance of Public Sector Banks with regard to sharing of NP
during the period under study. During 1996, maximum contribution
to the overall index was made by the leader (SBI) i.e. 49.09 per cent
followed by CB i.e. 24.79 per cent. However, the trend was not exactly
the same in the other years. In the year 2002, maximum contribution
to the overall index was made by SBI i.e. 80.28 per cent. The overall
index of NP had also witnessed ups and downs over the years. It has
moved from 0.10785 in 1996 to 0.11711 in 2007. Thus from the above
analysis of concentration indices, it becomes clear that among the 27
public sector banks, SBI and CB and the maximum relative share; and
DB and IB had the minimum relative share in 2007. Another main
observation is the general tendency towards almost similar degree of
efficiency over the years as shown by the banks. Over the period
under study i.e. from 1996 to 2007, the share of SBI, COB, BOI, DB
and UntBI in the total Concentration Index has gone up, whereas it
has come down in the case of BOB, CB and PNB.

137
3. Performance in Sharing Deposits
Table 4.19 presents the concentration indices of relative
performance of Public Sector Banks with regard to sharing of
deposits during the period under study. During 1996, maximum
contribution to the overall index was made by SBI i.e. 61.87 per cent
followed by BOI i.e. 7.61 per cent. However, the trend was not exactly
the same in the other years. In the year 2002, maximum contribution
to the overall index was again made by SBI to the extent of 64.91 per
cent and this time No.2 was BOB with 5.48 per cent share. The overall
index of total deposits had also witnessed ups and downs over the
year. It has moved from 0.09248 in 1996 to 0.10669 in 2007. Thus from
the above analysis of concentration indices, it becomes clear that
among the 27 public sector banks, SBI and PNB had the maximum
relative share; whereas SBIn and SBS had the minimum relative share
in 2007. The share of SBI has shown an improvement from 61.87 per
cent in 1996 to 73.11 per cent in 2007. Over the period under study i.e.
from 1996 to 2007, the share of SBI, CB and UBI in the total
Concentration Index has gone up, whereas it has come down in the
case of BOB, BOI, IOB and PNB.
4. Performance in Sharing Total Advances
Table 4.20 presents the concentration indices of relative
performance of Public Sector Banks with regard to sharing of total

138
advances during the period under study. During 1996, maximum
contribution to the overall index was made by SBI with 75.96 per cent
followed by BOI with just 5.88 per cent. Regarding advances, the
trend was almost the same in the other years also. SBI remained the
king and for the distant second position BOI and BOB etc. played. In
all the years, maximum contribution to the overall index was made
by SBI. The overall index of total advances had also witnessed ups
and downs over the years. It has moved from 0.12628 in 1996 to
0.09604 in 2007. Thus from the above analysis of concentration
indices, it becomes clear that among the 27 public sector banks, SBI
and BOI had the maximum relative share and SBIn and SBS had the
minimum relative share in 2007. Another main observation is that
even the share of SBI has shown declining trend. Over the period
under study i.e. from 1996 to 2007, the share of SBI, BOB, BOI, CB,
CBI, PSB and PNB in the total Concentration Index has gone up,
whereas it has come down in the case of IB and UCB.
5. Performance in Sharing Total Burden
Table 4.21 presents the concentration indices of relative
performance of public sector banks with regard to sharing of total
burden during the period under study. During 1996, maximum
contribution to the overall index was made by SBI with 73.76 per cent
followed by CB with just 4.40 per cent. Regarding burden, the trend
was almost the same in the other years also. SBI remained at the top.
139
In 2002, maximum contribution was by SBI and then stood PNB. In
all the years, maximum contribution to the overall index was made
by SBI. The overall index of total burden had also witnessed ups and
downs over the years. It has moved from 0.10913 in 1996 to 0.12837 in
2007. Thus from the above analysis of concentration indices, it
becomes clear that among the 27 public sector banks, SBI had the
maximum relative share; In 2007, SBIn and SBH had the minimum
relative share. Over the period under study i.e. from 1996 to 2007, the
share of BOB, CBI, IOB, PNB, SB and UntBI in the total concentration
index has gone up, whereas it has come down in the case of BOI, IB,
OBC, DB, CB and COB.
6. Performance in Sharing Total Spread
Table 4.22 presents the concentration indices of relative
performance of public sector banks with regard to sharing of total
spread during the period under study. During 1996, maximum
contribution to the overall index was made by SBI with 72.46 per cent
followed by CB with just 5.70 per cent. Regarding spread, the trend
was almost the same in the other years also. SBI remained the king. In
2002, share of SBI was 76.57 per cent, showing some improvement
and for the second position was occupied by PNB with 3.94 per cent
share. In all the years, maximum contribution to the overall index
was made by SBI. The overall index of total spread had also
witnessed changes over the years. It has moved from 0.10717 in 1996
to 0.11043 in 2007. Thus from the above analysis of concentration

140
indices, it becomes clear that among the 27 public sector banks, SBI
and PNB had the maximum relative share; and SBIn and SBS had the
minimum relative share in 2007. Another main observation is that
even the share of SBI has shown ups and downs. Over the period
under study i.e. from 1996 to 2007, the share of SBI, BOB, PNB, UntBI
and BOI in the total concentration index has gone up, whereas it has
come down in the case of CB, CBI, IB and SB.
7. Performance in Sharing Total Expenditure
Table 4.23 presents the concentration indices of relative
performance of public sector banks with regard to sharing of total
expenditure during the period under study. During 1996, maximum
contribution to the overall index was made by SBI with 71.16 per cent
followed by BOI with just 5.72 per cent. Regarding expenditure also,
the trend was almost the same in the other years also. The total
expenditure of SBI remained the highest in all the years under study,
so maximum contribution to the overall index was made by SBI. The
overall index of total expenditure had also witnessed ups and downs
over the years. It has moved from 0.10918 in 1996 to 0.11130 in 2007.
Thus from the above analysis of concentration indices, it becomes
clear that among the 27 public sector banks, SBI and BOI had the
maximum relative share; and SBIn and SBM had the minimum
relative share in 2007. Another main observation is that the share of
SBI has shown an upwards trend which is not desirable. Over the

141
period under study i.e. from 1996 to 2007, the share of SBI, CB, PNB
and UntBI in the total concentration index has gone up, whereas it
has come down in the case of BOB, BOI, IB and CBI.
8. Performance in Sharing Spread per Employee
Table 24 presents the concentration indices of relative
performance of public sector banks with regard to sharing of spread
per employee during the period under study. During 1996, maximum
contribution to the overall index was made by OBC i.e. 8.66 per cent
followed by CB i.e. 6.32 per cent. However, the trend was not exactly
the same in the other years. In the year 2002, maximum contribution
to the overall index was made by COB with 9.96 per cent share
followed by OBC with 9.57 per cent share. The overall index of
spread per employee had also witnessed ups and downs over the
years. It has moved from 0.03827 in 1996 to 0.03994 in 2007. It is also
clear from the table that among the 27 public sector banks, UntBI and
OBC had the maximum relative share; and UCB and IB had the
minimum relative share in 2007. Another main observation is the
general tendency towards almost similar degree of efficiency over the
years. Over the period under study i.e. from 1996 to 2007, the share of
SBI, BOB, BOI, OBC and UntBI in the total concentration index has
gone up, whereas it has come down in the case of AB, CB, CBI, PSB
and PNB.
142
9. Performance in Sharing Net Profit Per Employee
Table 4.25 presents the concentration indices of relative
performance of public sector banks with regard to sharing of NP per
employee during the period under study. During 1996, maximum
contribution to the overall index was made by OBC i.e. 35.64 per cent
followed by CB i.e. 15.17 per cent. However, the trend was not exactly
the same in the other years. In the year 2002, maximum contribution
to the overall index was made by COB with 23.51 per cent share, and
after it was OBC with 23.27 per cent share. The overall index of NP
per employee had also witnessed ups and downs over the years. It
has moved from 0.06394 in 1996 to 0.04994 in 2007. Thus from the
above analysis of concentration indices, it becomes clear that among
the 27 public sector banks, COB and OBC had the maximum relative
share; and DB and IB had the minimum relative share in 2007.
Another main observation is that it has shown a declining trend, it
was 35.64 per cent in 1996 and in 2007 it was just 18.90 per cent, it
shows the real impact of liberlisation on PSBs. Over the period under
study i.e. from 1996 to 2007, the share of SBI, COB, AB, BOI and PSB
in the total concentration index has gone up, whereas it has come
down in the case of AIIB, CB, OBC and PNB.
10. Performance in Sharing Total Expenditure per Employee
Table 4.26 presents the concentration indices of relative
performance of public sector banks with regard to sharing of total

143
expenditure per employee during the period under study. During
1996, maximum contribution to the overall index was made by IB i.e.
8.09 per cent followed by BOB i.e. 7.84 per cent. However, the trend
was not exactly the same in the other years. In the year 2002,
maximum contribution to the overall index was made by OBC with
6.31 per cent share. The overall index of total expenditure per
employee had also witnessed changes over the years. It has moved
from 0.03852 in 1996 to 0.03922 in 2007. Thus from the above analysis
of concentration indices, it becomes clear that among the 27 public
sector banks, OBC and UntBI had the maximum relative share;
whereas UCB and SBBJ had the minimum relative share in 2007.
Another main observation is the marginal increase in the sharing of
expenditure during the period under study. Over the period under
study i.e. from 1996 to 2007, the share of AB, COBDB, OBC and UntBI
in the total concentration index has gone up, whereas it has come
down in the case of BOB, BOI, IB, CB, AIIB and SBI.
11. Performance in Sharing Total Income per Employee
Table 4.27 presents the concentration indices of relative
performance of public sector banks with regard to sharing of total
income per employee during the period under study. During 1996,
maximum contribution to the overall index was made by IB with 8.09
per cent followed by BOB 7.82 per cent share. However, the trend
was not exactly the same in the other years. In the year 2002,

144
maximum contribution to the overall index was made by COB with
7.65 per cent share. The overall index of total income per employee
had also witnessed ups and downs over the years. It has moved from
0.03851 in 1996 to 0.03921 in 2007. Thus from the above analysis of
concentration indices, it becomes clear that among the 27 public
sector banks, OBC and UntBI had the maximum relative share; and
UCB and SBM had the maximum relative share in 2007. Another
main observation is the general tendency towards almost similar
degree of efficiency over the years. Over the period under study i.e.
from 1996 to 2007, the share of SBH, AB, COB, DB, OBC and UntBI in
the total concentration index has gone up, whereas it has come down
in the case of BOB, BOI, IB, AIIB and SBI.
12. Performance in Sharing Advances per Employee
Table 4.28 presents the concentration indices of relative
performance of public sector banks with regard to sharing of
advances per employee during the period under study. During 1996,
maximum contribution to the overall index was made by IB i.e. 9.35
per cent followed by BOI with 8.70 per cent share. However, the
trend was not exactly the same in the other years. In the year 2002,
maximum contribution to the overall index was made by BOB with
7.72 per cent share. The overall index of advances per employee had
also witnessed ups and downs over the years. It has moved from
0.03944 in 1996 to 0.04049 in 2007. Thus from the above analysis of

145
concentration indices, it becomes clear that among the 27 public
sector banks, UntBI and COB had the maximum relative share; and
UCB and SBBJ had the minimum relative share in 2007. No major
change was noticed over the years. Over the period under study i.e.
from 1996 to 2007, the share of SB, COB, OBC and UntBI in the total
concentration index has gone up, whereas it has come down in the
case of BOB, IB, IOB, AIIB and SBI.
13. Performance in Sharing Deposit per Employee
Table 4.29 presents the concentration indices of relative
performance of public sector banks with regard to sharing of deposit
per employee during the period under study. During 1996, maximum
contribution to the overall index was made by BOB i.e. 7.07 per cent
followed by BOI i.e. 7.02 per cent. However, the trend was not exactly
the same in the other years. In the year 2002, maximum contribution
to the overall index was made by OBC i.e. 7.54 per cent. The overall
index of deposits per employee had also witnessed ups and downs
over the years. It has moved from 0.03852 in 1996 to 0.03863 in 2007.
From the above analysis of concentration indices, it is clear that
among the 27 public sector banks, OBC and COB had the maximum
relative share; On the other hand, SBM and SBBJ had the minimum
relative share in 2002. Another main observation is the general
tendency towards almost similar degree of efficiency over the years.
Over the period under study i.e. from 1996 to 2007, the share of SBI,
COB, OBC, AB and SBM in the total Concentration Index has gone
146
up, whereas it has come down in the case of SBBJ, BOI, BOB, SBP,
AIIB and PNB.
14. Performance in Sharing Burden per Branch
Table 4.30 presents the concentration indices of relative
performance of public sector banks with regard to sharing of burden
per branch during the period under study. During 1996, maximum
contribution to the overall index was made by CB i.e. 8.22 per cent
followed by SBI i.e. 7.67 per cent. But the trend was not exactly the
same in the other years. In the year 2002, maximum contribution to
the overall index was made by SBI to the extent of 8.31 per cent. The
overall index of burden per branch had also witnessed ups and
downs over the years. It has moved from 0.03921 in 1996 to 0.05316 in
2007. Thus from the above analysis of concentration indices, it
becomes evident that among the 27 public sector banks, SB and UntBI
had the maximum relative share; and COB and SBH had the
minimum relative share in 2007. Main observation is the similar
degree of efficiency was not shown this time. In 1997, maximum
percentage was 8.22 which became 17.15 in the last year under study
over the period under study i.e. from 1996 to 2007, the share of SBI,
CBI, AIIB, IOB, SB and UntBI in the total concentration index has
gone up, whereas it has come down in the case of SBM, SBS, CB, COB
and IB.

147
15. Performance in Sharing Spread per branch
Table 4.31 presents the concentration indices of relative
performance of public sector banks with regard to sharing of spread
per branch during the period under study. During 1996, maximum
contribution to the overall index was made by CB i.e. 10.26 per cent
followed by SBI i.e. 7.26 per cent However, the trend was not
repeated in the other years. In the year 2002, maximum contribution
to the overall index was made by COB with a share of 9.58 per cent.
The overall index of spread per branch had also witnessed ups and
downs over the years. It has moved from 0.03950 in 1996 to 0.04074 in
2007. Thus from the above analysis of concentration indices, it
becomes clear that among the 27 public sector banks, UntBI and OBC
had the maximum relative share; and UCB and UBI had the
minimum relative share in 2007. Another main observation is that
almost every time there was a change in the total percentage and the
top slot also shown a change. Over the period under study i.e. from
1996 to 2007, the share of SBI, COB, SBP, BOI and UntBI in the total
concentration index has gone up, whereas it has come down in the
case of AB, CB, PSB, UCB and PNB.
16. Performance in Sharing Net Profit Per Branch
Table 4.32 presents the concentration indices of relative
performance of public sector banks with regard to sharing of NP per
branch during the period under study. During 1996, maximum
148
contribution to the overall index was made by OBC i.e. 32.73 per cent
followed by CB i.e. 23.41 per cent. However, the trend was not exactly
the same in the other years. In the year 2002, maximum contribution
to the overall index was made by COB i.e. 22.24 per cent. The overall
index of NP per branch had also witnessed changes over the years. It
has moved from 0.06786 in 1996 to 0.05087 in 2007. Thus from the
above analysis of concentration indices, it is clear that among the 27
public sector banks, COB and OBC had the maximum relative share;
and DB and IB had the minimum relative share in 2007.
Concentration index has shown a major decline from 32.73 per cent in
1996 to 18.53 per cent in 2007. Over the period under study i.e. from
1996 to 2007, the share of SBI, COB, SBM, SBIn and BOI in the total
concentration index has gone up, whereas it has come down in the
case of SBP, AIIB,CB, OBC and PNB.
17. Performance in Sharing Total Expenditure per Branch
Table 4.33 presents the concentration indices of relative
performance of public sector banks with regard to sharing of total
expenditure per branch during the period under study. During 1996,
maximum contribution to the overall index was made by BOI with
8.85 per cent share followed by SBI i.e. 8.23 per cent. However, the
trend was not exactly the same in the other years. In the year 2002,
maximum contribution to the overall index was made by SBI i.e. 7.54
per cent followed by CB with a 5.97 per cent share. The overall index
of total expenditure per branch had also witnessed ups and downs
149
over the years. It has moved from 0.03979 in 1996 to 0.03967 in 2007.
Thus from the above analysis of concentration indices, it becomes
clear that among the 27 public sector banks, OBC had the maximum
relative share i.e. 9.56 per cent; and AIIB and UCB had the minimum
relative share in 2007. Another main observation is the general
tendency towards almost similar degree of efficiency over the years
as shown by almost all the banks. Over the period under study i.e.
from 1996 to 2007, the share of SBI, SBP, AB, OBC and PSB in the total
concentration index has gone up, whereas it has come down in the
case of BOB, BOI, IB, BOM and AIIB.
18. Performance in Sharing Total Income per Branch
Table 4.34 presents the concentration indices of relative
performance of public sector banks with regard to sharing of total
income per branch during the period under study. During 1996,
maximum contribution to the overall index was made by BOI i.e. 8.67
per cent followed by SBI i.e. 8.13 per cent. However, the trend was
not exactly the same in the other years. In the year 2002, maximum
contribution to the overall index was made by SBI and that was 8.36
per cent whereas second position was achieved by COB with 7.33 per
cent. The overall index of total income per branch had also witnessed
ups and downs over the years. It has moved from 0.03979 in 1996 to
0.03992 in 2007. Thus from the above analysis of concentration
indices, it becomes clear that among the 27 public sector banks, SBI
and OBC and had the maximum relative share; and AIIB and UCB

150
had the minimum relative share in 2002. Another main observation is
the general tendency towards almost similar degree of efficiency over
the years. Over the period under study i.e. from 1996 to 2007, the
share of SBI, COB, SBP, OBC and PNB in the total Concentration
Index has gone up, whereas it has come down in the case of BOB,
BOI, AIIB and CBI.
19. Performance in Sharing Advances per Branch
Table 4.35 presents the concentration indices of relative
performance of public sector banks with regard to sharing of
advances per branch during the period under study. During 1996,
maximum contribution to the overall index was made by BOI i.e.
11.07 per cent followed by SBI with 10.69 per cent. However, the
trend was not exactly the same in the other years. In the year 2002,
maximum contribution to the overall index was made by BOI to the
tune of 8.93 per cent followed by SBI with 7.98 per cent share. The
overall index of advances per branch had also witnessed ups and
downs over the years. It has moved from 0.04129 in 1996 to 0.04127 in
2007. Thus from the above analysis of concentration indices, it
becomes clear that among the 27 public sector banks, COB and UntBI
had the maximum relative share; and UCB and AIIB had the
minimum relative share in 2007. Another main observation is the
general tendency towards almost similar degree of efficiency over the
years. Over the period under study i.e. from 1996 to 2007, the share of

151
SBP, AB, CB, OBC and UntBI in the total concentration index has
gone up, whereas it has come down in the case of BOB, BOI, SBI,
AIIB, PSB and PNB.
Ratio Analysis
It is the most widely used technique of financial analysis of
commercial banks. It establishes the relationship between two
accounting figures, enabling the banks to identify the causes of the
changes in their profits over a period of time and then, deciding the
future course of action, in the light of the given results. In order to
evaluate the profitability performance of public sector banks, the
following ratios have been used:
• Interest Income to Working Funds Ratio
• Interest Expended to Working Funds Ratio
• Spread to Working Funds Ratio
• Non-Interest Income to Working Funds Ratio
• Non-Interest Expenditure to Working Funds Ratio
• Burden to Working Funds Ratio
• Net Profit to Working Funds Ratio
• Interest Income to Total Income Ratio
• Interest Expended to total Expenditure Ratio
• Staff Expenditure to Operating Expenditure Ratio

152
Interest Income to Working Funds Ratio
It is the main ratio showing the profitability of a commercial
bank. Interest income is the primary source of income of a
commercial bank. This ratio is an indicator of the rate at which a
commercial bank earns income by lending the funds to the public.
The ratio of interest income as a percentage of working funds for all
the 27 PSBs for the time period under study i.e. 1996 to 2007 has been
shown in Table 4.36. In the year 1996, this ratio was the highest in SB
i.e. 9.27 per cent followed by SBM i.e. 8.84 per cent. In 1996 this ratio
was the lowest in the case of SBP i.e. 5.85 per cent followed by SBI i.e.
6.48 per cent. In 2007, this ratio was highest in the case of AB i.e. 9.69
per cent followed by VB i.e. 9.53 per cent. In 2007, this ratio was the
lowest in the case of IB i.e. 7.58 per cent followed by BOI i.e. 8.03 per
cent. As far as bank wise statistical analysis is concerned, the
maximum average ratio is in the case of SBT i.e. 9.93 per cent
followed by SBM i.e. 9.91 per cent, while the ratio was minimum for
PSB i.e. 8.20 per cent followed by UCB i.e. 8.21 per cent. Therefore the
ratio had changed from 8.20 per cent to 9.93 per cent over 12 years
period i.e. from 1996 to 2007. The ratio in terms of dispersion was
more variable in the case of PSB i.e. 31.89 per cent followed by SBP i.e.
14.10 per cent whereas the ratio in terms of dispersion was more
consistent in the case of AB i.e. 5.21 per cent followed by DB i.e. 5.88
per cent. Yearwise the average ratio which was 7.89 per cent in 1996
became 8.06 per cent in 2007. But it must be noted that this increase in

153
the ratio had not been consistent for some years it had declined also.
The ratio in terms of dispersion has moved from 9.60 per cent in 1996
to 5.44 per cent in 2007.
Interest Expended to Working Funds Ratio
The interest paid on deposits and on borrowings constitutes the
major components of the bank. Interest Expanded to Working Funds
Ratio shows the rate at which a commercial bank incurs expenditure
by borrowing funds. Table 4.37 shows that in the year 1996 this ratio
was the highest in BOB i.e. 7.04 per cent followed by IOB i.e. 6.77 per
cent. In 1996 this ratio was the lowest in the case of SBP i.e. 4.59 per
cent followed by SBIn i.e. 4.77 per cent. In 2007 this ratio was the
highest in the case of AB i.e. 6.94 per cent followed by PSB i.e. 6.90 per
cent. In 2007 this ratio was the lowest in the case of SBP i.e. 4.88 per
cent followed by BOI i.e. 5.39 per cent. As far as bank-wise statistical
analysis is concerned, the maximum average ratio is in the case of IB
i.e. 7.24 per cent followed by SBT i.e. 7.22 per cent, while the ratio was
minimum for SBP i.e. 5.62 per cent followed by SBI i.e. 5.84 per cent.
Therefore, the ratio had changed from 5.62 per cent to 7.24 per cent
over 12 years period i.e. 1996 to 2007. The ratio in terms of dispersion
was more variable in the case of PSB i.e. 31.98 per cent followed by
VB i.e. 15.44 per cent whereas the ratio in terms of dispersion was
more consistent in the case of AB i.e. 5.84 per cent followed by SBM
i.e. 6.08 per cent. Yearwise the average ratio which was 5.93 per cent
in 1996 became 6.06 per cent in 2007. But it must be noted that this
154
increase in the ratio had not been consistent for some years it had
declined also. The ratio in terms of dispersion has moved from 10.81
per cent in 1996 to 7.71 per cent in 2007.
Spread to Working Funds Ratio
Another main ratio to study the profitability of commercial
banks is spread to Working Funds Ratio. The ratio of spread as a
percentage of working funds for all the 27 PSBs for the time period
under study i.e. from 1996 to 2007 has been shown in Table 4.38 in the
year 1996 this ratio was the highest in SBM i.e. 2.83 followed by SB i.e.
2.72 per cent. In 1996 this ratio was the lowest in the case of BOB i.e.
1.07 per cent followed by UCB i.e. 1.17 per cent. In 2007 this ratio was
the highest in the case of SBP i.e. 3.78 per cent followed by SB i.e. 3.48
per cent. In 2007 this ratio was the lowest in the case of IB i.e. 1.75 per
cent followed by PSB i.e. 2.30 per cent. As far as bank wise statistical
analysis is concerned, the maximum average ratio is in the case of
SBP i.e. 3.67 per cent followed by SBIn i.e. 3.49 per cent, while the
ratio was minimum for IB i.e. 1.39 per cent followed by UCB i.e. 1.87
per cent. Therefore, the ratio had changed from 1.39 per cent to 3.67
per cent over 12 years period i.e. from 1996 to 2007. The ratio in terms
of dispersion was more variable in the case of UntBI i.e. 46.72 per cent
followed by PSB i.e. 41.78 per cent where as the ratio in terms of
dispersion was more consistent in the case of SBM i.e. 12.78 per cent
followed by VB i.e. 14.28 per cent. Yearwise the average ratio which
was 1.97 per cent in 1996 became 2.80 per cent in 2007. But it must be

155
noted that this increase in the ratio had not been consistent for some
years it had declined also. The ratio in terms of dispersion has moved
from 25.90 per cent in 1996 to 14.07 per cent in 2007.
Non-Interest Income to Working Funds Ratio
The ratio of Non-Interest income as a percentage of working
funds for all the 27 PSBs for the time period under study i.e. 1996 to
2007 has been shown in Table 4.39. In the year 1996 this ratio was the
highest in SBP i.e. 1.80 per cent followed by SBBJ i.e. 1.14 per cent. In
1996 this ratio was the lowest in the case of PNB i.e. 0.48 per cent
followed by OBC i.e. 0.47 per cent. In 2007 this ratio was the highest
in the case of SBIn i.e. 2.73 per cent followed by SBM i.e. 2.25 per cent.
In 2007 this ratio was the lowest in the case of SB i.e. 0.86 per cent
followed by UntBI i.e. 1.12 per cent. As far as bank wise statistical
analysis is concerned, the maximum average ratio is in the case of
SBBJ i.e. 1.67 per cent followed by SBM i.e. 1.65 per cent, while the
ratio was minimum for UntBI i.e. 0.78 per cent followed by OBC i.e.
0.92 per cent. Therefore the ratio had changed from 0.78 per cent to
1.67 per cent over 12 years period i.e. from 1996 to 2007. The ratio in
terms of dispersion was more variable in the case of PSB i.e. 39.99 per
cent followed by PNB i.e. 33.47 per cent whereas the ratio in terms of
dispersion was more consistent in the case of SBBJ i.e. 12.37 per cent
followed by SBH i.e. 13.49 per cent. Yearwise average ratio which was
0.80 per cent in 1996 became 1.59 per cent in 2007. But it must be
noted that this increase in the ratio had not been consistent for some

156
years it had declined also. The ratio in terms of dispersion has moved
from 25.35 per cent in 1996 to 23.86 per cent in 2007.
Non-Interest Expenditure to Working Funds Ratio
The ratio of Non-Interest expenditure as a percentage of
working funds for all the 27 PSBs for the time period under study i.e.
from 1996 to 3007 has been shown in Table 4.40. In the year 1996 this
ratio was the highest in SBM i.e. 3.65 per cent followed by SBBJ i.e.
3.25 per cent. In 1996 this ratio was the lowest in the case of BOI i.e.
1.70 per cent followed by ALLB i.e. 1,992 per cent. In 2007 this ratio
was the highest in the case of UCB i.e. 3.33 per cent followed by SB i.e.
3.23 per cent. In 2007 this ratio was the lowest in the case of COB i.e.
1.62 per cent followed by OBC i.e. 1.63 per cent. As far as bank-wise
statistical analysis is concerned, the maximum average ratio is in the
case of SB i.e. 3.45 per cent followed by SBM i.e. 3.42 per cent, while
the ratio was minimum for COB i.e. 2.161 per cent followed by OBC
i.e. 2.164 per cent. Therefore, the ratio had changed from 2.161 per
cent to 3.45 per cent over 12 years period i.e. from 1996 to 2007. The
ratio in terms of dispersion was more variable in the case of PSB i.e.
32.21 per cent followed by COB i.e. 19.29 per cent where as the ratio
in terms of dispersion was more consistent in the case of SBM i.e. 6.12
per cent followed by SB i.e. 6.50 per cent. Yearwise the average ratio
which was 2.59 per cent in 1996 became 2.40 per cent in 2007. But it
must be noted that this increase in the ratio had not been consistent

157
for some years it had declined also. The ratio in terms of dispersion
has moved from 18.88 per cent in 1996 to 17.68 per cent in 2007.
Burden to Working Funds Ratio
The ratio of burden as a percentage of working funds for all the
27 PSBs for the time period under study i.e. from 1996 to 2007 has
been shown in Table 4.41. In the year 1996 this ratio was the highest
in SBM i.e. 2.69 per cent followed by SB i.e. 2.66 per cent. In 1996 this
ratio was the lowest in the case of BOB i.e. 0.88 per cent followed by
SBP i.e. 0.85 per cent. In 2007 this ratio was the highest in the case SB
i.e. 2.36 per cent followed by UCB i.e. 1.60 per cent. In 2007 this ratio
was the lowest in the case of SBIn i.e. 0 per cent followed by COB i.e.
0.01 per cent. As far as bankwise statistical analysis is concerned, the
maximum average ratio is in the case of SB i.e. 2.46 per cent followed
by BOM i.e. 2.13 per cent, while the ratio was minimum for COB i.e.
0.75 per cent followed by BOB i.e. 1.05 per cent. Therefore, the ratio
had changed from 0.75 per cent to 2.46 per cent over 12 years period
i.e. 1996 to 2007. The ratio in terms of dispersion was more variable in
the case of COB i.e. 79.18 per cent followed by SBIn i.e. 42.16 per cent
whereas the ratio in terms of dispersion was more consistent in the
case of CBI i.e. 9.28 per cent followed by SB i.e. 9.99 per cent. Year
wise the average ratio which was 1.79 per cent in 1996 became 0.83
per cent in 2007. But it must be note that this increase in the ratio had
not been consistent for some years it had increased also. The ratio in
158
terms of dispersion has moved from 28.37 per cent in 1996 to 63.78
per cent in 2007.
Net Profit To working Funds Ratio
This ratio indicates efficiency with which a bank deploys its total
working funds in order to increase its profitability. In other words, net
profit to working funds ratio shows an index to the degree of asset
utilization by the bank. The ratio of Net Profit as a percentage of working
funds for all the 27 PSBs for the time period under study i.e. from 1996 to
2007 has been shown in Table 4.42. In the year 1996 this ratio was the
highest in OBC i.e. 0.66 per cent followed by CB i.e. 0.43 per cent. In 1996
this ratio was the lowest in the case of UCB i.e. 0 per cent followed by VB
i.e. 0.06 per cent. In 2007 this ratio was the highest in the case of SBP i.e.
1.34 per cent followed by COB i.e. 1.30 per cent. In 2007 this ratio was the
lowest in the case of IB i.e. 0.11 per cent followed by CBI i.e. 0.31 per cent.
As far as bankwise statistical analysis is concerned, the maximum average
ratio is in the case of OBC i.e. 1.03 per cent followed by COB i.e. 0.99 per
cent, while the ratio was minimum for IB and UCB i.e. 0.064 per cent
followed by UntBI i.e. 0.13 per cent. Therefore, the ratio had changed from
0.064 per cent to 1.03 per cent over 12 years period i.e. from 1996 to 2007.
The ratio in terms of dispersion was more variable in the case of UCB i.e.
238.60 per cent followed by UntBI i.e. 158.60 per cent whereas the ratio in
terms of dispersion was more consistent in the case of OBC i.e. 40.11 per
cent followed by SBH i.e. 41.94 per cent. Yearwise the average ratio which
was 0.18 per cent in 1996 became 0.73 per cent in 2007. But it must be noted
that this increase in the ratio had not been consistent for some years it had

159
declined also. The ratio in terms of dispersion has moved from 77.42 per
cent in 1996 to 46.32 per cent in 2007.
Interest Income to Total Income Ratio
The ratio of Interest income as a percentage of total income for
all the 27 PSBs for the time period under study i.e. from 1996 to 2007
has been shown in Table 4.43. In the year 1996 this ratio was the
highest in OBC i.e. 94.40 per cent followed by PNB i.e. 93.74 per cent.
In 1996 this ratio was the lowest in the case of SBP i.e. 83.22 per cent
followed by SBM i.e. 87.74 per cent. In 2007 this ratio was the highest
in the case of SB i.e. 91.26 per cent followed by VB i.e. 89.07 per cent.
In 2007 this ratio was the lowest in the case of SBIn i.e. 76.36 per cent
followed by SBM i.e. 80.63 per cent. As far as bankwise statistical
analysis is concerned, the maximum average ratio is in the case of
OBC i.e. 91.50 per cent followed by UntBI i.e. 91.49 per cent, while the
ratio was minimum for SBIn i.e. 84.83 per cent followed by SBBJ i.e.
84.91 per cent. Therefore, the ratio had changed from 84.83% to
91.50% over 12 years period i.e. from 1996 to 2007. The ratio in terms
of dispersion was more variable in the case of SBIn i.e. 4.41 per cent
followed by IOB i.e. 4.08 per cent whereas the ratio in terms of
dispersion was more consistent in the case of CBI i.e. 1.16 per cent
followed by SB i.e. 1.39 per cent. Yearwise the average ratio which
was 90.69 per cent in 1996 became 84.84 per cent in 2007. But it must
be noted that this increase in the ratio had not been consistent for

160
some years it had risen also. The ratio in terms of dispersion has
moved from 2..82 per cent in 1996 to 3.72 per cent in 2007.
Interest Expended to Total Expenditure Ratio
The ratio of interest expanded as a percentage of total
expenditure for all the 27 PSBs for the time period under study i.e.
from 1996 to 2007 has been shown in Table 4.44. In the year 1996 this
ratio was the highest in BOI i.e. 79.30 per cent followed by BOB i.e.
77.99 per cent. In 1996 this ratio was the lowest in the case of SBIn i.e.
62.19 per cent followed by SBM i.e. 62.17 per cent. In 2007 this ratio
was the highest in the case of COB i.e. 77.46 per cent followed by AB
i.e. 76.21 per cent. In 2007 this ratio was the lowest in the case of SB
i.e. 63.32 per cent followed by UCB i.e. 65.39 per cent. As far as bank-
wise statistical analysis is concerned, the maximum average ratio is in
the case of SBT i.e. 74.01 per cent followed by IB i.e. 73.97 per cent,
while the ratio was minimum for SB i.e. 63.88 per cent followed by
SBM i.e. 65.31 per cent.Therefore, the ratio had changed from 63.88
per cent to 74.01 per cent over 12 years period i.e. from 1996 to 2007.
The ratio in terms of dispersion was more variable in the case of COB
i.e. 6.17 per cent followed by AB i.e. 5.78 per cent whereas the ratio in
terms of dispersion was more consistent in the case of PSB i.e. 1.74
per cent followed by SBBJ i.e. 2.61 per cent. Yearwise the average
ratio which was 69.71 per cent in 1996 became 71.28 per cent in 2007.
But it must be noted that this increase in the ratio had not been
consistent for some years it had declined also. The ratio in terms of
161
dispersion has moved from 6.35 per cent in 1996 to 4.76 per cent in
2007.
Staff Expenditure to Operating Expenditure Ratio
The ratio of staff expenditure as a percentage of operating
expenditure for all the 27 PSBs for the time period under study i.e.
from 1996 to 2007 has been shown in Table 4.45.In the year 1996 this
ratio was the highest in DB i.e. 76.40 per cent followed by UCB i.e.
73.52 per cent. In 1996 this ratio was the lowest in the case of OBC i.e.
61.04 per cent followed by VB i.e. 61.66 per cent. In 2002 this ratio was
the highest in the case of UCB i.e. 86 per cent followed by UBI i.e. 82
per cent. In 2007 this ratio was lowest in the case of OBC i.e. 54.54 per
cent followed by COB i.e. 55.67 per cent. As far as bankwise statistical
analysis is concerned, the maximum average ratio is in the case of
UCB i.e. 79.85 per cent followed by UntBI i.e. 78.11per cent, while the
ratio was minimum for OBC i.e. 58.56 per cent followed by COB i.e.
61.69 per cent. Therefore, the ratio had changed from 58.56 per cent to
79.85 per cent over 12 years period i.e. 1996 to 2007. The ratio in terms
of dispersion was more variable in the case of IB i.e. 12.08 per cent
followed by UBI i.e. 8.51 per cent whereas the ratio in terms of
dispersion was more consistent in the case of SBBJ i.e. 2.68 per cent
followed by SBIn i.e. 2.75 per cent. Yearwise the average ratio which
was 68.76 per cent in 1996 became 71.45 per cent in 2007. But it must
be noted that this increase in the ratio had not been consistent for

162
some years it had declined also. The ratio in terms of dispersion has
moved from 6.05 per cent in 1996 to 71.42 per cent in 2007.
Overall Profitability Performance
In order to judge the overall profitability performance of
various nationalized banks, following seven indices have been
applied:
1. Index of Interest Earned to working funds
2. Index of Interest paid to working funds
3. Index of Spread of working funds
4. Index of Non-Interest Expenditure to working funds
5. Index of Non-Interest Income to working funds
6. Index of Burden to working funds
7. Index of Net Profit to working funds
To compute these indices, first of all the respective ratios has
been calculated over the period 1996-2007, then these ratios have
been averaged bankwise and the respective indices be computed by
the method given below:
Average Ratio for the concerned nationalized bank Index = ----------------------------------------------------------------------- Average Ratio for aggregate of all nationalized banks Further, the study seeks to classify the banks with regard to
these selected profitability indices at four performance levels viz.,
excellent, good, fair and poor. Excellent performance level includes
the banks lying at the top 25 per cent area of the normal distribution
163
i.e. where growth index value is greater than (X+0.6745σ). Good
performance category stands for banks whose growth index score lies
between 50-75 per cent areas of the normal distribution i.e. where
growth index value is between X to (X + 0.6745σ). Fair category
includes those banks whose growth index lies between 25-50 per cent
area under normal curve i.e. where growth index value is between
(X-0.6745σ) to X. Poor category comprises the banks which shows
their growth lying at the bottom 25 per cent area of the normal
distribution i.e. where growth index value lies below (X-0.675σ). In
this way the various indices of profitability parameters have been
calculated.
Table 4.46 shows the indices of selected profitability parameters
over the period (1996-2007). The mean and standard deviating (used
or making classification of all PSBs) of each parameter has also been
shown in the table. Table 4.47 presents the profitability performance
levels of the PSBs over the period under study. It is very much clear
from the table that six banks namely SBIn, SBM, SBS, SBT, DB and
OBC achieved excellent performance with regard to index of interest
earned to working funds ratio. A point worth mentioning here which
emerged from the results is that SBI has not performed well in this
regard, it held poor performance level. Another noteworthy point is
that the majority of banks which had excellent or good performance
level with respect to the index of spread to working funds obtained
poor or fair performance levels in respect of the index of burden to
working funds and vice versa. As far as, PNB and UBI are concerned,
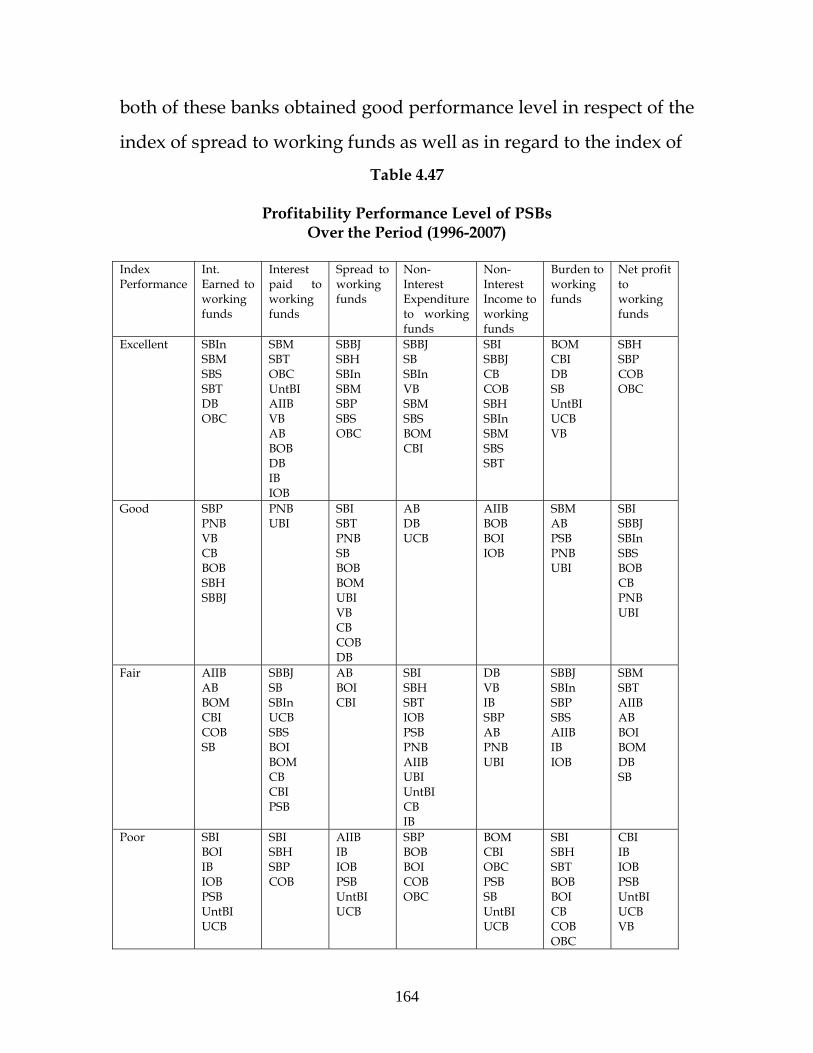
164
both of these banks obtained good performance level in respect of the
index of spread to working funds as well as in regard to the index of
Table 4.47
Profitability Performance Level of PSBs Over the Period (1996-2007)
Index Performance
Int. Earned to working funds
Interest paid to working funds
Spread to working funds
Non- Interest Expenditure to working funds
Non- Interest Income to working funds
Burden to working funds
Net profit to working funds
Excellent SBIn SBM SBS SBT DB OBC
SBM SBT OBC UntBI AIIB VB AB BOB DB IB IOB
SBBJ SBH SBIn SBM SBP SBS OBC
SBBJ SB SBIn VB SBM SBS BOM CBI
SBI SBBJ CB COB SBH SBIn SBM SBS SBT
BOM CBI DB SB UntBI UCB VB
SBH SBP COB OBC
Good SBP PNB VB CB BOB SBH SBBJ
PNB UBI
SBI SBT PNB SB BOB BOM UBI VB CB COB DB
AB DB UCB
AIIB BOB BOI IOB
SBM AB PSB PNB UBI
SBI SBBJ SBIn SBS BOB CB PNB UBI
Fair AIIB AB BOM CBI COB SB
SBBJ SB SBIn UCB SBS BOI BOM CB CBI PSB
AB BOI CBI
SBI SBH SBT IOB PSB PNB AIIB UBI UntBI CB IB
DB VB IB SBP AB PNB UBI
SBBJ SBIn SBP SBS AIIB IB IOB
SBM SBT AIIB AB BOI BOM DB SB
Poor SBI BOI IB IOB PSB UntBI UCB
SBI SBH SBP COB
AIIB IB IOB PSB UntBI UCB
SBP BOB BOI COB OBC
BOM CBI OBC PSB SB UntBI UCB
SBI SBH SBT BOB BOI CB COB OBC
CBI IB IOB PSB UntBI UCB VB
165
burden to working funds. In this context, it must be noticed that DB
and BOM achieved excellent performance level in respect of the
index of burden to working funds and both of these banks achieved
good performance level in respect of the index of spread to working
funds. As far as the index of interest paid to working funds is
concerned SBM, SBT, AIIB, AB, BOB, DB, IB, IOB, OBC, UntBI and
VB obtained the excellent performance level whereas SBI, SBH, SBP
and COB held the poor performance level. Here, it must be noticed
that DB, OBC, SBM and SBT achieved excellent performance level in
respect of the index of interest earned to working funds as well as in
respect of the index of interest paid to working funds. As far as the
index of non-interest expenditure to working funds is concerned
SBBJ, SBIn, SBM, SBS, BOM, CBI, SB and VB achieved excellent
performance level, AB, DB and UCB achieved good performance
level, SBI, SBH, SBT, AIIB, CB, IB, IOB, PSB, PNB, UBI and UntBI got
fair performance level, and SBP, BOB, BOI, COB and OBC held poor
performance level. Banks can reduce their non-interest expenditure
by adopting effective budgeting techniques and by implementing
various cost reduction programmes. In respect of the index of non-
interest income to working funds, SBI achieved the excellent
performance level along with various other banks but BOM, CBI,
OBC, PSB, SB, UntBI and UCB held poor performance level.
Regarding the index of net profits to working funds SBH, SBP, COB

166
and OBC achieved excellent performance level, SBI, SBBJ, SBIn, SBS,
BOB, CB, PNB and UBI achieved good performance level, SBT, SBM,
SB, AIIB, AB, BOI, BOM and DB got fair performance level, and CBI,
IB, PSB, UntBI, UCB, VB and IOB held poor performance level.
Conclusions
To conclude it can be said that evaluation of banks in terms of
profitability is very essential. In order to study the trend in
profitability and other variables, both EGR and Simple growth rates
have been used, the results of which have been shown in relevant
tables. One noteworthy point in this context is that share of PSBs in
total deposits and total advances have been declining. PSBs have
been struggling hard to maintain their profitability position. As far as
the results of per employee and per branch performance parameters
are concerned, it can be concluded that majority of PSBs (except SBI)
have enjoyed almost similar degree of efficiency with nominal
variations. As far as the index of interest paid to working funds is
concerned SBM, SBT, AIIB, AB, BOB, DB, IB, IOB, OBC, UntBI and
VB obtained the excellent performance level whereas SBI, SBH, SBP
and COB held the poor performance level. Here, it must be noticed
that DB, OBC, SBM and SBT achieved excellent performance level in
respect of the index of interest earned to working funds as well as in
respect of the index of interest paid to working funds. As far as the
index of non-interest expenditure to working funds is concerned
SBBJ, SBIn, SBM, SBS, BOM, CBI, SB and VB achieved excellent

167
performance level, AB, DB and UCB achieved good performance
level, SBI, SBH, SBT, AIIB, CB, IB, IOB, PSB, PNB, UBI and UntBI got
far performance level, and SBP, BOB, BOI, COB and OBC held poor
performance level. Banks can reduce their non-interest expenditure
by adopting effective budgeting techniques and by implementing
various cost reduction programmes.
References
1. Godse, V.T., Productivity in Banks – Concept and Measurements, Papers presented at bank economists met. Madras, 1984, p.298.
2. Dasgupta, Devajyoti, “Profitability of Indian Public Sector
Banks in the light of liberalization of Indian Economy – An Overview,” The Management Accountant, Sept. 2001.
3. Ramamoorthy, K.R., “Profitability and Productivity in
Indian Banking,” Chartered Financial Analyst, February 1998, p.53.
4. Thomas, Z., “Performance Effectiveness of Nationalized
Banks: A Case Study of Syndicate Bank,” Finance India, Vol. XIV, No.1, March 2000, pp. 187-192.
5. Khusro, A.M.,“Keynote Address”, BEM, 1996, pp.1-19. 6. Venkatratnam, M., Social Objectives and Profitability of
Commercial Banks, Andhra Bank, Hyderabad, 1987. 7. Bhubal, Subhash B., “Bank Profitability note worth the
candle,” Indian Banking Today and Tomorrow, Feb.1991. 8. Krishna, Dr. R.R., “Profitability Analysis: an Overview,”
Indian Banking Today and Tomorrow, Sept. 1996.


