
CHAPTER 2: OCCUPANCY AND HABITAT CHARACTERISTICS
ASSOCIATED WITH THE BLUE-HEADED QUAIL-DOVE
(STARNOENAS CYANOCEPHALA) OF CUBA
ABSTRACT. – When endangered endemic species are faced with population decline
from loss of habitat or other anthropogenic pressures, it becomes extremely important to
have current information on population status and trends for species management and
conservation. The Blue-headed Quail-dove of Cuba is one such species which remains
largely understudied at least in part due to its shy and illusive behavior resulting in a
species which has been very difficult to detect. We examined the occupancy, abundance
and habitat characteristics associated with the endangered endemic Blue-headed Quail-
dove (Starnoenas cyanocephala) at the Loma de Cunagua Wildlife Refuge from 2006 to
2008. The study area is a 2,428 ha dry semi-deciduous forest located in the Gran
Humedal del Norte de Ciego de Ávila reserve in north-central coastal Cuba. We
estimated occupancy, abundance and detection probability using multiple sample unit
visits, and we modeled occupancy as a function of habitat characteristics. First time
population size estimates of this ground dwelling dove in a sub-coastal loma indicate
abundance at 0.36 birds ha-1
and an averaged estimated 60% probability of sample unit
occupancy. Occupancy models suggest an association with a proportion of leaf litter not
exceeding 68% and a positive correlation with the presence of exposed limestone rock
outcropping which may retain water during seasonally dry months of the year.
Key Words: Blue-headed Quail-dove, Cuba, Loma de Cunagua, detection, occupancy,
abundance, habitat characteristics, semi-deciduous. Paloma Perdiz, Starnoenas
cyanocephala

THE BLUE-HEADED Quail-dove or La Paloma Perdiz (Starnoenas cyanocephala) is a non-
migratory terrestrial dove monotypic in its genus and is one of Cuba’s rare endemic
endangered species with a high risk of extinction (BirdLife International 2008). It is the
only endemic quail-dove species on the island and is often found in habitats occupied by
related Geotrygon species the Ruddy Quail-dove (Geotrygon montana), the Key-West
Quail-dove (Geotrygon chrysia) and the Grey-headed Quail-dove (Geotrygon caniceps)
(an endemic subspecies also found in the Dominican Republic; BirdLife International
2008). It was once reported as widespread with a range from Pinar del Rio on the
western end of the island to Guantanamo at the far eastern corner opposite Haiti (Fig. 2.1)
at the later part of the 19th
century (Bent 1963), but is now considered rare. Rodriguez &
Sanchez (1993) and Garrido & Kirkconnell (2000) consider it likely extinct on the Isle of
Youth off the south west coast of the main island (Fig. 2.1), however local biologists
reported seeing the Blue-headed Quail-dove in the southern portion of the small island in
2007 (F. Chavez-Ramirez pers. comm.). Populations are now locally restricted and
patchily distributed across the island (Fig. 2.1) with substantial numbers in the mountains
at La Güira National Park in Pinar del Rio, and the Guanahacabibes peninsula (Garrido &
Kirkconnell 2000). The population decline has been principally a result of anthropogenic
alterations to the landscape and subsequent loss of habitat owing in part to the
development of the sugar industry and widespread forest removal during the neocolonial
era (Rodriguez & Sanchez 1993), as well as hunting for food and trade, and possibly
natural disasters (Gundlach in Bent 1963, Collar et al. 1994, Baillie & Groombridge
1996, Stattersfield et al. 1998). In particular, hurricanes may affect the Blue-headed
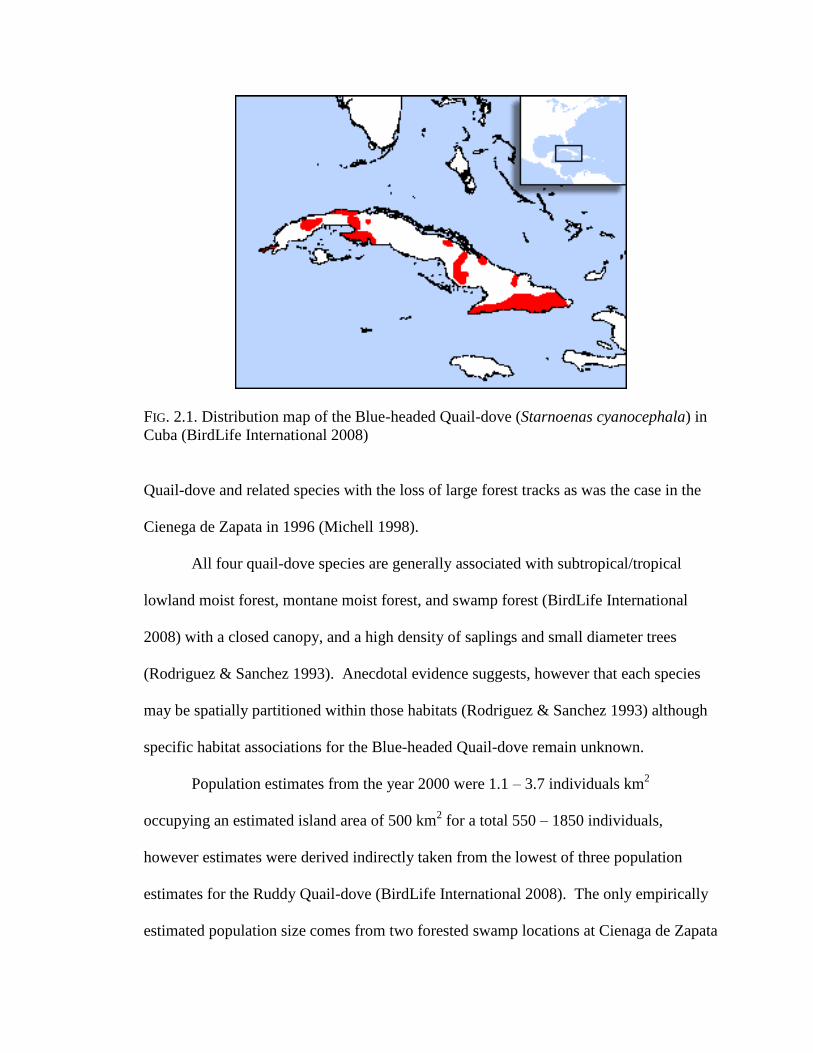
FIG. 2.1. Distribution map of the Blue-headed Quail-dove (Starnoenas cyanocephala) in
Cuba (BirdLife International 2008)
Quail-dove and related species with the loss of large forest tracks as was the case in the
Cienega de Zapata in 1996 (Michell 1998).
All four quail-dove species are generally associated with subtropical/tropical
lowland moist forest, montane moist forest, and swamp forest (BirdLife International
2008) with a closed canopy, and a high density of saplings and small diameter trees
(Rodriguez & Sanchez 1993). Anecdotal evidence suggests, however that each species
may be spatially partitioned within those habitats (Rodriguez & Sanchez 1993) although
specific habitat associations for the Blue-headed Quail-dove remain unknown.
Population estimates from the year 2000 were 1.1 – 3.7 individuals km2
occupying an estimated island area of 500 km2 for a total 550 – 1850 individuals,
however estimates were derived indirectly taken from the lowest of three population
estimates for the Ruddy Quail-dove (BirdLife International 2008). The only empirically
estimated population size comes from two forested swamp locations at Cienaga de Zapata

where estimates were on average 0.05 and 0.40 birds ha-1
(Rodriguez & Sanchez 1993),
however the authors feel this could be an underestimation due to the cryptic nature of the
species and the difficulty associated with its’ detection. No direct estimates of size exist
for this species in a dry semi-deciduous or evergreen forest habitat.
Attaining accurate population estimates are critical for highly endangered species;
long-term management and conservation decisions can be improved with information that
associates habitat with affects on populations. Sources of uncertainty can affect
management of a species, and decisions based on biased information can potentially be
harmful to conservation efforts. Endangered endemic species are often the ones of
highest management priority due to limited distribution and a lack of reliable information
on population status or trends. Consequently, our objectives were: 1) to obtain reliable,
unbiased population estimates of the Blue-headed Quail-dove in a subtropical semi-
deciduous forest; and 2) to investigate specific habitat features that are associated with
species presence. Habitat is defined as the vegetation variables and physical geographic
variables associated with the Blue-headed Quail-dove at the local site scale during the
breeding season.
METHODS
_____________________________________________________________
Methodological Considerations. – Quail-doves are generally timid and elusive in nature
making them difficult to detect and observe (Skutch 1949 1991, Seaman 1966, Chipley
1991, Rodriguez & Sanchez 1993, Rivera-Milan 1992, Robinson 2001, Dalsgaard et al.
2007). The Blue-headed Quail-dove is no exception and because it is also considered
rare (BirdLife International 2008) they present a special challenge in estimating
abundance. Traditional abundance counts where a sample unit is typically visited once

often produce erroneous estimates of population size or trends because they are subject to
bias when detection is imperfect (Hutto 1986, Buckland 1993, Yoccoz 2001, Nichols
2002, Tyre et al. 2003, Gu and Swihart 2004, MacKenzie 2002).
Similarly, abundance counts may fluctuate over time or across sample units due to
random variations or changes in detectability making inferences about the species
ambiguous (MacKenzie et al., 2002 2003). Possible factors of variation in detection may
come from: Season or time of day (MacKenzie 2002, 2005), temperature (Schmidt
2005), variations in singing proportion during a breeding season (Wilson and Bart 1985),
variations in singing proportion with habitat type and distance to the observer (McShea
and Rappole 1997), skill or observer anomalies (Sauer et al. 1994), variations in singing
due to seasonal rainfall (Rivera-Milan 1992), and habitat attributes such as foliage
density (Richards 1981).
Methods have been developed that account for detection probability as a result of
the problems associated with species detectability. Distance Sampling (Buckland 1993),
Double Observer sampling (Nichols 2000 et al.), Double Sampling (Bart and Earnst
2002), and removal methods (Farnsworth et al. 2002) are all examples. However these
methods are mainly geared towards conspicuous and relatively abundant species, and
may not work well with cryptic enigmatic animals (Thompson 2004) due to large
amounts of non-detections in the data (McDonald 2004).
How does one then achieve accurate abundance estimates for an elusive species?
Occupancy methods developed by MacKenzie et al. (2002) account for detection
probabilities to be estimated when sample units are surveyed multiple times, and account
for false negative observations when a species is present but goes undetected (Moilenan

2002, Tyre et al. 2003) which traditional abundance counts do not. These methods also
allow for the inclusion of sampling and habitat covariates that could affect either the
probability of detection or the probability of occupancy, thus providing an unbiased
estimate of habitat specific effects and population size. This involves a shift in
methodology from estimating numbers of animals to estimating the proportion of sample
units occupied by animals (MacKenzie 2002, Royle and Nichols 2003). We thus
employed occupancy as a surrogate for abundance estimation and habitat modeling.
Study Area. – We surveyed Blue-headed Quail-doves in the Loma de Cunagua
Wildlife Refuge in Cuba (Fig. 2.2). It is a subtropical 2,428 ha forest (22˚ 06’N;
78˚26’W) 340 m in elevation located within one of Cuba’s largest and newly established
wetland reserves El Gran Humedal located in the islands north central province of Ciego
de Ávila. It is one of several regional sub-coastal semi-deciduous forests (lomas),
characterized by porous limestone outcroppings and soils that have little ability to retain
water (Bisse 1988, Borhidi 1991). Dominant plant species are Almacigo Colorado
(Bursera simaruba), Sigua (Nectandra coreacea), Sangre de Doncella (Byrsonima
biflora), Yaya (Oxandra lanceolata), and Jocuma (Mastichodendron foetidissimum)
(Appendix 1). Shrub species common to the loma have not yet been identified by local
biologists. These lomas, also known as coastal saline domes, are typically low in stature
and small in area. The loma is a biogeographical island land mass surrounded by
wetlands, savannahs, agriculture (predominantly sugarcane), and urban areas. The study
area is located 15 km east from the province’s second largest city of Moron and 9.6 km
from coastal waters. According to residents, the loma experienced a high intensity fire in

1986 and was followed by aerial reseeding. It is unknown how much of the seed bank
was destroyed or whether reseeding altered species composition.
FIG 2.2. Loma de Cunagua Wildlife Refuge study area (outlined in red) in the Ciego de
Ávila region of Cuba. The dry sub-coastal semi-deciduous forest was surveyed for
presence of the Blue-headed Quail-dove (Starnoenas cyanocephala) from 2006 – 2008.
Bird Surveys. – Blue-headed Quail-dove were surveyed from 2006 -2008 at the
Loma de Cunagua Wildlife Refuge during March and April, the known peak reproductive
period for this species in its natural habitat (Goodwin 1983) in order to assess occupancy

and habitat associations in this forest type. Due to the presumed severely reduced
population of this species it was unclear to what extent it still inhabited this protected
area after 22 years of forest regeneration resulting from a devastating fire in 1986. Thus,
a pilot count was initiated on 23 March 2006 to investigate both species presence and the
onset of singing behavior related to the reproductive period. On 1 April 2006 singing
commenced across the study area and the three weeks that followed were utilized for
familiarization with the quail-doves song in this environment. Official bird surveys were
conducted from 23 April – 3 May 2006, 9 April – 19 April 2007 and 1 April – 9 April
2008. Singing tapers off precipitously during early May, thus surveys must be conducted
within this relatively small window to allow for maximum detection and to avoid false
absences.
We systematically placed 11 1 km lines every 500 m with a random start at the
east end of the loma in 2006. We were not able to stratify our sampling regime because
we had no information regarding the vegetation heterogeneity and possible stratification
of habitat types, or species distribution within the loma. We therefore used systematic
sampling to ensure coverage of all vegetation types within the study area (Sutherland et
al. 2004). We allowed 500 m between each 1 km line to assure independence of sample
units between lines.
Each 1 km line was divided into 200 x 200 m (4 ha) block sampling units for a
total of n = 55 sample units, 5 sample units per 1 km line in 2006. Because both territory
size and auditory detection distance for this species was unknown we estimated 100 m as
the horizontal distance at which auditory detection ceased. We then doubled that amount

to 200 m as the length and width of each sample unit to avoid double counting
individuals along the 1 km line and ensure independence of each sample unit.
Three repeat surveys (K) were conducted at each sample unit over the course of
the sampling period. In order to obtain a usable probability estimate of species presence
a minimum of three repeat visits is suggested (Tyre et al. 2003, MacKenzie and Royle
2005). In 2007 we increased the number of 1km lines by three for a total of 14 (n = 70
sample units) and the number of repeat visits increased to (K = 4) per day. Due to the
species timid nature and limited daily singing, the probability of obtaining a false
negative observation is increased and an increased number of visits are recommended
(Tyre et al. 2003). We increased our sampling effort due to a lack of sample unit
representation on the north-west portion of the loma during 2006. To reduce the effect
of heterogeneity (potential sources of variation in detection probability) as a result of
observer differences, observers were rotated amongst sample units and sample unit visits
were changed each day (MacKenzie and Royle 2005).
Each sample unit along the 1 km line was walked slowly (5 min 25 m-1
)
beginning at sunrise from 0630 until 1000 hours EST and observers recorded audible and
visual quail-dove detections. The Blue-headed Quail-dove sings intermittently
throughout the day however it is more physically active in the cooler morning hours (K.
M. Leavelle pers. obs.) increasing the probability of a visual sighting. This species also
makes a loud and abrupt flight exit when it takes flight resulting from being startled
unlike that of any other quail-dove or bird in this forest, and thus flushes were also
considered in our observations. Finally, in order to estimate population abundance we

counted all individuals observed within each sample unit during each replicated survey
count.
Vegetation Measurements. – We modified methods described by James and
Shugart (1970) to measure vegetation and physical feature variables within a 20 m radius
plot at a randomly chosen point within each 4 ha sample unit. Vegetation variables
measured within the circle included tree diameter at breast height (DBH), tree abundance
(≥10 cm DBH), and tree species abundance. Variables measured within a 2 m x 4 m
quadrat from the center of the plot were sapling abundance (≥2 cm & <10 cm DBH), and
shrub abundance (woody stems <2 cm). Average shrub cover (%) was estimated 10 m
from the center in each cardinal direction. Finally, I measured the percent cover of leaf
litter, exposed rock and canopy cover with an ocular tube at each meter along the meter
tape (James and Shugart 1970). I also measured topographic features of slope (the angle
of the surface relative to the horizon), and aspect (the compass direction of the slope’s
orientation).
Data Analysis.- I used a maximum likelihood based approach to estimate model
parameters and the proportion of sample units occupied by the Blue-headed Quail-dove
because we believed the probability of detection at a sample unit was < 1. Sample unit
occupancy models were developed by MacKenzie et al. (2002) and analyzed in Program
PRESENCE2.0 (Hines, J. E. 2002). I used a logit link function to model the probability
of occupancy (success) as a function of sample unit covariates. A linear combination of
covariate values was transformed to a probability scale between 0 -1. The logit link is
defined as:

iuuii
i
ii xxx
...
1ln)(itlog 22110
where θi is the probability for the ith sampling unit, the term i
i
1 is the odds of success,
and xi1, xi2, …, xiu are the values for the U covariates. The regression coefficients β1+ β2
+ … + βu determine the size of the effect of the covariates and β0 is the intercept.
I used a multi-season analysis which combines data from the 2006 - 2008
breeding seasons. The analysis resulted in estimates of occupancy (ψ), detection (p) and
the dynamic processes of extinction (ε), and colonization (γ) which explicitly govern
changes in occupancy. The time frame for a multi-season model is considered at two
temporal scales: a primary and secondary sampling period. The primary period refers to
three breeding seasons between March and July from 2006 - 2008. The primary period
assumptions are: 1) each breeding season is common to all sample units and; 2) the
occupancy state is open to change or population movement between seasons. The
secondary sampling periods refer to the within-season surveys of N sample units, K times
and is essentially a sequence of single season studies conducted at the same sample units
for multiple breeding seasons (Pollock 1982, MacKenzie et al. 2005). This model could
also be extended to determine habitat use in other seasons. Specific assumptions for the
secondary period are: 1) a closed population over each 2 week survey period with no
immigration or emigration due to assumed sedentary breeding behavior and territoriality.
In other words occupancy does not change at a sample unit during the set of surveys; 2)
detection of the target Blue-headed Quail-dove at a sample unit was independent of

detections at other sample units; and 3) the target species was never falsely detected at a
sample unit when absent.
I used a three-step approach to select the best model of accuracy. First we
determined which factors explained detection probabilities while keeping sample unit
occupancy probability, extinction and colonization parameters constant across sample
units [(.), γ(.), ε(.)]. Four detection models were constructed: 1) The probability of
detection was constant across sample units [p(.)]. Species at all sample units per sample
are detected with a single probability (detection is not heterogeneous across sample
units), and is the estimated probability of detecting a species at least once during a set of
surveys (given the species is present); 2) Detection probabilities were survey (sample
unit) specific [p(t)] where the detection probability at all sample units varies, sample #1 =
p(1), sample #2 = p(2), sample #3 = p(3); 3) The detection probability was a function of
temporal year differences [ p(year)]; 4) Detection was a function of observer variation
among years [p(obs)], and; 5) Detection was a function of an increase in singing due to
call playback [p(call playback)].
I then used the best model for detection probabilities in the second step to
determine sample unit extinction or colonization from 2006 to 2007 or from 2007 to
2008. In datasets of multiple years > 2 it is possible to allow them to vary to detect year
differences and test hypotheses about populations either being in equilibrium
(colonization = extinction) or non-equilibrium (colonization ≠ extinction). Finally, I used
the best model for detection, extinction and colonization probabilities to determine
probabilities in occupancy () which was allowed to vary as a function of habitat
covariates.

Candidate Models. – We developed an a priori set of candidate models based on
either known biological information or information gained from direct observations
obtained from this study hypothesized to be important for the Blue-headed Quail-dove.
Eight models contained vegetation variables. 1) A closed canopy (CANOPY COVER
PROPORTION) may be a possible mechanism for aerial predator avoidance. An open
understory with low shrub cover (AVERAGE SHRUB COVER) may be important for visual
clarity and an ease of predator escape. 2) A large percentage of leaf litter (LEAF LITTER
PROPORTION) would be important to this terrestrial dove as it only feeds on the ground
moving leaf litter with its beak in search of fallen fruit and invertebrates hiding within the
leaves. 3) A large percentage of limestone rock outcroppings (EXPOSED ROCK
PROPORTION) could be advantageous to a dove species which requires large amounts of
water for the production of crop milk. Water collects in these tide pool-like structures
during the rainy season (May-Oct) providing an important water resource to all animals.
In addition, incipient rains coincide with the later part of the quail-dove breeding season
when chicks are being fed crop milk, a substance which is 64.3% water (Reed et al.
1932). 4) Fallen trees, limbs or bent over trees (PERCHES) used as perches would
provide possible resting and nesting substrates. The Blue-headed Quail-dove has been
observed on many occasions sunning, resting, singing and preening on natural perches
and is often found in areas with large amounts of fallen tree matter. Two nests were also
found in bowed over tree trunks with a flat horizontal place for a nest. 5) Larger trees
(AVG. TREE DBH) would be indicative of a mature forest producing a greater abundance
of fruit (Chapman et al. 1992). 6) Fewer trees (TREE ABUNDANCE) would also represent
a mature forest and a greater ability to flee predators. 7) Fruiting tree species

(ALMACIGO COLORADO) (Bursera simaruba) and (SANGRE DE DONCELLA) (Byrsonima
biflora) may potentially be important for the quail-dove in this system. Quail-doves have
been observed feeding on fallen fruit of these tree species which may indicate an
important dietary component providing nutritional requirements during the breeding
season. A model combining AVG. TREE DBH and TREE ABUNDANCE was included to
represent fewer larger trees suggestive of a mature forest plus a model with ALMACIGO
COLORADO, SANGRE DE DONCELLA and ASPECT as quail-doves may prefer fruiting trees
on south facing slopes.
Two other models contained physical topographical variables. 1) Blue-headed
Quail-dove may be associated with south facing areas (ASPECT) (compass degrees) which
receive more sun at this latitude throughout the day and may cause earlier fruit
production in certain plant species. 2) Blue-headed Quail-dove may be associated with
increasing degree in incline (SLOPE) (horizontal degrees) as trees may have more of a
tendency to fall in the direction of the downward slope increasing the number of potential
available fallen trees for perches or nesting sites.
We considered 14 competing models with one or two parameters constructed
from 12 predictor variables. More complex models with additional parameters are of less
practical value for conservation of this species and make less biological sense (Burnham
and Anderson 2002). Preliminary analyses in Program PRESENCE2.0 revealed a lack of
convergence of global and sub-global models which were thus excluded from analysis.
We used Akaike’s Information criterion with a small sample size correction
(AICc) for model comparison (smallest AICc = the best model; Table 2.4). Burnham and
Anderson (2002) recommend the use of AICc when n/K < 40, n = sample size and K =

the number of sample unit covariates used; (70/12 = 5.83). High ranking models were
given substantial empirical support if the AICc difference (Δi = AICi – AICmin) was
greater than two (Burnham and Anderson 2002). Models were averaged across all model
parameters to reduce potential model selection bias effects on beta coefficient estimates
(Burnham and Anderson 2002).
Finally, we estimated abundance by including the total number of detections per 4
ha sample unit which estimates population size while accounting for detection probability
from spatially replicated counts (Royle 2004). We ran a Pearson’s Goodness of Fit test to
assess the fit of the global model to our data. Transformation of data was done by
dividing parameter values by a constant of 100 in order to avoid over dispersion and to
allow program PRESENCE to work with values between zero and one (Hines 2002).
RESULTS ______________________________________________________________________________
Detection. – Quail-dove were detected on 91% of the 11 1 km lines in the first year, 86%
of 14 1 km lines in 2007, and 93% of 14 1 km lines in 2008 indicating species presence
throughout the study area. The proportion of sample units where Blue-headed Quail-
dove were detected at least once (naïve occupancy) decreased by 8% in 2007 but
increased by 14% in 2008 (Table 2.1). The amount of birds detected aurally was 16
(57%) in 2006, 20 (62.5%) in 2007 and 25 (61%) in 2008. Visual detections accounted
for 7 (25%) in 2006 and 9 (28%) in 2007, and flushes accounted for 5 (18%) and 3 (9%)
of the detections in 2006 and 2007 respectively. The amount of visual detections
including flushes was 16 (39%) in 2008. Finally an average of 10.6 birds ± 0.57 were
detected h-1
from 0700 – 1000 hours decreasing to 4.5 ± 0.71 after 1000 h.
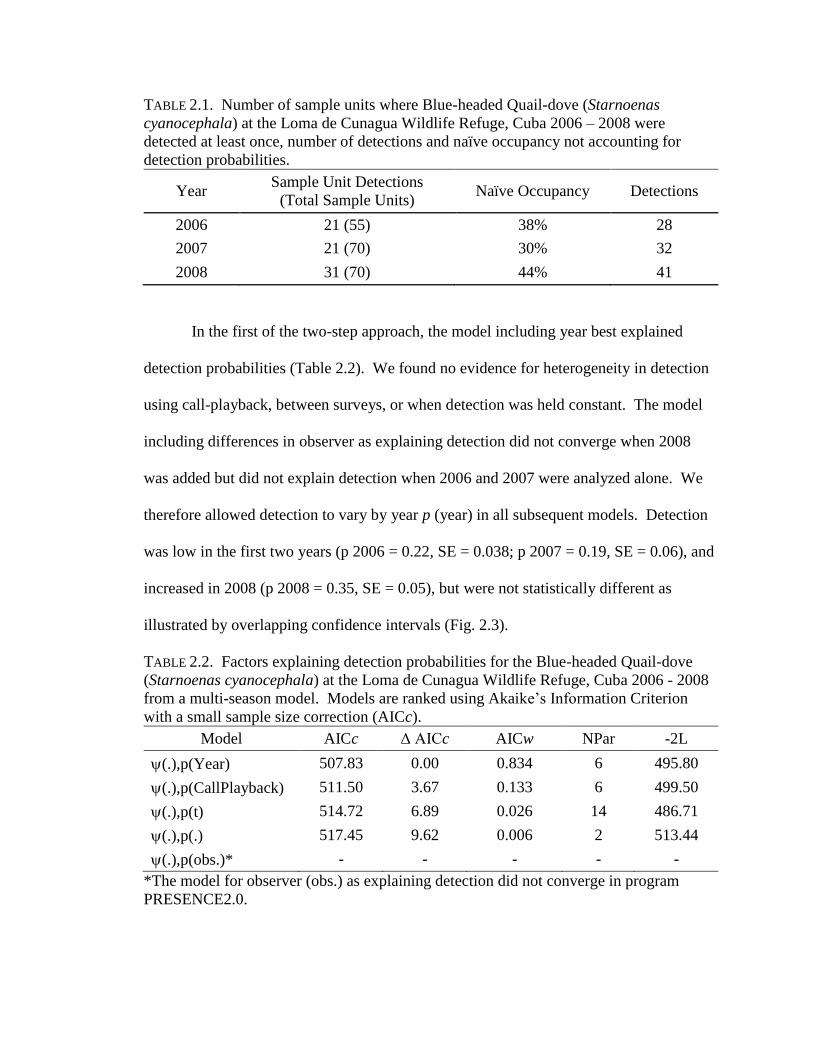
TABLE 2.1. Number of sample units where Blue-headed Quail-dove (Starnoenas
cyanocephala) at the Loma de Cunagua Wildlife Refuge, Cuba 2006 – 2008 were
detected at least once, number of detections and naïve occupancy not accounting for
detection probabilities.
Year Sample Unit Detections
(Total Sample Units) Naïve Occupancy Detections
2006 21 (55) 38% 28
2007 21 (70) 30% 32
2008 31 (70) 44% 41
In the first of the two-step approach, the model including year best explained
detection probabilities (Table 2.2). We found no evidence for heterogeneity in detection
using call-playback, between surveys, or when detection was held constant. The model
including differences in observer as explaining detection did not converge when 2008
was added but did not explain detection when 2006 and 2007 were analyzed alone. We
therefore allowed detection to vary by year p (year) in all subsequent models. Detection
was low in the first two years (p 2006 = 0.22, SE = 0.038; p 2007 = 0.19, SE = 0.06), and
increased in 2008 (p 2008 = 0.35, SE = 0.05), but were not statistically different as
illustrated by overlapping confidence intervals (Fig. 2.3).
TABLE 2.2. Factors explaining detection probabilities for the Blue-headed Quail-dove
(Starnoenas cyanocephala) at the Loma de Cunagua Wildlife Refuge, Cuba 2006 - 2008
from a multi-season model. Models are ranked using Akaike’s Information Criterion
with a small sample size correction (AICc).
Model AICc Δ AICc AICw NPar -2L
(.),p(Year) 507.83 0.00 0.834 6 495.80
(.),p(CallPlayback) 511.50 3.67 0.133 6 499.50
(.),p(t) 514.72 6.89 0.026 14 486.71
(.),p(.) 517.45 9.62 0.006 2 513.44
(.),p(obs.)* - - - - -
*The model for observer (obs.) as explaining detection did not converge in program
PRESENCE2.0.
0.220.1975
0.3548
0.00
0.10
0.20
0.30
0.40
0.50
0.60
0.70
0.80
0.90
1.00
2006 2007 2008
Year
Det
ectio
n P
rob
ability
.
FIG. 2.3. Detection probabilities (p) for Blue-headed Quail-dove (Starnoenas
cyanocephala) at the Loma de Cunagua Wildlife Refuge, Cuba 2006 - 2008. ± 95%
Confidence Intervals.
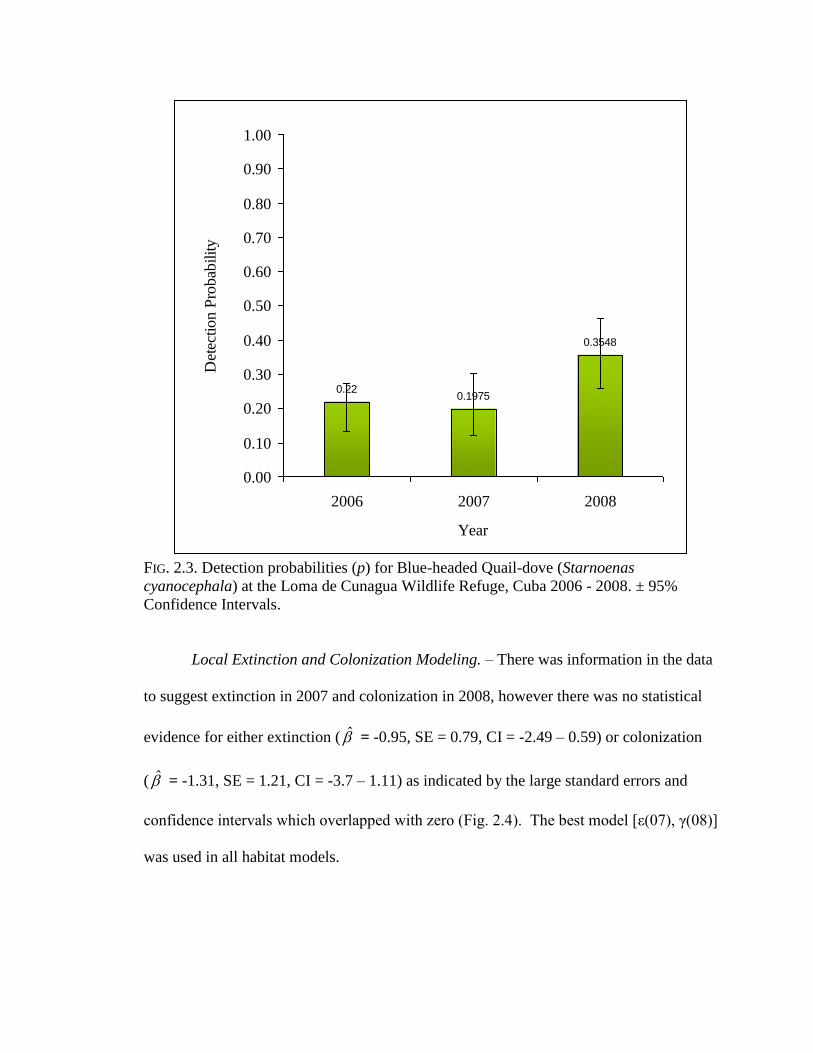
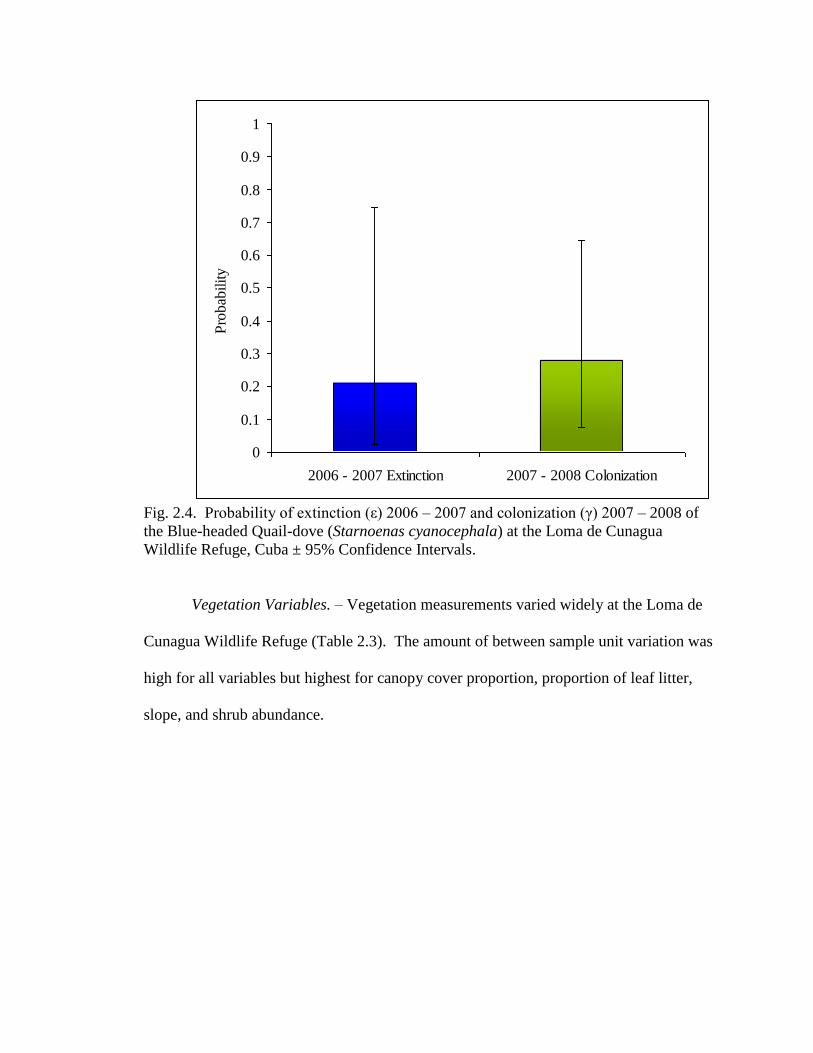
Local Extinction and Colonization Modeling. – There was information in the data
to suggest extinction in 2007 and colonization in 2008, however there was no statistical
evidence for either extinction ( ̂ = -0.95, SE = 0.79, CI = -2.49 – 0.59) or colonization
( ̂ = -1.31, SE = 1.21, CI = -3.7 – 1.11) as indicated by the large standard errors and
confidence intervals which overlapped with zero (Fig. 2.4). The best model [ε(07), γ(08)]
was used in all habitat models.
0
0.1
0.2
0.3
0.4
0.5
0.6
0.7
0.8
0.9
1
2006 - 2007 Extinction 2007 - 2008 Colonization
Pro
bab
ility .
Fig. 2.4. Probability of extinction (ε) 2006 – 2007 and colonization (γ) 2007 – 2008 of
the Blue-headed Quail-dove (Starnoenas cyanocephala) at the Loma de Cunagua
Wildlife Refuge, Cuba ± 95% Confidence Intervals.
Vegetation Variables. – Vegetation measurements varied widely at the Loma de
Cunagua Wildlife Refuge (Table 2.3). The amount of between sample unit variation was
high for all variables but highest for canopy cover proportion, proportion of leaf litter,
slope, and shrub abundance.

TABLE 2.3. Vegetation and physical feature sample unit (4 ha) parameter measurements
(Mean 4 ha-1
) at the Loma de Cunagua Wildlife Refuge, Cuba. Measurements were taken
in 2007.
Range
Variable Mean Median St. Dev. Min Max
Leaf Litter Proportion (%) 0.57 0.60 0.16 0.19 0.83
Canopy Cover Proportion (%) 0.68 0.67 0.16 0.25 0.99
Rock Proportion (%) 0.19 0.19 0.13 0.00 0.53
Sangre de Doncella Abundance 3.00 3.00 1.80 0.00 8.00
Almacigo Colorado Abundance 5.00 5.00 2.10 2.00 11.00
Tree Abundance 39.00 39.00 7.84 16.00 51.00
Avg. Tree DBH* 33.49 36.00 11.22 14.94 50.19
Slope (°) 18.37 19.00 9.90 0.00 50.00
# Perches 4.24 4.00 3.21 0.00 13.00
Sapling Abundance 31.33 30.00 11.41 14.00 67.00
Shrub Abundance 24.91 23.50 14.00 2.00 100.00
Avg. % Shrub Cover 0.79 0.81 0.13 0.41 0.98
*DBH = Diameter at Breast Height. Vegetation variables including all proportions, everything
related to trees and perches were measured within a 20 m radial circle. Slope was measured at
the randomly chosen point, shrub abundance and sapling abundance were measured within a 1 m
radial circle around the point, and avg. shrub cover was taken 10 m from the point in every
cardinal direction. n = 70.
Habitat Modeling. – The goodness-of-fit test for a global model did not indicate
lack of fit ( c hat = 0.95). The parameters of leaf litter and exposed rock were negatively
correlated (r2 = -0.56, p < 0.0001) and could not be included together in the same model
or in competing models. The model for exposed rock was chosen as the parameter which
was thought to be most biologically meaningful however it did not converge in program
PRESENCE2.0. Therefore a model for leaf litter was included instead as a proxy for the
proportion of exposed rock. The model for leaf litter best fit the data and received nearly
nine times more support then the next best model that included Sangre de Doncella
abundance and is given considerable empirical support by the 4.36 difference in AICc
(Table 2.4).

Occupancy decreased with increasing leaf litter (β0 = 23.60, β leaf litter = -33.37,
SE = 10.78, CI = -54.93 – -11.81). However, the model averaged estimate for leaf litter,
conditional on all 14 models, indicate little evidence for any directional effect ( ~
0 =
17.47, ~
leaf litter = -24.44, SE ( ~
) = 16.79, CI = -57.34 – 8.46). No other habitat
parameters or models combining multiple parameters received significant support.

TABLE 2.4. Models explaining the proportion of sample units occupied () by Blue-headed Quail-dove (Starnoenas cyanocephala) at
the Loma de Cunagua Wildlife Refuge, Cuba from 2006 - 2008 as a function of habitat variables ranked by Akaike’s Information
criterion (AIC) with a small sample size correction (AICc). Best model for parameters extinction in 2007 [ε(07)], and colonization in
2008 [γ(08)] are included in each model for occupancy. PRESENCE2.0 was used for analysis.
Model ΔAICc AICw NPar -2LL
ψ(Leaf Litter Proportion), ε(07), γ(08), p(Year) 0.00 0.732 7 487.60
ψ(Sangre de Doncella Abundance), ε(07), γ(08), p(Year) 4.36 0.082 7 491.96
ψ(Aspect), ε(07), γ(08), p(Year) 5.85 0.039 7 493.45
ψ(.), ε(07), γ(08), p(Year) 6.23 0.032 6 495.83
ψ(Slope + Aspect), ε(07), γ(08), p(Year) 7.28 0.019 8 492.88
ψ(Tree Abundance), ε(07), γ(08), p(Year) 7.77 0.015 7 495.37
ψ(Average Tree DBH), ε(07), γ(08), p(Year) 7.80 0.014 7 495.40
ψ(Canopy Cover Proportion), ε(07), γ(08), p(Year) 7.85 0.014 7 495.45
ψ(Slope), ε(07), γ(08), p(Year) 8.06 0.013 7 495.65
ψ(Almacigo Colorado), ε(07), γ(08), p(Year) 8.13 0.012 7 495.73
ψ(Perches), ε(07), γ(08), p(Year) 8.22 0.012 7 495.82
ψ(Avg. Shrub Cover), ε(07), γ(08), p(Year) 8.23 0.012 7 495.83
ψ(Tree Abundance + Avg. Tree DBH*), ε(07), γ(08), p(Year)** - - - -
ψ(Aspect + Doncella. + Almacigo), ε(07), γ(08), p(Year)** - - - -
*DBH=Diameter at Breast Height. **Models that did not converge in program PRESENCE2.0. Tree species listed are Sangre
de Doncella (Byrsonima biflora) and Almacigo Colorado (Bursera simaruba). Slope (°) = the angle of the surface relative to
the horizon, and Aspect (°) = the compass direction of the slopes orientation. All variables were measured within a 20 m
radius circle.
29

Figure 2.4 demonstrates the probability of occupancy with respect to the
proportion of leaf litter at a sample unit. Blue-headed Quail-doves were predominantly
detected in areas with 30-65% leaf litter ground cover proportion (57% of sample units)
and were detected most often at sample units with 49-59% leaf litter ground cover (33%
of sample units). Occupancy was estimated at ≤ 50% at leaf litter levels of ≥73% (14%
of sample units) while areas of highest occupancy (86% of sample units) were found with
leaf litter between 20% -73%. Figure 2.6 illustrates the lack of spatial pattern of specific
leaf litter proportions, thus a lack of pattern of occupancy which is high (99%) across the
loma.
0
0.1
0.2
0.3
0.4
0.5
0.6
0.7
0.8
0.9
1
0.0 0.1 0.2 0.3 0.4 0.5 0.6 0.7 0.8 0.9 1.0
Leaf Litter Proportion
Pro
bab
ility o
f O
ccupan
cy .
FIG. 2.4. Logistic curve describing the probability of sample unit occupancy ± 95%
confidence intervals as a function of the proportion of leaf litter ground cover of the
Blue-headed Quail-dove (Starnoenas cyanocephala) at the Loma de Cunagua Wildlife
Reserve, Cuba from 2006 – 2008.

FIG. 2.5. Occupancy of the Blue-headed Quail-dove (Starnoenas cyanocephala) at the
Loma de Cunagua Wildlife Refuge, Cuba as a function of leaf litter proportion. Areas of
high occupancy (≥ 70%) are in red, medium occupancy (40 – 69%) and low occupancy
(0 – 39%). True color is not represented in the image.
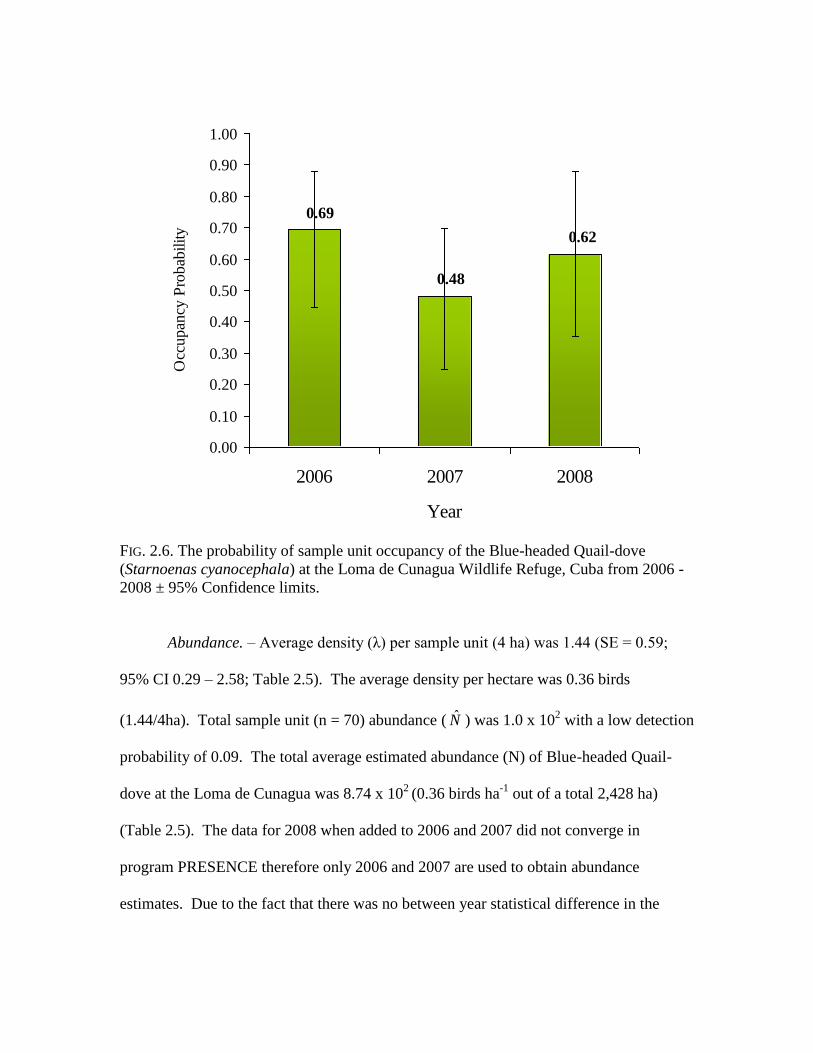
Sample unit Occupancy Probabilities. – The probability of sample unit occupancy
for each habitat model varied between 0.65 and 0.99 in all years, however high estimates
near 1.00 may be over-estimates as a result of low detection probabilities < 0.30
(MacKenzie 2002). Thus, the probability of sample unit occupancy (ψ) of Blue-headed
Quail-dove was taken from the constant model (2006: ψ = 0.69, SE = 0.11, CI = 0.47 –
0.90; 2007: ψ = 0.48, SE = 0.12, CI = 0.24 – 0.71; 2008: ψ = 0.62, SE = 0.14, CI = 0.34 –
0.90).
0.69
0.48
0.62
0.00
0.10
0.20
0.30
0.40
0.50
0.60
0.70
0.80
0.90
1.00
2006 2007 2008
Year
Occ
up
ancy
Pro
bab
ility
.
FIG. 2.6. The probability of sample unit occupancy of the Blue-headed Quail-dove
(Starnoenas cyanocephala) at the Loma de Cunagua Wildlife Refuge, Cuba from 2006 -
2008 ± 95% Confidence limits.
Abundance. – Average density (λ) per sample unit (4 ha) was 1.44 (SE = 0.59;
95% CI 0.29 – 2.58; Table 2.5). The average density per hectare was 0.36 birds
(1.44/4ha). Total sample unit (n = 70) abundance ( N̂ ) was 1.0 x 10² with a low detection
probability of 0.09. The total average estimated abundance (N) of Blue-headed Quail-
dove at the Loma de Cunagua was 8.74 x 10²
(0.36 birds ha-1
out of a total 2,428 ha)
(Table 2.5). The data for 2008 when added to 2006 and 2007 did not converge in
program PRESENCE therefore only 2006 and 2007 are used to obtain abundance
estimates. Due to the fact that there was no between year statistical difference in the

probability of occupancy all seven visits were combined to obtain a more robust estimate
of abundance.
TABLE 2.5. Abundance estimation from repeated count data formally allowing for
detection probability (Royal 2004). Occupancy (ψ), detection (p) and average
density/sample unit are transformed proportion estimates. Estimates are birds/sample
unit. A sample unit = 4 ha.
95% CI
Estimated Parameter Estimate St. Error Lower Upper
Detection (p) 0.09 0.04 0.02 0.17
Occupancy (ψ) 0.76 0.14 0.49 1.03
Average Density per
sample unit ( ̂ /ha) 1.44 (0.36/ha) 0.59 0.29 2.58
Total Sample Unit
Abundance ( ̂ ) 1.0 x 10² 40.96 20.26 1.8 x 10
2
Total Abundance (N)* 8.74 x 10² birds* 1.76 x 10
2 1.6 x 10
3
*Total abundance (N) is derived from 1.44 birds/4 for a per hectare estimate. Abundance
estimates reflect pooled data for 2006 and 2007 only.
DISCUSSION
Our study was the first to extensively examine occupancy of the Blue-headed Quail-dove,
to incorporate estimates of detectability into quail-dove occupancy analysis, and to
determine habitat associated with the presence of the species in a semi-deciduous forest
in Cuba. In general, we believe that these methods developed by MacKenzie et al.
(2002) are well suited for assessing populations of rare and elusive species and are worth
the time spent to obtain unbiased estimates and is recommend for the study of any animal
population. It is particularly well suited for the long-term monitoring of the Blue-headed
Quail-dove at the Loma de Cunagua and other areas throughout Cuba.
Results for the proportion of sample units occupied far exceeded our expectations
considering the fact that local biologists were uncertain as to the presence of the Blue-

headed Quail-dove within this protected area. Occupancy estimates indicate that
occupancy is moderately high across the entire study area and its distribution is
homogeneous. The local biologists’ perception is, therefore, a result of low detectability,
rather than low abundance, and this distinction is critical for future conservation
decisions.
Our estimation of abundance (0.36 birds ha-1
) is the first reported for a dry semi-
deciduous forest and exceed low Ruddy Quail-dove population size estimates (0.01 ind
ha-1
– 0.04 ind ha-1
) provided by BirdLife International (2008) as a proxy for Blue-headed
Quail-dove estimates, or by Rodriguez and Sanchez (1993) at one study area in the
Cienaga de Zapata (0.05 ind ha-1
). Our estimate more closely agrees with estimates given
by Rodriguez and Sanchez (1993) from their second study site in Zapata (0.40 ind ha-1
).
Because we incorporated detectability in our estimation process, it would be expected to
provide a higher estimate, especially given our detectability rate estimates. We also have
low precision in our estimates however increased years of data will increase statistical
confidence in these estimates.
There was no statistical evidence for between year increases or decreases in
detection, extinction, colonization or occupancy parameters due to a lack of precision in
the estimates. The amount of error and lack of precision is a result of this small data set
and highlights the need for additional years of data as well as an increase in surveys each
year. Missing values from both 2006 and 2008 could also cause reduced precision in the
estimates (MacKenzie et al. 2002).
Occupancy appears to vary as a function of leaf litter ground cover, though
conditional model averaged estimates rendered it inconclusive. Two possible factors may

help explain the uncertainty in our results. First, our limited observations contributed to a
lack of precision in the estimates, which is further amplified by the conditional model
averaging process. However, some of the uncertainty is derived from the fact that our
raw data shows that Blue-headed Quail-doves were fairly general users of habitat, as they
were observed across the range of litter cover values in our sample units (19 - 83%).
We did not observe a clear spatial pattern of areas with large or small amounts of
leaf litter on the loma, which led to the absence of a spatial pattern of occupancy. The
only spatial vegetation pattern we observed is that the secondary growth seen on the
eastern portion of the loma has smaller trees and reduced canopy and leaf litter cover
(Appendix 2), which may indicate more recent disturbance or abiotic factors affecting the
vegetation growth which is not seen on the rest of the loma. However, quail-dove
occupancy was not determined by that pattern. Indeed, no other vegetation variable,
slope, aspect, or tree species showed any clear spatial pattern on the loma, and the
estimated probability of occupancy was high at all levels (low, medium, and high) of
each variable. This is likely the main reason why no other model was able to explain
occupancy of the Blue-headed Quail-dove as related to a particular vegetation or physical
feature covariate due to the general vegetative association of the quail-dove in this semi-
deciduous forest that characterizes the Loma de Cunagua Wildlife Refuge.
We did observe patterns in our data that suggest a negative effect of leaf litter on
the occupancy when leaf litter exceeds 70% cover. The probability of occupancy
remained high (99%) from 19% litter up to about 70% and precipitously declined to zero
at approximately 83% (Fig. 2.4). Because the proportion of leaf litter ground cover was
used as a proxy for the proportion of exposed limestone rock due to their negative

correlation, the Blue-headed Quail-dove may be responding positively to an increase in
the proportion of rock which is exposed at sites with low leaf litter. In fact, the sample
units with leaf litter greater than 70%, which are associated with low occupancy, have an
average rock cover of 11%; 30% of those sample units (n = 20) have no rock at all. The
rest of the sample units (n = 50) with low to medium levels of litter between 19 and 70%
which are indicative of high occupancy had an average rock cover of 21%; less than 1%
of those sample units had no rock cover. Though it is only a 10% difference, it may be a
meaningful difference to the quail-dove. The average rock proportion for the loma is
0.185 (±0.132).
Why is the probability of occupancy high at low to medium proportions of leaf
litter? The presence of leaf litter on the ground is important to terrestrial species such as
new world quail-dove which primarily feed on seed, berries and small snails (Gundlach,
in Bent 1963). Seeds and berries are affected by the abiotic factors of humidity and
temperature which may create the micro site conditions necessary for seed viability
underneath the layers of leaf litter especially in drought years and during the dry season.
Specifically, this protective cap in tropical forests provides a hydraulic balance between
the seed and the soil (Sork 1985) protecting both berries and seeds from desiccation
during the dry months and flooding in the wet season. Alternatively, temperatures can
become too high in seasonal environments causing seed mortality and desiccation
beneath the litter (Foster 1986). Leaf litter can also protect seeds from seed predators
(Cintra 1997, except see Schupp 1989), but these factors may also create an environment
which allows for an increase of activity of seed predators (Schupp 1989). Blue-headed
Quail-dove, as well as species of the genus Geotrygon, are such ground dwelling seed

predators known for moving leaf litter substrate with both their feet and their beaks down
to the bare soil (Skutch 1991, K. Leavelle pers. obs.) in search of berries and seeds which
would allow them to take advantage of seed physiology and establishment mechanisms.
Invertebrates are considered to be a dietary element for the Blue-headed Quail-
dove as they have been directly observed to take small terrestrial snails (Dr. Jean
Gundlach in Bent 1963). Quail-dove are only part time fruit and seed eaters probably
relying on a certain amount of invertebrate protein in their diets (Goodwin 1983).
Captive Blue-headed Quail-dove have been known to “devoure” mealworms, snails, and
slugs (Skutch 1991) suggesting that animal protein may be an important dietary
component of doves. Low to mid elevations upwards of 1,000 m where quail-doves are
typically found (Gibbs et al. 2001) have more prolonged dry spells and associated
deciduousness with trees either dropping all of their leaves or reducing their leaf volume
(Smythe 1970). Fallen leaves of these seasonal forests harbor many species of
invertebrates which rely on litter fall for both structure and nutritional quality (Bultman
& Uetz 1984), moisture during the dry season (Levings and Windsor 1984), abiotic
factors of temperature and humidity (Janzen and Schoener 1968) and chemical properties
of the soil resulting from litter decomposition (Seastedt 1983). In a subtropical seasonal
forest in Costa Rica terrestrial snails are associated with secondary growth vegetation and
increase with increasing leaf litter depth and proportion for thermic stability (Barrientos
2000).
The proportion of exposed limestone rock may not be important as much as the
ability of these tide pool-like formations to retain water, a vital resource for many
organisms in a seasonally dry environment especially during the dry winter months.

Blue-headed Quail-dove are frequent visitors during the breeding season to these small
watering holes called “posetas” of which only 4 – 0.5 m diameter pools and several
smaller cup size reservoirs have been identified at the loma. As many as five individuals
have been observed at one time at a poseta to drink water during the month of May and as
many as eight throughout the course of a day (K. Leavelle pers. obs). There may also be
a connection between terrestrial snails, a potentially important dietary element of the
Blue-headed Quail-dove, and limestone rock deposits characteristic of the island of Cuba
(Seifriz 1943, Borhidi 1991). Interestingly, small terrestrial snails are more abundant on
limestone hills in Borneo supporting two to five times more species than non-limestone
plots possibly due to the calcium carbonate availability important for egg and shell
formation (Schilthuizen et al. 2003). Terrestrial snails are indeed found at the loma de
Cunagua refuge and may be playing an important role in the presence of the Blue-headed
Quail-dove in this environment and in its feeding ecology.
Future Investigation and Long term Monitoring. – Blue-headed Quail-doves are
ubiquitous at the Loma de Cunagua refuge; therefore, conservation efforts should protect
the entire loma. If logistical constraints allow, additional years of surveys will be needed
to increase the precision of our occupancy estimates of the Blue-headed Quail-dove at the
Loma de Cunagua and will allow biologists to detect trends in occupancy as well as the
dynamic processes of extinction and colonization probabilities. If there is a need to
decrease the effort involved in multiple visits to a sample unit then it is reasonable to
recommended a decrease in the number of sample units included in bird surveys due to
the homogeneity of the habitat (MacKenzie et al. 2002) while maintaining the
recommended minimum three visits per sample unit (MacKenzie et al. 2002, Tyre et al.

2003) though five is a more optimum number of visits to reduce bias and variance in the
estimates (Tyre et al. 2003). Furthermore, occupancy surveys can be conducted every
two to three years if survey effort needs to be decreased. When the old coffee plantation
area and burned areas from the 1986 fire are identified, sample units can be stratified
according to vegetation differences which resulted from disturbance which may provide
more fine scale differences in occupancy estimates.
Because this species is extremely elusive and difficult to detect we believe that
detection probabilities can be increased by adding call playback methods to population
counts. In 2007 we tested a call playback method to lure the birds in and had better than
expected results. We chose one 1 km line in particular where we believed the quail-dove
to be present, but absent on all visits during the official bird surveys, and played the
quail-dove call every 200 m for 5 min. Individuals either sang in response or walked into
the area either alone or in a pair to investigate the playback at each point. Blue-headed
Quail-dove are territorial during the breeding season and will respond to other individuals
entering into their territory by approach, display or if that doesn’t work, physical contact
(K. Leavelle pers. obs.). Use of call playback at all sample units by all observers during
bird surveys is therefore recommended to increase both detection and sample unit
occupancy probabilities.
Occupancy, relative abundance and habitat associations of the Blue-headed Quail-
dove should be investigated within remaining forest types throughout Cuba for the
purposes of direct comparisons of relative abundance and to evaluate actual species
distribution on the island. Specifically, we recommend investigating areas within the
reserve such as Tres Galan, a mixed palm, broadleaf, semi-deciduous forest located at sea

level at the base of the loma, and Cayo Coco, a reserve with semi-deciduous trees,
palmettos, black mangrove and coastal dunes which made this a perfect place for study of
any species in a series of stratified sub-tropical habitat types. It would also be important
to extend the study to areas outside of the reserve such as other neighboring lomas
common to this region or other natural areas within the central region such as Cueva
Lechusa in the Sierra de Cubitas where the Blue-headed Quail-dove has been sited
(Concepción and Tadeo 1997). Finally, investigations should be initiated in La Güira
National Park in Pinar del Rio, and the Guanahacabibes peninsula in the Eastern portion
of Cuba where naturalists and biologists have previously reported the quail-dove, as well
as the Zapata peninsula which would be a extension of an investigation previously
conducted with all four quail-dove species which occur together in this area (Rodriguez
and Sanchez 1993).
Investigation into species interactions will determine if and how each species
influences the other with respect to occupancy, extinction or colonization (MacKenzie et
al. 2005). We recommend a program to monitor the Key-West Quail-dove, the Ruddy
Quail-dove and the Blue-headed Quail-dove to determine niche partitioning, ecological
behaviors and effects of interactions they may have on each other. The Grey-headed
Quail-dove was not observed at any time during this investigation but is reported in Cayo
Coco, Ciego de Avila, Cuba.
Occupancy methods that account for the probability of detection are fundamental
to the long-term monitoring of population trends of this endangered endemic species, and
to gaining a better understanding of the species associations within differing habitat
types. Results from our study at the Loma de Cunagua Wildlife Refuge should serve as

the basis for new investigations both locally and regionally, and should be used to update
the current World Conservation Unions’ records for Blue-headed Quail-dove estimated
abundance in a semi-deciduous lowland forest in Cuba.
LITERATURE CITED
________________________________________________________________________
AKAIKE, H. 1973. Information Theory and an Extension of the Maximum Likelihood
Principle. Pages 267-281 in B. N. Petran and F. Csaaki, editors. International
Symposium on Information Theory. Akadeemiai Kiadi, Budapest, Hungary.
BAILLIE, J., AND B. GROOMBRIDGE, EDITORS. 1996. 1996 IUCN Red List of Threatened
Animals. IUCN, Gland, Switzerland.
BARRIENTOS, Z. 2000. Population dynamics and Spatial Distribution of the Terrestrial
Snail Ovachlamys fulgens (Stylommatrophora: Helicarionidae) in a Tropical
Environment. Revista de Biologica Tropical 48:
BART J. AND S. EARNST. 2002. Double Sampling to Estimate Density and Population
Trends in Birds. The Auk 119:36-45.
BENT, A. C. 1932. Life Histories of North American Gallinaceous Birds. Dover
Publications, New York.
BIRDLIFE INTERNATIONAL (2008) Species factsheet: Starnoenas cyanocephala.
Downloaded from http://www.birdlife.org on 12/7/2008
BISSE, J. 1988. Arboles de Cuba. Editorial Cientifico-Tecnica, Ciudad de la Havana,
Cuba
BORHIDI, A. 1991. The Phytogeography and Vegetation Ecology of Cuba. Akademiai
Kiado, Budapest.
BUCKLAND S. T. AND D. A. ELSTON. 1993. Empirical Models for the Spatial Distribution
of Wildlife. Journal of Applied Ecology 30:478-495.
BULTMAN, T. L., G. W. UETZ. 1984. Effect of Structure and Nutritional Quality of Litter
on Abundances of Litter-Dwelling Arthropods. The American Midland Naturalist
111:165-172.
BURNHAM, K. P., AND D. R. ANDERSON. 2002. Model Selection and Multi-model
Inference; A Practical Information-Theoretic Approach. Springer Science, New York,
New York.

CHAPMAN C. A., L. J. CHAPMAN, R. WANGHAM, K. HUNT, D. GEBO, L. GARDNER. 1992.
Estimators of Fruit Abundance of Tropical Trees. Biotropica 24:527-531.
CHIPLEY, R. M. 1991. Notes on the Biology of the Bridled Quail-dove (Geotrygon
mystacea). Caribbean Journal of Science 27:180-184.
CINTRA, R. 1997. Leaf Litter Effects on Seed and Seedling Predation of the Palm
Astrocaryum murumuru and the Legume Tree Dipteryx micrantha in Amazonian
Forest. Journal of Tropical Ecology 13:709-725.
COLLAR, N. J., M. J. CROSBY, AND A. J. STATTERSFIELD. 1994. Birds to Watch 2. The
World List of Threatened Birds. BirdLife International. Page Bros Ltd., Norwich,
UK.
CONCEPCIÓN, H. Y., AND R. P. TADEO. 1997. Registro de aves de la Sierra de Cubitas,
Camaguey, Cuba. El Pitirre 10:93-94.
DALSGAARD, B. 2007. Impacts of a volcanic eruption on the Forest Bird Community of
Montserrat, Lesser Antilles. Ibis 149:298-312.
FARNSWORTH, G. L., K. H. POLLOCK, J. D. NICHOLS, T. R. SIMONS, J. E. HINES, AND J. R.
SAUER. 2002. A Removal Model for Estimating Detection Probabilities from Point-
Count Surveys. The Auk 119:414-425.
FOSTER, S. A. 1986. On the Adaptive Value of Large Seeds for Tropical Moist Forest
Trees: A review and Synthesis. Botany Review 52:260-299.
GARRIDO, O. H., AND A. KIRKCONNELL. 2000. Field Guide to the Birds of Cuba. Ithaca,
NY: Comstock/Cornell University Press.
GIBBS, D. G., E. BARNES AND J. COX. 2001. Pigeons and Doves: A Guide to the Pigeons
and Doves of the World. Yale University Press, New Haven and London.
GOODWIN, D. 1983. Pigeons and Doves of the World, 3rd edition. Cornell University
Press, Ithaca, NY.
GU, WEIDONG, AND ROBERT K. SWIHART. 2004. Absent or undetected? Effects of a non-
detection of species occurrence on wildlife-habitat models. Biological Conservation
116:195-203.
HINES, J. E. (2002). PRESENCE2.0 - Software to Estimate patch occupancy rates and
related parameters USGS-PWRC.
http://www.mbr-pwrc.usgs.gov/software/presence.html.
HUTTO R. L., S. M. PLETSCHET, AND P. HENDRICKS. 1986. A Fixed-Radius Point Count
Method for Non-Breeding and Breeding Season Use. The Auk 103:593-602

JANZEN, D. H. AND T. W. SCHOENER. 1968. Differences in Insect Abundance and
Diversity between Wetter and Drier Sample units during a Tropical Dry Season.
Ecology 49:96-110.
JAMES F. C. AND H. H. SHUGART JR. 1970. A Quantitative Method of Habitat
Description. Audubon Field Notes 24:727-736.
JANZEN, D. H. 1973. Sweep Samples of Tropical Foliage Insects: Effects of Season,
Vegetation Types, Elevation, Time of Day, and Insularity. Ecology 54:687-708.
LEVINGS, S. C., D. M. WINDSOR. 1984. Litter Moisture Content as a Determinant of
Litter Arthropod Distribution and Abundance during the Dry Season on Barro
Colorado Island, Panama. Biotropica 16:125-131.
MCDONALD, L. L., 2004. Sampling Rare Populations. pp. 11-41 in W. L.Thompson, ed.,
Sampling Rare or Elusive Species. Island Press, Washington, D.C.
MACKENZIE, D. I., JAMES D. NICHOLS, GIDEON B. LACHMAN, SAM DROEGE, J. ANDREW
ROYAL, AND CATHERINE A. LANGTIMM. 2002. Estimating sample unit occupancy
rates when detection probabilities are less than one. Ecology 83:2248-2255.
MACKENZIE, D. I., AND A. J. ROYLE. 2005. Designing Occupancy Studies: General
Advice and Allocating Survey Effort. Journal of Applied Ecology 42:1105-1114.
MCSHEA W. J. AND J. H. RAPPOLE. 1997. Variable Song Rates in Three Species of
Passerines and Implications for Estimating Bird Populations. Journal of Field
Ornithology 68:367-375.
MOILANEN A. 2002. Implications of Empirical Data Quality to Metapopulation Model
Parameter Estimation and Application. Oikos 96:516-530.
NICHOLS J. D, J. E. HINES, J. R. SAUER, F. W. FALLON, J. E. FALLON, AND P. J. HEGLUND.
2000. A Double Observer Approach for Estimating Detection Probability and
Abundance from Point-Counts. The Auk 117:393-408.
POLLOCK, K. H. 1982. A Capture-Recapture Design Robust to Unequal Probability of
Capture. Journal of Wildlife Management 46:752-757.
REED, L. L., L. B. MENDEL, AND H. B. VICKERY. 1932. The nutritive properties of the
"crop-milk" of pigeons. American Journal of Physiology 101:285-292.
RICHARDS, D. G. 1981. Environmental acoustics and censuses of singing birds. Studies
in Avian Biology 6:297-300.

ROYLE, A. J. AND JAMES D. NICHOLS. 2003. Estimating abundance from repeated
presence-absence data or point counts. Ecology 84:777-790.
ROYLE, A. J. 2004. N-Mixture models for estimating population size from spatially
replicated counts. Biometrics 60:108-115.
RIVERA-MILAN, F. F. 1992. Distribution and relative abundance patterns of Columbids in
Puerto Rico. The Condor 94:224-238.
RODRÍGUEZ, D., AND B. SÁNCHEZ. 1993. Ecology of Cuban Terrestrial Doves (Genus
Geotrygon and Starnoenas). Poeyana 248:1-20.
SAUER J. R., B. G. PETERJOHN, AND W. A. LINK. 1994. Observer Differences in the
North American Breeding Bird Survey. The Auk 11:50-62.
SCHILTHUIZEN, M., H. N. CHAI, AND T. E. KIMSIM. 2003. Abundance and Diversity of
Land-Snails (Mollusca: Gastropoda) on Limestone Hills in Borneo. The Raffles
Bulletin of Zoology 51:35-42.
SCHMIDT B. R. AND J. PELLET. 2005. Relative Importance of Population Processes and
Habitat Characteristics in Determining Sample unit Occupancy of Two Anurans.
Journal of Wildlife Management 69:884-893.
SCHUPP, E. W. 1989. Factors Affecting Post-dispersal Seed Survival in a Tropical Forest.
Oecologia 76:525-530.
SEAMAN, G. A. 1966. Foods of the Quail-Dove (Geotrygon mystacea) in the American
Virgin Islands. Caribbean Journal of Science 6:177-179.
SEASTEDT, T. R. 1983. A Two Year Study of Leaf Litter Decomposition as Related to
macroclimatic factors and Microarthropod Abundance in the Southern Appalachians
Holarctic Ecology 6:11-16.
SEIFRIZ, W. 1943. The Plant Life of Cuba. Ecological Monographs 13:375-426.
SKUTCH, A. F. 1949. Life History of the Ruddy Quail-dove. The Condor 51:3-19.
SKUTCH, A. F. 1991. Life of the Pigeon. Cornell University Press. Ithaca, N.Y.
SMYTHE, N. 1970. Relationships between Fruiting Seasons and Seed Dispersal Methods
in a Neotropical Forest. American Naturalist 104:25-35.
SORK V. L. 1985. Germination Response in a Large-Seeded Neotropical Tree Species,
Gustavia superba (Lecythidaceae). Biotropica 17:130-136.
STATTERSFIELD, A. J., M. J. CROSBY, A. J. LONG, AND D. C. WEGE, EDITORS. 1998.
Endemic Bird Areas of the World: Priorities for Biodiversity Conservation. BirdLife
International, Cambridge, UK.
SUTHERLAND, W. J, I NEWTON, AND R. E. GREEN. 2004. Bird Ecology and Conservation:
A handbook of techniques. Oxford University Press Inc., New York.
THOMPSON W. L. EDITOR. 2004. Sampling Rare or Elusive Species. Island Press,
Washington, D.C.
TYRE, A. J., B. TENHUMBERG, S. A. FIELD, D. NIEJALKE, K. PARRIS, AND H. P.
POSSINGHAM. 2003. Improving Precision and Reducing Bias in Biological Surveys:
Estimating False-Negative Error Rates. Ecological Applications 13:1790-1801.
WILSON D. M., AND J. BART. 1985. Reliability of Singing Bird Surveys: Effects of Song
Phenology During the Breeding Season. The Condor 87:69-73.
YOCCOZ N. G., J. D. NICHOLS, AND T. BOULINIER. 2001. Monitoring of Biological
Diversity in Space and Time. Trends in Ecology and Evolution 16:446-453.


