Page 1
CHAPTER 13 + 14 HW: SPECTROSCOPY
INFRARED (IR) SPECTROSCOPY
1. A compound containing an NH2 group should have two peaks in its IR spectrum in the 3100-3500 cm-1 range. Explain why there are two absorbances in this region, and use a drawing to show the type of vibration that produces each peak.
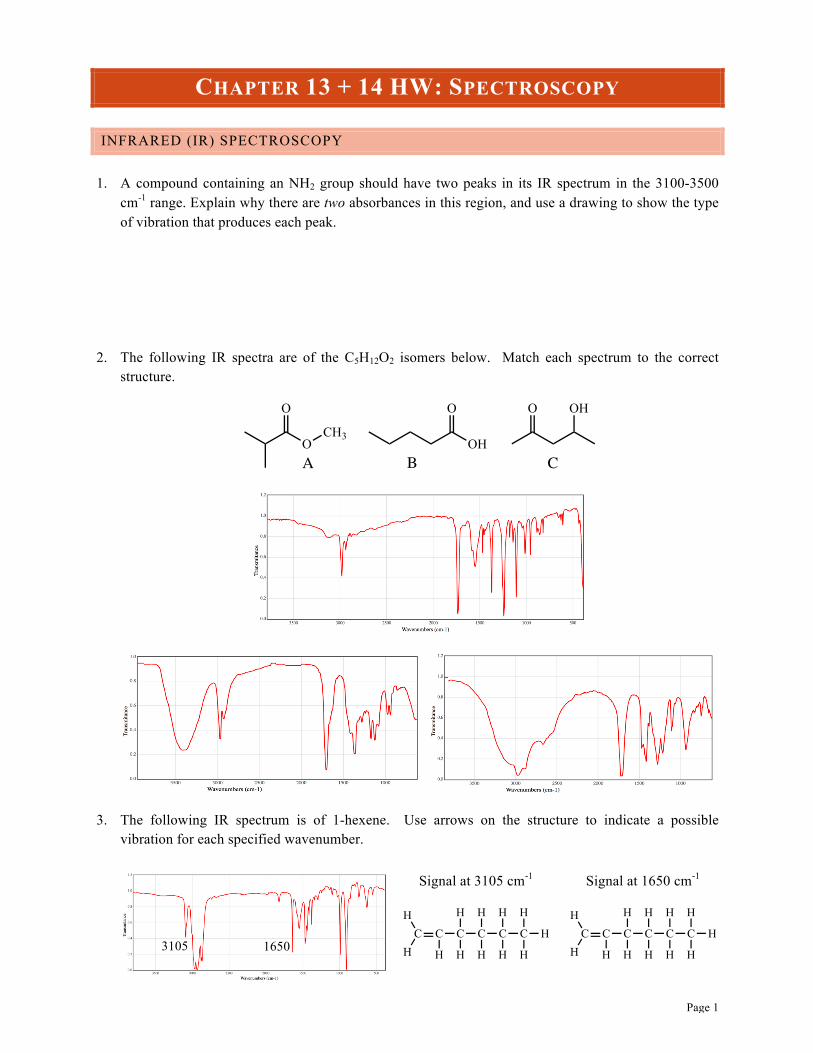
2. The following IR spectra are of the C5H12O2 isomers below. Match each spectrum to the correct structure.
3. The following IR spectrum is of 1-hexene. Use arrows on the structure to indicate a possible vibration for each specified wavenumber.
Signal at 3105 cm-1
Signal at 1650 cm-1
O
O
CH3OH
O O OH
A B C
C C
H
C
H
H
C
H
H
C
H
H
C
H
HH
HH C C
H
C
H
H
C
H
H
C
H
H
C
H
HH
HH
3105 1650

Page 2
4. The following IR spectrum is of 3-pentanone. Use arrows on the structure to indicate a possible vibration for each specified wavenumber.
Signal at 2997 cm-1
Signal at 1712 cm-1
5. Which of the following structures would produce the IR spectrum below?
GENERAL CONCEPTS OF NMR
6. Explain in general what happens inside an NMR instrument when a compound absorbs radiation of the radio frequency.
7. Briefly explain why deuterated solvents are used in preparing samples for NMR analysis.
C
H
C
H
H
C
O
C
H
H
C
H
H
H
H
H C
H
C
H
H
C
O
C
H
H
C
H
H
H
H
H
OHO
A B C D
2997 1712

Page 3
CHEMICAL EQUIVALENCE
8. How many signals should ideally be present in the 1H NMR spectrum of each compound (how many different hydrogen environments are present)? Use labels (a,b,c…) to show which hydrogen atoms should be grouped together.
CHEMICAL SHIFT
9. Use a discussion of shielding to explain why hydrogen “A” absorbs at a higher frequency than hydrogen “B” in an NMR instrument. Use diagrams with your answer.
10. In each pair, which of the hydrogen atoms nearest the asterisks (*) should produce the furthest left signal in the 1H NMR spectra? Briefly explain each comparison.
Oa.O
b. Oc.
H
Od.
CH3
CH3
e.
NH2
H2N
f.
Cl C
H
C
H
H
HCl
A B
OCH3
vs.a. * * Br Br
Brb.
** vs.

Page 4
11. Using an NMR correlation chart, assign the signals in the 1H NMR spectrum (a-c) to hydrogen atoms in the structure. (Note: signal “a” contains groupings that coincidentally overlap.)
SIGNAL SPLITTING
12. For the carboxylic acid below…
a. What is the expected splitting (singlet, doublet, etc.) for each hydrogen atom?
Signal Ha Hb Hc
Splitting
b. Using the nuclear orientation of the neighbors, explain the origin of the splitting for hydrogen
atoms a +b. Use a diagram with your answer.
Splitting for Hb:
Splitting for Ha:
O
O
02468PPM
a bc
Br C
H
Br
C
H
H
C
O
OH
a b
c

Page 5
13. For the molecule below….
a. What is the expected splitting (singlet, doublet, etc.) for each hydrogen atom?
Signal Ha Hb Hc Hd He
Splitting
b. Using the nuclear orientation of the neighbors, explain the origin of the splitting for hydrogen “d.”
c. Sketch a drawing of the splitting pattern for the following hydrogen atoms as accurately as possible. In each, state the relative heights of the lines in each signal (for example the lines of a triplet will be in the ratio of 1:2:1).
Signal Ha Hb Hd
Splitting drawing
ab
c de
O

Page 6
DRAWING 1H NMR SPECTRUM FROM STRUCTURE
14. Draw the expected 1H NMR spectrum for each compound, paying attention to chemical shift and splitting. Mark the integration of each peak, then assign each peak in the NMR to hydrogen atoms in the structure.
8 7 6 5 4 3 2 1 0 ppm
H3CC
CH2CH3
Oa.
8 7 6 5 4 3 2 1 0 ppm
b.
H3CC
O
H3C CH3
CH2 CH3
8 7 6 5 4 3 2 1 0 ppm
c.
H3C C
H
CH3
Br
8 7 6 5 4 3 2 1 0 ppm
d.
BrCH
CH2
Br
CH2 Br

Page 7
DEGREES OF UNSATURATION
15. Calculate the degrees of unsaturation associated with each chemical formula. Then circle the structures beside it that are possible for the formula (which match the degrees of unsaturation).
DETERMINING STRUCTURE FROM AN 1H NMR SPECTRUM
16. Draw the structure that matches the molecular formula and would produce the 1H NMR spectrum for each problem below. Then assign all peaks in the NMR spectrum (use labels a,b,c) to hydrogen atoms in the structure.
a. C5H10
b. C6H10O2
OH
OHO
OHO
OH3CO
O
c. C7H6Br2 Br
Br
Br
Br BrBr
CH3
Br
Br
d. C5H9NOH2N
O
O
NH2
NH2
OH
O
NH2
02468PPM
1H, m
6H, d
5H total
C9H12
0246810PPM
2H, quint.
3H, t
1H, t
C3H6O

Page 8
17. The following four 1H NMR spectra correspond to four different alcohols with a molecular formula of C5H12O. Determine which alcohol corresponds to which spectrum, then assign the peaks in the spectrum to hydrogen atoms in each structure.
012345PPM
2H, m
3H, t
1H, s
2H, t
4H, m
012345PPM
1H, s1H, sext.
3H, t
3H, d
4H, m
012345PPM
1H, s
6H, s
2H, q 3H, t
012345PPM
1H, s
2H, t
1H, m
6H, d
2H, q

Page 9
18. Draw the structure that matches the molecular formula and would produce the 1H NMR spectrum for each problem below. Then assign all peaks in the NMR spectrum (use labels a,b,c) to hydrogen atoms in the structure.
012345PPM
2H
3H
3H
C4H8O2
012345678PPM
2H 2H
3HC7H7Cl
01234PPM
2H, t 2H, t
9H, sC7H13BrO

Page 10
18 continued
02468PPM
5H, m2H, t
2H, t1H, s
C9H13N3H, s
0123PPM
2H
3H
2H1H
3H
C4H11N
02468PPM
2H, d 2H, d
1H, s
3H, d
1H, q
C8H9BrO

Page 11
CARBON-13 NMR SPECTROSCOPY
19. List two differences between 13C NMR and 1H NMR spectroscopy, or the spectra they produce.
20. Determine the total number of signals present in the 13C spectrum of each compound. Then use a correlation chart to indicate the approximate frequency in ppm of each carbon pointed to with an arrow.
Compound
Number of signals in 13C NMR
Approximate ppm of indicated carbon
21. An unknown is narrowed down to be one of the three structures below. How can the 13C NMR
spectrum of the unknown be used to determine the compound’s structure?
22. Assign all peaks in the 13C NMR spectrum (use labels A,B,C) to carbon atoms in the structure.
Cl
Cl
O
O
H3CO
OH
HO
OH OH
OH
OH
OCH3
O

Page 12
COMBINED SPECTROSCOPY PROBLEMS
23. Below are 5 possible structures with a formula of C3H6O2. Identify which of the molecules A-E “fit” each piece of data. In many cases more than one compound matches each piece of data.
Data Which match?
The IR spectrum contains a large, broad peak around 3300 cm-1.
The 1H NMR spectrum has a signal at 9.5 ppm.
The IR spectrum contains a strong peak at 1745 cm-1. (Assume this signal represents exactly what it suggests from the correlation chart.)
All signals in the 1H NMR spectrum are singlets.
The 1H NMR spectrum contains a quartet integrating to 2H at 4.0 ppm.
24. Which compound from the previous problem (A-E) would have the following IR signals and 1H
NMR spectrum? After identifying the compound, assign the IR signals to bonds in the molecule (fill in the table), and assign each peak in the 1H NMR spectrum to hydrogen atoms in the structure. Key IR signals:
Frequency (cm-1) Intensity Bonds represented
3210 to 3420 strong +broad
2955 strong
1725 strong
O
OHH
O
H
O O
OCH3 H
O
O
OH
OHA B C D E
012345678910PPM
1H, t
1H
2H, t
2H, q

Page 13
25. Use the chemical formula and given spectra (1H NMR, 13C NMR, and/or IR spectra) to determine the structure of each compound. Then assign each peak in the 1H NMR spectrum to hydrogen atoms in the structure.
a. C8H6O2
b. C5H12O
0246810PPM
1H NMR
2H, s
4H, s
050100150200PPM
13C NMR
020406080PPM
012345PPM
6H, t
1H, quint.
1H NMR
13C NMR
1H, s
4H, quint.
IR:

Page 14
c. C5H8Br2O
d. C10H15N
012345678PPM
4H, q6H, t
2H, t2H, d
1H, t

Page 15
e. C12H16O2
2980
3050
3450
1740
012345678PPM
5H, m
1H, m
2H, s
2H, d
6H, d


