Chapter 10
Introduction to Chromatography

Separation
Important areas in this chapter: Basic concepts; partition coefficient; retention time;
capacity factor; selectivity factor; band broadening;
relationship between plate height and column
variables; optimization of column performance;
qualitative applications; quantitative applications:
peak height; peak areas; internal
calibration.

Chromatographic separations
Sample is dissolved in a mobile phase (a gas, a
liquid or a supercritical fluid);
The mobile phase is forced through an immiscible
stationary phase which is fixed in place in a
column or on a solid surface.
The two phases are chosen so that the components
of the sample distribute themselves between the
mobile and stationary phase to a varying degree.

Classification of chromatographic methods:
1. physical means
column chromatography: stationary phase is held in
a narrow capillary through which the mobile phase is
forced under pressure or by gravity;
planar chromatography: stationary phase is
supported on a flat plate or in the interstices of a
paper. The
mobile phase moves through the stationary phase by
capillary action or under the influence of gravity.

2. mobile and stationary phases
• Liquid chromatography
• Gas chromatography
• Supercritical-fluid chromatography


Separation of a
mixture of
components A and
B by column elution
chromatography. (b)
The output of the
signal detector at
the various stages of
elution shown in (a).

The small peak on the left represents a species that is not
retained on the column and so reaches the detector almost
immediately after elution is started. Thus its retention time tM is
approximately equal to the time required for a molecule of the
mobile phase to pass through the column.
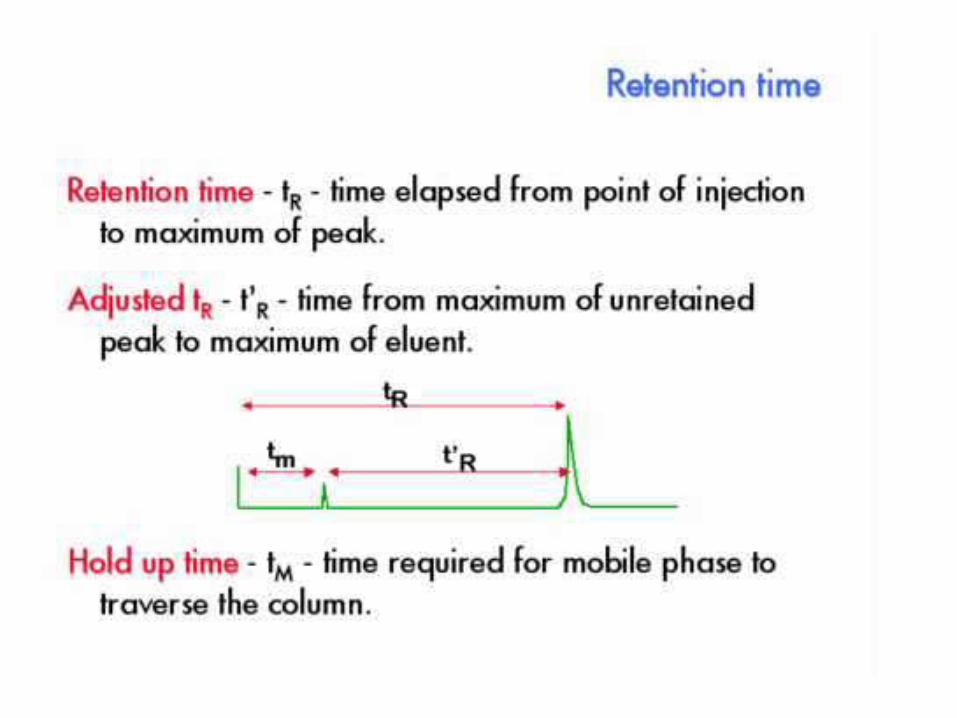
A typical chromatogram for a two-component mixture

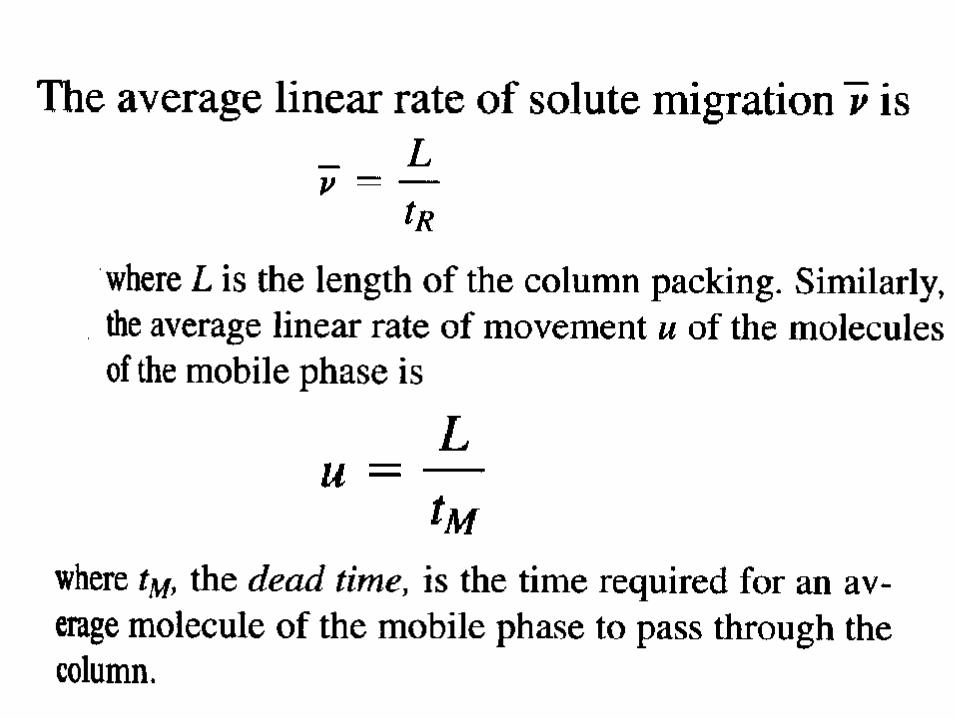
Retention time, tR:
tR is the time it takes after a sample injection for the
analyte peak to reach the detector.
tM is the time for the unretained species to reach the
detector, dead time. The rate of migration of the
unretained species is the same as the average rate of
motion of the mobile phase molecules.

Retention time and retention volume

Concentration profiles of analyte bands A and B at two different
times in their migration down the column. The times t1 and t2
are indicated in the figure above

Effects of migration rates and band
broadening on resolution
longer column distance enable peaks separated
better, but with more peak broadening, which
lowers the efficiency of the column as a separating
device.

(a) original chromatogram with overlapping peaks; improvements brought
about by (b) an increase in band separation, and (c) a decrease in band spread.
Methods of improving separators

Partition (distribution) Coefficient
Mobile stationary
As K increases the solute takes a longer time to elute
Partition Coefficient Independent of conc., but
Temperature dependent
coefficient

• K should be constant over a large range of
concentration range.
• Cs is directly proportional to CM
• Chromatography where this equation holds is linear
chromatography
Partition Coefficient, K

The relationship between retention time and
partition coefficients: relate tR with K
= x fraction of time an analyte spends in
mobile phase
= x (moles of analyte in mobile phase/total
mole of analyte)
= x (CM x VM / (CM x VM + Cs x Vs ))
= x (1 / ( 1 + Cs x Vs /CM x VM ))
v u
u
uu
tR = X L v
(1)
(2)
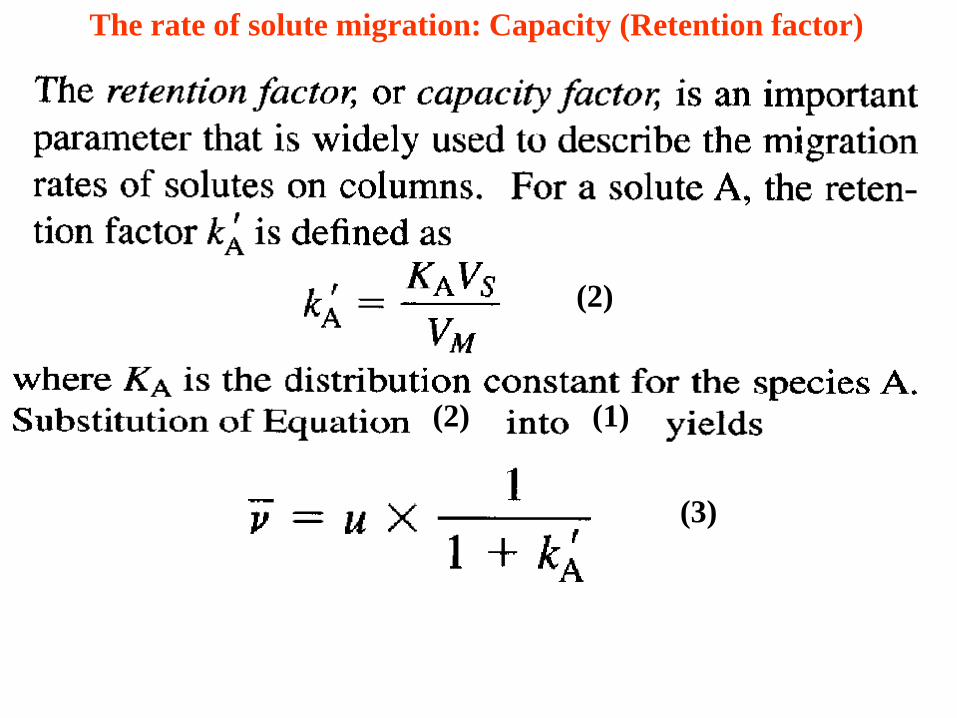
The rate of solute migration: Capacity (Retention factor)
(2) (1)
(3)

Substituting and from the above equations into
equation (3) yields v u

• When capacity factor is less than 1,
elution occurs so rapidly that accurate
determination of tR is difficult as a result
of peak broadening
• When capacity factor is >20 to 30, elution
times become too long.
• Ideally, separation occurs under
conditions of capacity factors in the range
of 1 to 5

The selective factor a
KB is the partition coefficient for the more strongly retained
species. Thus, a, is always >1

Since K’A can be expressed as:
Then,
Consequently,
since

Retention Volume, Vr
• Vr : Volume of mobile phase required to
elute sample component (move completely
from column)
• Vr = tr X F
• Since

k'1
1 X
V
LXF
V
LXF
AMr
X V
VMr
11
Ak'1
1
Vr can be obtained from the chromatogram
since Vr = tr X F

•Mobile phase volume is proportional to
column length. So retention is also
increased for longer columns
•As peaks travel through the column, they
broaden.
•Peak width increases with the square
root of column length
•Thus, longer columns wont give better
resolution

Methods for describing column efficiency
Theoretical plates
• In solvent extraction, a plate is represented by each
equilibrium (extraction) is conducted
• In chromatographic column, the plates are
theoretical
• The number of theoretical plates can be estimated
based on peak retention times and widths

Column Efficiency - Theoretical Plates (Quantitative measures of separation efficiency)
LH
H
LN
N
H
2
plates ofnumber
height plate
is the standard deviation of measurements
Efficiency is defined in terms of variance per unit length
Distribution of molecules along the length of
The column at the moment the analyte peak reaches
the end of the column

Relation between column length and
retention times
R
R
R
tL
tL
t
L
/
in timedeviation standard
timeretention
distancein deviation standard
(distance)length column

2
22
16
4
4
R
R
R
R
t
LW
LH
t
LW
W
t
L
tL
• Low H values achieve better separation
•In GC H < 1 to 3 mm
•In HPLC, H is one to two orders of magnitude lower

Determining the Number
of Theoretical Plates
peakofwidthbaseeapproximat
timeretention
16
pates ofnumber
2
W
t
where
W
tN
N
R
R= L/H
W is derived from the intersection of the baseline
with tangents drawn through inflection points on the
sides of each peak

Experimental determination of N
• Measuring the peak width is not always
simple
• The peak may co-elute with another
• The low detector sensitivity may result
in a difficulty in finding the start and
the end of the peak
• Is there an alternative way?
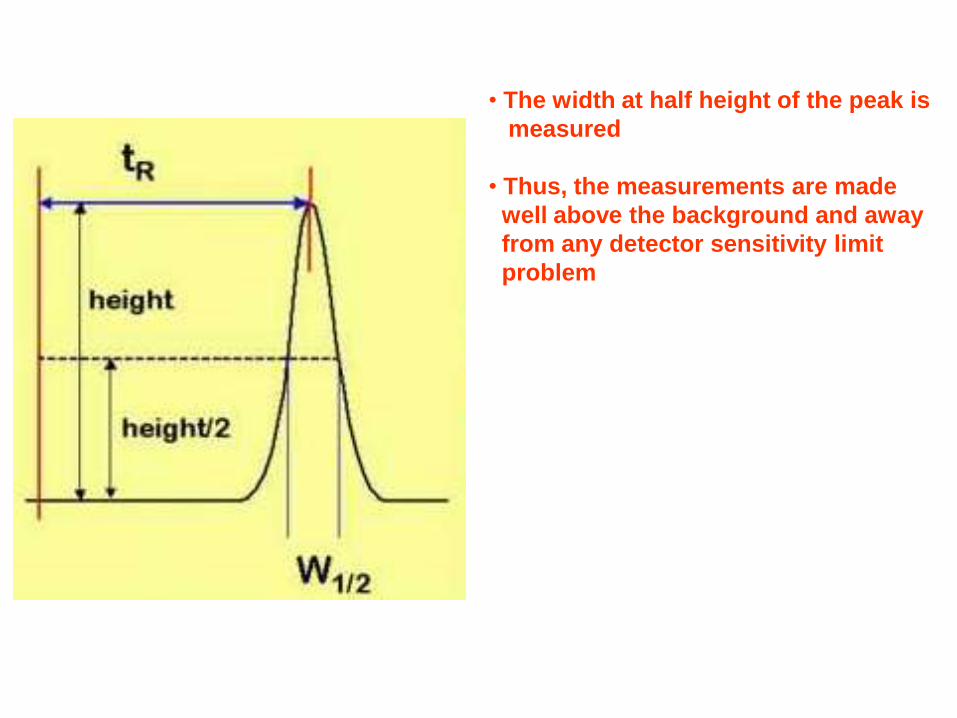
• The width at half height of the peak is
measured
• Thus, the measurements are made
well above the background and away
from any detector sensitivity limit
problem

• Since the peak is Gaussian, the number of
plates, N, can be determined by the following
modified formula
)(54.52/1W
tN R
For a fixed length column the height equivalent to a
theoretical plate , H, can be determined from the
equation:
H = column height/N

Column Resolution
• Column resolution, Rs, provides a
quantitative measure of the ability of
the column to separate two analytes
• It is s measure of how completely two
neighboring peaks are separated from
one another

Column resolution
B
B
B
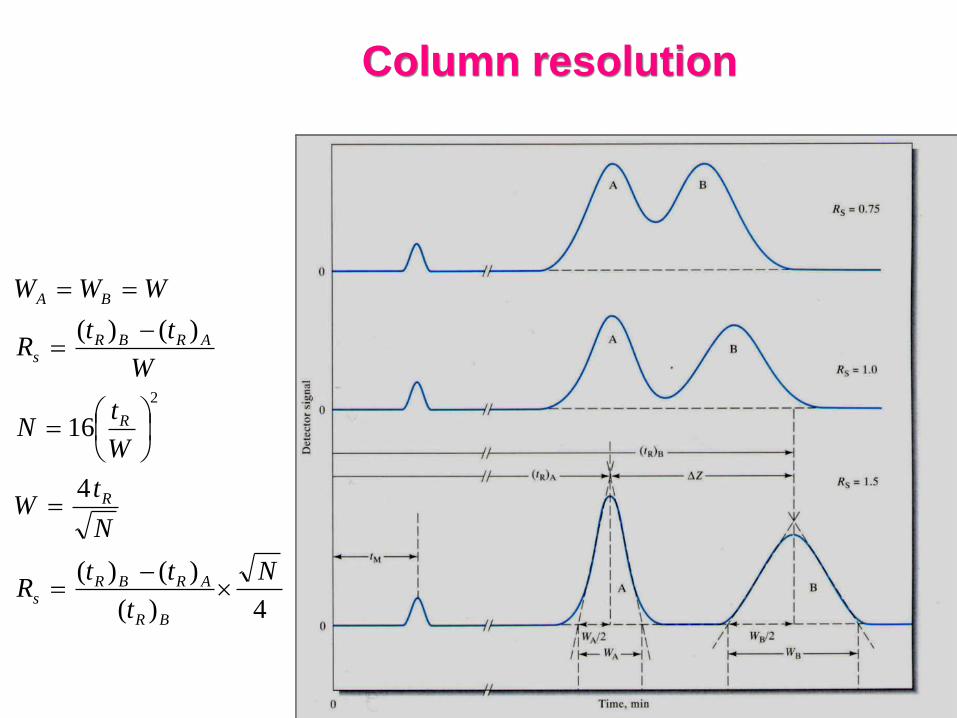
Column resolution
4)(
)()(
4
16
)()(
2
N
t
ttR
N
tW
W
tN
W
ttR
WWW
BR
ARBRs
R
R
ARBRs
BA

Sample Capacity
• It is the amount of sample that can be
sorbed onto a particular stationary
phase before overloading occurs
• Exceeding the capacity results in :
asymmetric peaks, change in retention
time, loss of resolution.
• Sample capacity is proportional to Vs

Chromatographic Compromise
• Sample capacity, speed and resolution are
dependent. Any one of the 3 can be improved
at the expense of the other 2.
• Always there is a compromise
• In LC, speed and resolution are desired.
Sample capacity is not important provided
that detectable amount of sample is
separated
• In preparative LC, speed is usually sacrificed

Kinetic variables affecting band broadening
• Band broadening is a consequence of the
finite rate at which several mass-transfer
processes occur during migration of a
species down a column.
• Some of theses rates are controllable by
adjustment of experimental variables, thus
permitting improvement of separation


Effect of flow rate of mobile phase
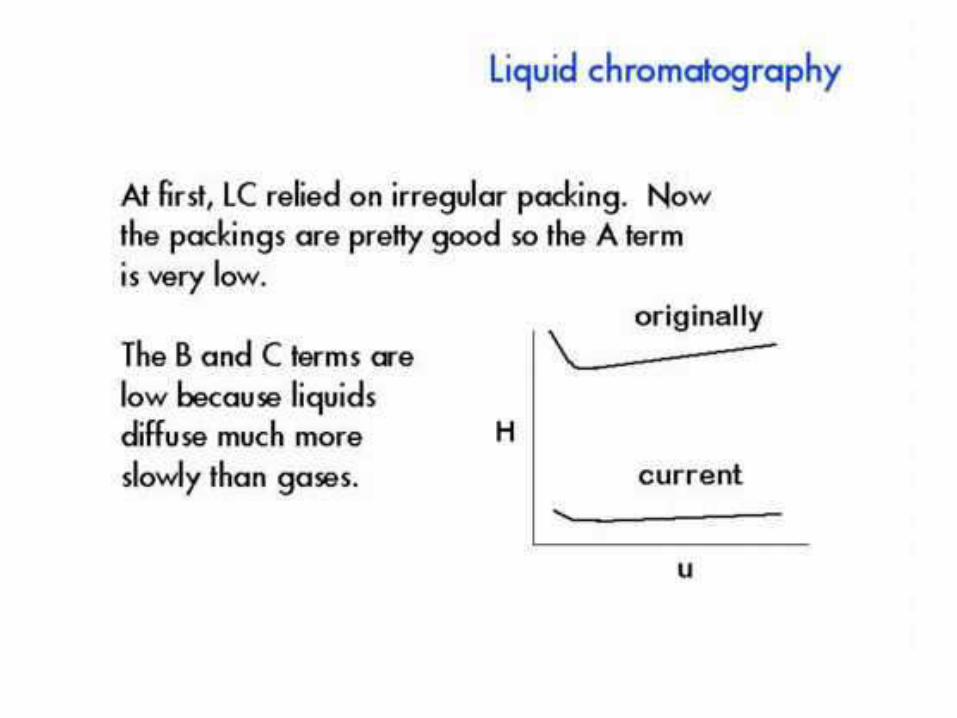
Liquid chromatography
Gas chromatography

Relationships between plate heights and
column variables
Van Deemter Equation
Modified Van Deemter Equation

(Longitudinal diffusion)
to and from liquid
Stationary phase and in mobile phase

relationship between plate height and column variables
Multiple flow path
Longitudinal diffusion Mass transfer between phases
Van Deemter Equation
Modified Van Deemter Equation
(Eddy diffusion)

Van Deemter eq.
in the Table above

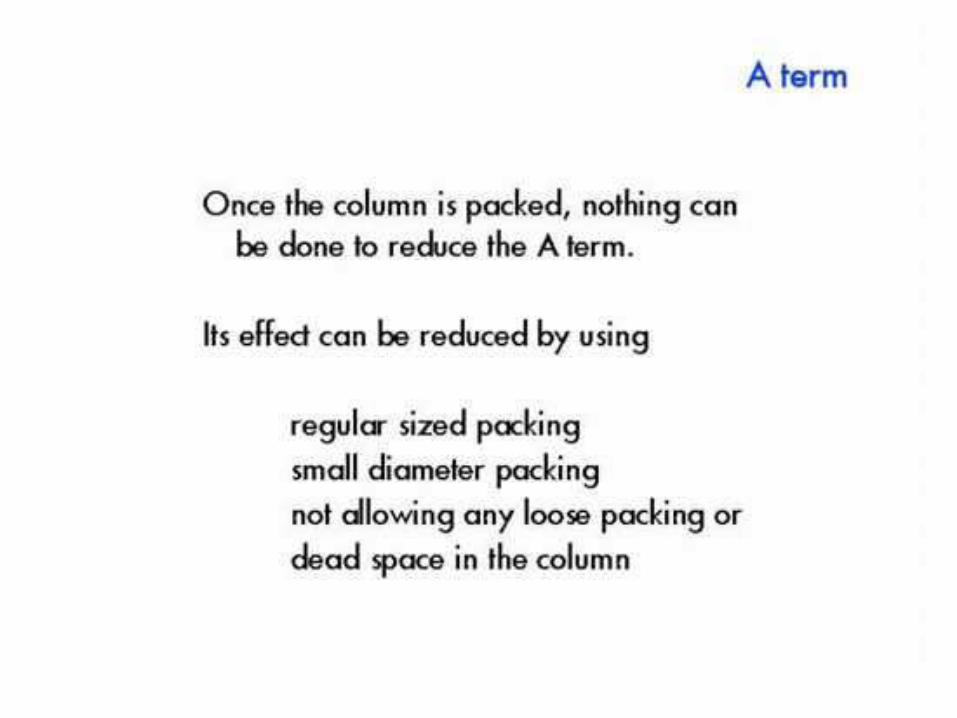
Multiple Pathways (Eddy diffusion)


Eddy Diffusion

Eddy Diffusion
A = 2ldR
where l => packing factor
dR => average diameter of particle
• caused by many pathways
• minimized by careful packing

Longitudinal Diffusion: B/u
Column
Diffusion


Longitudinal Diffusion

Longitudinal Diffusion B//u
B = 2yDM/u
where y =>obstruction factor
DM => diffusion coefficient of solute in the mobile phase
• minimized by lowering temperature of column oven and decreasing flow rate

(Cs+ CM)u Term: Resistance to mass transfer
It takes time for
a solute to reach
equilibrium between
the two phases
Thick or viscous
stationary phases
have larger terms
Thus, there is a lower
rate of mass transfer
and an increase in
plate height

Csu Term
• Csu differs depending upon the stationary phase (l or s)
– When stationary phase is liquid, Csu is directly proportional to d2
f and inversely proportional to diffusion coefficient of species in the film
– When stationary phase is solid, Csu is directly
proportional to the time required for the species to be adsoebed or desorbed

Cmu Term
• Cmu is inversely proportional to diffusion coefficient of the
analyte in the mobile phase and some function of the square of
the particle diameter of the packing d2p

• The points on the upper curve are experimental.
•The contributions of the various rate terms are shown by the lower curves: A,
multiple path effect; B/u, longitudinal diffusion; Cu, mass transfer for both
phases.
H
van Deemter plot for a packed liquid
chromatographic column

Effect of particle size on plate height. The numbers to the right
are particle diameters.
Two important variables: diameter of the column and
the diameter of the particles packed in the column


Applications of Chromatography
• Qualitative Analysis
• Quantitative Analysis
– Analyses Based on Peak Height
– Analyses Based on Peak Areas
– Calibration and Standards
– The Internal Standard Method
– The Area Normalization Method

GC & LC Qualitative and Quantitative Analysis

Qualitative analysis: Main approach
• GC is a blind method that indicates the presence of a
substance but not what it is.
• Qualitative analysis is based upon comparison of retention data that are characteristics but not unique
• Retention data used :
– Retention time,
– retention distance,
– retention volume
• These are dependent upon: Column dimensions, liquid phase (type and amount), column temperature, flow rate, type of carrier gas, packing density, pressure drop

Factors affect tR from two different columns of
the same type • Packing density
• Liquid loading
• Activity of the support
• Age & previous use of the packing
• Variation in composition of the column wall
• Thus, when two separate columns must be used, Relative Retention date is preferred.
• Since tR values are characteristic of a particular sample in the column conditions but are not unique!!
– run the unknown sample immediately before or immediately after the standard; and all conditions are the same.


• Component 1 is used as the reference; it should be
present or added to the sample and compatible with the
sample
• Peak of component 1 must be close (but resolved) to the
sample peak

• Relative retention eliminates variations in
– Column diameter and length
– liquid phase loading
– Carrier flow rate
– Others
• Referring the sample to 2 references gives different results
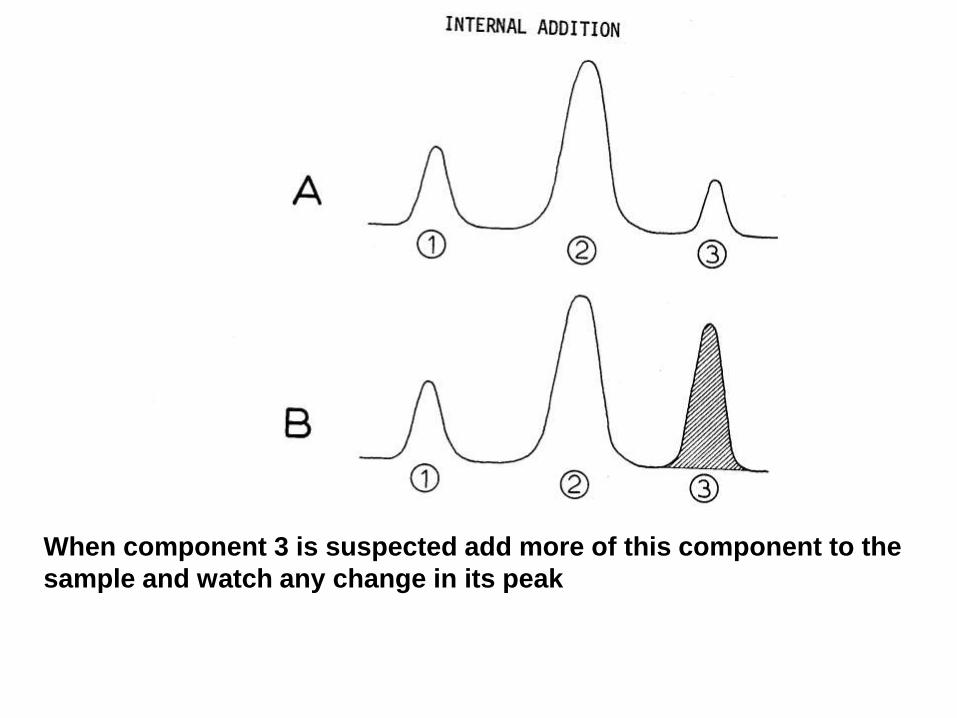
When component 3 is suspected add more of this component to the
sample and watch any change in its peak


• Only 3 compounds are needed to establish the line
• The line can be used to identify other members of the Same
homologous series

Homologous and Pseudo-homologous Series:
Alkanes,
Olefins
Aldehydes,
Ketones,
Alcohols,
Acetates
Acetals,
Esters,
Sulfoxides
Nitroderivatives
Aliphatic amines
Pyridine homologs.
Aromatic hydrocarbons, dialkyl ethers,
thiols, alkylnitrates, substitute tetrahydrofuran,
tetrahydrofuran

Kovats Retention Index, R.I. • R.I. indicates where a compound will appear with
respect to normal paraffins
• R. I (n-paraffins) (by definition) =
# C atoms x 100
(regardless of column or conditions)
• R.I of any solute is derived from a chromatogram of a mixture of the solute + at least two normal paraffins having t'R close to that of the solute.
• R.I. values change with column
• They are used for qualitative analysis
• R.I values are meaningless without the conditions being reported


Quantitative Analysis
Steps :
• Sampling
• Sample preparation
• Chromatography
• Integration
• Calculations
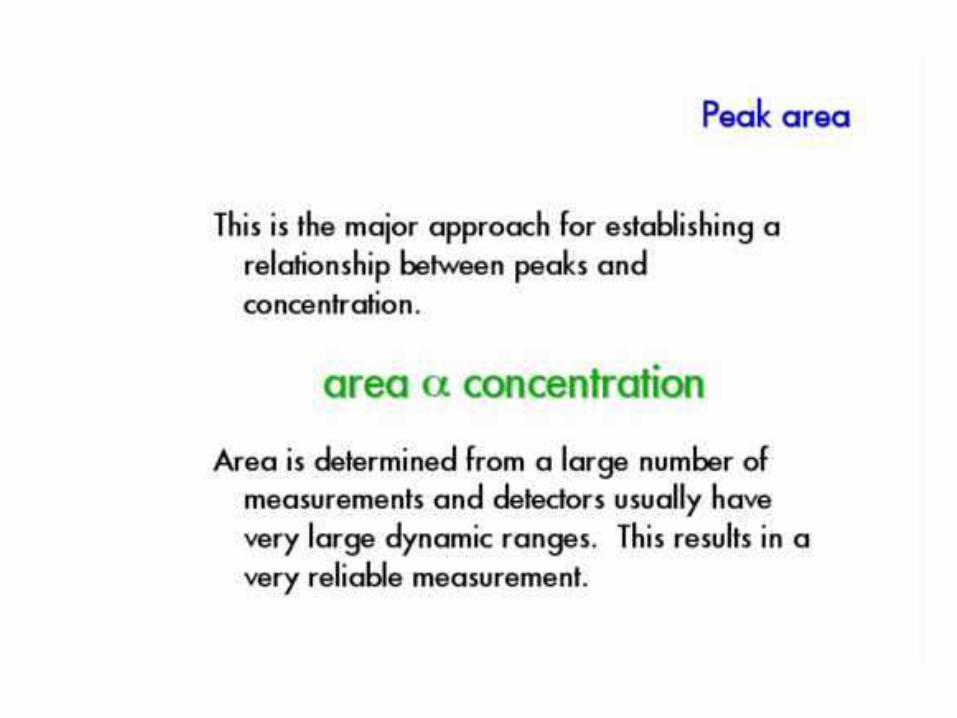
• Peak height or peak area are the basis for quantitative analysis

Basis for Quantitative Analysis • The peaks in the chromatogram are the basis for
quantitative analysis Peaks of interest should fulfill the following requirements:
• must be undistorted • must be well separated • Must have a large S/N ratio • must have a flat aseline Peak shape: The ideal chromatographic peak is
symmetric and narrow
To get symmetrical peaks following should emphasized: * Clean entry through the septum * Rapid depression of the syring plunger * Quick withdrawal of the syringe * Choosing proper column conditions * Temperature programming helps avoiding the
broadening of the later peaks in an isothermal
techniques.

Peak separation • The resolution of at least 1 must be achieved for all
peaks of interest • If the two peaks are fused together, dropline technique
should be considered first, where the fused peaks are separated by dropping a perpendicular from the vally between them to the baseline.
Peak size • Most appropriate peak is a big one on a quite flat
baseline.
Linear range • It is desirable to operate in the linear range of the
detector system. • When the linear range of the detector is narrow it is
often necessary to make several dilutions until a linear range is found.
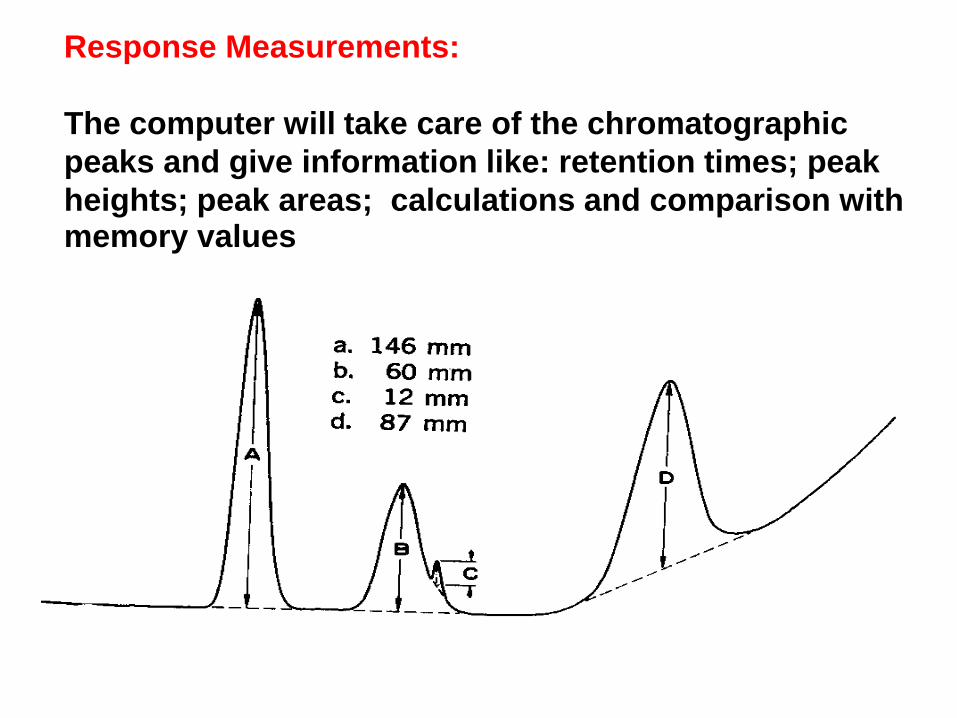
Response Measurements:
The computer will take care of the chromatographic
peaks and give information like: retention times; peak
heights; peak areas; calculations and comparison with memory values

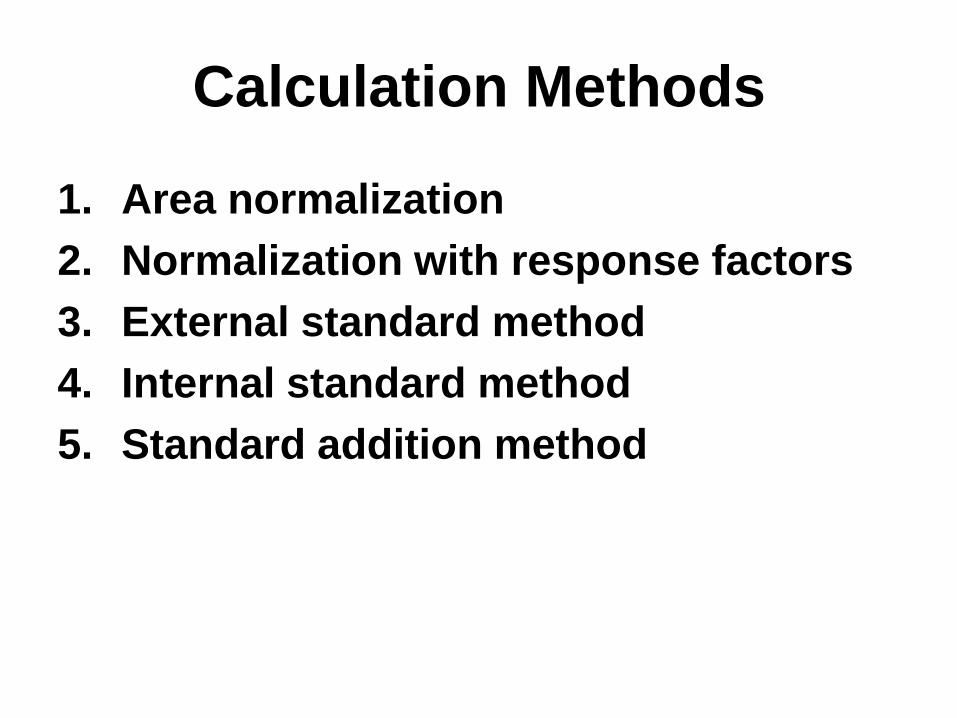
Calculation Methods 1. Area normalization
2. Normalization with response factors
3. External standard method
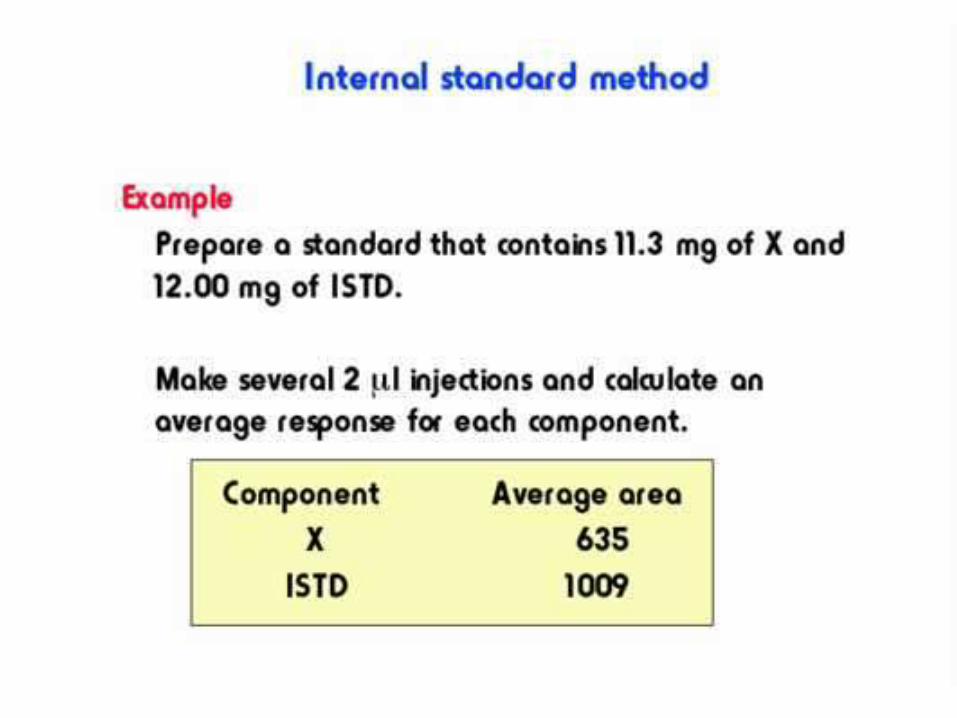
4. Internal standard method
5. Standard addition method

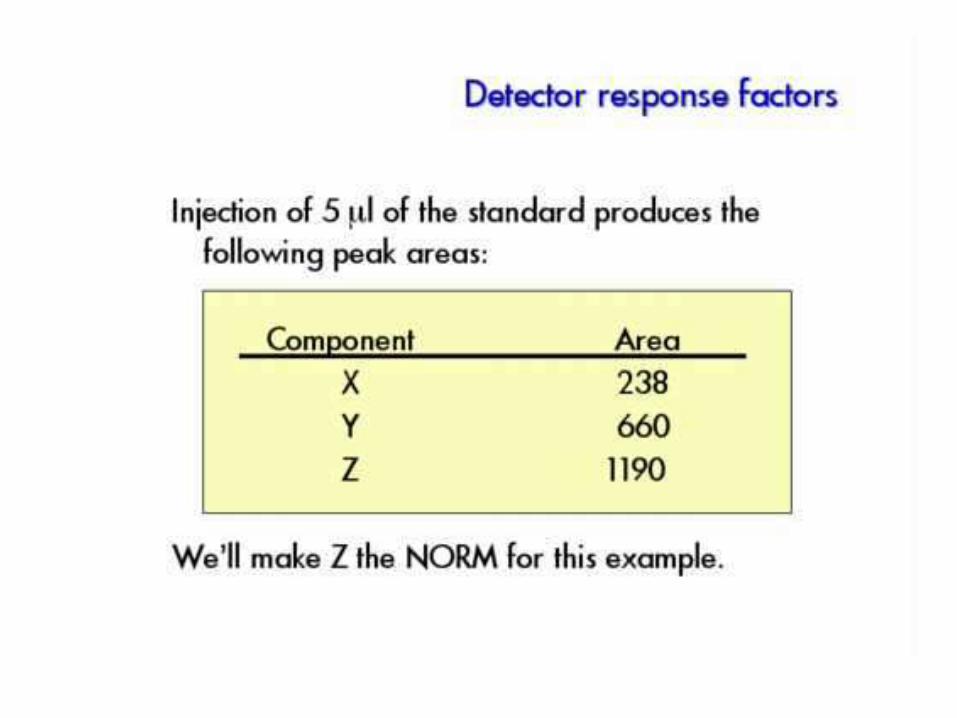
1. Area normalization (Internal normalization)
2. Normalization with response factors