
RReturns to Ed
CE
ducatio
Doro
Lyn
Jona
Den
Tim
A
EE DP 2
n: Evid
othe Bon
nn Cher
athan Ha
nise Haw
m Spect
April 200
22
dence fr
njour
kas
askel
wkes
tor
02
rom UKK Twins
ISSN 2045
s
5-6557
Published by Centre for the Economics of Education London School of Economics and Political Science Houghton Street London WC2A 2AE Dorothe Bonjour, Lynn Cherkas, Jonathan Haskel, Denise Hawkes and Tim Spector, submitted February 2002 ISBN 0 7530 1483 1 Individual copy price: £5 The Centre for the Economics of Education is an independent research centre funded by the Department for Education and Skills. The views expressed in this work are those of the authors and do not necessarily reflect the views of the DfES. All errors and omissions remain the authors.

Nontechnical Summary
Returns to Education: Evidence from UK Twins
A particularly robust correlation in economics is that more educated people have higher
earnings. Does this mean that a randomly selected person who invests in more education will
earn higher wages? Two opposing interpretations have been proposed:
a) That the relation is causal: education raises productivity and higher productivity raises
wages.
b) That the relation is spurious: more able people (higher ability, more favourable family
background) are more productive and get a higher wage, but such people acquire more
education to signal their high ability and/or because it is easier for them.
It is therefore not clear whether a simple relation between earnings and education can be
interpreted as a return to education for a randomly selected person. To make such an
interpretation, one must convincingly control for factors such as ability and family
background that might both affect the choice of education and the wage. If the second
interpretation is (partially) true and if there is no control for ability and family background
estimations would (overstated) find positive returns to education. This situation is referred to
as ability bias in the literature.
The present paper attempts to control for ability and family background to avoid
ability bias by using a new data set of identical UK twins. We administered a questionnaire
to around 6,600 individuals (3,300 same-sex twin pairs) in June 1999, all of whom are on the
St. Thomas' UK Adult Twin Registry, based at the Twins Research and Genetic
Epidemiology Unit, St. Thomas' Hospital, London, England. As well as the detailed medical
information on the questionnaire, which covers sex, age, childbearing etc., we asked the twins
additional socio-economic questions on earnings, occupation and schooling. We also asked
each twin to report on the schooling of the other. At time of writing we have available data
on 1,698 identical twins, of whom 428 comprise 214 identical twin pairs with complete wage
and schooling information.
Identical twins have the great advantage, relative to other siblings, of being genetically
identical and growing up in the same environment. Only a very small number of twins on the
Twin Registry have been raised apart. Thus, they provide an ideal test for the two
hypotheses. We control for ability and family background by applying so called within-twin
pair estimator. This is a method where the returns to education are estimated by comparing
the difference in the education of the twins in a pair with the difference in their earnings. If
the correlation between education and earnings observed in cross-sectional data is causal then
we should find that on average the twin with higher qualifications also has a higher wage.
The coefficient describing this relationship measures the returns to education. However, if
the correlation is spurious then there should be no correlation between the difference in
education of twins in a pair and the difference in their earnings. Our study is the first in the
UK to apply such methods to identical twins.
The within-twin pair estimation has been criticised. It has been argued that whilst
within-pair differencing removes genetic variation and family background, there might be
other differences between the twins that are unobservable to the researcher and that affect
both the schooling decision and wages. We conducted tests to investigate this criticism.
We present a number of key results. Firstly, our twin estimates suggest a private
return to education for women of 7.7 per cent.
Second, we find no evidence that ability bias affects our within- twin pair estimator by
more than cross-sectional estimation. Thus we expect ability biases to be less for within pair
estimators than for estimators not controlling for ability. Therefore our estimates at least
tighten the upper bound for the returns to education.
Third, the paper contains a contribution regarding the use of smoking as an
instrumental variable for education as has been suggested in the literature. It is argued that
smoking reflects personal discount rates which also affect the educational decision. Using
information on reading scores and smoking behaviour available in our data we find that
smoking is more likely to reflect family background than discount rates. Therefore we
conclude that smoking behaviour should not be used as an instrument for education as it is
likely to exacerbate ability bias.

Returns to Education: Evidence from UK Twins
Dorothe Bonjour, Lynn Cherkas, Jonathan Haskel,
Denise Hawkes and Tim Spector
1. Introduction 1 2. Method 2 3. Data 5 4. Results 7 5. Conclusions 12 Tables 14 Figure 18 Data Appendix 19 References 22
The Centre for the Economics of Education is an independent research centre funded by the Department for Education and Skills. The views expressed in this work are those of the authors and do not necessarily reflect the views of the DfES. All errors and omissions remain the authors.

Acknowledgements
Contact address: Jonathan Haskel, Economics, Queen Mary, University of London, London
E1 4NS, England; [email protected], <www.qmw.ac.uk/~ugte153>. We thank the
DfES and the ESRC (grant R00429924188) for financial support, Anna Vignoles for help
with data and seminar participants at Warwick and Bergen for comments. The Labour Force
Survey is Crown copyright. Errors are our own. This is a shorter version of a working paper
of the same title which is available on the website above.
Dorothe Bonjour is a member of the Policy Studies Institute, London. Lyn Cherkas is a
genetic analyst at the Twins Research and Genetic Epidemiology Unit, St. Thomas’ Hospital,
London. Jonathan Haskel is a Professor of Economics at Queen Mary and the University of
London. He is also a fellow of the CEPR. Denise Hawkes is a member of Queen Mary,
University of London and Tim Spector is director at the Twins Research and Genetic
Epidemiology Unit, St. Thomas’ Hospital, London.
1
1. Introduction
This paper attempts to estimate returns to education using a new data set of identical UK
twins.1 We administered a questionnaire to around 6,600 individuals (3,300 same-sex twin
pairs) in June 1999, all of whom are on the St. Thomas' UK Adult Twin Registry, based at the
Twins Research and Genetic Epidemiology Unit, St. Thomas' Hospital, London, England. As
well as the detailed medical information on the questionnaire, which covers age, birth-weight,
smoking etc., we asked the twins additional socio-economic questions on: earnings,
occupation and schooling; test scores; and the schooling of the other twin. This paper reports
results on 1,698 identical twins, of whom 428 comprise 214 identical twin pairs with
complete wage and schooling information.
We believe our study is of interest for five main reasons. First, given the interest in
genetics and economic success (see e.g. Herrnstein and Murray, 1994) data on genetically
identical individuals are of particular value.2 Second, there are comparatively few
earnings/education studies based on identical twins (we are aware of seven).3 Thus we add to
this literature. Third, our study is the first for the UK to present within-twin pair4 estimates
using identical twins. Blanchflower and Elias (1999) used a sample of 23 twin pairs from the
UK National Child Development Study, but there was insufficient variation of education
within each twin pair to perform any within-pair regressions. Fourth, we have followed
Ashenfelter and Krueger's (1994) innovation of asking one twin to report on the schooling of
the other, in order to examine possible measurement error. Fifth, our study has more data on
twins than other studies including test scores, reading scores and smoking behaviour.
The major criticism of within- twin pair estimates is set out by Bound and Solon
(1999) and Neumark (1999), building on earlier work by Griliches (1979). They argue that
whilst within-pair differencing removes genetic variation, differences might still reflect
ability bias to the extent that ability is affected by more than just genes. To examine this, we
1 Other returns to education methods that attempt to control for ability and background, use, for example IQ tests and detailed family background data sets (e.g. Dearden, 1999), or find an instrument, e.g. such as the raising of the school leaving age, proximity to college, or birth quarter, that is correlated with schooling but uncorrelated with earnings (see e.g. Harmon and Walker, 1995; Angrist and Krueger, 1991; Card, 1995). See Card (1999) for a survey. 2 See e.g. Ashenfelter and Zimmerman (1997) for a study based on brothers and father - son pairs. 3 The other economic studies are for the US, the Twinsburg sample (Ashenfelter and Krueger, 1994; Ashenfelter and Rouse, 1998; Rouse, 1999), the NAS study (Taubman, 1976) and the Minnesota studies (Behrman et al, 1999), for Sweden (Issacson, 1999) and for Australia (Miller et al, 1995). 4 We follow the medical literature and use the term “within-twin pair”, or “within pair” to describe estimates using differences between twins of the same pair. These are variously referred to in the economics literature as between-twins estimates, within-family estimates, first-difference estimates or within-twins estimates.

2
follow and extend Ashenfelter and Rouse (1998). We calculate the correlation of average
family education with those average family characteristics that might plausibly be correlated
with ability or discount rates (e.g. birthweight, partner's characteristics and smoking). This
indicates expected ability bias in a pooled regression. We then calculate the correlation of
within- twin pair differences in education with within-twin pair differences in characteristics.
This indicates expected ability bias in a within-twin pair regression. Using a range of
variables, we find significant correlations in the pooled case, but no significant correlation in
the within pair case. This suggests that ability bias in pooled regressions is likely to be higher
than that using within pair regressions.
A new contribution of this paper is that we have data on twins’ exam and reading
scores. Like the other characteristics, we find no correlation between differences in these
scores within-twin pairs and differences in their education. Finally, we also have data on
smoking at 16 and 18 and we also investigate whether smoking is a valid instrument for
education. We find that smoking seems to be correlated with family background rather than
reflecting individual discount rates and it is unlikely to be a valid education instrument.5
The plan of the rest of this paper is as follows. In the next section we set out some
simple theory. In Section 3 we describe the data and in Section 4 the results. Section 5
contains concluding remarks.
2. Method
Following Bound and Solon (1999), suppose the wage of twins 1 and 2 in family f is
determined by
1 1 1 1
2 2 2 2
log
logf f f f
f f f f
w S A
w S A
β ε
β ε
= + +
= + + (1)
where Sif (i=1,2) is schooling, Aif is ability, broadly defined, i.e. all the other effects on wages
outside those of schooling (intelligence, motivation, access to educational funds etc.) and ε if
5 We also discuss selection issues. Conventional estimates of female earnings equation focus a good deal on selection, but the issue for within pair estimates is whether selection affects not the sample level of education in but education differences.
3
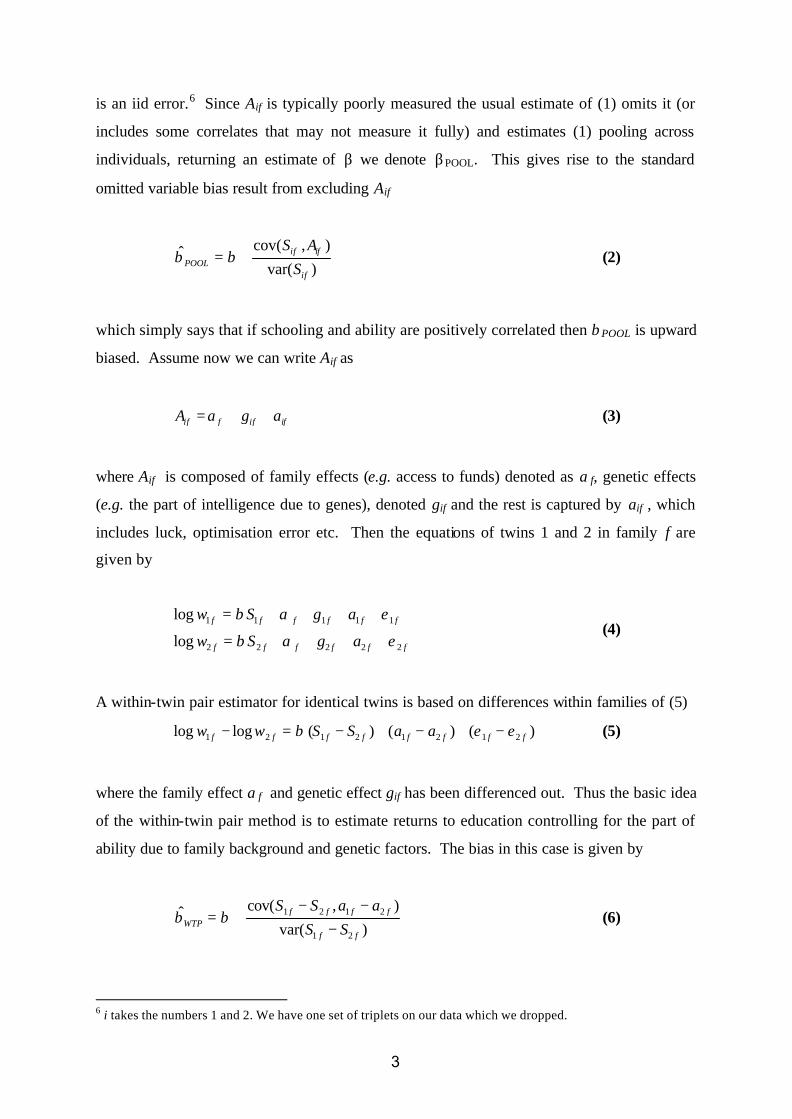
is an iid error.6 Since Aif is typically poorly measured the usual estimate of (1) omits it (or
includes some correlates that may not measure it fully) and estimates (1) pooling across
individuals, returning an estimate of β we denote βPOOL. This gives rise to the standard
omitted variable bias result from excluding Aif
cov( , )ˆvar( )
if ifPOOL
if
S AS
β β= + (2)
which simply says that if schooling and ability are positively correlated then βPOOL is upward
biased. Assume now we can write Aif as
if f if ifA g aα= + + (3)
where Aif is composed of family effects (e.g. access to funds) denoted as αf, genetic effects
(e.g. the part of intelligence due to genes), denoted gif and the rest is captured by aif , which
includes luck, optimisation error etc. Then the equations of twins 1 and 2 in family f are
given by
1 1 1 1 1
2 2 2 2 2
log
logf f f f f f
f f f f f f
w S g a
w S g a
β α ε
β α ε
= + + + +
= + + + + (4)
A within-twin pair estimator for identical twins is based on differences within families of (5)
1 2 1 2 1 2 1 2log log ( ) ( ) ( )f f f f f f f fw w S S a aβ ε ε− = − + − + − (5)
where the family effect αf and genetic effect gif has been differenced out. Thus the basic idea
of the within-twin pair method is to estimate returns to education controlling for the part of
ability due to family background and genetic factors. The bias in this case is given by
1 2 1 2
1 2
cov( , )ˆvar( )
f f f fWTP
f f
S S a aS S
β β− −
= +−
(6)
6 i takes the numbers 1 and 2. We have one set of triplets on our data which we dropped.
4
There are two issues that arise. First, Rouse (1999) estimates that 10 per cent of
variation in schooling is due to measurement error. Since measurement error in schooling
will be exacerbated by the differencing, estimates of (6) will be downward biased due to the
attenuation bias arising from measurement error (Griliches, 1979; Neumark, 1999). We
therefore follow Ashenfelter and Krueger (1994) in instrumenting the reported schooling
differences with reported differences based on reports from the other twin.7
The second question is what causes the differences in schooling between identical
twins? Ashenfelter and Rouse (1998), Bound and Solon (1999) and Neumark (1999),
following earlier arguments due to Griliches, (1979) debate this at length in recent papers.
As (2) shows, conventional OLS ability bias depends on the fraction of variance in schooling
that is accounted for by variance in unobserved abilities that might also affect wages.
Similarly, as (6) shows, within pair ability bias depends on the fraction of within pair
variance in schooling that is accounted for by within pair variance in unobserved abilities that
also affect wages. Thus if the endogenous variation within families is smaller than the
endogenous variation between families, then βWTP is less biased than βPOOL. Hence even if
there is ability bias in within-twin pair regressions βWTP might still be regarded as an upper
bound on the returns to education (if schooling and ability are positively correlated).
However, Bound and Solon (1999) argue there is no a priori reason to believe that βWTP is
less biased than βPOOL.
Ultimately the matter is of course an empirical one. Its investigation is subject to the
central problem that ability is not observed. Ashenfelter and Rouse (1998) therefore look at
the correlation between schooling and potential correlates of ability (e.g. employment status,
tenure and spouse's education). To investigate the covariance in (2) they examine the
correlation between the average level of schooling and the average level of characteristics
across different families. To investigate the covariance in (6) they examine the correlation
between the difference in schooling and the differences in characteristics within families.
They find the former is bigger than the latter and hence argue that most of the variation in
ability is between families and not between twins within a family. We present some similar
investigations below and find similar results to Ashenfelter and Rouse (1998). We also
extend their results by looking at twins exam performance and literacy test scores.
7 Ashenfelter and Rouse (1998) and Rouse (1999) experiment with a number of different instrumentation methods using combinations of own and other twins reporting. Here we instrument using the report of one twin on the education of another. Other instrument configurations gave similar magnitudes to those reported below.
5
Using the same framework we investigate the suggestion that smoking be used as an
instrument for education, since it might proxy discount rates (Fuchs, 1982). Hamermesh
(1999) suggested however that youth smoking is a measure of family background and thus
not a valid instrument for education. We believe that our twins data allows us to shed some
light on the smoking debate. Again, this is based on a comparison of correlations between
and within families. A high correlation between family smoking behaviour and educational
attainment is consistent with both views. However, significant within twin pair correlation is
only consistent with the hypothesis that smoking reflects an individual’s discount rate.
Finding no within twin correlation provides indirect evidence for the family background
view.
3. Data
a. Data set
The Twins Research Unit, St. Thomas' Hospital, London, has built up a list of (mainly
female) identical and non-identical twins. The data we have used in this paper is derived
from a mailing list to about 6,600 individuals. They are mailed questionnaires on mostly
medical information (including birthweight, birth order, gestation period) plus socio-
economic questions on sex, age, presence of children, age of mother etc. We added more
detailed socio-economic questions to the most recent questionnaire which went out in June
1999. We asked the twins to report their qualifications, their twin's qualifications, the age
they finished full-time education, their occupation, their spouse’s occupation, their
employment status, earnings and household income (see Data Appendix for more details).
We should note that response rates are very high (above 80 per cent) on these questionnaires,
kept up by re-mailing and telephoning non-respondents.
Full details of our various measures are set out in the data appendix. To calculate
wages we asked twins to report normal earnings before taxes and deductions and then asked
whether this was hourly, daily, weekly, monthly or yearly. We also asked how many hours
were usually worked (excluding meals and paid overtime). From these questions we
converted the wage data into an hourly rate. To measure schooling, we asked each twin to
report their qualification and their twin's qualification. Qualifications were split into 12

6
groups (e.g. University, A levels, 5+ O levels, 1-4 O levels etc. see data appendix). We then
assigned years of education to each qualification. 8
b. Descriptive statistics and comparisons with other work
We have 1,480 individual, identical twins, all of whom are women. Due to use of postal
questionnaires, we do not necessarily have replies from both members of a twin pair. Of the
identicals therefore we have 621 complete pairs i.e. 1,242 individuals. For 214 of these pairs
(428 individuals) we have complete wage information on both twins in the pair. Thus our
sample size is between the Ashenfelter and Krueger (1994, 298 individuals) and Ashenfelter
and Rouse (1998, 680 individuals) and Rouse (1999, 906 individuals) studies. Our study is
somewhat special as we only have data on female twins. Most of the other studies have both
male and female twin pairs, although they do not attempt to estimate wage equations
separately for men and women. Our sample size is less than Taubman (1976, 2,038
individuals), Behrman and Rosenzweig (1999, 1,440 individuals), Miller et al (1995, 1,204
individuals) and Isacsson (1999, 4,984 individuals). However Taubman (1976) had no
measurement error correction, Miller et al (1995) impute earnings from two-digit occupations
and Behrman and Rosenzweig (1999) impute earnings for non-working women.
How does our data compare with Blanchflower and Elias (1999) (the only other UK
twins study we are aware of)? They identify 267 (individual) twins from the National Child
Development Study (a panel study of all UK births between 3rd-9th March 1958). This is a
potentially very rich data set since it contains detailed information about, for example, test
scores. There are however two difficulties with the study. First, due to high twin infant
mortality and subsequent panel attrition, only 59 pairs have complete wage and education
information and, of these, 23 pairs are classified as identical twins (see their figures 1 and 2).
They therefore have too little variance among their 23 identical pairs to estimate within pair
equations. Second, the twins were identified as identical at birth, but "… from the
documentation we have available to us we are unclear how such designations were made in
practice" (their footnote 6). The usual method at birth is to see if there were one or two
placenta present and identify identicals as coming from one placenta. Unfortunately recent
research indicates that as much as one third of identicals can come from double placentas
8 See Data Appendix. We refer to this education measure as “estimated” years of schooling. In our regressions we use estimated years. We tried different imputations for estimated years and found similar results

7
(Bryan, 1992). Thus it seems likely that their sample of identicals is identified with
substantial error.9
An important innovation of the Ashenfelter and Krueger (1994) study is to ask each
twin his/her own and their cotwin's education. If self-reported education is measured with
error this provides a potential instrument since the report of the other twin should be
correlated with the self-reported education level but uncorrelated with the equation
regressand. This strategy was adopted in the subsequent Twinsburg studies, the Miller et al
(1995) study and ours. Isacsson (1999) uses the comparison of reported education and
registry information to control for measurement error.
Table 1 sets out some descriptive statistics for our data along with comparative data
from the Labour Force Survey (LFS) as a check on the representativeness of our sample.
Column 1 shows data from the 1999 LFS for all women and all women who report a wage.
These women average 12.1 years of schooling, are aged 39 and 59.5 per cent are married.
Column 3 sets out data for all identical twins. They have 12.6 years of schooling, are aged
44.3 and 65.1 per cent are married. So our twins are slightly more educated and slightly
older, but our data do not seem to be too far from the average for women. Column 4 shows
the data for our working twins, who earn, on average, £10.17 per hour, have worked in the
present job for 11.7 years and 58.2 per cent are part time. Comparing this to column 2, which
shows the LFS data for working women, wages and tenure are slightly lower. These lower
LFS figures presumably reflect the somewhat more educated twins sample. The figures are
very similar if we only consider twin pairs (columns 5 and 6).
4. Results
a. Returns to education
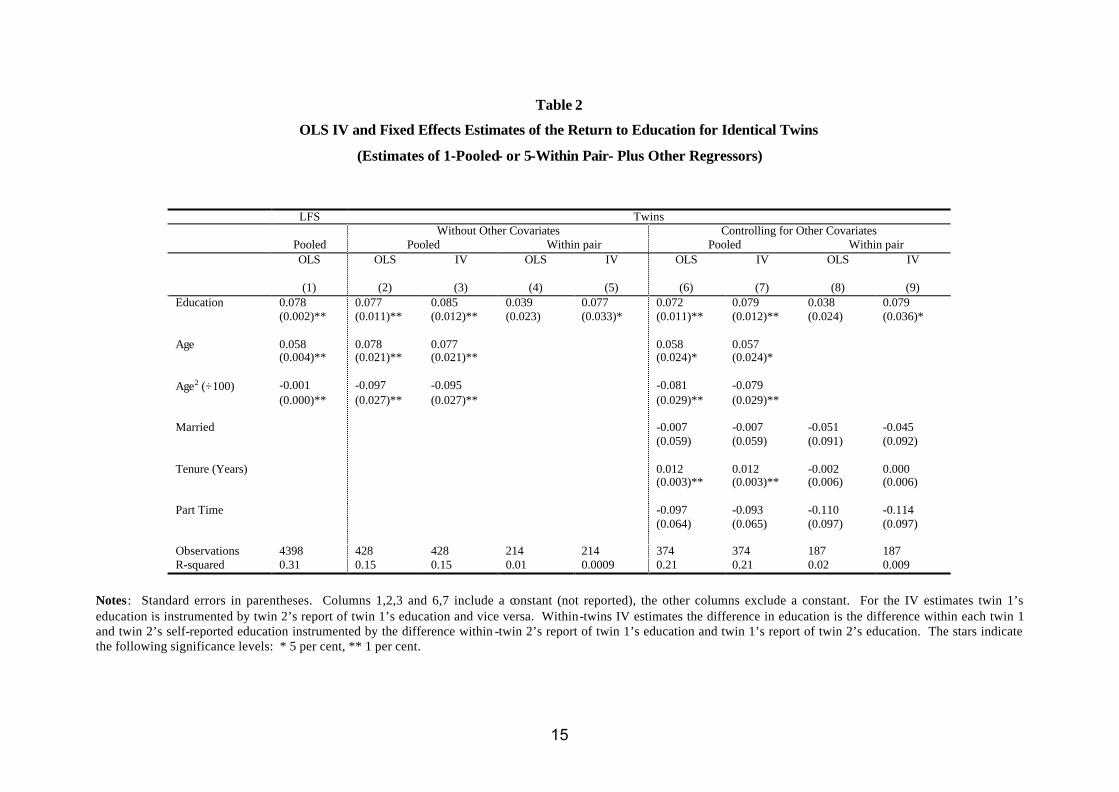
Table 2 sets out our estimates. Column 1 shows an OLS regression using all working women
from the LFS, entering schooling, age and age squared. The return to education is quite
precisely estimated at 7.8 per cent. The rest of the columns are estimates for twins. Column
2 is an OLS pooled regression of (1) using all identicals for whom we have complete wage
Regressions with reported years gave similar coefficients but were less precisely determined (likely due to recall error).

8
information, 428 individuals, and schooling, age and age squa red as regressors. This gives a
return to education of 7.7 per cent, similar to figure in column 1. Dearden's (1998) equivalent
results on the NCDS are about 12.2 per cent (see her Table 4.3, column 1, no control for
ability or family background). Column 3 maintains a pooled specification, but instruments
education with reported level of the other twin. This should control for measurement error in
reported education which would bias down the returns estimate. As column 3 shows, returns
rise to 8.5 per cent when this is done.
Column 4 estimates the within pair equation (5). Figure 1 illustrates data in this case.
The cluster around zero is due to the fact that 55 per cent of the twin pairs have the same
education years. Since the pooled estimates do not control for ability bias we would expect
the within pair returns estimates to be less.10 As column 4 of Table 5 shows, the return is
indeed less, at 3.9 per cent, but is poorly determined. This figure might however reflect
downward bias due to exacerbated measurement error in the differenced equation. To check
this column 5 instruments reported schooling. As expected the point estimate rises to 7.7 per
cent, with a standard error of 0.033. Comparison of the pooled IV and the first difference IV
estimates therefore provide an estimate of the magnitude of ability bias as both control for
measurement error; comparing columns 3 and 5 suggests ability bias is positive.
The right hand panel of the table repeats the exercise controlling for marriage, current
job tenure and part-time status. Interestingly, the pattern of estimates on the regressors is
exactly the same. The pooled OLS estimates (7.2 per cent) are lower than the pooled IV
estimates (7.9 per cent) that control for measurement error. The within pair estimate (3.8 per
cent) is less than the pooled estimate, whilst the within pair estimate controlling for
measurement error (7.9 per cent) is more than the simple within pair estimate.
Thus we can conclude the following. First, ability bias appears to bias the pooled
estimates upwards. Second, measurement error appears to bias all estimates downwards
especially in the case of the within pair estimate. Third, female returns to education appear to
be about 7.7 per cent. Fourth, Dearden (1998) obtains returns of 8.3 per cent for women after
controlling for ability and family background (see her Table 4.3, column 4). Thus our results
are similar to hers.
9 Note in passing they also find the sample of identicals have no significant within-twin pair differences for maths and reading scores, see their Table 8.

9
b. Ability differences within twin pairs
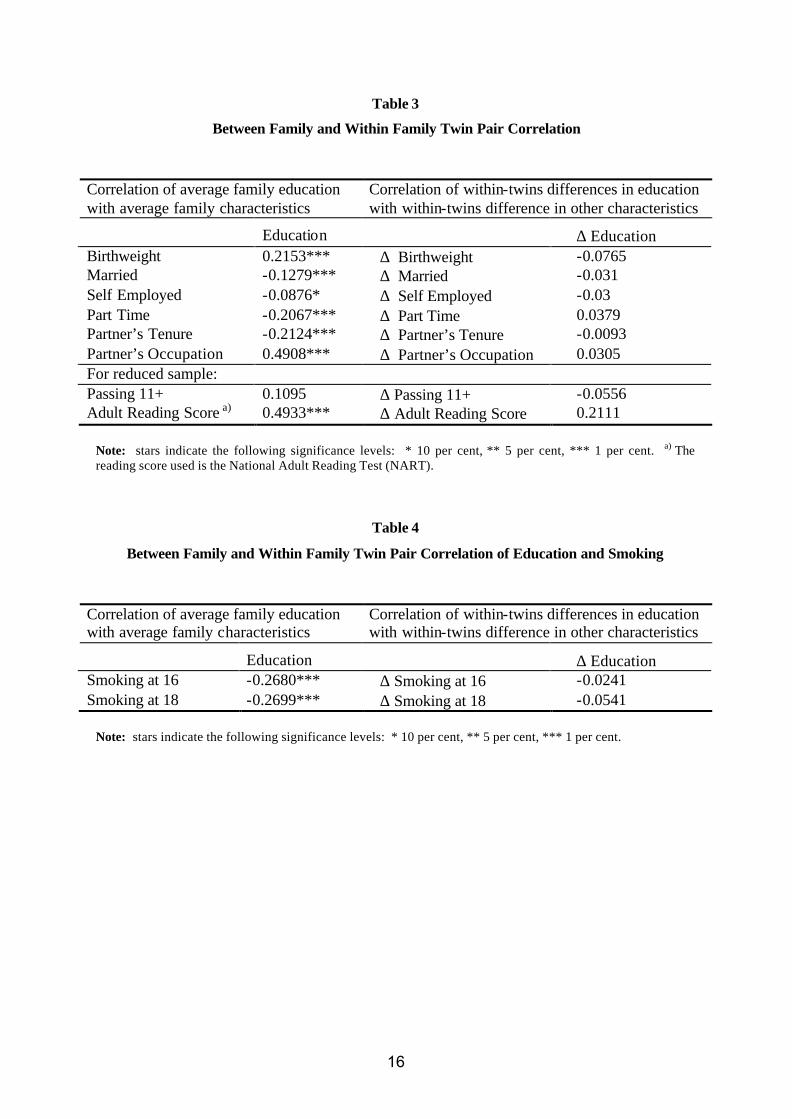
To investigate ability biases within and between families Table 3 shows the results of the
correlation analyses. Consider the first column, first row. This shows that the correlation
between average family education and average family birthweight is 0.22 and is highly
significant. It suggests that families with low average birthweight have low average
schooling, consistent with ability and family background affecting schooling choice. The
second column shows an insignificant correlation between differences in education within-
twin pairs and differences in birthweight within- twin pairs. To the extent that birthweight
measures ability therefore, between family differences in education are more affected by
ability bias than the within pair education differences.
The rest of the first column shows other family correlations.. This shows strong
correlations between average family education and average family marriage status, self-
employment, part-time status, partner's tenure and partner’s occupation. The second column
shows the correlations between within pair differences in education and within pair
differences in characteristics. None of them are significant. In sum, within pair education
differences are uncorrelated with any other within-twin difference in observables. Of course,
these characteristics are incomplete measures of ability, but the evidence is suggestive,
especially as it mirrors that found by the Ashenfelter and Rouse (1998).
For a sub-sample of twins we managed to collect more detailed data on characteristics
that are also likely to be highly correlated with ability. For these twins we have their reading
score on the National Adult Reading Test (NART) and whether the twins passed the 11+
exam (an exam taken at age 11). Before the introduction of comprehensive schools, the 11+
was universally applied across Britain as a means of selecting which secondary school to
attend. If the pupil passed the 11+ (around 25 per cent of the population) this meant that they
were selected to attend a Grammar school where education was largely academically based.
If the pupil did not pass they were selected to attend a Secondary Modern school where
education was more vocationally based. As a result this 11+ test result can be regarded as an
early ability test. However, we only have data on 48 pairs (96 individuals) who reported the
answer to this question in a short follow-up questionnaire we conducted. Of these 48 pairs
only 3 pairs actually received a different result in the 11+ test. As shown in the lower panel
10 If the variation within-twin pairs is uncorrelated with ability, or if there is more between family ability bias than within-family bias.

10
of Table 6, correlations between families and within twins show a pattern similar to upper
panel.
In addition to this early ability measure an adult ability measure is also available for a
subset of twins. The measure is the National Adult Reading Test (NART) which is based on
the ability to read and correctly pronounce each word from a list of 25 words. Of course,
being an adult reading test, the result may be affected by the schooling the respondent has
received. However, Crawford et al (2001) compared NART results of 77 year olds with IQ
tests taken when the same individuals were 11 and obtained a correlation of 0.69. We have
NART test results for 108 identical twin pairs (the twins’ scores had a correlation of 0.71).
As shown in Table 3, the NART results confirm the same pattern as the other ability
correlates: there is a high and significant correlation between average family NART and
average family education but the corresponding correlation of within-twin differences is
insignificant. This is additional evidence that educational differences within twin pairs are
likely be less correlated with ability difference than across families.
c. Smoking as an instrument?
A strength of our data is that we have information on the smoking behaviour of the twins at
the age of 16 and 18. Smoking has been suggested as an instrument for education, since it
might proxy discount rates (Fuchs, 1982) and subsequently been used by Evans and
Montgomery (1994) for the US and Chevalier and Walker (1999) for the UK. This was
criticised by Hamermesh (1999) who suggests that a youth’s smoking behaviour is a measure
of family background and thus not a valid instrument for education.
Evans and Montgomery (1994) show that smoking is highly correlated with
educational outcomes and use it as an instrument in estimating returns to education. Their IV
estimate of the returns to education lies about 10 per cent above the OLS estimate11. This
would indicate negative ability bias, unlike twins studies where ability bias is small or
positive. Evans and Montgomery present ind irect evidence that the correlation of smoking
and educational attainment is due to differences in time preferences. However, they
acknowledge that there is no possibility to test this directly against the alternative hypothesis
that the observed correlation is due to unobserved ‘ability’ in a very broad sense including
genes, family and social background as well as peers.
11 The difference is higher in their estimates for females only.
11
While not able to perform a direct test, our twin data allow us to give additional – and
in our view more compelling – indirect evidence which relies on the correlation method in
Table 3. A significant negative correlation between average family smoking and average
family education is consistent with either smoking reflecting discount rates or family
background. However, if smoking affects individual’s discount rates differences in smoking
within families should be correlated with differences in education. But the within pair
correlation should be insignificant if the cross-sectional correlation between smoking and
education is due to family background.
Table 4 shows the correlation results for smoking. There is a significant negative
correlation between average family smoking and family education. However, there is no
significant correlation between within- twin pair smoking and within-twin pair education.
This suggest smoking is more likely to reflect family background than discount rates.
Furthermore, if the family background view is true and if ability bias is positive – as
is the case for our data – then using smoking as an instrument is likely to exacerbate ability
bias. Table 5 investigates this. Column 1 upper panel shows, for comparison, the pooled
OLS results from column 2 of Table 3. The return of 0.077 compares closely with two
smoking studies in the literature set out in the lower panel, Evans and Montgomery (1994,
0.079) and Chevalier and Walker (1999, 0.099). The second and third columns shows returns
to education when using smoking at 16 and 18 as an instrument. The returns rise just as in
the Chevalier/Walker and Evans/Montgomery studies (see lower panel), consistent with an
exacerbation of positive ability bias. The final column investigates smoking at 18 and finds a
similar effect. In sum, evidence seems to suggest that smoking reflects family background
rather than discount rates. Thus the higher estimated returns in studies using smoking as an
instrument are more likely caused by an augmentation of (positive) ability bias than the
existence of negative ability bias.
d. Selection bias
How are the returns to education estimates affected by possible selection bias? There are
several selection processes going on. Here we will focus on two: taking part in the study
(volunteering to be on the data base and returning the specific questionnaire) and
participating in the labour market. They might affect pooled estimations differently form
within- twin pair estimations.
12
Consider first the effects on the pooled estimates. Selection into the study arises since
twins have to volunteer to be on the database and return the questionnaire. Better educated
twins seem more likely to do this as they are more likely to be in our sample (see Table 2).
However, if returns to education are linear in schooling, then having a sample of highly
schooled individuals should not matter. If returns are non- linear but characterised by
diminishing marginal returns 12 then, since we have a slightly above average education group,
our pooled estimates would understate average marginal returns. As in all studies that are
concerned with wages there is the potential of selection bias due to the participation decision.
As our sample consists of female twins selection issues of this kind do potentially affect our
estimates. We therefore experimented with traditional Heckman-correction models (using
children and husband’s occupation in the selection equation) but found no evidence that
selection affected our estimates significantly.
Our main estimates are however of within-twin pair differences. The key point with
respect to selection is that we are not concerned with whether the average characteristics of
the group are non-representative, but whether differences in education within twin pairs are
non-representative of differences in education in general. The two main selection issues
discussed above could also affect the differences. First, both twins need to respond to the
questionnaire, and second, both twins have to be working. It is not straightforward to show
how these selection processes affect differences within-twin pairs and which way potential
biases would go.
5. Conclusions
We have used a new sample of UK twins to estimate returns to education using the within-
twin pair method allowing for measurement error. Our findings suggest a number of key
results. Firstly, our twin estimates confirm the theoretical prediction that measurement error
biases estimated returns to education up and omitting ability biases estimates down. These
effects roughly cancel each other out indicating a private return to education for women of
7.7 per cent. Second, we find no evidence that ability bias affects our within-twin pair
estimator by more than the between family estimator. Thus we expect ability biases to be
12 The higher marginal returns in IV studies are often attributed to high marginal returns for a low educated group whose behaviour is frequently the source of variation of the instrument (Card, 1999).

13
less for within pair estimators than for estimators not controlling for ability. Therefore our
estimates at least tighten the upper bound for the returns to education.
Third, we present evidence that smoking behaviour used in the literature as an
instrument for education is more likely to reflect family background than the assumed
discount rates. Therefore, smoking behaviour should not be used as an instrument for
education as it is likely to exacerbate ability bias.
In future work we hope to be able to extend the data set to consider male twins and,
with an increased sample size consider the issue of heterogeneous returns to education both
with respect to different qualifications and to parental background.

14
Table 1
Descriptive Statistics
LFS 1999 Identical Twins Identical Twin Pairs
All (1)
Working (2)
All (3)
Working (4)
All (5)
Both Work (6)
Reported Years of Schooling a)
12.1 (2.37)
12.3 (2.39)
12.6 (2.89)
13.0 (2.92)
12.6 (2.89)
13.2 (3.04)
Estimated Years of Schooling b)
12.5 (2.32)
12.9 (2.35)
13.5 (2.52)
13.9 (2.48)
13.5 (2.54)
14.1 (2.50)
Age 38.9 (11.08)
38.6 (10.72)
44.3 (10.40)
42.7 (10.15)
44.8 (10.3)
42.5 (10.0)
Married (%) 59.5 60.3 65.1 61.4 65.3
61.3
White (%) 94.9 96.6 98.3 98.4 98.6 98.3
Non (%) Participation
29.0 0 18.2 0 18.6 0
Hourly Wage Rate 7.09 (4.37)
10.17 (10.36)
10.03 (9.12)
Tenure 6.9 (6.84)
11.7 (9.64)
11.9 (9.15)
Full Time (%) 58.5 58.2 60.8
Self Employed (%) 4.8 5.1 4.9
Sample Size (Individuals)
7729 4226 1364 748 1242 428
Notes: Standard deviations in parentheses; a) Based on age when finished fulltime education minus five; b) Based on highest qualification (see data appendix);
15
Table 2
OLS IV and Fixed Effects Estimates of the Return to Education for Identical Twins
(Estimates of 1-Pooled- or 5-Within Pair- Plus Other Regressors)
LFS Twins Without Other Covariates Controlling for Other Covariates Pooled Pooled Within pair Pooled Within pair OLS
(1)
OLS
(2)
IV
(3)
OLS
(4)
IV
(5)
OLS
(6)
IV
(7)
OLS
(8)
IV
(9) Education 0.078 0.077 0.085 0.039 0.077 0.072 0.079 0.038 0.079 (0.002)** (0.011)** (0.012)** (0.023) (0.033)* (0.011)** (0.012)** (0.024) (0.036)* Age 0.058 0.078 0.077 0.058 0.057 (0.004)** (0.021)** (0.021)** (0.024)* (0.024)* Age2 (÷100) -0.001 -0.097 -0.095 -0.081 -0.079 (0.000)** (0.027)** (0.027)** (0.029)** (0.029)** Married -0.007 -0.007 -0.051 -0.045 (0.059) (0.059) (0.091) (0.092) Tenure (Years) 0.012 0.012 -0.002 0.000 (0.003)** (0.003)** (0.006) (0.006) Part Time -0.097 -0.093 -0.110 -0.114 (0.064) (0.065) (0.097) (0.097) Observations 4398 428 428 214 214 374 374 187 187 R-squared 0.31 0.15 0.15 0.01 0.0009 0.21 0.21 0.02 0.009
Notes: Standard errors in parentheses. Columns 1,2,3 and 6,7 include a constant (not reported), the other columns exclude a constant. For the IV estimates twin 1’s education is instrumented by twin 2’s report of twin 1’s education and vice versa. Within-twins IV estimates the difference in education is the difference within each twin 1 and twin 2’s self-reported education instrumented by the difference within -twin 2’s report of twin 1’s education and twin 1’s report of twin 2’s education. The stars indicate the following significance levels: * 5 per cent, ** 1 per cent.
16
Table 3
Between Family and Within Family Twin Pair Correlation
Correlation of average family education with average family characteristics
Correlation of within-twins differences in education with within-twins difference in other characteristics
Education ∆ Education Birthweight 0.2153*** ∆ Birthweight -0.0765 Married -0.1279*** ∆ Married -0.031 Self Employed -0.0876* ∆ Self Employed -0.03 Part Time -0.2067*** ∆ Part Time 0.0379 Partner’s Tenure -0.2124*** ∆ Partner’s Tenure -0.0093 Partner’s Occupation 0.4908*** ∆ Partner’s Occupation 0.0305 For reduced sample: Passing 11+ 0.1095 ∆ Passing 11+ -0.0556 Adult Reading Score a) 0.4933*** ∆ Adult Reading Score 0.2111
Note: stars indicate the following significance levels: * 10 per cent, ** 5 per cent, *** 1 per cent. a) The reading score used is the National Adult Reading Test (NART).
Table 4
Between Family and Within Family Twin Pair Correlation of Education and Smoking
Correlation of average family education with average family characteristics
Correlation of within-twins differences in education with within-twins difference in other characteristics
Education ∆ Education Smoking at 16 -0.2680*** ∆ Smoking at 16 -0.0241 Smoking at 18 -0.2699*** ∆ Smoking at 18 -0.0541
Note: stars indicate the following significance levels: * 10 per cent, ** 5 per cent, *** 1 per cent.

17
Table 5
Smoking as an Instrument: OLS and IV Estimates
of the Return to Education For Identical Twins
(Pooled Estimates of 5, Dependent Variable Log Wages)
Instrument: Smoking at 16 Smoking at 18
OLS IV IV Education 0.077 0.110 0.104 (0.011)** (0.044)* (0.045)*
Age 0.078 0.074 0.074 (0.021)** (0.022)** (0.022)**
Age2 (÷100) -0.097 -0.089 -0.091 (0.027)** (0.029)** (0.029)**
Smoking (1 yes, 0 no) Constant -0.428 -0.873 -0.782 (0.435) (0.719) (0.719) Observations 428 428 428 R-squared 0.15 0.13 0.14 Evans and Montgomery (1994) a) Education 0.079 0.122 (0.003)** (0.030)**
Chevalier and Walker (1999) a) GHS: Education 0.099 0.163 (0.003)** (0.011)**
Note: stars indicate the following significance levels: * 5 per cent, ** 1 per cent. a) Results from Table 10. b) Results from Table 23 (General Household Survey, GHS). The age of smoking is not specified in their paper..

18
Figure 1
Differences in Log Hourly Earnings Against Differences in Schooling
(Schooling Based On Highest Qualifications)
Dif
f Log
Hou
rly
Wag
e
Difference in Estimated Years of Schooling-6 6
-3.59299
2.23105

19
Data Appendix
The identification of the twins as identical or fraternal is generated at the Twins Unit using
a set of standardised questions. In addition these results are compared, where possible, to
DNA data held at the Unit.
If both twins are present in the sample they are recorded as a pair, if only one twin is present
they are recorded as a singleton.
Reported Years of Schooling are found by subtracting five years from the age reported for
finishing full-time education. This does not account for pre-school or adult education. For
example someone who reports that they left school at 17 will have 17 - 5 = 12 reported years
of schooling.
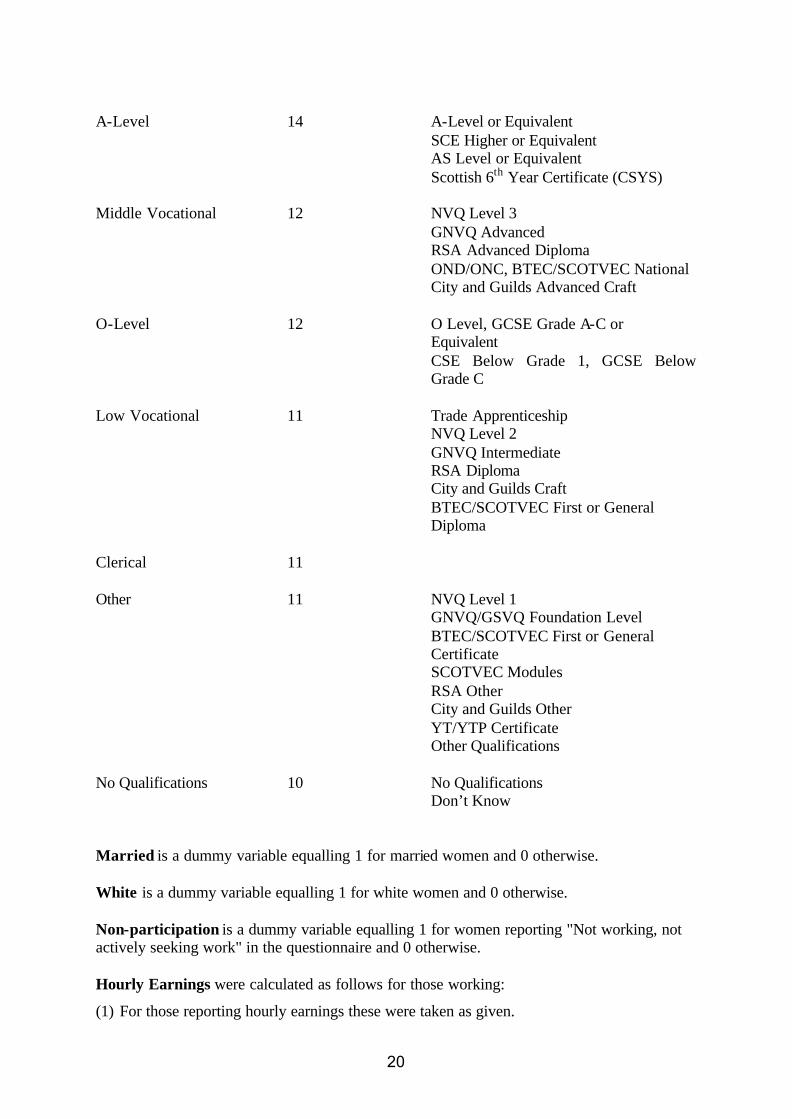
Estimated Years of Schooling are based on the highest qualification reported. The
qualifications were ranked and assigned the number of years necessary to achieve the
qualification as follows (in descending order). In addition the LFS data were matched into
our qualifications groups as below.
Twins Groupings Years Allocated LFS Grouping University 17 Higher Degree NVQ Level 5 First Degree Other Degree Higher Vocational 16 NVQ Level 4 Diploma in Higher Education HNC/HND, BTEC Higher etc RSA Higher Diploma Other Higher Education Below Degree
Level Teaching 16 Teaching – Further Education Teaching – Secondary Teaching – Primary Teaching – Level Not Stated Nursing 15 Nursing etc
20
A-Level 14 A-Level or Equivalent SCE Higher or Equivalent AS Level or Equivalent Scottish 6th Year Certificate (CSYS) Middle Vocational 12 NVQ Level 3 GNVQ Advanced RSA Advanced Diploma OND/ONC, BTEC/SCOTVEC National City and Guilds Advanced Craft O-Level 12 O Level, GCSE Grade A-C or
Equivalent CSE Below Grade 1, GCSE Below Grade C
Low Vocational 11 Trade Apprenticeship NVQ Level 2 GNVQ Intermediate RSA Diploma City and Guilds Craft
BTEC/SCOTVEC First or General Diploma
Clerical 11 Other 11 NVQ Level 1 GNVQ/GSVQ Foundation Level BTEC/SCOTVEC First or General
Certificate SCOTVEC Modules RSA Other City and Guilds Other YT/YTP Certificate Other Qualifications No Qualifications 10 No Qualifications Don’t Know Married is a dummy variable equalling 1 for married women and 0 otherwise. White is a dummy variable equalling 1 for white women and 0 otherwise. Non-participation is a dummy variable equalling 1 for women reporting "Not working, not actively seeking work" in the questionnaire and 0 otherwise. Hourly Earnings were calculated as follows for those working:
(1) For those reporting hourly earnings these were taken as given.

21
(2) For those reporting daily earnings, a working day of eight hours was assumed. Hourly earnings therefore were found to be reported daily earnings multiplied by reported weekly hours divided by eight. This was then all divided by reported weekly hours. This calculation can cause some problems for part-time workers. However, only ten twins in the whole sample and two twins in the sample of working twin pairs reported daily wages.
(3) For those reporting weekly earnings, hourly earnings were found by dividing reported
weekly earnings by reported weekly hours. (4) For those reporting monthly earnings, a working month of four weeks was assumed.
Hourly earnings therefore were found to be reported monthly earnings divided by four all divided by reported weekly hours.
(5) For those reporting annual earnings, a working year of fifty- two weeks was assumed (full
time staff are generally have paid during vacations). Hourly earnings therefore were found to be reported annual earning divided by fifty- two all divided by reported weekly earnings.
Tenure is the years spent in present occupation. Full-time is a dummy equalling 1 for women reporting "Working in a job, full-time" and 0 otherwise. Self-employed is a dummy variable equalling 1 for women reporting "Working as self-employed" and 0 otherwise. Partner's Occupation is an index variable ranking from 1 to 8 with the following categories: plant and machine operatives, sales occupations, personal and protective services, crafts and related occupations, clerical and secretarial occupations, associate professional occupations, professional occupations. Partner's tenure is partner's years spent in present occupation.
22
References Angrist, J. and Krueger, A. (1991), ‘Does Compulsory School Attendance Affect Schooling
and Earnings’, Quarterly Journal of Economics, 106, pp. 979-1014 Ashenfelter, O. and Krueger, A. (1994), ‘Estimating the Returns to Schooling Using a New
Sample of Twins’, American Economic Review, 84, pp. 1157-1173. Ashenfelter, O. and Rouse, C. (1998), ‘Income, Schooling and Ability: Evidence from a New
Sample of Identical Twins’, Quarterly Journal of Economics, Feb 1998, pp. 253-284. Ashenfelter, O. and Zimmerman, D. (1997), ‘Estimates of the Returns to Schooling from
Sibling Data: Fathers, Sons, and Brothers’, Review of Economics and Statistics, 79, pp. 1-9.
Behrman J. and Rosenzweig, M. (1999), ‘“Ability” Biases in Schooling Returns and Twins:
A Test and New Estimates’, Economics of Education Review, 18, pp. 159-167. Blanchflower, D. and Elias, P. (1999), ‘Ability, Schooling and Earnings: Are Twins
Different?’ unpublished manuscript. Bound J. and Solon, G. (1999), ‘Double Trouble: On the Value of Twins-Based Estimation
of the Return to Schooling’, Economics of Education Review, 18, pp. 169-182. Bryan, E. (1992), Twins and Higher Multiple Births - A Guide to their Nature and Nurture,
Edward Arnold: London/Melbourne/Auckland. Card, D. (1995), ‘Using Geographic Variation in College Proximity to Estimate the Return to
Schooling’, in L. Christofides, E. Grant, and R. Swidinsky, editors, Aspects of Labour Market Behaviour: Essays in Honour of John Vanderkamp, University of Toronto Press: Toronto, pp. 201-222.
Card, D. (1999), ‘The Causal Effect of Education on Earnings’, in O. Ashenfelter and D.
Card, editors, Handbook of Labor Economics, Elsevier Science B.V. Chevalier, A. and Walker, I. (1999), ‘Further Results on the Returns to Education’,
University of Warwick, mimeo. Crawford, J. R., Dearly, I. J., Starr, J. and Whalley, L. J. (2001), ‘The NART as an Index of
Prior Intellectual Functioning: a Retrospective Validity Study Covering a 66-Year Interval’, Psychological Medicine, 31, pp. 451-458.
Dearden, L. (1998), ‘Ability, Families, Education and Earnings in the UK’, IFS Working
Paper No. W98/14. Dearden, L. (1999), ‘Qualifications and Earnings in Britain: How Reliable are Conventional
OLS Estimates of the Returns to Education?’, IFS Working Paper No. W99/7.

23
Evans, W. N. and Montgomery, E. (1994), ‘Education and Health: Where There’s Smoke There’s an Instrument’, NBER Working Paper No. 4949.
Fuchs, V. R. (1982), ‘Schooling and Health: The Cigarette Connection’, Journal of Health
Economics, 1, pp. 217-230. Griliches, Z. (1979), ‘Sibling Models and Data in Economics: Beginnings of a Survey’,
Journal of Political Economy, 87, pp. S37-S65. Hamermesh, D. (1999), ‘The Art of Labormetrics’, NBER Working Paper 6927. Harmon, C. and Walker, I. (1995), ‘Estimates of the Economic Return to Schooling for the
United Kingdom’, American Economic Review, 85, pp. 1278-1286. Herrnstein, R. and Murray, C. (1994), The Bell Curve, Free Press: New York. Isacsson, G. (1999), Essays on the Twins Approach in Empirical Labor Economics, Swedish
Institute for Social Research, Stockholm. Miller, P., Mulvey, C. and Martin, N. (1995), ‘What Do Twins Studies Reveal About the
Economic Returns to Education? A Comparison of Australian and U.S. Findings’, American Economic Review, 85, pp. 586-599.
Neumark, D. (1999), ‘Biases in Twin Estimates of the Return to Schooling’, Economics of
Education Review, 18, pp. 143-148. Rouse, C. (1999), ‘Further Estimates of the Economic Return to Schooling from a New
Sample of Twins’, Economics of Education Review, 18, pp. 149-157. Taubman, P., (1976), ‘Earnings, Education, Genetics, and Environment’, Journal of Human
Resources, 11, pp. 447-461.
CENTRE FOR THE ECONOMICS OF EDUCATION Recent Discussion Papers
21 A. Chevalier P. Dolton S. McIntosh
Recruiting and Retaining Teachers in the UK: an Analysis of Graduate Occupation Choice from the 1960s to the 1990s
20 G. Conlon The Determinants of Undertaking Academic and Vocational Qualifications in the UK
19 A. Jenkins A. Vignoles A. Wolf F. Galindo-Rueda
The Determinants and Effects of Lifelong Learning
18 S. Gibbons Neighbourhood Effects on Educational Achievement
17 S. Gibbons Paying for Good Neighbours? Neighbourhood Deprivation and the Community Benefits of Education
16 R. Blundell L. Dearden B. Sianesi
Estimating the Returns to Education: Models, Methods and Results
15 S. Gibbons S. Machin
Valuing Primary Schools
14 C. Megir M. Palme
The Effect of a Social Experiment in Education
13 G. Conlon One in Three? The Incidence and Outcomes of LifelongLearners in the United Kingdom
12 A. Jenkins Companies Use of Psychometric Testing and the Changing Demand for Skills: A Review of the Literature
11 G. Conlon The Differential in Earnings Premia Between Academically and Vocationally Trained Males in the United Kingdom
10 P. Dolton O. D. Marcenaro L. Navarro
The Effective Use of Student Time: A Stochastic Frontier Production Function Case Study
9 P. Dolton M. Silles
Over-Education in the Graduate Labour Market: Some Evidence
8 A. Chevalier G. Lanot
The Relative Effect of Family and Financial Characteristics on Educational Achievement
7 A. Chevalier Graduate Over-Education in the UK
6 B. Sianesi J. Van Reenen
The Returns to Education: A Review of the Macro-Economic Literature
5 C. Harmon H. Osterbeek I. Walker
The Returns to Education: A Review of Evidence, Issues and Deficiencies in the Literature
4 L. Dearden S. McIntosh M. Myck A. Vignoles
The Returns to Academic and Vocational Qualifications in Britain
3 S. McIntosh A. Vignoles
Measuring and Assessing the Impact of Basic Skills on Labour Market Outcomes
2 A. Vignoles R. Levacic J. Walker S. Machin D. Reynolds
The Relationship Between Resource Allocation and Pupil Attainment: A Review
1 A. Vignoles T. Desai E. Montado
An Audit of the Data Needs of the DfEE Centres on the Economics of Education and the Wider Benefits of Learning
To order a discussion paper, please contact the Publications Unit Tel 020 7955 7673 Fax 020 7955 7595


