
1
Electronic Supplementary Information (ESI)
Simultaneous realization of high catalytic activity and stability for
catalytic cracking of n-heptane on highly exposed (010) crystal planes
of nanosheet ZSM-5 zeolite
Xia Xiao, Yaoyuan Zhang, Guiyuan Jiang*, Jia Liu, Shanlei Han, Zhen Zhao*, Ruipu
Wang, Cong Li, Chunming Xu*, Aijun Duan, Yajun Wang, Jian Liu and Yuechang
Wei
State Key Laboratory of Heavy Oil Processing, China University of Petroleum,
Beijing, Beijing 102249, PR. China
E-mail: [email protected]
Electronic Supplementary Material (ESI) for ChemComm.This journal is © The Royal Society of Chemistry 2016

2
Contents
1. Catalyst preparation2. Catalyst characterization3. Catalytic tests and carbon deposit analyses.4. Supplementary Figures and Tables
3
1. Catalyst preparation
The nanosheet ZSM-5 zeolite was prepared according to the literature1 except for
static condition during hydrothermal crystallization of 13 days. Subsequently, all the
samples were converted to the H+ form through three times ion-exchanged in 1 M
NH4NO3 solution (80 0C, 4 h, weight ratio of zeolite to NH4NO3 solution is 1:20) and
calcination at 550 0C for 4h. Prior to catalytic evaluation, powder was pressed,
crushed, and sorted into grains of 40-60 mesh. The conventional ZSM-5 zeolite was
purchased from Nankai catalyst factory. Synthesis of nanosheet ZSM-5 zeolite was
prepared according to the previously reported procedures.
2. Catalyst characterization
Powder X-ray diffraction (XRD) patterns were collected by a Bruker D8
Advance diffractometer, using Cu Kα ( λ=0.15406 nm ) radiation with a Nickel filter
operating at 40KV and 100 mA at a scanning rate of 2◦/min from 5◦ to 50◦.
The scanning electron microscopy (SEM) images of the samples were observed
on an FEI Quanta 200F instruments using accelerating voltages of 5 KV. The samples
were dusted on an adhesive conductive carbon belt attached to a copper disk and were
coated with Au prior to measurement.
Transmission electron microscopy (TEM) was performed on a JEOL JEM-2100
equipped with a field emission source at an acceleration voltage of 200 kV. The
powder samples were dispersed in ethanol by ultrasonication and then several drops
of the suspended were planed on an ultrathin carbon films.
Nitrogen adsorption–desorption isotherms were measured on a Micromeritics
TriStar Ⅱ 3020 volumetric adsorption analyzer at 77 K. Prior to the adsorption
measurement, all samples were degassed at 363 K under vacuum for 1 h then heating
up to 623 K outgas for 4 h under 1×10⁻⁴ Pa. The specific surface area was calculated
from the adsorption data obtained at P/P0 between 0.05 and 0.20 using Brunauer–

4
Emmett–Teller (BET) equation. The total pore volume was derived from the nitrogen
amount adsorbed at a relative pressure of 0.95. The external surface area and
micropore volume was evaluated by t-plot method. The pore size distribution and
mesopore volume was evaluated by Barrett-Joyner-Halenda (BJH) method following
the adsorption branch of the isotherm.
The Si/Al molar ratios of all samples were confirmed by inductively coupled
plasma optical emission spectroscopy (ICP-OES) using an Optima 7300V instrument
(Perkin-Elmer).
27Al solid-state MAS NMR spectra were recorded on a Bruker AVANCE III 400
NMR spectrometer under one pulse condition. 27Al MAS NMR spectra were recorded
with a frequency of 104.1 MHz, a spinning rate of 12.0 kHz, and a recycling delay of
1 s. Hydrated Al(NO3)3 powder was used as an external reference. The spectra are
dominated by a signal at 54 ppm corresponding to tetrahedrally coordinated
framework Al. A weaker band at 0 ppm relates to octahedral coordination
extraframework Al. The tetrahedral and octahedral Al content in the catalysts was
estimated from spectral deconvolution and peak areas.
Temperature-programmed desorption of ammonia (NH3-TPD) was carried out to
detect the acidity of the samples. Prior to the measurements, about 100 mg of sample
was outgassed at 873 K for 1 h. After cooling to 373 K, the sample was saturated in
NH3 stream for 30 min, followed by purging with nitrogen for 1 h to remove co-
adsorbed NH3. The remaining strongly adsorbed NH3 was then desorbed by heating
the sample to 873 K at a constant rate of 10 K min-1, and the amount of desorbed NH3
was monitored by thermal conductivity detector (TCD) simultaneously.
The concentrations of Lewis (cL) and Brønsted (cB) acidities were determined by
Pyridine adsorption IR measurements (Py-IR). Prior to measurement, a sample was
pressed into a pressed in ca 10 mg/cm2 self-supporting wafers in the absence of any
binder and evacuated in an in situ IR cell at 723 K for 2 h up to 10−2 Pa. After the
5
sample was cooled to room temperature, the wafer was saturated with pyridine vapor
(equilibrium vapor at 273 K) for 30 min, followed by outgas at 473 K or 623 K for 30
min. The IR spectrum was recorded after cooling to room temperature. The cL and cB
were evaluated from the integral intensities of bands at 1454 cm-1 (cL) (2.22 cm/μmol
as a molar extinction coefficient) and 1545 cm-1 (cB) (1.67 cm/μmol as a molar
extinction coefficient). 2
To determine the external acid sites in the nanosheet ZSM-5 zeolites, a relatively
large probe molecule 2,6-di-methylpyridine (DMPy) was used.3 The adsorption of
DMPy took place at 423 K for 15 min at an equilibrium vapor pressure of the probe
molecule. Desorption proceeded at the same temperature for 1 h followed by
collection of spectra at room temperature.
3. Catalytic tests and carbon deposition analyses
3.1. Catalytic tests
Catalytic cracking of n-heptane (purchased from Sinopharm Chemical Reagent
Co, purity 99%, without any further purification), which is a typical acid-catalyzed
reaction, was carried out in a fixed bed stainless steel continuous-flow reactor (10 mm
i.d.), with a thermocouple in the center of the catalyst bed to measure the reaction
temperature. In a typical run, the reaction was carried out under atmospheric pressure
using N2 as a carrier gas. The catalyst loading and flow rate of N2 carrier were 0.75 g
and 400 ml min-1, respectively. The feedstock was injected into the vaporization zone
of rector by using a syringe pump (KDS Scientific), the weight hourly space velocity
of the n-heptane was kept at 1.82 h-1. The output reaction products were analyzed
online by a gas chromatograph (SP-2100) equipped with an Agilent GC-Al2O3
capillary column (30 m × 0.53mm) and a hydrogen flame ionization detector.
3.2. Carbon deposition analyses
The coke-deposited sample was obtained after the n-heptane cracking reaction at
873 K for time on stream (TOS) of 100 h. Subsequently, the reactor was purged with

6
a high-purity N2 gas flow (400 mL min-1) for 2 h at 873 K to remove organic volatiles.
The amount, location and type of coke species deposited in the zeolite samples which
were used in the n-heptane cracking reaction as catalysts are investigated in both
quantitative and qualitative methods.
For the quantitative analysis, thermogravimetric analysis (TGA) was conducted
on TGA/DSC 1 STAR system of Mettler Toledo. In a typical TGA measurement, the
temperature was increased from ambient temperature to 1073 K at a constant ramping
rate of 10 K min-1 under flowing oxygen (50 mL min-1). The sample weight loss
between 473 and 950 K was taken as the total coke content.
The location of coke deposited on the catalysts was determined by N2 adsorption
isotherm. Adsorption was measured at 77 K using the procedure described above. The
amount of internal coke in the zeolite micropores was calculated from the decrease in
the micropore volume of the spent catalysts, as compared with the pristine sample.
The amount of external coke (coke deposition on the external surface or mesopores)
was calculated by subtracting the internal coke content from the total coke content.
The calculated methods of internal coke content were based on the assumption that
the remaining micropore volume in the spent catalysts is fully accessible to N2
molecules through the three dimensionally interconnected zeolite channels. The
internal coke content was calculated with the assumption that the coke density was
1.22 g cm-3. The coke analysis method was reported by Ryoo et al.4
For the qualitative analysis of the coke species in the zeolites, the Raman spectra
of spent catalysts were performed on an in Via Raman microscope (Renishaw) using
an excitation source of 532 nm, and subtracting the fluorescence caused by coke. The
laser spot size was approximately 1–2 mm with a power of 10 mW.
4. Supplementary Figures and Tables
7
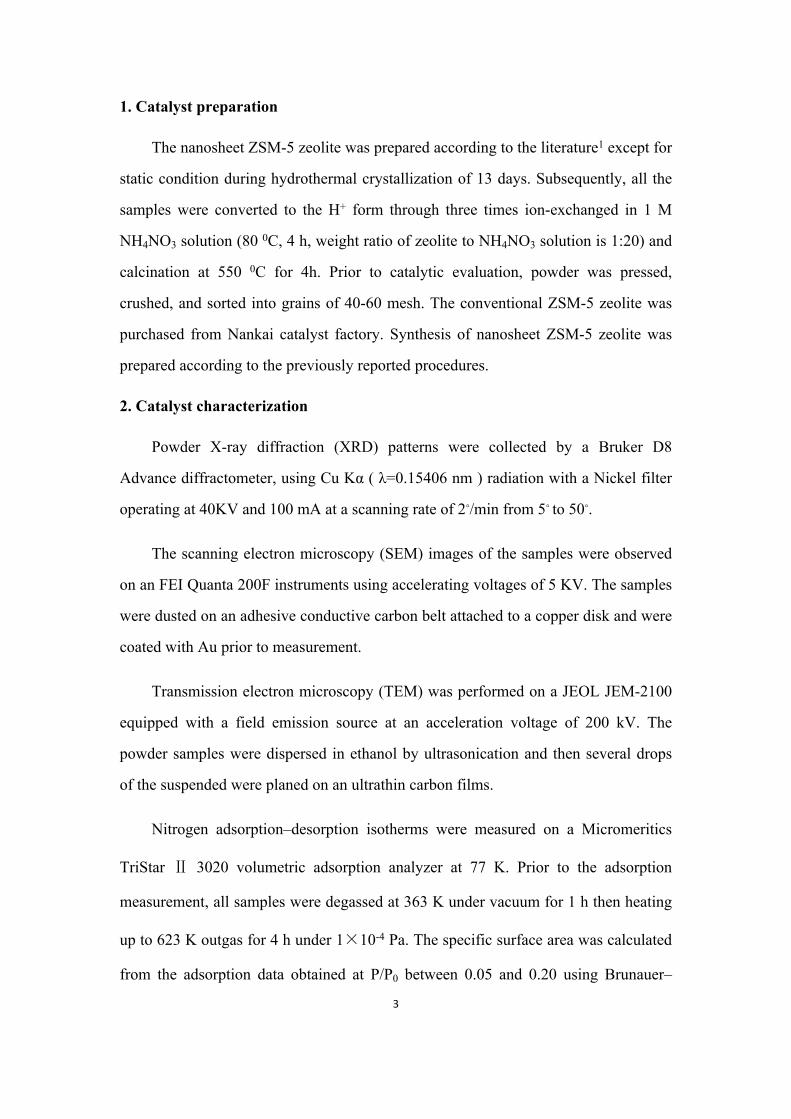
Figure S1. The SEM (a) and TEM (b) image of conventional ZSM-5 zeolite catalyst
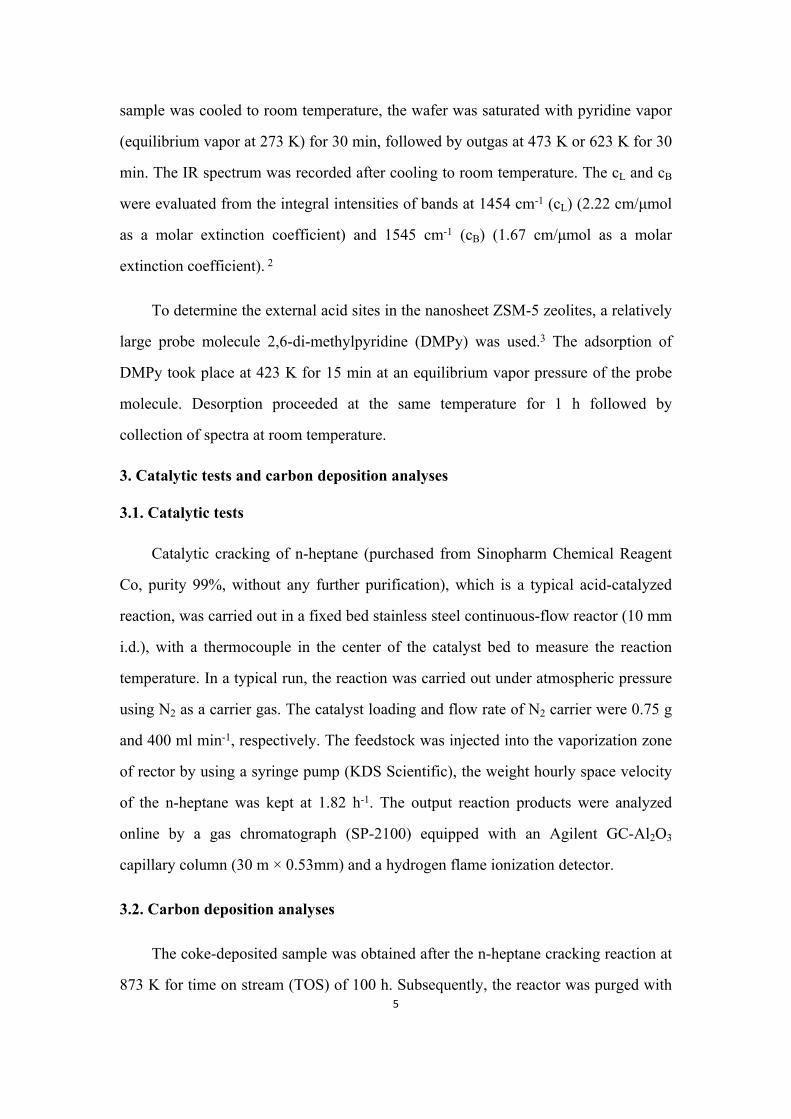
Figure S2. NH3-TPD profiles of the protonic form ZSM-5 zeolite catalyst (a) and FTIR spectra of ZSM-5 zeolites after adsorption of 2,6-dimethylpyridine (b).

8
Figure S3. The FTIR spectra of ZSM-5 zeolite catalysts after degasing of pyridine at 473K (a) and 623K (b)
Figure S4. 27Al MAS NMR spectra of the conventional and nanosheet ZSM-5 zeolite
9
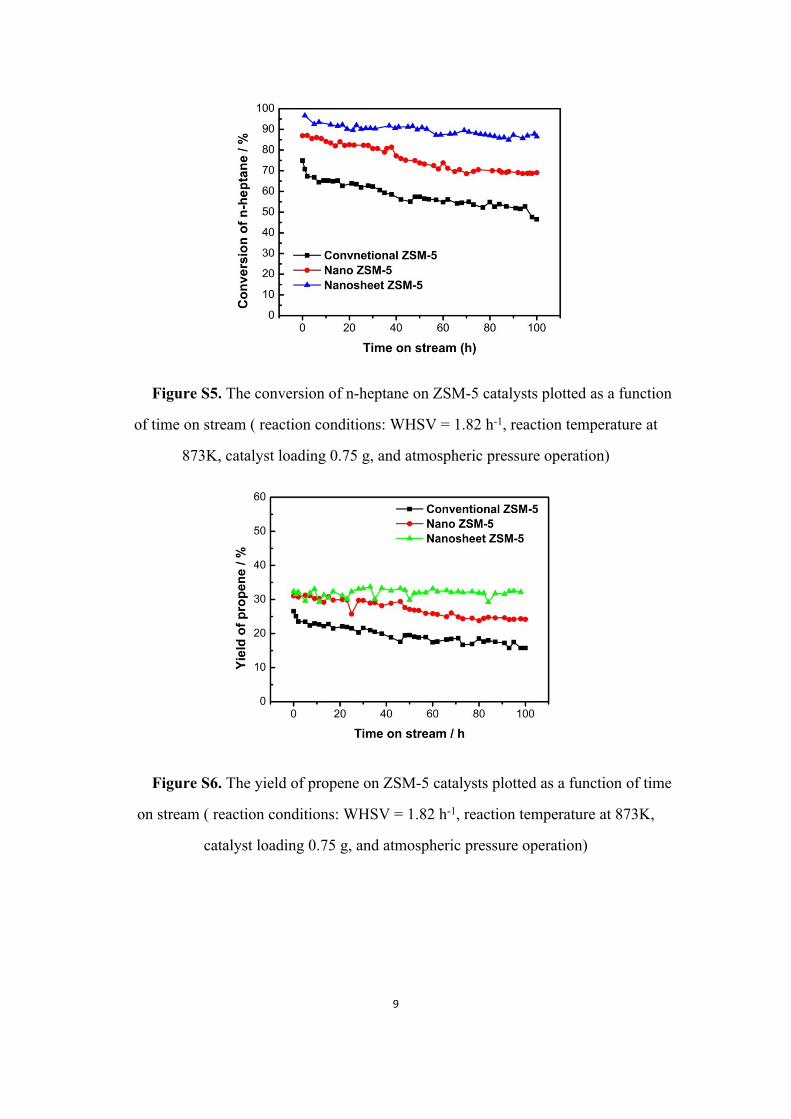
Figure S5. The conversion of n-heptane on ZSM-5 catalysts plotted as a function
of time on stream ( reaction conditions: WHSV = 1.82 h-1, reaction temperature at
873K, catalyst loading 0.75 g, and atmospheric pressure operation)
Figure S6. The yield of propene on ZSM-5 catalysts plotted as a function of time
on stream ( reaction conditions: WHSV = 1.82 h-1, reaction temperature at 873K,
catalyst loading 0.75 g, and atmospheric pressure operation)

10
Figure S7. Nitrogen adsorption-desorption isotherms of the coke deposited
conventional and nanosheet ZSM-5 zeolite catalysts.

11
Table S1. Chemical composition and textural properties of ZSM-5 catalysts.
Sample Si/Ala
AlEFAl/AlTotal
b(%)
SBETc
(m2/g)
Sextd
(m2/g)
Vtole
(cm3/g)
Vmicrof
(cm3/g)
Pore sizeg (nm)
Conventional ZSM-5 49 13.0 307 57 0.2 0.096 -
Nanosheet ZSM-5 54 8.3 515 260 0.4 0.091 4.5
a Si/Al molar ratio was obtained from ICP-OES analysis; b AlEFAl/AlTotal is
estimated from spectral deconvolution and peak areas; c SBET is the BET surface
area obtained from N2 adsorption in relative pressure range (P/P0) of 0.05-0.20;
d Sext is the external surface area determined according to the t-plot method; e
Vtol is the total pore volume obtained at P/P0=0.95. f Vmicro is the micropore
volume obtained evaluated from the t-plot method. g Average diameter
distribution has calculated using the adsorption branch of BJH.
Table S2. Representative parameters of the Raman bands, corresponding to the coke deposited on the catalysts
Catalyst Gp (cm-1) D/G La (nm)
Conventional ZSM-5 1591.3 1.45 1.62
Nanosheet ZSM-5 1598.6 2.11 1.96
There exists a potential correlation between D/G and the in-plane correlation length
La (in nm), which also quantifies the coke particle size
D/G= 0.55 La2 ( Equation 1)

12
References
[1] M. Choi, K. Na, J. Kim, Y. Sakamoto, O. Terasaki and Ryoo, R. Nature. 2009, 461, 246-251.[2] C. A. Emeis, J. Catal. 1993, 141, 347–354.[3] K. Gora-Marek, K. Tarach and M. Choi, J. Phys. Chem. C. 2014, 118, 12266−12274. [4] V. N. Shetti, J. Kim, R. Srivastava, M. Choi and R. Ryoo, J. Catal. 2008, 254, 296–303.


