
Carbon Disclosure Project CDP 2013 Investor CDP 2013 Information Request
Avery Dennison Corporation
Module: Introduction
Page: Introduction
0.1
Introduction
Please give a general description and introduction to your organization Avery Dennison helps make brands more inspiring and the world more intelligent as a global leader in pressure-sensitive technology and materials and retail branding and information solutions. Sales from continuing operations in 2012 were $6 billion. As of year-end 2012, we operated approximately 200 manufacturing and distribution facilities worldwide, employed approximately 30,000 persons, and had operations in over 50 countries. Our reportable business segments in 2012 were (i) Pressure-sensitive Materials (PSM) and (ii) Retail Branding and Information Solutions (RBIS). Our PSM segment manufactures and sells pressure-sensitive label and packaging materials, graphics and graphic films, reflective products, tapes and performance polymers. Our RBIS segment designs, manufactures and sells brand embellishments, graphic tickets, tags, and labels, RFID-enabled inventory and loss prevention solutions, price ticketing and care, content, and origin compliance solutions, and brand protection and security solutions. We formerly had a third reportable business segment, Office and Consumer Products (OCP). Our OCP business develops, manufactures and sells printable media, related computer software, printer card and index products, organization, filing and presentation products, writing instruments, markers, adhesives and specialty products. In January 2013, we entered into an agreement to sell our OCP and Designed and Engineered Solutions (DES) businesses in a transaction expected to close in mid-2013. In addition to our reportable business segments, we have other specialty converting businesses (“Other”) comprised of Vancive Medical Technologies (“Vancive”) and DES. Our Vancive business manufactures pressure-sensitive adhesive products for surgical, wound care, ostomy, and electromedical applications. Our DES businesses manufacture and sell specialty tapes, highly engineered films, pressure-sensitive postage stamps and other converted products.
0.2
Reporting Year
Please state the start and end date of the year for which you are reporting data. The current reporting year is the latest/most recent 12-month period for which data is reported. Enter the dates of this year first.

We request data for more than one reporting period for some emission accounting questions. Please provide data for the three years prior to the current reporting year if you have not provided this information before, or if this is the first time you have answered a CDP information request. (This does not apply if you have been offered and selected the option of answering the shorter questionnaire). If you are going to provide additional years of data, please give the dates of those reporting periods here. Work backwards from the most recent reporting year. Please enter dates in following format: day(DD)/month(MM)/year(YYYY) (i.e. 31/01/2001).
Enter Periods that will be disclosed
Sun 01 Jan 2012 - Mon 31 Dec 2012
0.3
Country list configuration
Please select the countries for which you will be supplying data. This selection will be carried forward to assist you in completing your response
Select country
Argentina
Australia
Bangladesh
Belgium
Brazil
Bulgaria
Canada
Chile
China
Colombia
Czech Republic
Denmark
Dominican Republic
Egypt
El Salvador

Select country
France
Germany
Honduras
Hong Kong
India
Indonesia
Ireland
Italy
Japan
South Korea
Luxembourg
Malaysia
Mexico
Morocco
Netherlands
New Zealand
Norway
Pakistan
Peru
Poland
Portugal
Romania
Singapore
South Africa
Spain
Sri Lanka
Switzerland
Taiwan
Turkey
United Arab Emirates
United Kingdom
United States of America
Vietnam

0.4
Currency selection
Please select the currency in which you would like to submit your response. All financial information contained in the response should be in this currency. USD($)
0.6
Modules
As part of the request for information on behalf of investors, electric utilities, companies with electric utility activities or assets, companies in the automobile or auto component manufacture sectors, companies in the oil and gas industry and companies in the information technology and telecommunications sectors should complete supplementary questions in addition to the main questionnaire. If you are in these sectors (according to the Global Industry Classification Standard (GICS)), the corresponding sector modules will not appear below but will automatically appear in the navigation bar when you save this page. If you want to query your classification, please email [email protected]. If you have not been presented with a sector module that you consider would be appropriate for your company to answer, please select the module below. If you wish to view the questions first, please see https://www.cdproject.net/en-US/Programmes/Pages/More-questionnaires.aspx.
Module: Management [Investor]
Page: 1. Governance
1.1
Where is the highest level of direct responsibility for climate change within your company?
Individual/Sub-set of the Board or other committee appointed by the Board
1.1a
Please identify the position of the individual or name of the committee with this responsibility
To ensure that the Company’s senior management is fully involved and responsible for managing climate change within our company, there is a 3-tier structure with this responsibility: 1. Board of Directors: Governance and Social Responsibility Committee; 2. Corporate Leadership Team which includes the CEO; and 3. the

Corporate Sustainability Steering Committee. The Corporate Sustainability Steering Committee is comprised of business unit presidents, global marketing vice presidents, procurement vice presidents, environmental, health and safety directors, and sustainability leaders
1.2
Do you provide incentives for the management of climate change issues, including the attainment of targets?
Yes
1.2a
Please complete the table
Who is entitled to benefit from these incentives?
The type of incentives
Incentivized performance indicator
Business unit managers Monetary reward
Performance based annual Avery Dennison “Thank You” awards for activities such as increased sales of sustainable products
Energy managers Monetary reward
Performance based annual Avery Dennison “Thank You” awards for activities such as implementing projects with increased efficiency that lead to significant energy savings and progress towards emissions reductions
Environment/Sustainability managers
Monetary reward
Performance based annual Avery Dennison “Thank You” awards for activities such as promoting product innovation and increasing sales of sustainable products.
Facility managers Monetary reward
Performance based annual Avery Dennison “Thank You” awards for activities such as implementing projects with increased efficiency that lead to significant energy savings and progress towards emissions reductions
All employees Monetary reward
Performance based annual Avery Dennison “Thank You” awards for activities such as sustainable product development and implementing projects with increased efficiency that lead to significant energy savings and progress towards emissions reductions
Page: 2. Strategy
2.1

Please select the option that best describes your risk management procedures with regard to climate change risks and opportunities
Integrated into multi-disciplinary company wide risk management processes
2.1a
Please provide further details
i. The scope of our risk management process encompasses regulatory, physical and consumer-related risks and incentives-based opportunities associated with climate change. Multidisciplinary risk management is embedded in Avery Dennison’s strategic planning, innovation and operations processes. We have integrated sustainability, including climate change into these processes, and are rigorously measuring our performance in this area. Risk management is decentralized into our two business units; Pressure Sensitive Materials and Retail Branding Information Services ii. At a company level, the Sustainability Steering Committee identifies, reviews, and, if necessary, acts on climate change related risks and opportunities brought by business unit experts in sustainability and environmental, health, and safety. Climate-change related efforts are guided by our Sustainability Charter – this has three core principles related to People, Planet and Prosperity. iii. At the asset level, Avery Dennison has introduced a number of processes that are designed to assess climate change-related performance, and through this, risks and opportunities. These are on-going and include:
a. Maintaining a web-based sustainability data collection tool. This tool, which is currently being used to collect, amongother things, data relating to our energy usage/carbon footprint, is an ongoing mechanism used for decision-making purposes. b. At the product and customer level, Avery Dennison assesses risks/opportunities through detailed customer research and life cycle analysis of its products These assessments then support expansion of our sustainable product offerings as appropriate to to ensure that the company takes advantage of evolving opportunities. For example, Avery Dennison has developed an LCA-based environmental assessment tool for sustainable product development known as “Avery Dennison Greenprint” which helps customers understand the relative environmental impacts of the products that they buy. We use the Avery Dennison Greenprint tool in our two major business units: Pressure Sensitive Materials and Retail Branding and Information Solutions.
iv. We collect data from our web-based sustainability tracking tool monthly, consolidated and passed to both operational and executive-level management. The Corporate Governance and Social Responsibility Committee, whose responsibilities include reviewing and assessing climate change risks and opportunities meets twice a year and the business unit sustainability steering committees meet four to six times a year. v. Avery Dennison prioritizes climate change risks and opportunities based on impact to our business, the immediacy and likelihood of occurrence. We conduct a material assessment on a biennial basis to ensure that it reflects the sustainability issues most important to our stakeholders and businesses. To identify the issues, we reviewed a variety of sources, including internal strategic plans and reports, customer surveys, media coverage, and Internet postings. We also interviewed more than 35 internal subject matter experts who interact frequently with our various stakeholders. By proactively addressing our material issues, we believe we will create products and programs that fuel our ongoing business success. vi. We report results to the Sustainability Steering Committee, the Corporate Leadership Team and with the Board of Directors. In addition, Avery Dennison has a communication plan for engagement with internal and external stakeholders regarding energy and climate change actions and progress (including disclosure).

Avery Dennison communicates with investors, shareholders and employees through our Annual Report, our Corporate Sustainability Report, the CDP, and our corporate website.
2.2
Is climate change integrated into your business strategy?
Yes
2.2a
Please describe the process and outcomes
i. Avery Dennison’s business strategy focuses on top line growth in all markets, operational excellence and attracting and retaining talent. We recognize that climate change is an important global issue with potential implications to our business. Our Sustainability Charter lays out the primary tenants of how we integrate sustainability and climate change into our business strategy through the following goals: - More sustainable products: Avery Dennison will improve the energy and carbon footprint of our products and services through innovation and life cycle management - More sustainable processes: Avery Dennison will improve the energy and GHG efficiency of our operations and will work toward continual improvement at all facilities - More sustainable purpose: Avery Dennison will communicate and engage with key stakeholders to achieve our energy and climate change goals and to meet the interests of customers, shareholders, employees and the communities where we operate We have embedded sustainability into our strategic planning, innovation and operations processes, and are rigorously measuring performance in this area, Our Energy and Climate Change Strategy corresponds with our business and sustainability strategies, and includes a target to reduce greenhouse gas emissions by 15% as indexed to net revenue from 2005 to 2015. ii. The aspects of climate change that have influenced Avery Dennison’s strategy include regulatory, physical and consumer-related risks and incentives-based opportunities. iii. The key components of our short term strategy that have been influenced by climate change include activities that support our Energy and Climate Change Strategy and enable us to work towards our emission reduction targets, such as energy evaluations and management projects at prioritized sites including: - Energy reclamation and efficiency projects - Building/infrastructure efficiency - Supply-side procurement and peak-load analysis - Alternative energy, as feasible - Teaming with energy experts on energy reductions opportunities, analyses In addition, as part of Avery Dennison’s waste reduction initiatives, the company has started to divert from landfill a growing proportion of its industrial waste by

sending this waste off-site to municipal waste-to-energy facilities. By supporting energy recovery from waste, Avery Dennison is helping to reduce GHG emissions elsewhere, downstream of our operations, by avoiding landfill methane emissions from waste that would have been landfilled. Avery Dennison is expanding its lifecycle program for product design and development and we set internal goals related to product lifecycle in 2012. Our innovation teams use screening lifecycle assessment to evaluate new products with the goal that 80% of new products will have reduced impacts when compared to existing products. iv. The most important components of the long term strategy that have been influenced by climate change include a change in core business focus and development and incorporation of new technologies to reduce our environmental impacts over the next 15 years. v. These activities gain Avery Dennison strategic advantage through cost reductions and by enabling product innovation which will enhance sales and help to reach new markets and customers. vi. The most substantial business decisions made include expanding use of life cycle assessment in product design, partnering and membership in NGO organizations with a focus on GHG reduction. These activities were influenced by stakeholder requests, brand differentiation, desire for a leadership position in sustainability, and reducing energy costs.
2.2b
Please explain why not
2.3
Do you engage in activities that could either directly or indirectly influence policy on climate change through any of the following? (tick all that apply)
Trade associations
2.3a
On what issues have you been engaging directly?
Focus of legislation Corporate Position Details of engagement Proposed solution

2.3b
Are you on the Board of any trade associations or provide funding beyond membership?
Yes
2.3c
Please enter the details of those trade associations that are likely to take a position on climate change legislation
Trade association
Is your position on
climate change
consistent with theirs?
Please explain the trade association's position
How have you, or are you attempting to influence the postion?
National Association of PET Container Resources
Consistent Increased recycled content of PET plastic offsets extraction of virgin material
Yes. We are supporting this position by creating products that align with this position in that they enable food-grade PET recycling so that recycled PET can easily offset virgin PET material
Sustainable Apparel Coalition
Consistent
Avery is in alignment with SAC goals as outlined in the SAC's Higg Facilities Module that includes, among other things, energy management systems and GHG reduction.
Avery participated on a number of working groups in the SAC and holds a co-chair position on the adoption working group. By being a member of the SAC, we are trying to influence the position of the SAC and as an extension, its members.
Tag and Label Manufacturers Association Label Initiative for the Environment
Consistent Measurement is required to set goals that lead to change
Yes. All but one of our operations are LIFE certified. The remaining operation facility will be LIFE certified in 2014
Association of Postconsumer Plastic Recyclers Design for Recyclability
Consistent Increased recycled content of all plastics offsets extraction of virgin material
Yes, We support this position by creating products that enable clean recycling of plastics (PET and HDPE) which can easily offset the extraction of new materials
2.3d
Do you publically disclose a list of all the research organizations that you fund?

2.3e
Do you fund any research organizations to produce public work on climate change?
2.3f
Please describe the work and how it aligns with your own strategy on climate change
2.3g
Please provide details of the other engagement activities that you undertake
2.3h
What processes do you have in place to ensure that all of your direct and indirect activities that influence policy are consistent with your overall climate change strategy?
2.3i
Please explain why you do not engage with policy makers
Page: 3. Targets and Initiatives
3.1

Did you have an emissions reduction target that was active (ongoing or reached completion) in the reporting year?
Intensity target
3.1a
Please provide details of your absolute target
ID
Scope
% of emissions in
scope
% reduction from base year
Base year
Base year emissions
(metric tonnes CO2e)
Target year
Comment
3.1b
Please provide details of your intensity target
ID
Scope
% of emissions in scope
% reduction from base
year
Metric
Base year
Normalized base year emissions
Target year
Comment
Tar1 Scope 1+2
95% 15% Other: Metric tonnes CO2e per Million US$ revenue
2005 85 2015 Target emissions include those from on-site fuel combustion and purchased electricity.
3.1c
Please also indicate what change in absolute emissions this intensity target reflects

ID
Direction of change
anticipated in absolute
Scope 1+2 emissions at
target completion?
% change anticipated in
absolute Scope 1+2 emissions
Direction of change
anticipated in absolute Scope 3
emissions at target
completion?
% change anticipated in
absolute Scope 3 emissions
Comment
Tar1 Increase 7.7
While we anticipate company growth of approximately 30% from 2005-2015, we expect our GHG emissions to only Increase by 7.7% due to our energy and GHG reduction efforts and our 15%reduction in GHG intensity.
3.1d
Please provide details on your progress against this target made in the reporting year
ID
% complete (time)
% complete (emissions)
Comment
Tar1 70% 70% We are on track to meet our reduction target due to energy and GHG reduction efforts
3.1e
Please explain (i) why not; and (ii) forecast how your emissions will change over the next five years
3.2
Does the use of your goods and/or services directly enable GHG emissions to be avoided by a third party?
Yes

3.2a
Please provide details (see guidance)
i) In developing labeling and graphic materials with a smaller carbon footprint, Avery Dennison enables its customers to reduce the carbon footprint of their products. Avery Dennison has conducted a growing number of life cycle assessments (LCA) to identify opportunities to reduce the energy and carbon footprint of our major product lines. Findings to date have shown that the principal opportunities for reducing the environmental impact of our pressure-sensitive labelling and graphics materials lie in the selection of raw materials and the end-of-life disposal of those materials. In contrast, we estimate that the manufacturing phase of our products’ life cycle contributes to less than 10% of the overall impact on the major environmental indicators, including Global Warming Potential. These findings have helped us focus our product innovation on reducing the environmental impact of the materials found in our products by: 1. designing thinner and lighter labelling and trim materials 2. developing bio-based adhesives formulations that reduce consumption of fossil-based materials 3. designing products that facilitate recycling For example, Avery Dennison ThinStream products combine an ultra-thin PET liner material with patented machine technology to yield 17% more labels per roll. With more labels per roll, customers can operate more efficiently by reducing the frequency of roll change-overs and decrease the GHG emissions associated with transporting fewer rolls of materials. We utilize our environmental assessment tool, known as “Avery Dennison Greenprint” to help leading U.S. and European customers estimate the relative energy savings and GHG emissions reductions of the products they buy. By showing a customer the reduction in their environmental footprint, Avery is presenting data that will hopefully influence the customer's choice of product. Avery Dennison also provides materials (“inlays” and tags) for use in radio frequency identification (RFID) applications. RFID technology can enable large-scale retail organizations and consumer product companies track products more efficiently throughout the supply chain. Tracking products more efficiently enables optimization of product shipping and transportation, potentially reducing transportation-related GHG emissions. Access to more sophisticated supply chain data can also assist companies in calculating their products’ carbon footprint and capturing other supply chain efficiencies. ii) For example, a life cycle inventory assessment determined that our Green Film Ruby 2.5 product produces approximately 70% of the GHG emissions per roll of the GHG emissions associated with a comparable traditional MPI 1005 Cast polyvinyl chloride (PVC) film technology. iii) These figures were estimated using the results of a Life Cycle Assessment study that applied the ReCipe impact assessment method to calculate climate change. ReCipe uses the GWPs published in the Intergovernmental Panel on Climate Change (IPCC) Fourth Assessment Report (2007). iv) There are no plans for develop CERs or other credits for GHG emissions reductions resulting from the use of our products.
3.3
Did you have emissions reduction initiatives that were active within the reporting year (this can include those in the planning and implementation phases)
Yes

3.3a
Please identify the total number of projects at each stage of development, and for those in the implementation stages, the estimated CO2e savings
Stage of development
Number of projects
Total estimated annual CO2e savings in metric tonnes CO2e (only for rows marked *)
Under investigation 1
To be implemented* 10 9
Implementation commenced* 0 0
Implemented* 3 16
Not to be implemented 0
3.3b
For those initiatives implemented in the reporting year, please provide details in the table below
Activity type
Description of activity
Estimated annual CO2e
savings (metric tonnes CO2e)
Annual monetary
savings (unit currency - as specified in
Q0.4)
Investment required (unit currency - as specified in
Q0.4)
Payback period
Energy efficiency: Processes
At PSM coating facilities, we optimized the temperatures and throughput of our drying ovens; Scope 1 and 2; voluntary; expected lifetime: 2-5 years
5 1000000 0 <1 year
Energy efficiency: Processes
We reduced heat curing requirements in our heat printing processes at RBIS facilities by using more efficient inks and operating printing presses at standard, more efficient settings; Scope 1 and 2; voluntary;
7
0 <1 year
Energy efficiency: Processes
We purchased digital platform printers to replace existing less energy-efficient technology; Scope 2; voluntary;
4

Activity type
Description of activity
Estimated annual CO2e
savings (metric tonnes CO2e)
Annual monetary
savings (unit currency - as specified in
Q0.4)
Investment required (unit currency - as specified in
Q0.4)
Payback period
Product design
We concentrated on down-gauging products to increase yield. For example, Avery Dennison ThinStream products combine an ultra-thin PET liner material with patented machine technology to yield 17% more labels per roll. This enables customers to increase efficiencies by reducing the frequency of roll change-overs; scope 3; voluntary
3.3c
What methods do you use to drive investment in emissions reduction activities?
Method
Comment
Internal finance mechanisms
Lower return on investment (ROI) specification
3.3d
If you do not have any emissions reduction initiatives, please explain why not
Page: 4. Communication
4.1
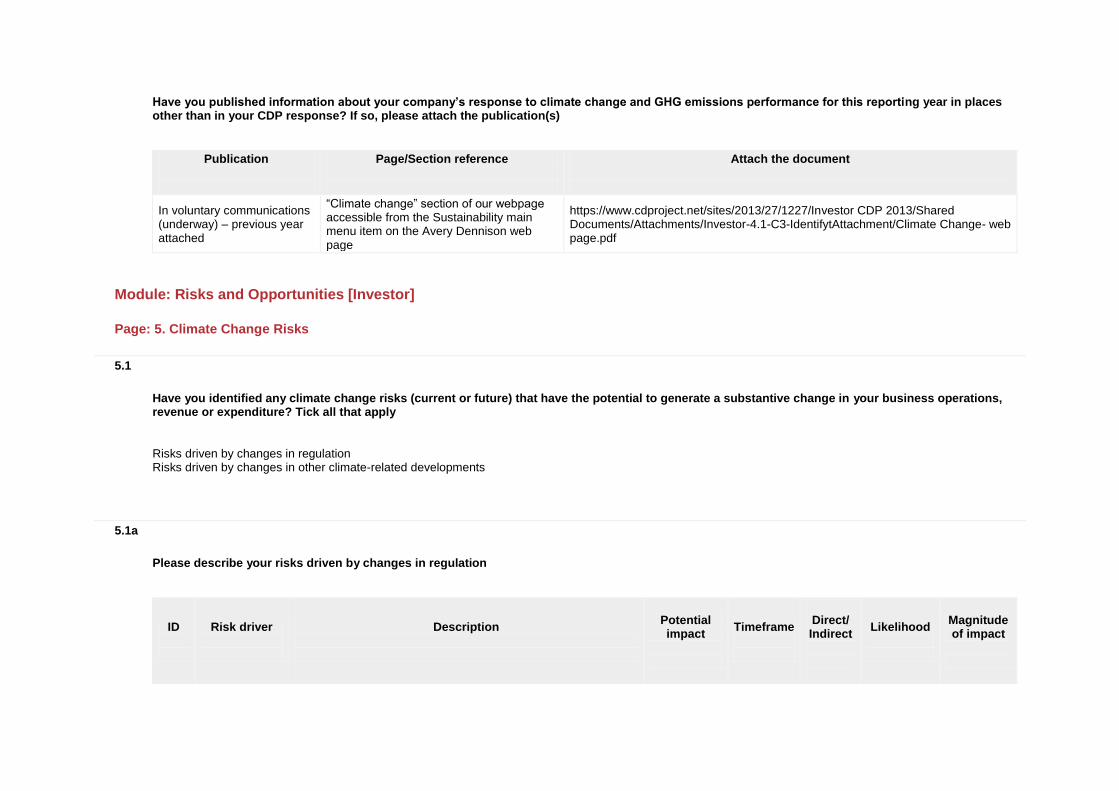
Have you published information about your company’s response to climate change and GHG emissions performance for this reporting year in places other than in your CDP response? If so, please attach the publication(s)
Publication
Page/Section reference
Attach the document
In voluntary communications (underway) – previous year attached
“Climate change” section of our webpage accessible from the Sustainability main menu item on the Avery Dennison web page
https://www.cdproject.net/sites/2013/27/1227/Investor CDP 2013/Shared Documents/Attachments/Investor-4.1-C3-IdentifytAttachment/Climate Change- web page.pdf
Module: Risks and Opportunities [Investor]
Page: 5. Climate Change Risks
5.1
Have you identified any climate change risks (current or future) that have the potential to generate a substantive change in your business operations, revenue or expenditure? Tick all that apply
Risks driven by changes in regulation Risks driven by changes in other climate-related developments
5.1a
Please describe your risks driven by changes in regulation
ID
Risk driver
Description
Potential impact
Timeframe
Direct/ Indirect
Likelihood
Magnitude of impact

ID
Risk driver
Description
Potential impact
Timeframe
Direct/ Indirect
Likelihood
Magnitude of impact
RR_1 Fuel/energy taxes and regulations
Because Avery Dennison is a worldwide company, we face a constantly changing array of environmental regulations with which we must comply. Climate change regulation could affect our operations in one or more regions in the world by increasing operational costs by affecting the prices of key inputs such as electricity and natural gas.
Increased operational cost
1-5 years Direct More likely than not
Low
5.1b
Please describe (i) the potential financial implications of the risk before taking action; (ii) the methods you are using to manage this risk and (iii) the costs associated with these actions
i. Although direct energy costs are not a significant portion of the Company’s operating costs, if we are unable to reduce energy consumption, energy costs could rise. ii. Avery Dennison goes beyond complying with current environmental regulations- We actively track energy use across our operations and have reduced energy consumption by implementing numerous efficiency measures--we organized large-scale kaizen initiatives designed to remove or reduce energy and material-intensity of manufacturing processes at our twenty most energy-intensive facilities. For example, we reduced heat curing requirements in our heat printing processes at RBIS facilities by using more efficient inks and operating printing presses at standard, more efficient settings. Similarly, at PSM coating facilities, we have optimized the temperatures and throughput of our drying ovens. Due to these and other efforts, our energy use declined by 5% from 2005 levels. These measures enable us to mitigate the potential risk of cost increases. iii. The cost of these actions is typically combined with broad sustainability and business initiatives including carbon, energy, and other environmental concerns.
5.1c
Please describe your risks that are driven by change in physical climate parameters

ID
Risk driver
Description
Potential impact
Timeframe
Direct/ Indirect
Likelihood
Magnitude of impact
5.1d
Please describe (i) the potential financial implications of the risk before taking action; (ii) the methods you are using to manage this risk; and (iii) the costs associated with these actions
5.1e
Please describe your risks that are driven by changes in other climate-related developments
ID
Risk driver
Description
Potential impact
Timeframe
Direct/ Indirect
Likelihood
Magnitude of impact
OR_1 Changing consumer behaviour
Increased customer attention on environmental performance of products, including the carbon footprint, could affect their selection of Avery Dennison’s products
Reduced demand for goods/services
Current Direct Likely Low-medium
5.1f
Please describe (i) the potential financial implications of the risk before taking action; (ii) the methods you are using to manage this risk; (iii) the costs associated with these actions

OR_1 i. We are already responding to changing consumer behavior driven by a demand for more sustainable products. The financial implications of the opportunity would be determined by the market shift. With sales of approximately $7 billion, a 1% shift would represent $70million in sales. ii. To manage these risks we are expanding our sustainable product offerings through detailed customer research and life cycle analysis of our products. Our analyzes have helped us focus our product innovation on reducing the environmental impact of the materials found in our products by: 1. designing thinner and lighter labeling and trim materials 2. developing bio-based adhesives formulations that reduce consumption of fossil-based materials 3. designing products that facilitate recycling We utilize our environmental assessment tool, known as “Avery Dennison Greenprint” to help leading U.S. and European customers estimate the relative energy savings and GHG emissions reductions of the products they buy. The Avery Dennison Greenprint tool has been used in our two major business units: Label and Packaging Materials and Retail Branding and Information Solutions. iii. We are investing $200,000 annually in developing and marketing products that help reduce environmental impact. Conducting Life Cycle Assessments of our products cost approximately $30,000 per product.
5.1g
Please explain why you do not consider your company to be exposed to risks driven by changes in regulation that have the potential to generate a substantive change in your business operations, revenue or expenditure
5.1h
Please explain why you do not consider your company to be exposed to risks driven by physical climate parameters that have the potential to generate a substantive change in your business operations, revenue or expenditure
i. We do not consider our company to be exposed to substantive physical climate parameter risks. ii. Based on an analysis of physical climate parameters that have the potential to impact our business, Avery Dennison does not anticipate manufacturing or distribution facilities to be significantly impacted by climate change-induced extreme weather events. The company’s facilities are generally located inland, and should not be significantly impacted by sea level rise, flood zones or storm-affected areas. The company does not have sites in the high-catastrophic exposure areas along the Gulf Coast. The Company has some flood exposures: • Kent, Washington. • Champ-sur-Drac if the dam should fail. • Dutch flood exposure related to ocean water level.

Increased insurance premiums have not been assigned in the past or currently, nor has there been an adverse or supplemental impact to coverage. Property damage due to flood or severe weather is covered under current Company insurance. We believe that we are typical in this respect relative to other companies in our peer group. While Avery Dennison could potentially experience disruptions in its supply chain (e.g., shortage or delay of key raw material inputs) resulting from extreme weather events, the company continually seeks to qualify alternative suppliers on a global basis to mitigate such events. The company does not anticipate significant disruptions in the physical distribution of its products resulting from an extreme weather event. Based on current information for these locations, disruption of manufacturing products and transportation of products would be reassigned to other manufacturing or distribution locations under the business continuity plan. The impact to business interruption is not likely to be significant since there are other manufacturing and distribution centers to accommodate business needs. Demand for the company’s products from customers affected by extreme weather events could be impacted; however, given the company’s breadth of operations globally and the relatively low degree of customer/industry concentration, Avery Dennison does not consider reduced customer demand following an extreme weather event to be a significant risk to the company’s financial bottom line. iii. We considered the impact of sea level rise, flooding and storm event on our facilities, insurance costs, potential supply chain and distribution disruptions, and customer demand, as detailed above. iv. We included all of Avery Dennison’s global operations in this assessment v. Our analysis considered physical risks in the 1-5 year timeframe. We continue to consider and reevaluate risks driven by physical climate parameters as part of our risk management procedure described in Question 2a.
5.1i
Please explain why you do not consider your company to be exposed to risks driven by changes in other climate-related developments that have the potential to generate a substantive change in your business operations, revenue or expenditure
Page: 6. Climate Change Opportunities
6.1
Have you identified any climate change opportunities (current or future) that have the potential to generate a substantive change in your business operations, revenue or expenditure? Tick all that apply
Opportunities driven by changes in regulation Opportunities driven by changes in other climate-related developments

6.1a
Please describe your opportunities that are driven by changes in regulation
ID
Opportunity driver
Description
Potential impact
Timeframe
Direct/Indirect
Likelihood
Magnitude of impact
RO_1 Emission reporting obligations
Avery Dennison could efficiently meet reporting obligations due to our multiple year experience with carbon and energy management tracking and reporting on a voluntary basis. This experience can create a cost advantage relative to less prepared competitors.
Reduced operational costs
1-5 years Direct Very likely Low-medium
6.1b
Please describe (i) the potential financial implications of the opportunity; (ii) the methods you are using to manage this opportunity and (iii) the costs associated with these actions
i. Specific costs associated with emissions reporting obligations will vary based on the type of program and scope, as well as the implementation; Avery Dennison has several years of experience measuring and voluntarily reporting emissions data, and may be more prepared for reporting requirements than competitors, resulting in a potential cost advantage. We have become increasingly more efficient at preparing our corporate GHG inventory. ii. To manage this opportunity we utilize a corporate-wide web-based sustainability data collection tool. We use this tool to collect, amongst other things, data relating to energy usage/carbon footprint. We collect data on a monthly basis that we use for tracking and reporting. iii. The cost of these actions are combined with other sustainability and business initiatives and strategies. We estimate we invested approximately $85,000 to update our sustainability data base in 2012.
6.1c
Please describe the opportunities that are driven by changes in physical climate parameters

ID
Opportunity driver
Description
Potential impact
Timeframe
Direct/ Indirect
Likelihood
Magnitude of impact
6.1d
Please describe (i) the potential financial implications of the opportunity; (ii) the methods you are using to manage this opportunity and (iii) the costs associated with these actions
6.1e
Please describe the opportunities that are driven by changes in other climate-related developments
ID
Opportunity driver
Description
Potential impact Timeframe
Direct/ Indirect
Likelihood
Magnitude of impact
OO_1 Changing consumer behaviour
Customers increasingly judge products based on their environmental performance. Avery Dennison has the opportunity to increase sales by developing products that have relatively lower carbon footprint than our competitors.
Increased demand for existing products/services
Current Direct Likely Medium
6.1f
Please describe (i) the potential financial implications of the opportunity; (ii) the methods you are using to manage this opportunity; (iii) the costs associated with these actions
i. We are responding to changing consumer behavior driven by a demand for more sustainable products, such as our ThinStream products that combine an ultra-thin PET liner material with patented machine technology to yield 17% more labels per roll. With more labels per roll, customers can operate more efficiently by

reducing the frequency of roll change-overs and decrease the GHG emissions associated with transporting fewer rolls of materials. The financial implications of the opportunity would be determined by the market shift. With sales of approximately $7 billion, a 1% shift would represent $70million in sales. ii. To manage these opportunities we are expanding our sustainable product offerings through detailed customer research and life cycle analysis of our products. Our analyzes have helped us focus our product innovation on reducing the environmental impact of the materials found in our products by: 1. designing thinner and lighter labeling and trim materials 2. developing bio-based adhesives formulations that reduce consumption of fossil-based materials 3. designing products that facilitate recycling iii. We utilize our environmental assessment tool, known as “Avery Dennison Greenprint” to help leading U.S. and European customers estimate the relative energy savings and GHG emissions reductions of the products they buy. The Avery Dennison Greenprint tool has been used in our two major business units: Label and Packaging Materials and Retail Branding and Information Solutions. The costs associated with these actions include investing $200,000 annually in developing and marketing products that help reduce environmental impact. Conducting Life Cycle Assessments of our products cost approximately $30,000 per product
6.1g
Please explain why you do not consider your company to be exposed to opportunities driven by changes in regulation that have the potential to generate a substantive change in your business operations, revenue or expenditure
6.1h
Please explain why you do not consider your company to be exposed to opportunities driven by physical climate parameters that have the potential to generate a substantive change in your business operations, revenue or expenditure
i. We do not consider our company to be exposed to substantive physical climate parameter opportunities. ii. We do not consider opportunities driven by physical climate change substantive to our Company because costs related to physical changes to the environment will likely have a similar impact across the industry and may occur gradually enough to allow for the marketplace to react. iii. We considered opportunities in resulting from physical climate change parameters on our operations, supply chain and distribution. iv. We included all of Avery Dennison’s global operations in this assessment v. Our analysis considered physical opportunities in the 1-5 year timeframe.
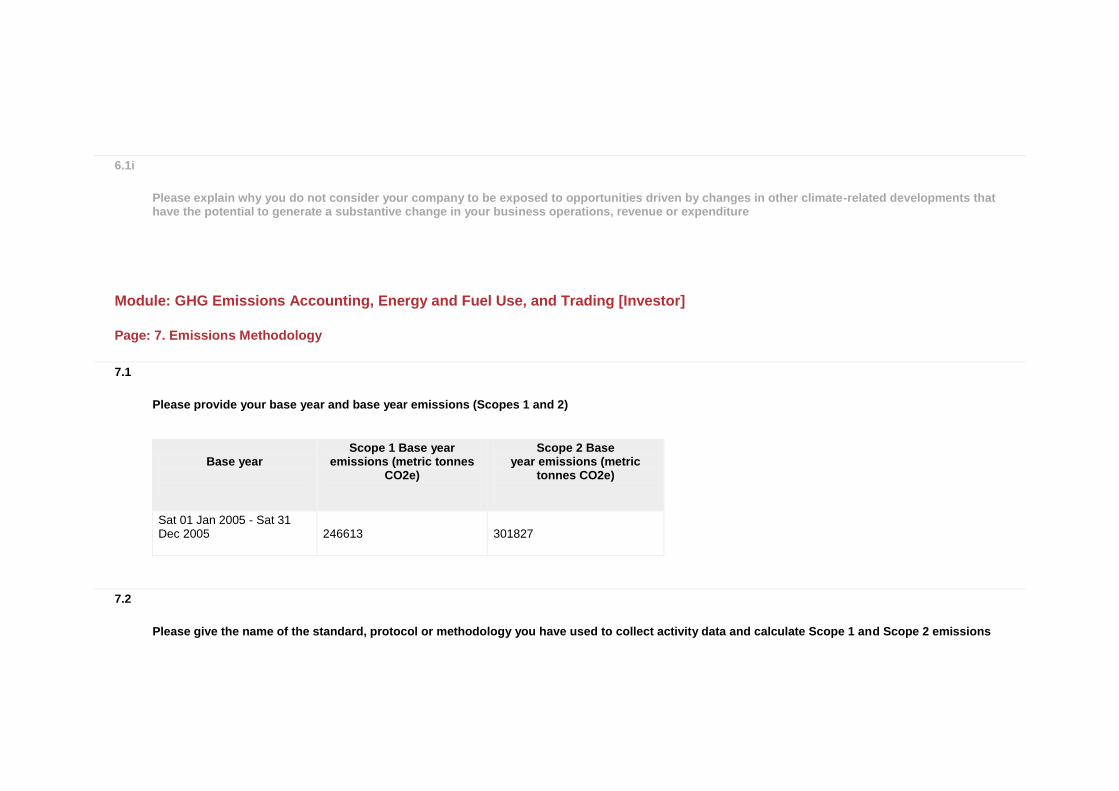
6.1i
Please explain why you do not consider your company to be exposed to opportunities driven by changes in other climate-related developments that have the potential to generate a substantive change in your business operations, revenue or expenditure
Module: GHG Emissions Accounting, Energy and Fuel Use, and Trading [Investor]
Page: 7. Emissions Methodology
7.1
Please provide your base year and base year emissions (Scopes 1 and 2)
Base year
Scope 1 Base year emissions (metric tonnes
CO2e)
Scope 2 Base year emissions (metric
tonnes CO2e)
Sat 01 Jan 2005 - Sat 31 Dec 2005
246613 301827
7.2
Please give the name of the standard, protocol or methodology you have used to collect activity data and calculate Scope 1 and Scope 2 emissions

Please select the published methodologies that you use
The Greenhouse Gas Protocol: A Corporate Accounting and Reporting Standard (Revised Edition)
7.2a
If you have selected "Other", please provide details below
7.3
Please give the source for the global warming potentials you have used
Gas
Reference
CO2 IPCC Second Assessment Report (SAR - 100 year)
CH4 IPCC Second Assessment Report (SAR - 100 year)
N2O IPCC Second Assessment Report (SAR - 100 year)
7.4
Please give the emissions factors you have applied and their origin; alternatively, please attach an Excel spreadsheet with this data
Fuel/Material/Energy
Emission Factor
Unit
Reference
Page: 8. Emissions Data - (1 Jan 2012 - 31 Dec 2012)

8.1
Please select the boundary you are using for your Scope 1 and 2 greenhouse gas inventory
Operational control
8.2
Please provide your gross global Scope 1 emissions figures in metric tonnes CO2e
160558
8.3
Please provide your gross global Scope 2 emissions figures in metric tonnes CO2e
367087
8.4
Are there are any sources (e.g. facilities, specific GHGs, activities, geographies, etc.) of Scope 1 and Scope 2 emissions which are not included in your disclosure?
Yes
8.4a
Please complete the table
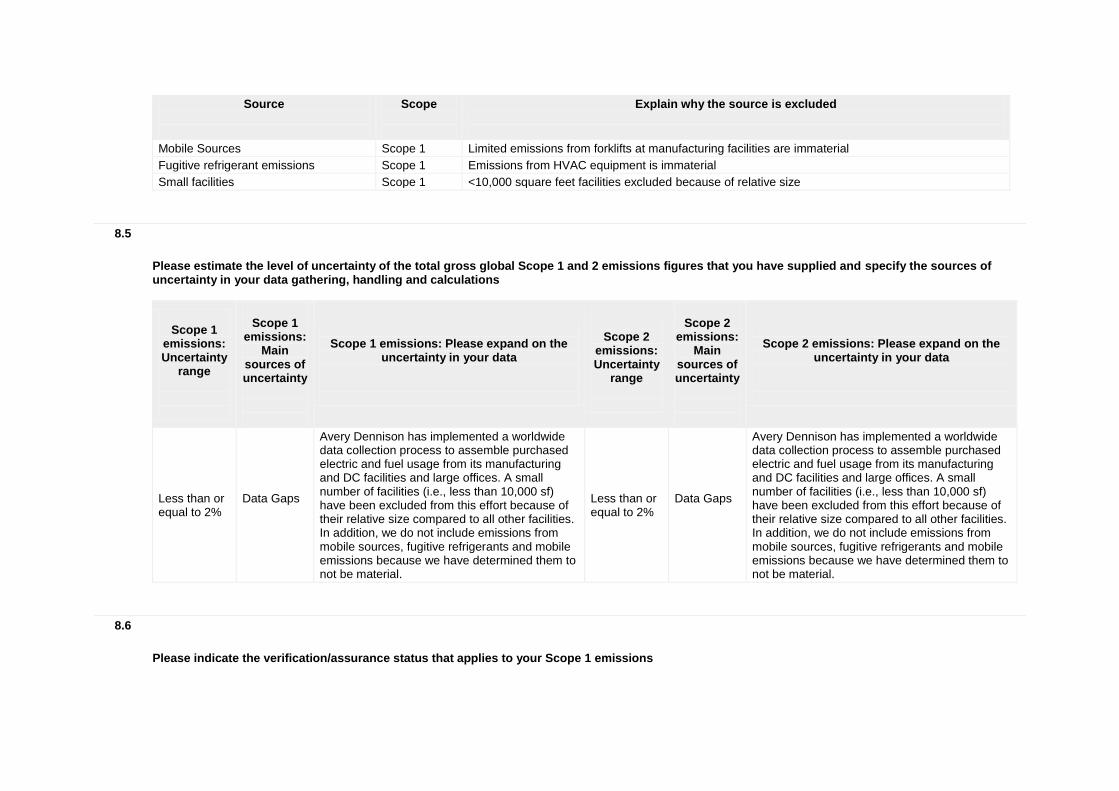
Source
Scope
Explain why the source is excluded
Mobile Sources Scope 1 Limited emissions from forklifts at manufacturing facilities are immaterial
Fugitive refrigerant emissions Scope 1 Emissions from HVAC equipment is immaterial
Small facilities Scope 1 <10,000 square feet facilities excluded because of relative size
8.5
Please estimate the level of uncertainty of the total gross global Scope 1 and 2 emissions figures that you have supplied and specify the sources of uncertainty in your data gathering, handling and calculations
Scope 1
emissions: Uncertainty
range
Scope 1
emissions: Main
sources of uncertainty
Scope 1 emissions: Please expand on the
uncertainty in your data
Scope 2
emissions: Uncertainty
range
Scope 2
emissions: Main
sources of uncertainty
Scope 2 emissions: Please expand on the
uncertainty in your data
Less than or equal to 2%
Data Gaps
Avery Dennison has implemented a worldwide data collection process to assemble purchased electric and fuel usage from its manufacturing and DC facilities and large offices. A small number of facilities (i.e., less than 10,000 sf) have been excluded from this effort because of their relative size compared to all other facilities. In addition, we do not include emissions from mobile sources, fugitive refrigerants and mobile emissions because we have determined them to not be material.
8.6
Please indicate the verification/assurance status that applies to your Scope 1 emissions

No third party verification or assurance
8.6a
Please indicate the proportion of your Scope 1 emissions that are verified/assured
8.6b
Please provide further details of the verification/assurance undertaken, and attach the relevant statements
Type of verification or assurance
Relevant standard
Attach the document
8.6c
Please provide further details of the regulatory regime to which you are complying that specifies the use of Continuous Emissions Monitoring Systems (CEMS)
Regulation
% of emissions covered by the system Compliance period
Evidence of submission
8.7
Please indicate the verification/assurance status that applies to your Scope 2 emissions
No third party verification or assurance
8.7a

Please indicate the proportion of your Scope 2 emissions that are verified/assured
8.7b
Please provide further details of the verification/assurance undertaken, and attach the relevant statements
Type of verification or assurance
Relevant standard
Attach the document
8.8
Are carbon dioxide emissions from biologically sequestered carbon relevant to your organization?
No
8.8a
Please provide the emissions in metric tonnes CO2
Page: 9. Scope 1 Emissions Breakdown - (1 Jan 2012 - 31 Dec 2012)
9.1
Do you have Scope 1 emissions sources in more than one country?

Yes
9.1a
Please complete the table below
Country/Region
Scope 1 metric tonnes CO2e
North America 83319
Europe, Middle East and Africa (EMEA) 51385
Asia Pacific (or JAPA) 19376
Latin America (LATAM) 6478
9.2
Please indicate which other Scope 1 emissions breakdowns you are able to provide (tick all that apply)
By business division
9.2a
Please break down your total gross global Scope 1 emissions by business division
Business division
Scope 1 emissions (metric tonnes CO2e)
Corporate 739
Pressure Sensitive Materials 122053
Office and Consumer Products 1952
Retail Branding and Information Solutions 9067
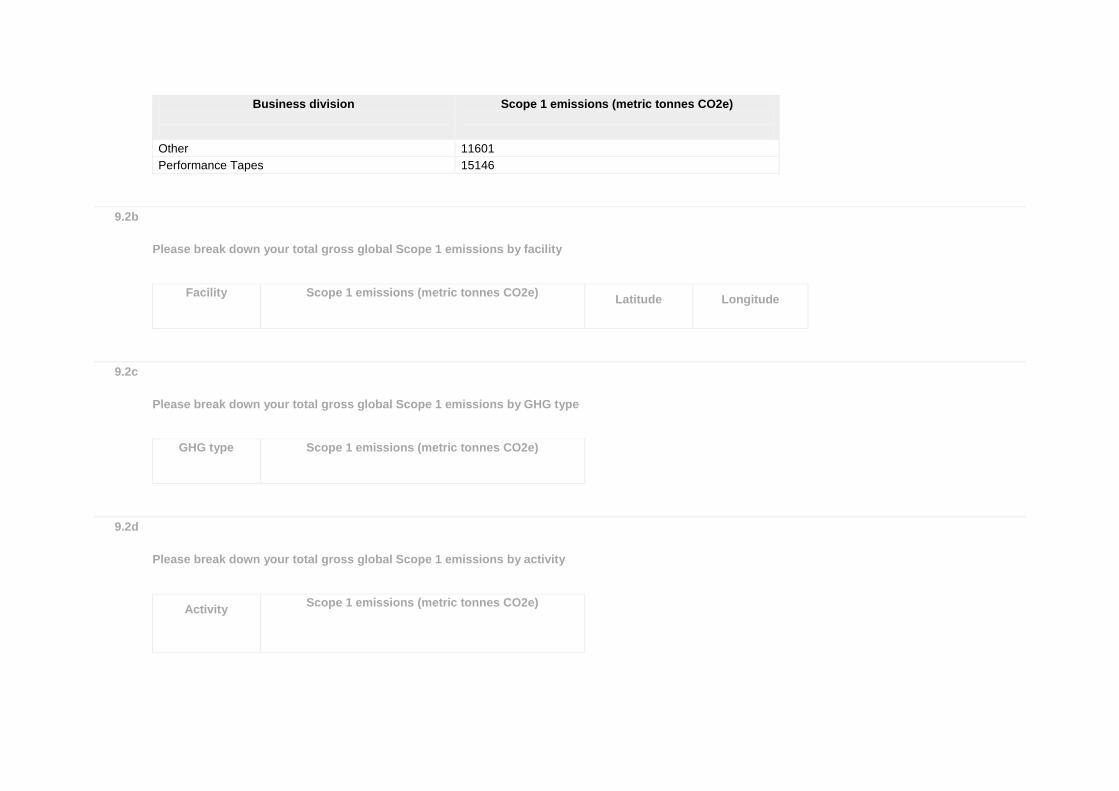
Business division
Scope 1 emissions (metric tonnes CO2e)
Other 11601
Performance Tapes 15146
9.2b
Please break down your total gross global Scope 1 emissions by facility
Facility
Scope 1 emissions (metric tonnes CO2e)
Latitude
Longitude
9.2c
Please break down your total gross global Scope 1 emissions by GHG type
GHG type
Scope 1 emissions (metric tonnes CO2e)
9.2d
Please break down your total gross global Scope 1 emissions by activity
Activity
Scope 1 emissions (metric tonnes CO2e)

9.2e
Please break down your total gross global Scope 1 emissions by legal structure
Legal structure
Scope 1 emissions (metric tonnes CO2e)
Page: 10. Scope 2 Emissions Breakdown - (1 Jan 2012 - 31 Dec 2012)
10.1
Do you have Scope 2 emissions sources in more than one country?
Yes
10.1a
Please complete the table below
Country/Region
Scope 2 metric tonnes CO2e
Purchased and consumed electricity, heat, steam or cooling
(MWh)
Purchased and consumed low carbon electricity, heat, steam or cooling
(MWh)
Asia Pacific (or JAPA) 130439
Europe, Middle East and Africa (EMEA) 49460
Latin America (LATAM) 4557
North America 182631
10.2
Please indicate which other Scope 2 emissions breakdowns you are able to provide (tick all that apply)

By business division
10.2a
Please break down your total gross global Scope 2 emissions by business division
Business division
Scope 2 emissions (metric tonnes CO2e)
Corporate 1397
Pressure Sensitive Materials 169627
Office and Consumer Products 25230
Retail Branding and Information Solutions 130512
Performance Tapes 14316
Other 26005
10.2b
Please break down your total gross global Scope 2 emissions by facility
Facility
Scope 2 emissions (metric tonnes CO2e)
10.2c
Please break down your total gross global Scope 2 emissions by activity
Activity
Scope 2 emissions (metric tonnes CO2e)

10.2d
Please break down your total gross global Scope 2 emissions by legal structure
Legal structure
Scope 2 emissions (metric tonnes CO2e)
Page: 11. Energy
11.1
What percentage of your total operational spend in the reporting year was on energy?
More than 0% but less than or equal to 5%
11.2
Please state how much fuel, electricity, heat, steam, and cooling in MWh your organization has purchased and consumed during the reporting year
Energy type
MWh
Fuel 874769
Electricity 574134
Heat 0
Steam 0
Cooling 0
11.3
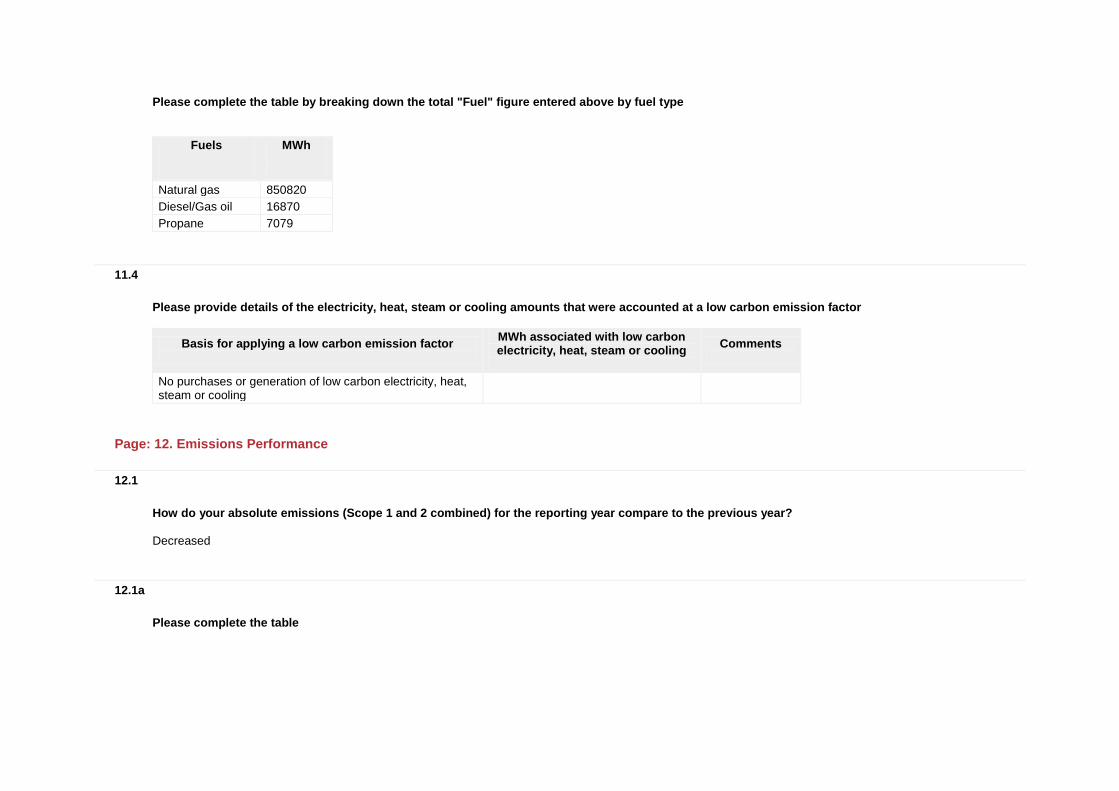
Please complete the table by breaking down the total "Fuel" figure entered above by fuel type
Fuels
MWh
Natural gas 850820
Diesel/Gas oil 16870
Propane 7079
11.4
Please provide details of the electricity, heat, steam or cooling amounts that were accounted at a low carbon emission factor
Basis for applying a low carbon emission factor
MWh associated with low carbon electricity, heat, steam or cooling
Comments
No purchases or generation of low carbon electricity, heat, steam or cooling
Page: 12. Emissions Performance
12.1
How do your absolute emissions (Scope 1 and 2 combined) for the reporting year compare to the previous year?
Decreased
12.1a
Please complete the table

Reason
Emissions value (percentage)
Direction of change
Comment
Emissions reduction activities 3 Decrease Emission reduction activities including process optimization and installing more efficient equipment
Divestment
Acquisitions
Mergers
Change in output
Change in methodology
Change in boundary
Change in physical operating conditions
Unidentified
Other
12.2
Please describe your gross combined Scope 1 and 2 emissions for the reporting year in metric tonnes CO2e per unit currency total revenue
Intensity figure
Metric numerator
Metric denominator
% change from previous year
Direction of change from previous year
Reason for change
0.000076 metric tonnes CO2e
unit total revenue 4.6 Decrease Total GHG emissions reduced by over 3% and our revenue increased by 2%
12.3
Please describe your gross combined Scope 1 and 2 emissions for the reporting year in metric tonnes CO2e per full time equivalent (FTE) employee

Intensity figure
Metric numerator
Metric denominator
% change from previous year
Direction of change from previous year
Reason for change
16.7 metric tonnes CO2e
FTE employee 3.5 Decrease Total GHG emissions reduced by over 3% and our total FTEs remained constant
12.4
Please provide an additional intensity (normalized) metric that is appropriate to your business operations
Intensity figure
Metric numerator
Metric denominator
% change from previous year
Direction of change from previous year
Reason for change
Page: 13. Emissions Trading
13.1
Do you participate in any emissions trading schemes?
No, and we do not currently anticipate doing so in the next 2 years
13.1a
Please complete the following table for each of the emission trading schemes in which you participate
Scheme name
Period for which data is supplied
Allowances allocated
Allowances purchased
Verified emissions in metric tonnes CO2e
Details of ownership

13.1b
What is your strategy for complying with the schemes in which you participate or anticipate participating?
13.2
Has your company originated any project-based carbon credits or purchased any within the reporting period?
No
13.2a
Please complete the table
Credit origination
or credit purchase
Project type
Project identification
Verified to which standard
Number of credits (metric
tonnes of CO2e)
Number of credits (metric tonnes
CO2e): Risk adjusted volume
Credits retired
Purpose, e.g. compliance
Page: 14. Scope 3 Emissions
14.1
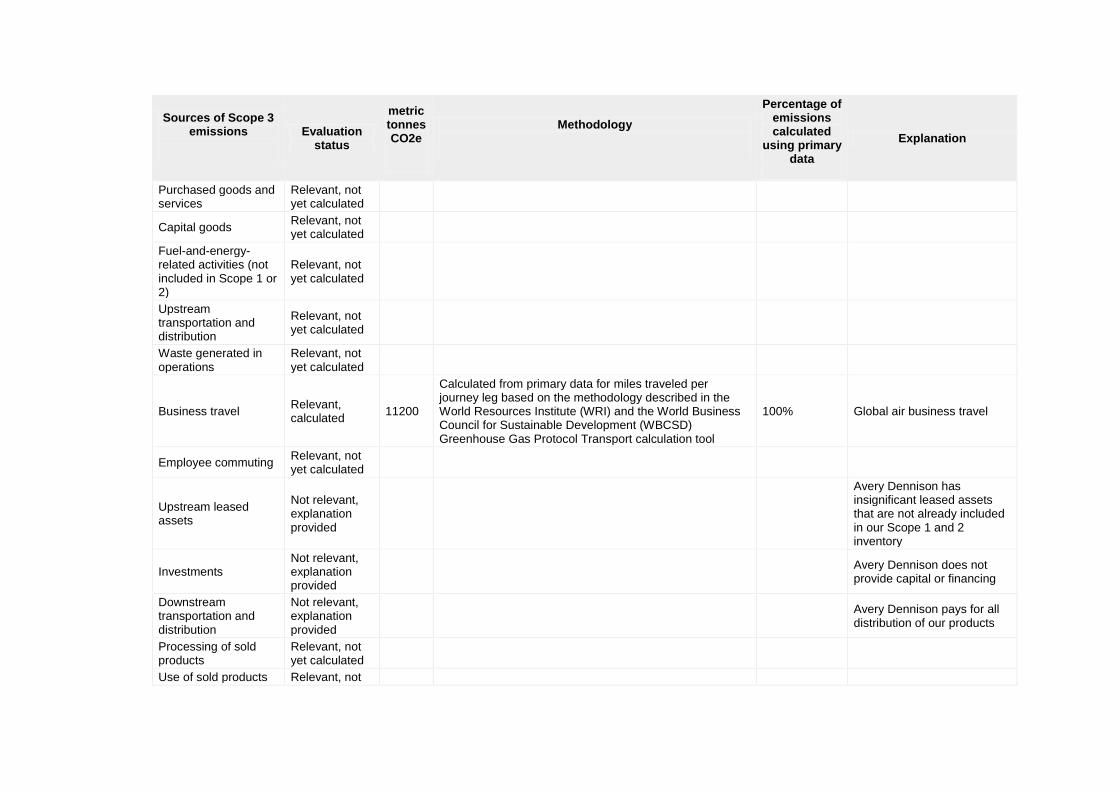
Please account for your organization’s Scope 3 emissions, disclosing and explaining any exclusions
Sources of Scope 3 emissions
Evaluation status
metric tonnes CO2e
Methodology
Percentage of emissions calculated
using primary data
Explanation
Sources of Scope 3 emissions
Evaluation status
metric tonnes CO2e
Methodology
Percentage of emissions calculated
using primary data
Explanation
Purchased goods and services
Relevant, not yet calculated
Capital goods Relevant, not yet calculated
Fuel-and-energy-related activities (not included in Scope 1 or 2)
Relevant, not yet calculated
Upstream transportation and distribution
Relevant, not yet calculated
Waste generated in operations
Relevant, not yet calculated
Business travel Relevant, calculated
11200
Calculated from primary data for miles traveled per journey leg based on the methodology described in the World Resources Institute (WRI) and the World Business Council for Sustainable Development (WBCSD) Greenhouse Gas Protocol Transport calculation tool
100% Global air business travel
Employee commuting Relevant, not yet calculated
Upstream leased assets
Not relevant, explanation provided
Avery Dennison has insignificant leased assets that are not already included in our Scope 1 and 2 inventory
Investments Not relevant, explanation provided
Avery Dennison does not provide capital or financing
Downstream transportation and distribution
Not relevant, explanation provided
Avery Dennison pays for all distribution of our products
Processing of sold products
Relevant, not yet calculated
Use of sold products Relevant, not

Sources of Scope 3 emissions
Evaluation status
metric tonnes CO2e
Methodology
Percentage of emissions calculated
using primary data
Explanation
yet calculated
End of life treatment of sold products
Relevant, not yet calculated
Downstream leased assets
Not relevant, explanation provided
Avery Dennison does not leases space to other entities
Franchises Not relevant, explanation provided
Avery Dennison does not have franchises
Other (upstream)
Other (downstream)
14.2
Please indicate the verification/assurance status that applies to your Scope 3 emissions
No third party verification or assurance
14.2a
Please indicate the proportion of your Scope 3 emissions that are verified/assured
14.2b
Please provide further details of the verification/assurance undertaken, and attach the relevant statements

Type of verification or assurance
Relevant standard
Attach the document
14.3
Are you able to compare your Scope 3 emissions for the reporting year with those for the previous year for any sources?
No, this is our first year of estimation
14.3a
Please complete the table
Sources of Scope 3
emissions
Reason for change
Emissions value
(percentage)
Direction of change
Comment
14.4
Do you engage with any of the elements of your value chain on GHG emissions and climate change strategies? (Tick all that apply)
Yes, our suppliers Yes, our customers Yes, other partners in the value chain

14.4a
Please give details of methods of engagement, your strategy for prioritizing engagements and measures of success
i) We engage with our customers through utilizing Avery Dennison Greenprint, a LCA-based tool that helps them to measure the environmental impact (including GHG emissions) of their labeling product choices. In addition, our Pressure Sensitive Materials operations participate in Label Initiative for the Environment, an external audit and reporting system of the Tag and Label Manufacturers Institute and our RBIS operations implement the facilities module (which includes energy, environmental and water modules) of the Sustainable Apparel Coalition ii) We prioritize engagements by impact on the full value chain, potential sales and opportunities; and measure success by improvements in tracking, sales.
14.4b
To give a sense of scale of this engagement, please give the number of suppliers with whom you are engaging and the proportion of your total spend that they represent
Number of suppliers
% of total spend Comment
14.4c
If you have data on your suppliers’ GHG emissions and climate change strategies, please explain how you make use of that data
How you make use of the data
Please give details
14.4d
Please explain why not and any plans you have to develop an engagement strategy in the future
Module: Sign Off

Page: Sign Off
Please enter the name of the individual that has signed off (approved) the response and their job title
CDP 2013 Investor CDP 2013 Information Request


