We wish to thank Ron Alquist for his invaluable research assistance. We also thank George1
Akerlof, Bill Brainard, Marc Noland, George Perry, Carmen Reinhart and Dani Rodrik for comments onearlier drafts. Financial support was provided by the Tokyo Club Foundation for Global Studies.
Meeting Draft (revised)March 15, 1999
Capital Flows to Developing Economies:Implications for Saving and Investment
Barry Bosworth The Brookings Institution
andSusan M. Collins
The Brookings Institution &Georgetown University1
The currency crises that broke out in East Asia in mid-1997 have been followed by a year
of tumult in international financial markets. These crises have seriously impacted the emerging
market economies, forcing many to raise domestic interest rates so as to stem an outflow of
financial capital and prevent further exchange rate collapse. Interest rate increases have, in turn,
depressed domestic economic activity. Not surprisingly, this severe financial instability has
intensified ongoing discussions about the benefits and risks to developing economies from
allowing capital to flow freely across national borders.
For many developing countries, the ability to draw upon an international pool of financial
capital offers large potential benefits. Economic output in these countries is held down by low
levels of capital per worker. Foreign resource inflows -- current account deficits -- can be used to
augment their private saving and reach higher rates of capital accumulation and growth. Access
to international capital markets provides the means to finance those resource flows. It is also
2
Recent literature emphasizing the potential role for FDI to raise growth through technological2
diffusion includes Borensztein et. al. (1998) and Grossman and Helpman (1991, chapters 11 &12).
For more discussion of the potential benefits, see Eatwell (1996, UNDP) and Obstfeld (May 1998,3
NBER 6559).
A useful discussion of this issue is provided in Fischer et al (1998).4
argued that some types of foreign capital inflows, principally foreign direct investment, facilitate
the transfer of managerial and technological knowhow. Portfolio investment and foreign bank2
lending are seen as adding to the depth and breadth of domestic financial markets. Some
proponents have gone on to argue that, by increasing the rewards for good policies and the
penalties for bad policies, the free flow of capital across national borders has the salutary effect of
promoting more disciplined macroeconomic policies and reducing the frequency of policy errors. 3
By the mid-1990s, support for open financial markets had grown to the extent that some officials
suggested amending the IMF charter to place capital account convertibility on the same level of
desirability as a convertible current account. Some analysts reason that the obvious benefits of4
open trade in goods and services creates a presumption of positive net benefits for open cross-
border trade in all financial instruments.
On the other hand, the opening of domestic financial markets to cross-border transactions
creates added risks, as evidenced by the frequency of currency crises, particularly in developing
countries. These crises have most often been blamed on mistaken macroeconomic policies in the
affected countries, or what is characterized as bad fundamentals. But the recent crises in Mexico
and East Asia, countries with reasonably successful policy regimes, have called attention to the
inherent instability of financial markets, and the risks that cross-border financial transactions can
raise for countries with relatively unsophisticated financial systems and weak regulatory oversight.
3
World Bank (1997, pp. 89-91). From the investor perspective the puzzle is why there is so little5
international diversification of portfolios, French and Poterba (1991).
Today’s crises are seen as similar to the bank runs or financial panics that plagued the U.S.
banking system of the 19th century in the sense that they are triggered by liquidity problems as
countries get caught in a maturity mismatch of their foreign assets and liabilities. In addition,
international financial transactions involve hazards that are not present within domestic markets,
especially the risk of exchange rate changes. And when markets are stressed, governments are
inevitably drawn in by their commitment to an explicit exchange rate or by the societal
consequences of large swings in currency values.
Most of the current policy discussion implicitly accepts the notion that open capital
markets are highly beneficial, and proposals for reform have been directed toward reducing the
risks of financial instability and crises. But, few resources have been devoted to a systematic
evaluation of the benefits of open capital markets. The benefits to foreign investors seem quite
evident and stem largely from the higher expected long-term rates of return and opportunities for
risk diversification. The return on investments in emerging markets shows a low correlation with
overall global indexes of the return, and returns among emerging markets often exhibit low
correlations with one another. Much less is known about the benefits to the economies receiving5
foreign capital inflows. In particular, little is known about the extent to which the promise of
expanded resources for investment and growth has been realized. In part, this is due to the
inherent difficulties in constructing counter-factual outcomes in the absence of such inflows.
There is also a severe shortage of historical data. The international financial market
largely disappeared with the outbreak of World War I; and, in contrast to current arguments
4
Most countries were concerned not with the potential instability, but with the pressures that capital6
inflows would create for an appreciation of their currencies.
Frankel (1986). However, in earlier years individual countries did allow capital inflows for specific7
projects, such as the development of Norway’s oil reserves in the mid-1970s.
about the benefits of capital inflows, reconstruction of the industrial economies was conducted
within a regime of tight capital controls. Most countries prohibited all but direct investment until
the mid-1970s. The free international flow of financial capital became feasible only as countries6
moved away from the Bretton Woods system of fixed exchange rates. Previously, countries with
fixed exchange rates maintained control over external financial transactions as a means of
obtaining some freedom for monetary policy to address domestic concerns. Even as late as 1980,
only six industrial countries were judged as having open financial markets - Canada, Germany, the
Netherlands, Switzerland, the United Kingdom, and the United States. Most financial flows to7
developing countries, other than direct investment, took the form of government borrowing from
official organizations or from private banks in the industrial economies. Large-scale flows of
portfolio capital to developing economies are primarily phenomena of the 1990s.
In this study we attempt to evaluate the implications of capital inflows for the recipient
countries by developing a panel data set covering 58 developing economies and annual
information on the balance of payments, domestic investment and saving over the period of 1978-
95. We are concerned with the uses that are made of financial capital inflows: do they finance
additional inflows of real resources (a current account deficit) or are they offset by compensating
financial transactions such as increased reserves or capital outflows? Second, to the extent that
there is a resource transfer, how is it divided between increased investment and added
consumption?
5
Claessen, Dooley and Warner (1995) argue that FDI is indistinguishable from other capital flows in8
terms of its volatility and predictability. Sarno and Taylor (1999), on the other hand, find that FDI is morepersistent than other components of capital flows.
The next section provides an overview of the growth in international financial markets and
the extent of involvement of developing countries. We examine trends in the different types of
capital inflows (foreign direct investments, portfolio investments, and other finance) and the
allocation in the aggregate of those funds among alternative uses. In the second section, we use
regression analysis to examine the relationship between financial inflows and rates of national
saving and investment at the level of individual countries. We summarize our conclusions in the
final section.
I. An Overview of Recent Trends
Our data on capital flows are drawn largely from the Balance of Payments (BOP) files of
the IMF. The 5th edition of the BOP manual provides for the separate reporting of financial
capital inflows (liabilities) and outflows (assets). Both the capital inflows and outflows of the
BOP are reported net of repayments. One advantage of these data for our purposes is that they
distinguish three types of capital flows: foreign direct investment (FDI), portfolio investment and
other financial flows -- comprised primarily of bank loans. This enables us to study, for example,
whether FDI is “different” from other inflows. A second advantage of this source is that the8
consistent accounting framework enables us to relate capital inflows to other components of the
balance of payments: in particular, the current account, reserve accumulation, capital outflows
6
While we do not use them in this study, we note that the World Bank has developed a second9
source of data in its Global Development Finance Report (GDF). That report provides detailed informationon debt stocks of developing countries, but it excludes asset transactions of the BOP, and it includes onlythose financial liabilities that are denominated in a foreign currency. Thus, it includes borrowing in Euro-currency markets, but excludes bond purchases of foreign investors in the domestic market. The GDF dataare very similar to those of the BOP in the aggregate, but there are substantial differences at the level ofindividual countries.
and reserve accumulation. Foreign aid (bilateral and multilateral) is largely classified as a transfer9
in the BOP and excluded from capital inflows, but some forms of concessionary finance are
included.
The following identity provides a simplified overview of the different types of transactions
in the BOP accounts:
(1) 0 = (CA + KA) + FINI + FINO + ERR + RES,
whereCA = Current account balance,KA = Capital account balance,FINI = Financial inflows,FINO = Financial outflows,ERR = Errors and omissions, andRES = Reserves and related items.
As usual, sources of foreign exchange, such as financial inflows and exports, are denoted as
positive (credits) while uses of foreign exchange, such as financial outflows and imports, are
negative (debits). This identity is based on the redesign in the 5th edition of the IMF’s BOP
Accounts, which unfortunately uses somewhat confusing terminology. A newly created category
that primarily includes capital transfers and transactions related to the purchase and sale of used
equipment, is called the capital account. This new account is zero or small for the countries in
our sample, and for simplicity we have combined it with the current account. Thus, we have a
current account, a financial account and a reserve account. What used to be referred to as the
7
In 1990, it represented about 95 percent of the GDP estimate of the World Bank for the total10
world less the high income OECD and Eastern Europe and Central Asia.
capital account now corresponds most closely to the sum of the financial account and the reserve
account. Within this simplified framework, inflows of financial capital can either be set aside in
reserves, used to finance current account deficits, or be offset by financial capital outflows.
Most countries have revised their historical accounts to conform to the new BOP format,
and with minor extensions we are able to put together a data set covering 58 developing countries
over the period of 1978-95. The period includes five years prior to the 1982 debt crisis.
Unfortunately, delayed publication of the full balance payments accounts for some countries made
it infeasible to extend the period beyond 1995. The sample of countries is drawn from our earlier
study that analyzed patterns of economic growth using data on GDP and investment. The specific
list of countries, given in appendix table A1, covers nearly all of the countries of Latin America
and Asia and a large portion of the countries in Africa. Singapore, Hong Kong and Panama are10
excluded from the analysis because their role as financial centers involves atypically large capital
outflows and inflows, and leads to some double counting of inflows at the regional level. For
some purposes, we also include 23 industrial countries of the OECD.
As shown in the top panel of figure 1, there was a five-fold expansion in the total
international flow of capital between 1978 and 1995. However, this trend is completely dominated
by the high-income OECD countries who receive about 85 percent of the total flow.
Furthermore, the nominal increase significantly overstates the growth in relative importance of
these inflows. The bottom panel of figure 1 shows that, as a share of GDP, total capital inflows
and the portion going to industrial countries are roughly unchanged over the two decades.
8
Bank lending to some developing countries, especially in Latin America, grew rapidly between11
1973 and 1981 as efforts were made to encourage those countries to generate current account deficits asoffsets to the large surpluses of the oil producing states.
Morgan Guaranty’s list of emerging markets also includes Singapore which is excluded from the12
18. See Table A1 for a complete list.
Readers are referred to appendix table A2 for additional information about flows to individual13
countries.
A key point that emerges from these data is that the very rapid growth of capital flows to
developing countries since 1988 is largely just a recovery from the highly depressed flows
following the 1982 debt crisis. Flows to developing economies were about the same share of
output in 1995 as they were during 1978-81. Further, at 5 percent of GDP, capital inflows to11
the developing economies in 1995 are about the same as the flows to industrial countries despite a
far less sophisticated infrastructure of financial markets and institutions.
Total capital flows to developing economies are concentrated among a few countries in
Asia and Latin America. Five countries (China, Mexico, Korea, Thailand, and Brazil) accounted
for nearly two-thirds of total financial flows in the 1990-95 period while the eighteen countries
identified as ‘emerging markets’ by JP Morgan accounted for 90 percent of the total. 12
Furthermore, this share has been rising over time.13
It is interesting to ask how total flows to developing economies were used. One might
assume that the inflows are used to finance enlarged current account deficits with an emphasis on
investment goods, but the actual pattern is more complex. As shown in the lower part of table 1,
only about half of the capital inflows have been associated with increased current account deficits,
and that proportion has declined in the 1990s. Roughly a third of the inflows have been funneled
into reserve assets. The need to hold reserves is a significant concern in the evaluation of the net
9
Some regional detail is provided in appendix table 3.14
benefits of financial inflows because the return on those reserves is typically very low. To offset
this low return would require a high private return or substantial externalities. At the aggregate
level a third of the inflows are offset by financial outflows, but that percentage is strongly
influenced by a few large countries that allow free capital movements on the part of their citizens.
Errors and omissions are frequently associated with capital flight. Like capital outflows, they
were very large in the period after the Latin American debt crisis. Most recently, the errors have
been large for China. Exceptional finance transactions and IMF credits are included with total
reserve accumulation (RES). Such transactions could be classified as capital inflows; but because
they are frequently associated with crises, debt forgiveness and debt restructuring, they are
negatively correlated with other inflows. During the 1982-89 period, exceptional finance
transactions averaged 112 percent of total capital inflows.
The data also enable us to disaggregate total capital flows into three types: FDI, portfolio
capital, and loans. As shown at the top of Table 1, there has been a significant shift in the
composition of total capital flows to developing countries towards FDI and away from loans. In
the 1990s, there has also been an explosive growth in portfolio capital (equities and bonds) which
was practically nonexistent in prior decades.
The pattern of inflows differs markedly by region. Prior to 1982, bank loans either to14
governments or to other banks were the dominant financial transaction for Latin America. After
the 1982 crisis, this region largely avoided or could not obtain bank loans, focusing instead on
repayment and conversion of the old loans to marketable equities. Hence more recent net loan
activity has been consistently negative, with the growth in capital inflows concentrated in FDI and
10
portfolio capital. East Asia experienced an even larger growth in FDI, but lending remains more
important than portfolio capital. Indeed, Asia accounts for nearly all of the growth in bank loans
to developing countries.
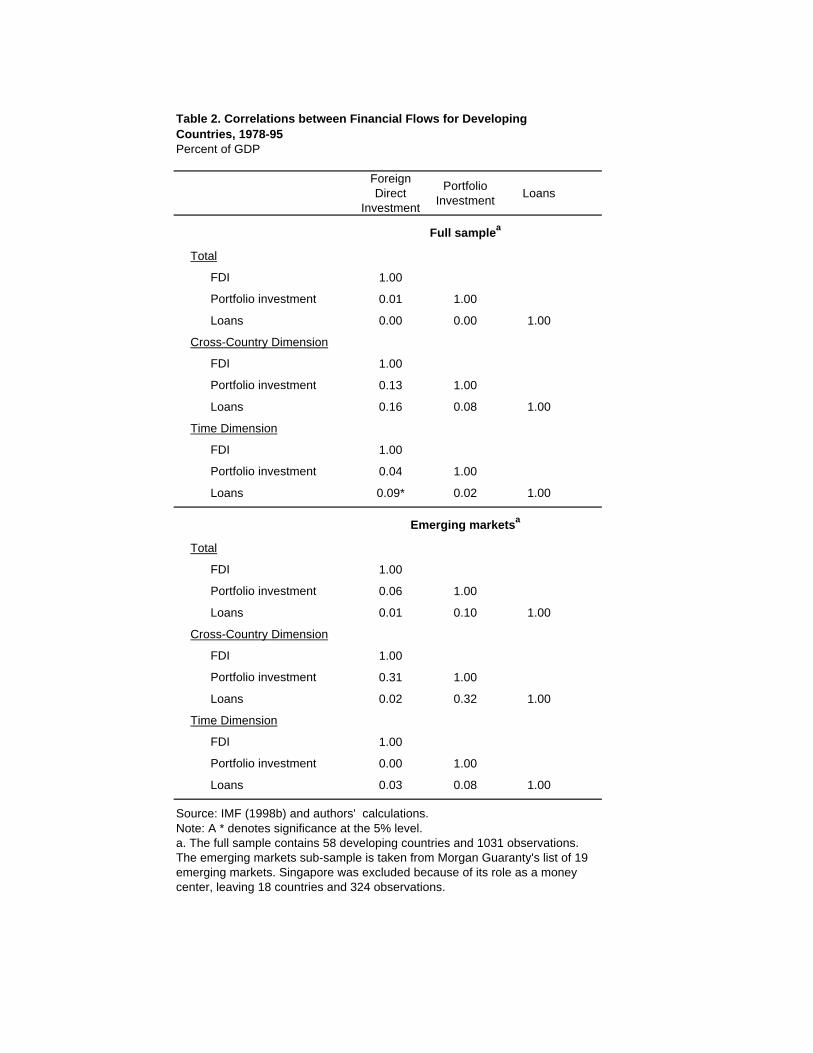
Interestingly, the three types of capital inflows (FDI, portfolio, and loans) are not
significantly correlated with one another over time or across countries. That is, there is little
tendency for countries with large amounts of portfolio capital or loans to receive correspondingly
large amounts of FDI. China, the largest recipient of FDI in the 1990s, obtained very little
portfolio capital or loans, while Brazil, the largest recipient of portfolio capital, actually reduced
its reliance on loans, and maintained a very restrictive policy toward FDI. The lack of correlation
is shown more formally in table 2, which reports the correlation coefficients for the full set of 58
countries and 18 years. The first set of correlations pools the data and treats all observations as
equivalent. The second set averages the data for each country over time and examines the
correlations across the 58 country means. The third set subtracts the country-specific effects to
focus on the time dimension. The correlations are all low. Indeed, the only statistically significant
one (between FDI and loans in the time dimension) is just 0.09.
The bottom of the table reports parallel correlations for the subset of 18 emerging market
countries. By eliminating most of the countries with no portfolio capital inflows, this sub-sample
may be more representative of countries with active linkages to external financial markets. There
is some modest increase in the correlation between portfolio capital and other inflows in the
cross-country dimension, but no correlation is statistically significant. Perhaps surprisingly, there
remains little evidence of complementarity between different types of capital inflows.
11
A recent summary of this literature is provided by Obstfeld (1998). Much of this literature focuses15
on the implications of foreign aid, which we do not examine here.
Some studies have taken a different approach or asked a somewhat different question. Eatwell16
(1996) compares investment and growth rates during periods identified as having limited versus highinternational capital mobility. Rodrik (1998) examines the effects of capital account liberalization, thusfocusing on the implications of changes in policy, and not on the implications of capital inflows themselves.
II. Capital Inflows and the Resource Transfer
For developing economies, the primary benefits of capital inflows are the opportunities to
accelerate economic growth and/or to increase current consumption. The inflows can raise
growth rates by supplementing domestic saving and thereby raising the rate of capital
accumulation. They may also accelerate growth through the transfer of technology and
management skills. Alternatively, capital inflows may be used to raise current consumption,
potentially reducing saving. Indeed, there is a long-standing interest in the extent to which the
resource inflows associated with current account deficits are invested or consumed.15
In this section, we use regression analysis to examine the links between capital inflows,
investment and saving for our sample of 58 developing countries during 1979-95. While our16
analysis focuses on capital inflows and the two components of the identity defining the current
account, it is important to reiterate a point made in the previous section. Capital inflows need not
be associated with a resource transfer. Indeed, significant shares of the flows to developing
countries have been offset by reserve accumulation, capital outflows or errors and omissions.
Our work differs from other such empirical studies in one or more of the following
dimensions. We recognize that capital inflows are likely to be influenced by domestic economic
conditions, and use an instrumental variable estimator to allow for this endogeneity. We consider
possible differences among types of inflows and look at both investment and saving. We focus on
12
For example, Borensztein et. al. (1998) and Gruben and McLeod (1998) both used pooled data sets17
that do not focus on the time dimension. The former examines the links between FDI and investment andgrowth, but does not adjust for endogeneity. The latter uses annual data to study effects of FDI versusportfolio equity and short versus long capital inflows on saving and growth.
Maurice Obstfeld (1998). See as well, Schmidt-Hebbel and Servén (1995), and Eaton (1989).18
experiences within countries over time, instead of on differences among countries. Finally, our
specifications include a variety of factors likely to influence the shares of GDP devoted to saving
and investment and allow for unobserved country characteristics. 17
Determinants of Investment and Saving
Ideally, we would like to embed the empirical estimates of the effects of capital inflows
within the framework of a realistic theoretical model. One possibility is to rely on a neoclassical
model of intertemporal utility maximization by a representative consumer or planner subject to the
constraint of capital accumulation within a neoclassical production function. For an economy
with constrained access to international capital markets, foreign resource inflows can be viewed as
an income transfer that can either be consumed or invested. Maurice Obstfeld outlines such a
model in a recent paper that extends earlier models of the effects of foreign aid transfers. In18
these models, a foreign resource inflow is no different from any other income increase. Unless the
rate of intertemporal substitution is very high, the representative agent will respond to a
permanent resource inflow with a large increase in consumption. Because the inflow affects
income as well as consumption, saving may rise or fall. If the resource transfer is temporary or a
loan that must be repaid, the consumption effect is somewhat damped, but it is still likely to
exceed the effect on investment. Within such models, resource inflows may raise utility primarily
13
by smoothing consumption, rather than by raising investment and long run growth. Just as the
steady-state capital stock and output are independent of the saving rate, they are also unaffected
by resource inflows.
Such models miss some essential features of foreign capital inflows. The assumption of a
single representative agent assumes a degree of capital market development -- equalization of
lending and borrowing rates -- that does not exist in most developing economies. Also, foreign
suppliers of credit may not be indifferent to its allocation between consumption and investment.
With FDI, the foreign investor is likely to face different investment options than the domestic firm
due to established links to foreign markets or access to technology. Even in the case of foreign
loans, collateral is likely to be required by foreign lenders.
More disaggregated theoretical models allow for a separation of the determinants of
investment and saving with explicit use of interest rates as equilibrating mechanisms. But
extensive data requirements make these models ill-suited for estimation among developing
economies. Instead, they have been calibrated to match the major stylized facts and used to
simulate policy changes.
We have settled for a less structured approach based on existing empirical research on the
determinants of investment and saving in developing economies. However, as discussed below,
our approach does try to incorporate two of the major lessons from the theoretical analyses. In
particular, our instrumental variables estimation enables us to focus on capital inflows that are
likely to be relatively permanent and to be associated with a relaxation in external constraints on
borrowing.
The empirical literature on investment reflects three differing views of investment
14
See, for example, McKibbin and Sachs (1991) and Laxton and others(1998).19
Servén and Solimano (1993).20
behavior. The oldest model, the accelerator theory, emphasizes the proportionality between the
stock of capital and output, and ties investment to the rate of growth of output. Early versions of
the neoclassical model expand on the accelerator model by relating the optimal stock of capital to
the relative cost of capital as well as the level of output. The cost of capital is a function of the
price of capital goods, taxes, the rate of interest, and depreciation. More recent versions,
associated with Tobin, Brainard and others, emphasize the relationship between the market value
of additional investment and its replacement costs, the ‘marginal’ Q ratio, as a determinant of
investment. The use of Q is particularly compatible with the current emphasis on forward-looking
rational expectations; and, with the incorporation of adjustment costs, it yields a well-defined
investment relationship.
Efforts to validate the Q approach with historical data have had limited success; but its
strong theoretical underpinnings have made it popular for macroeconomic simulation models. 19
For our purposes, the formulation raises a host of empirical problems -- most importantly, we
lack measures of market valuation in developing economies. Most of the empirical studies that
focus on developing economies have also lacked measures of taxes and interest rates needed to
compute effective measures of the cost of capital as called for by the neoclassical model.
In practice, nearly all of the empirical research on investment in developing economies has
been driven by rather ad hoc approaches that are strongly influenced by the availability of data. A
recent World Bank study surveyed a large number of these studies. They find that investment is20
strongly influenced by output growth, variations in the terms of trade, and external indebtedness.
15
Loayza, Schmidt-Hebbel, and Serven (1998). See as well Masson, Bayoumi, and Samiei (1995).21
Turning next to saving, there is a similar dichotomy between theory and empirical analysis.
Most of the theoretical literature emphasizes a life-cycle model where consumption is determined
by the maximization of intertemporal utility subject to a wealth constraint: consumption is
proportionate to the annuitized value of non-human and human wealth. Empirically, however,
there appears to be much less consumption smoothing than these models predict -- or an
excessive sensitivity to current income fluctuations. Furthermore, sustained variations in income
growth appear to have a positive effect on saving, rather than the negative relationship suggested
by the theory. In response, borrowing constraints are often used to account for the importance of
current income. Similarly, the existence of borrowing constraints in international capital markets
is used to argue that capital inflows will reduce national saving.
Another recent World Bank study surveys many of the empirical analyses of saving
behavior in developing countries. The authors find important parallels between the determinants21
of saving and investment -- as for investment, national saving rates have a robust positive
relationship with income growth and variations in the terms trade. Other variables that usually
have significant negative effects on saving are capital inflows, external debt, and dependency
ratios (the proportion of the population that is old or very young). The results for other variables
such as the interest rate and financial market depth, tend to be ambiguous.
Our review of the prior studies of investment and saving leads us to formulate both saving
and investment as functions of capital inflows, output growth, and changes in the terms of trade.
There may also be a role for additional country characteristics, such as external indebtedness and,
in the case of saving, for dependency rates. However, while these variables vary considerably
16
Missing values for some variables and the need to allow for lagged variables reduce the sample size22
from the full potential of 986 observations
The studies by Borensztein et. al. (1998) and Gruben and Mcleod (1998) both relied upon pooled23
data sets.
across countries, they have limited variation within countries over time.
Estimation With Panel Data. Given 58 countries and up to 17 years, our data set provides us
with a total of 972 observations. Its panel nature has the important advantage of allowing us to22
control for country-specific effects when estimating investment and saving relationships. In
contrast, many previous studies have pooled their data across countries and over time, implicitly
assuming that country-specific effects are either absent or uncorrelated with the regressors. It is
well known that such correlation will bias coefficient estimates. Fixed effects estimation enables23
us to focus on relationships within countries over time. As discussed above, this is the dimension
of the data set that we wish to emphasize.
Thus, we use the following specification for our estimations:
(2) (I/Y) = (+$X + < andit i it it
(3) (S/Y) = " +*X + ,it i it it
where I=1,...,58 and t = 1,...,17.
(I/Y) and (S/Y) are the percentages of GDP devoted to investment and saving respectively. Xit
denotes the following explanatory variables that vary across countries and over time. First, we
include either the total capital inflow expressed as a percent of GDP (FINI/Y) or its three
components (FDI/Y, PORT/Y and LOANS/Y). Second, we include the rate of real GDP growth
17
The endogeneity issue is discussed more fully in Dooley, Frankel, and Mathieson (1987). 24
with one and two year lags (G and G ). Finally, DTOT is the change in the terms of trade index. -1 -2
Country specific effects are denoted by ( and " . Given their limited variation over time, otheri i
variables such as the age structure of the population and external indebtedness will be reflected in
these terms. The empirical analysis measures saving as the sum of investment and the current
account balance. Thus, the impact of a change in ‘X’ on the real resource transfer (the current
account deficit) is simply ($ - *).
The Endogeneity of Capital Inflows. Just as investment and saving may depend on capital
inflows, the capital inflow a country receives is likely to depend on domestic economic activity. 24
This two-way interaction creates an endogeneity that may lead to biased coefficient estimates
when capital inflows are used as an explanatory variable. However, the direction of this bias is
unclear. A domestic shock that raises the return to capital may increase both capital inflows and
investment. This would tend to bias the coefficient on capital inflows in an investment equation
upwards. In contrast, consider a domestic policy change that raises interest rates. This may be
expected to both increase the flow of capital into the country and to reduce domestic investment
inducing a negative correlation in the data. Similarly, errors in the measurement of capital inflows
would tend to bias the coefficient estimate downward.
In order to uncover the effect of capital inflows on saving and investment, we use
instrumental variables to isolate the flows that are related to exogenous factors. Of particular
interest are developments in the global financial markets that alter the pool of capital available to
developing countries, since these can be interpreted as changes in LDCs’ access to the
18
See as well, Calvo and Rienhart (1996).25
international market. Unlike shocks to domestic demand for capital inflows, external supply
shocks provide an opportunity to identify the underlying relationships of interest between capital
inflows and domestic investment and saving.
We turn to the literature on determinants of capital inflows to develop our instruments.
However, the empirical literature here is limited. Because of the difficulty of modeling capital
inflows, most macroeconomic simulation models specify outcomes in terms of interest-rate parity
conditions rather than in terms of the capital flows that are part of the process. Those parity
conditions may be appropriate for the major industrial economies, but they are of doubtful value
for developing countries with their infant financial markets. Unfortunately, the interest rate and
rate of return data that are critical for a fully-articulated model of capital flows are available for
only a small subset of developing economies; and when available, may be distorted by sharply
changing investor perceptions of risk.
We have relied heavily on a study of financial inflows and their determinants by Calvo,
Leiderman, and Reinhart (1994) that documented a major role for external factors . To measure25
these factors, their VAR analysis extracted the first two principle components of nine measures of
interest rates and cyclical conditions in the United States. But even their empirical work focused
on reserves and real exchange rates rather than capital inflows per se.
As measures of exogenous external factors to use as instruments, we experimented with
U.S. interest rates and deviations of real U.S. GDP from trend as suggested by the Calvo,
Leiderman, and Reinhart study. While both instruments were statistically significant by
themselves, they were dominated by a measure of the total gross capital flows to the developing
19
The variable is the cumulative sum of the capital flows divided by the cumulative sum of the GDPs,26
both expressed in U.S. dollars. There is considerable variation among countries in the behavior of investment,saving and capital inflows. For example the correlation coefficient between the individual country investmentrates and the 58-country aggregate was only 0.25 and that for capital inflows was 0.20. In any case, thechoice of the instruments had little or no significant effect on the results reported later in tables 3 and 4.
IMF (1998b).27
economies in our sample. This variable should reflect a broader range of supply-side factors than
just economic conditions in the United States and is largely independent of economic conditions in
any one developing economy. While this instrument is identical for each country, our other26
instruments do vary across countries. One of these is the IMF indicator of the presence or
absence of controls on financial account transactions. Additional instruments included the27
change in the terms of trade, the prior year’s capital inflows and the lagged change in GDP --
variables that are included in the equations for saving and investment. Fixed effects estimation
was used in our first stage regressions. As stated above, this procedure enables us to focus on the
relatively permanent component of capital inflows, and on those inflows associated with changes
in external supply conditions.
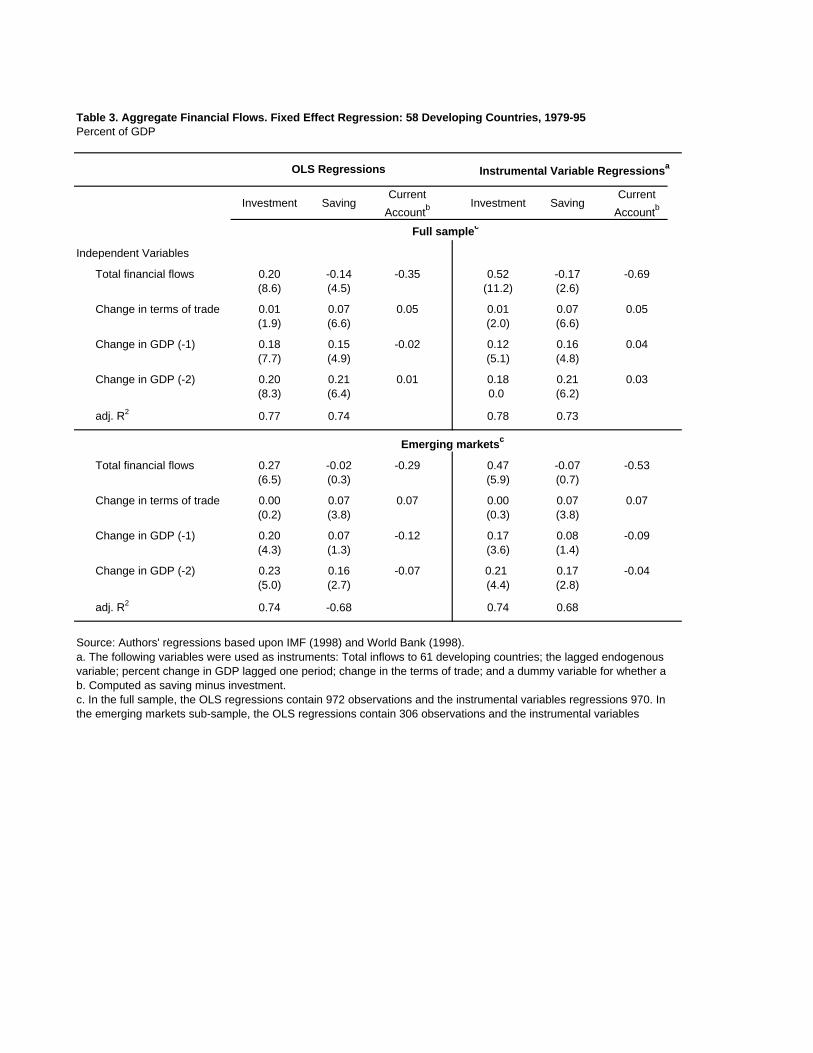
Empirical Results. We begin by focusing on total financial inflows. Regressions relating those
inflows to rates of investment and saving are reported in table 3. The OLS estimates in the top
left panel show a significant role for financial inflows in both the investment and the saving
equations: about 20 percent of the inflow goes into higher investment and about 14 percent is
reflected in increased consumption. On average, 35 percent (column 3) of the capital inflow is
used to finance resource transfers through the current account. This implies a somewhat smaller
diversion of the inflow into other offsetting financial transactions than suggested by the
20
The first stage estimates account for 42 percent of the variation in the financial inflow with large28
roles for the aggregate flows to developing countries, the lagged inflow and the lagged change in GDP.
decomposition in table 1. As expected, output growth and variations in the terms of trade
account for a large proportion of the variation in rates of investment and saving.
The top right panel presents the results using instrumental variable (IV) estimation on the
full sample. As shown, IV substantially increases the estimated effect of capital inflows on28
investment, from 0.20 in the OLS regression to 0.52. However, there is no significant change in
the saving relationship. Thus, the estimated resource transfer induced by a capital inflow increases
to 69 percent. The remaining 31 percent of the inflow is absorbed by reserve accumulation and
capital outflows. The difference between the IV and the OLS estimates, may reflect endogeneity
bias, as discussed above. But it could also reflect extreme values in measured capital inflows
that are not closely related to investment, and are similar to measurement error. In support of the
latter interpretation, the predicted values from the first stage estimate of capital inflows have a
notably smaller variance than the original data.
The results for the subsample of emerging-market economies, shown in the lower panels
of Table 3, are similar to those for the entire sample. OLS estimation yields a positive, and
slightly larger, effect of capital inflows on investment. The impact of foreign inflows on the
saving rate, while negative, is small and insignificant. Again, the shift from OLS to IV results in a
sharply increased coefficient on financial inflows in the investment equation, but the impact on
saving remains insignificant. These results for total financial flows are also very robust with
respect to other changes in the sample, such as a division of the countries by region or a focus on
the more recent years.
21
Gruben and McLeod (1998) also find a positive effect of FDI on saving.29
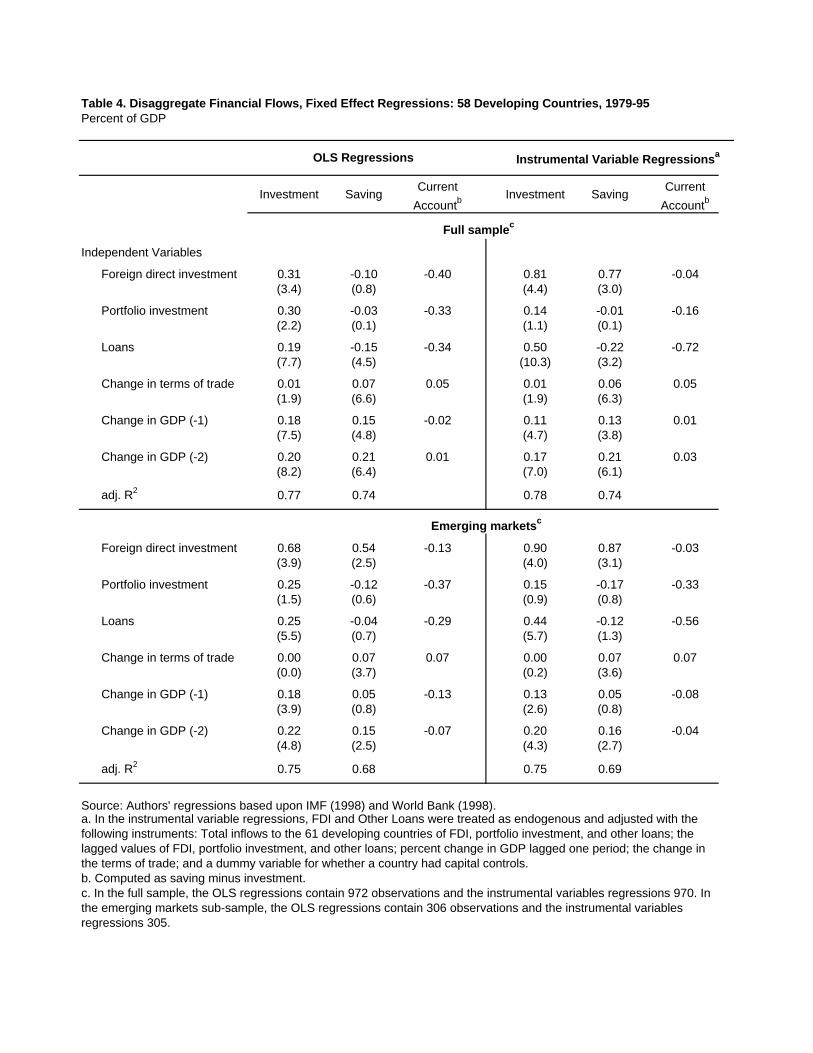
Table 4 presents a more disaggregate model of the relationships, with capital flows divided
into three types: foreign direct investment, portfolio investments, and loans. Several points
emerge from the estimates. First, there are substantial differences between the OLS and IV
estimates. As with the aggregate flows, IV estimation increases the coefficients on (especially
FDI) inflows in the investment equation. It also yields a strikingly large positive coefficient on
FDI in the saving equation, while the coefficient for loans becomes more negative. There is no29
loss of overall explanatory power in the move from OLS to IV. However, we note that actual
values of portfolio inflows are used in the reported regressions because we were unable to obtain
useful first-stage estimates for this component. The differences are less notable for the emerging
market sample. FDI has a positive influence on saving in both the OLS and IV equations, and the
negative influence of loans on saving is not statistically significant.
Second, the IV results show substantial differences by type in the effects of capital
inflows on investment. FDI has the strongest relationship, with an estimated coefficient close to
one. Portfolio inflows have the smallest and least significant relationship, while loans are in
between. This finding is particularly evident for the emerging market economies that account for
the bulk of portfolio capital inflows. It too is robust to a variety of different specifications.
Third, the three types of financial inflows appear to also have sharply different implications
for the current account. The differences are most evident for the IV estimation where FDI has a
large positive effect on both investment and saving, implying no net deterioration of the current
account. Instead, all of the negative correlation between total capital inflows and the current
account is associated with loans, which raise investment but lower saving. Portfolio inflows have
22
Since the capital inflows are part of an overall BOP identity, we can apply the specification of table30
4 to the other components, reserve accumulation, capital outflows, and extraordinary finance. In the shiftfrom the OLS to the IV estimation, the decline in the impact of FDI on the current account is offset by anincreased effect on reserve accumulation and extraordinary finance.
These items are sizable and volatile for many developing countries because the factor payments31
include the interest on foreign debt and transfers are dominated by foreign aid and remittances from relativesliving abroad.
little impact on investment, saving or the current account, and appear to be largely offset by other
financial transactions.
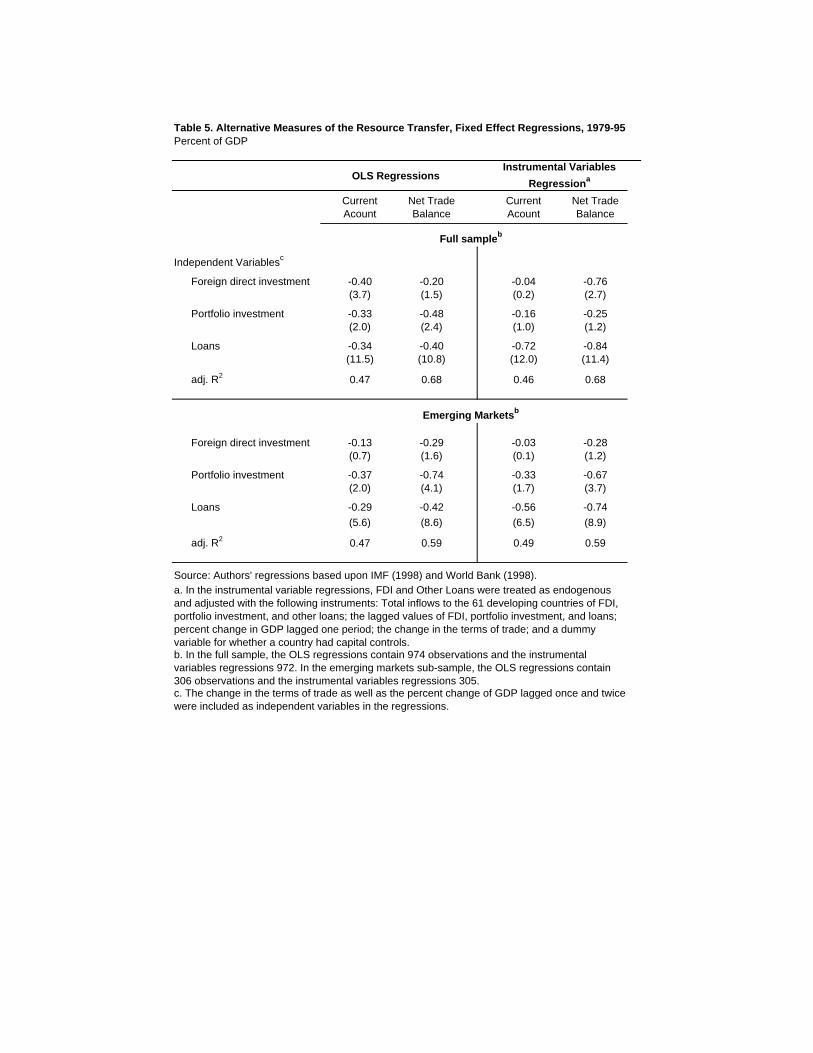
However, the strong positive effect of FDI on saving in the IV estimation, implying the
absence of any negative effect on the current account balance, is surprising. While the positive30
impact on saving might be dismissed in the full sample as a reflection of the imperfect nature of
the IV estimation, it is also evident in the OLS estimates for emerging markets. In exploring this
issue further, we find that the role of FDI is sensitive to the definition of the external balance.
This is illustrated in table 5 which compares the coefficients on the disaggregated flows from a
regression explaining the current account with those using a narrower measure, the trade balance
on goods and services. The latter excludes factor income payments and transfers. In contrast31
with the earlier IV results, FDI has a large negative effect on the trade balance, close to that for
loans. The differences between the current account and the trade balance are less marked for the
emerging market sample. The results using total capital inflows and the narrow trade balance are
very similar to those reported in table 3.
It might be argued that variations in the impact on the current account are the result of
changes in the timing between an inflow of financial capital and the purchase of real goods. To
explore this possibility, we re-estimated the equations in tables 3 and 4, using three-year averages.
In this triannual data set, there are up to six observations per country, providing 340 observations
23
The use of three-year averages also allows us to address some of the concerns about the presence of32
lagged capital flows and lagged GDP in the first-stage estimation. Any problem of autocorrelation is muchreduced in the three- year averages.
Their results are based on pooled data for 69 countries over two time periods.33
in the full sample. The result was little or no change in the parameter estimates. As before, the
aggregate capital inflows increase investment and the current account deficit, with no significant
effect on saving; and in contrast, the disaggregate IV equations show large positive effects of FDI
on both investment and saving, with no net effect on the current account. Loans continue to32
raise investment and lower saving, thereby accounting for all of the negative impact on the current
account.
We conclude that while the disaggregate flows are consistently different in their effects on
investment, they do not have stable and predictable differences in their impact on the net external
balance and thus saving. The results may reflect difficulty with obtaining reliable instruments for
the disaggregate flows; but they are also consistent with the view that the different types of capital
flows are fully fungible with one another in their financing of an external deficit.
Finally, the use of a fixed-effects estimator also has an important influence on the
statistical results. Regressions on the pooled data (which assume the absence of country-specific
effects) imply even larger effects of financial inflows and its components on investment and saving
-- but most of this correlation comes from the cross-country covariance. That is, countries with
large capital inflows tend to have higher rates of investment. Within countries, over time (the
fixed-effect estimates) the coefficients are smaller. Thus, large coefficient estimates (such as
those above 1.5 reported by Borenstein et. al. ) may primarily reflect the cross-country33
covariance. In addition, the problems raised by the endogeneity of capital flows are particularly
24
severe in the cross-country dimension, and it is difficult to develop effective instruments that
distinguish among countries.
III. Concluding Remarks
This paper examines capital inflows to developing countries over the past two decades.
Its primary objective is to extend the relatively small empirical literature that assesses whether the
potential benefits from such inflows are in fact realized. In this final section, we pull together the
main conclusions that emerge. Our basic conclusion is that a large proportion of capital inflows
are used to finance current account deficits and the resource transfer is directed overwhelmingly
into investment and not consumption.
The overview of capital flows reveals that the widely discussed surge in international
capital movements has been less dramatic than often suggested. First, the lion’s share of the
increase has gone to industrial, not developing, countries; and to a large extent, the increase in
capital flows to LDCs since the late 1980s reflects a return to earlier levels. Flows to these
countries as a group amount to roughly the same percentage of GDP in the mid 1990s as they had
in the late 1970s. Further, capital inflows are highly concentrated among a small number of
countries, frequently labeled the “emerging markets” of Latin America and Asia.
The aggregate figures also mask a significant shift in the composition of capital inflows,
from bank lending towards FDI and portfolio capital. Perhaps surprisingly, we find very little
correlation among types of capital inflows, either across countries, or within countries over time.
In particular, increased receipts of portfolio capital or bank loans are not associated with
25
increased inflows of FDI. At the aggregate level, only about half of the inflows over the last two
decades have been used to finance resource transfers through larger current account deficits.
Roughly 30 percent of the inflow has been used to increase reserves, and a substantial portion has
been offset by capital outflows
Our analysis of the data for individual countries suggests that about half of each dollar of
capital inflow translates into an increase in domestic investment. There is a small negative effect
on national saving of marginal statistical significance. In combination, the instrumental variable
estimates for saving and investment suggest a foreign resource transfer equal to 53 - 69 percent of
the inflow of financial capital, with the remainder being diverted into reserve accumulation or
capital outflows.
This aggregate result, however, masks significant differences among types of capital
inflows. Foreign direct investment appears to have highly beneficial effects on domestic
investment: indeed, the results suggest a near one-for-one relationship between the two. In
contrast, portfolio capital inflows appear to have no discernible impact on investment, and the
effect of loans lies between the other two. We are less certain of the differential effect on the
current account and saving. In some of the estimates, FDI appears to generate large increases in
domestic saving with no negative implications for the external balance, but the results were not
robust to alternative specifications. Loans have a large negative impact on the current account,
but a significant portion of the resource inflows is used to augment consumption. It this latter
case, it would be useful to distinguish between public and private-sector borrowing -- something
we have not yet incorporated in our data set.
Are these benefits of financial inflows sufficient to offset the evident risks of allowing
26
markets to freely allocate capital across the borders of developing countries? The answer would
appear to be a strong yes for FDI. Indeed, FDI has long been viewed as "different," and most
countries have actively sought such investments with special provisions to permit exchange
convertibility and repatriation of funds. However, the current debate over capital convertibility is
much more focused on portfolio capital -- a flow which we find to have a lesser impact on real
resource use.
It is probably a mistake to believe that the current momentum of international financial
liberalization can or should be reversed. At the same time, it is important to recognize that the
most compelling evidence of efficiency gains from financial market liberalization results from
improvements in domestic markets. Furthermore, the orderly sequencing of financial
liberalization appears to be extremely important: strengthening domestic markets and regulatory
oversight prior to permitting external convertibility. We interpret our results as supporting such a
sequenced procedure because the most useful form of capital inflow, FDI, can be accommodated
without full capital convertibility.
27
References
Borensztein, E., J. De Gregorio, and J-W Lee. 1998. "How Does Foreign Direct InvestmentAffect Growth?" Journal of International Economics 45:115-35.
Calvo, Guillermo A, Leonardo Leiderman, and Carmen M. Reinhart. 1993. "Capital Inflows toLatin America: the role of External Factors," IMF Staff Papers (March), pp.108-51.
____. 1996. "Inflows of Capital to Developing Countries in the 1990s," The Journal ofEconomic Perspectives (Spring), pp.123-40.
Calvo, Sarah, and Carmen M. Rienhart. 1996. “Capital Flows to Latin America: Is ThereEvidence of Contagion Effects?’ In Guillermo Calvo, Morris Goldstein, and Eduard Hochreiter(editors), Private Capital Flows to Emerging Markets After the Mexican Crisis, Institute forInternational Economics and the Austrian National Bank, Washington D.C: 151-172.
Cardoso, Eliana A. And Rudiger Dornbusch. 1989. "Foreign Private Capital Flows," in H. Chenery and T.N. Srinivasan (editors), Handbook of Development Economics, vol 2 (Amsterdam:North Holland):1387-1439.
Claessens, Stijn, Michael P. Dooley, and Andrew Warner. 1995. "Portfolio Capital Flows: Hotor Cold?" World Bank Economic Review, vol 9, No 1:153-74.
Collins, Susan M., and Barry Bosworth. 1996. "Economic Growth in East Asia: Accumulationversus Assimilation,” Brookings Papers on Economic Activity, 2:1996:135-203.
Dooley, Michael P. 1995. “A Survey of Academic Literature on Controls Over InternationalCapital Transactions.” IMF Working Paper WP/95/127 (November).
Dooley, Michael, Jeffrey Frankel, and Donald J. Mathieson. 1987. “International Capital Mobility:What Do Saving-Investment Correlations Tell Us? IMF Staff Papers, 34 No. 3 (September):503-30.
Eaton, Jonathan. 1989. "Foreign Public Capital Flows," in H. Chenery and T.N. Srinivasan(editors), Handbook of Development Economics, vol 2 (Amsterdam: North Holland): 1305-1385.
Eatwell, John. 1996. International Financial Liberalization: The Impact on World Development,UNDP Discussion Paper (September).
Eichengreen, Barry. 1999. Toward a New International Financial Architecture: A Practical Post-Asia Agenda. Washington DC: Institute for International Economics.
28
Fischer, Stanley, and others. 1998. Should the IMF Pursue Capital Account Convertibility? Essays in international Finance No. 207, Department of Economics, Princeton University (May).
Frankel, Jeffrey. 1986. "International Capital Mobility and Crowding Out in the U.S. Economy:Imperfect Integration of Financial Markets or Goods Markets?" in R.W. Hafer (editor) How Openis the U.S. Economy? Lexington: Lexington Books, pp 33-68.
French, Kenneth , and James Poterba. 1991. “Investor diversification and International EquityMarkets.” American Economic Review 81: 222-226 (May).
Grossman, Gene M. and Elhanan Helpman. 1991. Innovation and Growth in the GlobalEconomy. Cambridge, MA: MIT Press.
Gruben, William C., and Darryl McLeod. 1998. " Capital Flows, Saving and Growth in the1990s," The Quarterly Review of Economics and Finance, 38, No.3 (Fall):287-301.
International Monetary Fund. 1998a. Exchange Arrangements and Exchange Restrictions,Annual Report, Washington D.C..
International Monetary Fund. 1998b. International Financial Statistics, CD-ROM, August,Washington D.C.
Laxton, Douglas, and others. 1998. Multimod Mark II: The Core Dynamics and Steady-StateModels, Occasional Paper 164 (May), the International Monetary Fund, Washington D.C.
Leiderman, Leonardo, and Alfredo E. Thorne. 1996. "The 1994 Mexican Crisis and ItsAftermath: What Are the Main Lessons? In Guillermo Calvo, Morris Goldstein, and EduardHochreiter (editors), Private Capital Flows to Emerging Markets After the Mexican Crisis,Institute for International Economics and the Austrian National Bank, Washington D.C: 1-43.
Loayza, Norman, Klaus Schmidt-Hebbel, and Luis Servén. 1998. "What Drives Saving Acrossthe World?’ paper prepared for World Bank Conference on Saving Across the World(September), World Bank, Washington D.C.
Masson, Paul R., Tamin Bayoumi, and Hossein Samiei.1995. "Saving Behavior in Industrial andDeveloping Countries," Staff Studies for the World Economic Outlook, (September),International Monetary Fund, Washington D.C., pp: 1-27.
McKibbin, Warwick, and Jeffrey D. Sachs. 1991. Global Linkages: MacroeconomicInterdependence and Cooperation in the World Economy, the Brookings Institution.
Moran, Theodore. 1998. Foreign Direct Investment and Development: The New Policy Agendafor Developing Countries and Economies in Transition. Washington DC: Institute for
29
International Economics.
Obstfeld, Maurice. 1998. “Foreign Resource Inflows, Saving, and Growth," in K. Schmidt-Hebbeland L. Servén (editors) The Economics of Saving and Growth: Theory, Evidence andImplications for Policy. The World Bank and Cambridge University Press. (Forthcoming)
Obstfeld, Maurice. 1998. “The Global Capital Market: Benefactor or Menace?” NBER Workingpaper #6559 (May).
Rodrik, Dani. 1998a. “Who Needs Capital Account Convertibility?” Harvard University, KennedySchool of Government mimeo (February).
Servén, Luis, and Andres Solimano (editors), 1993. Striving for Growth After Adjustment: theRole of Capital Formation, the World Bank, Washington D.C.
Sarno, Lucio, and Mark P. Taylor. 1997. "Hot Money, Accounting Labels and the Persistence ofCapital Flows to Developing Countries," working paper No. 97-07, University of Brunel.
World Bank. 1997. Private Capital Flows to Developing Countries. Washington D.C.: TheWorld Bank.
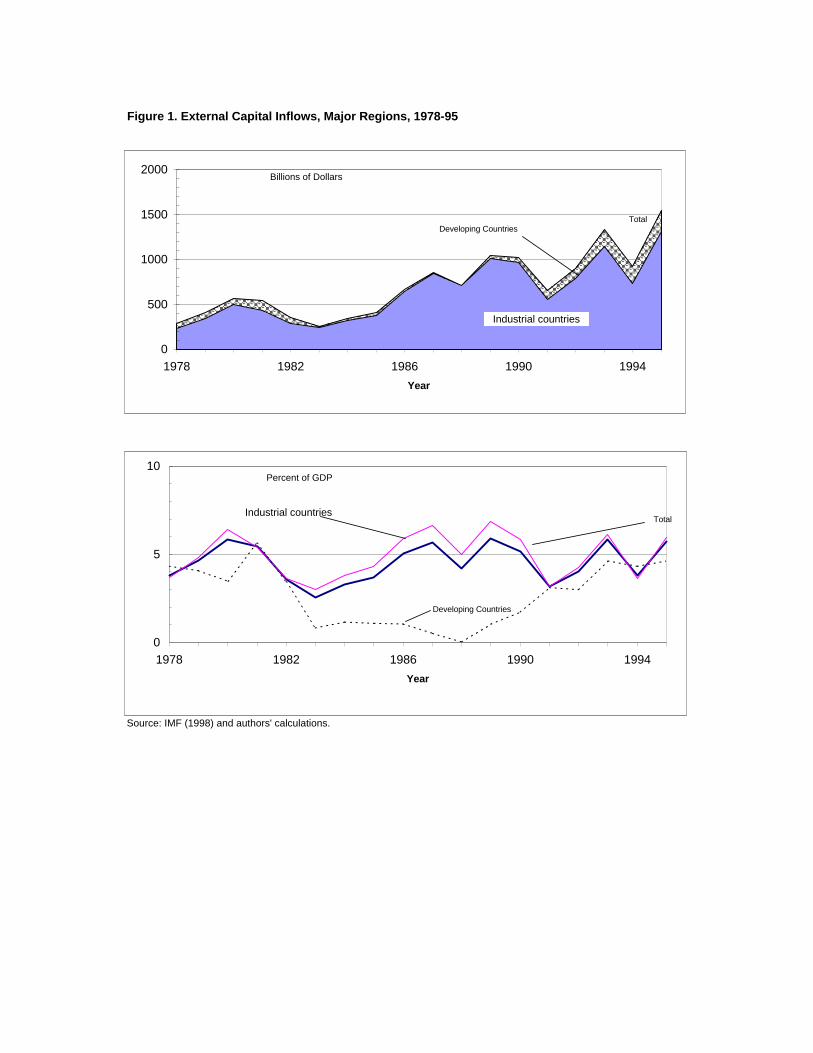
Figure 1. External Capital Inflows, Major Regions, 1978-95
Source: IMF (1998) and authors' calculations.
0
500
1000
1500
2000
1978 1982 1986 1990 1994
Year
Industrial countries
TotalDeveloping Countries
Billions of Dollars
0
5
10
1978 1982 1986 1990 1994
Year
Industrial countriesTotal
Developing Countries
Percent of GDP
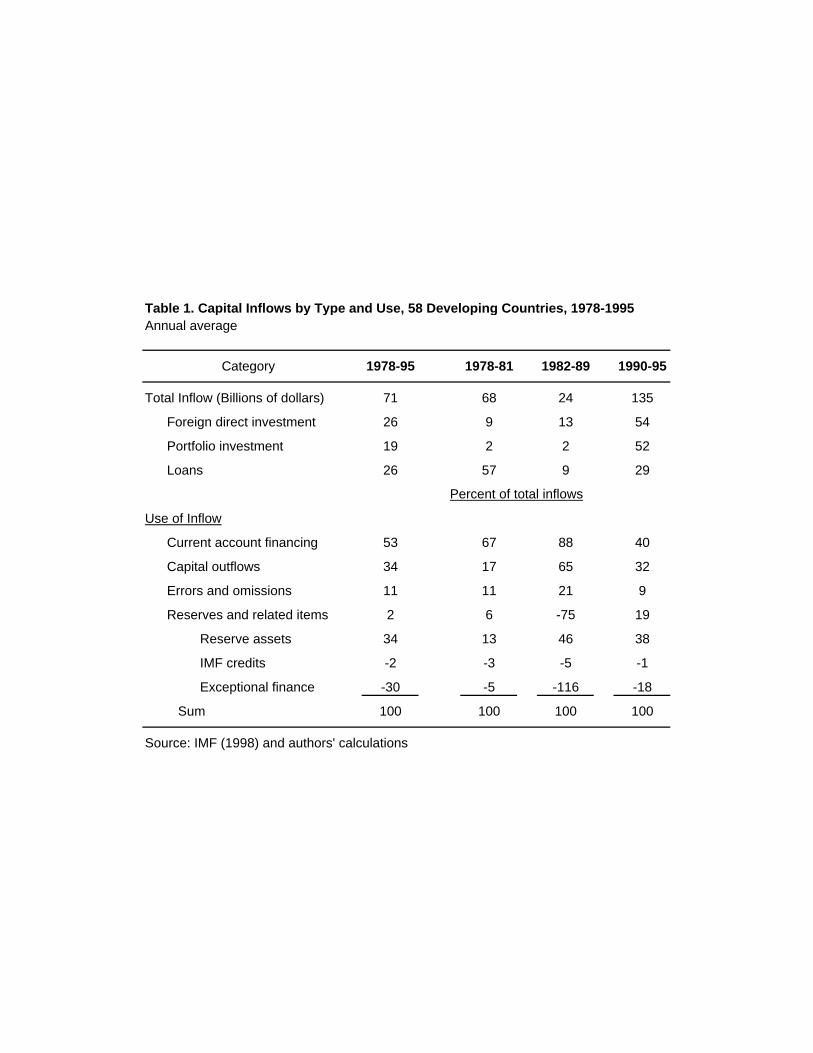
Table 1. Capital Inflows by Type and Use, 58 Developing Countries, 1978-1995Annual average
Category 1978-95 1978-81 1982-89 1990-95
Total Inflow (Billions of dollars) 71 68 24 135
Foreign direct investment 26 9 13 54
Portfolio investment 19 2 2 52
Loans 26 57 9 29
Use of Inflow
Current account financing 53 67 88 40
Capital outflows 34 17 65 32
Errors and omissions 11 11 21 9
Reserves and related items 2 6 -75 19
Reserve assets 34 13 46 38
IMF credits -2 -3 -5 -1
Exceptional finance -30 -5 -116 -18
Sum 100 100 100 100
Source: IMF (1998) and authors' calculations
Percent of total inflows
Percent of GDP
Foreign Direct
Investment
Portfolio Investment
Loans
Full samplea
Total
FDI 1.00
Portfolio investment 0.01 1.00
Loans 0.00 0.00 1.00
Cross-Country Dimension
FDI 1.00
Portfolio investment 0.13 1.00
Loans 0.16 0.08 1.00
Time Dimension
FDI 1.00
Portfolio investment 0.04 1.00
Loans 0.09* 0.02 1.00
Emerging marketsa
Total
FDI 1.00
Portfolio investment 0.06 1.00
Loans 0.01 0.10 1.00
Cross-Country Dimension
FDI 1.00
Portfolio investment 0.31 1.00
Loans 0.02 0.32 1.00
Time Dimension
FDI 1.00
Portfolio investment 0.00 1.00
Loans 0.03 0.08 1.00
Source: IMF (1998b) and authors' calculations.
a. The full sample contains 58 developing countries and 1031 observations. The emerging markets sub-sample is taken from Morgan Guaranty's list of 19 emerging markets. Singapore was excluded because of its role as a money center, leaving 18 countries and 324 observations.
Note: A * denotes significance at the 5% level.
Table 2. Correlations between Financial Flows for Developing Countries, 1978-95
Percent of GDP
Investment SavingCurrent
AccountbInvestment Saving
Current
Accountb
Full samplec
Independent Variables
Total financial flows 0.20 -0.14 -0.35 0.52 -0.17 -0.69(8.6) (4.5) (11.2) (2.6)
Change in terms of trade 0.01 0.07 0.05 0.01 0.07 0.05(1.9) (6.6) (2.0) (6.6)
Change in GDP (-1) 0.18 0.15 -0.02 0.12 0.16 0.04(7.7) (4.9) (5.1) (4.8)
Change in GDP (-2) 0.20 0.21 0.01 0.18 0.21 0.03(8.3) (6.4) 0.0 (6.2)
adj. R2 0.77 0.74 0.78 0.73
Total financial flows 0.27 -0.02 -0.29 0.47 -0.07 -0.53(6.5) (0.3) (5.9) (0.7)
Change in terms of trade 0.00 0.07 0.07 0.00 0.07 0.07(0.2) (3.8) (0.3) (3.8)
Change in GDP (-1) 0.20 0.07 -0.12 0.17 0.08 -0.09(4.3) (1.3) (3.6) (1.4)
Change in GDP (-2) 0.23 0.16 -0.07 0.21 0.17 -0.04(5.0) (2.7) (4.4) (2.8)
adj. R2 0.74 -0.68 0.74 0.68
Source: Authors' regressions based upon IMF (1998) and World Bank (1998).
c. In the full sample, the OLS regressions contain 972 observations and the instrumental variables regressions 970. In the emerging markets sub-sample, the OLS regressions contain 306 observations and the instrumental variables
Emerging marketsc
b. Computed as saving minus investment.
Table 3. Aggregate Financial Flows. Fixed Effect Regression: 58 Developing Countries, 1979-95
a. The following variables were used as instruments: Total inflows to 61 developing countries; the lagged endogenous variable; percent change in GDP lagged one period; change in the terms of trade; and a dummy variable for whether a
OLS Regressions Instrumental Variable Regressionsa
Percent of GDP
Investment SavingCurrent
AccountbInvestment Saving
Current
Accountb
Full samplec
Independent Variables
Foreign direct investment 0.31 -0.10 -0.40 0.81 0.77 -0.04(3.4) (0.8) (4.4) (3.0)
Portfolio investment 0.30 -0.03 -0.33 0.14 -0.01 -0.16(2.2) (0.1) (1.1) (0.1)
Loans 0.19 -0.15 -0.34 0.50 -0.22 -0.72(7.7) (4.5) (10.3) (3.2)
Change in terms of trade 0.01 0.07 0.05 0.01 0.06 0.05(1.9) (6.6) (1.9) (6.3)
Change in GDP (-1) 0.18 0.15 -0.02 0.11 0.13 0.01(7.5) (4.8) (4.7) (3.8)
Change in GDP (-2) 0.20 0.21 0.01 0.17 0.21 0.03(8.2) (6.4) (7.0) (6.1)
adj. R2 0.77 0.74 0.78 0.74
Foreign direct investment 0.68 0.54 -0.13 0.90 0.87 -0.03(3.9) (2.5) (4.0) (3.1)
Portfolio investment 0.25 -0.12 -0.37 0.15 -0.17 -0.33(1.5) (0.6) (0.9) (0.8)
Loans 0.25 -0.04 -0.29 0.44 -0.12 -0.56(5.5) (0.7) (5.7) (1.3)
Change in terms of trade 0.00 0.07 0.07 0.00 0.07 0.07(0.0) (3.7) (0.2) (3.6)
Change in GDP (-1) 0.18 0.05 -0.13 0.13 0.05 -0.08(3.9) (0.8) (2.6) (0.8)
Change in GDP (-2) 0.22 0.15 -0.07 0.20 0.16 -0.04(4.8) (2.5) (4.3) (2.7)
adj. R2 0.75 0.68 0.75 0.69
Source: Authors' regressions based upon IMF (1998) and World Bank (1998).
Table 4. Disaggregate Financial Flows, Fixed Effect Regressions: 58 Developing Countries, 1979-95
c. In the full sample, the OLS regressions contain 972 observations and the instrumental variables regressions 970. In the emerging markets sub-sample, the OLS regressions contain 306 observations and the instrumental variables regressions 305.
OLS Regressions Instrumental Variable Regressionsa
Emerging marketsc
b. Computed as saving minus investment.
a. In the instrumental variable regressions, FDI and Other Loans were treated as endogenous and adjusted with the following instruments: Total inflows to the 61 developing countries of FDI, portfolio investment, and other loans; the lagged values of FDI, portfolio investment, and other loans; percent change in GDP lagged one period; the change in the terms of trade; and a dummy variable for whether a country had capital controls.
Percent of GDP
OLS Regressions
Current Acount
Net Trade Balance
Current Acount
Net Trade Balance
Full sampleb
Independent Variablesc
Foreign direct investment -0.40 -0.20 -0.04 -0.76(3.7) (1.5) (0.2) (2.7)
Portfolio investment -0.33 -0.48 -0.16 -0.25(2.0) (2.4) (1.0) (1.2)
Loans -0.34 -0.40 -0.72 -0.84(11.5) (10.8) (12.0) (11.4)
adj. R2 0.47 0.68 0.46 0.68
Emerging Marketsb
Foreign direct investment -0.13 -0.29 -0.03 -0.28(0.7) (1.6) (0.1) (1.2)
Portfolio investment -0.37 -0.74 -0.33 -0.67(2.0) (4.1) (1.7) (3.7)
Loans -0.29 -0.42 -0.56 -0.74
(5.6) (8.6) (6.5) (8.9)
adj. R2 0.47 0.59 0.49 0.59
Source: Authors' regressions based upon IMF (1998) and World Bank (1998).a. In the instrumental variable regressions, FDI and Other Loans were treated as endogenous and adjusted with the following instruments: Total inflows to the 61 developing countries of FDI, portfolio investment, and other loans; the lagged values of FDI, portfolio investment, and loans; percent change in GDP lagged one period; the change in the terms of trade; and a dummy variable for whether a country had capital controls.b. In the full sample, the OLS regressions contain 974 observations and the instrumental variables regressions 972. In the emerging markets sub-sample, the OLS regressions contain 306 observations and the instrumental variables regressions 305.c. The change in the terms of trade as well as the percent change of GDP lagged once and twice were included as independent variables in the regressions.
Table 5. Alternative Measures of the Resource Transfer, Fixed Effect Regressions, 1979-95
Instrumental Variables
Regressiona

Table A1. Country Sample, by Regional Grouping58 Developing Countries
Middle East and East Asia North AfricaChina* AlgeriaIndonesia* CyprusKorea* EgyptMalaysia* IranPhilippines* IsraelTaiwan* JordanThailand* Malta
Morocco*South Asia TunisiaBangladeshIndia* Latin AmericaMyanmar Argentina*Pakistan BoliviaSri Lanka Brazil*
Chile*Columbia*
Sub-Sahara Africa Costa RicaCameroon Dominican Rep.Cote d' Ivoire Ecuador*Ethiopia El SalvadorGhana GuatemalaKenya HaitiMadagascar HondurasMalawi JamaicaMali Mexico*Mauritius ParaguayNigeria Peru*Rwanda Trinidad & TobagoSenegal UruguaySierra Leone Venezuela*South Africa*TanzaniaUgandaZambiaZimbabwe
Note: * indicates countries contained in the 18 country sub-sample of emerging markets.
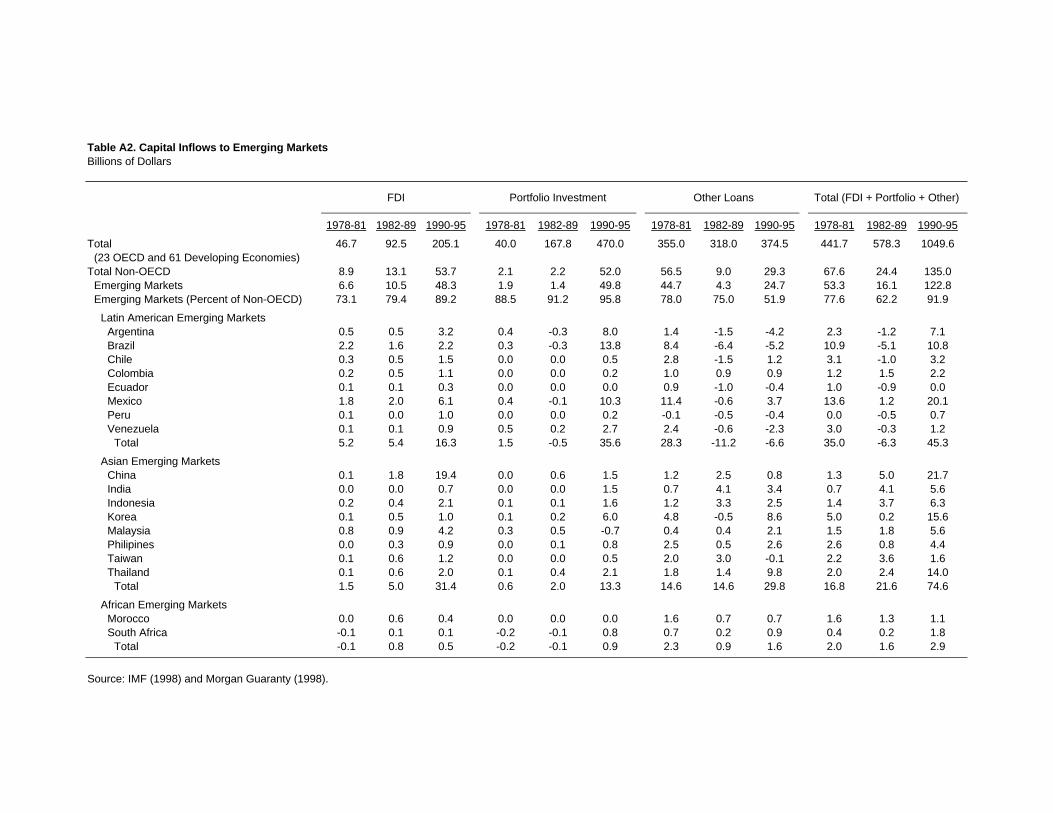
Table A2. Capital Inflows to Emerging MarketsBillions of Dollars
FDI Portfolio Investment Other Loans Total (FDI + Portfolio + Other)
1978-81 1982-89 1990-95 1978-81 1982-89 1990-95 1978-81 1982-89 1990-95 1978-81 1982-89 1990-95
Total 46.7 92.5 205.1 40.0 167.8 470.0 355.0 318.0 374.5 441.7 578.3 1049.6(23 OECD and 61 Developing Economies)
Total Non-OECD 8.9 13.1 53.7 2.1 2.2 52.0 56.5 9.0 29.3 67.6 24.4 135.0Emerging Markets 6.6 10.5 48.3 1.9 1.4 49.8 44.7 4.3 24.7 53.3 16.1 122.8Emerging Markets (Percent of Non-OECD) 73.1 79.4 89.2 88.5 91.2 95.8 78.0 75.0 51.9 77.6 62.2 91.9
Latin American Emerging MarketsArgentina 0.5 0.5 3.2 0.4 -0.3 8.0 1.4 -1.5 -4.2 2.3 -1.2 7.1Brazil 2.2 1.6 2.2 0.3 -0.3 13.8 8.4 -6.4 -5.2 10.9 -5.1 10.8Chile 0.3 0.5 1.5 0.0 0.0 0.5 2.8 -1.5 1.2 3.1 -1.0 3.2Colombia 0.2 0.5 1.1 0.0 0.0 0.2 1.0 0.9 0.9 1.2 1.5 2.2Ecuador 0.1 0.1 0.3 0.0 0.0 0.0 0.9 -1.0 -0.4 1.0 -0.9 0.0Mexico 1.8 2.0 6.1 0.4 -0.1 10.3 11.4 -0.6 3.7 13.6 1.2 20.1Peru 0.1 0.0 1.0 0.0 0.0 0.2 -0.1 -0.5 -0.4 0.0 -0.5 0.7Venezuela 0.1 0.1 0.9 0.5 0.2 2.7 2.4 -0.6 -2.3 3.0 -0.3 1.2
Total 5.2 5.4 16.3 1.5 -0.5 35.6 28.3 -11.2 -6.6 35.0 -6.3 45.3
Asian Emerging MarketsChina 0.1 1.8 19.4 0.0 0.6 1.5 1.2 2.5 0.8 1.3 5.0 21.7India 0.0 0.0 0.7 0.0 0.0 1.5 0.7 4.1 3.4 0.7 4.1 5.6Indonesia 0.2 0.4 2.1 0.1 0.1 1.6 1.2 3.3 2.5 1.4 3.7 6.3Korea 0.1 0.5 1.0 0.1 0.2 6.0 4.8 -0.5 8.6 5.0 0.2 15.6Malaysia 0.8 0.9 4.2 0.3 0.5 -0.7 0.4 0.4 2.1 1.5 1.8 5.6Philipines 0.0 0.3 0.9 0.0 0.1 0.8 2.5 0.5 2.6 2.6 0.8 4.4Taiwan 0.1 0.6 1.2 0.0 0.0 0.5 2.0 3.0 -0.1 2.2 3.6 1.6Thailand 0.1 0.6 2.0 0.1 0.4 2.1 1.8 1.4 9.8 2.0 2.4 14.0
Total 1.5 5.0 31.4 0.6 2.0 13.3 14.6 14.6 29.8 16.8 21.6 74.6
African Emerging MarketsMorocco 0.0 0.6 0.4 0.0 0.0 0.0 1.6 0.7 0.7 1.6 1.3 1.1South Africa -0.1 0.1 0.1 -0.2 -0.1 0.8 0.7 0.2 0.9 0.4 0.2 1.8
Total -0.1 0.8 0.5 -0.2 -0.1 0.9 2.3 0.9 1.6 2.0 1.6 2.9
Source: IMF (1998) and Morgan Guaranty (1998).
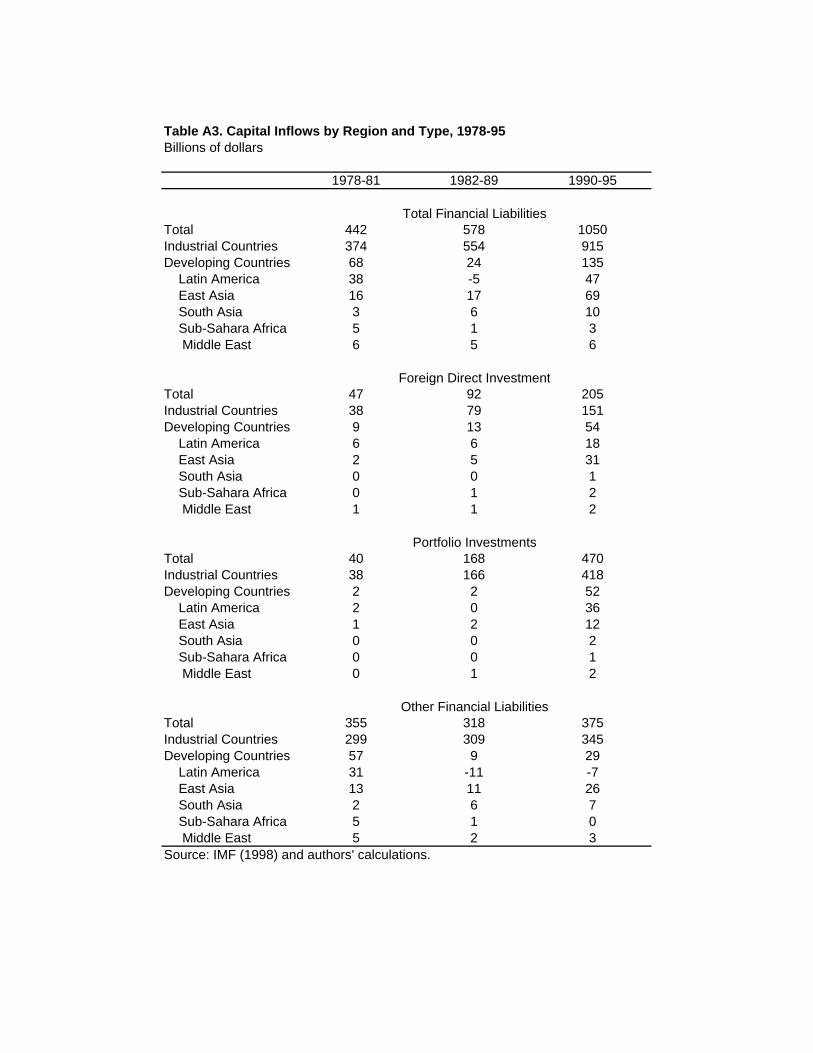
Table A3. Capital Inflows by Region and Type, 1978-95Billions of dollars
1978-81 1982-89 1990-95
Total 442 578 1050Industrial Countries 374 554 915Developing Countries 68 24 135 Latin America 38 -5 47 East Asia 16 17 69 South Asia 3 6 10 Sub-Sahara Africa 5 1 3 Middle East 6 5 6
Total 47 92 205Industrial Countries 38 79 151Developing Countries 9 13 54 Latin America 6 6 18 East Asia 2 5 31 South Asia 0 0 1 Sub-Sahara Africa 0 1 2 Middle East 1 1 2
Total 40 168 470Industrial Countries 38 166 418Developing Countries 2 2 52 Latin America 2 0 36 East Asia 1 2 12 South Asia 0 0 2 Sub-Sahara Africa 0 0 1 Middle East 0 1 2
Total 355 318 375Industrial Countries 299 309 345Developing Countries 57 9 29 Latin America 31 -11 -7 East Asia 13 11 26 South Asia 2 6 7 Sub-Sahara Africa 5 1 0 Middle East 5 2 3Source: IMF (1998) and authors' calculations.
Total Financial Liabilities
Foreign Direct Investment
Portfolio Investments
Other Financial Liabilities


