
May 2019Cantabil Retail India Limited

This document has been prepared by Cantabil Retail India Limited (the “Company”) solely for information purposes and does not constitute any offer,
recommendation or invitation to purchase or subscribe for any securities, and shall not form the basis or be relied on in connection with any contract or binding
commitment what so ever. No offering of securities of the Company will be made except by means of a statutory offering document containing detailed
information about the Company.
This document has been prepared by the Company based on information and data which the Company considers reliable, but the Company makes no
representation or warranty, express or implied, whatsoever, and no reliance shall be placed on, the truth, accuracy, completeness, fairness and reasonableness of
the contents of this document. This document may not be all inclusive and may not contain all of the information that you may consider material. Any liability in
respect of the contents of, or any omission from, this document is expressly excluded.
Certain matters discussed in this document may contain statements regarding the Company’s market opportunity and business prospects that are individually and
collectively forward-looking statements. Such forward-looking statements are not guarantees of future performance and are subject to known and unknown risks,
uncertainties and assumptions that are difficult to predict. These risks and uncertainties include, but are not limited to, the performance of the Indian economy
and of the economies of various international markets, the performance of the industry in India and world-wide, competition, the company’s ability to successfully
implement its strategy, the Company’s future levels of growth and expansion, technological implementation, changes and advancements, changes in revenue,
income or cash flows, the Company’s market preferences and its exposure to market risks, as well as other risks. The Company’s actual results, levels of activity,
performance or achievements could differ materially and adversely from results expressed in or implied by this document. The Company assumes no obligation to
update any forward-looking information contained in this document. Any forward-looking statements and projections made by third parties included in this
document are not adopted by the Company and the Company is not responsible for such third party statements and projections.
2
Disclaimer

3
Table of Content
Company Overview
Business Overview
Industry Overview
Financial Highlights
Way Ahead

Company Overview
Who we are
Management
Key Strengths

5
Among Leading Retail Brands in India
CANTABIL
State of Art Manufacturing Facility▪ One owned manufacturing facility and two
centralized warehouses to ensure seamless & timely logistics of quality products
▪ Current combined capacity - 10 Lakh pcs. of garments p.a. at Bahadurgarh factory
▪ Focus on customer requirement & high quality product – driven by combination of strong vendor tie-ups for sourcing, importing from China, job workers
Certifications & Awards▪ Awarded “Best Quality Design Award”
for 2008 ▪ Awarded “Best Brand Award” in 2018
Wide and Diverse Product Portfolio▪ Men’s wear - Formals, Casuals, Ultra
Casuals, Woollen, Knitwear & Accessories▪ Women’s Wear – Formals, Casuals,
Woollen/Knitwear▪ Kids Wear - Casuals
Reputed Clientele▪ Raymond's, Splash (Lifestyle Group),
Austin Reed (Apparel UAE), Benetton, etc.
World class designing, manufacturing, branding and retailing of apparels▪ Market apparels under Brands “CANTABIL”,
“CROZO”, “LIL POTATOES”, “KANESTON”▪ Presence across 16 states with 241 EBOs as on
31st March 2019▪ Sales floor area - 2,53,539 sq. ft. as on Mar 31,
2019
Strong Retail Network▪ 241 Exclusive Brand Outlets▪ Out of 241 EBOs - 194 stores are
Company operated and 47 stores are Franchise operated

Mr. Vijay Bansal
6
Strong & Experienced Management Team
▪ Rich & vast experience in Apparel and Retail Business
▪ Founded, Promoted and launched Brand “Cantabil” in 2000
▪ Awarded “Delhi Udyog Ratan Award 2008” by Government of Delhi and “GLOBAL BUSINESS ICON” award by Hon’ble Union Minister of Science & Technology in June 2018
Mr. Deepak Bansal Mr. Basant Goyal Mr. Shivendra Nigam (FCA)
Ms. Poonam Chahal (FCS, LLB)
▪ Graduate in mathematics from Delhi University
▪ 13+ years of experience in Retail Apparel Industry
▪ Responsible for marketing strategy and spearhead plans to expand
▪ Explore new markets & increasing retail footprint in India
▪ Graduate in Bachelor of Business Study from Delhi University
▪ Responsible for Production & overall Administration of Company
▪ Commerce graduate and Chartered Accountant
▪ Extensive experience in Finance, Accounts, Administration, Management & Tactical planning and Regulatory compliances
▪ Responsible for ensuring financial, accounting compliances and reporting requirements
▪ Holds Master’s degree in Commerce, degree in law and fellow member of ICSI
▪ 12 years of experience in Corporate Law, Securities Law, IPO, Due Diligence, Corporate Governance, Foreign Exchange Law & IPR
▪ Heads Legal and Compliance Department
Company SecretaryChief Financial OfficerWhole Time DirectorWhole Time DirectorChairman & Managing Director

7
Key Strengths
Reputed and Long Term Clients
▪ Key marquee customers like Raymond's, Splash (Lifestyle Group), Austin Reed (Apparel UAE), Benetton etc.
▪ Focus on attaining highest level of customer satisfaction
Strong Retail Presence
▪ Pan-India presence of 241 exclusive retail outlets with floor space of 2.53 lacs sq. ft across 16 states
Dynamic & Experienced Leadership
▪ Strong management team with rich experience in Textile Industry
▪ Dedicated and skilled employee base
Wide Apparel Range with Quality Garments
▪ Apparel range catering to wide customer base across all segments i.e. men’s, ladies and kids
▪ Strong in-house design and research team▪ Fabrics and Fabric designs made to order
as per customers’ need
State of Art Infrastructure Facilities
▪ World class integrated manufacturing facility spread across 1.50 Lakh sq. ft. at Bahadurgarh, Haryana operating through Exclusive Brand Outlets
▪ All outlets at prime locations in respective markets
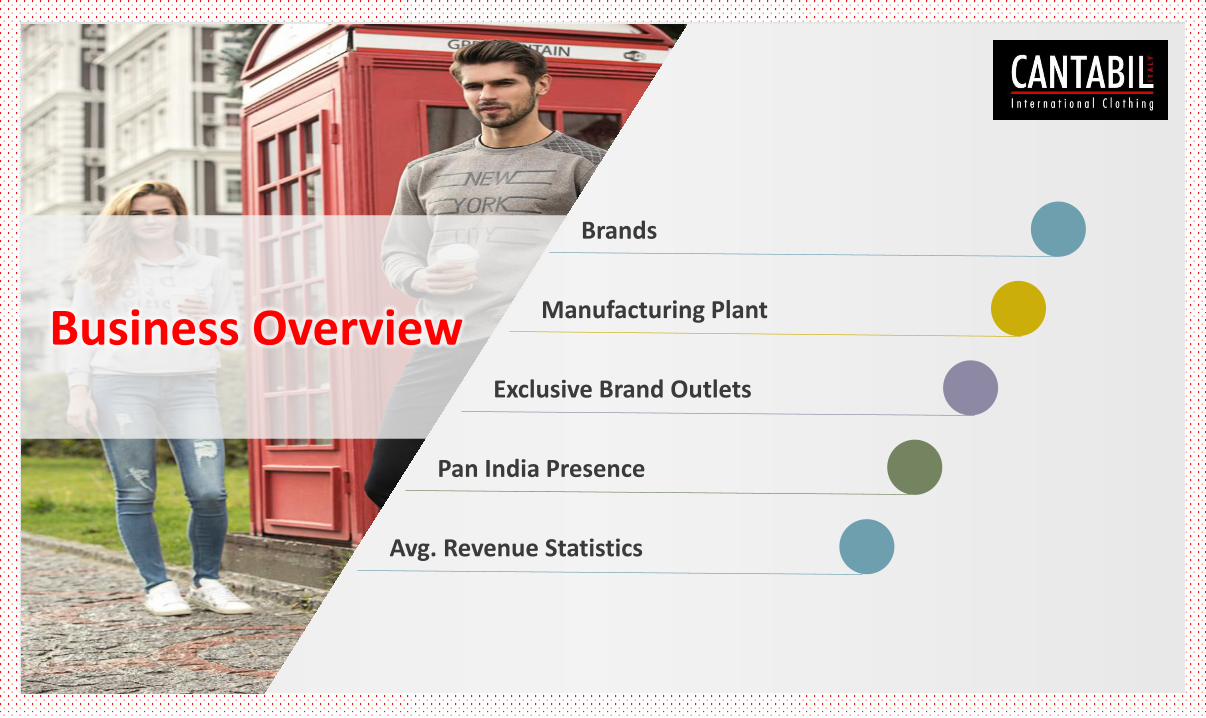
Business Overview
Brands
Manufacturing Plant
Exclusive Brand Outlets
Pan India Presence
Avg. Revenue Statistics
9
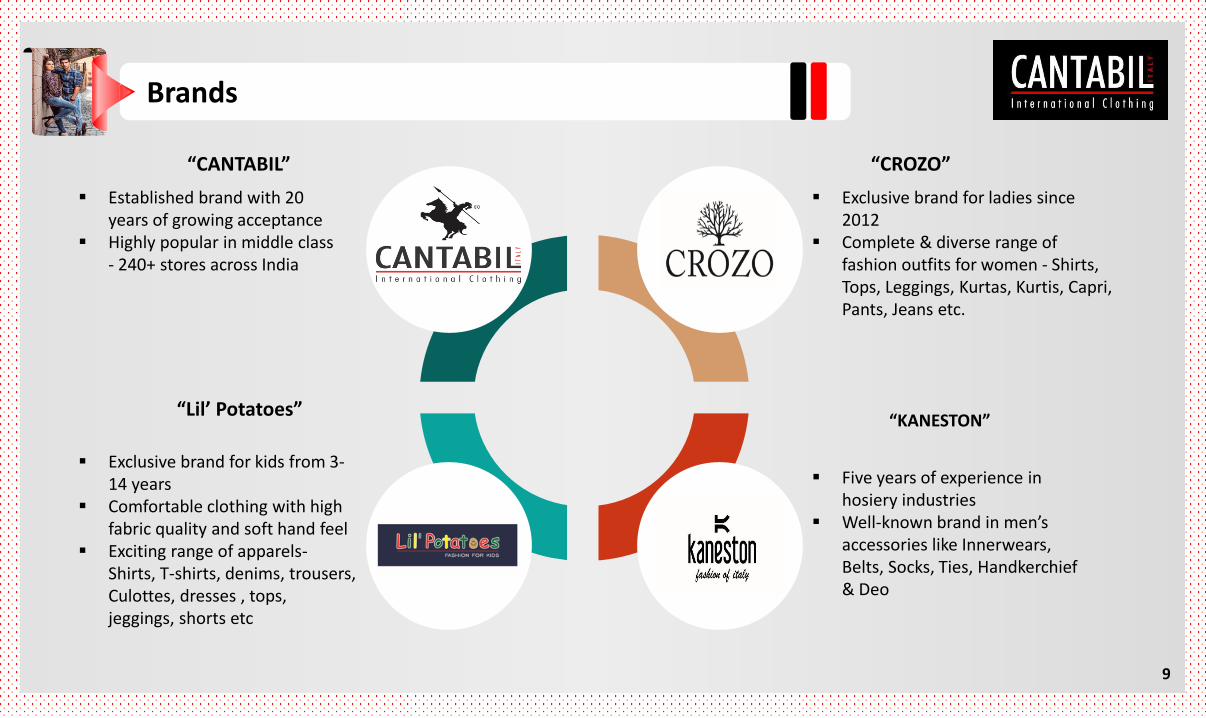
Brands
“CROZO”
▪ Exclusive brand for ladies since 2012
▪ Complete & diverse range of fashion outfits for women - Shirts, Tops, Leggings, Kurtas, Kurtis, Capri, Pants, Jeans etc.
“KANESTON”
▪ Five years of experience in hosiery industries
▪ Well-known brand in men’s accessories like Innerwears, Belts, Socks, Ties, Handkerchief & Deo
“Lil’ Potatoes”
▪ Exclusive brand for kids from 3-14 years
▪ Comfortable clothing with high fabric quality and soft hand feel
▪ Exciting range of apparels-Shirts, T-shirts, denims, trousers, Culottes, dresses , tops, jeggings, shorts etc
“CANTABIL”
▪ Established brand with 20 years of growing acceptance
▪ Highly popular in middle class - 240+ stores across India

10
Our Brands
“CANTABIL” “CROZO”

11
Our Brands contd…
“KANESTON” “Lil’ Potatoes”

12
Manufacturing Plant - Haryana
▪ State-of-art world class manufacturing plant across area of 1.50 Lakh sq. ft. in
Bahadurgarh, Haryana
▪ Fully integrated infrastructure and systems for modern manufacturing &
retailing with complete automation - from Cutting to manufacture and
finishing of formal and casual trousers, formal shirts & Men’s Suits,
waistcoats, blazers in Formal, Casual and party-wear range
▪ Current combined capacity to produce 10.00 Lakh pcs. of garments per
annum with Casual trousers of 3 lac pcs, Formal trousers of 2 lac pcs, Suits &
jackets to 2 lac pcs and shirts to 3 lac pcs
▪ Equipped with best brand machines from JUKI, Durkopp, Brother, Ngai
Shing, Kansai, Pfaff, Maier, Siruba, Sako and latest finishing equipment using
hot and cold steam foam finishers from Veit and Macpi
▪ Space and scope to double existing capacity

13
Pan India Presence
State31st Mar’
201931st Mar’
2018
Bihar 3 1
Chhattisgarh 6 4
Delhi 54 49
Gujrat 13 9
Haryana 32 24
Himachal Pradesh 1 1
Jammu & Kashmir 4 4
Jharkhand 6 3
Maharashtra 29 20
Madhya Pradesh 2 1
Punjab 15 11
Rajasthan 28 23
Telangana 2 2
UP 39 27
Uttaranchal 6 4
West Bengal 1 1
Total 241 184

14
Exclusive Brand Outlets
Company & Franchise Operated
99121
141
194
55 47 43 47
Mar-16 Mar-17 Mar-18 Mar-19
No. of Stores
Company Operated Franchise Operated
1,06,4161,31,404
1,55,646
2,17,903
40,136 31,906 30,156 35,636
Mar-16 Mar-17 Mar-18 Mar-19
Company Operated Franchise Operated
Régional Distribution
105 110120
151
7 6 5 10
38 45 5270
1 2 2 23 5 5 8
Mar-16 Mar-17 Mar-18 Mar-19
No. of Stores
North East West South Central
1,06,2181,13,417
1,27,413
1,63,254
6,077 5,627 5,202 11,128
29,407 36,24145,162
68,752
900 2,100 2,100 2,1003,950
5,9255,925 8,305
Mar-16 Mar-17 Mar-18 Mar-19
Floor Area
North East West South Central
Floor Area

15
Avg. Revenue Statistics
97.01106.11 104.81
117.93 122.06
FY15 FY16 FY17 FY18 FY19
Avg Revenue per Store (in lakhs)
891963 973
1,0421,107
FY15 FY16 FY17 FY18 FY19
Weighted Avg Revenue per Sq.ft (in Rs.)
1,35,766 1,46,5521,63,310
1,85,802
2,53,539
FY15 FY16 FY17 FY18 FY19
Total sq. ft
132.97148.05 149.10
180.15
233.09
FY15 FY16 FY17 FY18 FY19
Same Store Sales (in crs)

Apparel Market
Retailers
Industry Overview

17
Indian Apparel Industry
108137 150
223
FY15 FY16 FY17^ FY21F
Textile and apparel industry in India (US$ bn)
36.75 39.00 39.20
24.90
82.00
FY16 FY17 FY18 FY19* FY21E
Textiles and apparel exports from India (US$ bn)
64.30 64.60 63.60 66.90
45.70
FY15 FY16 FY17 FY18 FY19P*
Total cloth production in India (bn sq. mtrs)
Notes: E – Estimate, F – Forecast, ^ - as of November 2017, * - between April–November 2018, P - Provisional CAGR up to FY18, P – Provisional / Source : IBEF
▪ Second largest contributor in retail after food and grocery industry in India
▪ 41% of Men’s wear, 38% Women’s wear and 21% kid’s wear
▪ Per capita expenditure on apparel expected to reach Rs. 8,000 by 2025, rising from Rs. 3,100 in 2015. Thereby expected to grow to Rs. 11.7 Lakh Crores (USD 180 bn) by 2025
▪ Fitness and healthcare concerns in youth to lead growth at high CAGRs of 14%, 14% and 12% in denim, active wear and t-shirts respectively
▪ Women’s wear - Expected to grow at CAGR of 9.9% to reach US $44 bn in 2026
▪ Urban areas witnessing clear shift in Women’s Wear- from saree to salwar kameez, kurti’s, shirts, tops, trousers and denims – expected to remain high growth product categories & grow at a CAGR of 12-16%
▪ Significant opportunity in branded kid’s wear as currently less number of players in India - expected to reach Rs. 1,57,000 Crores by 2025 at a CAGR of approx. 10-11%.

18
Strong Growth in Indian Retail Industry
Note: *CAGR for 2000-2016, F – Forecast, E – Estimated , Source : IBEF - https://www.ibef.org/download/retail-feb-2019.pdf
204 238 278 321 368 424518 490 534 600 641 672
1,200
1,750
Market size over the past few (US$ billion)
▪ Total market size of Indian retail industry reached US$ 672 bn in 2017. Forecasted to increase to US$ 1,200 bn by 2021 and 1,750 bn by 2026
▪ India – fast growing market for fashion retailers on back of favorable demographics, increase in awareness of fashion trends, disposable incomes and relaxed FDI norms
▪ By 2021 traditional retail to hold major share of 75%, organized retail share to reach 18% and e-commerce retail share to reach 7% of total retail market
▪ Organized retail market in India growing at a CAGR of 20-25% per year
▪ Global large retailers such as Walmart, GAP, Tesco etc in process of increasing their sourcing from India and moving from third-party buying offices to establishing their own wholly-owned/wholly-managed sourcing and buying offices
▪ FDI in multi-brand retail approved to 51% and increased FDI limit to 100%(from 51%) in single brand retail, and has plans to allow 100% FDI in e-commerce, under arrangement that products sold must be sourced or manufactured in India
13.00 14.50 17.80
32.70
60.00
73.00
FY15 FY16 FY17 FY18F FY20F FY22F
Online retail in India (US$ billion)

Management Comment
Financial Highlights – Annual
Revenue Breakup - Segmental
Revenue Breakup - Regional
Financial Highlights
Key Financial Ratios
Balance Sheet Highlights

20
Management Comment – FY19
We are happy to share that our financial & operational performance has beenin line with our expectations. During the year we registered a strong revenuegrowth of over 47% and recorded a significant increase in our profits. This is onaccount of increase in sales from our existing stores as well as sales from newstores that we added across India during the year.
Our focus will remain on maintaining our operational efficiencies leading to abetter profitability. We believe we are well positioned to capitalize onopportunities in the industry and will be able to increase our market shareprogressively. We see lot of opportunities in opening up new stores andincreasing our presence across India and focus to grow our retail business.
I thank the entire team of ‘Cantabil Retail India Ltd’ for their untiring efforts,hard work, sincerity and high dedication. Also, I would like to thank our valuedShareholders, whose support and faith in our Company along with their criticalinputs has given us the determination and ambition to grow from strength tostrength.”
Commenting on the results, Mr. Vijay Bansal, Chairman & Managing Director, Cantabil Retail India Limited said :

21
Financial Highlights – Annual*
14.3216.21 18.02
19.96
29.61
0
5
10
15
20
25
30
35
FY15 FY16 FY17 FY18 FY19
138.68 155.27 156.72197.24
288.55
FY15 FY16 FY17 FY18 FY19
Revenue from Operations (Rs. Crs)
EBITDA excluding Other Income (Rs. Crs)
17.05 18.96 19.0021.95
30.69
FY15 FY16 FY17 FY18 FY19
Sales Qty in Lakhs
* Numbers as per Ind AS guidelines

22
Financial Highlights – FY19*
Revenue from OperationsRs. 288.55 Crore
47.08%EBITDARs. 29.61 crore
48.29%EBITDA Margin10.26%
8 bps
* Numbers as per Ind AS guidelines
• 47% YoY growth in Revenue on account of increase in number of stores from 184 in FY18 to 241 in FY19 and higher same store sales
• Average revenue per store increased from Rs. 1.18 cr in FY18 to Rs. 1.22 cr in FY19
• Same store sales increased from Rs. 180.15 cr in FY18 to Rs. 233.09 cr in FY19

23
Financial Highlights – Annual*
*Numbers as per Ind AS guidelines
Rs. Cr FY19 FY18 Y-o-Y(%)Income from Operations 288.55 197.24
Excise Duty 0.00 1.05
Revenue from Operations 288.55 196.19 47.08%
Cost of Goods Sold 136.26 68.66
Employee Cost 51.47 37.12
Job Work Charges 10.18 19.60
Lease Rentals 27.31 24.46
Other Expenses 33.73 26.37
Total Expenditure 258.95 176.22
EBITDA 29.61 19.96 48.29%
EBITDA Margin% 10.26% 10.18%
Other Income 4.00 1.41
Depreciation 8.89 8.84
Interest 8.52 6.80
Exceptional Item 0.00 1.89
Profit Before Tax 16.19 7.63
Tax 3.69 (12.36)
PAT 12.50 19.99 (37.46%)
Adj. PAT (for def. tax on previous losses) 12.50 8.89 40.61%
EPS in Rs. 7.66 12.24 (37.42%)
• Revenue growth onaccount of additionalstores and higher samestore sales
• Higher average revenue perstore leading toincremental EBITDA
• Interest includes notionalcost of Rs. 1.85 cr in FY19and 0.45 cr in FY18 forUnwinding of Interest costson security Deposits
• Adj. PAT - in compliancewith provisions of Ind AS12, one time adjustment ofdeferred tax asset of Rs.11.10 cr created in Q4 FY18on account of carry forwardlosses of Rs. 40.29 cr

24
Revenue Break Up – Segmental
FY18 FY19
Men's Wear, 85%
Women's Wear, 12%
Accessories, 3%
Men's Wear, 87%
Women's Wear, 10%
Accessories, 3%
Kid’s wear brand - “LiL’ Potatoes” launched in Nov’18

25
Revenue Break Up – Regional
North, 68%
East, 4%
West, 24%
South, 1%Central, 3%
North, 74%
East, 3%
West, 20%
South, 1% Central, 2%
FY18 FY19

26
Key Financials Ratios*
ROA** (%) RoCE (%)
2.15%3.70%
2.50%
10.47%
5.55%
FY15 FY16 FY17 FY18 FY19
10.14% 11.32% 11.20% 10.83%
19.07%
FY15 FY16 FY17 FY18 FY19
3.99%6.41%
4.80%
19.77%
10.94%
FY15 FY16 FY17 FY18 FY19
RoE** (%)
RoE = Net Profit/Total Equity; RoA = Net Profit/Total Assets ; RoCE = EBIT/(Total Assets – Current Liabilities) ; Debt to Equity = Total Debt/Total Equity *Numbers as per Ind AS guidelines
0.480.42
0.46 0.43
0.34
FY15 FY16 FY17 FY18 FY19
Debt to Equity
**PAT is adjusted in compliance with provisions of Ind AS 12, one time adjustment of deferred tax asset of Rs. 11.10 cr created in Q4 FY18 on account of carry forward losses of Rs. 40.29 cr

27
Balance Sheet Highlights - Annual*
Rs. Crs Mar-19 Mar-18
Total Equity 114.30 101.10
Equity Share capital 16.33 16.33
Other Equity 97.97 84.77
Non - Current Liabilities 15.31 14.66
Borrowings 4.29 6.98
Other Financial Liabilities 5.52 3.93
Provisions 2.77 2.29
Other Non - Current Liabilities 2.73 1.46
Current Liabilities 95.52 75.14
Borrowings 34.56 36.32
Trade Payables 49.13 26.18
Other Financial Liabilities 7.53 5.46
Provisions 2.36 2.03
Other Current Liabilities 1.94 5.15
Total Equities & Liabilities 225.13 190.89
Rs. Crs Mar-19 Mar-18
Non-Current Assets 94.75 87.84
Property, Plant and Equipment 59.36 54.54
Capital work in progress 0.34 0.16
Investment Property 3.70 3.76
Other Intangible Assets 0.36 0.32
FA - Investments 0.15 0.10
FA - Other Financial Assets 0.13 0.11
FA – Loans 6.67 5.97
Deferred Tax Assets (Net) 16.90 17.38
Other Non - Current Assets 7.14 5.50
Current Assets 130.38 103.05
Inventories 96.90 81.06
FA - Investments 0.06 0.05
FA - Trade Receivables 18.45 10.50
FA - Loans 0.56 0.34
FA - Cash & Cash Equivalent 2.57 2.59
FA - Other Financial Assets 4.18 4.12
Current Tax Assets (Net) 0.23 0.49
Other Current Assets 7.44 3.89
Total Assets 225.13 190.89
* Numbers as per Ind AS guidelines

Way Ahead

29
Way Ahead
Reduction of operational costs and achieving efficiency
Widening customer base, Adding new markets and Increasing wallet share
Enhancing manufacturing capacities
• Right selection of property with building brand which includes strongest basic parameters of product – to enhance customer loyalty
• Further space and scope to gradually add an equal quantity to the existing capacity as per the increase in demand by sizeable numbers
• Focus on areas to reduce costs and achieve efficiencies in order to remain competitive
• Reduce wastage and control fabrication on production floor through effective supervision
• With growing market opportunities available - endeavor to grow business by adding new customers in existing markets and increasing wallet share of existing customers by adding more product lines
• Increasing geographical presence -identifying new markets in India -expand and enhance across all own brands
Increasing Retail Presence
• Planned expansion to open 5 to 7 stores per month
• Expand ladies brand store network to 130 stores from existing 104 in next 12 months
• Enhancing shopping experience by providing ‘Best Brand Mix’

For further information, please contact:
Company : Investor Relations Advisors :
Cantabil Retail India Ltd.
Mr. Shivendra [email protected]
www.cantabilinternational.com
Bridge Investor Relations Pvt. Ltd.
Mr. Amit [email protected]
Ms. Disha [email protected]
www.bridge-ir.com
CANTABIL CANT IN CRIL.BO533267
Thank You


