
1
California’s Central Valley – HKHC Leading Site
California’s Central Valley – HKHC Leading Site
CASE REPORT
CENTRAL VALLEY, CALIFORNIA
Evaluation of the Healthy Kids, Healthy Communities National Program
December 2008 to December 2012

2
California’s Central Valley – HKHC Leading Site
ACKNOWLEDGMENTS
Support for this evaluation was provided by a grant from the Robert Wood Johnson Foundation (#67099). Transtria LLC led the evaluation and dissemination activities from April 2009 to March 2014. Representatives from California’s Central Valley – HKHC Leading Site partnership actively participated in the evaluation planning, implementation, and dissemination activities. This case report is a synthesis of information collected through multiple evaluation methods as part of a collaborative, community-based approach to evaluation.
We are grateful for the collaboration with and support from the Robert Wood Johnson Foundation (Laura Leviton, PhD and Tina Kauh, PhD), the Washington University Institute for Public Health (Ross Brownson, PhD), the Healthy Kids, Healthy Communities (HKHC) National Program Office (Casey Allred; Rich Bell, MCP; Phil Bors, MPH; Mark Dessauer, MA; Fay Gibson, MSW; Joanne Lee, LDN, RD, MPH; Mary Beth Powell, MPH; Tim Schwantes, MPH, MSW; Sarah Strunk, MHA; and Risa Wilkerson, MA), the HKHC Evaluation Advisory Group (Geni Eng, DrPH, MPH; Leah Ersoylu, PhD; Laura Kettel Khan, PhD; Vikki Lassiter, MS; Barbara Leonard, MPH; Amelie Ramirez, DrPH, MPH; James Sallis, PhD; and Mary Story, PhD), the Social System Design Lab at Washington University in St. Louis (Peter Hovmand, PhD), the University of Memphis (Daniel Gentry, PhD), and Innovative Graphic Services (Joseph Karolczak).
Special thanks to the many individuals who have contributed to these efforts from Transtria LLC, including Evaluation Officers (Tammy Behlmann, MPH; Kate Donaldson, MPH; Cheryl Carnoske, MPH; Carl Filler, MSW; Peter Holtgrave, MPH, MA; Christy Hoehner, PhD, MPH; Allison Kemner, MPH; Jessica Stachecki, MSW, MBA), Project Assistants (James Bernhardt; Rebecca Bradley; Ashley Crain, MPH; Emily Herrington, MPH; Ashley Farell, MPH; Amy Krieg; Brandye Mazdra, MPH; Kathy Mora, PhD; Jason Roche, MPH; Carrie Rogers, MPH; Shaina Sowles, MPH; Muniru Sumbeida, MPH, MSW; Caroline Swift, MPH; Gauri Wadhwa, MPH; Jocelyn Wagman, MPH), additional staff (Michele Bildner, MPH, CHES; Daedra Lohr, MS; Melissa Swank, MPH), Interns (Christine Beam, MPH; Skye Buckner-Petty, MPH; Maggie Fairchild, MPH; Mackenzie Ray, MPH; Lauren Spaeth, MS), Transcriptionists (Sheri Joyce; Chad Lyles; Robert Morales; Vanisa Verma, MPH), and Editors (Joanna Bender and Julie Claus, MPH).
This material may be reproduced or copied with permission from California’s Central Valley – HKHC Leading Site, Robert Wood Johnson Foundation, the Healthy Kids, Healthy Communities National Program Office, or Transtria LLC. Citation of the source is appreciated.
Cover photos: HKHC Dashboard and Transtria LLC.
Suggested citation:
Bildner M. California’s Central Valley – HKHC Leading Site Case Report. St. Louis, MO: Transtria LLC; 2014. http://www.transtria.com/hkhc. Accessed <Month Day, Year>.
For more information about the evaluation aims, methods, analyses, or products, please contact Laura Brennan ([email protected]) or Allison Kemner ([email protected]).
ACKNOWLEDGMENTS

3
California’s Central Valley – HKHC Leading Site
TABLE OF CONTENTS
Background 4-5
Community Demographics 6-7
Influence of Social Determinants 8-9
California’s Central Valley – HKHC Leading Site Partnership 10-11
Leadership Development Program 12-15
Partnership Funding 16-17
Community Assessment 18-20
Planning and Advocacy Efforts 21-22
Healthy Eating and Active Living Strategies
Parks and Play Spaces 23-25
Joint Use 26-27
Community Gardens and School Farm Stands 28-29
Farmers’ Markets 30-31
Corner Stores 32
Sustainability of the Partnership and Initiative 33
Tables
Table 1: Sociodemographic Characteristics of California’s Central Valley HKHC Sites 7
Figures
Figure 1: Map of Healthy Kids, Healthy Communities Partnerships 4
Figure 2: Map of 8 HKHC Counties in Central Valley, CA 6
Figure 3: Parks and Play Spaces Infographic 25
Appendices
Appendix A: California’s Central Valley Evaluation Logic Model 35
Appendix B: Partnership and Community Capacity Survey Results 37
Appendix C: Partner List 42
Appendix D: Sources and Amounts of Funding Leveraged 43
Appendix E: Enhanced Evaluation Reports 45
TABLE OF CONTENTS

4
California’s Central Valley – HKHC Leading Site
BACKGROUND
Healthy Kids, Healthy Communities National Program
With the goal of preventing childhood obesity, the Healthy Kids, Healthy Communities (HKHC) national program, funded by the Robert Wood Johnson Foundation (RWJF), provided grants to 49 community partnerships across the United States (See Figure 1). Healthy eating and active living policy, system, and environmental changes were implemented to support healthier communities for children and families. The program placed special emphasis on reaching children at highest risk for obesity on the basis of race, ethnicity, income, or geographic location.1
Project Officers from the HKHC National Program Office assisted community partnerships in creating and implementing annual workplans organized by goals, tactics, activities, and benchmarks. Through site visits and monthly conference calls, community partnerships also received guidance on developing and maintaining local partnerships, conducting assessments, implementing strategies, and disseminating and sustaining their local initiatives. Additional opportunities supplemented the one-on-one guidance from Project Officers, including peer engagement through annual conferences and a program website, communications training and support, and specialized technical assistance (e.g., health law and policy).
For more about the national program and grantees, visit www.healthykidshealthycommunities.org.
Figure 1: Map of Healthy Kids, Healthy Communities Partnerships
Evaluation of Healthy Kids, Healthy Communities
Transtria LLC and Washington University Institute for Public Health received funding from the Robert Wood Johnson Foundation to evaluate the HKHC national program. They tracked plans, processes, strategies, and results related to active living and healthy eating policy, system, and environmental changes as well as influences associated with partnership and community capacity and broader social determinants of health.
BACKGROUND

5
California’s Central Valley – HKHC Leading Site
Reported “actions,” or steps taken by community partnerships to advance their goals, tactics, activities, or benchmarks from their workplans, formed community progress reports tracked through the HKHC Community Dashboard program website. This website included various functions, such as social networking, progress reporting, and tools and resources to maintain a steady flow of users over time and increase peer engagement across communities.
In addition to action reporting, evaluators collaborated with community partners to conduct individual and group interviews with partners and community representatives, environmental audits and direct observations in specific project areas (where applicable), and group model building sessions. Data from an online survey, photos, community annual reports, and existing surveillance systems (e.g., U.S. census) supplemented information collected alongside the community partnerships.
For more about the evaluation, visit www.transtria.com/hkhc.
California’s Central Valley—HKHC Leading Site
The Central California Regional Obesity Prevention Program (CCROPP), a program developed by the Central California Public Health Partnership, was the lead agency for the Healthy Kids, Healthy Communities (HKHC) Central Valley Project. CCROPP is facilitated by California State University, Fresno and brought together eight public health departments, community-based organizations, and community councils to build the capacity of community residents as advocates for change in improving local food and physical activity environments. Through funding from The California Endowment (TCE), Robert Wood Johnson Foundation, and James Irvine Foundation. the coalition has strengthened the capacity of county public health departments to collaborate with communities to improve local environments for healthy eating and physical activity. It also has built a regional infrastructure to leverage resources, skills, communication, and policy efforts for other health improvement activities.
The partnership and capacity building strategies included:2,3
Powerful People: Building Leadership for Healthy Communities: The Project Director worked with community partners and residents to design a leadership development training program and curriculum with the goal of enabling those who have traditionally been marginalized to speak for themselves. The 12-module community leadership curriculum provided training around the basic skills needed to help residents become change agents. It is culturally, linguistically, and literacy-level appropriate for low-income communities of color, and available in English and Spanish.3
See Appendix A: California’s Central Valley Evaluation Logic Model and Appendix B: Partnership and Community Capacity Survey Results for additional information.
Along with partnership and capacity building strategies, the Central Valley HKHC partnership incorporated assessment and community engagement activities to support the partnership and the healthy eating and active living strategies.
The healthy eating and active living strategies of Central Valley HKHC included:2,3
Active Transportation: Leaders advocated for Safe Routes To School in Stockton, Ceres, and Merced, resulting in improved pedestrian and bicycling access around two schools. The partnership also implemented a Walking School Bus and secured additional funding to improve pedestrian and bicycling environments.
Parks and Play Spaces: HKHC partners improved safety and park amenities (e.g., installed lighting, planted trees, repaired swings) in Bakersfield and increased secured joint use agreements in Fresno, Fairmead, and Stockton between neighborhood schools and the community, for example.
Healthy Eating: Graduates of the Power People program established school farm stands in Fresno and Ceres solidified Electronic Benefit Transfer (EBT) acceptance at a flea market in Merced, increased access to fruits and vegetables at a corner store in Stockton, and started community gardens in Pixley and Bakersfield.
BACKGROUND

6
California’s Central Valley – HKHC Leading Site
COMMUNITY DEMOGRAPHICS
The 240-mile long San Joaquin Valley is a major agricultural region encompassing eight counties in Central California (Kern, Kings, Tulare, Fresno, Madera, Merced, Stanislaus, and San Joaquin). However, residents, many of them migrant workers, are often unable to enjoy the abundance of food grown all around them, as Central Valley grows the bulk of the nation’s fruits and vegetables. People living here have among the lowest per capita income, highest rates of poverty, and lowest educational attainment in the state (see Table 1). All are factors contributing to pronounced rates of overweight and obesity, particularly among youth.
There are over 70 ethnicities represented in Central Valley and over 100 languages spoken. Outside of the City of Los Angeles, the region has the largest concentration of Latinos in the United States. However, there are distinct differences between the North and South Central Valleys. North Valley, close to Oakland and San Francisco, adopts culture and the leadership that is almost all African American women. Whereas, the South Valley leadership is mostly Hispanic women.
According to a study conducted by the Great Valley Center, California’s population was growing at a faster rate than the U.S. as a whole, and Central Valley was growing almost 50% faster than the state.4 Compared to other counties in the region, Kern County has the largest population percentage change (26.9%). The populations in San Joaquin and Merced counties are expected to increase by 2.5 times the current population over the next 50 years. Other valley counties (Kern, Madera, Merced, San Joaquin) are expected to double their populations by 2040.5
COMMUNITY DEMOGRAPHICS
Figure 2: Map of 8 HKHC Counties in Central Valley, CA2

7
California’s Central Valley – HKHC Leading Site
COMMUNITY DEMOGRAPHICS
Table 1: Sociodemographic Characteristics of California’s Central Valley HKHC Sites5,6
Dem
og
rap
hic
Ch
ara
cte
risti
cs
F
resn
o
Kern
K
ing
s
Mad
era
M
erc
ed
S
an
Jo
aq
uin
S
tan
isla
us
T
ula
re
Cen
tral
Vall
ey
C
alifo
rnia
Po
pu
lati
on
930,4
50
839,6
31
152,9
82
150,8
65
155,7
93
685,3
09
514,4
53
442,1
79
3,9
71,6
59
37,2
53,9
56
Po
pu
lati
on
per
Sq
uare
Mile
156.0
103.1
110
70.6
132.6
489.8
344.4
91.7
184.0
238.9
% A
fric
an
Am
eri
can
5.3
%
5.8
%
7.2
%
3.7
%
3.9
%
7.6
%
2.9
%
1.6
%
5.1
%
6.2
%
% W
hit
e
32.7
%
38.6
%
35.2
%
38.0
%
31.9
%
35.9
%
46.7
%
32.6
%
39.2
%
40.1
%
% H
isp
an
ic/
Lati
no
50.3
%
49.2
%
50.9
%
53.7
%
54.9
%
38.9
%
41.9
%
60.6
%
47.2
%
37.6
%
% A
sia
n
1.7
%
1.5
%
1.7
%
2.7
%
1.4
%
1.1
%
1.1
%
1.6
%
5.9
%
13.0
%
% L
an
gu
ag
e O
ther
Th
an
En
glish
at
Ho
me
42.9
%
41.%
42.4
%
43.3
%
51.8
%
39.0
%
40.5
%
47.5
%
42.7
%
43.5
%
% 2
5 y
ea
rs
wit
ho
ut
Hig
h
Sch
oo
l D
iplo
ma
26.8
%
29.8
%
30.8
%
31.4
%
33.7
%
24.3
%
24.8
%
32.4
%
29.3
%
19.7
%
Pers
on
s U
nd
er
18
Years
29.3
%
29.9
%
27.7
%
28.3
%
30.7
%
28.6
%
27.9
%
32.1
%
29.4
%
24.3
%
An
nu
al
Un
em
plo
ym
en
t R
ate
15.1
%
14.4
%
14.6
%
13.8
%
17.2
%
15.4
%
16.0
%
18.4
%
15.6
%
11.4
%
Per
Cap
ita I
nco
me
$30,9
97
$30,0
47
$26,7
34
$26,5
24
$27,8
17
$31,5
47
$31,4
85
$28,6
10
$29,2
27
$42,3
25
Med
ian
Ho
useh
old
In
co
me
$46,9
03
$48,0
21
$48,8
38
$47,7
24
$43,9
45
$53,7
64
$50,6
71
$43,5
50
$48,3
53
$61,4
00
% o
f T
ota
l P
op
ula
tio
n B
elo
w
100
% o
f F
PL
27.8
%
24.7
%
26.9
%
23.6
%
24.4
%
23.5
%
17.2
%
27.7
%
24.7
%
17.8
%

8
California’s Central Valley – HKHC Leading Site
INFLUENCE OF SOCIAL DETERMINANTS
According to the latest county health rankings released in 2014, six out of eight Central Valley HKHC communities ranked in the bottom 25th percentile in terms of overall health status: Kern (54); Tulare (47), Fresno (46), Madera (43), San Joaquin (42), Kings (41), Merced and Stanislaus ranked only slightly higher (37 and 35, respectively).7 The annual rankings measure vital health factors (e.g., obesity, smoking, teen births) in nearly every county in America and provide a snapshot of how health is influenced by where Americans live, learn, work, and play.7
Migrant Workers
Poor housing conditions are common for migrant and itinerant workers in Central Valley. There have been instances of ten workers living in a single trailer with no sewer hook-up. In addition to poor living conditions, many of the migrant workers are undocumented and are part of an underground economy, therefore exploitation is common. The owners of the housing facilities where migrant workers reside often exploit them by charging relatively high rent for poor conditions.
Communities in California’s Central Valley are advocating for immigration reform that will allow them to continue to live there, but also offer legal citizenship. Illegal immigrants who work in the Valley still contribute to the economy by paying sales tax and buying goods and services. Subsequently, if immigration reform remains constrained (as in Arizona), workers will be forced to leave the state and crops will not be harvested, resulting in a decline in the local economy.
Geographic Isolation
Freeway systems have been an issue for Central Valley in past years. Roadways and railroad systems that should promote community development and growth have been established in locations that have produced the opposite effect. In some cases, communities have been isolated from each other and access to healthy eating and active living opportunities for residents within these communities have been limited. For example, there are many challenges to kids walking safely in Fresno and Bakersfield, due to the close proximity to freeways.
The only grocery store in Madera closed when the state Department of Transportation upgraded all of the exit and entrance highway ramps and relocated the exit to Madera further away, diverting traffic that otherwise came into the community.
Income and Education
Inequality in income and education correlate to a high prevalence of health disparities, population groups that suffer the worst health status often have the highest poverty rates and lowest level of education. Inadequate education and income create barriers to learning about healthy lifestyles and accessing health care. Residents of Central Valley earned 31% less than residents in the state of California in 2010, on average. The median household income among Central Valley residents was similarly lower: Valley residents earned $48,353, compared to the state average of $61,400 (see Table 1).5,6 Among California residents who earned within the range of Central Valley ($27,000 to $49,999) in 2012, nearly 27% remained uninsured.
The percentage of adults (25 years and older) in Central Valley without high school diplomas was 29.3, which was 3 times higher than the state graduation rate of 19.7. Advocating for better education is one way to increase the chances of higher academic achievement, but it is only one piece, as residents in Earlimart (Tulare County) discovered. Students living in Earlimart were traveling to a different community to attend high school, so the community focused efforts on building a new high school. The greatest challenge they faced when planning to build a high school was lack of funding. Although a bond was passed to develop funds for the project, the money went to another high school.
Access to Active Living Opportunities
Earlimart, due to its low level of local government representation, is not seen as a priority community in Tulare County. Tulare County Parks and Recreation Department has not been supportive of establishing a park in Earlimart.
Fairmead is a small community in Madera County lacking infrastructure. There is only one park, Toddler Park,
INFLUENCE OF SOCIAL DETERMINANTS

9
California’s Central Valley – HKHC Leading Site
with a play structure, but not enough green space or room for the more than 300 children who live there. Other parks exist in Madera County, however transients often spend their days drinking, which further deters children from playing outdoors.
Pollution
Conventional farming practices create environmental hardships for residents living in Central Valley. Irrigation and harsh chemical treatments used on crops have produced pollutants that have led to both poor water and air quality for those who live there. A 2010 American Lung Association study ranked seven Central Valley cities in the top 15 out of 25 most polluted by short-term particles. Merced was ranked number 11.6 The production of cotton within the region has worsened these emissions, creating adverse effects like “dust devils,” miniature tornadoes carrying dust and debris throughout the region. Unfortunately, farming practices are slow to change, due to the powerful influence of agri-business. This has created a sense of hopelessness among organizations like CCROPP who wants to effect change. Furthermore, it is challenging to encourage residents to advocate for safer practices when the population largely consists of undocumented residents who are fearful of deportation.
Crime/Violence
Gangs and gang violence are a major concern in Earlimart (Tulare County). At one point, there were 18 different gangs represented in a town of around 7,000.
Challenges in Madera are similar: illicit drug activity, gangs, and crime are prevalent and make it difficult for residents to access outdoor physical activities. In an effort to address crime and the complex issues associated with it, the Madera County Police Department holds Town Hall-style meetings two to three times a year on safety concerns. There are also neighborhood watch programs in the community.
INFLUENCE OF SOCIAL DETERMINANTS

10
California’s Central Valley – HKHC Leading Site
CENTRAL VALLEY HKHC PARTNERSHIP
Lead Agency and Leadership Teams
The Central California Regional Obesity Prevention Program (CCROPP) was developed in 2006 through the collaboration of six public health departments within the Central California region, with a vision of addressing obesity prevention from a policy and environmental change perspective. CCROPP focused on two major initiatives: increasing access to healthy food and beverages and improving opportunities for physical activity. Initiatives are carried out by partnerships between public health departments, community-based organizations, and grassroots community members in eight counties: Fresno, Kern, Kings, Madera, Merced, San Joaquin, Stanislaus, and Tulare counties. The program was developed by the Central California Public Health Partnership and housed under the Public Health Institute.
3 Since many of CCROPP’s partners were unfamiliar
with the policy arena before the partnership, they had to learn how to overcome challenges associated with community engagement, in relation to obesity and diabetes prevention. The partnership’s initial workplan implemented a region-wide effort to make policy and environmental changes that promoted healthy eating and active living behaviors.
See Appendix C for a list of all partners.
Organization and Collaboration
Staff assigned to the Central Valley HKHC partnership consisted of a Project Director, a Project Coordinator (PC), and Community Leads, who worked together to organize and facilitate program activities related to HKHC. Funding from HKHC provided full compensation for the Project Coordinator’s salary and a portion of the Project Director’s salary. The community leads were paid through funding provided by The California Endowment, which has been CCROPP’s primary source of funding since inception.
The PC began as a community lead before transitioning into the role. That experience helped to understand the needs of the community and leverage connections and relationships with community organizations and members. The Project Coordinator was primarily responsible for recruiting participants from within the eight counties to begin leadership development training sessions. The PC disseminated the leadership development curriculum to active sites throughout the region and explored different options for sustainability of the program.
Community Leads (residents from the eight counties), represented community-based organizations in tandem with Public Health Leads (full-time health department staff members from each county). This combination led to a strong partnership in terms of community development. The Leads from all eight counties convened monthly to provide updates and collaborate on strategy work.
During HKHC, there was crossover with personnel who worked on obesity prevention (e.g., Communities for a New California) and other professionals (e.g., legal services, development).
Project staff had the opportunity to work on other grants while working on HKHC, when allowed CCROPP to expand its reach into other rural communities in Fresno County and areas of the valley that were not reached through HKHC.
Political Support
Prior to HKHC, there was a lack of grassroots community involvement in politics in Central Valley. The voices of low-income community members were not often heard at the table. Working with HKHC changed that dynamic. It allowed CCROPP to develop stronger relationships with key decision-makers. HKHC enabled the partnership to take constituents on office visits, creating a stronger relationship and awareness of CCROPP’s
PARTNERSHIP AND LEADERSHIP PROFILE
“health departments do have practical
challenges that limit the level of
engagement that they can have with
grassroots community members. They
can’t pay for childcare, give people
transportation, or provide meals at
meetings; the types of things that really add
value to the opportunity of bringing people
together and creating dialogue. So that’s
how CCROPP began.” -HKHC Staff

11
California’s Central Valley – HKHC Leading Site
mission among a greater number of decision-makers, in both the school arena as well as with locally- and county-elected officials. In the state legislature, there was more support from politicians who were considering health in their decision-making process. Due to the skills taught through the Leadership Training Program, graduates were more active in politics and won seats on School Boards and wellness committees.
A challenge for Earlimart was that it did not have a town council, due to being unincorporated in the county. This challenge, coupled with the lack of representation at Tulare County Board of Supervisor’s meetings, often led to the town being forgotten and left out of decision-making processes.
Partnership Successes
Outside of HKHC efforts, CCROPP worked on statewide policy efforts to decrease the consumption of sugar-sweetened beverages within schools, childcare settings, and other community spaces. This policy stated that there would be no high sugary beverages at any meetings, and no access to vending machines with high sugary beverages, the only beverages allowed were low-fat milk, water, and 100% juice.
Partnership Challenges
A decrease in funding from the largest matched-funds contributor, The California Endowment, led to a loss of Community Leads. At one time, only five of the eight counties had leadership representation.
Although there was a cohort of graduates from Kettlemen City, Kings County, there was no engagement for well over a year because no organizations were able to take over the role of the Community Lead. Therefore, no Community Leads were recruited for Cohort II of the Leadership Development Program.
There was also a deficit of non-profit organizations operating in many of the counties in Central Valley, making it difficult to find a group to act in place of a Community Lead. In other cases, the only non-profit organizations were not health-related organizations and, therefore, had to step into an unfamiliar role.
PARTNERSHIP AND LEADERSHIP PROFILE
“It’s been a tremendous help—
having had those relationships
already established—and my
connections with the lead [has]
certainly made my work a lot
easier.” -HKHC Staff
12
California’s Central Valley – HKHC Leading Site
LEADERSHIP DEVELOPMENT PROGRAM
The Leadership Development program, Powerful People: Building Leadership for Healthy Communities, was created by CCROPP in 2009 to increase community engagement of residents within the region. The program provided opportunities for sustainability of CCROPP’s preventive efforts by developing a team of advocates within the community who would remain dedicated to the effort. During the first year of HKHC, CCROPP established a dynamic process for training curriculum development.
Accomplishments
One of the most important objectives was to successfully implement the Community Leadership and Advocacy Program with two cohorts of participants. A total of 76 Leaders from Cohort I completed the program and were eligible to graduate. The graduation took place on May 23, 2010. These graduates were predominately Spanish-speaking women from low-income rural communities and urban neighborhoods, many of who were new immigrants with no previous training in advocacy or leadership. By March 2012, all of the seven Central Valley counties in Cohort II implemented the 12 sessions of the Leadership Development Training. A total of 127 residents from two cohorts graduated from the program.
Between both cohorts, the Leadership program successfully built the capacity of leaders from the following communities: Stockton, Ceres, Modesto, Riverbank, Merced, Winton, Fairmead, Madera, Fresno, Kettlemen City, Pixley, Earlimart, and Bakersfield.
Complementary Programs & Promotions
The Project Coordinator worked with the Web Manager to design the recruitment flyer, a marketing piece for HKHC that included the annual calendar, mission, and map of all the communities involved in the HKHC project. All of the pieces were distributed among Community Leaders and stakeholders in May 2009.
Curriculum Development
The efforts during the first year of the project provided the foundation for the regional community Leadership Development Program. The HKHC Project Coordinator met with the eight CCROPP Community Leads in April 2009 to discuss their expectations and recommendations for the training curriculum, obtain commitments to recruit local leaders for the training program, and facilitate logistics for local trainings. It also afforded CCROPP the opportunity to explore models of creative capacity building strategies. These model strategies are the direct result of input from the “Emerging Leaders” and staff involved in the project.
The Project Coordinator, Project Director, and Evaluation Liaison, along with the CCROPP Community Leads regularly reviewed and revised curriculum activities to assure that they were developed in a manner that truly built the capacity of participants to advocate for policy and environmental changes around healthy eating and active living. In some instances, updating curriculum modules was about simplifying languages, there was an activity to “identify assets and liabilities in the community” which was changed to ”what advantages and disadvantages shape your community environment?” The latter was easier to understand and translate into Spanish. Ultimately, changes to the curriculum that made it more accessible to participants helped them to apply it to organizing within their own neighborhoods, mostly by informing participants that the concepts were from people’s experiences.
All curriculum modules were drafted and implemented by the HKHC Project Coordinator and based in literature research and best practices. The influence of the CCROPP Community Leads and the HKHC Community Leaders (i.e., participants) in the development of the activities was key to adapting them to local needs, projects, literacy levels, and logistical challenges. Monthly meetings with CCROPP Community Leads were instituted to review curriculum modules and provide input on the improvement of the modules.
Observational assessments prior to the beginning of each training were built into the curriculum to evaluate participants’ comprehension. A recommendation for the next cohort was to increase the frequency of the classes to every two weeks instead of four, as it was for the first cohort. Written assessments were not recommended for the first cohort, rather, oral and casual evaluations, which were successful in confirming that concepts were adequately gasped.
Implementation
LEADERSHIP DEVELOPMENT PROGRAM

13
California’s Central Valley – HKHC Leading Site
HKHC funding gave CCROPP the opportunity to develop a curriculum for its Leadership development program. The curriculum was published in both English and Spanish versions. CCROPP owned the copyright for the curriculum, however, the curriculum royalties were owned by RWJF.
Beginning in December 2010 with the support of the Project Coordinator, CCROPP Community Leads recruited participants for Cohort II of the Leadership Development program in seven sites, totaling 76 participants region-wide:
San Joaquin County community members were recruited from Southeast Stockton.
Stanislaus County community members were recruited from Ceres, Modesto, and Riverbank.
Merced County community members were recruited from Southeast Merced.
Madera County community members were recruited from the Fairmead Community and Friends (FCF) committee.
Fresno County community members were recruited from Southwest Fresno and parents were recruited from John Burroughs Elementary School.
Tulare County community members were recruited from Earlimart and from members of their park committee.
Kern County community members were recruited among members of the Greenfield Walking Group.
Participating residents were expected to continue advocacy efforts by passing what they learned onto the next cohort. Community members who participated in the Leadership development program and attended all of the training classes received a $100 gift card stipend at graduation.
Monitoring
A method for tracking trainings and attendance was developed. The Administrative Support Coordinator and Research/Training Assistant worked diligently to keep training statistics (e.g., attendance, records, homework, contact information, reminders) and activities updated and accurate. Attendance statistics were submitted to the Community Leads to minimize attrition rates and measure participation. This assessment was very successful in the Counties where the Community Leads were highly involved in the monthly trainings. The Project Coordinator compiled attendance statistics and created a list of candidates for graduation.
Evaluation
CCROPP developed a multi-level evaluation method that assessed: 1) the effectiveness of each curriculum session, 2) the personal transformation of participants to leaders, and 3) the achievement of community transformations to healthy communities.
Session evaluations allowed participants to continuously reflect on the value of the sessions, as well as offer comments and suggestions for enhancing the program. Participants completed a one-page form with a set of questions designed to measure course objectives at the end of each session. A rating system was used to facilitate and tabulate participants’ responses. There were also two open-ended questions that allowed participants an opportunity to indicate what the most important aspect of each session was and provide other suggestions for enhancing the session.
CCROPP also designed an appreciative inquiry (pre- and post- interview) that focused on the personal transformation of participants. The pre-interview tool assessed how participants perceived themselves in terms of leadership in their community; the post-interview tool assessed whether there was a change in self-perception as a leader. The tool was designed to be conducted in audio or video format. Cohort I participated in only the post interviews, whereas Cohort II participated in the full appreciative inquiry, completing both pre- and post-interviews.
Curriculum Dissemination
There were several layers of review for the curriculum. One level was the review committee, and the second level was with the Communications Specialist and Project Director, along with the Program Officer. Each
LEADERSHIP DEVELOPMENT PROGRAM

14
California’s Central Valley – HKHC Leading Site
review found new changes and edits, as well as a generation of more ideas for inclusion. Electronic versions of the curriculum were made available to sites with working agreements and contracts.
Population Impact
Four members of the Fresno County Leaders group were elected by the Fresno Mayor to the City Neighborhoods Redevelopment Advisory Committee. Their posts enabled Leaders to advocate for building healthy neighborhoods where healthy eating and active living has promoted. From August 2010 until April 2011, two Leadership Program graduates served on the City of Fresno Downtown Neighborhood Advisory Committee where they had the opportunity to provide the city with direction for future developments in Southeast Fresno.
A Leadership Program graduate from Stockton joined the resident council within the U.S. Department of Housing and Urban Development (HUD) housing complex where she resided. This graduate advocated for more healthy eating and active living opportunities for residents. She was also involved in the Mothers Taking Action Program, where mothers and grandmothers discussed in small groups how to improve their children’s nutrition and increase their physical activity opportunities.
Another Leadership Program graduate became a board member for the San Joaquin County HeadStart Program. She used her position to advocate for increasing healthy eating and active living opportunities at HeadStart sites.
A Leadership Program graduate from Cohort I became a Program Evaluator for United Way. She joined a review committee that evaluated and determined which community programs would receive United Way funding.
The HKHC Leadership Advocacy training has had a long lasting positive impact on graduates. In at least three counties—Kern, Stanislaus, and Fresno—graduates sought and received full-time employment. In Kern, one of the graduates began working as a promotora with Vision y Compromiso. In Stanislaus, one of the graduates from Cohort II began working closely with the CCROPP Lead on several projects as a full-time employee. And, in Fresno, one of the graduates from Cohort I went on to pursue self-employment.
Lessons Learned
The Leadership Development program has given many of the graduates confidence, skills, and support to take on leadership positions they would not have taken on otherwise. Graduates from Cohort I became members of their school district wellness committee; joined various city- and county-wide advisory boards; became involved in program development and fundraising activities around obesity prevention in their community; and provided technical assistance to other communities locally, regionally, and nationally. One of the graduates was so motivated by her experience in the program that she decided to continue her education, which she did not have a chance to do earlier in life.
The primary lesson learned was that community members are the experts of their context. They are the primary source to identify the challenges that impact their ability to lead healthier lifestyles. They also have the most viable solutions to their challenges.
Effective promotion, such as, conveying the need for policy and environmental change by identifying with different audiences, helped increase interest among key decision makers and the community.
Challenges
Staffing fluctuations affected the project implementation. The loss of the original HKHC Project Coordinator during year two of the project was a setback to curriculum development activities as well as delaying the implementation of the Leadership Development program’s second cohort. Logistical tasks, originally the responsibility of one position, spanned across two positions due to the loss of the Administrative Assistant in year three.
A decrease in funding to Regional CCROPP Leads impacted the program at several points. The Community Building Specialist was the only staff person providing the trainings, which made spreading out sessions a
LEADERSHIP DEVELOPMENT PROGRAM
“What CCROPP has done with this
program is given us the knowledge we
need to take this work into our own
hands and make our neighborhood
healthier even when they’re gone.” -
CCROPP Community Leader

15
California’s Central Valley – HKHC Leading Site
necessity. Consequently, sessions were delivered once per month in each county, and the month-long lag between each session made it difficult for the group to connect the session topics together. Providing support and technical assistance to the first cohort while the second cohort was undergoing the training was also challenging, since the Community Building Specialist was implementing lessons instead of developing curriculum.
The challenge of engaging a community primarily consisting of undocumented residents pervaded throughout the initiative. Having a largely undocumented population made it difficult for CCROPP to convince residents to advocate for their well-being.
With respect to the Community Leads, gaps have existed in this role between counties (e.g., Kings County).
Each county had different funding timelines, which impeded the stability of the project. Matched funding from The California Endowment went individually to each community-based organization in each community. There were different start dates, and as such, some communities ran out of money, whereas others were able to implement the program more consistently and for a long period of time.
Logistics to transport Leaders to the more remote sites was a significant challenge due to the extensive geographical area that HKHC served.
Sustainability
CCROPP plans to seek funding and resources to continue leadership development, be more active in marketing the curriculum, and educate elected officials about policy and environment changes. To this effect, CCROPP hopes to evaluate the intermediate effects of their work (e.g., increased physical activity, increased consumption of healthy foods) in order to show decision makers its effectiveness.
There is an opportunity to provide training and technical assistance to groups who are interested in implementing the Leadership Training program in their areas; specifically, four rural communities in Fresno County.
CCROPP desires to continue adding value to obesity prevention in the Valley with other organizations working on similar issues and to branch out into efforts not previously explored, such as Complete Streets.
LEADERSHIP DEVELOPMENT PROGRAM
“the beauty of this leadership training…is that even though it is coming from a frame of obesity
prevention in terms of trying to really support efforts that promote access to healthy food and
promote more opportunities for physical activity, these are skills that community residents can
take and apply to a number of issues in their community; social issues or environmental justice
issues. So in that way, we’re building this idea of leadership and civic engagement within the
eight county region that could have implications for a lot of other things.” -HKHC Staff

16
California’s Central Valley – HKHC Leading Site
PARTNERSHIP FUNDING
The California Endowment (TCE) provided matched funds for CCROPP throughout the first three years of the initiative. CCROPP’s first year of funding focused on developing relationships with community organizations by making connections with existing public health coalitions and organizations within the region.
STRATEGY FUNDING
Funding for the environmental changes in parks, corner stores, and community gardens came from a variety of different sources:
Sci-Arc (South California Institute of Architecture) used state funding for a corner store conversion.
CCROPP partnered with First 5 California (a government-based organization dedicated to improving the lives of youth ages 0 to 5) to receive funds in support of a policy dedicated to decreasing the consumption of sugar sweetened beverages. The policy was passed and implemented by San Joaquin County.
Catholic Health Care West awarded a $25,000 dollar grant to support active living initiatives in Merced.
In Merced, Flanigan Park received a $200,000 grant for renovation and the city added $400,00 for a basketball court and walkways.
The Greenfield Walking group received a $500 grant from TCE to purchase an iPod and amplifier, which were needed to conduct physical activity programs at the park.
A mini-grant with the Fresno Council of Governments was used to develop a training for teaching leaders how to participate in and conduct community advocacy around an impending regional transportation plan.
United Way of Merced applied for a $25,000 grant and received funding to engage residents in physical activity.
Chowchilla School District, on behalf of Fairmead Community and Friends, received $69,000 from Chukchansi Casino to build a fence, per a joint use agreement requirement.
The HKHC partnership received a technical assistance award for $20,000 from the California Convergence, which provided them with resources to help other areas of California to regionalize.
The James Irvine Foundation awarded a grant that built local civic engagement.
In 2010, 14 San Joaquin Valley cities made a formal contract for sustainable growth, called Smart Valley Places.11 A U.S. Department of Housing and Urban Development (HUD) - U. S. Department of Transportation (DOT) - U.S. Department of Environmental Protection Agency (EPA) grant (Smart Valley Places) provided funding to conduct community leadership in the communities, specifically to build capacity to become involved in land use and built environment issues. CCROPP was funded to provide outreach and help leaders become active participants in the city planning process. This corresponded well with the regional work CCROPP was already doing as an objective for its TCE grant (e.g., conducting workshops for public health department staff). Three community workshops were funded by TCE as a kick-off for the Smart Valley Places work.
Funding Challenges
It was difficult to persuade certain funders to follow through with initiatives, since they wanted to see immediate results. CCROPP struggled with identifying indicators which measured the impact of the Leadership Development program in a way that convinced funders to follow through.
Funders did not seem to appreciate the cost of community engagement, and often cut their funding, which in some cases resulted in disrupting organizational structure and leadership capacity.
The HKHC partnership struggled to convey that HKHC work takes time: time to engage with communities, time to build relationships with decision makers, and time to build capacity with those most likely to make changes.
The philosophical alignment of the funder did not always correspond to the initiative.
PARTNERSHIP FUNDING

17
California’s Central Valley – HKHC Leading Site
The core funder for CCROPP was The California Endowment; however, funding levels decreased over time, which affected CCROPP’s ability to continue community engagement and have a lead in each of the counties. At one time, CCROPP only had community leads in five of the eight counties it served.
Because CCROPP was initiated and largely funded by TCE, other funders identified CCROPP only as a California Endowment project and were sometimes hesitant to provide additional funding.
See Appendix D for sources and amounts of funding leveraged.
PARTNERSHIP FUNDING

18
California’s Central Valley – HKHC Leading Site
COMMUNITY ASSESSMENT
Cohort II of the Leadership Development program was instrumental in implementing nearly 200 neighborhood surveys, of which they reported findings back to the community. The Leaders helped design the survey, which asked residents of Southeast Stockton to share their experiences accessing healthy food in their neighborhoods. The survey also asked where they currently shopped for groceries, how much they spent every week, and whether or not they saw a need for healthier food options closer to their homes.
Parks and Play Spaces
Community Surveys
Burroughs Community Leaders worked with the Fresno CCROPP Lead to develop a survey that forum participants completed to determine which amenities should be installed in Ray Riley park. Responses indicated that amenities such as soccer posts, basketball courts, and toddler parks would be much better utilized than what was in the current proposal (i.e., dog park).
HKHC Leaders and residents joined County Parks and Recreation staff and provided feedback on what they would like to see improve in and around parks in their community. Nearly 150 people provided valuable feedback via a community outreach survey for a park infrastructure grant.
The CCROPP Community Leader in Tulare County organized a survey of Pixley residents to identify which improvements the residents wanted most at Pixley Park. Residents were invited to a Picnic in the Park event at which people voted on specific improvements they wanted the county to make. Among the many opportunities for park improvements, residents requested that goal posts be installed on the large open space to create a soccer field.
Direct Observation—Enhanced Evaluation
In order to better understand the impact of their work in parks and play spaces, representatives of CCROPP participated in completing direct observation to assess individuals’ behaviors in their natural setting. Data were collected between April and June 2013 at the following eight parks: Lions Town and County Park, Madera County Courthouse Park, Madera Sunrise Rotary Park, McNally Park, Pan America Park, Romaine Park, Rotary Park, and Smyrna Park. Observations were collected between 9:00 AM and 7:30 PM. See Key Takeaways Direct Observation (Parks and Play Spaces) for a summary of the results.
Environmental Audit—Enhanced Evaluation
In order to better understand the impact of their work in parks and play spaces, representatives of CCROPP participated in completing an environmental audit to assess the presence or absence of different features, as well as the quality or condition of the physical environment. The audit tools were completed for seven parks in Fresno County and Madera County. The tools captured the setting, accessibility, vending machines, signage, barriers to entry, playground features (swings, slides, monkey bars, sandboxes, ground games), sports and recreation features (fields, courts, pools, tracks, trails), aesthetic features and amenities, trash, and vandalism. The following parks were included in the assessment: Romain Park (Fresno County), Lions Town and Country
COMMUNITY ASSESSMENT
Key Takeaways
Direct Observation (Parks and Play Spaces)
For most parks, very active behavior was observed among children, adolescents, and adults.
Playground games were the most common activity type observed among children.
Adults were sedentary, moderately active, and very active. They participated in a wide variety of activities from supervising to playing basketball.
Adolescents were mostly moderately and very active.
Key Takeaways
Environmental Audit (Parks and Play Spaces)
Five of the seven parks (71%) were multi-featured and publically-accessible.
Almost all of the parks had a parking area on-site and on-street parking next to a play space.
None of the parks had broken glass and only one had graffiti and tagging.
Six of the parks had signage indicating the park or play space name.
Only one park charged an entrance fee.
Two parks showed signs of alcohol or other drug use and one park had a some sex paraphernalia present.

19
California’s Central Valley – HKHC Leading Site
Park, Rotary Park, Madera County Courthouse Park, Madera Sunrise Rotary Park, Pan-Am Park, and McNally Park (Madera County). See Key Takeaways Environmental Audit (Parks and Play Spaces) for a summary of the results.
Corner Stores and School Farm Stands
Environmental Audit—Enhanced Evaluation
In order to better understand the impact of their work in corner stores, representatives of CCROPP participated in completing an environmental audit to assess the presence or absence of different features, as well as the quality or condition of the physical environment. Six stores were audited in two counties of Central Valley. Three auditors assessed the following stores in Fresno County: Easton Market, Lee's Market, Main General Store, Latino Market, and La Tiendita between May and June 2013. Three auditors assessed La Placita Michoacana in Stanislaus County in May 2013. See Key Takeaways Environmental Audit (Corner Stores and School Farm Stands) for a summary of the results.
Community Surveys
Leaders assisted with the implementation of a community survey in Spanish in rural Fresno County in December 2012. The purpose of the survey was to assess the community’s support for a Healthy Corner Store Makeover/ Small Distribution Project in the communities of Fowler, Easton, Sanger, and Del Rey.
HKHC Leaders assisted with the design and implementation of a community survey for the full-scale grocery store in Stockton. The survey assessed whether or not the community would support the establishment of a new grocery store; specifically, how much people were willing to spend at the store weekly and monthly, and what specific items they would most likely buy.
HKHC Leaders from Cohort II with support from Cohort I were determined to tackle school breakfast participation and quality as one of their main projects. As a starting point, a breakfast survey consisting of seven questions was developed and completed by parents in 2012. In November 2012, the breakfast survey was piloted at the John Burroughs Elementary Fall Festival. CCROPP hosted a resource table with information and HKHC Community Leaders assisted with the implementation of the survey. Approximately, 100 parents completed the survey during one afternoon. At this event, the Principal of Burroughs indicated interest in having the survey sent home with all 850 children enrolled. Nearly 400 completed surveys were received. The information from the surveys informed the need for alternative breakfast models, such as universal school breakfast and changes to the menu, and incorporating more wholesome foods (e.g., fresh fruits and vegetables).
CX3
HKHC Community Leaders from Cohorts 1 and II conducted CX3, a tool that captured and communicated neighborhood-level data to promote healthier communities,8 by assessing the overall nutrition environment of the community. Specifically, Leaders assessed outdoor marketing, mobile vending around
COMMUNITY ASSESSMENT
Key Takeaways
Environmental Audit (Corner Stores and School Farm Stands)
About half of the stores lacked accessibility with three stores lacking an acces-sible entrance and two stores lacking wide aisles to accommodate strollers and wheelchairs.
All six corner stores accepted a form of WIC, SNAP, or EBT, and two stores (Lee’s Market and La Placita Michoacana) had WIC/SNAP signs near WIC/SNAP approved products.
Fresh fruits (3-8 types per store) were available at five of the six corner stores. Fresh vegetables (3-15 types per store) were available at all six stores. Latino Market was the only store without fresh fruits available.
La Tiendita had the highest number of fresh fruits listed on the audit tool (8). La Placita Michoacana had the highest number of fresh vegetables listed on the audit tool (15).
The only two stores that identified produce by name and clearly labeled both the price and unit were Lee’s Market and La Placita Michoacana.
Canned fruits and vegetables were available at all six corner stores, but frozen fruits and vegetables were not available in any store.
Two-percent and whole or vitamin D milk was available at all the corner stores; however, skim milk was not available at any store.
Four of the six stores sold both tobacco and alcohol products.

20
California’s Central Valley – HKHC Leading Site
schools, walkability, food stores, fast food outlets, farmers markets and other alternative food sources, food banks, and pantries. Findings were presented to the community. Intervention strategies that emerged included working on a healthy corner store project, with M&M store as a potential solution to increasing access to local produce. Given the city's bankruptcy state and its focus on other priorities, Stockton could not move forward with a full-scale supermarket. In the meantime, it moved strategically to establish relationships with the store owner at M&M Store where a successful healthy corner store convergence project was established. After one year of implementation, the store remained EBT- and WIC-authorized and sales were profitable.
Farmers’ Markets
Environmental Audit—Enhanced Evaluation
In order to better understand the impact of their work in farmers’ markets, representatives of CCROPP participated in completing an environmental audit to assess the presence or absence of different features, as well as the quality or condition of the physical environment. The tool captured overall market operations (e.g., months, days and hours of operation, accessibility, government nutrition assistance programs), vendor display areas (e.g., space, equipment), product signage and pricing (e.g., clear signs, unit and price labeled, discounts for larger sales), frozen and canned fruits and vegetables (e.g., quantity and variety of frozen or canned fruits and vegetables), other foods (e.g., availability of healthier options, foods with minimal nutritional value) and the availability, pricing, quality, and quantity of fresh fruits and vegetables. Fifteen markets were selected throughout Fresno, Madera, and Stanislaus counties in Central Valley for data collection. An Evaluation Officer from Transtria LLC trained community members and partnership staff on proper data collection methods. Data collection was completed between May 19, 2013 and June 8, 2013. See Key Takeaways Environmental Audit (Farmers’ Markets) for a summary of the results.
See Appendix E for the full Enhanced Evaluation Reports.
COMMUNITY ASSESSMENT
Key Takeaways
Environmental Audit (Farmers’ Markets)
Nine farmers’ markets were open year-round, five markets were open between five-ten months per year, and one market was open three months per year.
One market was open five days per week, seven markets were open one day per week, and seven markets were open between two and three days per week.
Seven markets opened as early as 5:30-7:00 AM, and two markets closed as late as 6:00 PM.
Ten farmers’ markets accepted WIC,SNAP, and EBT (CalFresh) benefits.
Other markets offered discounts for larger bulk sales, double dollar discounts, matched voucher discounts, wholesale discounts, and reduced prices for over-ripened produce.
Healthier food items, such as frozen vegetables; high-fiber, whole grain foods: lean meats, fish, poultry; nuts, seeds, beans, and low-fat, prepared meals were available at several markets.
Milk was available at two markets, one market offered a variety of milk options, while the other market only offered whole milk and flavored whole milk.
Foods with minimal nutritional value were available at fifteen markets, including salty foods, ice cream and frozen desserts, sweet foods, candy and chocolate, and regular to high-fat prepared meals.
A wide variety of fresh produce was available across all fifteen farmers’ markets, includ-ing 31 different types of fresh fruits and 64 different types of fresh vegetables.
All fresh produce was of ‘good’ quality, except peaches at one market.
21
California’s Central Valley – HKHC Leading Site
PLANNING AND ADVOCACY EFFORTS
Historically, the Central Valley region has struggled with creating changes that benefit residents because of its largely undocumented population. Without citizenship, residents perceived advocacy efforts as a threat to their ability to work within the region. Therefore, efforts dedicated to community engagement and empowerment were the primary focus within Central Valley even before CCROPP’s existence. Once CCROPP was established, the organization provided residents with the resources necessary to improve upon the region’s effort to increase community empowerment and engagement.
Community Outreach and Engagement
Derived from the introduction of Leaders from Kern and Tulare Counties, Pixley Leaders accepted an invitation from the Greenfield Walking Group Leaders to exchange expertise at a convening. The two groups requested the support of HKHC, and the Project Coordinator accepted. This was an excellent opportunity that encouraged networking and event organizing. The event was a great success in terms of inclusion and all the Leaders' families were invited. The Leaders' spouses were highly encouraged to be part of the next cohort and to support their partners in Leadership endeavors.
After several meetings and conversations with Burroughs Community Leaders in Southeast Fresno, City of Fresno Planning and Parks staff held a community forum to discuss the schematic design of Ray Riley Park. Burroughs Leaders, several of whom were graduates from the Leadership Development program, helped organize parents and community members to attend and share their perspective about what type of park Ray Riley needed to become in order to increase physical activity for local families.
Cub scouts were a key partner in park revitalization in Stockton. Additionally, high school youth involved with CCROPP and the City of Stockton assisted with supplies (i.e., materials to paint over graffiti, landscaping) and community members helped with clean-up. The youth spearheaded this initiative.
Throughout 2012, Fairmead Community and Friends (FCF) worked to receive donations from grocery stores in Madera to hold a Thanksgiving feast for those unable to provide a meal for their families. This event was well-received by the community. FCF held several other community events, which they used as opportunities to connect with the community and share in English and Spanish some of the community issues and how residents could help. Over 100 people of all ages participated in these events.
Advocacy
FCF organized and advocated for additional resources at the county level in Madera. Fairmead was an unincorporated community and lacked a governing body from which to petition help. The county officials were supportive and started to work with FCF on upgrading physical activity opportunities.
CCROPP joined the Health in All Policies Task Force, a collaborative project focused on improving population health by incorporating health considerations into decision-making across sectors and policy areas, with partners from the Public Health Institute, the California Department of Public Health, and the California Strategic Growth Council.9 CCROPP also participated in statewide advocacy groups such as the Latino Coalition for a Healthy California, whose goal is to improve the health of all Californians through legislative advocacy, community education, training and research10 and California Food Policy Advocates, a statewide policy and advocacy organization dedicated to improving the health and well-being of low-income Californians by increasing their access to nutritious, affordable foods.11
In Kern County, CCROPP advocated for funding to approach a local partner, The Center on Race, Poverty, and the Environment, to support the Greenfield Walking Group, since there was no longer a Community Lead.
In Madera County, Community Leads worked on securing joint use agreements. The parents of HeadStart students were key advocates in unlocking the gates at Burroughs Elementary School. Their advocacy plan included presenting to the School Board, driving a signature campaign, and meeting with the local Sheriff to gain support.
One of the Fresno Community Leads was confirmed to represent the Southeast Fresno HKHC leaders on a statewide group called California Convergence. This was an opportunity for the Central Valley resident
PLANNING AND ADVOCACY EFFORTS

22
California’s Central Valley – HKHC Leading Site
representative to meet and share lessons learned and success stories with other residents across California.
Media Advocacy
Valley Public Television created a “Corporate Video” filmed in the HKHC communities that highlighted CCROPP and its successes and marketed the need for viewers to work at the policy and environmental level.
The graduation ceremony that culminated the Leadership Development program of Cohort I was held on May 23, 2010. A weekend day was selected to make this a family event and many TV and printed media outlets attended the ceremony to showcase the accomplishments of the HKHC Leaders.
One of the Leadership Development program graduates was interviewed by Valley PBS on healthy eating and active living opportunities in Southeast Fresno.
Youth in Stockton developed a public service announcement (PSA) around the loose dog issue in their community. The PSA was developed with a mini-grant from the city and was not receiving much air time until one of the City Councilman was bitten by a dog while jogging.
Valley Public Television (VPT) produced three videos for CCROPP that received airtime on VPT and on the CCROPP website for broadcast.
In celebration of a year-long effort, on March 16, 2013, a media event was planned in Stockton to highlight the success of the M&M corner store, recognizing the store owner's great leadership and attracting other store owners to follow suit.
PLANNING AND ADVOCACY EFFORTS

23
California’s Central Valley – HKHC Leading Site
PARKS AND PLAY SPACES
PARKS AND PLAY SPACES
Unincorporated communities present a host of challenges when it comes to accessing healthy eating and active living opportunities. When the county is the primary governing body for these communities, resources are scarce and often shared among multiple communities. Park access is an example of an amenity that often suffers.
Policy, Practice, and Environmental Changes
The San Joaquin County Community Lead helped develop a community center, similar to a recreation center, and involved neighbors in the decision-making process.
Community Leads were able to plant two trees in Stiern Park, Bakersfield, as well as building a toddler playground, installing public lighting throughout the park, paving the periphery of the park as a walking trail, painting over graffiti, and cleaning up the park on a regular basis. The park has been transformed into a place where many local families walk, run, dance, play sports, and enjoy recreation with their families. The Greenfield Walking Group mothers were successful in requesting new swings be added at the park where many of their children enjoyed daily visits. Mothers have worked closely with city officials, including the police department, to help patrol the area where kids are crossing to and from Stiern Park and a neighboring school. As a result, there was one officer stationed at the Family Resource Center, across from Stiern Park, who helped monitor speed and other traffic violations.
The Greenfield Walking Group worked closely with the community of Rexland, including city officials, to increase safety at Rexland Park. They were successful in replacing lights. The group was also successful in Kern Park; where they installed flood lights for soccer games at night and helped pave sidewalks in half of an unpaved area. Soccer fields, a new playground, volleyball nets, and basketball courts were also installed. As a result of adding these amenities, more people visited the park.
After nearly 12 months of negotiations, the Tulare County’s Department of Parks and Recreation approved and installed the goal posts at Pixley Park.
A new park, Ray Riley, was developed in Southeast Fresno. The location, although plagued by noise and air pollution, was approximately 1½ miles from the neighborhood school.
Complementary Programs and Promotions
CCROPP partners in Madera County developed the “Vern McCullough River Trail Map and Park Resource Guide” to promote the park and trail system The guide includes park addresses, amenities, and a map of the river trail. The Madera County Police department worked with residents and the Parks and Recreation Department to develop a neighborhood watch program.
The Greenfield Walking Group met daily at Stiern Park and held morning aerobic and Zumba classes with other community residents. The group partnered with AmeriCorps youth to ensure that Stiern Park was clean, free from trash, and free from attraction to negative activity.
Source: CCROPP
Source: CCROPP

24
California’s Central Valley – HKHC Leading Site
Implementation
In Bakersfield, the Greenfield Walking Group members, many of whom were graduates or participants in the Leadership Development program, transformed Stiern Park in a way that facilitated physical activity for the entire community. The group developed a very productive working relationship with the Parks and Recreation Department, the City Mayor, and the County Public Health Department, and other key local government officials, in order to make much needed changes to the local park.
The Kern County Leaders of the Greenfield Walking Group held neighborhood meetings. At the first meeting, they had 36 people in attendance and among the attendees was the Parks and Recreation Manager. As a result, lighting requests were fulfilled by the Department at Stiern Park.
To complete the development of Ray Riley Park, Community Leads worked diligently with their City Council member and other city staff from the Parks and Recreation Department to ensure that the park reflected the amenities and appearance they envisioned. They also conducted a community assessment to determine desired amenities. Upon the City’s recent request, a committee of parents was formed to select the colors of the playground and the appropriate structures.
Population Reach and Impact
Youth, ranging from Kindergarten through high school, approached the city of Stockton and formally adopted the park. They worked weekly on improvements and maintenance.
The Greenfield Walking Group continued using Stiern Park for physical activity after improvements began. Within two years, individuals experienced weight loss, reported stress loss, and increased self-esteem. The group has impacted other communities by joining forces with advocacy organizations such as the Central Valley Air Quality Coalition to promote policy changes on a regional, state, and national level.
Challenges
Unincorporated areas are county-governed, which presents challenges for promoting change for communities like Pixley. Continuous ground-up advocacy efforts seemed to be the only strategy the residents could use to effect change in these areas. However, finding residents to engage in advocacy efforts was difficult, since most of the population consisted of undocumented residents. Residents have to take initiative if they want changes to be made within the park. If advocacy is not present, persistent, and effective, then the park is neglected by the county.
See Figure 3: Parks and Play Spaces Infographic for more information.
PARKS AND PLAY SPACES
“There [were] five and six year olds who really took ownership of the park and, of course, their parents too.
Years ago no one went to [the park] in the summertime. On a good afternoon there could be several
hundred people in the park; people are playing soccer. Teens are playing basketball, there are guys at the
hand-ball court, mothers are walking around the perimeter of the park, and there’s kids at the playground.
There’s just people everywhere; cars are doubled parked. Years ago that just would not [have] happened.” -
Community Member

25
California’s Central Valley – HKHC Leading Site
PARKS AND PLAY SPACES
Figure 3: Parks and Play Spaces Infographic

26
California’s Central Valley – HKHC Leading Site
JOINT USE
Policy, Practice, and Environmental Change
Fairmead Community and Friends (FCF) in Fresno had success in securing a joint use agreement between John Burroughs Elementary and parents. Burroughs became the first school among 103 schools in the Fresno Unified School District to unlock its school gates to the community after school hours and on weekends. This agreement facilitated both organized as well as informal physical activity for parents, children, youth, and the rest of the community.
In Stockton, a city-owned, multi-use gymnasium was opened to the public, due in large part to the development of a joint use agreement with the Community Partnership for Families of San Joaquin.
Merced recently launched its joint use efforts in August 2012 at Farmdale Elementary, with a partnership between Weaver School District, Dignity Health Foundation, United Way of Merced, and Make it Happen Wellness Center.
In December 2011, after three years of advocating for the Chowchilla School District to sign a joint use agreement, Community Leads from Cohorts I and II and partners from Chukchansi Casino, Fairmead Family and Friends, Chowchilla School District, and Madera County succeeded in signing the agreement. As a requirement to separate the classrooms from the open green space, a fence was installed.
CCROPP facilitated a joint use agreement between the community and Pixley Elementary School in Tulare County. The school Principal said that opening the school grounds after hours and on weekends helped reduce vandalism in the park.
In June 2011, Tulare County entered into a joint use agreement with the Earlimart School District. The agreement stated that, upon receiving grant funds for construction of the neighborhood park, shared use of the grounds would be in effect for the next 30 years.12 The agreement allowed community members to use the athletic facilities after school hours. The athletic facilities (e.g., track, basketball court) were left unlocked and the lights remained on after school hours and in the summer.
Complementary Programs and Promotions
Effective September 22, 2012, parents began Zumba classes every Saturday morning out in the open green space at Stiern Park.
Stockton Community Leads have taken significant strides in advocating for increased joint use of existing community assets, such as a gymnasium. There were numerous ongoing activities that attracted people of all ages and racial/ethnic groups such as indoor soccer, indoor basketball, line dancing, and Filipino martial arts.
More than 100 people attended the Safe Places to Play Summit. Community Leads from counties working on joint use and parks and recreation efforts served as panelists.
Fresno residents have conducted aerobics classes in Burroughs gym and children have used the outdoor facilities after school.
Every Monday and Wednesday evening, Merced residents received one hour of yoga and, on Tuesdays and Thursdays, an hour of Zumba. Daily, nearly 400 residents of all ages have turned out to participate in these free community activities.
Community Leads in Bakersfield (Kern County) were able to develop no-cost physical activities such as solo line dancing, Zumba, Filipino dance, youth indoor soccer, and youth basketball. A group of adult community residents also played soccer every evening and one of the Community Leads’ spouse volunteered as the coach. Additionally, a group of youth have adopted their neighborhood park and have painted over graffiti.
Implementation
Board members from Chowchilla School District in Madera County held a facilities-use workshop with
JOINT USE
Source: Community Commons
27
California’s Central Valley – HKHC Leading Site
Fairmead Community Leads, School Board members, Fairmead Elementary School and High School Principals, and County Planners. The Superintendent itemized requirements that would permit the School District to enter into a joint use agreement with community members to use the elementary school on evenings and weekends. Requirements were to:
build a facilities-use fence around the school buildings to separate them from the playground;
institute a security plan; and
devise a plan for insurance liability to limit the school district’s responsibilities.
The CCROPP Community Lead in Tulare County facilitated a series of meetings at Pixley Elementary School with the Principal and School Board members and a risk management expert who specialized in liability issues. Through the process, they learned that the school, district, and region were sufficiently covered by an existing insurance policy for joint use agreements. The administrators had originally thought that keeping their gates locked was protective, but in reality they were fully protected. As a result, the joint use agreement at Pixley Elementary School in Earlimart was easily secured.
Challenges
Working with the City of Stockton to establish joint use agreements was a process that took time. Community Leads were advised to be upfront with community members about this. The City had never secured joint use agreements with community-based organizations before. All of the previous agreements were secured with the School District. With the lengthy process broken into attainable objectives, community members were motivated to stay involved in the initiative. Their participation was key in securing joint use agreements.
Sustainability
The CCROPP Lead in Merced advocated for replicating their joint use agreement model in other low-income areas of Merced and began by holding conversations with Golden Valley High School. A partnership with University of California, Merced transpired and they committed to do a participant study with a group from the physical activity classes to assess biometrics (i.e., cholesterol, blood pressure, diabetes).
JOINT USE

28
California’s Central Valley – HKHC Leading Site
COMMUNITY GARDENS and SCHOOL FARM STANDS
CCROPP completed a community food assessment in Madera County in 2005, which uncovered that many low-income communities did not have access to healthy food items and transportation was a problem. No farmers’ markets were present and groceries were limited to one supermarket. In turn, the assessment inspired the school farm stands initiative to increase access to healthy foods in low-income communities. Although not implemented region-wide, community gardens supported the lead agency’s goal of increasing consumption of produce at the local level (i.e. avoiding the use of “big box stores”).
Policy, Practice, and Environmental Changes
In Pixley, Community Leads from Cohort I worked with the local elementary school to establish a community garden, providing fresh fruits and vegetables for the community throughout the year. In addition, a weekly farm stand was established at Pixley Elementary School.
One of the requirements from the City of Bakersfield included a fence around the perimeter of the community garden site, which cost approximately $5,000. Due to the Greenfield Walking Group's diligence and strong relationships with elected officials, they were able to secure funding from the Board of Supervisors.
Farm stands in Ceres expanded into two new sites in 2012, Adkison (in Modesto) and Sinclear Elementary. The success of the school farm stands was attributed to several things: the schools’ great promotion; encouraging staff; increased awareness by the school and local community to purchase healthy drinks and fresh fruit and vegetables; innovative marketing strategies by the farmer; good selection of fruits and vegetables, smoothies, milkshakes, and prepared fruit; and parents’ heavy involvement in promoting these events in the community.
A school farm stand was established at John Burroughs Elementary. Farmer Rubertina Pacheco began accepting EBT as a method of payment, which allowed more parents the opportunity to purchase fruits and vegetables.
Complementary Programs and Promotions
On July 31, 2012, a “Re-think Your Drink” community kick-off campaign event was held with strong community resident participation from San Joaquin County.
The Greenfield Walking Group worked diligently on the community garden at Jonah and Langston streets in Bakersfield, near Stiern Park. They established a committee, delegated roles and responsibilities for the garden, and canvassed the neighborhood to recruit volunteers. During the first week of October 2012, the Greenfield Walking Group partnered with AmeriCorps youth to clean the garden site free from trash and other incivilities.
CCROPP staff informed the latest publication on school farm stands developed and published by Change Lab Solutions. The publication entitled, Spinach to Schoolyards, provides invaluable information on the basic legal requirements for starting a school farm stand in California.
Implementation
CCROPP gave the Weaver School District (Merced County) a mini grant to break ground on a school garden. A science teacher spearheaded the initiative. The middle school is in the process of writing a small proposal for a greenhouse farm.
At Pixley Elementary School, affordable fruits and vegetables were available to families for purchase at the weekly school fruit and vegetable stand. The pilot project proved to be beneficial to the students, the community, and the school. Students were involved in bagging and parents were involved in selling the produce. Both groups learned multiple skills relevant to future employment. Funds were earned for after-school activities and the relationship between community and school was enhanced. As a result, children, their families, and community members consumed more fresh fruits and vegetables.
In the Summer 2012, FCF held a farm stand in front of John Burroughs Elementary School. This one-time
COMMUNITY GARDENS & SCHOOL FARM STANDS
Source: HKHC Dashboard
29
California’s Central Valley – HKHC Leading Site
event came months after working with the district’s Superintendent, Principal, and partners. The produce sold was all local. Residents in the neighborhood donated a variety of produce such as peppers, strawberries, watermelon, tomatoes, and squash that were grown in their backyards. Additional produce was purchased from Madera Produce Company at a discounted price.
Two Community Leads, one from Cohort I, and the other from Cohort II represented parents from Southeast Fresno in Fresno Unified School District’s (FUSD) School Meals Committee. At the monthly meeting, parents have the opportunity to voice their concern and offer solutions about improving school meals.
Challenges
Although the farm stand was held only once at Burroughs, Fairmead Family and Friends were determined to hold the stand consistently in 2013 with strong support from the community.
COMMUNITY GARDENS & SCHOOL FARM STANDS

30
California’s Central Valley – HKHC Leading Site
FARMERS’ MARKETS
In some areas of the Valley, high prices of local products sold by farmers within the region has inhibited residents living in low-income areas from purchasing local goods. Farmers that sold locally-grown produce often positioned themselves at higher-income markets in order to generate profits, thus disregarding the smaller, low-income communities.
Policy, Practice, and Environmental Changes
A policy definition for a farmers’ market in the municipal code in the city of Fresno was passed.
Electronic Benefit Transfer (EBT) was accepted at the Merced flea and farmers’ market and Atwater flea market in 2008. Users could put up to $50 on each EBT token. Shopping for produce at flea markets is part of Hispanic cultural tradition.
Kern County farmers’ market was re-established in 2008 and accepted of Women, Infants and Children (WIC) vouchers.
Complementary Programs and Promotions
In 2011, The Community Alliance with Family Farmers (CAFF) and CCROPP developed the first edition of Buy Fresh, Buy Local: The Eater’s Guide to Local Food. This free San Joaquin Valley Eater's Guide was designed to be a useful tool in identifying local, fresh, and affordable food from the rich agricultural region. The guide was developed in an effort to help improve access to healthy food and raise awareness about the importance of buying local. The guide highlighted produce vendors who accepted WIC vouchers and EBT cards. Components of the guide included: seasonality chart of local fruit and vegetable crops, schedule and location information of 53 farmers’ markets in the region, list of CSA programs, food system editorials, organizations and websites that supported sustainable food systems and healthy food access; and a list of CCROPP partners who were working on obesity prevention.13
In 2011, Merced County CCROPP partners released a new toolkit, 10-Step Guide to Establishing Electronic Benefit Transfer (EBT) at Your Local Produce Market. This toolkit was developed to improve access to healthy, affordable food in communities throughout the San Joaquin Valley. It was intended to serve as a useful resource for farmers, growers, market managers, produce vendors, school administrators, food service directors, community organizations, faith-based groups, and others who might be interested in establishing EBT at an outdoor fresh produce market.
The Merced market hosted the area’s bi-national health week events, which provided free health screenings to migrant and seasonal farm worker families who lacked routine health care.
Implementation
Health educators and nutrition advocates tried for many years to establish a farmers’ market in the city of Fresno. Because there was no policy definition for a farmers’ market in the municipal code, this task was completed first. An advisory committee was formed, consisting of farmers, nutrition advocates, residents, and City Planning Department employees. After one year, the policy was created and passed unanimously by the City Council.
Merced County CCROPP increased access to healthy food by implementing EBT at the local food markets, including the Merced and Atwater flea markets. It took four and a half months to install the EBT machines at the market. Community Leads had to create a co-op of the vendors at the market to inform them of the procedures of accepting the tokens, since many of the vendors sold items other than food (e.g., make-up, clothes). Non-food vendors were discouraged from accepting tokens for their goods and they would be removed from the market.
FARMERS’ MARKETS
Source: HKHC Dashboard
Source: HKHC Dashboard
31
California’s Central Valley – HKHC Leading Site
The farmers’ market in Kern County started in 2007, but after the initial interest and excitement dissipated, the market languished from a shortage of vendors and customers. For the 2008 market season, the Kern County Community Lead secured approval to promote the market through flyers, banners, radio, television spots, and online publicity. Other bureaucratic steps remained, such as obtaining a site permit from the County Department of Environmental Health Services, covering access to public restrooms, and establishing food safety regulations and measures. Vendors were required to prove to the Kern County Agriculture Commission that the foods they were selling were grown on their property and not purchased elsewhere. Vendors paid $10 for a Certified Producer’s Application, which could be used to obtain a California Certified Farmers’ Market certificate from the Calfiornia State WIC Association, qualifying them to redeem WIC vouchers.
Population Reach
Within the first three weeks of implementing EBT, sales were $700 between the Merced and Atwater markets. The following six weeks, the sales were over $5,000. In one year (2008-2009), EBT food sales doubled at the markets. At one point, there were 5,000 people that visited the markets every weekend.
Establishing the Kern County Farmers’ Market within walking distance of a WIC clinic increased the clinic’s redemption rate nearly 30% within two years. The more vouchers that were redeemed in a season, the more vouchers the WIC agency could receive the following year for distribution.
Challenges
It has been difficult to get other farmers’ markets off the ground. This could be due to the cost of starting a market since a city permit can cost $6,000.
FARMERS’ MARKETS

32
California’s Central Valley – HKHC Leading Site
CORNER STORES
San Joaquin Valley is largely a food desert where residents rely on corner stores for access to common foods. The stores mostly resemble liquor stores. Few fast food places are in existence in San Joaquin Valley. As a result, the re-design initiative—creating a healthier corner store—was a necessary step toward providing residents with healthier options.
Policy, Practice, and Environmental Change
Due to Stockton’s bankruptcy status, there was a hold on moving forward with building a supermarket. Instead, the community chose to work on converting an existing corner store into a healthy store, called the M&M market. This store was able to accept WIC and EBT.
Complementary Programs and Promotions
The CCROPP newsletter was the main catalyst in promoting the corner store redesign as an effective promotion strategy that other stores were able to use. CCROPP members designed the sign for the M&M market.
In April 2013, the community of Southeast Stockton united to recognize the M&M market as a leading healthy store. The small store maintained its commitment to the community by providing fruits and vegetables as well as accepting WIC and EBT. The hope for the event was to draw attention and encourage more small stores to follow M&M’s lead. A ribbon cutting ceremony, taste testing, free recipes, and naturally-flavored water samples were some of the activities and incentives offered at the event.
Implementation
San Joaquin leaders purchased shelving and baskets for the corner store, and the owner was responsible for restocking. Within two weeks, the owner’s sales increased, and the store gained valuable media attention (newspaper article).
Challenges
In the process of starting corner store assessments in San Joaquin, violence increased and a murder occurred near the store. Community Leads decided the timing was not ideal to implement interventions, rather they focused on developing relationships with the community members.
A corner store owner in Earlimart refused assistance from the HKHC partnership, indicating that fruits and vegetables would not sell at his facility.
CORNER STORES

33
California’s Central Valley – HKHC Leading Site
SUSTAINABILITY OF THE PARTNERSHIP AND INITIATIVE
CCROPP plans to continue the work of reversing the obesity epidemic in the San Joaquin Valley. CCROPP’s goals are to continue to increase access to healthy foods and beverages as well as continue to increase opportunities for physical activity. CCROPP is also interested in continuing the work of building the capacity of grassroots community members to be advocates for healthy communities.
CCROPP’s success as an organization has inspired other groups to follow suit. They have provided technical assistance to HKHC sites in California (i.e., Rancho Cucamonga, Watsonville-Pajaro Valley) and in New Mexico (i.e., Grant County). CCROPP has also presented its work at least three times at national American Public Health Association meetings and has been asked to present on the value of non-clinical community-based programs by the Institute of Medicine.
Two Community Leads were invited to sit on a Board of Supervisors’ Advisory Committee.
The network of leaders that emerged from the program has made it easier for CCROPP to identify key policy and environmental change priorities, as well as mobilize residents to action. According to the Project Leaders, this greatly facilitates the development of regional policy priorities, and provides an organized voice that can represent the Central Valley in statewide efforts to prevent obesity and create healthier communities.
SUSTAINABILITY

34
California’s Central Valley – HKHC Leading Site
REFERENCES
1. Healthy Kids Healthy Communities National Program Office. Home and About. 2009. http://www.healthykidshealthycommunities.org/. Accessed <January 1, 2014>.
2. Healthy Kids Healthy Communities National Program Office. Healthy Kids, Healthy Communities: Central Valley, CA. 2013. http://www.healthykidshealthycommunities.org/communities/central-valley-ca. Accessed <January 1, 2014>
3. Central California Regional Obesity Prevention Program (CCROPP). Home Page. 2014. http://www.ccropp.org/. Accessed <February 6, 2014>.
4. Great Valley Center. Annual Report 2007-2008. 2008. http://www.greatvalley.org/wp-content/uploads/2012/01/FY-2008-GVC-Annual-Report.pdf. Accessed <March 20, 2014>.
5. Bengiamin, M., Capitaman, J.A., and Chang, X. Healthy People 2010: A 2010 Profile of Health Status in the San Joaquin Valley, Fresno, CA. (2011). Fresno, CA: California State University, Fresno.
6. United States Census Bureau. 2007-2011 American Community Survey. 2014 http://www.census.gov/acs. Accessed <February 6, 2014>.
7. University of Wisconsin Population Health Institute and Robert Wood Johnson Foundation. County Health Rankings and Roadmaps: A Healthier Nation, County by County. 2013. http://www.countyhealthrankings.org/app/ohio/2013/hamilton/county/outcomes/overall/snapshot/by-rank. Accessed <March 20, 2014>.
8. California Department of Public Health. Programs: CX3. 2014. http://www.cdph.ca.gov/programs/cpns/Pages/CX3_Main_Navgation.aspx. Accessed <February 25, 2014>.
9. Public Health Institute. Health in All Policies. 2014. http://www.phi.org/focus-areas/?focus_area=chronic-disease-prevention&program=health-in-all-policies. Accessed <February 25, 2014>.
10. Latino Coalition for a Healthy California. Mission and Values. 2014. http://www.lchc.org/who-we-are/mission-values/. Accessed <February 25, 2014>.
11. California Food Policy Advocates. About Us. n.d. http://cfpa.net/about-us. Accessed <February 25, 2014>.
12. Community Commons and IP3. Teamwork Brings Shared Use Agreements and New Park to Earlimart, Calif. n.d. http://www.communitycommons.org/sa_success_story/teamwork-brings-shared-use-agreements-and-new-park-to-earlimart-calif/. Accessed <February 25, 2014>.
13. Community Alliance with Family Farmers and CCROPP. Buy Fresh, Buy Local: The Eaters Guide to Local Food, San Joaquin Valley. 2011. http://caff.org/programs/local-food-systems/. Accessed <March 4, 2014>.
REFERENCES

35
California’s Central Valley – HKHC Leading Site
APPENDIX A: CALIFORNIA’S CENTRAL VALLEY EVALUATION LOGIC MODEL
In the first year of the grant, this evaluation logic model identified short-term, intermediate, and long-term community and system changes for a comprehensive evaluation to demonstrate the impact of the strategies to be implemented in the community. This model provided a basis for the evaluation team to collaborate with the Central Valley HKHC partnership to understand and prioritize opportunities for the evaluation. Because the logic model was created at the outset, it does not necessarily reflect the four years of activities implemented by the partnership (i.e., the workplans were revised on at least an annual basis).
The healthy eating and active living strategies of the Central Valley HKHC partnership included:
Active Transportation: Leaders advocated for Safe Routes To School in Stockton, Ceres, and Merced, resulting in improved pedestrian and bicycling access around two schools. The partnership also implemented a Walking School Bus and secured additional funding to improve pedestrian and bicycling environments.
Parks and Play Spaces: HKHC partners improved safety and park amenities (e.g., installed lighting, planted trees, repaired swings) in Bakersfield and increased secured joint use agreements in Fresno, Fairmead, and Stockton between neighborhood schools and the community, for example.
Healthy Eating: Graduates of the Power People program established school farm stands in Fresno and Ceres solidified Electronic Benefit Transfer (EBT) acceptance at a flea market in Merced, increased access to fruits and vegetables at a corner store in Stockton, and started community gardens in Pixley and Bakersfield.
APPENDICES
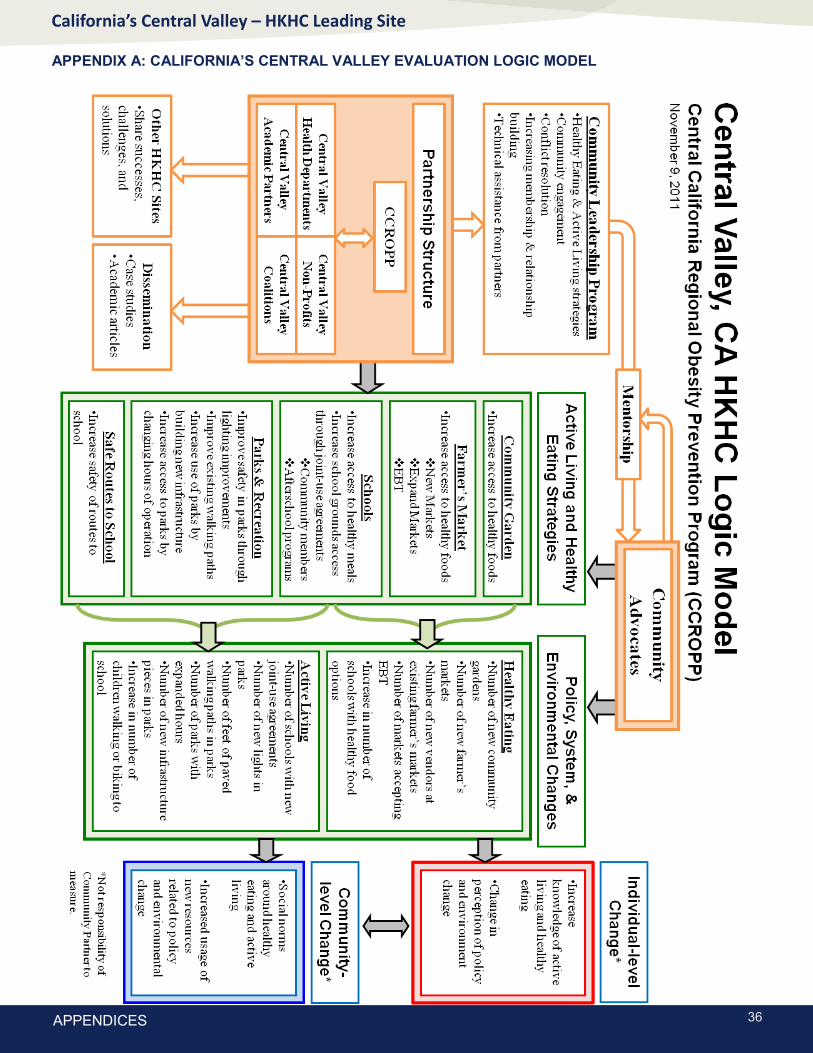
36
California’s Central Valley – HKHC Leading Site
APPENDIX A: CALIFORNIA’S CENTRAL VALLEY EVALUATION LOGIC MODEL
APPENDICES

37
California’s Central Valley – HKHC Leading Site
APPENDIX B: PARTNERSHIP AND COMMUNITY CAPACITY SURVEY RESULTS
APPENDICES
Partnership and Community Capacity Survey
To enhance understanding of the capacity of each community partnership, an online survey was conducted with project staff and key partners involved with California’s Central Valley- HKHC during the final year of the grant. Partnership capacity involves the ability of communities to identify, mobilize, and address social and public health problems.1-3
Methods
Modeled after earlier work from the Prevention Research Centers and the Evaluation of Active Living by Design4, an 82-item partnership capacity survey solicited perspectives of the members of the California’s Central Valley- HKHC partnership on the structure and function of the partnership. The survey questions assisted evaluators in identifying characteristics of the partnership, its leadership, and its relationship to the broader community.
Questions addressed respondents’ understanding of California’s Central Valley- HKHC in the following areas: partnership capacity and functioning, purpose of partnership, leadership, partnership structure, relationship with partners, partner capacity, political influence of partnership, and perceptions of community members. Participants completed the survey online and rated each item using a 4-point Likert-type scale (strongly agree to strongly disagree). Responses were used to reflect partnership structure (e.g., new partners, committees) and function (e.g., processes for decision making, leadership in the community). The partnership survey topics included the following: the partnership’s goals are clearly defıned, partners have input into decisions made by the partnership, the leadership thinks it is important to involve the community, the partnership has access to enough space to conduct daily tasks, and the partnership faces opposition in the community it serves. The survey was open between December 2012 and April 2013 and was translated into Spanish to increase respondent participation in predominantly Hispanic/Latino communities.
To assess validity of the survey, evaluators used SPSS to perform factor analysis, using principal component analysis with Varimax with Kaiser Normalization (Eigenvalue >1). Evaluators identified 15 components or factors with a range of 1-11 items loading onto each factor, using a value of 0.4 as a minimum threshold for factor loadings for each latent construct (i.e., component or factor) in the rotated component matrix.
Survey data were imported into a database, where items were queried and grouped into the constructs identified through factor analysis. Responses to statements within each construct were summarized using weighted averages. Evaluators excluded sites with ten or fewer respondents from individual site analyses but included them in the final cross-site analysis.
Findings
Five of the project staff and key partners involved with California’s Central Valley-HKHC completed the survey. See Partnership and Community Capacity Survey Results starting on page 39.
References
1. Goodman RM, Speers MA, McLeroy K, et al. Identifying and defining the dimensions of community
capacity to provide a basis for measurement. Health Educ Behav. Jun 1998;25(3):258-278.
2. Israel BA, Schulz AJ, Parker EA, Becker AB. Review of community-based research: assessing
partnership approaches to improve public health. Annu Rev Public Health. 1998;19:173-202.
3. Roussos ST, Fawcett SB. A review of collaborative partnerships as a strategy for improving community health. Annu Rev Public Health. 2000;21:369-402.
4. Baker E, Motton F. Is there a relationship between capacity and coalition activity: The road we’ve
traveled. American Public Health Association 131st Annual Meeting. San Francisco, CA; 2003.
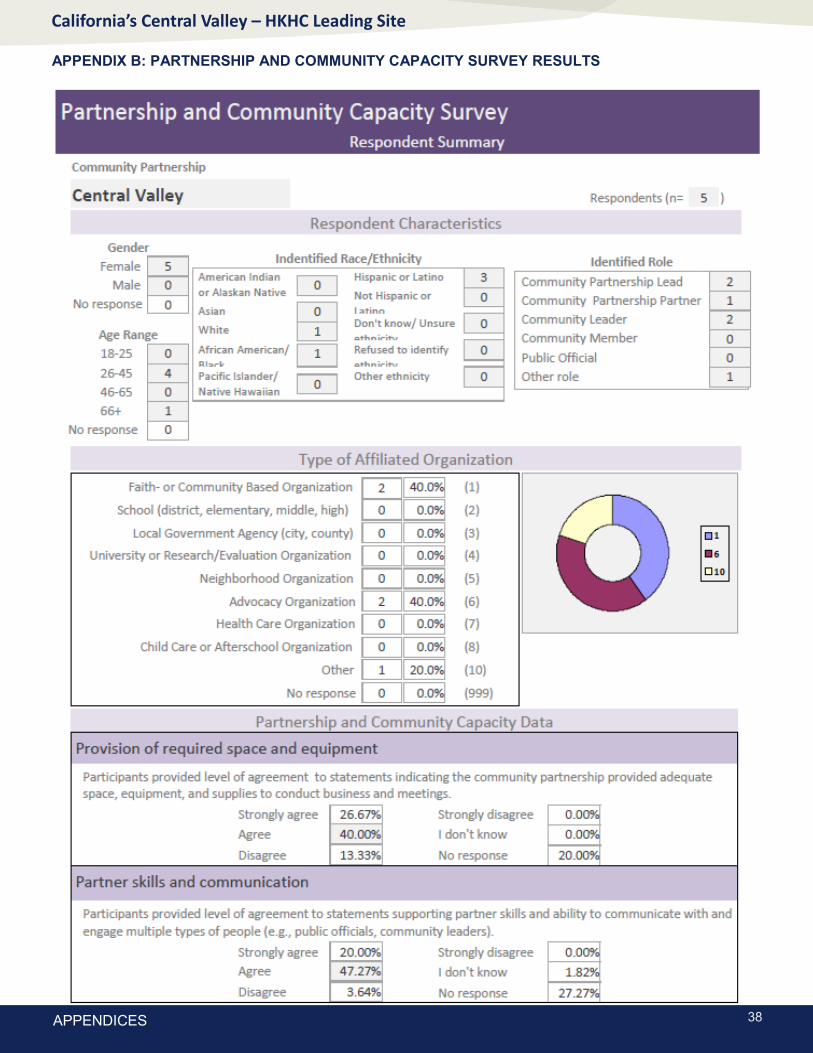
38
California’s Central Valley – HKHC Leading Site
APPENDIX B: PARTNERSHIP AND COMMUNITY CAPACITY SURVEY RESULTS
APPENDICES

39
California’s Central Valley – HKHC Leading Site
APPENDIX B: PARTNERSHIP AND COMMUNITY CAPACITY SURVEY RESULTS
APPENDICES

40
California’s Central Valley – HKHC Leading Site
APPENDIX B: PARTNERSHIP AND COMMUNITY CAPACITY SURVEY RESULTS
APPENDICES

41
California’s Central Valley – HKHC Leading Site
APPENDIX B: PARTNERSHIP AND COMMUNITY CAPACITY SURVEY RESULTS
APPENDICES
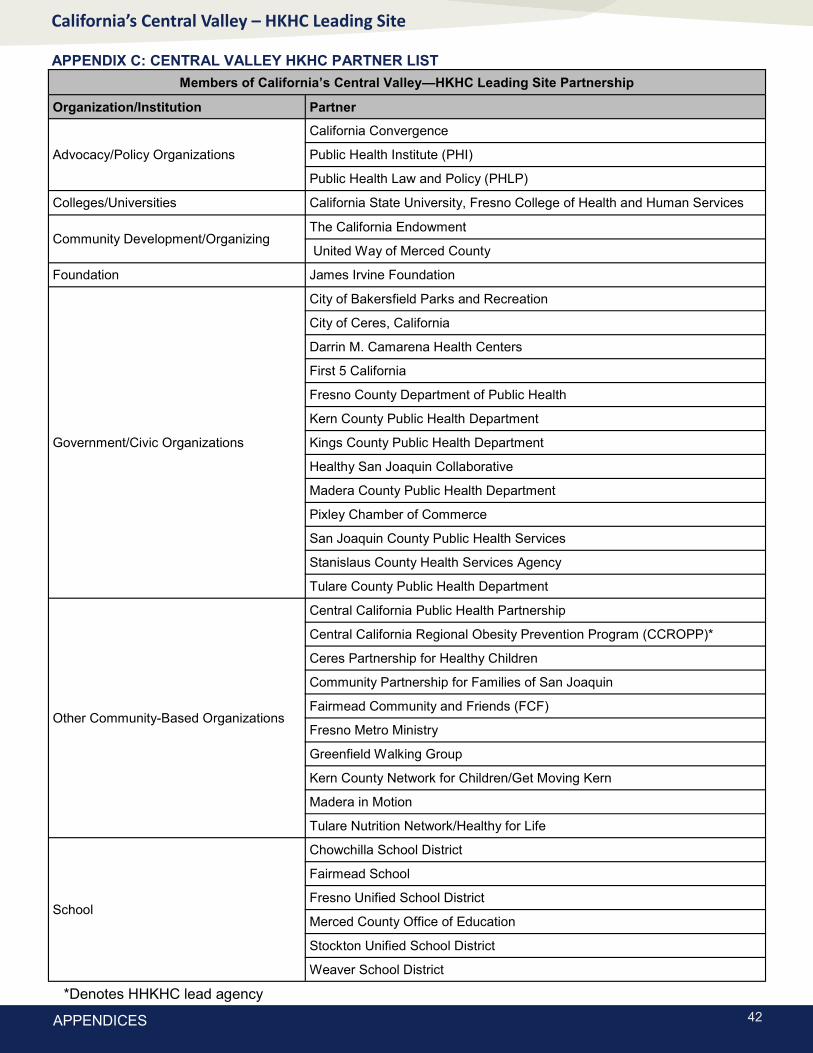
42
California’s Central Valley – HKHC Leading Site
APPENDIX C: CENTRAL VALLEY HKHC PARTNER LIST
APPENDICES
*Denotes HHKHC lead agency
Members of California’s Central Valley—HKHC Leading Site Partnership
Organization/Institution Partner
Advocacy/Policy Organizations
California Convergence
Public Health Institute (PHI)
Public Health Law and Policy (PHLP)
Colleges/Universities California State University, Fresno College of Health and Human Services
Community Development/Organizing The California Endowment
United Way of Merced County
Foundation James Irvine Foundation
Government/Civic Organizations
City of Bakersfield Parks and Recreation
City of Ceres, California
Darrin M. Camarena Health Centers
First 5 California
Fresno County Department of Public Health
Kern County Public Health Department
Kings County Public Health Department
Healthy San Joaquin Collaborative
Madera County Public Health Department
Pixley Chamber of Commerce
San Joaquin County Public Health Services
Stanislaus County Health Services Agency
Tulare County Public Health Department
Other Community-Based Organizations
Central California Public Health Partnership
Central California Regional Obesity Prevention Program (CCROPP)*
Ceres Partnership for Healthy Children
Community Partnership for Families of San Joaquin
Fairmead Community and Friends (FCF)
Fresno Metro Ministry
Greenfield Walking Group
Kern County Network for Children/Get Moving Kern
Madera in Motion
Tulare Nutrition Network/Healthy for Life
School
Chowchilla School District
Fairmead School
Fresno Unified School District
Merced County Office of Education
Stockton Unified School District
Weaver School District

43
California’s Central Valley – HKHC Leading Site
APPENDIX D: SOURCES AND AMOUNTS OF FUNDING LEVERAGED
APPENDICES

44
California’s Central Valley – HKHC Leading Site
APPENDIX D: SOURCES AND AMOUNTS OF FUNDING LEVERAGED
APPENDICES

45
California’s Central Valley – HKHC Leading Site
APPENDIX E: ENHANCED EVALUATION REPORTS
APPENDICES
Parks and Play Spaces Direct Observation
Parks and Play Spaces Environmental Audit
Corner Stores Environmental Audit
Farmers’ Market Environmental Audit

1
California’s Central Valley - Healthy Kids, Healthy Communities Leading Site
Parks and Play Spaces Direct
Observation
Summary Report
Prepared by Transtria LLC
2
Table of Contents Overview ..................................................................................................................................... 3
Background ................................................................................................................................. 3
Methods ...................................................................................................................................... 3
Results ........................................................................................................................................ 5
Appendix A: Parks and Play Spaces Direct Observation Tool ................................................... 15
3
OVERVIEW California’s Central Valley Healthy Kids, Healthy Communities Leading Site, one of 49 Healthy Kids, Healthy Communities partnerships, is part of a national program of the Robert Wood Johnson Foundation whose primary goal is to implement healthy eating and active living policy, system, and environmental change initiatives. In order to better understand the impact of their work on parks and play spaces, partnership representatives collected direct observation data around units of measurement (i.e. corner store, street segment, park) throughout the Partnership’s catchment area, including: (1) Lions Town and County Park, (2) Madera County Courthouse Park, (3) Madera Sunrise Rotary Park, (4) McNally Park, (5) Pan America Park, (6) Romaine Park, (7) Rotary Park, (8) Smyrna Park. BACKGROUND Healthy Kids, Healthy Communities (HKHC) is a national program of the Robert Wood Johnson Foundation (RWJF) whose primary goal is to implement healthy eating and active living policy, system, and environmental change initiatives that can support healthier communities for children and families across the United States. Healthy Kids, Healthy Communities places special emphasis on reaching children who are at highest risk for obesity on the basis of race/ethnicity, income, and/or geographic location. Central Valley, California was selected as one of 49 communities to participate in HKHC, and the Central California Regional Obesity Prevention Program (CCROPP) is the lead agency for their community partnership, California’s Central Valley Healthy Kids, Healthy Communities Leading Site. Central Valley has chosen to focus its work on farmers’ markets, corner stores, and parks and play spaces. Transtria LLC, a public health evaluation and research consulting firm located in St. Louis, Missouri, is funded by the Robert Wood Johnson Foundation to lead the evaluation and dissemination activities from April 2010 to March 2014. For more information about the evaluation, please visit www.transtria.com. In order to better understand the impact of their work in parks and play spaces, partnership representatives chose to participate in the enhanced evaluation data collection activities. This supplementary evaluation focuses on the six cross-site HKHC strategies, including: parks and play spaces, active transportation, farmers’ markets, corner stores, physical activity standards in childcare settings, and nutrition standards in childcare settings. Communities use two main methods as part of the enhanced evaluation, direct observation and environmental audits. Central Valley chose to collect data on parks and play spaces using the direct observation method. METHODS Parks and Play Spaces Direct Observation The parks and play spaces direct observation tool was adapted from the System for Observing Play and Leisure Activity (SOPLAY) and System for Observing Play and Recreation in Communities (SOPARC) tools, protocols, and operational definitions. Direct observation is a method used to assess individuals’ behaviors in their natural setting. An Evaluation Officer from Transtria LLC trained representatives of Central Valley’s community partnership on proper data collection methods using the tool.
4
Data were collected between April 30 and June 7, 2013 at the following eight parks: (1) Lions Town and County Park, (2) Madera County Courthouse Park, (3) Madera Sunrise Rotary Park, (4) McNally Park, (5) Pan America Park, (6) Romaine Park, (7) Rotary Park, (8) Smyrna Park. Observations were collected between 9:00 AM and 7:30 PM. The observations were all conducted on nine separate days by seven different observers. Observers collected data at single points in time sometimes making several observations per day. For some parks observers made several observations, but did not specify times. Each observation represents an individual’s activity level in the area at the specified time. Because individuals may have exited and re-entered the area during observation periods, the individuals observed in each time period were not the same. This method allowed observers to capture overall changes in activity level as time lapsed, but it did not allow observers to record individual behavior changes. However, for some of the parks, observers recorded the total number of individuals observed at a particular time point or time interval, sometimes reporting a range. During the scan, the observer completed the observation tool by tallying children in the designated area by age group (i.e., preschool = 3-5 years; elementary school = 6-10 years; middle school = 11-14 years; high school = 15+ years) and activity level (i.e., sedentary, moderate, or very active behaviors).
Sedentary behaviors are defined as activities in which children are not moving (e.g.,
standing, sitting, playing board games).
Moderate intensity behaviors require more movement but no strenuous activity (e.g.,
walking, biking slowly).
Very active behaviors show evidence of increased heart rate and inhalation rate (e.g.,
running, biking vigorously, playing basketball).
Observers also reported the activity codes for the children in the designated area, including:
The activity code “No Identifiable Activity” was used to indicate no movement. The activity code “None of the Above” was used when an individual was engaging in an activity not included in the other activity codes.
In addition to recording individuals’ activity levels, observers created maps of the parks. The maps included a form for the setting, location, type of park area, condition of the area, any permanent modifications (the specific permanent alterations present that assist children in participating in physical activity such as lines painted on courts or basketball poles and nets; this does not include temporary improvements such as chalk lines and portable nets.), the presence of overlap modifications (e.g., the space has multiple improvements that overlap but cannot be used simultaneously such as a space that is used for both volleyball and basketball), and the surface type (e.g., gravel, grass). One Transtria staff member entered the data and a second staff member conducted validity checks on 10% of observations (i.e., every tenth observation) to ensure accuracy of the data. Of the 10% checked, zero errors were found among the 273.6 observations (100% correct).
No Identifiable Activity Aerobics Baseball/Softball Basketball Dance Football Gymnastics Martial Arts Racquet Sports Soccer Swimming Weight Training Playground Games Walking Jogging/Running
Volleyball None of the Above Biking

5
RESULTS Overall Results Park Direct Observations Direct observations were conducted at eight parks including (1) Lions Town and County Park, (2) Madera County Courthouse Park, (3) Madera Sunrise Rotary Park, (4) McNally Park, (5) Pan America Park, (6) Romaine Park, (7) Rotary Park, (8) Smyrna Park. Observations were collected between April 30 and June 12, 2013. Activity levels were collected over a total of 76 observation periods with a range of 1 to 38 observation periods collected per park (Table 1).
Table 1. Number of Observation Periods Collected per Park
Lions Town and County Park 5
Madera County Courthouse Park 11
Madera Sunrise Rotary 1
McNally Park 1
Pan America Park 2
Rotary Park 12
Romaine Park 6
Smyrna Park 38
Total 76
Results by Park Fresno County Romain Park At Romain Park, observers collected data for six observation time points on May 27, 2013 between 5:15 PM and 6:30 PM. Six different play space areas were observed including the toddler play structure, the ramp and skate park, the baseball field, the basketball courts, and an ‘adult area’, primarily used to play cards. Each play space was observed once at one point in time. Observers counted the total number of children, adolescents, and adults in each play space and the type of activity with which they were engaged. Between 68 and 89 individuals were observed in the park (see Table 1). The first play space observed was the toddler play structure where 12 children were very active, and 6 adults were sedentary. Next, the ramp and skate park were observed where 12-14 children and 4 adolescents were very active. At the baseball field four to six children were moderately active and two adolescents were very active. Five adolescents and four adults were very active at the basketball courts. At an ‘adult area’, primarily used to play cards, 15-20 sedentary adults were observed. When observations were made from the middle of the play field, four to six sedentary adults were observed.

6
Table 1. Activity Levels Observed by Age Group at Romain Park
Age Activity Level Individuals Observed
Children
Sedentary 0
Moderate 4-6
Very Active 24-26
Adolescents
Sedentary 0
Moderate 0
Very Active 11
Adults
Sedentary 25-32
Moderate 0
Very Active 4
Total All activity
levels 68-89
A total of five activity types (see Table 2) were observed in Romain Park including other playground games, biking, baseball/softball, basketball, and no identifiable activity (i.e. not moving). Children were observed participating in other playground games, biking, and baseball/softball. Adolescents were observed participating in other playground games, baseball/softball, and basketball. Adults were observed participating in basketball, and no identifiable activity. Table 2. Types of Activity Observed at Romain Park
Activity Type
Present/absent in Park
Age Group Participating
No identifiable Activity (i.e. not moving) present adults
Aerobics absent
Baseball/softball present
children, adolescents
Basketball present
adolescents, adults
Dance absent
Football absent
Gymnastics absent
Martial Arts absent
Racquet sports absent
Soccer absent
Swimming absent
Volleyball absent
Weight training absent

7
Other playground games present
children, adolescents
Walking absent
Jogging/Running absent
Biking present children
None of the above absent
Madera County Lions Town and Country Park At Lions Town and County Park, observers collected data on four different days (April 30, May 15, 18, and 21, 2013). Data were collected over a total of five observation time points. Each day data were collected at one point, except for May 21, when data were collected at two time points. Activity levels observed among each age group, and types of activity observed were recorded, but the number of individuals was not indicated. On April 30 at 3:00 PM, very active children and moderately active adults were observed (see Table 3). On May 15 at 6:00 PM very active adolescents were observed. On May 18, 2013 at 6:00 PM very active children, very active adolescents and moderately active adults were observed. On May 21 at 11:00 AM very active children and moderately active adults were observed. On May 21 at 7:00 PM very active adolescents were observed. Table 3. Activity Levels Observed Among Each Age Group at Lions Town and Country Park
Age Activity Level Activity Level Observed in
Park?
Children
Sedentary no
Moderate no
Very Active yes
Adolescents
Sedentary no
Moderate no
Very Active yes
Adults
Sedentary no
Moderate yes
Very Active yes
Park goers were observed participating in five different types of activity (see Table 4) at Lions Town and Country Park including baseball/softball, volleyball, walking, jogging/running, other playground games. Observers also noted that none of the activities listed on the observation tool appropriately described the observed activity. Children were exclusively observed playing other playground games. Adolescents played baseball/softball, and volleyball. Adults jogged/ran, walked, and played volleyball.

8
Table 4. Types of Activity Observed at Lions Town and County Park
Activity Type
Present/absent in Park
Age Group Participating
No identifiable Activity (i.e. not moving) absent
Aerobics absent
Baseball/softball present adolescents
Basketball absent
Dance absent
Football absent
Gymnastics absent
Martial Arts absent
Racquet sports absent
Soccer absent
Swimming absent
Volleyball present
adolescents, adults
Weight training absent
Other playground games present children
Walking present adults
Jogging/Running present adults
Biking absent
None of the above present
adolescents, adults
Madera County Courthouse Park Madera County Courthouse Park was observed on June 7, 2013 between 9:30 AM and 12:00 PM. Observers collected data over a total of eleven observation periods (the length of the observation periods was not specified). Starting at 9:30 AM, three observation periods were conducted. At 11:00 AM, six observation periods were completed. At 12:00 PM, an additional three observation periods were completed. Observers counted the total number of children, adolescents, and/or adults during each observation period as well as the type of activity with which park goers were engaged. Of the 135 individuals observed at Madera County Courthouse Park, the majority (88.9%) of individuals observed at the park were adults (see Table 5), followed by children (8.1%), and adolescents (3.0%). Across all age groups, adults were the only group observed being very active (2.2%), and the only group observed being sedentary (63.0%). Table 5. Overall Activity Levels Observed by Age Group at Madera County Courthouse Park (N=135)

9
Sedentary Moderate Very Active All Activity Levels
Children 0 (0%) 11 (8.1%) 0 (0%) 11 (8.1%)
Adolescents 0 (0%) 4 (3.0%) 0 (0%) 4 (3.0%)
Adults 85 (63.0%) 32 (23.7%) 3 (2.2%) 120 (88.9%)
All Age Groups 85 (63.0%) 47 (34.8%) 3 (2.2%) 135 (100%)
When we look at activity levels within each age group, we see that all children and adolescents observed were moderately active (see Figure 1). Among the adults observed, most (70.8%) were sedentary, about one-quarter of adults (26.7%) was moderately active, and few (2.5%) were very active.
A total of four different types of activity (see Table 6) were observed among all 135 individuals at the park on the day of the observation. Children and adolescents walked. Adults participated in walking, biking, and no identifiable activity. Observers also noted that none of the activities listed on the observation tool appropriately described the observed activity for some adults. Table 6. Types of Activity Observed at Madera County Courthouse Park
Activity Type
Present/absent in Park
Age Group Participating
No identifiable Activity (i.e. not moving) present adults
0.0%
20.0%
40.0%
60.0%
80.0%
100.0%
120.0%
Children (n=11) Adolescents (n=4) Adults (n=120)
Figure 1. Proportion of Individuals within Age Groups at Each Activitiy Level at Madera County Courthouse Park
Sedentary Moderate Very Active

10
Aerobics absent
Baseball/softball absent
Basketball absent
Dance absent
Football absent
Gymnastics absent
Martial Arts absent
Racquet sports absent
Soccer absent
Swimming absent
Volleyball absent
Weight training absent
Other playground games absent
Walking
present
children, adolescents,
adults
Jogging/Running
Biking present adults
None of the above present adults
Madera Sunrise Rotary Madera Sunrise Rotary Park was observed on May 24, 2013 at 5:00PM. One observation was made that noted the activity level among age groups and the type of activity with which park goers were engaged, though the total number of individuals observed was not specified. Children were moderately active participating in other playground games. Adults were also moderately active engaged in basketball. No adolescents were observed. McNally Park At McNally Park, one observation was made on May 25, 2013 at 6:30 PM. Activity levels observed among each age group, and types of activity observed were recorded, though the number of individuals was not indicated. Observers noted very active children participating in other playground games and very active adults engaged in dancing. Pan America Park Pan America Park was observed at two points in time on May 18, 2013. One observation was at 11:00 AM, the other at 7:30 PM. Activity levels observed among each age group, and types of activity observed were recorded, but the number of individuals was not indicated. At both time points very active children were observed participating in other playground games. At 7:30 PM adults were observed engaged in moderate activity, specifically playing basketball. Rotary Park

11
Rotary Park was observed on two separate days. Data were collected for a total of 12 observation periods. The length of the observation period is not specified. On May 19, 2013, data were collected at 6:00 PM and 9:00 PM for seven observation periods. On May 27, 2013, data were collected at 2:00 PM and 4:00 PM for five observation periods. Observers counted the total number of children, adolescents, and/or adults during each observation period as well as the type of activity with which park goers were engaged. The majority (55.4%) of park goers on both days the park was observed were adults, followed by children (22.5%) and adolescents (22.1%) (see Table 7). Of all 249 individuals observed, most were very active (75.1%). About one-fifth (21.7%) of all individuals were moderately active, while only a few were sedentary (3.2%).
Table 7. Overall Activity Levels Observed by Age Group at Rotary Park (N=249)
Sedentary Moderate Very Active All Activity Levels
Children 0 (0.0%) 34 (13.7%) 22 (8.8%) 56 (22.5%)
Adolescents 0 (0.0%) 20 (8.0%) 35 (14.1%) 55 (22.1%)
Adults 8 (3.2%) 0 (0.0%) 130 (52.2%) 138 (55.4%)
All Age Groups 8 (3.2%) 54 (21.7%) 187 (75.1%) 249 (100.0%)
When we look at activity levels within each age group, we see that about one-third of children (39.3%), over half of adolescents (63.6%), and the majority of adults (94.2%) were very active (see Figure 2). Over half of the observed children (60.7%) and over one-third of observed adolescents (36.4%) were moderately active. A small proportion of adults was sedentary (5.8%), but they were the only group observed at this activity level.
0.0%
10.0%
20.0%
30.0%
40.0%
50.0%
60.0%
70.0%
80.0%
90.0%
100.0%
Children (n=56) Adolescents (n=55) Adults (n=138)
Figure 2. Proportion of Individuals within Age Groups at Each Activitiy Level at Rotary Park
Sedentary Moderate Very Active

12
Among the 249 individuals observed at Rotary Park, a total of eight different types (see Table 8) of activities were observed including soccer, volleyball, walking, jogging/running, biking, skating, other playground games and no identifiable activity. Children participated in other playground games, and biking. Adolescents were engaged in volleyball, walking, jogging/running, biking, and skating. Adults participated in soccer, volleyball, other playground games, walking, jogging/running, biking, and skating. Table 8. Types of Activity Observed at Rotary Park
Activity Type
Present/absent in Park
Age Group Participating
No identifiable Activity (i.e. not moving) present adults
Aerobics absent
Baseball/softball absent
Basketball absent
Dance absent
Football absent
Gymnastics absent
Martial Arts absent
Racquet sports absent
Soccer present adults
Swimming absent
Volleyball present adolescents,
adults
Weight training absent
Other playground games present children, adults
Walking present
adolescents, adults
Jogging/Running present
adolescents, adults
Biking
present
children, adolescents,
adults
Skating present
adolescents, adults
Stanislaus County Smyrna Park Three different observers collected data at Smyrna Park on May 27, 2013 from 9:00 AM to 9:50 AM. Various play space areas of the park including a playground, green space, a skate park, a walkway, and ‘around the park’ were observed for multiple observation periods, but not observation time interval was specified.

13
Table 9. Play Spaces Observed and Number of Observations at Smyrna Park
Play Space Area Observed
Number of Observations
Playground 9
Green Space 13
Around the Park 4
Skate Park 9
In the walkway 3
Total 38
On the day of observation children were observed being moderately and very active at the playground. Their activity level was moderate on the walkway and in the green space. Their activity level was very active at the skate park and ‘around the park’. No sedentary children were observed. Adolescents were moderately active on the walkway and in the green space. ‘Around the park’ they were moderately and very active. No sedentary adolescents were observed. Sedentary adults were observed at the playground, in the green space, at the skate park, and on the walkway. Adults were moderately active at the playground, in the green space, and at the skate park. Adults were very active ‘around the park’.
Table 10. Activity Levels Observed at Smyrna Park
Play Space Area Observed
Children Adolescents Adults
Sed- entary
Mod- erate
Very Active
Sed- entary
Mod- erate
Very Active
Sed- entary
Mod- erate
Very Active
Playground x x x x
Green Space x x x x
Around the Park x x x x
Skate Park x x x
On the walkway x x x
A total of seven types of activity were observed at Smyrna Park. Children participated in other playground games, walking, biking, and skating. Walking was the only activity type observed among adolescents. Adults were observed walking, sitting, playing at the skate park and green space, supervising, and cleaning.

14
Key Takeaways
For most parks, very active behavior was observed among children, adolescents, and adults.
Playground games were the most common activity type observed among children.
Adults were sedentary, moderately active, and very active. They participated in a wide variety of activity from supervising to playing basketball.
Adolescents were mostly moderately and very active.
Table 11. Types of Activity Observed at Smyrna Park
Activity Type
Present/absent in Park
Age Group Participating
No identifiable Activity (i.e. not moving) absent
Aerobics absent
Baseball/softball absent
Basketball absent
Dance absent
Football absent
Gymnastics absent
Martial Arts absent
Racquet sports absent
Soccer absent
Swimming absent
Volleyball absent
Weight training absent
Other playground games present children
Walking present
children, adolescents,
adults
Jogging/Running absent
Biking present children
Skating present children
Supervising present adults
Sitting present adults
Playing at skate park, green space present adults
Cleaning present adults

1
Central California Regional Obesity Prevention Program (CCROPP)
Parks and Play Spaces Environmental Audits
Summary Report
Prepared by Transtria LLC

2
Table of Contents Overview ..................................................................................................................................... 3
Background ................................................................................................................................. 4
Methods ...................................................................................................................................... 4
Results ........................................................................................................................................ 5
Appendix A: Data Tables .......................................................................................................... 12
Appendix B: Parks and Play Spaces Environmental Audit Tool ................................................. 17
3
OVERVIEW Central California Regional Obesity Prevention Program (CCROPP), one of 49 Healthy Kids, Healthy Communities partnerships, is part of a national program of the Robert Wood Johnson Foundation whose primary goal is to implement healthy eating and active living policy, system, and environment change initiatives. In order to better understand the impact of their work around parks and play spaces, representatives of the Central California Regional Obesity Prevention Program (CCROPP), located in Central Valley, CA collected Environmental Audits around parks and play spaces throughout Fresno and Madera Counties. The following seven parks and play spaces were included in the assessment: Romain Park, Lions Town and Country Park, Rotary Park, Madera County Courthouse Park, Madera Sunrise Rotary, Pan-Am Park, and McNally Park.
Results
There were no vending machines at any of the seven audited parks.
Two parks were located adjacent to schools.
Two parks had parking for bicycles.
Madera County Courthouse Park had no playground or sports and recreation features and was the only park where sex paraphernalia was found. There was also some evidence of alcohol or other drug use in this park.
One park reported the presence of a lot of garbage/litter and two parks noted no garbage/litter present.
Two parks reported the presence of three or more sports and recreation features of the same type (i.e., Lions Town and County Park had nine baseball fields and Madera Sunrise Rotary Park had five soccer fields)

4
BACKGROUND
Healthy Kids, Healthy Communities (HKHC) is a national program of the Robert Wood Johnson Foundation (RWJF) whose primary goal is to implement healthy eating and active living policy, system, and environmental change initiatives that can support healthier communities for children and families across the United States. HKHC places special emphasis on reaching children who are at highest risk for obesity on the basis of race/ethnicity, income, and/or geographic location. For more information about HKHC, please visit www.healthykidshealthycommunities.org.
Located in Fresno, California, California Regional Obesity Prevention Program (CCROPP) was selected to lead the local HKHC partnership. CCROPP has chosen to focus its work on farmers’ markets, safe routes to school, parks and recreation, joint-use of facilities, corner stores, community gardens, and school nutrition programs. Transtria LLC, a public health evaluation and research consulting firm located in St. Louis, Missouri, is funded by the Robert Wood Johnson Foundation to lead the evaluation and dissemination activities from April 2010 to March 2014. For more information about the evaluation, please visit www.transtria.com/hkhc. This supplementary enhanced evaluation component focuses on six cross-site HKHC strategies, including: parks and plays spaces, street design, farmers’ markets, corner stores, physical activity standards in childcare settings, and nutrition standards in childcare settings. Communities are trained to use two main methods as part of the enhanced evaluation, direct observation and environmental audits. Tools and training are provided by Transtria staff (see www.transtria.com/hkhc).
In order to better understand the impact of their work in parks and play spaces, representatives of CCROPP chose to participate in the enhanced evaluation data collection activities. The partnership completed their enhanced evaluation activities for parks and play spaces using the environmental audit method.
METHODS
The Parks and Play Spaces Environmental Audit Tool was used to collect data (see Appendix B). This tool and protocol were adapted from the Physical Activity Resource Assessment and the BTG-COMP Park Observation Form 2012. An Evaluation Officer from Transtria LLC trained members of Central Valley’s community partnership on proper data collection methods using the tool. Environmental audits assess the presence or absence of different features as well as the quality or condition of the physical environment. This tool captures the setting, accessibility, vending machines, signage, barriers to entry, playground features (swings/slides/monkey bars/sandboxes/ground games), sports and recreation features (fields/courts/pools/tracks/trails), aesthetic features and amenities, and trash and vandalism. In this case, the audit tools were completed for seven parks in Fresno County and Madera County. The following parks were included in the assessment:
Fresno County: Romain Park
Madera County: Lions Town and Country Park, Rotary Park, Madera County Courthouse Park, Madera Sunrise Rotary, Pan-Am Park, and McNally Park.

5
Key Takeaways
Five of the seven parks (71%) were multi-featured and publically accessible.
Almost all the parks had a parking area on-site and on-street parking next to a play space.
None of the parks audited had broken glass and only one had some graffiti/tagging.
Six of the parks had signage indicating the park or play space name.
Only one park charged an entrance fee.
Two parks showed signs of alcohol or other drug use and one park had a little/some sex paraphernalia present.
Four auditors completed the assessments between May 18, 2013 and June 7, 2013. Transtria staff performed data entry and validation. Double data entry was performed to ensure accuracy of data. Agreement of data entry was 100%. RESULTS
Overall Results
Setting and accessibility
Four of seven parks (57%) had both outdoor and indoor settings, one park (14%) had only an outdoor setting, and two parks (29%) did not report the presence of either indoor or outdoor facilities. One park was a publically accessible green space, one park was a single-feature publically accessible park, and five parks (71%) were multi-feature, publically accessible parks; three of these five multi-feature parks were also reported to have publically accessible green space. Two parks were located adjacent to a school.
Almost all of the parks had a parking area on-site (86%) and on-street parking next to the play space (86%). Lighted parking areas were present at three parks (43%) and sidewalk/pedestrian lighting was present at six parks. A sidewalk on the street leading to the entrance was present in two parks and wheelchairs and strollers were easily able to enter play spaces in six of the parks. Five parks had crosswalks present at all intersections. Two parks had designated space for bicycle parking and three parks had a bus/transit stop on site. Three parks had a restroom/portable toilet.
Vending machines
There were no vending machines in the seven audited parks.
Signage and barriers to entry
Six parks had signage indicating the name of the park or play space. Two parks had a gate/fence partially restricting access to play space and two parks had a locked fence or other barrier preventing access to the park. One park charged an entrance fee.
Playground features
Six parks had playground features present in the play space, five of which had foam/rubber as the play surface.
Three parks had toddler swings and two parks had youth swings. Five parks had slides and four parks had a climbing feature. One of the parks had both a marked four-square court and a marked hopscotch area. Two parks had other play areas not already specified, one of which was a noted to be a well-lit toddler specific play area.

6
Sports and recreation features
Six of the parks audited had sports or recreation features. One park had two baseball fields and five soccer fields and another park had nine baseball fields. Three parks had basketball courts and two parks had volleyball courts. Two parks had skateboarding features and two other parks had running/walking tracks. Trails were found at five of the parks, with the surface of these trails being either gravel, cement and gravel, or a mixture of asphalt and cement.
Table 1, Sports and Recreation Features Across All Parks
Sports and Recreation Features Totals Across All Parks
Soccer Field 5
Baseball Field 11
Multi-use Field 1
Basketball Court 4
Volleyball Court 3
Skateboarding features 2
Running /Walking Track 2
Trail 5* *The surface of trails was noted in five parks but the presence of the trail itself was noted for three.
Aesthetic features and amenities
The green spaces at five parks were reported to be in good condition and two were reported to be in poor condition. Three parks had drinking fountains, shelters, benches, and grills/fire pits, all in good condition. Four parks had picnic tables and trash containers, all in good condition. Six parks had shade trees in good condition and one park had shade trees in poor condition. Four parks did not have other gardens and/or plants.
Trash and vandalism
Four parks had a little/some garbage/litter present and one park had a lot of garbage present. None of the parks had broken glass present and one park had graffiti/tagging present. Two parks showed evidence of a little/some alcohol or other drug use and one park had a little/some sex paraphernalia present at the time of the audit.
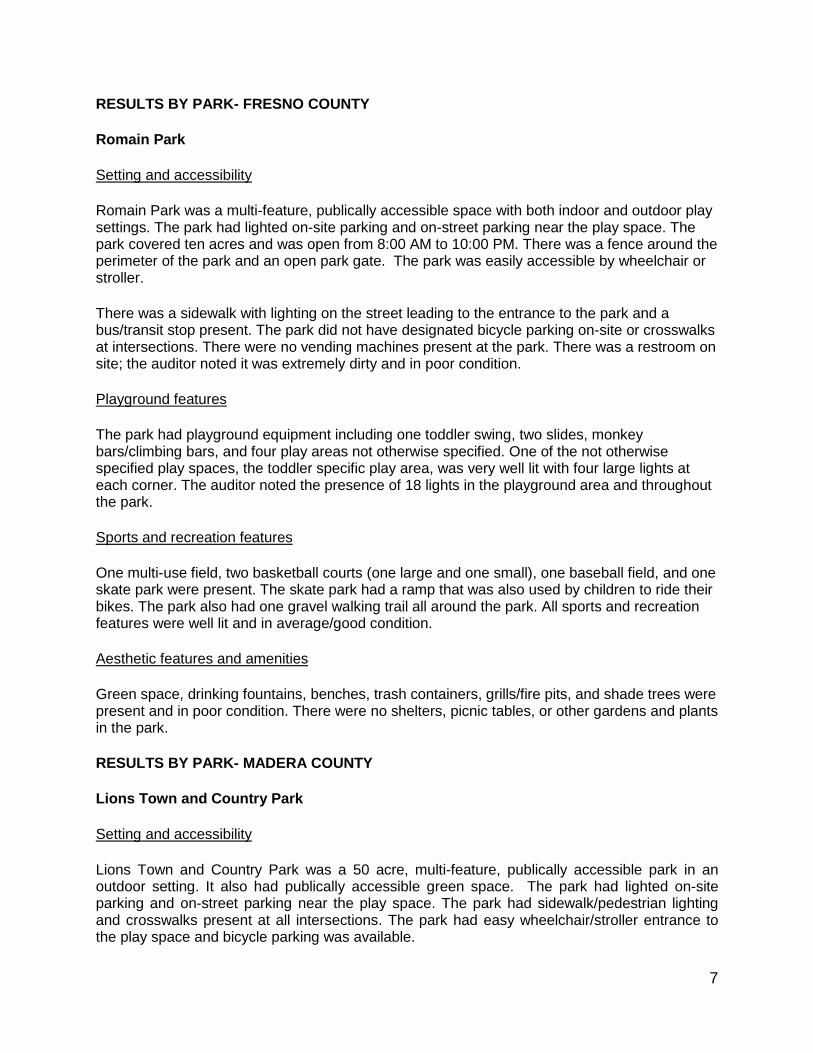
7
RESULTS BY PARK- FRESNO COUNTY
Romain Park
Setting and accessibility
Romain Park was a multi-feature, publically accessible space with both indoor and outdoor play settings. The park had lighted on-site parking and on-street parking near the play space. The park covered ten acres and was open from 8:00 AM to 10:00 PM. There was a fence around the perimeter of the park and an open park gate. The park was easily accessible by wheelchair or stroller.
There was a sidewalk with lighting on the street leading to the entrance to the park and a bus/transit stop present. The park did not have designated bicycle parking on-site or crosswalks at intersections. There were no vending machines present at the park. There was a restroom on site; the auditor noted it was extremely dirty and in poor condition.
Playground features
The park had playground equipment including one toddler swing, two slides, monkey bars/climbing bars, and four play areas not otherwise specified. One of the not otherwise specified play spaces, the toddler specific play area, was very well lit with four large lights at each corner. The auditor noted the presence of 18 lights in the playground area and throughout the park.
Sports and recreation features
One multi-use field, two basketball courts (one large and one small), one baseball field, and one skate park were present. The skate park had a ramp that was also used by children to ride their bikes. The park also had one gravel walking trail all around the park. All sports and recreation features were well lit and in average/good condition.
Aesthetic features and amenities
Green space, drinking fountains, benches, trash containers, grills/fire pits, and shade trees were present and in poor condition. There were no shelters, picnic tables, or other gardens and plants in the park.
RESULTS BY PARK- MADERA COUNTY
Lions Town and Country Park
Setting and accessibility
Lions Town and Country Park was a 50 acre, multi-feature, publically accessible park in an outdoor setting. It also had publically accessible green space. The park had lighted on-site parking and on-street parking near the play space. The park had sidewalk/pedestrian lighting and crosswalks present at all intersections. The park had easy wheelchair/stroller entrance to the play space and bicycle parking was available.
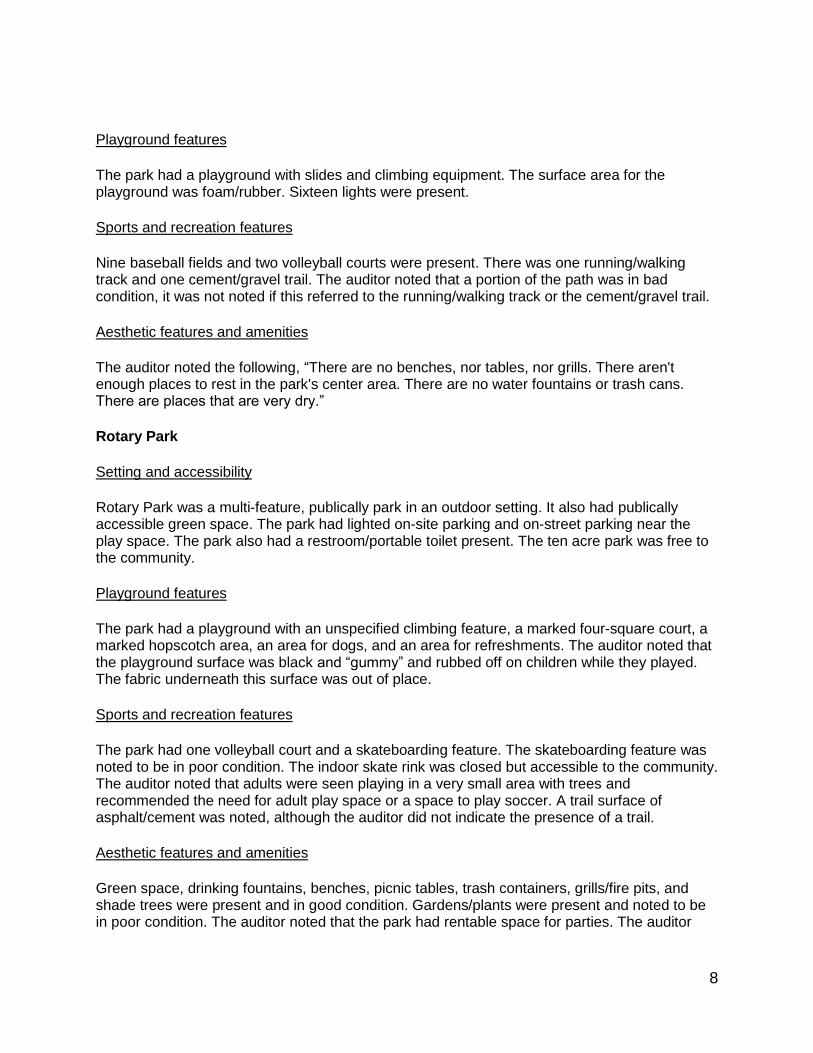
8
Playground features
The park had a playground with slides and climbing equipment. The surface area for the playground was foam/rubber. Sixteen lights were present.
Sports and recreation features
Nine baseball fields and two volleyball courts were present. There was one running/walking track and one cement/gravel trail. The auditor noted that a portion of the path was in bad condition, it was not noted if this referred to the running/walking track or the cement/gravel trail.
Aesthetic features and amenities
The auditor noted the following, “There are no benches, nor tables, nor grills. There aren't enough places to rest in the park's center area. There are no water fountains or trash cans. There are places that are very dry.”
Rotary Park
Setting and accessibility
Rotary Park was a multi-feature, publically park in an outdoor setting. It also had publically accessible green space. The park had lighted on-site parking and on-street parking near the play space. The park also had a restroom/portable toilet present. The ten acre park was free to the community.
Playground features
The park had a playground with an unspecified climbing feature, a marked four-square court, a marked hopscotch area, an area for dogs, and an area for refreshments. The auditor noted that the playground surface was black and “gummy” and rubbed off on children while they played. The fabric underneath this surface was out of place.
Sports and recreation features
The park had one volleyball court and a skateboarding feature. The skateboarding feature was noted to be in poor condition. The indoor skate rink was closed but accessible to the community. The auditor noted that adults were seen playing in a very small area with trees and recommended the need for adult play space or a space to play soccer. A trail surface of asphalt/cement was noted, although the auditor did not indicate the presence of a trail.
Aesthetic features and amenities
Green space, drinking fountains, benches, picnic tables, trash containers, grills/fire pits, and shade trees were present and in good condition. Gardens/plants were present and noted to be in poor condition. The auditor noted that the park had rentable space for parties. The auditor

9
also noted that a small running/walking path was next to the party space, the path was not wide enough for people to pass.
Madera County Courthouse Park
Setting and accessibility
Madera County Courthouse Park was a publically accessible green space with both outdoor and indoor settings. The park had lighted on-site parking and on-street parking near the play space. The park had easy wheelchair/stroller access to the play space, sidewalk/pedestrian lighting, and crosswalks at all intersections. The park also had a bus/transit stop and a restroom/portable toilet.
Playground features
There were no playground features noted at Madera County Courthouse Park.
Sports and recreation features
There were no sports and recreation features noted at Madera County Courthouse Park.
Aesthetic features and amenities
Green space, drinking fountains, benches, trash containers, shade trees, and other gardens and plants were present and in good condition. Picnic tables were present and in poor condition. There were no shelters or grills/fire pits present.
Madera Sunrise Rotary Park
Setting and accessibility
The Madera Sunrise Rotary Park was a multi-feature, publically accessible park adjacent to a school. The park also had publically accessible green space. The park had lighted on-site parking and on-street parking near the play space. Crosswalks were present at all intersections and lighting was present on sidewalks. Wheelchairs and/or strollers were easily able to enter play space.
Playground features
The park had a playground with swings for toddlers and youth. Slides were also present. The surface area of the playground was foam/rubber.
Sports and recreation features
The park had five soccer fields, two baseball fields, and a running/walking track. A trail surface of asphalt/cement was noted, although the auditor did not indicate the presence of a trail. The auditor noted that there was a basketball court next to the school and people often had issues with the police for using it without permission.

10
Aesthetic features and amenities
Green space, shelters, picnic tables, trash containers, grills/fire pits, and shade trees were present and in good condition. Drinking fountains were present and were noted to be old and in poor condition.
Pan-Am Park
Setting and accessibility
Pan-Am Park was a multi-feature publically accessible park with outdoor and indoor settings and an on-site parking area. The sidewalk was lighted and crosswalks were present at all intersections. Wheelchairs and strollers were easily able to access play space.
Playground features
The park had slides; no other playground features were noted. The surface area of the playground was foam/rubber.
Sports and recreation features
The park had one basketball court and one asphalt/cement trail. The auditor noted the presence on an additional basketball court next to a sitting area; the court had a steel bar with signage that noted information about entry and closing.
Aesthetic features and amenities
Shelters, picnic tables, and shade trees were present and in good condition. Green space, drinking fountains, benches, trash containers, and grills/fire pits present and in poor condition. The auditor noted that the benches were only located in front of the playground. The auditor noted the presence of numerous trash cans in the playground area and two trash cans located outside of the playground area.
McNally Park
Setting and accessibility
McNally Park was a single-feature, publically accessible park adjacent to a school. The park had on-street parking located next to the play space and bicycle parking. There were crosswalks present at all intersections and a lighted sidewalk for pedestrians. Wheelchairs and strollers were easily able to access play space.

11
Playground features
The park had a playground with swings for both toddlers and youth, slides, and monkey bars/climbing bars. The surface area of the playground was foam/rubber.
Sports and recreation features
The park had one basketball court.
Aesthetic features and amenities
All features present (i.e. green space, drinking fountains, shelters, benches, picnic tables, trash containers, grills/fire pits, and shade trees) were in good condition.

12
Appendix A: Data tables Table 2. Park Characteristics (Setting, Accessibility, Signage and barriers to entry)
Park Characteristics Romain Park Lions Town and
Country Park Rotary Park Madera County
Courthouse Park Madera Sunrise
Rotary Pan-Am
Park McNally
Park
Setting
Single-feature publically accessible park X
Multi-feature publically accessible park X X X X X
Publically accessible green space X X X X
Adjacent to a school X X
Outdoor setting X
Outdoor and indoor setting X X X X
Accessibility
Parking area on-site X X X X X X
Lighted parking area X X X
On-street parking next to play space X X X X X X
Sidewalk on street leading to entrance X X
Sidewalk/pedestrian lighting present X X X X X X
Wheelchair or stroller can easily enter play space X X X X X X
Bicycle parking X X
Bus/transit stop present X X X
Crosswalks present at all intersections X X X X X
Restroom/portable toilet X X X
Signage and barriers to entry
Signage that indicates the park or play space name X X X X X X
Entrance fee X
Gate/fence partially restricting access to play space X X
Locked fence or other physical barrier that prevents access X X

13
Table 3. Playground features
Playground Features Romain Park Lions Town and
Country Park Rotary Park Madera
Sunrise Rotary Pan-Am Park McNally Park
Swings, toddler X (1) X X
Swings, youth X X
Slides X (2) X X X X
Monkey bars/climbing bars X (2) X
Other climbing feature X X
Marked four-square court
X
Marked hopscotch area X
Other play area X (4) X
Note: The auditors of Lions, Rotary, Sunrise Rotary, Pan-Am, and McNally Parks did not tally the number of features present or the condition of the features in the parks. Instead, the auditors only indicated presence/absence of playground features. It was also unclear whether there was lighting present at these playground areas.

14
Table 4. Sports and recreation features
*Romain Park: All features were noted to be in good condition **Rated in “poor condition” by the auditor ***Did not indicate presence of trail, but selected trail surface
Note: The auditors of Lions, Sunrise Rotary, Pan-Am, and McNally Parks did not indicate the condition of the features or presence of lighting in the parks.
Features Romain Park* Lions Town and
Country Park Rotary Park
Madera Sunrise Rotary Pan-Am Park McNally Park
Fields, soccer only X (5)
Fields, baseball only X (9) X (2)
Fields, multi-use X (1)
Courts, basketball only X (2) X (1) X (1)
Courts, volleyball only X (2) X (1)
Skateboarding features X (1) X**
Running/walking tracks X (1) X (1)
Trails X (1) X (1) *** *** X (1)
Trail surface Gravel Cement and
gravel Asphalt/ cement
Asphalt/ cement
Asphalt/ cement

15
Table 5. Aesthetic features and amenities by condition
Aesthetic features and amenities Romain Park
Lions Town and Country Park** Rotary Park
Madera County Courthouse
Park Madera Sunrise
Rotary Pan-Am Park McNally Park
Green Space Poor Good Good Good Good Poor Good
Drinking fountains Poor Poor Good Good Poor Poor Good
Shelters None Poor * None Good Good Good
Benches Poor Poor Good Good * Poor Good
Picnic tables None Poor Good Poor Good Good Good
Trash containers Poor Poor Good Good Good Poor Good
Grills/fire pits Poor Poor Good None Good Poor Good
Shade trees Poor Good Good Good Good Good Good
Other gardens and plants None None Poor Good * None None
*No response by auditor ** Condition of drinking fountains, shelters, benches, picnic tables, trash containers, and grills/fire pits were noted to be in poor condition and green space and shade trees were noted to be in good condition

16
Table 6. Trash and vandalism
Trash and vandalism Romain Park Lions Town and
Country Park Rotary Park
Madera County Courthouse
Park Madera Sunrise
Rotary Pan-Am
Park McNally Park
No garbage/litter present X X
A little/some garbage/litter X X X X
A lot garbage/litter X
No broken glass present X X X X X X X
No graffiti/tagging present X X X X X X
A little/some graffiti/tagging X
No evidence of alcohol or other drug use X X X X X
A little/some evidence of alcohol or other drug use
X X
No sex paraphernalia present X X X X X X
A little/some sex paraphernalia X
17
Appendix B: Environmental Audit Tool

Evaluation of Healthy Kids, Healthy Communities
Transtria LLC Page 1
Parks and Play Spaces Environmental Audit Tool Play space ID (Transtria use only):
"Play spaces" may refer to parks as well as other play spaces (e.g., playgrounds, pools, greenways).
Play space name:
Address:
Hours of operation: Open Close
No posted hours
Size of play space (acres):
Auditor name:
Community partnership:
Date:
Weather conditions:
Start time: __ __ : __ __ AM PM
End time: __ __ : __ __ AM PM
Auditor name 2:
Section A: Setting, accessibility, vending machines, signage and barriers to entry
Setting Accessibility (cont.)
1. What type of park or play space is this? (Select only one.) 13. Is there a shower/locker room on-site?
No
Yes
1.a. Single-feature publically accessible park Vending machines
1.b. Multi-feature publically accessible park
14. Are there vending machines that sell
beverages? (If no, skip to Question 15)
No
Yes
1.c. Publically accessible green space (i.e., no
features such as sports fields or jungle gyms)
14.a. Water (no additives)
No
Yes
1.d. Other publically accessible space (e.g., street
with temporary play equipment)
14.b. 100% Juice
No
Yes
2. Is the play space adjacent to a school? (If yes, print school name):
No
Yes 14.c. Skim milk
No
Yes
3. What is the setting of the play space? (Circle one.) 14.d. Sports or energy drinks
No
Yes
Indoor Outdoor Indoor and Outdoor 14.e. Diet soda
No
Yes
Accessibility
14.f. Sugar sweetened beverages (e.g., soda,
fruit punch)
No
Yes
4. Is there a parking area on-site? (If no, skip to Question 4)
No
Yes
15. Are there vending machines that sell food
items? (If no, skip to Question 16)
No
Yes
4.a. Is the parking area lighted?
No
Yes 15.a. Chips/crackers/pretzels (baked, low-fat)
No
Yes
5. Is there on-street parking next to the play space?
No
Yes 15.b. Granola bars/cereal bars
No
Yes
6. Is there a sidewalk on the street leading to the
entrance?
No
Yes 15.c. Nuts/trail mix
No
Yes
6.a. Is sidewalk/pedestrian lighting present?
No
Yes 15.d. Reduced fat cookies or baked goods
No
Yes
7. Can a wheelchair or stroller easily enter into the
play space? (No curbs or other barriers)
No
Yes 15.e. Candy, chips, cookies, snack cakes
(sugar, salt, or fat)
No
Yes
8. Is there bicycle parking?
No
Yes Signage and barriers to entry
9. Is there a bike lane, sharrow, or bike signage on
the street(s) adjacent to the play space?
No
Yes
16. Is there signage that indicates the park or
play space name?
No
Yes
10. Is there a bus/transit stop on a street adjacent to
the play space?
No
Yes 17. Is there an entrance fee?
No
Yes
11. Are there crosswalks present at all of the intersections next to the play space?
No
Yes 18. Is there a gate/fence partially restricting access to the play space?
No
Yes
12. Is there a restroom/portable toilet?
No
Yes
19. Is there a locked fence around the perimeter
or other physical barrier that prevents access?
No
Yes
Comments?
Appendix B

Evaluation of Healthy Kids, Healthy Communities
Transtria LLC Page 2
Section B: Playground features
*Do not tally the number of lights. Tally the number of playground features with lighting present.
30. What is the surface for the playground (check all that apply)?
Foam/rubber
Woodchip/mulch
Sand
Grass or dirt
Paved spaces (concrete or asphalt)
Other, specify:
Comments?
For the following items, please take note and document each feature by condition and whether or not there is lighting.
Number of features by condition Number of
features with lighting*
Poor Average/Good Tally Total
Tally Total Tally Total
Indoor Outdoor Indoor Outdoor Indoor Outdoor Indoor Outdoor Outdoor Only
20. Check if no playground features are present in the play space. No playground features (Skip to Section C.) (Leave the items below blank if there are no playground features present.)
Swings/slides/monkey bars/sandboxes/ground games
21. Swings, toddler
22. Swings, youth
23. Slides
24. Monkey bars/climbing bars
25. Other climbing feature Specify:
26. Sandboxes
27. Marked four-square courts
28. Marked hopscotch areas
29a. Other play areas Specify:
29b. Other play areas Specify:

Evaluation of Healthy Kids, Healthy Communities
Transtria LLC Page 3
Section C: Sports and recreation features
For the following items, please take note and document each feature by condition and whether or not there is lighting.
Number of features by condition
Number of features with
lighting*
Poor Average/Good Tally Total
Tally Total Tally Total Indoor Outdoor Indoor Outdoor Indoor Outdoor Indoor Outdoor Outdoor Only
31. Check if no sports or recreation features are present in the play space. No sports or recreation features (Skip to Section D.) (Leave the items below blank if there are no sports or recreation features present.)
Fields/Courts/Pools/Tracks/Trails
32. Fields, soccer only
33. Fields, football only
34. Fields, baseball only
35. Fields, multi-use
36a. Other fields Specify:
36b. Other fields Specify:
37. Courts, basketball only
38. Courts, tennis only
39. Courts, volleyball only
40. Courts, multi-use
41a. Other courts Specify:
41b. Other courts Specify:
42. Pools (> 3ft deep)
43. Wading pools/spray grounds (≤ 3ft deep)
44. Skateboarding features (e.g., ramps, etc.)
45. Exercise stations with
signage
46. Running/walking tracks
47. Trails (If no trails, skip
Questions 47a and 50 below.)
47a. Two-way traffic
on trails?
48. Other features Specify:
49. Other features Specify:
*Do not tally the number of lights. Tally the number of sports/recreation features with lighting present.
50. What is the surface for the trails (choose one)?
Asphalt/concrete
Wood chips/mulch
Gravel
Dirt or grass
Other, specify: Comments?

Evaluation of Healthy Kids, Healthy Communities
Transtria LLC Page 4
Section D: Aesthetic features and amenities (outdoor play spaces only)
Section E: Trash and vandalism (outdoor play spaces only)
Comments?
Please be sure to complete end time for the data collection at the beginning of this form.
For each aesthetic feature and amenity below, document the presence and condition.
Condition of feature or majority of features?
Poor Average/Good Not present
51. Green space
52. Beach
53. Decorative water fountains
54. Drinking fountains
55. Shelters
56. Benches
57. Picnic tables
58. Trash containers
59. Grills/fire pits
60. Fruit and vegetable gardens
61. Shade trees
62. Other gardens and plants
63. Other features Specify:
Indicate the amount of the following types of trash or vandalism.
None A little/Some A lot
64. Garbage/litter
65. Broken glass
66. Graffiti/tagging
67. Evidence of alcohol or other drug use
68. Sex paraphernalia

1
California’s Central Valley – HKHC
Leading Site
Corner Store Environmental Audit
Summary Report
Prepared by Transtria LLC

2
Table of Contents Background ........................................................................................................... 3
Methods ................................................................................................................ 3
Results .................................................................................................................. 4
Appendix A: Store Characteristic Tables .............................................................. 8
Appendix B: Fruit and vegetable availability, price, quality, and quantity ........... 12
Appendix C: Corner Store Environmental Audit Tool .......................................... 14

3
Background
Healthy Kids, Healthy Communities (HKHC) is a national program of the Robert Wood Johnson Foundation (RWJF) whose primary goal is to implement healthy eating and active living policy, system, and environmental change initiatives that can support healthier communities for children and families across the United States. HKHC places special emphasis on reaching children who are at highest risk for obesity on the basis of race/ethnicity, income, and/or geographic location. For more information about HKHC, please visit www.healthykidshealthycommunities.org.
Located in Fresno, California, the Central California Regional Obesity Prevention Program (CCROPP) was selected to lead the local HKHC partnership. CCROPP has chosen to focus its work on developing community advocates for policy and environment change through a community leadership program.
Transtria LLC, a public health evaluation and research consulting firm located in St. Louis, Missouri, is funded by the Robert Wood Johnson Foundation to lead the evaluation and dissemination activities from April 2010 to March 2014. For more information about the evaluation, please visit www.transtria.com/hkhc.
This supplementary enhanced evaluation component focuses on six cross-site HKHC strategies, including: parks and plays spaces, street design, farmers’ markets, corner stores, physical activity standards in childcare settings, and nutrition standards in childcare settings. Communities are trained to use two main methods as part of the enhanced evaluation, direct observation and environmental audits. Tools and training are provided by Transtria staff (see www.transtria.com/hkhc).
In order to better understand the impact of their work in corner stores, representatives of CCROPP chose to participate in the enhanced evaluation data collection activities. CCROPP completed their enhanced evaluation activities for corner stores using the environmental audit method.
Methods
The corner stores environmental audit tool was adapted from the Nutrition Environment Measurement Survey in Stores (NEMS-S), an evidence based tool designed to assess nutrition environments including the availability and pricing differences between healthier and less-healthy options. Environmental audits assess the presence or absence of different features as well as the quality or condition of the physical environment. Overall, this audit attempts to determine the quality of specific corner stores pertaining to the availability of healthy food options, particularly access to fruits and vegetables. An Evaluation Officer from Transtria trained community members on proper data collection methods using the tool.
In this case, the audits were developed to assess the healthy eating supports and barriers that increase access to foods contributing to a healthy lifestyle in corner stores in Central Valley. Six stores were audited in two counties of Central Valley. Three auditors assessed the following stores in Fresno County: Easton Market, Lee's Market, Main General Store, Latino Market, and La Tiendita. These audits were conducted between May 24, 2013 and June 6, 2013. Three auditors assessed La Placita Michoacana in Stanislaus County on May 30, 2013. Transtria staff performed data entry

4
and validation. Double data entry was performed to ensure accuracy of data; percent agreement was 99.9% and all errors were fixed.
Results
Overall Store, Store Exterior, Store Interior All six stores were open daily with operating hours of between 13 (8:00 am-9:00 pm) and 14 hours (7:00 am-9:00 pm). Operating hours for La Placita Michoacana were not provided in the audit. The majority of stores (4) had a legible sign; however, only three stores had an accessible entrance and only four had wide aisles to accommodate strollers and wheelchairs. Three stores (e.g., Easton Market, Lee’s Market, and La Placita Michoacana) were located near a public transit stop. A sidewalk was adjacent to the store entrance of four stores, while five stores had a parking lot adjacent to the entrance. None of the stores had bicycle parking. All six corner stores accepted a form of WIC, SNAP, or EBT. Five of the six stores had at least one exterior sign advertising the availability of WIC, SNAP, and/or EBT use. Easton Market was the only store that lacked WIC, SNAP, or EBT signage on its exterior. In addition, Lee’s Market and La Placita Michoacana were the only two stores that had WIC/SNAP signs near WIC/SNAP approved products inside the store. All stores lacked visible security features (e.g., cameras or guards), and the windows were blocked by bars, signs, or tinting at four of the stores (sometimes a concern to parents or community members who cannot see into the store from the outside). A school was visible from two of the stores, suggesting students of these schools may be able to walk to the corner store to access foods and beverages sold.
Fresh fruits and vegetables Fresh vegetables were available at all corner stores, and fresh fruits were available at five of the six corner stores. Latino Market was the only store without fresh fruits available. The location of fresh produce within the stores varied some of the stores carrying produce in the front of the store and others locating produce in the back of the store. In addition, some stores had produce in both the front and back of the store. Fruit was most often located on a middle or high shelf, whereas vegetables were more often located on a middle or low shelf. La Tiendita displayed fresh produce on a table in the store. The only two stores that identified produce by name and
clearly labeled both the price and unit were Lee’s Market and La Placita Michoacana.
Produce at Main Street General Store
Latino Market in Fresno, CA

5
The most frequently available fruit (found in at least four of the five stores with fruit available) were apples, bananas, and lemons. The most frequently available vegetables (found in at least five of the six stores) were avocados, onions, tomatoes, and cucumbers. La Tiendita had the highest number of unique fruits (8 types) and La Placita Michoacana had the highest number of unique vegetables (15 types). Of the stores with fresh fruits available, Easton Market and Main General Store had the least number of fruits (3 types). Main General Store also had the least number of vegetables available (3 types). The overall quality of the fresh produce varied between stores. The quality of all produce at Lee’s Market and La Placita Michoacana was found to be “average or good quality”. Half of the produce at Easton Market was found to be “poor quality” by the auditor. The quantity of fresh produce also varied greatly between stores and produce item with the majority of produce items being available in medium (3-10 available per fruit or vegetable or large quantities (10 or more available per fruit or vegetable). The quality and quantity of produce was not provided by the auditors at Main General Store, Latino Market, or La Tiendita. Prices of produce items were not provided for La Placita Michoacana. Price Comparison of Most Frequently Available Fruit
Easton Market
Lee’s Market
Main General Store
La Tiendita
Apples $1.49/lb. $0.99/lb. $0.89/lb.
Bananas $0.79/lb. $0.69/lb. $0.99/lb.
Lemons 4 for $1.00 3 for $1.00 7 for $1.00
As shown in the table above, apples were least expensive at La Tiendita, while bananas and lemons were most affordable at Main General Store. In the table below, a price comparison of vegetables was conducted. Avocados were least expensive at Lee’s Market. Onions, tomatoes, and cucumbers cannot be directly compared because the unit in which the item was sold varied by store. Price Comparison of Most Frequently Available Vegetables
Easton Market
Lee’s Market
Main General Store
Latino Market
La Tiendita
Avocados $1.49 each $0.99 each $1.50 each $2.00 each
Onions $0.60/lb. $0.49/lb. $1.00/bunch $0.99/lb.
Tomatoes $1.49/lb. $0.99/lb. $0.89/lb. $1.00/bunch $0.99/lb.
Cucumbers 3 for $1.00 $0.79 each $2.00/lb. $0.50 each
Store Number of different
fruits
Number of different
vegetables
Easton Market 3 7
Lee’s Market 7 7
Main General Store 3 3
Latino Market 0 5
La Tiendita 8 5
La Placita Michoacana 7 15

6
Canned and frozen fruits and vegetables In addition to fresh produce, all six corner stores had both canned fruits and vegetables available, but none of the stores had frozen fruits or vegetables. Three stores (e.g., Easton Market, Latino Market, and La Tiendita) had a limited selection (1-3 types) of canned fruit available, while the remaining three stores had a varied selection (4+ types). All six stores had a varied selection of canned vegetables available. Other foods Nuts, seeds, or dry beans and grain products were available in all six corner stores. Four of the stores carried whole grain products and low-fat or non-fat dairy products, and lean meats, fish, and poultry and low-fat prepared meals (e.g., baked chicken) were available in three of the six stores. Sweet and salty snack (e.g., potato chips, cakes, and candy) were available in all of the corner stores. In addition, ice cream and frozen desserts were found in four of the stores, and regular to high-fat prepared meals, like fried chicken, were available at three stores. All stores had at least two varieties of milk available. Two-percent and whole or vitamin D milk was available at all the corner stores. Lee’s Market and La Tiendita were the only two stores that carried Lactaid™. None of the stores had skim, rice, or soy milk available for purchase. In addition to milk, water, 100% juice, and sugar sweetened beverages were available in all corner stores. Tobacco and alcohol Two stores, La Tiendia and La Placita Michoacana, did not sell tobacco or alcohol products. The remaining four stores sold both tobacco and alcohol products with tobacco products located behind the counter and alcohol products located in the freeze/cooler section in all four of the stores. These four stores also all had alcohol product advertisements present both inside and outside the store. Only Main General Store and Latino Market had tobacco product advertisements present at the store. Both stores had tobacco advertising inside, while Latino Market was the only store to have tobacco advertising outside the store.
Easton Market in Fresno, CA

7
Key Takeaways
About half of the stores lacked accessibility with three stores lacking an accessible entrance and two stores lacking wide aisles to accommodate strollers and wheelchairs.
All six corner stores accepted a form of WIC, SNAP, or EBT, and two stores (Lee’s Market and La Placita Michoacana) had WIC/SNAP signs near WIC/SNAP approved products.
Fresh fruits (3-8 types per store) were available at five of the six corner stores. Fresh vegetables (3-15 types per store) were available at all six stores. Latino Market was the only store without fresh fruits available.
La Tiendita had the highest number of fresh fruits listed on the audit tool (8). La Placita Michoacana had the highest number of fresh vegetables listed on the audit tool (15).
The only two stores that identified produce by name and clearly labeled both the price and unit were Lee’s Market and La Placita Michoacana.
Canned fruits and vegetables were available at all six corner stores, but frozen fruits and vegetables were not available in any store.
Two-percent and whole or vitamin D milk was available at all the corner stores; however, skim milk was not available at any store.
Four of the six stores sold both tobacco and alcohol products.

8
Appendix A. Store characteristic tables
Vendor Characteristic Easton Market
Lee's Market
Main General
Store Latino Market
La Tiendita
La Placita Michoac-ana
Fresno County
Fresno County
Fresno County
Fresno County
Fresno County
Stanislaus County
Overall Store
Hours of operation: Sunday 7am-9pm 8am-10pm 8am-9pm 8am-10pm 7am-9pm *
Hours of operation: Monday 7am-9pm 8am-10pm 8am-9pm 8am-10pm 7am-9pm *
Hours of operation: Tuesday 7am-9pm 8am-10pm 8am-9pm 8am-10pm 7am-9pm *
Hours of operation: Wednesday 7am-9pm 8am-10pm 8am-9pm 8am-10pm 7am-9pm *
Hours of operation: Thursday 7am-9pm 8am-10pm 8am-9pm 8am-10pm 7am-9pm *
Hours of operation: Friday 7am-9pm 8am-10pm 8am-9pm 8am-10pm 7am-9pm *
Hours of operation: Saturday 7am-9pm 8am-10pm 8am-9pm 8am-10pm 7am-9pm *
Store exterior
Legible signs to identify store X X X X
Accessible entrance X X X
Seating X
Windows blocked by bars, signs, or tinting X X X X
Public transit stop visible from the store entrance X X X
Sidewalk adjacent to store entrance X X X X
Parking lot adjacent to store entrance X X X X X
Store accepts WIC/SNAP/EBT X X X X X X
Sign for WIC X X X
Sign for SNAP/Food stamps X X X X
Sign for EBT X X X
A school is visible from the store X X
Type of school: Primary X
Type of school: Secondary X X
*Store open on this day but hours of operation not given

9
Vendor Characteristic Easton Market
Lee's Market
Main General
Store Latino Market
La Tiendita
La Placita Michoacana
Fresno County
Fresno County
Fresno County
Fresno County
Fresno County
Stanislaus County
Employee characteristics
Employee use gloves when handling food X
Employees greet customers X X X X
Store interior
ATM inside store X
Wide aisles to accommodate strollers and wheelchairs X X X X
Licenses/permits visibly displayed X X
WIC/SNAP signs near WIC/SNAP approved products X X
Tobacco and alcohol
Store sells tobacco products X X X X
Tobacco advertisements present X X
Tobacco advertisements inside the store X X
Tobacco advertisements outside the store X
Tobacco products located behind counter X X X X
Store sells alcohol products X X X X
Alcohol advertisements present X X X X
Alcohol advertisements inside the store X X X X
Alcohol advertisements outside the store X X X X
Alcohol products in the freezer/cooler section X X X X
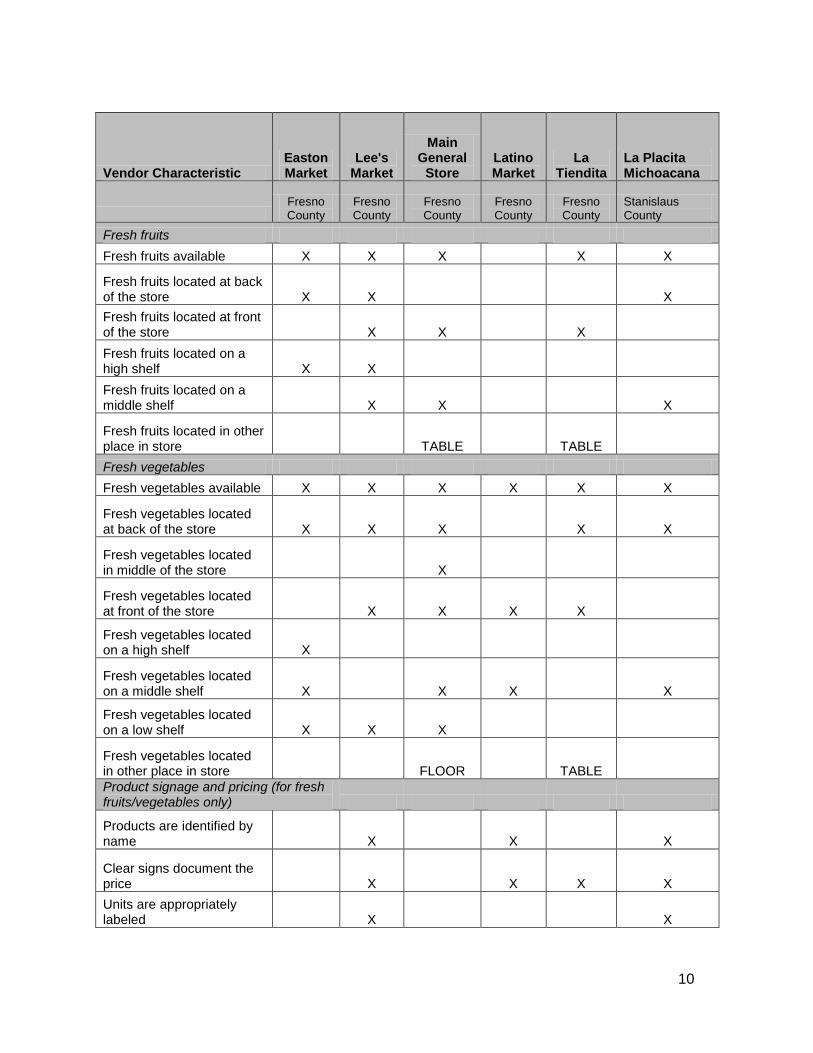
10
Vendor Characteristic Easton Market
Lee's Market
Main General
Store Latino Market
La Tiendita
La Placita Michoacana
Fresno County
Fresno County
Fresno County
Fresno County
Fresno County
Stanislaus County
Fresh fruits
Fresh fruits available X X X X X
Fresh fruits located at back of the store X X X
Fresh fruits located at front of the store X X X
Fresh fruits located on a high shelf X X
Fresh fruits located on a middle shelf X X X
Fresh fruits located in other place in store TABLE TABLE
Fresh vegetables
Fresh vegetables available X X X X X X
Fresh vegetables located at back of the store X X X X X
Fresh vegetables located in middle of the store X
Fresh vegetables located at front of the store X X X X
Fresh vegetables located on a high shelf X
Fresh vegetables located on a middle shelf X X X X
Fresh vegetables located on a low shelf X X X
Fresh vegetables located in other place in store FLOOR TABLE
Product signage and pricing (for fresh fruits/vegetables only)
Products are identified by name X X X
Clear signs document the price X X X X
Units are appropriately labeled X X

11
Vendor Characteristic Easton Market
Lee's Market
Main General
Store Latino Market
La Tiendita
La Placita Michoacana
Fresno County
Fresno County
Fresno County
Fresno County
Fresno County
Stanislaus County
Canned/frozen fruits/vegetables
Limited canned fruits (1-3 types) X X X
Variety canned fruits (4+ types) X X X
Variety canned vegetables (4+ types) X X X X X X
No frozen fruits available X X X X X X
No frozen vegetables available X X X X X X
Other foods
Whole grains (e.g. bread, flour, oatmeal, brown rice, pasta) X X X X
Other grain products (e.g. white breads, rice, pasta) X X X X X X
Low-fat or non-fat dairy foods (e.g. low-fat yogurts or cheeses) X X X X
Lean meats, fish, poultry X X X
Nuts, seeds, or dry beans X X X X X X
Low-fat prepared meals (baked chicken) X X X
Potato chips/corn chips/ popcorn X X X X X X
Ice cream/frozen desserts X X X X
Cakes/cookies/doughnuts X X X X X X
Candy/chocolate X X X X X X
Regular to high-fat prepared meals (e.g. fried chicken) X X X
Milk available at store X X X X X X
1% milk X X
2% milk X X X X X X
Whole or Vitamin D milk X X X X X X
Flavored whole milk X
Flavored skim, 1%, or 2% milk X X
Lactaid X X
Water X X X X X X
100% juice X X X X X X
Sugar sweetened beverages X X X X X X

12
Appendix B. Fruit and vegetable availability, price, quality, and quantity
Produce Item
Easton Market Lee's Market Main General
Store La Tiendita La Placita Michoacana
Fresno County Fresno County Fresno County Fresno County Stanislaus County
Price Unit Quality Quantity Price Unit Quality Quantity Price Unit Price Unit Unit Quality Quantity
Fruits:
Apples $1.49 Per lb. Good A lot $0.99 Per lb. $0.89
Per lb. Per lb.* Good* A lot*
Bananas $0.79 Per lb. Good Some $0.69 Per lb. $0.99
Per lb. Per lb. Good A lot
Cantaloupe $3.50 Each Poor Few Each Good* Some*
Mangos $1.49 Each Good A lot $1.50 Each Each Good A lot
Nectarines 3/$1.00 Each Good A lot
Oranges 2/$1.00 Each Good A lot $0.50 Per lb. Per lb. Good A lot
Papayas $0.99 Per lb.
Pineapples $3.99 Each Each Good Some
Watermelon $5.99 Each Good Some
Lemons 4/$1.00 Each Poor A lot 3/$1.00 Each Good A lot 7/$1.00 Per
lb./Each Good A lot
Limes 3/$1.00 Each Good A lot $1.00 Bunch
Plutan $0.99 Per lb.
*Only one of three auditors indicated this selection

13
Produce Item
Easton Market Lee's Market Main General
Store Latino Market La Tiendita La Placita Michoacana
Fresno County Fresno County Fresno County Fresno County Fresno County Stanislaus County
Price Unit Quality Quantity Price Unit Quality Quantity Price Unit Price Unit Price Unit Unit Quality Quantity
Vegetables:
Avocados $1.49 Each Good A lot $0.99 Each Good Some $1.50 Each $2.00 Each Each Good A lot
Broccoli Per lb. Good Few
Cabbage Per lb. or box/bag Good *
Carrots $0.65 Per lb. Poor A lot $0.99 Box/bag Good A lot Box/bag or
Each Good *
Cauliflower Each Good A lot
Celery Bunch or box/bag Good Few
Green peppers $1.49 Per lb. Poor A lot $0.99 Per lb.
Per lb. or each Good A lot
Lettuce - Romaine $0.99 Each Good Some Each Good Few
Onions $0.60 Per lb. Good A lot $0.49 Per lb. $1.00 Bunch $0.99 Per lb. Per lb. Good* A lot
Radishes Per lb. or box/bag Good A lot
Red peppers $1.49 Per lb. Good A lot Per lb. Good Some*
Summer squash $0.99 Per lb. Per lb. Good A lot
Tomatoes $1.49 Per lb. Good Some $0.99 Per lb. Good A lot $0.89 Per lb. $1.00 Bunch $0.99 Per lb. Per lb. Good A lot
Cucumber 3/$1.00 Each Poor A lot $0.79 Each Good A lot $2.00 Per lb. $0.50 Each Per lb. Good A lot
Potatoes $1.99 Box/bag Good $3.00 Box/bag $1.99 Box/bag Per lb. Good A lot
Other produce found at corner stores: tomatillo, jalapeño, zucchini, chayote, Serrano pepper, pasilla, cilantro, ginger
*Disagreement between three auditors
California’s Central Valley Healthy
Kids, Healthy Communities
Farmers’ Markets Enhanced Evaluation
Summary Report
Prepared by Transtria LLC

Table of Contents
Background ................................................................................................................................. 3
Methods ...................................................................................................................................... 3
Results ........................................................................................................................................ 4
Appendix A: Farmers’ Markets Characteristics Tables ................................................................ 9
Farmers’ Market Operations ................................................................................... 9
Hours and Frequency of Operation ....................................................................... 10
Market Features .................................................................................................... 11
Farmers’ Market Vendor Characteristics ............................................................... 12
Fresh, Canned, Frozen Produce and Signage ...................................................... 13
Other Foods and Milk Sold at Farmers’ Markets ................................................... 14
Fresh Fruit: Availability, Price, Quality ................................................................... 15
Fresh Vegetables: Availability, Price, Quality ........................................................ 18
Appendix B: Farmers’ Markets Environmental Audit Tool .......................................................... 21

BACKGROUND
Healthy Kids, Healthy Communities (HKHC) is a national program of the Robert Wood Johnson
Foundation (RWJF) whose primary goal is to implement healthy eating and active living policy,
system, and environmental change initiatives that can support healthier communities for
children and families across the United States. Healthy Kids, Healthy Communities places
special emphasis on reaching children who are at highest risk for obesity on the basis of
race/ethnicity, income, and/or geographic location.
Central Valley, California was selected as one of 49 communities to participate in HKHC, and
the Central California Regional Obesity Prevention Program (CCROPP) is the lead agency for
their community partnership, California’s Central Valley Healthy Kids, Healthy Communities.
Central Valley has chosen to focus its work on farmers’ markets, corner stores, and parks and
play spaces. Transtria LLC, a public health evaluation and research consulting firm located in
St. Louis, Missouri, is funded by the Robert Wood Johnson Foundation to lead the evaluation
and dissemination activities from April 2010 to March 2014. For more information about the
evaluation, please visit www.transtria.com.
In order to better understand the impact of their work in farmers’ markets, representatives from
California’s Central Valley Healthy Kids, Healthy Communities chose to participate in the
enhanced evaluation data collection activities. This supplementary evaluation focuses on the six
cross-site HKHC strategies, including: parks and play spaces, active transportation, farmers’
markets, corner stores, physical activity standards in childcare settings, and nutrition standards
in childcare settings. Communities use two main methods as part of the enhanced evaluation,
direct observation and environmental audits. Central Valley chose to collect data on farmers’
markets using the environmental audit method.
METHODS
The farmers’ market environmental audit tool was modified from three existing environmental
audit tools including the Farmers’ Market Vendor Evaluation (created by Monika Roth), Farmers’
Market Evaluation, Mystery Shopping-Farmers’ Market (created by marketumbrella.org), and
Nutrition Environment Measurement Survey-NEMS (created by Glanz et al.). Environmental
audits assess the presence or absence of different features as well as the quality or condition of
the physical environment. The tool captures overall market operations (e.g., months, days and
hours of operation, accessibility, government nutrition assistance programs), vendor display
areas (e.g., space and equipment), product signage and pricing (e.g., clear signs, unit and price
labeled, discounts for larger sales), frozen/canned fruits and vegetables (e.g., quantity and
variety of frozen or canned fruits and vegetables), other foods (e.g., availability of healthier
options and foods with minimal nutritional value) and the availability, pricing, quality, and
quantity of fresh fruits and vegetables.

Each audit tool was completed for one farmers’ market. Fifteen markets were selected
throughout Fresno, Madera, and Stanislaus counties in Central Valley, California for data
collection. An Evaluation Officer from Transtria LLC trained community members and
partnership staff on proper data collection methods. Data collection was completed between
May 19, 2013 and June 8, 2013. One Transtria staff member entered the data and a second
Transtria staff member conducted validity checks to ensure accuracy and validity of the data. A
total of 8787 data points were checked and no errors were found (100% correct).
RESULTS
Operations
Across Central Valley, farmers’ markets were open between three and twelve months of the
year, and between one and five days per week. Nine farmers’ markets were open year round
(January through December), one farmers’ market was open three months of the year (April
through June), and five markets were open between five and ten months of the year. Five
farmers’ markets were not open during January through March, four markets were not open
during November and December, and one market was not open during July and August (see
Appendix A, Table 1).
The number of days and hours of operation per week varied across the fifteen farmers’ markets.
Farmers’ markets were open one day per week (n=7), two days per week (n=5), three days per
week (n=2), or five days per week (n=1). Seven farmers’ markets were open on Wednesdays,
six markets were open on Saturday, and five markets were open on Fridays. Three markets
were open on Sunday, Tuesday, and Thursday. Only one farmers’ market was open on Monday
(see Appendix A, Table 2).
The hours of operation for the fifteen farmers’ markets ranged from 2-12.5 hours per day and
from 2-37.5 hours per week. Markets opened as early as 5:30 AM and closed as late as 6:00
PM. El Rematito was open the most hours per week, with hours of operation between 5:30 AM
and 6:00 PM, three days per week (total of 37.5 hours per week). The Mayfair School Farm
Stand was open the fewest hours per week, with hours of operation between 2:00 PM and 4:00
PM, one day per week (total of 2 hours per week). Seven farmers’ market opened early
between 5:30 AM and 7:00 AM, two markets opened at 8:00 AM, and two markets opened at
10:00 AM. Two other markets did not open until later in the afternoon at 2:00 PM and 3:00 PM,
respectively. Four farmers’ markets stayed opened as late as 3:30 PM or 4:00 PM, and five
markets closed between 12:00 PM or 2:00 PM, respectively. El Rematito and the Vineyard were
the only markets that remained open extended hours until 6:00 PM. It should be noted that the
Vineyard was only open until 6:00 PM on Wednesdays, while the Saturday hours of operation
were between 7:00 AM and 12:00 PM. The Manchester Center Farmers’ Market was reported
open one day per week from 10:00 AM until dusk. Ruiz Produce operated as a mobile farmers’
market was open five days per week; hours of operation were not available. As a mobile

farmers’ market, Ruiz Produce operated Monday through Friday at one of five selected local
elementary schools (see Appendix A, Table 2).
Market Features
Features available at all fifteen farmers’ markets included an accessible entrance, room to
maneuver around the market, and a parking lot adjacent to each market. Security features were
available at seven farmers’ markets; security at one market was reported as school cameras,
and security at one market was reported as four guards and ten staff. An on-site market
manager was available at twelve markets, market maps were available at two markets, seating
was available at eight markets, an information booth was available at ten markets, and ten
markets provided legible signs identifying their market name. The signage for one market
included the market schedule, regulations, and hours and days. Six markets held additional
events or activities (e.g., live music, yoga); auditors reported that additional events or activities
were not always available at one farmers’ market. An automated teller machine (ATM) was
available at six markets; the ATM access at one market included credit accepted from phone
apps. A public transit stop was visible from each of ten markets, however public transportation
service was not available on Sundays near one market. Other features reported at three
markets included: parking/parking garage, ample parking, access through vendors, multiple
entries, and access to the vendors (see Appendix A, Table 3).
Purchasing Discounts for Low Income Customers
Ten farmers’ markets accepted WIC/SNAP/EBT benefits. Seven of the ten markets provided
signs for SNAP/food stamp benefits; only three of the ten markets provided signs for WIC
benefits. A token system was used by WIC/SNAP/EBT customers for purchases at seven
markets. Six markets accepted a variety of other discounts. As reported for the Fresno Farmers’
Market, if an EBT/SNAP customer swipes $5.00, the customer will receive a $2.00 credit. The
Fresno Farmer’s Market also offered a Double Dollar discount for EBT/SNAP/CalFresh
recipients, where every $1.00 spent yields a $0.40 match/voucher for produce. The SNAP/EBT
customers used a debit card system and not tokens at the Fresno Farmer’s Market. The
discount offered at the Market on Kern was reported as a market match program and
SNAP/EBT customers used cards similar to tokens. Some vendors offered bulk purchases at
the Kaiser Permanente Farmers’ Market. At the Flea Market, customers were able to ask for a
wholesale discount; and vendors sold produce at reduced prices if/when the fruit had ripened in
the heat. Ruiz Produce offered coupons for students (see Appendix A, Table 3).
Vendor Characteristics
Across the fifteen farmers’ markets in Central Valley, the total number of participating vendors
ranged from one to over seven hundred. Fresh produce vendors made up at least 50-100% of
participating vendors at eight markets, 26-49% of participating vendors at one market, and
≤25% of participating vendors at six markets. Between one and ten vendors sold both produce
and other products at eleven markets. At eight markets, all fresh produce vendors offered a

sufficient amount of produce for their space. Most of the fresh produce vendors at six markets
offered a sufficient amount of produce for their space. An insufficient amount of produce was
reported for vendor space at one market. Signage and pricing were provided to identify all fresh
fruit and vegetable products at one farmers’ market, and most or some fresh fruit and vegetable
products at twelve markets. Signage and pricing to identify fresh fruit and vegetable products
was not available at two markets. Discounts for larger sales were available from all vendors at
four markets and some vendors at eight markets. Vendors at three markets did not offer
discounts for larger sales (see Appendix A, Table 4).
Visible signs that displayed farmer’s/business’ name were available for most or all of the
vendors at nine markets, some of the vendors at three markets, and none of the vendors at
three markets. Power cords were taped down to prevent tripping for all vendor spaces at four
markets, some vendor spaces at three markets, and none of the vendor spaces at six markets
(data for power cords were not available for two markets). Most or all of the vendor displays at
thirteen farmers’ markets provided clean and well-organized displays (data was not reported for
two farmers’ markets).
Additional (translated) comments reported specifically for the Flea Market stated that the tables
and floor area near a Chinese food stall were not clean, and that the people responsible for
providing service at the Chinese food stall were not able to provide change for purchases. In
other areas where food was sold, vendors were not available. There was poor hygiene and a
lack of accessible trash cans at another vendor stall where gifts type items were sold. Benches
were not available and there was a lack of shade along walkways in the Flea Market.
Availability of nutrient-dense and minimally nutritious food
Canned fruits, canned vegetables, and frozen fruits were not offered at any of the fifteen
farmers’ markets in Central Valley. Two markets offered four or more types of frozen vegetables
and thirteen markets did not offer frozen vegetables. Nutrient-dense and healthier foods
available at the markets included high-fiber, whole grain foods (n=9 markets), lean
meats/fish/poultry (n= 3 markets), nuts/seeds/dry beans (n=12 markets), and low-fat prepared
meals (n=6 markets). Lentils, garbanzo beans, peanuts, almonds, walnuts, and semilla de
caladade (seed) were specifically identified as the types of nuts/seeds/dry beans available at
three markets. Cheese would soon be available in one market. Auditors reported other available
nutrient-rich and healthier food at eight markets, such as roasted corn on the cob, dried fruit,
chopped fruit, seviche, café/pies, abas, polen, and avas, roasted chicken, clam chowder, lumpia
(type of Asian spring roll), cranberry beans, black beans, pumpkin seeds, pecans, walnuts, and
peanuts (see Appendix A, Table 5 and Table 6)
Milk was sold at two farmers’ markets. Several types of milk were available for sale at one
market, including skim, 2%, whole, flavored whole, rice, soy, and Lactaid® milk. The other
market only sold whole milk or flavored whole milk (see Appendix A, Table 6).

Each of the fifteen farmers’ markets sold at least one type of minimally nutritious food item, such
as salty food, ice cream/frozen dessert, sweet foods, candy/chocolate, and/or regular to high-fat
prepared meals. One farmers’ market only sold salty foods and the remaining fourteen markets
sold between three and six foods with minimal nutritional value. Eight markets offered other
minimally nutritious foods, such as cotton candy, gorditas (small cake made with masa harina,
stuffed with cheese, meat, or other fillings), pupusas (stuffed tortilla), tacos dorados, loncheras
(lunch boxes), churros (Spanish donut), elotes (corn on the cob), frescas con crema
(strawberries with cream), or yogurt. Auditors reported abas, lentil, pistacious, kettlecorn,
hotdogs, fries, lemonade, smoothies, peanut brittle, café, cakes/pies, and peas as other
minimally nutritious foods available at one market (see Appendix A, Table 6).
Availability and quality of fresh produce
A wide variety of fresh produce was available in Central Valley farmers’ markets. Across all
fifteen farmers’ markets, as many as 31 different types of fresh fruits and 64 different types of
fresh vegetables were available. All fresh fruit and vegetables sold in all farmers’ markets were
rated in ‘good’ quality, with the exception of peaches in one market. Twelve farmers’ markets
offered large quantities of most or all types of fresh fruits. Some fresh fruits, such as
cantaloupes, papaya, bananas, oranges, and peaches were less available at four markets. The
fewest quantities of pineapples, watermelon, cantaloupe, apples, or raspberries were available
at three farmers’ markets. Five markets offered large quantities of more or all types of fresh
vegetables and six markets offered some limited quantities of fresh vegetables. One market
offered eight types of vegetables, with the fewest quantities of carrots and broccoli. Quantity
was not available for three markets. Additionally, five markets offered a variety of dried fruits
(apricots, mango, raisins), coconut, chorimoya (custard), and/or cactus. Seven markets also
offered a variety of fresh herbs, such as cilantro, basil, mint, rosemary, thyme, tarragon, garlic,
ginger, and purslane (see Appendix A, Table 7 and Table 8).
Cost of produce
Produce prices varied greatly across ten of the farmers’ markets in Central Valley; produce
prices were not reported or available for five markets. Produce was sold by the bag or box,
pound, or individual or multiple unit items, and ranged in price from $0.50 -$16.00 for fresh fruit,
and $0.05-$3.00 for fresh vegetables. The least expensive fruits were nectarines, peaches,
plums and bananas (each sold for $0.50 per pound). Apples and peaches were also available
individually for $0.50 per each at two other markets. The most expensive fruits were
strawberries ($16.00 per four-two pound boxes), followed by blueberries ($8.00 per pound) and
raspberries ($8.00 per bag/box). The least expensive vegetables were carrots ($0.05 per each),
onions ($0.50 per pound), and sweet potatoes ($0.75 per 3 pounds). Tomatoes and onions
were also available for $0.75 per pound, and individual artichokes for $0.75 per each. The most
expensive vegetables were avocados and spinach (each sold for $3.00 per bag/box); beans,
green peppers, and tomatoes (each sold for $3.00 per pound); and kale ($3.00 per bunch) (see
Appendix A, Table 7 and Table 8).

Key Takeaways
Nine farmers’ markets were open year round, five markets were open between 5-10 months per year, and one market was open 3 months per year.
One market was open 5 days per week, seven markets were open 1 day per week, and seven markets were open between 2-3 days per week.
Seven markets opened as early as 5:30-7:00 AM, and two markets closed as late as 6:00 PM.
Ten farmers’ markets accepted WIC/SNAP/EBT (CalFresh) benefits.
Other markets offered discounts for larger/bulk sales, double dollar discounts, matched voucher discounts, wholesale discounts, and reduced prices for over-ripened produce.
Healthier food items, such as frozen vegetables; high-fiber, whole grain foods, lean meats/fish/poultry; nuts/seeds/beans, and low-fat prepared meals were available at several markets.
Milk was available at two markets; one market offered a variety of milk options, while one market only offered whole milk and flavored whole milk.
Foods with minimal nutritional value were available at fifteen markets, including salty foods, ice cream/frozen desserts, sweet foods, candy/chocolate, and regular to high-fat prepared meals.
A wide variety of fresh produce was available across all fifteen farmers’ markets, including 31 different types of fresh fruits and 64 different types of fresh vegetables.
All fresh produce was of ‘good’ quality, except peaches at one market.

Appendix A: Farmers’ Market Characteristics Tables
Table 1. Farmers' Market Operations
Months of Operation Fres
no F
armer
s' M
arke
t
Man
ches
ter C
enter F
arm
ers' M
arke
t
Che
rry Au
ction
Flea
Mar
ket
The
Mar
ket o
n Ke
rn
Old T
own
Clovis Fa
rmer
s' M
arke
t
Kaise
r Per
man
ente F
armer
s' M
arke
t
"Hea
lthy Hab
its" Fa
rmer
s' M
arke
t
Farm
ers' M
arke
t on
Par
k Place
May
fair
Sch
ool F
arm
Sta
nd
The
Viney
ard
Mad
era
Flea
Mar
ket D
ay 1
Mad
era
Flea
Mar
ket D
ay 2
Mod
esto
Far
mer
s' M
arke
t
El R
emat
ito
Rui
z Pr
oduc
e
Overall Market
Months of operation: January X X X X X X X X X X
Months of operation: February X X X X X X X X X X
Months of operation: March X X X X X X X X X X
Months of operation: April X X X X X X X X X X X X X X
Months of operation: May X X X X X X X X X X X X X X X
Months of operation: June X X X X X X X X X X X X X X X
Months of operation: July X X X X X X X X X X X X X
Months of operation: August X X X X X X X X X X X X
Months of operation: September X X X X X X X X X X X X X X
Months of operation: October X X X X X X X X X X X X X
Months of operation: November X X X X X X X X X X X
Months of operation: December X X X X X X X X X X X
Days of operation: Sunday X X X
Days of operation: Monday X
Days of operation: Tuesday X X X
Days of operation: Wednesday X X X X X X X
Days of operation: Thursday X X X
Days of operation: Friday X X X X X
Days of operation: Saturday X X X X X X

Table 2. Hours and Frequency of Operation
Vendor Characteristic Fresn
o Far
mers
' Mark
et
Man
ches
ter C
enter F
armer
s' M
arke
t
Cher
ry A
uction
Flea
Mark
et
The M
arke
t on
Kern
Old T
own C
lovis Farm
ers' M
arke
t
Kaise
r Per
man
ente F
armers
' Mark
et
"Hea
lthy Hab
its" Fa
rmer
s' M
arke
t
Farmers
' Mark
et on
Par
k Place
May
fair
Sch
ool F
arm
Sta
nd
The V
iney
ard
Mad
era F
lea
Mar
ket D
ay 1
Mad
era F
lea
Mar
ket D
ay 2
Mod
esto
Farm
ers' M
arke
t
El R
emat
ito
Ruiz
Pro
duce
Sunday Hours
5:30AM-
6PM
Monday Hours *
Tuesday Hours
7AM-
2PM
6:30AM-
3:30PM *
Wednesday Hours
10AM-
2:30PM
8AM-
1:30PM
3PM-
6PM
6AM-
4PM
6AM-
4PM *
Thursday Hours
7AM-
2PM
7AM-
1PM *
Friday Hours
10AM-
DUSK
2PM-
4PM
5:30AM-
6PM *
Saturday Hours
7AM-
2PM
6:30AM-
3:30PM
8AM-
1PM
7AM-
12PM
7AM-
1PM
5:30AM-
6PM
Frequency of operation: 1 day a
week X X X X X X X
Frequency of operation: 2-6 days a
week X X X X X X X X
*Did not indicate hours of operation
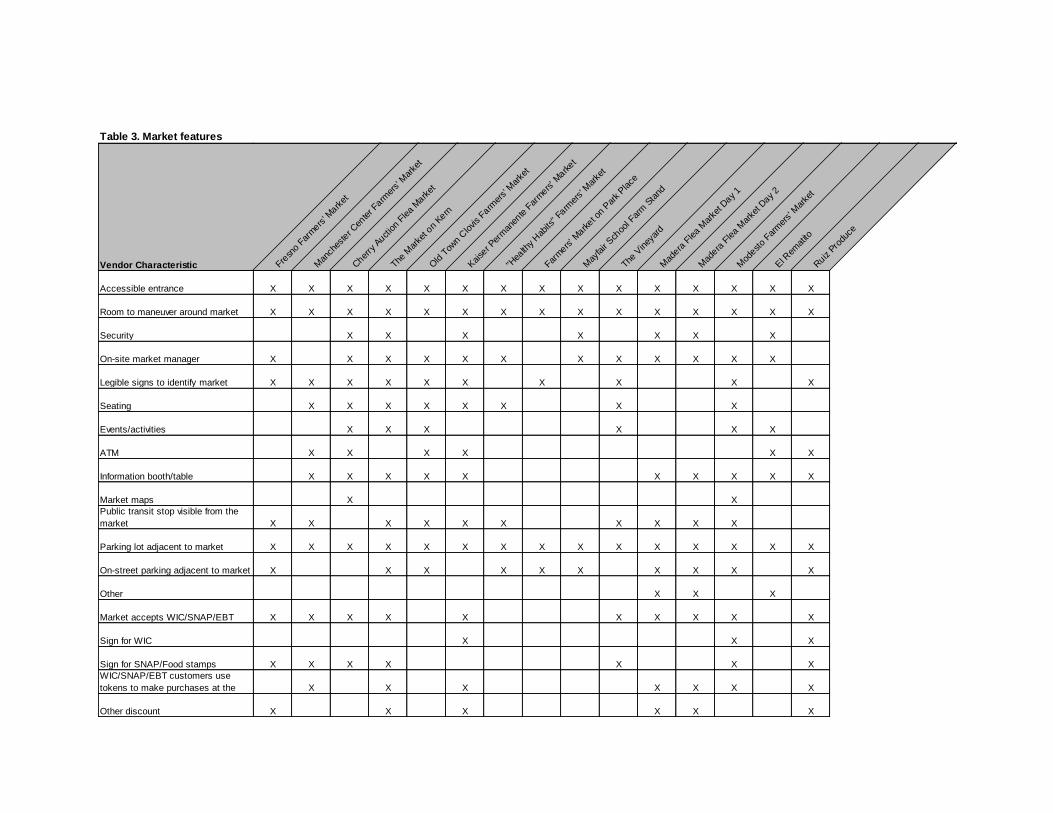
Table 3. Market features
Vendor Characteristic Fresn
o Far
mers
' Mark
et
Man
ches
ter C
enter F
armer
s' M
arke
t
Cher
ry A
uction
Flea
Mark
et
The M
arke
t on
Kern
Old T
own C
lovis Farm
ers' M
arke
t
Kaise
r Per
man
ente F
armers
' Mark
et
"Hea
lthy Hab
its" Fa
rmer
s' M
arke
t
Farmers
' Mark
et on
Par
k Place
May
fair
Sch
ool F
arm
Sta
nd
The V
iney
ard
Mad
era F
lea
Mar
ket D
ay 1
Mad
era F
lea
Mar
ket D
ay 2
Mod
esto
Farm
ers' M
arke
t
El R
emat
ito
Ruiz
Pro
duce
Accessible entrance X X X X X X X X X X X X X X X
Room to maneuver around market X X X X X X X X X X X X X X X
Security X X X X X X X
On-site market manager X X X X X X X X X X X X
Legible signs to identify market X X X X X X X X X X
Seating X X X X X X X X
Events/activities X X X X X X
ATM X X X X X X
Information booth/table X X X X X X X X X X
Market maps X X
Public transit stop visible from the
market X X X X X X X X X X
Parking lot adjacent to market X X X X X X X X X X X X X X X
On-street parking adjacent to market X X X X X X X X X X
Other X X X
Market accepts WIC/SNAP/EBT X X X X X X X X X X
Sign for WIC X X X
Sign for SNAP/Food stamps X X X X X X X
WIC/SNAP/EBT customers use
tokens to make purchases at the X X X X X X X
Other discount X X X X X X

Table 4. Farmers' Market Vendor Characteristics
Vendor Characteristic Fresn
o Far
mers
' Mark
et
Man
ches
ter C
enter F
armer
s' M
arke
t
Cher
ry A
uction
Flea
Mark
et
The M
arke
t on
Kern
Old T
own C
lovis Farm
ers' M
arke
t
Kaise
r Per
man
ente F
armers
' Mark
et
"Hea
lthy Hab
its" Fa
rmer
s' M
arke
t
Farmers
' Mark
et on
Par
k Place
May
fair
Sch
ool F
arm
Sta
nd
The V
iney
ard
Mad
era F
lea
Mar
ket D
ay 1
Mad
era F
lea
Mar
ket D
ay 2
Mod
esto
Farm
ers' M
arke
t
El R
emat
ito
Ruiz
Pro
duce
Number of vendors who sell only
produce 4 28 110 8 19 17 1 10 1 14 24 9 35 40+ 1
Number of vendors who sell produce
and other products 1 6 10 4 9 1 0 3 0 2 1 0 10 1
Number of vendors who sell no
produce 0 3 600 7 62 7 0 9 0 4 78 181 31 550 0
Amount of produce sufficient for
vendor space: None X
Amount of produce sufficient for
vendor space: Most X X X X X X
Amount of produce sufficient for
vendor space: All X X X X X X X X
Visible signs with name: None X X X
Visible signs with name: Some X X X
Visible signs with name: Most X X X X
Visible signs with name: All X X X X X
Clean and well-organized displays:
Most X X X X X
Clean and well-organized displays:
All X X X X X X X X
Power cords taped down to prevent
tripping: None N/A X X X X X N/A X
Power cords taped down to prevent
tripping: Some X X X
Power cords taped down to prevent
tripping: All X X X X

Table 5. Fresh, Canned, Frozen Produce and Signage
Vendor Characteristic Fresn
o Far
mers
' Mark
et
Man
ches
ter C
enter F
armer
s' M
arke
t
Cher
ry A
uction
Flea
Mark
et
The M
arke
t on
Kern
Old T
own C
lovis Farm
ers' M
arke
t
Kaise
r Per
man
ente F
armers
' Mark
et
"Hea
lthy Hab
its" Fa
rmer
s' M
arke
t
Farmers
' Mark
et on
Par
k Place
May
fair
Sch
ool F
arm
Sta
nd
The V
iney
ard
Mad
era F
lea
Mar
ket D
ay 1
Mad
era F
lea
Mar
ket D
ay 2
Mod
esto
Farm
ers' M
arke
t
El R
emat
ito
Ruiz
Pro
duce
Product signage and pricing (for fresh fruits/vegetables only)
Products identified by name: None X X
Products identified by name: Some X X X X X X
Products identified by name: Most X X X X X X
Products identified by name: All X
Clear signs document price: None X X X
Clear signs document price: Some X X X X
Clear signs document price: Most X X X X X X X X
Units are appropriately labeled: None X X X
Units are appropriately labeled:
Some X X X
Units are appropriately labeled: Most X X X X X
Units are appropriately labeled: All X X X
Discounts for larger sales: None X X X
Discounts for larger sales: Some X X X X X X X X
Discounts for larger sales: Most X X X X
Canned/frozen fruits/vegetables
No canned fruits available X X X X X X X X X X X X X X X
No canned vegetables available X X X X X X X X X X X X X X X
No frozen fruits available X X X X X X X X X X X X X X X
No frozen vegetables available X X X X X X X X X X X X X
Variety frozen vegetables (4+ types) X X

Table 6. Other Foods and Milk Sold at Farmers' Markets
Vendor Characteristic Fresn
o Far
mers
' Mark
et
Man
ches
ter C
enter F
armer
s' M
arke
t
Cher
ry A
uction
Flea
Mark
et
The M
arke
t on
Kern
Old T
own C
lovis Farm
ers' M
arke
t
Kaise
r Per
man
ente F
armers
' Mark
et
"Hea
lthy Hab
its" Fa
rmer
s' M
arke
t
Farmers
' Mark
et on
Par
k Place
May
fair
Sch
ool F
arm
Sta
nd
The V
iney
ard
Mad
era F
lea
Mar
ket D
ay 1
Mad
era F
lea
Mar
ket D
ay 2
Mod
esto
Farm
ers' M
arke
t
El R
emat
ito
Ruiz
Pro
duce
Other foods
High-fiber, whole grain foods X X X X X X X X X
Lean meats, fish, poultry X X X
Nuts, seeds, or dry beans X X X X X X X X X X X XHealthier foods: Low-fat prepared
meals X X X X X X
Healthier foods: Other X X X X X X
Salty foods X X X X X X X X X X X
Ice cream/frozen desserts X X X X X X X X X X X
Sweet foods X X X X X X X X X X X
Candy/chocolate X X X X X X X X X
Regular to high-fat prepared meals X X X X X X X X X XFoods with minimal nutritional value:
Other X X X X X
Milk sold at market X X
Skim milk X
2% milk X
Whole or Vitamin D milk X X
Flavored whole milk X X
Rice milk X
Soy milk X
Lactaid® X
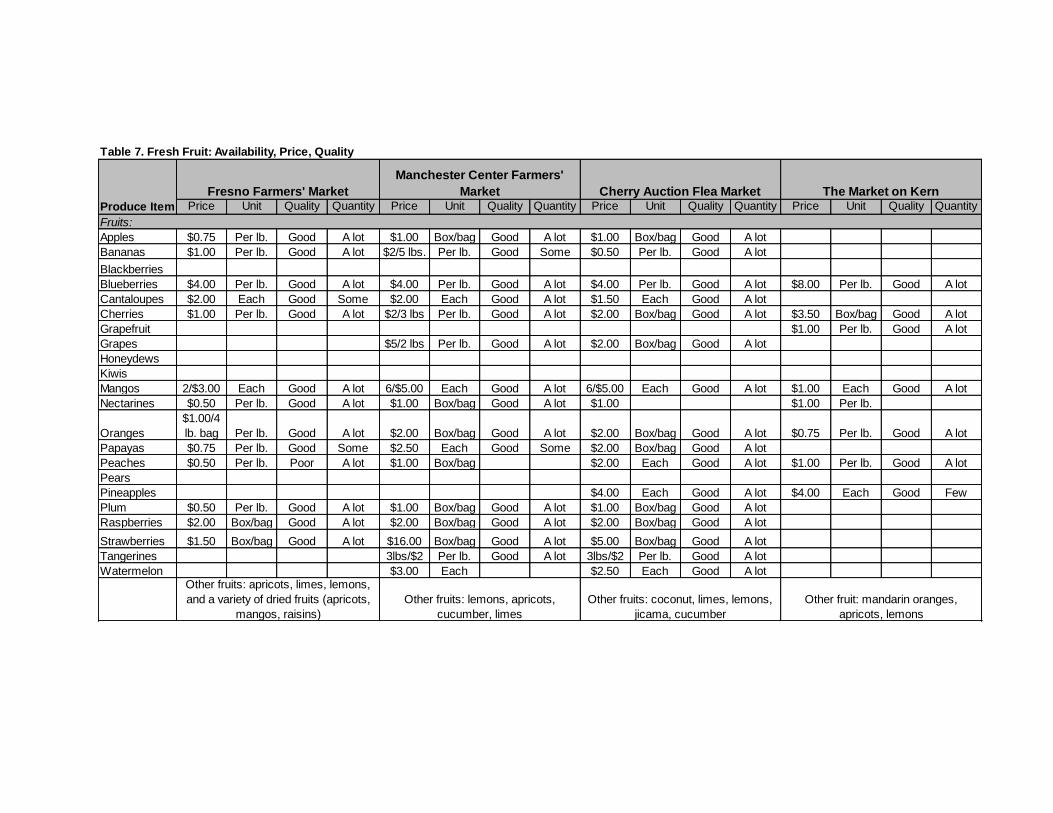
Table 7. Fresh Fruit: Availability, Price, Quality
Price Unit Quality Quantity Price Unit Quality Quantity Price Unit Quality Quantity Price Unit Quality Quantity
Fruits:
Apples $0.75 Per lb. Good A lot $1.00 Box/bag Good A lot $1.00 Box/bag Good A lot
Bananas $1.00 Per lb. Good A lot $2/5 lbs. Per lb. Good Some $0.50 Per lb. Good A lot
Blackberries
Blueberries $4.00 Per lb. Good A lot $4.00 Per lb. Good A lot $4.00 Per lb. Good A lot $8.00 Per lb. Good A lot
Cantaloupes $2.00 Each Good Some $2.00 Each Good A lot $1.50 Each Good A lot
Cherries $1.00 Per lb. Good A lot $2/3 lbs Per lb. Good A lot $2.00 Box/bag Good A lot $3.50 Box/bag Good A lot
Grapefruit $1.00 Per lb. Good A lot
Grapes $5/2 lbs Per lb. Good A lot $2.00 Box/bag Good A lot
Honeydews
Kiwis
Mangos 2/$3.00 Each Good A lot 6/$5.00 Each Good A lot 6/$5.00 Each Good A lot $1.00 Each Good A lot
Nectarines $0.50 Per lb. Good A lot $1.00 Box/bag Good A lot $1.00 $1.00 Per lb.
Oranges
$1.00/4
lb. bag Per lb. Good A lot $2.00 Box/bag Good A lot $2.00 Box/bag Good A lot $0.75 Per lb. Good A lot
Papayas $0.75 Per lb. Good Some $2.50 Each Good Some $2.00 Box/bag Good A lot
Peaches $0.50 Per lb. Poor A lot $1.00 Box/bag $2.00 Each Good A lot $1.00 Per lb. Good A lot
Pears
Pineapples $4.00 Each Good A lot $4.00 Each Good Few
Plum $0.50 Per lb. Good A lot $1.00 Box/bag Good A lot $1.00 Box/bag Good A lot
Raspberries $2.00 Box/bag Good A lot $2.00 Box/bag Good A lot $2.00 Box/bag Good A lot
Strawberries $1.50 Box/bag Good A lot $16.00 Box/bag Good A lot $5.00 Box/bag Good A lot
Tangerines 3lbs/$2 Per lb. Good A lot 3lbs/$2 Per lb. Good A lot
Watermelon $3.00 Each $2.50 Each Good A lot
Fresno Farmers' Market
Manchester Center Farmers'
Market Cherry Auction Flea Market The Market on Kern
Produce Item
Other fruits: apricots, limes, lemons,
and a variety of dried fruits (apricots,
mangos, raisins)
Other fruits: lemons, apricots,
cucumber, limes
Other fruits: coconut, limes, lemons,
jicama, cucumber
Other fruit: mandarin oranges,
apricots, lemons

Table 7. Fresh Fruit: Availability, Price, Quality (Continued)
Price Unit Quality Quantity Price Unit Quality Quantity Price Unit Quality Quantity Price Unit Quality Quantity Price Unit
Fruits:
Apples $1.50 Per lb. Good A lot $0.50 Each Good A lot
Bananas $1.00 Box/bag Good A lot
Blackberries $3.00 Box/bag Good $3.00 Box/bag Good A lot
Blueberries $5.00 Box/bag Good A lot $5.00 Box/bag Good A lot $5.00 Box/bag Good A lot
Cantaloupes $2.00 Each Good Few
Cherries $5.00 Box/bag Good A lot $3.00 Box/bag Good A lot $2.00 Per lb. Good A lot
Grapefruit
Grapes $1.00 Box/bag Good A lot $1.00 Box/bag
Honeydews
Kiwis $1.50 Per lb. Good A lot $1.00/3 Each Good A lot
Mangos
Nectarines $1.25 Per lb. Good A lot $1.99 Per lb. Good A lot $1.50 Per lb. Good A lot
Oranges $5.00 Box/bag Good A lot $4.00 Box/bag Good Some $2.00 Per lb. Good A lot
Papayas
Peaches $1.25 Per lb. Good A lot $1.99 Per lb. Good A lot $1.50 Per lb. Good A lot $0.50 Each
Pears
Pineapples
Plum $1.99 Per lb. Good A lot 3/$1.00 Each Good A lot $2.00 Per lb. Good A lot
Raspberries $8.00 Box/bag Good A lot $3.00 Box/bag Good A lot $3.00 Box/bag Good A lot
Strawberries $5.00 Box/bag Good A lot $2.50 Box/bag $2.00 Box/bag $3.00 Box/bag Good A lot
Tangerines
Watermelon $2.00 Each Good Few
Produce
Item
Mayfair School
Farm Stand
Old Town Clovis Farmers'
Market
Kaiser Permanente Farmers'
Market
"Healthy Habits" Farmers'
Market Farmers' Market on Park Place
Other fruit: apricots, pluots
Other fruit: apricots, passion fruit,
guava, lemons, pluots, dried fruit Other fruit: apricots
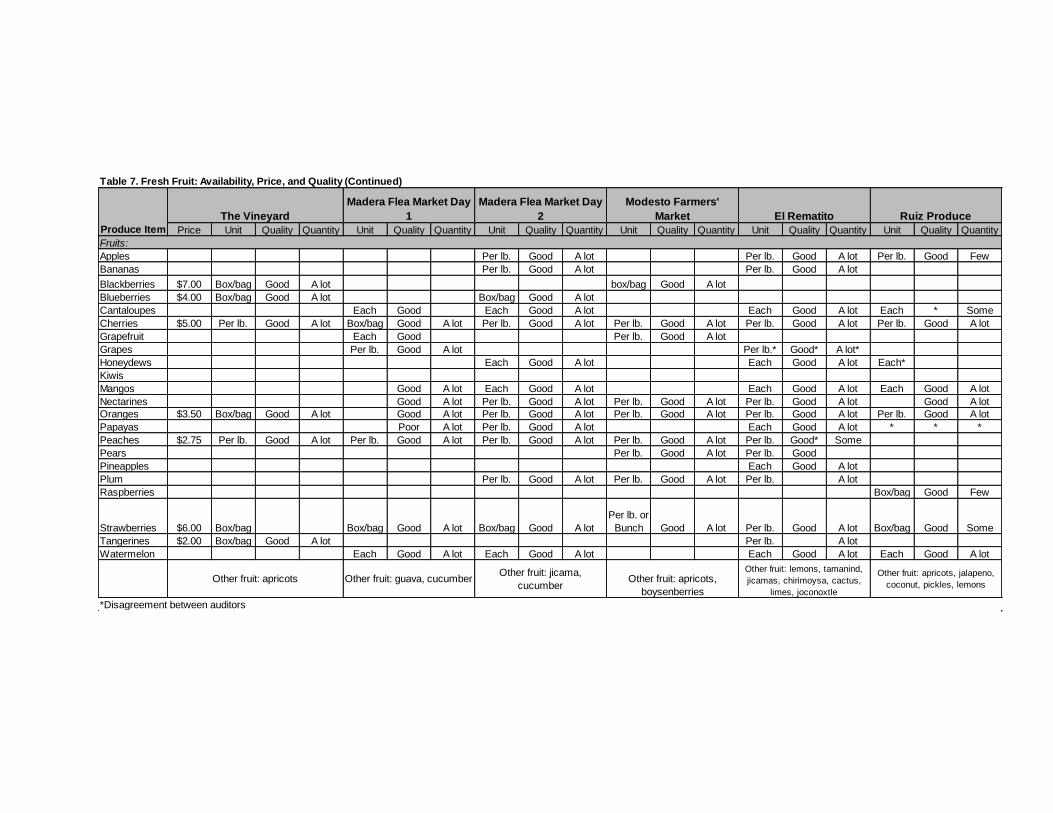
Price Unit Quality Quantity Unit Quality Quantity Unit Quality Quantity Unit Quality Quantity Unit Quality Quantity Unit Quality Quantity
Fruits:
Apples Per lb. Good A lot Per lb. Good A lot Per lb. Good Few
Bananas Per lb. Good A lot Per lb. Good A lot
Blackberries $7.00 Box/bag Good A lot
Per lb or
box/bag Good A lot
Blueberries $4.00 Box/bag Good A lot Box/bag Good A lot
Cantaloupes Each Good Each Good A lot Each Good A lot Each * Some
Cherries $5.00 Per lb. Good A lot Box/bag Good A lot Per lb. Good A lot Per lb. Good A lot Per lb. Good A lot Per lb. Good A lot
Grapefruit Each Good Per lb. Good A lot
Grapes Per lb. Good A lot Per lb.* Good* A lot*
Honeydews Each Good A lot Each Good A lot Each*
Kiwis
Mangos Good A lot Each Good A lot Each Good A lot Each Good A lot
Nectarines Good A lot Per lb. Good A lot Per lb. Good A lot Per lb. Good A lot Good A lot
Oranges $3.50 Box/bag Good A lot Good A lot Per lb. Good A lot Per lb. Good A lot Per lb. Good A lot Per lb. Good A lot
Papayas Poor A lot Per lb. Good A lot Each Good A lot * * *
Peaches $2.75 Per lb. Good A lot Per lb. Good A lot Per lb. Good A lot Per lb. Good A lot Per lb. Good* Some
Pears Per lb. Good A lot Per lb. Good
Pineapples Each Good A lot
Plum Per lb. Good A lot Per lb. Good A lot Per lb. A lot
Raspberries Box/bag Good Few
Strawberries $6.00 Box/bag Box/bag Good A lot Box/bag Good A lot
Per lb. or
Bunch Good A lot Per lb. Good A lot Box/bag Good Some
Tangerines $2.00 Box/bag Good A lot Per lb. A lot
Watermelon Each Good A lot Each Good A lot Each Good A lot Each Good A lot
Table 7. Fresh Fruit: Availability, Price, and Quality (Continued)
Produce Item
Other fruit: guava, cucumber
Madera Flea Market Day
1
*Disagreement between auditors
The Vineyard
Madera Flea Market Day
2
Modesto Farmers'
Market El Rematito Ruiz Produce
Other fruit: apricots, jalapeno,
coconut, pickles, lemonsOther fruit: apricots
Other fruit: jicama,
cucumberOther fruit: apricots,
boysenberries
Other fruit: lemons, tamanind,
jicamas, chirimoysa, cactus,
limes, joconoxtle

Table 8. Fresh Vegetables: Availability, Price, Quality
Price Unit Quality Quantity Price Unit Quality Quantity Price Unit Quality Quantity Price Unit Quality Quantity
Vegetables:
Artichokes $0.75 Each Good A lot $1.00 Each Good A lot $1.00 Each Good A lot
Asparagus
Avocados 2/$1.00 Each Good A lot 2/$1.00 Each Good A lot $3.00 Box/bag
Broccoli $1.00 Per lb. Good Some
Brussel sprouts
Cabbages $1.00 Each Good Some $1.00 Each Good A lot
Carrots $1.00 Bunch Good Some
Cauliflower
Celery $2.00 Each Good Some $1.00 Each Good A lot $1.00 Each Good A lot
Collard Greens $1.00 Per lb. Good Some
Corn
Green beans $1.00 Per lb. Good Some $1.00 Box/bag Good A lot $2.00 Box/bag Good A lot $1.50 Per lb. Good A lot
Green peppers $1.00 Per lb. Good A lot $1.00 Box/bag Good A lot $1.00 Box/bag Good A lot
Kale $1.00 Per lb. Good Some
Lentils 2lbs/$1.00 Per lb. Good Some $1.00 Per lb.
Lettuce - Romaine $1.00 Each Good Some $1.00 Each Good Some $1.00 Each Good A lot $1.50 Each
Lima beans 2lbs/$3.00 Per lb. Good A lot $2.00 Per lb. Good A lot
Mushrooms
Okra
Onions 2 lb/$1.00 Per lb. Good Some $0.50 Per lb. Good A lot $2.00 Box/bag Good A lot $1.00 Box/bag
Radishes $1.00 Bunch Good Some $1.00 Bunch Good A lot
Red peppers $1.00 Box/bag Good Some $1.00 Box/bag Good A lot
Spinach $1.00 Per lb. Good Some
Summer squash Per lb. 3lbs/$2.00 Per lb. Good A lot $2.00 Box/bag Good A lot $1.50 Per lb. Good A lotSweet potatoes 3lb/$0.75 Per lb. Good A lot $2.50 Box/bag Good A lot $1.50 Per lb. Good A lot
Tomatoes 0.75 Per lb. Good A lot $1.00 Box/bag Good A lot $1.00 Per lb. Good A lot $1.25 Per lb. Good A lot
Produce Item
Fresno Farmers' Market Manchester Center Farmers' Market Cherry Auction Flea Market The Market on Kern
Other vegetables: eggplant, green
tomatillo, bell peppers, yams Other vegetables: cilantro, yams, cactus
Other vegetables: garbanzo, green
tomatillo, bell peppers, eggplant
Herbs: cilantro, rosemary, thyme,
parsley, basil, mint, terragon

Table 8. Fresh Vegetables: Availability, Price, Quality (Continued)
Price Unit Quality Quantity Price Unit Quality Quantity Price Unit Quality Quantity Price Unit Quality Quantity Price Unit Quality
Vegetables:
Artichokes
Asparagus
Avocados
Broccoli $1.50 Per lb. Good A lot $1.00 Bunch Good Few $1.50 Per lb. Good A lot $1.00 Each
Brussel sprouts
Cabbages $1.25 Per lb.
Carrots $1.00 Bunch Good A lot $2.00 Bunch Good A lot $1.00 Box/bag Good Few $1.00 Box/bag Good A lot $0.05 Each
Cauliflower $1.00 Each Good A lot $1.00 Each Good
Celery
Collard Greens $1.00 Box/bag Good A lot
Corn
Green beans $2.00 Per lb. Good A lot $3.00 Per lb. Good A lot $2.00 Box/bag Good A lot
Green peppers $2.00 Per lb. Good A lot $3.00 Per lb. Good A lot $1.50 Per lb. Good A lot
Kale $1.00 Bunch Good A lot $3.00 Bunch Good A lot $1.00 Box/bag Good A lot
Lentils
Lettuce - Romaine $1.00 Bunch Good A lot $2.00 Each Good A lot
Lima beans
Mushrooms $1.00 Box/bag Good Some
Okra $1.00 Box/bag Good A lot
Onions $1.00 Each Good A lot $1.50 Per lb. Good A lot $1.25 Per lb. Good A lot
Radishes
Red peppers
Spinach $3.00 Box/bag Good A lot $1.00 Box/bag Good A lot
Summer squash $1.00 Per lb. Good A lot $1.50 Per lb. Good A lot $1.50 Per lb. Good A lot $1.00 Box/bagSweet potatoes $2.00 Per lb. Good A lot $1.00 Box/bag Good A lot
Tomatoes $2.00 Per lb. Good A lot $3.00 Per lb. Good A lot $2.50 Per lb. Good A lot $1.00 Box/bag
Produce Item
Mayfair School Farm Stand
Other vegetables: dikon, bok choy,
cherry tomatoes
Old Town Clovis Farmers'
Market
Kaiser Permanente Farmers'
Market
"Healthy Habits" Farmers'
Market
Other vegetables and herbs: guta, beets,
red onion, cucumber, yellow zuccinni, baby
onion, basil, yellow tomato, mint, parsley,
green onion, kohlorabi, eggplant, armenian
bell pepper, shangai bok choy, sweet
italian peppers, bell green peppers, baby
bok choy, obra leaves, bitter lemon leaves,
ong choy
Other vegetables: snow peas, cilantro,
grape tomatoes, serrano peppers
Other vegetables: thai eggplant, sweet
italian peppers, armenian bell peppers,
chinese eggplant, cucumber, garlic, leeks,
sinqua squash, armenian cucumber, bitter
melon leaves, green onions, parsley, lemon
basil, dandelion greens, baby bok choy
Farmers' Market on Park Place

Table 8. Fresh Vegetables: Availability, Price, Quantity (Continued)
Produce Item
Price Unit Unit Quality Unit Quality Quantity Unit Quality Quantity Price Unit Quality Quantity Unit Quality Quantity
Vegetables:
Artichokes Each Some
Asparagus Box/bag Good Good A lot
Avocados Box/bag Good Per lb. Good A lot Each Good A lot
Broccoli Box/bag Good Per lb. Good A lot Per lb. Good Some
Brussel sprouts Per lb. Box/bag Good A lot Per lb Good Some
Cabbages $1.00 Each Each Good Box/bag Good A lot Box/bag Poor A lot Per lb. Good A lot Each * *
Carrots $1.25 Bunch Per lb. Box/bag Good A lot Per lb. Good A lot
Cauliflower Each Good Each
Celery $1.50 Each Each Good Box/bag Good A lot Bunch
Collard Greens
Corn Per lb. Good Per lb. Good A lot Per lb. Good A lot
Green beans $2.00 Per lb. Per lb. Good Per lb. Good A lot Per lb. Good A lot
Green peppers 3/$1.00 Each Per lb. Good Per lb. Good A lot Per lb. Good *
Kale Each Good Bunch Good A lot Per lb. Good Some
Lentils Per lb. Per lb. Good A lot Per lb. Good A lot
Lettuce - Romaine $1.50 Each Each Good * Each
Lima beans Per lb. Good Per lb. Good A lot Box/bag Some
Mushrooms Per lb. Good A lot
Okra
Onions $2.00 Box/bag Per lb. Good Per lb. Good A lot Box/bag Good * $0.75 Per lb. Good A lot * Good Some
Radishes $1.00 Bunch Box/bag Good Box/bag Good A lot Box/bag Good A lot Per lb. Good A lot
Red peppers Per lb. Good Per lb. Good A lot
Spinach
Summer squash $1.50 Per lb. Per lb. Good Per lb. Good A lot Per lb. Good A lot Per lb. Good * Per lb. Good *Sweet potatoes $1.50 Per lb. Per lb. Good A lot Per lb. Good A lot Per lb. Good A lot
Tomatoes $0.75 Per lb. Per lb. Good Per lb. Good A lot Per lb. Good A lot Per lb. Good A lot Per lb. Good A lot
Other vegetables and herbs:
eggplant, dikon, chard,
potatoes, various types of
lettuce (sweet green, red
and green, sweet baby
romain, extreme baby) beets
(yellow, Italian), beets
(organic), zucchini, Italian
squash, fava beans, turnips,
herbs, garlic, ginger, cilantro
Modesto Farmers'
Market
Other vegetables: jalapenos,
honey, peanuts, potatoes,
chile serrano, garlic
Ruiz Produce
Other vegetables: prickly pear, chiles,
turnips, tomatillo, plantains, purslane,
garlic, napol, purslane, potatoes,
chayote, green onions, zucchini,
cucumbers, beetroot, pickles
Other vegetables:
zucchini, garlic,
squash
The Vineyard
Other vegetables:
nopal, cilantro
Madera Flea
Market Day 1
Other vegetables: chile
serranos, cilantro, tomatillo
Madera Flea Market Day
2 El Rematito

Appendix B: Farmers’ Market Environmental Audit Tool


