
Critical Access
Hospital Finance 101
Manual
November 2012
This is a publication of the Technical Assistance and Services Center (TASC),
a program of the National Rural Health Resource Center. The project
described was supported by Grant Number U27RH08533 from the U.S.
Department of Health and Human Services, Health Resources and Services
Administration, Office of Rural Health Policy.
For questions, concerns, clarification, or technical assistance, please contact:
National Rural Health Resource Center
600 East Superior Street, Suite 404
Duluth, Minnesota 55802
Phone: 218-727-9390
Fax: 218-727-9392
www.ruralcenter.org
National Rural Health Resource Center 2
This report prepared by:
Kristina N. Hahn, MHA
Consultant
50 Sewall Street, Suite 102
Portland, Maine 04105
(800) 947-5712
www.stroudwater.com
600 East Superior Street, Suite 404
Duluth, Minnesota 55802
Phone: 218-727-9390
Fax: 218-727-9392
www.ruralcenter.org
Report edited by:
Ralph Llewellyn, Eide Bailly LLC
National Rural Health Resource Center 3
TABLE OF CONTENTS
PURPOSE ............................................................................................. 5
WHAT IS MEDICARE? ............................................................................ 5
MEDICARE PART A (HOSPITAL INSURANCE) ................................................... 6
MEDICARE PART B (MEDICAL INSURANCE) .................................................... 6
MEDICARE PART C (ALSO KNOWN AS MEDICARE ADVANTAGE) ............................. 6
MEDICARE PART D (MEDICARE PRESCRIPTION DRUG COVERAGE) ........................ 6
WHAT IS MEDICAID? ............................................................................ 6
WHAT IS CHILDREN’S HEALTH INSURANCE PROGRAM (CHIP)? .................. 7
WHAT IS THE PROSPECTIVE PAYMENT SYSTEM? ...................................... 8
WHAT IS THE MEDICARE SWING BED PROGRAM? ................................... 10
WHAT IS CAH COST-BASED REIMBURSEMENT? ....................................... 11
WHAT IS CAH MEDICARE AMBULANCE REIMBURSEMENT? ........................ 11
WHAT ARE ALLOWABLE COSTS FOR 101% COST-BASED REIMBURSEMENT
FROM MEDICARE? ............................................................................... 11
WHAT IS THE DIFFERENCE BETWEEN PPS AND COST-BASED
REIMBURSEMENT? ............................................................................... 12
WHAT IS OPTIONAL (METHOD II) BILLING? ............................................ 12
WHAT IS A MEDICARE ADMINISTRATIVE CONTRACTOR (MAC)? ................ 14
IF CAHS ARE REIMBURSED AT 101%, WHY MIGHT THEY NOT MAKE A
PROFIT? ............................................................................................. 14
WHAT IS A HOSPITAL COST REPORT? .................................................... 15
IF A CAH HAS A RURAL HEALTH CLINIC ATTACHED, HOW DO THEY BILL FOR
THOSE SERVICES AND FILE THEIR EXPENSES? ....................................... 16
WHAT ARE THE MOST IMPORTANT CAH FINANCIAL INDICATORS OF
PERFORMANCE? .................................................................................. 16
1. DAYS IN NET ACCOUNTS RECEIVABLE ................................................... 18
2. DAYS IN GROSS ACCOUNTS RECEIVABLE ............................................... 18
3. DAYS CASH ON HAND ...................................................................... 19
4. TOTAL MARGIN .............................................................................. 19
5. OPERATING MARGIN ........................................................................ 20

National Rural Health Resource Center 4
6. DEBT SERVICE COVERAGE RATIO ........................................................ 20
7. SALARIES TO NET PATIENT REVENUE .................................................... 21
8. PAYOR MIX PERCENTAGE .................................................................. 21
9. AVERAGE AGE OF PLANT ................................................................... 22
10. LONG TERM DEBT TO CAPITALIZATION .................................................. 22
IS THERE A MODEL FOR PREDICTING CAH FINANCIAL DISTRESS? ............ 23
WHERE CAN I FIND INFORMATION ABOUT THE FINANCIAL PERFORMANCE OF
CAHS IN MY STATE? ............................................................................ 25
WHAT INTERVENTIONS CAN CAHS USE TO IMPROVE THEIR FINANCIAL
PERFORMANCE? .................................................................................. 25
WHY IS A REVIEW OF THE COST REPORT IMPORTANT? ............................ 25
WHAT IS A CHARGEMASTER AND HOW OFTEN SHOULD IT BE REVIEWED? . 26
WHAT ARE STRATEGIC, FINANCIAL AND OPERATIONAL ASSESSMENTS? .... 26
WHAT IS REVENUE CYCLE MANAGEMENT? .............................................. 27
WHY ARE PHYSICIAN PRACTICE MANAGEMENT ASSESSMENTS USEFUL? .... 27
WHAT IS LEAN AND HOW CAN IT IMPACT CAH FINANCES? ....................... 27
WHY IS EDUCATION ON FINANCES IMPORTANT FOR CAH DEPARTMENT
MANAGERS AND BOARD MEMBERS? ...................................................... 28
WHY IS COLLABORATION IMPORTANT FOR IMPROVING FINANCES IN CAHS?
......................................................................................................... 28
APPENDIX .......................................................................................... 29

National Rural Health Resource Center 5
PURPOSE
This manual was developed for use by state Medicare Rural Hospital
Flexibility (Flex) Program personnel as well as staff and boards of critical
access hospitals (CAHs). The content is designed to be as non-technical as
possible and to provide answers to frequently asked questions regarding CAH
finance and financial performance.
WHAT IS MEDICARE?
The Medicare program, an amendment to Social Security legislation known
as Title XVIII, provides medical coverage to all Americans 65 years of age
and older. The bill was signed into law by President Lyndon B. Johnson in
1965, and took effect in July, 1966. The enactment of the Medicare program
was significant because it was the beginning of the federal government’s role
as a major financer of health care. In 2010, there were 46.6 million enrollees
in the Medicare program, or approximately 15% of the total U.S. population.
Approximately 21% of Medicare beneficiaries live in rural counties, meaning
rural hospitals tend to have a higher percentage of Medicare recipients than
their urban counterparts.
Medicare is health insurance for people 65 or older, people under 65 with
certain disabilities, and people of any age with End-Stage Renal Disease.
Medicare is funded by both Social Security payroll taxes and insurance
premiums, with coverage categories divided into “Parts.” Medicare Part A is
the hospital insurance portion of the program, and includes acute hospital
inpatient care and inpatient skilled nursing care. Medicare Part B is the
medical insurance component, and includes coverage for doctor visits and
outpatient care. Medicare Part C, known as Medicare Advantage, covers both
Part A and Part B options. And, Medicare Part D is the prescription drug
coverage component of the program, which went into effect on January 1,
2006.
National Rural Health Resource Center 6
Medicare Part A (Hospital Insurance)
Helps cover inpatient care in hospitals, skilled nursing facilities, hospice
and home health care.
Most people do not have to pay a premium for Medicare Part A because
they, or a spouse, paid Medicare taxes while working in the United States.
If they do not automatically get premium-free Part A, they may still be
able to enroll, and pay a premium.
Medicare Part B (Medical Insurance)
Helps cover doctors’ and other health care providers’ services, outpatient
care, durable medical equipment and home health care.
Helps cover some preventive services.
Most people pay up to the standard monthly Medicare Part B premium.
Some Medicare recipients buy coverage that fills gaps in Medicare coverage,
such as Medicare Supplemental Insurance (Medigap).
Medicare Part C (also known as Medicare Advantage)
Offers health plan options run by Medicare-approved private insurance
companies. Medicare Advantage Plans are a way to get the benefits and
services covered under Part A and Part B. Most Medicare Advantage Plans
cover Medicare prescription drug coverage (Part D).
Some Medicare Advantage Plans may include additional benefits for an
additional cost.
Medicare Part D (Medicare Prescription Drug Coverage)
Helps cover the cost of prescription drugs.
May help lower your prescription drug costs and help protect against
higher costs.
Run by Medicare-approved private insurance companies.
Costs and benefits vary by plan.
WHAT IS MEDICAID?
Medicaid is health coverage available to people and families who have limited
income and resources. It is funded both by the federal government and state
governments, but is managed at the state level. The program was enacted in
1965 as Title XIX of the Social Security Act. The funding of Medicaid is a
major component of state spending, on average comprising 25% of the total
National Rural Health Resource Center 7
state budget. Nationally, 60% of Medicaid spending goes toward acute care
services and over a third goes toward long-term care services.1
Medicaid recipients who are disabled or elderly may also receive coverage for
services such as nursing home care or home and community-based services.
Depending on the state’s rules, individuals may also be asked to pay a small
part of the cost (copayment) for some medical services. If an individual
qualifies for both Medicare and Medicaid, most of their health care costs will
be covered, including prescription drug coverage.
Frequently, nursing home residents run out of financial resources during their
stay, at which point they become eligible for Medicaid coverage. States
attempt to control the costs by ensuring that those receiving Medicaid
benefits are truly eligible, and at times adopt payment methodologies of the
Medicare program. Because Medicaid programs are managed at the state
level, there is state-to-state variation in eligibility requirements, coverage
and reimbursement.
Medicaid reimbursement, in general, is lower than both Medicare and private
insurance reimbursement. Thus, the proportion of Medicaid business for any
health care organization is particularly relevant to its financial performance.
Moreover, because Medicaid programs place stress on state budgets, state
regulators often carry out cost containment measures to reduce Medicaid
spending. State cost containment activities include the reduction of payments
to providers, reduction in covered services and reduced pharmacy benefits.
Over half of CAHs receive cost based reimbursement from their state
Medicaid program. For information on state-specific Medicaid reimbursement
rates for CAHs, please visit http://www.ruralcenter.org/node/159
WHAT IS CHILDREN’S HEALTH INSURANCE PROGRAM
(CHIP)?
The Children’s Health Insurance Program (CHIP) provides access to low cost
health insurance coverage for children in families who earn too much to
qualify for Medicaid but not enough to be able to buy private health
insurance. These families are eligible for free or low-cost health insurance
that pays for doctor and dental visits as well as prescription drugs,
hospitalizations and more.
1 Medicaid Spending by Service and Medicaid Spending on Long-Term Care: Urban Institute and Kaiser Commission on Medicaid and the Uninsured estimates based on data from Centers for Medicare and Medicaid Services-64 reports, March 2009.
National Rural Health Resource Center 8
WHAT IS THE PROSPECTIVE PAYMENT SYSTEM?
In 1983, the payment methodology for inpatient acute hospital care
(Medicare Part A) changed from cost-based reimbursement to a prospective
payment reimbursement system (PPS). In this new payment system, all of
the various clinical diagnoses were classified into groups, called “Diagnosis
Related Groups” or DRGs. With the establishment of DRG categories, of
which there are more than 500, hospitals were then paid a fixed amount to
treat each patient based on age, sex, International Classification of Diseases
(ICD) diagnoses, procedures, discharge status and the presence of
comorbidities or complications. Upon admission, each patient is assigned a
DRG based on their primary diagnosis, for example, “pneumonia”. The
hospital is then paid a specific dollar amount for that pneumonia patient,
based on the DRG code they were assigned. Some patients need more
anticipated services to treat their specific ailment(s), while other cases
require fewer services. Regardless, the hospital is still paid the same amount
for that DRG code. Naturally, some diagnoses, and their corresponding DRGs,
have very high levels of complexity and thus are more costly to treat. For
example, a heart transplant is vastly more complicated and requires more
resources than a normal newborn birth. Consequently, DRG reimbursement
for heart transplants is higher than for the normal newborn DRG.
Base DRG rates can be adjusted for several reasons, including a hospital’s
location. Just as the cost of living in the United States varies by location, the
cost of providing health care varies by location as well. A heart transplant
performed in San Francisco, California, would likely cost more than one
performed in Omaha, Nebraska, due to wage differences, supply costs
differences, etc. The DRG system adjusts for this by varying DRG payments
according to market forces across the country.
Inherent in the DRG reimbursement system is the incentive for hospitals to
treat and discharge patients as quickly as possible. Because this
reimbursement program pays hospitals on a “per patient” basis, there is a
financial incentive for hospitals to treat as many patients as possible, as
efficiently as possible. By discharging patients in a timely manner, it frees
more bed space which can be used to treat more incoming patients.
Additionally, the reduced number of days spent in the hospital for a given
patient reduces the required resources and associated costs of caring for that
patient. In this way, for any DRG, a shorter length of stay is more profitable
for the hospital than a longer length of stay. Because of this direct impact on
profitability, the “Average Length of Stay” metric is used by hospitals to
assess the efficiency of their organization.

National Rural Health Resource Center 9

National Rural Health Resource Center 10
WHAT IS THE MEDICARE SWING BED PROGRAM?
As discussed earlier, hospitals are reimbursed on a DRG basis for inpatient
acute care. Often, patients who require acute inpatient services require
inpatient rehabilitative aftercare or skilled nursing care. DRG acute payment
rates are set based upon the resources required to treat the acute condition
only, and not those expended on the subsequent rehabilitation. Therefore,
the Medicare program created a separate reimbursement system to
compensate providers for the extended care service they provide. The
amount of extended care required by patients for any condition is highly
variable because of differences in age, overall health and other factors that
determine the speed of recovery. Due to this length of stay variation,
hospitals receive reimbursement based on the overall assessed condition of
the patient, the amount of which is determined by the assigned Resource
Utilization Group (RUG).
The RUG system classifies patients into one of 66 RUG levels, based on the
expected amount of provider resources to be expended. RUG payments are
larger for most severe conditions that require a great deal of attention and
service. In cases where extended care is required, hospitals receive two
payments for a patient: DRG payment for the treatment of the acute
condition, and the RUG payment for care offered to patients after the acute
treatment.
The Medicare swing bed program allows hospitals with 100 beds or less to
provide both acute care treatment and skilled nursing treatment to patients
without having to physically move the patient to another bed. The hospital
receives both forms of reimbursement described above, simply by
discharging patients from acute care beds and admitting them to skilled
nursing beds when the patient meets the coverage guidelines for skilled care.
The skilled nursing bed is sometimes referred to as a “swing” bed, because
the hospital swings a bed from an acute care designation to a skilled nursing
designation. Patients must be in the medically necessary acute care bed for
at least 72 hours before they can be discharged to a swing bed.
National Rural Health Resource Center 11
WHAT IS CAH COST-BASED REIMBURSEMENT?
During the 1980s and 1990s, almost 400 hospitals closed across the U.S.
because of financial losses from the PPS system. In 1997, the Balanced
Budget Act created the Medicare Rural Hospital Flexibility (Flex) Program and
CAH provider type.
Medicare pays for the same services from CAHs as for other acute care
hospitals (e.g., inpatient stays, outpatient visits, laboratory tests and post-
acute skilled nursing days). However, CAH payments are based on each
CAH’s costs and the share of those costs that are allocated to Medicare
patients).
CAHs receive cost based reimbursement for inpatient and outpatient services
provided to Medicare patients (and Medicaid patients depending on policy of
the state in which they are located). Cost based reimbursement provides
significant financial advantage to CAHs by allowing them to get paid at 101%
of costs on all of their hospital Medicare business. The cost of treating
Medicare patients is estimated using cost accounting data from Medicare cost
reports.
WHAT IS CAH MEDICARE AMBULANCE REIMBURSEMENT?
Under Medicare ambulance reimbursement, if a CAH or an entity that is
owned and operated by the CAH is the only provider or supplier of ambulance
service located within a 35-mile drive of that CAH, the CAH or the CAH-
owned and operated entity is paid 101% of the reasonable costs of the CAH
or entity in furnishing ambulance services. Additionally, if there is no other
provider or supplier of ambulance services within a 35-mile drive of the CAH
but there is a CAH-owned and operated entity furnishing ambulance services
that is more than a 35-mile drive from the CAH, that CAH-owned and
operated entity can be paid 101% of reasonable costs for its ambulance
services as long as it is the closest provider or supplier of ambulance services
to the CAH.
WHAT ARE ALLOWABLE COSTS FOR 101% COST-BASED
REIMBURSEMENT FROM MEDICARE?
Medicare pays CAHs for most inpatient, outpatient and swing bed services to
Medicare beneficiaries on the basis of reasonable cost. Reasonable cost is the
cost that was actually incurred in order to provide a medical service, to the

National Rural Health Resource Center 12
extent that cost is necessary in order to efficiently deliver that service.
Expenses must be prudent and reasonable, as well as related to patient care.
For a condensed list of allowable vs. non allowable expenses, please refer to
Table A. below.
Table A. Allowable Costs in CAH
Type of Expense Allowable Not
Allowable
Public education X
Employee recruitment X
Taxes based on income X
Sales tax X
Property taxes X
Entertainment X
Civic organizations X
Legal fees Depends on activity
Collection agency fees X
Political/lobbying costs X
WHAT IS THE DIFFERENCE BETWEEN PPS AND COST-
BASED REIMBURSEMENT?
PPS is a system where payment levels are set ahead of time or
“prospectively” before health care services are delivered, as opposed to after
the diagnosis and treatment. Because rates are set prior to services, each
service has a pre-determined rate associated with it. These rates are based
on estimates of the resources that must be expended for any particular
service, e.g. physician time and effort, supplies, etc. In this way, this
reimbursement system attempts to appropriately match payments to the
acuity of patient illnesses. For example, hospitals are paid a fixed amount for
performing a hip replacement, and a different fixed amount for treating a
patient with heart failure. This type of reimbursement methodology controls
for costs because providers are paid a fixed rate per service, regardless of
the costs they incur.
WHAT IS OPTIONAL (METHOD II) BILLING?
A CAH may elect the Optional (or Method II) Payment Method under which it
bills the fiscal intermediary (FI) or Medicare Administrative Contractor (MAC)
for both facility services and professional services to its outpatients on a
National Rural Health Resource Center 13
single claim. Eligible medical professionals affiliated with CAHs can elect the
Optional (Method II) Payment Method whereby the CAH bills on behalf of
these professionals for their outpatient services. These services would include
where a CAH physician would reassign outpatient billing services to the CAH,
for example in pathology, radiology, emergency room, outpatient surgery
and outpatient clinics. This payment does not include services provided at a
rural health clinic and only applies to the CAH outpatient services.
It is important to note that Optional (Method II) Payment Method billing is
setting-specific, not provider-specific. If a provider works in a rural health
clinic, they cannot use Optional (Method II) Payment Method for those clinic
services. However, if that same provider also provides outpatient services in
the CAH, that provider could use Optional (Method II) Payment Method for
those outpatient CAH services under the Optional (Method II) Payment
Method based on the sum of:
For facility services: 101% of reasonable costs, after applicable
deductions, regardless of whether the physician or practitioner has
reassigned his or her billing rights to the CAH; and
For physician professional services: 115% of the allowable amount, after
applicable deductions, under the Medicare Physician Fee Schedule.
Payment for non-physician practitioner services is 115% of the amount
that otherwise would be paid for the practitioner’s professional services
under the Medicare Physician Fee Schedule.
Physicians reassign their billing to the hospital, and the hospital must do the
billing. All providers of the CAH do not need to use Optional (Method II)
Payment Method, but can individually elect to do so. Overall, it is beneficial
for the CAH to elect the Optional (or Method II) Payment Method, in that it
results in higher reimbursement.
Previously, if a CAH chose to be paid under the Optional (or Method II)
Payment Method, it was required to make that election on an annual basis.
However, in the Fiscal Year (FY) 2011 Inpatient Prospective Payment System
(IPPS) Final Rule, CMS changed the regulations for the optional method
election. Effective for cost reporting periods beginning on or after October 1,
2010:
If a CAH elects the optional method in its most recent cost reporting
period beginning before October 1, 2010, that election remains in
place until the CAH submits a termination request to its FI/MAC. CAHs
will no longer be required to make an annual election.
National Rural Health Resource Center 14
If a CAH chooses to make a change or terminate its optional method
election, the CAH will need to notify its FI/MAC in writing at least 30
days prior to the start of the next cost reporting period.
WHAT IS A MEDICARE ADMINISTRATIVE CONTRACTOR
(MAC)?
Section 911 of the Medicare Prescription Drug Improvement and
Modernization Act of 2003 (MMA) established the Medicare Contracting
Reform (MCR). This statute required the Department of Health and Human
Services (HHS) to replace Medicare’s 48 carriers and fiscal intermediaries
who process Medicare Part A and B Fee for Service claims with the new
Medicare Administrative Contractor (MAC) authority. The primary reasons for
instituting this change were to increase the contractor’s efficiency in the
receipt, processing and payment of Fee-For-Service claims. When all states
are transitioned, there will be 15 new MACs processing Part A and Part B
claims.
IF CAHS ARE REIMBURSED AT 101%, WHY MIGHT THEY
NOT MAKE A PROFIT?
Some CAH expenses, such as recruiting and bad debts, are not included in
the cost-based reimbursement formula. Therefore, CAHs generally earn less
than 101% of cost for care of their Medicare patients. Consequently,
profitability of CAHs is dependent on private insurance business, both
inpatient and increasingly for outpatient services. Private insurance payors
do not reimburse CAHs on a cost basis, but rather follow a PPS system or
reimburse on a percent of charges. In fact, the profitability of commercial
business is enhanced because of the cost based reimbursement received for
Medicare/Medicaid business.
Suppose a CAH administrator decides to purchase and install a CT scanner
for $1 million, and assume 40% of patient care at the CAH in the
CT department is Medicare business. The CAH will receive $400,000 in cost
reimbursement over the useful life of the scanner ($1 million * 40% =
$400,000) from Medicare for their portion of this scanner used to serve
patients. This reduces the hospital’s remaining costs for the CT scanner to
$600,000. The use of the scanner from other patients would need to be
available in order to offset the remaining costs based on overall demand.

National Rural Health Resource Center 15
It is often the challenge of rural health care providers to operate profitably
with a patient population that is comprised of more Medicare and Medicaid
business than urban providers. When performing financial assessments of
CAHs, it is essential to evaluate both the proportion of private insurance
business, as well as the DRG rates negotiated with the private payor.
WHAT IS A HOSPITAL COST REPORT?
The Medicare Cost Report is a financial document filed annually by all
Medicare providers participating in the program, including: hospitals, skilled
nursing facilities, home health agencies, rural health clinics (RHC), federally
qualified health centers (FQHC), hospice, renal and home office. The
Medicare Cost Report is submitted annually to CMS for settlement of costs
relating to health care services rendered to Medicare beneficiaries. The
Medicare Cost Report records each institution’s total costs and charges
associated with providing services to all patients, the portion of those costs
and charges allocated to Medicare patients, and the Medicare payments
received.
The Medicare Cost Report must be filed with the FI/MAC within five months
of fiscal year end of the CAH in order to achieve settlement of costs for
health care services. Final settlement will equal the total reimbursable costs
incurred by or on behalf of the CAH for furnishing covered care to the CAH's
Medicare enrollees (less applicable deductible and coinsurance). Throughout
the course of the year, the hospital receives interim payments from Medicare
for its services. These payments are based on historical costs as claims are
processed. At the end of the hospital’s fiscal year, if the final settlement
determination is greater than payments already made to the CAH through
interim settlement, an underpayment will be declared, and CMS will make a
lump-sum payment to the CAH. Conversely, if the final settlement
determination is less than the total payment made, the CAH has been
overpaid, and CMS must recover the overpayment. This is similar to the
filling of individual taxes each year, where it is likely a person will either owe
tax money to or be paid a refund from the state or Federal government
based on estimated tax payments throughout the previous year. The above
payment methodology illustrates the importance of up-to-date charges,
billing and coding methodologies for the hospital to ensure accuracy and
maximize allowable payment.
National Rural Health Resource Center 16
IF A CAH HAS A RURAL HEALTH CLINIC ATTACHED, HOW
DO THEY BILL FOR THOSE SERVICES AND FILE THEIR
EXPENSES?
The primary benefit of rural health clinic (RHC) status is enhanced
reimbursement from Medicare and Medicaid. Medicare reimburses RHCs
based on allowable and reasonable costs. There are two types of RHCs:
independent RHCs and provider based RHCs. Provider based RHCs work as a
department of another provider, such as a CAH, providing health care
services to the same population. Independent RHCs, on the other hand, are
not affiliated with other providers. There can be significant reimbursement
implications associated with each type of designation; for example,
independent RHCs are subject to a payment cap, whereas provider based
RHCs are not. However, if the main provider has fewer than 50 available
acute care beds (not licensed beds), the RHC’s reimbursement rate is
uncapped. Provider based RHCs are reported on the main provider’s cost
report as a department of that provider. As a result, overhead is allocated to
the RHC through the step-down overhead allocation process in the same
manner that impacts all of the provider’s patient care service departments.
WHAT ARE THE MOST IMPORTANT CAH FINANCIAL
INDICATORS OF PERFORMANCE?
Financial indicators closely aligned with financial strength can be used to
determine the financial status of a CAH. Financial indicators, often ratios,
combine line items from the balance sheet, statement of operations and/or
statement of cash flows in a meaningful way to help interpret strengths or
weaknesses in operations or financing activities. Examining these ratios over
time can help determine an organization’s future trajectory or momentum.
In June 2012, a group of CAH financial experts met in Minneapolis, Minnesota
at a CAH Financial Leadership Summit. Of the many identified financial ratios
proven useful for assessing organizations’ financial conditions, the Summit
participants identified the 10 most important indicators for evaluating CAH
financial performance. These indicators are listed below with associated
definitions, formulas and benchmarks from the 2012 CAH Financial Indicators
Report distributed by the Flex Monitoring Team. The tables are meant to be
used as a reference when calculating these ratios for a specific CAH. A series
of financial statements (balance sheet, statement of operations and
statement of cash flows) are presented in the Appendix and are used to
illustrate where ratio inputs are located and how to calculate the ratios
National Rural Health Resource Center 17
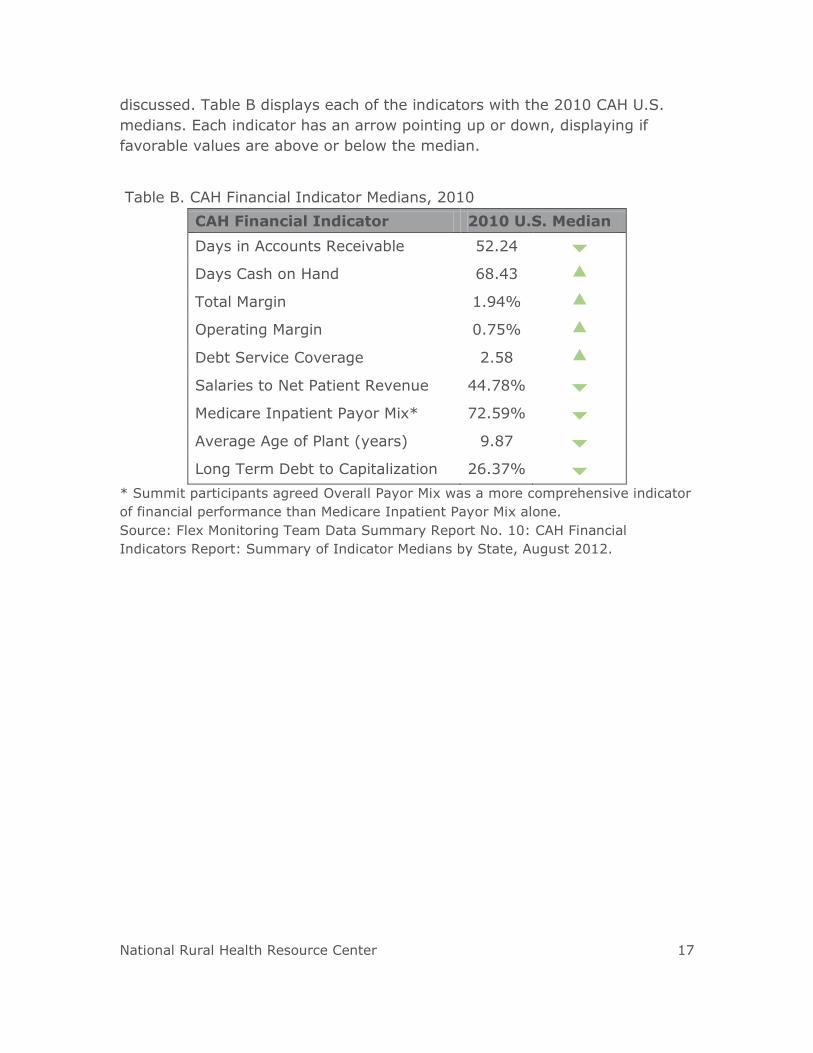
discussed. Table B displays each of the indicators with the 2010 CAH U.S.
medians. Each indicator has an arrow pointing up or down, displaying if
favorable values are above or below the median.
Table B. CAH Financial Indicator Medians, 2010
CAH Financial Indicator 2010 U.S. Median
Days in Accounts Receivable 52.24
Days Cash on Hand 68.43
Total Margin 1.94%
Operating Margin 0.75%
Debt Service Coverage 2.58
Salaries to Net Patient Revenue 44.78%
Medicare Inpatient Payor Mix* 72.59%
Average Age of Plant (years) 9.87
Long Term Debt to Capitalization 26.37%
* Summit participants agreed Overall Payor Mix was a more comprehensive indicator
of financial performance than Medicare Inpatient Payor Mix alone.
Source: Flex Monitoring Team Data Summary Report No. 10: CAH Financial
Indicators Report: Summary of Indicator Medians by State, August 2012.
National Rural Health Resource Center 18
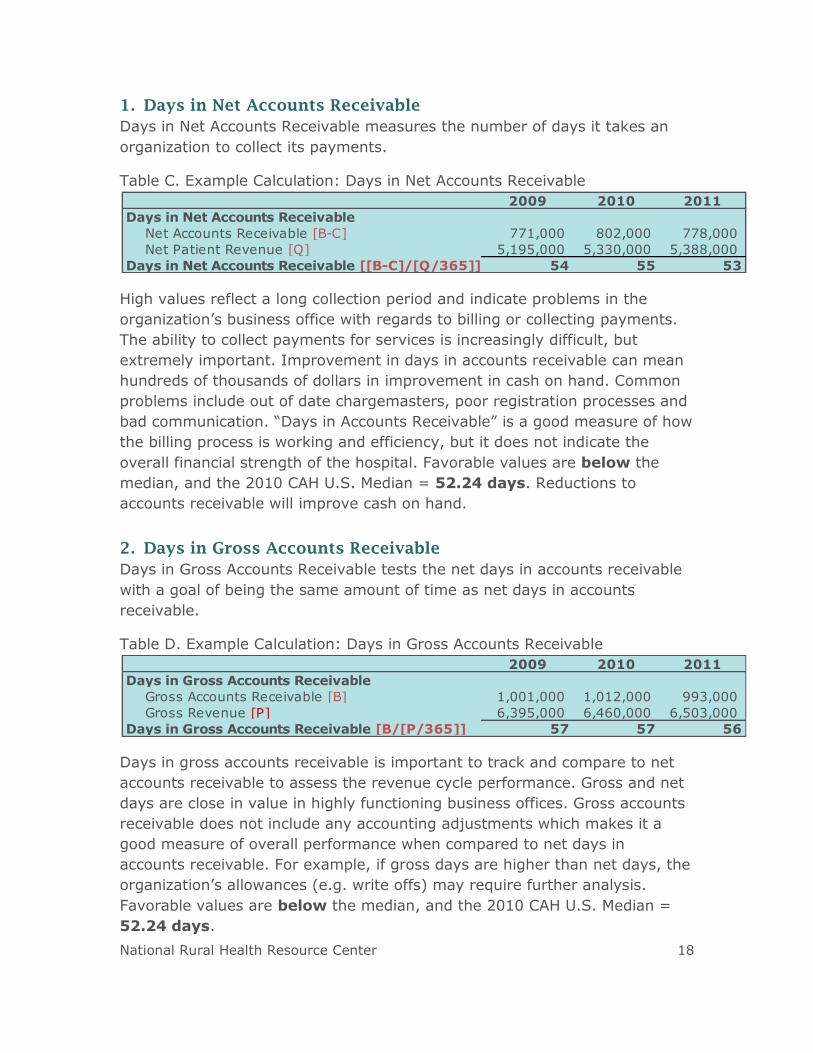
1. Days in Net Accounts Receivable
Days in Net Accounts Receivable measures the number of days it takes an
organization to collect its payments.
Table C. Example Calculation: Days in Net Accounts Receivable
High values reflect a long collection period and indicate problems in the
organization’s business office with regards to billing or collecting payments.
The ability to collect payments for services is increasingly difficult, but
extremely important. Improvement in days in accounts receivable can mean
hundreds of thousands of dollars in improvement in cash on hand. Common
problems include out of date chargemasters, poor registration processes and
bad communication. “Days in Accounts Receivable” is a good measure of how
the billing process is working and efficiency, but it does not indicate the
overall financial strength of the hospital. Favorable values are below the
median, and the 2010 CAH U.S. Median = 52.24 days. Reductions to
accounts receivable will improve cash on hand.
2. Days in Gross Accounts Receivable
Days in Gross Accounts Receivable tests the net days in accounts receivable
with a goal of being the same amount of time as net days in accounts
receivable.
Table D. Example Calculation: Days in Gross Accounts Receivable
Days in gross accounts receivable is important to track and compare to net
accounts receivable to assess the revenue cycle performance. Gross and net
days are close in value in highly functioning business offices. Gross accounts
receivable does not include any accounting adjustments which makes it a
good measure of overall performance when compared to net days in
accounts receivable. For example, if gross days are higher than net days, the
organization’s allowances (e.g. write offs) may require further analysis.
Favorable values are below the median, and the 2010 CAH U.S. Median =
52.24 days.
2009 2010 2011
Days in Net Accounts Receivable
Net Accounts Receivable [B-C] 771,000 802,000 778,000
Net Patient Revenue [Q] 5,195,000 5,330,000 5,388,000
Days in Net Accounts Receivable [[B-C]/[Q/365]] 54 55 53
2009 2010 2011
Days in Gross Accounts Receivable
Gross Accounts Receivable [B] 1,001,000 1,012,000 993,000
Gross Revenue [P] 6,395,000 6,460,000 6,503,000
Days in Gross Accounts Receivable [B/[P/365]] 57 57 56
National Rural Health Resource Center 19
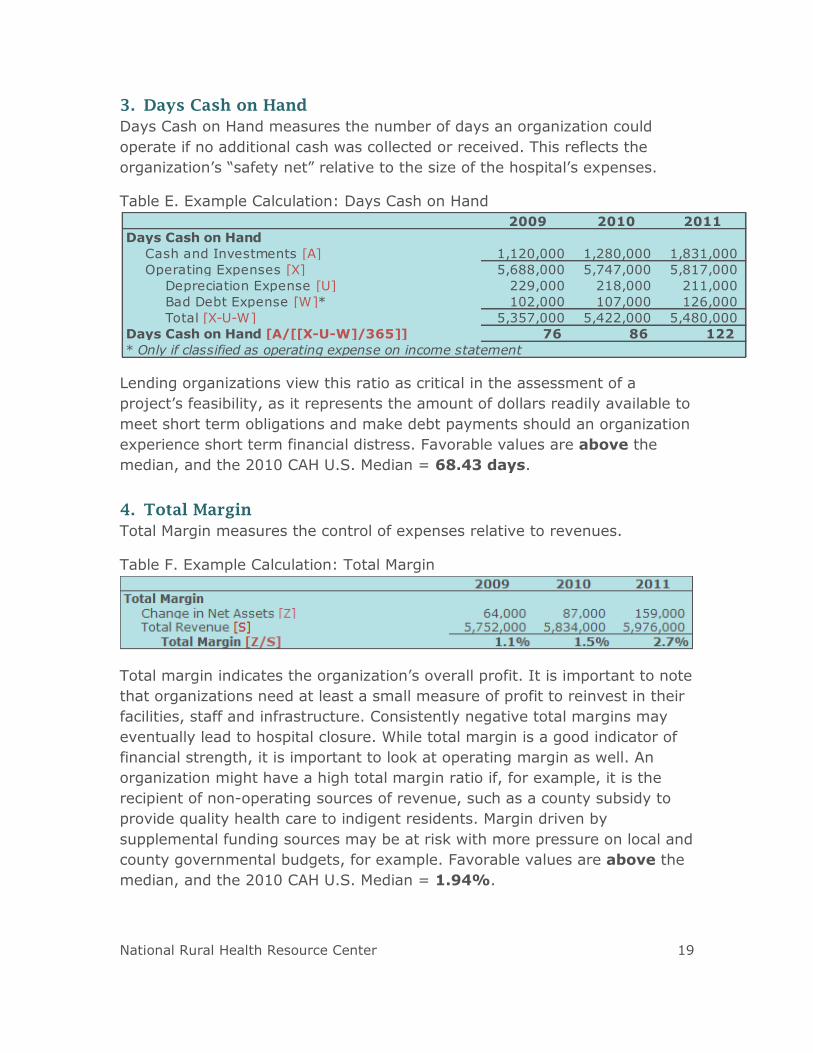
3. Days Cash on Hand
Days Cash on Hand measures the number of days an organization could
operate if no additional cash was collected or received. This reflects the
organization’s “safety net” relative to the size of the hospital’s expenses.
Table E. Example Calculation: Days Cash on Hand
Lending organizations view this ratio as critical in the assessment of a
project’s feasibility, as it represents the amount of dollars readily available to
meet short term obligations and make debt payments should an organization
experience short term financial distress. Favorable values are above the
median, and the 2010 CAH U.S. Median = 68.43 days.
4. Total Margin
Total Margin measures the control of expenses relative to revenues.
Table F. Example Calculation: Total Margin
Total margin indicates the organization’s overall profit. It is important to note
that organizations need at least a small measure of profit to reinvest in their
facilities, staff and infrastructure. Consistently negative total margins may
eventually lead to hospital closure. While total margin is a good indicator of
financial strength, it is important to look at operating margin as well. An
organization might have a high total margin ratio if, for example, it is the
recipient of non-operating sources of revenue, such as a county subsidy to
provide quality health care to indigent residents. Margin driven by
supplemental funding sources may be at risk with more pressure on local and
county governmental budgets, for example. Favorable values are above the
median, and the 2010 CAH U.S. Median = 1.94%.
2009 2010 2011
Days Cash on Hand
Cash and Investments [A] 1,120,000 1,280,000 1,831,000
Operating Expenses [X] 5,688,000 5,747,000 5,817,000
Depreciation Expense [U] 229,000 218,000 211,000
Bad Debt Expense [W]* 102,000 107,000 126,000
Total [X-U-W] 5,357,000 5,422,000 5,480,000
76 86 122
* Only if classified as operating expense on income statement
Days Cash on Hand [A/[[X-U-W]/365]]

National Rural Health Resource Center 20
5. Operating Margin
Operating Margin measures the control of operating expenses relative to
operating revenues related to patient care. Operating expenses are all
expenses incurred from the hospital in delivering services. Examples are
salaries and benefits, purchased services, professional fees, supplies, interest
expense, depreciation and amortization and bad debt expense.
Table G. Example Calculation: Operating Margin
This measure reflects the overall performance on the CAH’s core business:
providing patient care. It is important to note that it takes into account the
deductions from revenue, such as contractual allowances, bad debt and
charity care. Favorable values are above the median, and the 2010 CAH U.S.
Median = 0.75%.
6. Debt Service Coverage Ratio
Debt Service Coverage Ratio measures the ability to pay obligations related
to long-term debt.
Table H. Example Calculation: Debt Service Coverage Ratio
The measure reflects the availability of capital after debt obligations have
been satisfied. The debt service coverage represents a key ratio in
determining the ability of an organization to take on additional debt, whether
for IT, equipment or a building project. The higher the value of the debt
service coverage ratio, the greater the “cushion” to repay outstanding debt
or take on additional obligations. Favorable values are above the median,
and the 2010 CAH U.S. Median = 2.58.
2009 2010 2011
Operating Margin
Net Operating Income [R-X] (7,000) 10,000 63,000
Total Operating Income [R] 5,681,000 5,757,000 5,880,000
Operating Margin [[R-X]/R] -0.1% 0.2% 1.1%
2009 2010 2011
Debt Service Coverage Ratio
Change in Net Assets [Z] 64,000 87,000 159,000
Interest Expense [V] 28,000 17,000 13,000
Depreciation Expense [U] 229,000 218,000 211,000
Total [Z+V+U] 321,000 322,000 383,000
Principal Payments [AA] 169,000 145,000 90,000
Interest Payments [BB] 28,000 17,000 10,000
Total [AA+BB] 197,000 162,000 100,000
Debt Service Coverage Ratio [[Z+V+U]/[AA+BB]] 1.6 2.0 3.8
National Rural Health Resource Center 21
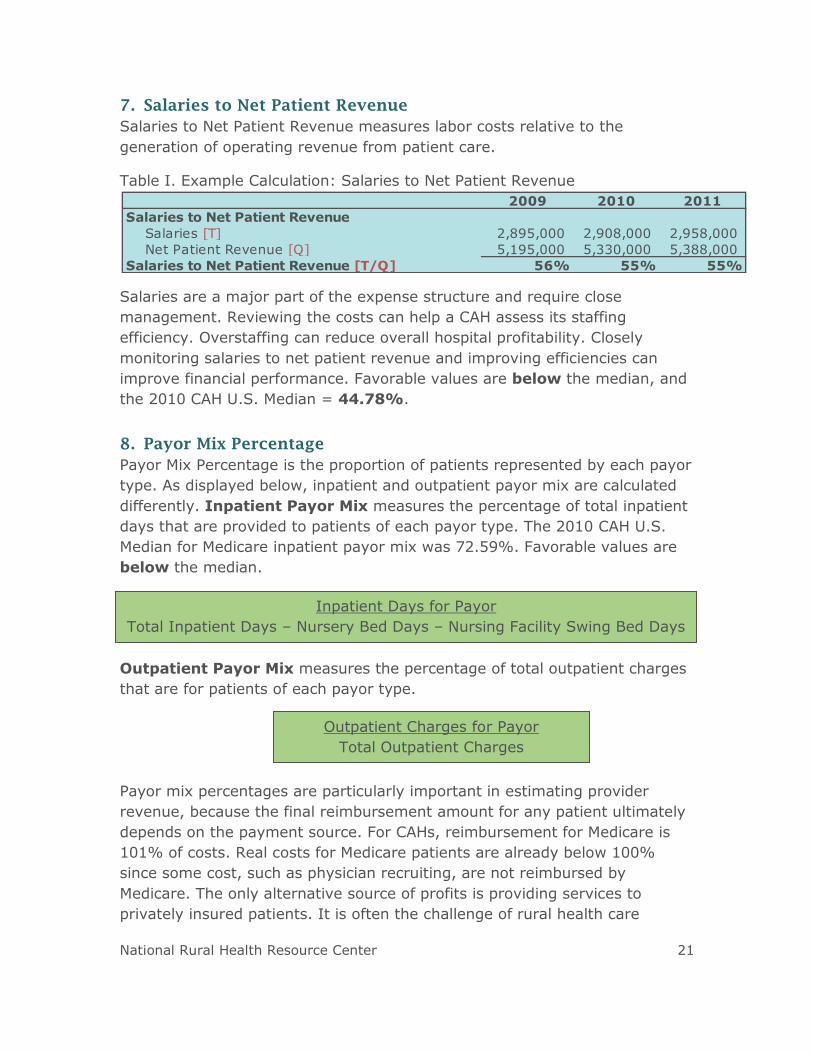
7. Salaries to Net Patient Revenue
Salaries to Net Patient Revenue measures labor costs relative to the
generation of operating revenue from patient care.
Table I. Example Calculation: Salaries to Net Patient Revenue
Salaries are a major part of the expense structure and require close
management. Reviewing the costs can help a CAH assess its staffing
efficiency. Overstaffing can reduce overall hospital profitability. Closely
monitoring salaries to net patient revenue and improving efficiencies can
improve financial performance. Favorable values are below the median, and
the 2010 CAH U.S. Median = 44.78%.
8. Payor Mix Percentage
Payor Mix Percentage is the proportion of patients represented by each payor
type. As displayed below, inpatient and outpatient payor mix are calculated
differently. Inpatient Payor Mix measures the percentage of total inpatient
days that are provided to patients of each payor type. The 2010 CAH U.S.
Median for Medicare inpatient payor mix was 72.59%. Favorable values are
below the median.
Outpatient Payor Mix measures the percentage of total outpatient charges
that are for patients of each payor type.
Payor mix percentages are particularly important in estimating provider
revenue, because the final reimbursement amount for any patient ultimately
depends on the payment source. For CAHs, reimbursement for Medicare is
101% of costs. Real costs for Medicare patients are already below 100%
since some cost, such as physician recruiting, are not reimbursed by
Medicare. The only alternative source of profits is providing services to
privately insured patients. It is often the challenge of rural health care
2009 2010 2011
Salaries to Net Patient Revenue
Salaries [T] 2,895,000 2,908,000 2,958,000
Net Patient Revenue [Q] 5,195,000 5,330,000 5,388,000
Salaries to Net Patient Revenue [T/Q] 56% 55% 55%
Inpatient Days for Payor
Total Inpatient Days – Nursery Bed Days – Nursing Facility Swing Bed Days
Outpatient Charges for Payor
Total Outpatient Charges

National Rural Health Resource Center 22
providers to operate profitably with a patient population that is comprised of
more Medicare and Medicaid business than urban providers.
9. Average Age of Plant
Average Age of Plant measures the average age in years of the buildings and
equipment of an organization.
Table J. Example Calculation: Average Age of Plant
CAHs often fail to improve or rebuild their facilities. The status of newer
facilities has been shown to have a positive effect on financial performance
and on the recruitment and retention of physicians and staff. Average age of
plant is a good indicator of distress with older hospitals having greater
problems. Lower, decreasing values indicate a newer facility or more
frequent reinvestments in buildings or equipment over time. Favorable values
are below the median, and the 2010 CAH U.S. Median = 9.87 years.
10. Long Term Debt to Capitalization
Long Term Debt to Capitalization measures the percentage of net assets (or
equity) that is debt.
Table K. Example Calculation: Long Term Debt to Capitalization
This ratio measures the amount of capital that is financed with debt, which is
important to lenders for long term viability. Higher values signify a riskier
situation and indicate that a hospital may have a harder time sustaining debt
payments in the future and/or getting financing from lenders. Favorable
values are below the median, and the 2010 CAH U.S. Median = 26.37%.
2009 2010 2011
Average Age of Plant
Accumulated Depreciation [E] 1,874,000 1,755,000 1,896,000
Depreciation Expense [U] 229,000 218,000 211,000
Average Age of Plant [E/U] 8.2 8.1 9.0
2009 2010 2011
Long Term Debt to Capitalization
Long Term Capital Liabilities [K] 186,000 183,000 178,000
Net Assets [M] 1,835,000 2,173,000 2,694,000
Long Term Debt to Capitalization [K/[K+M]] 9.2% 7.8% 6.2%

National Rural Health Resource Center 23
IS THERE A MODEL FOR PREDICTING CAH FINANCIAL
DISTRESS?
The CAH Financial Distress Model was developed by researchers from the
North Carolina Rural Health Research and Policy Analysis Center at University
of North Carolina at Chapel Hill.2 A well-functioning prediction model, such as
this, can be used as an early warning system to identify hospitals at
increased risk of facing financial distress. State Medicare Flex Programs, CAH
CEOs and boards reviewing the model could identify areas of particular
distress and develop strategies, or interventions, to improve financial
performance.
Today’s characteristics (recent financial performance and measures of a
market in which a hospital operates) are used to assign CAHs to one of four
“risk levels” that predict whether a CAH will be in financial distress two years
later. Many financial performance and market characteristics were considered
for inclusion. The final model was selected due to its ability to predict
performance in a straightforward manner. Variables used in the model are
noted below in Table L.
2 Mark Holmes, PhD and George H. Pink, PhD; North Carolina Rural Health Research
and Policy Analysis Center, University of North Carolina at Chapel Hill
National Rural Health Resource Center 24
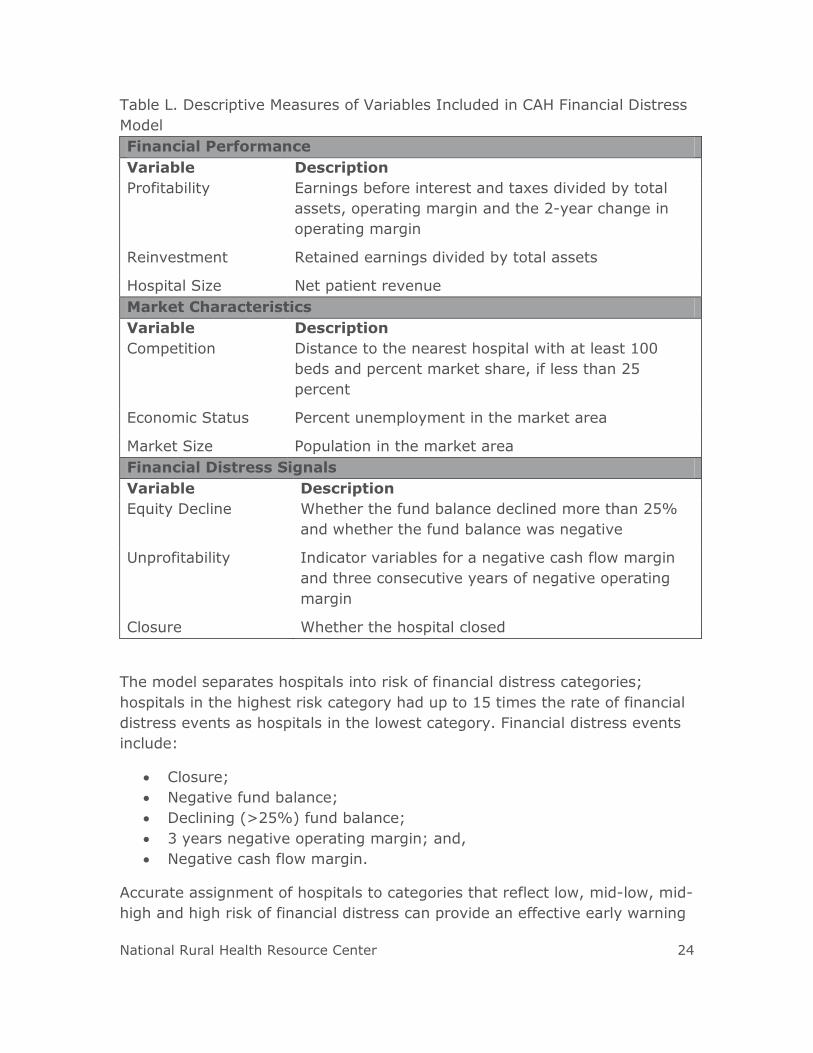
Table L. Descriptive Measures of Variables Included in CAH Financial Distress
Model
Financial Performance
Variable Description
Profitability Earnings before interest and taxes divided by total
assets, operating margin and the 2-year change in
operating margin
Reinvestment Retained earnings divided by total assets
Hospital Size Net patient revenue
Market Characteristics
Variable Description
Competition Distance to the nearest hospital with at least 100
beds and percent market share, if less than 25
percent
Economic Status Percent unemployment in the market area
Market Size Population in the market area
Financial Distress Signals
Variable Description
Equity Decline Whether the fund balance declined more than 25%
and whether the fund balance was negative
Unprofitability Indicator variables for a negative cash flow margin
and three consecutive years of negative operating
margin
Closure Whether the hospital closed
The model separates hospitals into risk of financial distress categories;
hospitals in the highest risk category had up to 15 times the rate of financial
distress events as hospitals in the lowest category. Financial distress events
include:
Closure;
Negative fund balance;
Declining (>25%) fund balance;
3 years negative operating margin; and,
Negative cash flow margin.
Accurate assignment of hospitals to categories that reflect low, mid-low, mid-
high and high risk of financial distress can provide an effective early warning
National Rural Health Resource Center 25
system to CAHs, allowing CAH Administrators and state Medicare Flex
Program Coordinators to target efforts to those at higher risk.
WHERE CAN I FIND INFORMATION ABOUT THE FINANCIAL
PERFORMANCE OF CAHS IN MY STATE?
A “Financial Indicators Report” is provided to individual CAHs late each
summer with a summary report for the state provided to the state Flex
Programs. These reports include a variety of metrics, and will now include
the Financial Distress Model. For more information, visit:
http://flexmonitoring.org/indicators.html.
WHAT INTERVENTIONS CAN CAHS USE TO IMPROVE
THEIR FINANCIAL PERFORMANCE?
The 2012 CAH Financial Leadership Summit identified a number of important
financial interventions that historically have been associated with improved
financial performance. They include:
Cost report review and strategy
Strategic, financial and operational assessments
Revenue cycle management
Physician practice management assessments
Lean process improvement training
Financial education for CAH department managers
Financial education for CAH boards
Pooling Small Rural Hospital Improvement Program (SHIP) dollars
Developing CFO networks
Benchmarking financial indicators
WHY IS A REVIEW OF THE COST REPORT IMPORTANT?
A review of the cost report can be completed by an outside party to look for
common errors in preparation. Because it drives Medicare payments, errors
on the cost report directly affect the bottom line, sometimes as much as
hundreds of thousands of dollars. Errors include incorrect allocations of
expenses and inaccurate statistics, for example. Most cost reports are
“outsourced,” but understanding direct and indirect costs and how cost
reports work is a critical input top making sound decisions for CEOs, CFOs
and board members.

National Rural Health Resource Center 26
WHAT IS A CHARGEMASTER AND HOW OFTEN SHOULD IT
BE REVIEWED?
The Charge Description Master (CDM) is primarily a list of services and
procedures, room accommodations, supplies, drugs/biologics, and/or
radiopharmaceuticals that may be billed to a patient registered as an
inpatient or outpatient on a claim. It is integral to the CAH’s revenue cycle
and provides many of the necessary data elements for compliant claims
submission for reimbursement. It is recommended to have an outside source
perform a comprehensive chargemaster and revenue cycle review annually.
Ongoing education is also crucial to having business office staff remain
current with information necessary to appropriately bill for services rendered.
Code changes and description changes must be communicated to the
departments who will be generating the charges and may need to be altered
or added to the system. Similarly, charge tickets may need to be updated.
Billing and coding workshops are available in many locations throughout the
country. For information on upcoming workshops and trainings, please visit:
http://www.ruralcenter.org/search/apachesolr_search?filters=tid%3A2%20ty
pe%3Aeducation_gateway&solrsort=created%20desc&retain-filters=1.
WHAT ARE STRATEGIC, FINANCIAL AND OPERATIONAL
ASSESSMENTS?
Strategic, financial and operational assessments provide a broad-based
analysis of hospital performance and help identify specific opportunities for
CAH improvement. These studies provide an objective review of the areas
where many CAHs need help, including:
Matching services to community needs;
Staffing to benchmarks;
Clinic management;
Medical staff planning; and,
Organizational culture.
Assessments are recommended periodically to determine areas of focus for
follow-up improvement work.
National Rural Health Resource Center 27
WHAT IS REVENUE CYCLE MANAGEMENT?
Revenue cycle management is a means to improve hospital revenue and
reimbursement by streamlining workflow, processes and education
throughout all financial components of the hospital. A holistic revenue cycle
management includes a multi-disciplinary approach focusing on culture
change with comprehensive, dramatic and permanent results. Specific areas
of focus may include:
o Comprehensive chargemaster and revenue cycle review
o Business office and patient financial services review
o Development of training protocols for revenue capture
o Implementation of an effective revenue control process
o Pricing analysis
o Recovery audit contractor (RAC) preparedness and revenue cycle
process improvement
o Revenue process capture audits
These assessments should result in identifying opportunities for improvement
and specific, actionable recommendations.
WHY ARE PHYSICIAN PRACTICE MANAGEMENT
ASSESSMENTS USEFUL?
As more and more physicians align and become employees of CAHs, it is
critically important to contract with physicians and operate the clinics
according to best practices. A practice management assessment looks at
physician and mid-level provider productivity, scheduling, staffing, billing and
collection practices specific to this area. These assessments should result in
specific recommendations and action plans that have the potential to bring in
additional revenue and improve clinic efficiency.
WHAT IS LEAN AND HOW CAN IT IMPACT CAH FINANCES?
Lean focuses on increasing efficiency and eliminating waste. This creates
greater value for customers and uses fewer resources. In the health care
setting, Lean processes can result in substantial cost savings, fewer delays
and increased patient and staff satisfaction. Lean education, Lean networks
and shared Lean expertise have all been successfully used by individual CAHs
and networks of rural hospitals.
National Rural Health Resource Center 28
WHY IS EDUCATION ON FINANCES IMPORTANT FOR CAH
DEPARTMENT MANAGERS AND BOARD MEMBERS?
Financial education for CAH department managers can enhance budgeting,
planning and financial skills in department heads, whose background may be
clinical rather than business or administrative. CAH Board members similarly
lack basic CAH financial knowledge. Financial education for CAH Boards
provides a fundamental grounding on cost-based reimbursement and CAH
financial strategies. Hospital financial management is complex and rural
hospital boards need a basic understanding of CAH finances to provided
needed oversight. This type of education has been done successfully with
rural hospitals using both on-site workshops and web-based presentations,
which are often stored and accessible online.
WHY IS COLLABORATION IMPORTANT FOR IMPROVING
FINANCES IN CAHS?
Two minds are better than one. Collaboration allows CAH staff to share ideas,
lessons learned, best practices and funds with one another. Many state Flex
Programs have provided support to develop CFO networks. CFO networks
have proven to be a popular method of education, peer learning and peer
support. In more than a dozen states, rural hospital CFOs meet periodically,
either in person or virtually, to discuss common issues, gain new skills and
share experiences and techniques.
Benchmarking financial outcomes among groups of hospitals is a common
means of measuring performance and comparing results. By collaboratively
comparing results, CAHs identify areas of strengths and weaknesses and
measure progress toward strategic goals. This collective benchmarking also
provides an opportunity for the hospitals to share common issues, best
practices and lessons learned. The University of North Carolina-Chapel Hill’s
distribution of an annual CAH Financial Indicators Report is a useful source
for benchmarking, but other information sources are also available.
Aside from the value of bringing collective minds together, using various
funding sources to achieve an end goal can be strategic. Pooling SHIP dollars
among a group of CAHs has provided an effective means of providing
financial or Lean education to hospital staff and boards. Economies of scale,
shared expertise, access to speakers and resources, peer learning and
support have all been reported as benefits of pooling resources.

National Rural Health Resource Center 29
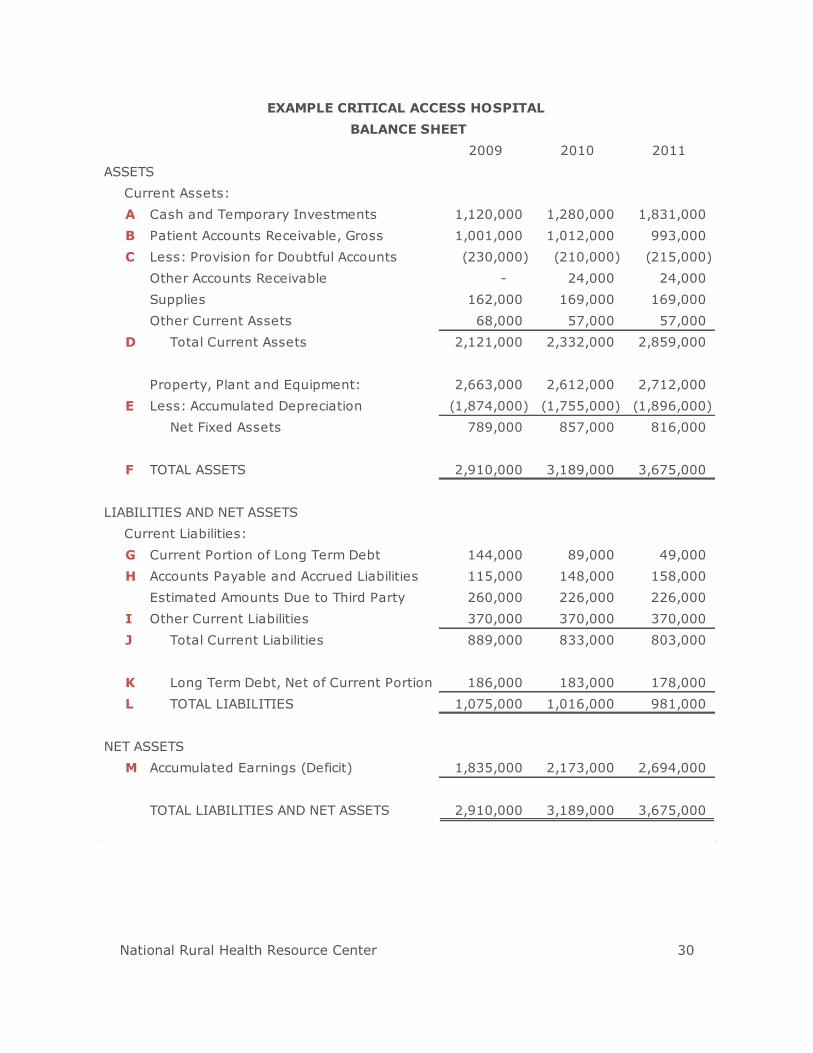
APPENDIX
National Rural Health Resource Center 30
2009 2010 2011
ASSETS
Current Assets:
A Cash and Temporary Investments 1,120,000 1,280,000 1,831,000
B Patient Accounts Receivable, Gross 1,001,000 1,012,000 993,000
C Less: Provision for Doubtful Accounts (230,000) (210,000) (215,000)
Other Accounts Receivable - 24,000 24,000
Supplies 162,000 169,000 169,000
Other Current Assets 68,000 57,000 57,000
D Total Current Assets 2,121,000 2,332,000 2,859,000
Property, Plant and Equipment: 2,663,000 2,612,000 2,712,000
E Less: Accumulated Depreciation (1,874,000) (1,755,000) (1,896,000)
Net Fixed Assets 789,000 857,000 816,000
F TOTAL ASSETS 2,910,000 3,189,000 3,675,000
LIABILITIES AND NET ASSETS
Current Liabilities:
G Current Portion of Long Term Debt 144,000 89,000 49,000
H Accounts Payable and Accrued Liabilities 115,000 148,000 158,000
Estimated Amounts Due to Third Party 260,000 226,000 226,000
I Other Current Liabilities 370,000 370,000 370,000
J Total Current Liabilities 889,000 833,000 803,000
K Long Term Debt, Net of Current Portion 186,000 183,000 178,000
L TOTAL LIABILITIES 1,075,000 1,016,000 981,000
NET ASSETS
M Accumulated Earnings (Deficit) 1,835,000 2,173,000 2,694,000
TOTAL LIABILITIES AND NET ASSETS 2,910,000 3,189,000 3,675,000
EXAMPLE CRITICAL ACCESS HOSPITAL
BALANCE SHEET

National Rural Health Resource Center 31
2009 2010 2011
REVENUE
N Total Inpatient Revenue 2,402,000 2,445,000 2,471,000
O Total Outpatient Revenue 3,993,000 4,015,000 4,032,000
P Total Gross Revenue 6,395,000 6,460,000 6,503,000
Less: Contractual Allowances (1,200,000) (1,130,000) (1,115,000)
Q Net Patient Revenue 5,195,000 5,330,000 5,388,000
Other Operating Revenue 486,000 427,000 492,000
R Total Operating Revenue 5,681,000 5,757,000 5,880,000
Gain (Loss) on PP&E Disposal (2,000) (3,000) -
Contributions/Grants 65,000 69,000 77,000
Investment Income 8,000 11,000 19,000
S Total Revenue 5,752,000 5,834,000 5,976,000
EXPENSES
T Salaries 2,895,000 2,908,000 2,958,000
Benefits, Supplies, & Other 2,434,000 2,497,000 2,509,000
U Depreciation and Amortization 229,000 218,000 211,000
V Interest 28,000 17,000 13,000
W Provision for Doubtful Accounts/Bad Debt 102,000 107,000 126,000
X Total Expenses 5,688,000 5,747,000 5,817,000
Y EXCESS OF REVENUES OVER EXPENSES 64,000 87,000 159,000
Restricted Contributions - -
Z CHANGE IN NET ASSETS 64,000 87,000 159,000
EXAMPLE CRITICAL ACCESS HOSPITAL
STATEMENT OF OPERATIONS

National Rural Health Resource Center 32
2009 2010 2011
CASH FLOWS FROM OPERATING ACTIVITIES
Change in Net Assets 522,000 547,000 542,000
Adjustments to reconcile change in
net cash provided by operating
activities: 246,000 459,000 (210,000)
Purchase of Other Assets (3,000) (6,000) -
Other Current Liabilities 34,000 - -
Net Cash Provided by Operating Activities 799,000 1,000,000 332,000
CASH FLOWS FROM FINANCING ACTIVITIES
AA Repayment of Debt (169,000) (145,000) (90,000)
Purchases of PP&E (63,000) (189,000) (100,000)
BB Interest Paid on Long Term Debt (28,000) (17,000) (10,000)
Gifts to Purchase Capital Assets 46,000 - -
Net Cash Used by Investing Activities (214,000) (351,000) (200,000)
CASH FLOWS FROM INVESTING ACTIVITIES
Interest and Dividends on Investments 8,000 11,000 19,000
Net Cash Used by Investing Activities 8,000 11,000 19,000
NET INCREASE (DECREASE) IN CASH 593,000 660,000 151,000
CASH, BEGINNING OF YEAR 527,000 1,120,000 1,780,000
CASH, END OF YEAR 1,120,000 1,780,000 1,931,000
EXAMPLE CRITICAL ACCESS HOSPITAL
STATEMENT OF CASH FLOWS


