Download - By: Kedar Pokharel

COMPARATIVE STUDY ON PORTFOLIO MANAGEMENT OF KUMARI BANK LTD. AND EVEREST BANK LTD.
By:
Kedar Pokharel Post Graduate Campus, Biratnagar
T.U. Registration No: 7-1-3-1315-98
A Thesis Submitted to: Office of the Dean
Faculty of Management
Tribhuvan University
In partial fulfillment of the requirements of the degree of Masters of Business Studies (MBS)
Biratnagar,Morang
May 2009

2
TRIBHUVAN UNIVERSITY
POST GARAUATE CAMPUS
BIRATNAGAR, NEPAL
Phone No 021526327
_Ref No
VIVA VOCE SHEET
We have conducted the viva-voce examination of the thesis presented by
KEDAR POKHAREL
entitled
COMPARATIVE STUDY ON PORTFOLIO MANAGEMENT OF
KUMARI BANK LTD. AND EVEREST BANK LTD.
and have found the thesis to be the original work of the student written
according to the prescribed format. We recommend the thesis to be accepted as
partial fulfillment of the requirements for
Master’s Degree in Business Studies (M.B.S.)
Viva-Voce Committee
Chairperson Research Committee ………………………………………
Member (Thesis Supervisor)
(Prof. Dr. Khagendra Acharya) ………………………………………
Member (External Expert) ………………………………………
Date: ………...………….

3
TRIBHUVAN UNIVERSITY
POST GARAUATE CAMPUS
BIRATNAGAR, NEPAL
Phone No 021526327
_Ref No
RECOMMENDATION
This is to certify that the thesis:
Submitted by
KEDAR POKHAREL
entitled
COMPARATIVE STUDY ON PORTFOLIO MANAGEMENT OF
KUMARI BANK LTD. AND EVEREST BANK LTD.
has been prepared as approved by this department in the prescribed format of
Faculty of Management. This thesis is forwarded for examination.
Thesis Supervisor
(Prof. Dr. Khagendra Acharya)
.............................................
Head of Research Department (Prof. Dr. Madhav Bahadur Shrestha)
..................................................
Campus Chief (Mr. Harihar Bhandari)
…………………………………….
Date: ………………………..
4
DECLARATION
I here by declare that the work reported in this thesis entitled “Comparative study on
Portfolio management Practices of Kumari Bank Ltd. and Everest Bank Ltd.”
submitted to Office of the Dean, Faculty of Management, Tribhuvan University is my
original work done in the form of partial fulfillment of the requirement of Master of
Business Studies (MBS) under the guidance and supervision of Prof. Dr. Khagendra
Acharya (Thesis Supervisor) and Prof. Dr. Madhav Bahadur Shrestha(Head of
Research Department) of Post Graduate Campus Biratnagar.
Date: May 2009
Researcher
Kedar Pokharel
Roll No. 067 (2060)
Post Graduate College
Exam Roll No: 262
T.U. Regd. No7-1-3-1315-98.

5
ACKNOWLEDGEMENT
I wish to extend my deep sense of indebtedness to my thesis supervisor Prof. Dr.
Khagendra Acharya., who provided me valuable guidelines, insightful comments,
encouragement and generous treatment to complete this thesis. This work has been
come out in the present form with his inspiration, valuable suggestions, and
guidelines. Similarly, I would also wish to extend my sincere gratitude to Prof. Dr.
Madhav Bahadur Shrestha, who guided me a lot during the course of preparation of
this report. I am also extremely indebted to all the teachers of Post Graduate Campus
Biratnagar, who encouraged me in my entire academic attempt.
I express my heartfelt gratitude to my parents and all my family members who always
inspired me to complete this journey of higher education from the benchmark of my
academic qualification that I had. Without their encouragement and inspiration, my
higher education could not have been fulfilled.
I would also like to thank my friends and colleagues Mr Khagendra Sigdel,Mr. Ravi
Dahal,Mr Suman Adhikari,Mr Navaraj Pokharel,Mr. Satish Poudyal and all other
friends who have helped me in completing this endeavor . Without their cordial
cooperation this work could have been very difficult for me. Similarly, I thank to all
the co-workers, seniors and juniors of Kumari Bank Ltd., Biratnagar who always
encouraged me to complete this work.
Thank You.
Date: May 2009 Kedar Pokharel
Researcher

6
7
LIST OF ABBREVIATIONS
CDR : Credit Deposit Ratio
CRR : Cash Reserve Ratio
CV : Coefficient of variation
EPS : Earning Per Share
FDR : Fixed Deposit Receipt
Forex : Foreign Exchange
FY : Fiscal Year
GDP : Gross Domestic Product
JVBs : Joint Venture Banks
KBL : Kumari Bank Limited
EBL : Everest Bank Limited
LC : Letter of Credit
NBBL : Nepal Bangaladesh Bank Limited
NBL : Nepal Bank Limited
NEPSE : Nepal Stock Exchange
NIBL : Nepal Indosuez Bank Limited (current Nepal Investment Bank
Limited)
NIM : Net Interest Margin
NPA : Non-Performing Assets
NPL : Non-Performing Loan
NRB : Nepal Rastra Bank
NRs. : Nepalese Rupees
OBS : Off Balance Sheet
RBB : Rastriya Banijya Bank
ROA : Return on Assets
ROE : Return on Equity
SCBNL : Standard Chartered Bank Nepal Limited
SD : Standard Deviation

8
TABLE OF CONTENTS
Page No.
Recommendation
Viva-Voce sheet
Declaration
Acknowledgement
Table of Contents
List Abbreviations
CHAPTER 1: INTRODUCTION 1-9 1.1 Background of the Study 1
1.2 Focus of the Study 4
1.3 Introduction of Banks Under Study 5
1.4 Statement of the Problem 6
1.5 Objectives of the Study 7
1.6 Significance of the Study 8
1.7 Limitations of the Study 8
1.8 Organization of the Study 9
CHAPTER 2: REVIEW OF LITERATURE 10-22 2.1 Conceptual Review 10
2.1.1 Concept of Portfolio 13
2.1.2 Concept of Portfolio Management 13
2.1.3 Assumptions of Portfolio Management 13
2.1.4 Objective of Portfolio Management 14
2.2 Review of Related Studies 15
2.2.1 Review of Research Papers 15
2.2.2 Review of Thesis 17
CHAPTER 3: RESEARCH METHODOLOGY 23-35 3.1 Research Design 23
3.2 Population & Sample 23
3.3 Data Collection Procedure 23
3.4 Sources of Data 24
3.5 Data Analysis Tools 24
3.5.1 Financial Tools 24
3.5.2 Statistical Tools 33

9
CHAPTER 4: PRESENTATION AND ANALYSIS OF DATA 36-68 4.1 Liquidity Ratios 36
4.2 Assets Management Ratios 39
4.3 Activity Ratios 44
4.4 Profitability Ratios 46
4.5 Growth Ratios 53
4.6 Correlation Coefficient Analysis 56
4.7 Trend Analysis and projection for Next Five Years 58
4.8 Major Findings of the Study 63
CHAPTER 5: SUMMARY, CONCLUSION AND RECOMMENDATIONS 69-77
5.1 Summary 69
5.2 Conclusion 73
5.3 Recommendations 76
BIBLIOGRAPHY
APPENDIX
10
CHAPTER – I
INTRODUCTION
1.1 Background of the Study
Nepal is one of the least developed countries characterized by high population
growth rate, low per capita income, and low rate of capital formation having
unlimited resources. Therefore, Nepal like other developing countries has
been facing the problem of accelerating the pace of economic development
and Nepal is not the exception.
A sound banking system is a precondition for healthy economy and economic
policy formulation. An efficient banking system becomes a top priority as
country moves toward free market economy which allows private sectors
saving to be retained in the country for the promotion of investment needed
for the growth.
Capital formation and its proper utilization are two important aspect of
economic development of a country. Private investment can be the significant
contributor to economic growth and employment generation in the developing
country. “Economic development demands transformation of saving into
actual investment. And it is the financial institutions that transfer funds from
surplus spending units to deficit units” (NRB, 1996:4). Economic
development is supported by financial infrastructure of the country.
Banks are the principal source of credit for millions of individuals and
families and for units of government. Moreover, for small local businesses
ranging from grocery stores to automobile dealers, banks are often the major
11
source of credit to stock the shelves with merchandise. Banks grant more
installment loans to consumer than any other financial institutions.
In most years, banks are the leading buyers of bonds and notes issued by
government to finance public facilities, ranging from hospital and football
stadium to airport and highways. Moreover, bank reserves the principal
channel for government economic policy to stabilize the economy. And banks
are also the most important sources of short -term working capital needed for
the businesses. They have become increasingly active in recent years in
making long-term business loans for new plant and equipment. When
businesses and consumers must make payments for the purchase of goods and
services, more often they use bank provided cheques, credit or debit cards, or
electronic accounts connected to a computer network. It is the banker to whom
they turn most frequently for advice and counsel when they need financial
information and financial planning.
An investment in any funds is made to have some positive rate of return.
Nobody is ready to bear risk without any return but to have returned one must
ready to face some risk. To minimize the risk at the given rate of return the
concept of portfolio diversification is necessary. Portfolio is simply a
collection of securities gathered to achieve certain investment goals.
“Investment positions are undertaken with the goal of earning some expected
return. Investors seek to minimize inefficient deviations from this expected
rate of return. Diversification is essential to the creation of a n efficient
investment because it can reduce the variability of returns around the expected
return” (Francis, 2003:228)
The growth of any commercial bank depends upon its financing and
investment policy. A sound financing and investment policy attracts bo th
borrowers and lenders, which helps to increase the volume and quality
deposits and investment. Both the depositors and creditors are customers of

12
the banks. Banks offer various products for deposit mobilization and disburse
the credit products as per the portfolio management. Customers as per their
need purchase different types of products offered in the market. Deposit
products offered to the customers are categorized into general products and
special products. Mobilization of deposit simply by increasing the rate of
interest is termed as general products and special products are developed in
terms of schemes generally refundable at longer period of time. Customers
choose the respective better general products and special products from among
the products available in the market. Special products focus on some specific
value and needs of the customers. Under this comes the education scheme for
the children, daughter’s marriage scheme and retirement pension scheme,
among others.
A systematic investment process should be followed to win the stock market.
Investment process describes how an investor should go about making
decisions with regard to what marketable to invest in, how extensive the
investment should be and when the investment should be made. A five step
procedure for making these decisions forms the basis of the investment
process (Baily, 1995:9):
Set Investment Policy
Perform Security Analysis
Construct a Portfolio
Revise the Portfolio
Evaluate the Portfolio
Loans are an essential aspect of commercial banking functions. “First income
from loan contributes substantially to the revenues and profit of the bank.
Second, lending money to people in the community strengthens the
community-bank relationship. Third, lending money spurs business
development and supports a growing economy (Edmister, 1980:82).” Credit
being the most important function of commercial banks, affects overall
13
development of the country. So far as pace of economic development is
considered, it is directly related to the quality and quantity of credit, which is
derived from various financial institutions especially commercial banks of
Nepal.
Investment operation of commercial banks is very risky one. For this,
commercial banks have to pay due consideration while formulating Investment
policy. A rapid development of any commercial bank depends upon its
investment policy. A sound investment policy attracts both borrowers and
lenders, which helps to increase the volume and quality deposits and
investment.
1.2 Focus of the Study
In any firm, Portfolio Management is taken as major financial decision, which
affects the value of firm. The performance of any business organization
largely depends upon its investment policy. Furthermore, investors invest their
money analyzing the investment policy of a business organization. Therefore,
investment policy is regarded as an important decision with respect to
management and investors.
A bank always puts in effort to maximize its profitability. The profit is excess
of income over expenses. To maximize profit income should be reasonably
excess over expenses. The major source of income of a bank is interest income
from loans, investments and fee based income. As loan and advances dominate
the asset side of the balance sheet of any bank; similarly, e arnings from such
loan and advances occupy a major space in income statement of the bank.
However, it is very important to be reminded that most of the bank failures in
the world are due to the shrinkage in the value of loan and advances. Hence,
loan is known as risky asset and investment operation of commercial banks is
very risky one. Risk of non-performing loans erodes even existing capital.

14
Considering the importance of lending to the individual banks and also to the
society it serves, it is imperative that the bank meticulously plans its credit
operations. Sound credit policy has the following objectives:
To have performing assets.
To give guidance to lending officials.
To establish a standard for control.
To contribute to economic development.
Considering these facts, this study mainly focuses on the Portfolio
Management practices of Kumari Bank Ltd. and Everest Bank Ltd.
1.3 Introduction of Banks Under Study
Kumari Bank Ltd. (KBL) came into existence as part of Rastra Bank’s
liberalization of the Nepalese Banking Industry by starting it’s operation from
Chaitra 21,2057 B.S.(April 03, 2001). KBL stands in the market with a vision
to be a world class Nepalese Bank and to be a leading financial institution of
the country. Its goal is to create its own niche in the market and get
recognition as the most preferred organization among its customers,
shareholders, regulatory authorities and all its stakeholders. And its business
philosophy is ‘WE DO IT’. Due to the use of Hi-Tech banking system of the
world it is growing rapidly and has 17 branches.
The current Capital Structure of KBL is as: Paid-up Capital Rs. 750M,
General Reserve Fund Rs. 84.862M, Cumulative profit Rs. 35.031M, Capital
Adjustment Fund Rs. 150M, General Loan loss Provision Rs. 89.577M, and
Exchange Equalization Reserve Rs. 5.737M. Thus, total capital fund is Rs.
1115.207M as at end of FY 2062/63.
Everest Bank Ltd. (EBL) a joint venture with Punjab National Bank (India)
started its operation in 2051B.S.(1994 A.D.) with a view and objective o f
extending professionalized and efficient banking services to various segments
of the society. The bank is providing customer friendly services through a
network of 23 branches across the country.
15
The current Capital Structure of EBL is as: Paid-up Capital Rs. 378M, Share
Premium Rs. 6.427M, Non-Redeemable Preference Shares Rs. 140M, General
Reserve Fund 232.848M, Cumulative Profit Rs. 130.547M, Capital
Adjustment Fund Rs. 283.5M, Other Fund Rs.13.226M, General Loan Loss
Provision Rs. 137.506M, Unsecured subordinated Term Debt Rs. 300M,
Exchange Equalization Reserve Rs. 16.968M, Other free Reserve Rs. 50.508M
Investment under Under-writing Rs 19.414M. Thus, total capital fund is Rs.
1676.115M as at end of FY 2063/64.
(The abovementioned datum are based on the published Annual report for
fiscal year 2063/64)
1.4 Statement of the Problem
Portfolio Management is a relatively new concept in Nepalese content. Many
companies still have no awareness towards it. The study proposes to the
investors’ awareness about the portfolio management of the financial
institutions while investing.
Investors can be classified into three categories on the basis of risk and return.
First type of investors is risk seeker who becomes ready to face high risk in
the hope of high return. The second type of investors is risk averters who try
to avoide risk and ready to be satisfied in the low return. The third type of
investors comes along in between these two investors called risk neutral.
These investors are ready to bear medium sized risk and have medium sized
return.
The major problem in almost all underdeveloped countries and Nepal is no
exception, is that of capital formation and proper utilization. In such
countries, the commercial banks have to shoulder more responsibilities a nd
acts as development banks, due to the lack of other specialized institutions.
16
Thus, in this scenario of Nepalese Commercial banking sector, this study
mainly seeks the answers of the following specific problems related to
Portfolio Management practices of Kumari Bank Ltd. and Everest Bank Ltd.
What is the proportion of Non-performing Asset on total loans and
advances of the bank?
What is the portfolio behavior of the bank?
Are the banks’ funds mobilization and Portfolio Management effective
and efficient?
Is there any stability in fund mobilization policy or not?
What is the relationship of investment and loans and advances with
total deposit and net profit?
1.5 Objective of the Study
The main objective of the study is to compare the Portfolio Manage ment
practices of Kumari Bank Ltd. and Everest Bank Ltd. However the specific
objectives are:
To compare the liquidity management, asset management efficiency,
profitability position, risk position, investment practices of
aforesaid Banks.
To find out the relationship between deposit and total investment,
deposit and loans and advances and net profit.
To find out the non-performing asset position of the banks.
To analyze the risk return ratios of investment the banks.
To evaluate the portfolio management of the banks.

17
1.6 Significance of the Study
Commercial banks in the developing countries like Nepal have the greatest
responsibility towards the economic development of the country. In modern
times, since credit or bank money constitutes bulk is of the economy’s
aggregate money supply, it mostly changes the volume of bank money or
credit rather than changes in the total supply of the high-powered money
issued by the reserves held by the bank against their deposit liabilities that
account for changes in the aggregated money supply. The main goal of the
bank as a commercial organization is to maximize the surplus by the efficient
use of its funds and resources. In spite of being a commercial institution, it too
have a responsibility (obligation) to provide social service oriented
contribution for the social economic upliftment to the country by providing
specially considered loans and advances towards less privileged sectors.
Hence, the study is needed to examine the overall performance of KBL and
EBL especially in collection of deposits and its utilization. The study will
have to know the overall performance of KBL and EBL. So, it will be useful
for the different stakeholders.
1.7 Limitations of the Study
This study has the following limitations:
a) This is a comparative study of KBL and EBL. So the findings of the
study cannot be generalized.
b) The study is based on the secondary data published on annual report.
c) Among many factors affecting investment decision, only certain factors
i.e. liquidity, profitability, diversification, growth, etc. have been
considered.

18
1.8 Organization of the Study
The whole study has been divided into five chapters as:
Chapter I. Introduction: This Chapter deals with the background of the study,
focus of the study, introduction of banks under study, statement of the
problem, Objective of the study, Significance if the study, Limitations of the
study, and organization of the study.
Chapter II. Review of Literature: This chapter includes the conceptual review
and review of related studies.
Chapter III. Research Methodology: This chapter includes the research design,
sources of data and data analysis tools.
Chapter IV. Presentation and Analysis of Data: This chapter includes the
liquidity ratios, assets management ratios, activity ratios, profitability ratios,
growth ratios, correlation coefficient analysis, trend analysis, and major
findings of the study.
Chapter V. Summary, Conclusions and Recommendations: This chapter
includes Summary, Conclusions, and Recommendations of the st udy.

19
CHAPTER – II
REVIEW OF LITERATURE
This chapter is mainly concerned with the competent exploration of the
background to the work and a comprehensive review of recent and relevant
literature. In this regard, the effort has been made to grasp knowledge and
information that is available from libraries, document collection center, other
information managing bureaus and concerned commercial banks. This chapter
helps to take adequate feedback to broaden the information base and inputs to
the study. Conceptual framework is given by different researchers, authors,
practitioners, scholars, etc. is reviewed from research papers, books, annual
reports, articles, etc.
2.1 Conceptual Review
A commercial bank is a business organization that receives and holds deposits
of funds from others, makes loans or extends credits and transfers funds by
written order of deposits. Commercial Bank Act of Nepal (1974) has defined
that “A commercial bank is one which exchanges money, deposits money,
accepts deposits, grant loans and performs commercial banking functions and
which is not a bank meant for co-operative, agriculture and industries or for
such specific purpose.”
American Institute of Banking (1972) has defined as “Commercial bank is a
corporation, which accepts demand deposits subject to check and makes short -
term loans to business enterprise, regardless of the scope of its other
services”. This act has laid emphasis on the functions of commercial bank
while defining it. Commercial banks provide short – term debts necessary for
trade and commerce. They take deposits from the public and grant loans in
20
different forms. They purchase discount bills and promissory notes and
exchange foreign currencies. They discharge various functions on behalf of
their customer that they are paid for their services.
Commercial banks, as financial institution, perform a number of internal
functions. Among them, providing credit is considered as most important one.
In the words of H.D. Crosse (1963), “Commercial banks are very risky one.
For this, commercial banks have to pay due consideration while formulating
investment policy regarding loan investment. Investment policy is one facet of
the overall spectrum of policies that guide banks investment operations.”
“A bank’s marketing starts with proper relationship with customers either to
attract savings or for the loan disbursement. Both the depositors and creditors
are customers of the banks. Banks offer various products for deposit
mobilization and disburse the credit products as per the portfolio management.
Customers as per their need purchase different types of product offered in the
market. Deposit products offered to the customers are categorized into general
products and special products. And credit products can be bifurcated into fund
based products and non-fund based products” (NRB, 2007:1). The fund based
products in practice are developed from the credit products generally known
as overdraft, working capital loan, Term loan, bills purchase or negotiation,
export and import bills, import/trust receipt loan, export credit, loan against
fixed deposit receipt, loan against shares, loan against securities, and loan
against bank guarantee and deprived sector loan. The term loan used in
practice generally addresses short term loam medium term loan and long term
loan to be advanced in various forms such as housing loan, hire purchase loan
and bridge financing. The non-fund based product is composed of letter of
credit (LC) and bank guarantees with different forms (bid bonds, performance
bonds, etc.)
“Among the different banking products available in the market, the product
with high demand are consumer credit, export and import credit, term loan,

21
Project loan and syndicate loan. All banks and financial institution on the
basis of their capital base and liquidity position offer these credit products but
none of them so far have been found to have expertise in any one of them for
marketing. Relying on any one product by portfolio seems more risky. Banks
in foreign countries are known to bring out numerous products. As an
example, the bank of America has the vast range of banking business serving
individuals and small firms and a big share of the loan syndicate market”
(Economist, 2006:10). It means markets are there for some products and it i s
created for others. Banks in Nepal are weak in locating the existing market
and in creating new markets too.
“Loan disbursement is a trade of win-win game lenders and borrowers both
get benefited out of it. Customers, not products are the ultimate source of
income. For the analysis of customers several questions need to be answered.
These includes questions such as which customers buy the product and how
they use it, where customers buy the product, when customer buy, how
customer choose, why they preferred that product, how they respond, and will
they buy it again. All these data available in the respective files of the
customer make the marketing activities quite easier and effective” (NRB,
2007:3)
Market makers play an important role in the contract between the borrowers
and the bank. In principle, it is the duty of the consultant to sell the project on
behalf of the borrower to the bank. The rejection of the project can raise the
question about the knowledge and quality of the consultant. But in Nepal ,
after the preparation of the project the duty of the consultant gets over. And it
is the borrower who exercises his personal contact to get the project approved.
Each bank follows some process and system for loan approval and for
accepting the deposits. At first, the banks demand a detailed proposal of a
project along with an application for loan. The respective loan officer accesses

22
the proposal submitted to the bank and recommends for approval if the
proposal is found viable. Normally, only feasible projects are accepted. The
preparation of project proposal is a professional job assigned to any consulting
firm or organization. The company that needs credit lacks that type of
expertise with in the organization. To get the bank credit properly and
effectively, there is a network of the parties' involved in the borrowing. These
parties are: a) Borrower, b) Consulting firm for the project preparation, c)
Bank and d) Consulting firm for collateral valuation.
2.1.1 Concept of Portfolio
Portfolio is the holding of a collection of investment. For some individuals
and institutions, it is the entire holdings consisting of both assets and
liabilities. An investment held as part of a portfolio is less risky then the same
investment held individually. So, every individuals and institutions should
manage the portfolio by which the individuals and institutions get maximum
return. The concept of portfolio comes from "not putting all the eggs in one
basket".
2.1.2 Concept of Portfolio Management
The management of portfolio is called the portfolio management. Portfolio
theory evaluates the reduction of non-systematic or diversifiable risks through
the selection of securities or other instruments in to a composite holding or
efficient portfolio. This efficiency means that a portfolio would offer lower
risks or more stable returns for a targeted return level. Instruments that have
independent returns lower non-systematic risks. Also, instruments that are
inversely related on a return basis reduce the diversifiable risks.
23
2.1.3 Assumptions of Portfolio Management
The basic theory assumes that returns are independent, investors expectations
are homogeneous, and that the normalized probability distributions are stable.
2.1.4 Objective of Portfolio Management
The portfolio manager’s task is to select the investment weights that will
result in dominant investments. Here after, dominant assets will be called
“efficient portfolios” whether they content one or many assets. An efficient
portfolio than is any assets or combinat ion of assets that has (1) the minimum
expected return in its risk class or conversely,(2) the minimum risk at its level
of expected return.
Investment positions are undertaken with the goal of earning some expected
rate of return. Investors seek to minimize inefficient deviations from this
expected rate of return. Diversification is essential to the creation of an
efficient investment because it can reduce the variability of returns around the
expected return.
A healthy development of any bank depends heavily upon its investment
policy. A sound and viable investment policy can attract both borrowers and
lenders which help to increase volume and quality of deposits, loans and
investments. The loan provided by commercial bank is guided by fundamental
principles such as length of time, their purpose, profitability, safety and so on.
These fundamental principles are fully considered while making investment
policy. Emphasizing upon this H. D. Crosse stated, “The investment policy
should be carefully analyzed.” Commercial bank should ensure minimum risk
and maximum profit from lending.
“Commercial bank should consider the national interest followed by
borrower’s interest and the interest of the bank itself, before investing to the
borrowers.” To further peruse his views bank lending must be for such
purpose of the borrowers that are in keeping with the national policy and
bank’s overall investment policy” (Clemens, 1994:29).

24
Optimal investment decision plays a vital role in each and every organization.
But especially for the commercial bands and other financial institutions the
sound knowledge of investment is the most because the subject is relevant for
all surrounding that mobilize funds in view of return. As it is concerned to the
commercial banks and other financial institutions; they must mobilize (i.e.
investment on different sectors) their collections (deposits) and other funds
towards the profitable, secured and marketable sectors so that they will be in
profit. For this purpose the banks and financial institutions should gather the
sufficient information about the firm (client) to which supposed to be
invested. The information include as financial background, nature of business
as well as its ability to repay the loan back. These all information should be
gathered from the view point of security.
2.2 Review of Related Studies
2.2.1 Review of Research Papers
Under this heading, reviews of research papers of researchers are analyzed to
find out the investment policies of commercial banks.
Govinda Bahadur Thapa, expresses his views in his research paper
“Financial System of Nepal” that the commercial banks including foreign joint
venture banks seem to be doing pretty well in mobilizing deposits. Likewise,
loans and advances of these banks are also increasing. But compared to high
credit needs particularly by newly emerging industries, the bank still seems to
lack adequate funds. The banks are increasing their lending to non –traditional
sectors along with the traditional sectors. Out of all commercial banks
(excluding two recently opened regional commercial banks), Nepal Bank Ltd.
and Rastriya Banijya Bank are operating with a nominal profit, the later
turning towards negative from time to time. Because of growing competition
and limitation of investment sectors, the spread between interest income and
25
interest expenses is declining. These banks have not been able to increase
their income from commission and discount. On the contrary, they have got
heavy burden of personal and administrative overheads. Similarly, due to
accumulated overdue and defaulting loans, profit position of these banks has
been seriously affected. On the other hand, the foreign joint venture banks
have been functioning in an efficient way. They are making profit year after
year and have been distributing bonus to their employees and dividends to
their shareholders.
He concludes that by its very nature of the public sector, these two domestic
banks couldn’t compete with the private sector banks, so only remedy to the
problems of these banks, as the government decided, is to hand over the
ownership as well as the management of these banks to the private hands
(Thapa, 1994:29-37).
Radhe S. Pradhan in his research paper “Role of Saving, Investment and
Capital formation in Economic Development, A case of Nepal,” has studied
about the strong role and impact of saving, investment and capital formation
on economic development of Nepal. This study is based on secondary data
only. The necessary data on saving, investment, capital formation and gross
domestic product has been collected for the period of 1974/75 to 2000/01. The
role and impact of saving, investment and capital formation on economic
development were analyzed by using various regression models. The
regression equations used in this study have been estimated at current prices
as well as in real terms with the entire study period divided into different sub
periods.
The results presented in this paper suggest that in all cases, GDP is
significantly associated with saving, investment and capital formation both at
current prices and in real terms. The results of the empirical analysis led to
three important conclusions: First, saving, investment and capital formation
have positive impact on economic development. Second, the current values

26
and past values of saving, investment and capital formation have positive
impact on economic development but the current values have the largest
impact. Third, there is a strong role played by saving and capital formation on
economic development while weak role-played by
investment.(Pradhan,2003:123-133)
2.2.2 Review of Thesis
Several thesis works have been conducted by various students regarding the
various aspects of commercial banks such as lending policy, investment
policy, investment planning, liquidity and investment position, trends of
saving investment and capital formation, investment on priority sectors etc.
Some of them as supposed to be relevant for the study are presented below.
Mrs. Ramala Bhattarai, in her thesis, “Lending Policy of Commercial Banks
in Nepal,” has made an effort to examine the lending policy of commercial
banks. She has concluded that efficient utilization of resources is more
important than collection of the same. Lower investment means lower capital
formation that hampers economic development of the people and the country.
So, she recommended that banks give emphasis on efficient utilization of
resources (Bhattarai, 1978:36)
Sunity Shrestha has conducted a study on “Investment Planning of
Commercial Banks in Nepal” with the objectives:
To evaluate the financial performance of commercial banks in
Nepal.
To examine the investment of commercial banks of Nepal with
reference to securities, loans & advances.
To establish the relationship of banks’ portfolio variables with the
national income and interest rates.
The research findings of the study are summarized as:

27
The general trend of commercial banks asset holding is growing.
Deposits have been a major source of funds. The excess reserve
level of the banks allows idle money and loss of opportunity. Debt
equity ratios are very high, greater than 100%.
The return ratios are on the average higher for foreign joint venture
banks than for the Nepalese bank but return of asset found to be
statistically some. Risk taking attitude is higher in foreign joint
venture banks. The total management achievement index is higher in
case of foreign banks in comparison to the Nepalese banks.
The hypothesis that the commercial banks have non –professional
style of decision making in investment has been accepted. The
investment of commercial banks in shares and securities is normal
and not found to have strategic decision towards investment in
shares and securities. Yield from the security has been found to be
satisfactory.
Investment in various economic sectors shows industrial and
commercial sector taking higher shares of loan till 1990.
Investment in various sectors has a positive impact on the national
income from their respective sectors.
Lending in priority sector showed cottage and small industry sector
sharing higher loans.
Priority sector lending showed positive impact on the national
income.
The secured loan analysis showed commercial loan as being very important
followed by social and industrial loans. The loan loss ratio has been found to
be increase with low recovery of loan. Demand of bank credit has been found
to be affected by the national income and lending and Treasury bill rate. The
investment of commercial banks on government securities has been observed
to be affected by total deposit, cash reserve requirements and Treasury bill
and lending rates. Interest rates, lending rate, deposit rate were found to
28
constitute a set of significant variables affecting the bank portfolio
composition. (Sherestha, 1993:86)
Kishor Poudel’s, in his thesis paper “Liquidity and Investment Position of
Joint Venture Commercial Bank in Nepal” had made an attempt to evaluate
liquidity and investment of joint venture Banks, special reference to Everest
Bank Ltd. and Nabil Bank Ltd. He has concluded that liquidity position o f
EBL is comparatively better than Nabil. Growth rate of investment is higher in
EBL than Nabil. He further found the banks do not have constant and
consistent liquidity and investment policy. There is no standard and uniform
rate or ratio for maintaining liquid assets by the commercial banks. A
commercial bank at its own judgment may decide to maintain an appropriate
level of liquid assets. So he has recommended exploring such investment and
to increase its investment on share and debenture and the bank should have
laid down policy for timely review of portfolio and to maintain risk and
return.( Poudel,2002:78)
Sharad Wagle’s Study; in his thesis paper “A study on trends of savings,
investment and capital formation in Nepal”, he concluded that in Nepal ther e
is large gap between investment and saving rate. The low savings rate implies
that majorities of people are poor. Low rate of saving and investment has been
the continuing characteristic of the Nepalese economy as compared to some
selected Asian countries. The need for the improving internal savings and
investment performance in the country has been high in the agenda of
Nepalese policy declarations but the performance in has remained rather poor.
The rate of investment and capital formation is low in Nepal because of low
saving. He has recommended that the government should review existing
restriction on foreign direct investment. (Wagle, 2000:72)
Mrs. Rabina Bajracharya, in her thesis paper entitled, ”Investment of
Commercial Banks in Priority Sector” has made an effort to examine the

29
banking procedures and services in disbursing loan in priority sector. She has
found that:-
The target of 12% investment of total outstanding liabilities in
priority sector and 3% out of which has been invested in deprived
sector has been met by Rastriya Banijya Bank.
The trend of investment are continued to increase in the following
years.
The regression analysis of the investment and relationship between
investment and repayment.
Investment on agriculture is higher than investment on industry and
service sector because investment on agriculture benefited a higher
number of households. (Bajracharya, 2000:79)
Kul Chandra Pandit in his thesis, “A study on the investment policy analysis
of Standard Chartered Bank Nepal Limited in comparison to Nabil and Nepal
Bangaledesh Bank” has mainly found that SCB’s loan & advances to total
deposits ratios are significantly lower than that of Nabil and Nepal
Bangladesh Bank, SCB is recommended to follow a liberal lending policy,
invest more portion of deposition loan & advances. He has further stated that
besides giving priority of investing on government securities, SCB is
recommended to invest its fund in the purchase of shares and debentures of
other financial, non-financials companies, hotels and government companies.
This also helps in the maintenance of a sound portfolio of the banks. (Pandit,
2003:65)
Mukunda Prasad Lamichhane in his thesis, “Investment policy of the Joint
Venture Banks in Nepal” had analyzed between investment policy a nd
different variables like deposits, commission and discount, net profit, interest
on loan and investment. He applied correlation, ratio analysis, t - test, and
standard deviations.
30
He concluded that there is significant relationship between deposit and lo an
and advances as well as outside assets and net profit but not deposits and total
investment in case of Nabil and other joint venture banks. Most of the joint
venture banks have focused their banking services especially to big clients
such as to purchase shares and debentures of other financial and non-financial
companies. (Lamichhane, 2000:69)
Mr. Shiba Raj Loudari conducted a study on “A study on investment policy
of Nepal Indosuez Bank Ltd. in comparison to Nepal SBI Bank Ltd.” with the
objective of:
To examine the liquidity, asset management and profitability
position and investment policy of NIBL in comparison to Nepal SBI
Bank Ltd.
To study the growth ratios of loans and advances and investment to
total deposit and net profit of NIBL in comparison to Nepal SBI
bank ltd.
To analyses relationship between deposit and investment, deposits
and loan & advances, net profit and outside assets of Nepal
Indosuez Bank Ltd. In comparison to Nepal SBI Bank Ltd.
The research findings of the study are as follows:
Current ratios for both the banks are satisfactory.
Although Cash reserve ratio is managed by both banks as per Nepal
Rastrya Bank directives, both banks have not paid sufficient insight
towards cash management. Their cash reserves have fluctuated in a
high degree.
Nepal SBI Bank ltd. has increased investment in government
securities where as Nepal Indosuez Bank has decreased.
Nepal Indosuez Bank Ltd. has maintained both current ratio and
cash reserve ratio better than Nepal SBI Bank Ltd. But its cash and
31
bank balance, investment in government securities and loan and
advances in comparison to current assets are lower than that of
Nepal SBI Bank Ltd.
Deposit utilization of Nepal Indosuez Bank Ltd. is less effective
than that of Nepal SBI Bank Ltd. Further Nepal Indosuez Bank Ltd.
has invested lesser amount on government securities and shares and
debenture than that of Nepal SBI Bank.
Nepal Indosuez Bank Ltd. did a better performance in return on
total assets and loan and advances and interest earning, but it paid
lower interest amount to working fund.
The analysis of growth ratios shows that growth ratios of total
deposit, loan and advances, total investment and net profit of Nepal
Indosuez Bank are less than that of Nepal SBI Bank.
The trend value of loan and advances to total deposits ratio is
decreasing in case of both banks. The trend value of total
investment to total deposits ratio is also decreasing in case of both
banks. ( Loudari, 2001:75)
32
CHAPTER- III
RESEARCH METHODOLOGY
The topic of the study has been selected as “Comparative study on Portfolio
Management of Kumari Bank Ltd. and Everest Bank Ltd.” The sole objective
of this study is to compare the Portfolio Management Practices of Kumari
Bank Ltd. and Everst Bank Ltd.
In order to reach and accomplish the objectives of the study, different
activities will be carried out. For this purpose, the chapter aims to present and
reflect the methods and techniques that are carried out and followed during the
study period. The research methodology that is adopted for the present study
is mentioned in this chapter which deals with research design, sources of data,
data collection, processing and tabulating procedure and methodology.
3.1 Research Design
To achieve the objective of this study, comparative and analytical research design has been used.
3.2 Population and Sample
The objective of the research is to explore and describe the portfolio management in
Nepal from the investor’s point of view. However, with regard to the availability of
the financial information, two samples were identified purposively from the banking
sector, which comprise of nineteen among the listed. The sample represents 10.52% of
the entire population of the entire listed banking sector.
3.3 Data Collection Procedure
33
Different tools and techniques were adopted while collecting the data for this study.
Collected secondary information was analyzed during the course of the deskwork.
However, during the desk study, an information gap was found. This gap was fulfilled
by the discussion with the thesis advisor and finance experts of the security board and
the NEPSE.
3.4 Sources of Data
The data are collected from the secondary source (i.e. annual reports) of the
concerned banks to achieve the objective of the study and also referred t he
websites for the purpose to complete the thesis.
3.5 Data Analysis Tools
Presentation and analysis of data is one of the important part of the research
work. The collected raw data will first be presented in systematic manner in
tabular form and then will be analyzed by applying different financial and
statistical tools to achieve the research objectives. Besides these some graph
charts and tables will be presented to analyze and interpret the findings of the
study. The tools applied are:-
3.5.1 Financial Tools
3.5.1.1 Liquidity Ratios: This ratio measures the liquidity position of a firm.
It measures the firm’s ability to meet its short term obligations. As a Financial
Analytical tools, following liquidity ratios will be used.
a.) Current Ratio: This ratio shows the bank’s short term solvency. It shows
the ratio of current assets over the current liabilities. This ratio can be
computed by dividing the total current assets by total current liabilities which
can be presented as:
Current Ratio = Current Assets/ Current Liabilities

34
Higher ratio indicates the strong short -term solvency position and vice-versa.
b.) Cash and Bank Balance to Total Deposit Ratio: Cash and bank balances
are the most liquid current assets. This ratio measures the percentage o f most
liquid fund with the bank to make immediate payment to the depositor. This
ratio can be computed by dividing cash and bank balance by total deposit and
can be presented as:
Cash and bank balance to total deposit ratio= Cash &bank balance / Total
deposits
Cash and bank balance includes cash in hand, foreign cash in hand, cheques
and other cash items, balance with domestic and foreign banks. The total
deposit includes deposits made by customers though d ifferent accounts like
current (demand deposit), saving, fixed deposit, call deposit and other deposit
accounts.
c.) Cash and Bank Balance to Current Assets Ratio: This ratio measures the
proportion of most liquid assets viz. cash and bank balance among t he total
current assets of the bank. Higher ratio shows the bank’s ability to meet its
demand for cash. The ratio is computed by dividing cash and bank balance by
current assets, presented as under;
Cash and bank balance to current assets ratio = Cash & bank balance /Current
assets
d.) Investment on Government Securities to Total Current Assets Ratio:
This ratio is calculated to find out the percentage of current assets invested on
government securities viz. treasury bills and development bonds. The ratio is
stated as under;

35
Investment on Govt. securities to total current assets ratio = Investment on
Govt. Securities/ Current assets
3.5.1.2Assets Management Ratios: Asset management ratio measures the
proportion of various assets and liabilities in balance sheet. The proper
management of assets and liability ensures its effective utilization. The
banking business converts the liability into assets by way of its lending and
investing functions. The following are the various ratios relating to determine
the efficiency of the subjected bank in managing its assets and in portfolio
management.
a.) Loan and Advances to Total Deposit Ratio: This ratio is also called
credit- deposit ratio (C D ratio). It is calculated to find out how successfully
the bank is able to utilize its total deposits on loan and advances for profit
generating purpose. Greater ratio implies better utilization of total deposits.
This ratio can be obtained by dividing loan and advances by total deposit as
under;
Loan & Advances to total deposit ratio = Loan & advances/ Total deposits
b.) Total Investment to Total Deposit Ratio: Investment is one of the major
form of credit creation to earn income. This implies the utilization of firm’s
deposit on investment on government securities, shares &debentures of other
companies and banks. This ratio can be calculated by total investment divided
by total deposit as:
Total investment to total deposit ratio = Total investment / Total deposits
c.) Loan and Advances to Working Fund Ratio: Loan and advances is the
major component in the total working fund (total assets), which indicates the
ability of bank to utilize its deposits in the form of loan and advances to earn
high return. The ratio is computed by dividing loan and advances by total
working fund, which is stated as under;
36
Loan and advances to working fund ratio=Loans and advances /Total working
fund
d.) Investment on Government Securities to Total Working Fund Ratio:
This ratio shows that bank’s investment on government securities in
comparison to the total working fund. This ratio can be computed by dividing
investment on government securities by total working fund, which can be
presented as;
Investment on Govt. Securities to total working fund = Investment on Govt.
Securities/ Total working fund
e.) Total outside Assets to Total Deposits Ratio: Loans and advances and
investment comprise the total outside assets of a bank. This ratio measures
how well the deposits liabilities have been mobilized by the bank in income
generation. This ratio is computed by dividing total loan and advances and
investment by total deposits, which can be stated as under;
Total outside assets to total deposits ratio = Total outside assets / Total
deposits
f.) Loan and Advances to Total outside Assets Ratio: This ratio measures
the proportion of loans and advances of total outside assets. The proportion
between investment and loans and advances measures the management attitude
towards more risky assets and lower risky assets. This ratio is computed by
dividing loan and advances by total outside assets as under:
Loan and advances to total outside assets ratio= Loan and advances/ Total
outside assets
g.) Investment on Government Securities to Total outside Assets Ratio:
This ratio measures the proportion of the bank’s inves tment in risky and risk
free areas. This ratio is computed by dividing investment on government
securities by total outside assets as under;
37
Investment on Govt. Securities to total outside assets ratio= Investment on
Govt. Securities / Total outside assets.
h.) Total outside Assets to Total Assets Ratio: Loans & advances and
investment are total outside assets of commercial banks. This ratio is
calculated by dividing total outside assets which can be presented as under;
Total outside assets to total assets ratio= Total outside assets/ Total assets
This is the proportion of assets employed by the bank for the purpose of
income generation. This ratio shows the ability of the bank to utilize the funds
into income generating assets.
3.5.1.3 Activity Ratios: Activity ratio measures the performance efficiency of
an organization from various angles of its operations. These ratios indicate the
efficiency of activity of an enterprise to utilize available funds, particularly
short-term funds. These ratios are used to determine the efficiency, quality
and the contribution of loan and advances in the total profitability. The
following activity ratios measure the performance efficiency of the bank to
utilize its funds.
a.) Loan Loss Provision to Total Loans and Advances Ratio: This ratio
describes the quality of assets that a bank is holding. Nepal Rastra Bank has
directed the commercial banks to classify its loans and advances into the
category of pass, sub-standard, doubtful and loss on the basis of the maturity
of principal to make the provision of 1, 25, 50, and 100 percentages
respectively. The provision for loan loss reflects the increasing probability of
non-performing loans in the volume of total loans and advances. This ratio is
calculated by dividing the loan loss provision by total loans and advances as
presented here under;
38
Loan loss provision to total loans and advances ratio = Total loan loss
provision / Loans and advances
b.) Non-Performing Loans to Total Loans and Advances Ratio: This ratio
measures the proportion of non- performing loans on the total volume of loans
and advances. This reflects the quantity of quality assets that the bank has.
Higher ratio reflects the poor performance of bank in mobilizing loans and
advances and bad recovery rate and vice- versa. This ratio is computed by
dividing the non-performing loans by total loans and advances as under;
Non-performing loans to total loans & advances ratio = Total non-performing
loans / Total loans & advances
3.5.1.4 Profitability Ratios: Profitability ratios are used to indicate and
measure the overall efficiency of a firm in terms of profit and financial
performance. For better performance, profitability ratios of firm should be
higher. Under this, the following profitability ratio will be comput ed.
a.) Interest Income to Total Income Ratio: This ratio measures the volume
of interest income in total income of the bank. The high ratio indicates the
high contribution made by the lending and investing and vice-versa. This ratio
can be completed by dividing interest income by total income presented as
under;
Interest income to total income ratio = Interest income / Total income
b.) Total Interest Earned to Total outside Assets Ratio: This ratio measures
the interest earning capacity of the bank through the efficient utilization of
outside assets. Higher ratio implies efficient use of outside assets to earn
interest. This ratio is calculated by dividing total interest earned by total
outside assets and can be mentioned as under;
39
Total interest earned to total outside assets ratio = Total interest earned / Total
outside assets
The numerator includes total interest income from loans and advances and
investment where as the denominator comprises loan and advances, bills
purchased and discounted and all type investment.
c.) Interest Expenses to Total Expenses Ratio: This ratio measures the
portion of total interest expenses in the volume of total expenses. The high
ratio indicates the low operation efficiency and vice-versa. This ratio is
calculated by dividing interest expenses by total expenses which can be
presented as under;
Interest expenses to total expenses ratio = Interest expenses / Total expenses
d.) Total Interest Earned to Total Working Fund Ratio: This ratio is
computed to find out percentage of interest earned to total assets (working
fund). Higher ratio implies better performance of the bank in terms of interest
earning on its total working funds. This fund is computed by dividing total
interest earned by total working fund can be presented as;
Total interest earned to total working fund ratio = Total interest paid / Total
working fund
e.) Total Interest Paid to Total Working Fund Ratio: This ratio depicts the
percentage of interest paid on liabilities with respect to total working fund
which can be presented as;
Total interest paid to total working fund ratio= Total interest paid/ Total
working fund
40
f.) Total Income to Total Expenses Ratio: The comparison between total
income and expenses measures the productivity of expenses in generating
income .The amount of income that a unit of expenses generates is measured
by the ratio of total income to total expenses. The high ratio is the indication
of higher productivity of expenses and vice-versa. This ratio is computed by
dividing total income by total expenses presented as;
Total income to total expenses ratio = Total income / Total expenses
g.) Total Income to Total Working Fund Ratio: This ratio measures how
efficiently the assets of a business are utilized to generate income. It also
measures the quality of assets in income generation. This ratio is calculated by
dividing total income by total assets as stated here under;
Total income to total working fund ratio: Total income / Total working fund
h.) Return on Loan and Advances Ratio: This ratio indicates how efficiently
the bank utilizes its resources in the form loans and advances. This also
measures the earning capacity of its loans and advances. This ratio is
computed by dividing net profit (loss) by loans and advances which can be
expressed as;
Return on loan and advances ratio = Net profit (loss) / Loans & advances
i.) Return on Total Working Fund Ratio (ROA): This ratio measures the
overall profitability of all working fund i.e. total assets. It is also known as
return on assets (ROA). This ratio is calculated by dividing net profit (loss) by
total working funds. This can be presented as;
Return on total working fund ratio (ROA) =Net profit (loss)/ Total working
fund

41
The numerator indicates the portion of income left to the internal equities
after deduction all costs, charges and expenses.
j.) Return on Equity (ROE): Net worth refers to the owner’s claim of a bank.
The excess amount of total assets over total liabilities is known as net worth.
This ratio measures how efficiently the bank has used funds of the
shareholders. This ratio can be computed by dividing net profit by total equity
capital (net worth). This can be calculated as;
Return on Equity (ROE) =Net profit (loss) / Total equity capital
Here, total equity capital includes share holders’ reserve including profit and
loss account, general loan loss provision and share capital i.e. ordinary share
preference share capital.
k.) Earnings per Share (EPS): EPS refers to net profit divided by total
numbers of share outstanding. The amount of EPS measures the efficiency of a
firm in relative terms. This ratio is calculated as;
Earnings per Share (EPS) =Net profit (loss) / Total number of shares
outstanding
l.) Net Interest Margin: Net interest margin in general term is the difference
between the interests received from investment and loan and advances and
interest paid on deposits collected by bank. It shows the bank’s efficiency to
earn high profit to meet various costs. Higher ratio shows the higher
profitability and vice-versa. This ratio is computed by dividing the difference
between interest revenues from earning assets and interest costs on borrowed
funds by total earning assets which can be pressed as;

42
Net interest margin = (Interest revenues from earning assets – interest cost on
borrowed funds) / Total earning assets
Here, interest revenues from earning assets is the total interest income of the
bank and interest cost on borrowed funds is the total interest expenses of the
bank, Total loan and advances comprises the total earning assets of the bank.
3.5.1.5 Growth Ratio: To examine and analyze the expansion and growth of
the banking business, following growth ratios will be calculated in this part:
a) Growth ratio of total deposits
b) Growth ratio of loans and advances
c) Growth ratio of total investment
d) Growth ratio of net profit
3.5.2 Statistical Tools
Some important statistical tools will be used to achieve the objective of this
study. In this study statistical tool such as mean, standard deviation,
coefficient of variation, coefficient of correlation and trend analysis will be
used.
3.5.2.1 Mean: A mean is the average value or the sum of all the observation
divided by the number of observations and it is given by the following
formula:
N
XX
Where, X = Mean of the values
X = Summation of the values
N = No. of Observations

43
3.5.2.2 Standard deviation: The standard deviation measures the absolute
dispersion. It is said that higher value of standard deviation the higher the
variability and vice versa. Karl Pearson introduced the concept of standard
deviation in 1823 A. D. and this is denoted by the small Greek letter
(pronounced sigma) the formula to calculate the standard deviation is given
below:
N
x 2
where, x = XX
3.5.2.3 Coefficient of variation: The calculated standard deviation gives an
absolute measure of dispersion. Hence where the mean value of the variables
is not equal, it is not appropriate to compare two pairs of variables based on
standard deviation only. The coefficient of variation (C.V.) is given by the
following formula in the percentage basis:
Coefficient of variation (C.V.) = 100X
3.5.2.4 Measures of Correlation: We examine the relation between the
various variables. The correlation between the different variables of a bank is
compared to measure the performance of these banks. Correlation refers to the
degree of relationship between two variables. If between two variab les,
increase or decrease in one causes increase or decrease in another, then such
variables are correlated variables. The reliability of the value of coefficient of
correlation is measured by probable error. The correlation coefficient
describes the degree of relationship between two variables. It interprets
whether variables are correlated positively or negatively. This tool analyses
the relationship between those variables by which it is helpful to make

44
appropriate investment policy for profit minimization. The Karl Pearson
coefficient of correlation (r) is given by following formula:
Coefficient of Correlation (r) = 21N
xy
Where, x = XX
y = YY
1 = Standard series of X
2 = Standard series of Y
N = Number of pairs of Observations
The Karl Pearson coefficient of correlation always falls between -1 to +1. The
value of correlation in minus signifies the negative correlation and in plus
signifies the positive correlation. As the value of correlation reaches to the
value of zero, it is said that there is no significant relationship between the
variables.
3.5.2.5 Trend Analysis: Among the various methods of determining trend of
time series, the most popular and mathematical method is the least square
method. Using this least square method, it has been estimated the future trend
values of different variables. For the estimation of linear trends line following
formula can be used:
y= a + bx
Where,
y= Dependent variable
x = Independent variable
a = Y – intercept
b = Slope of the trend line

45
CHAPTER- IV
PRESENTATION AND ANALYSIS OF DATA
In this chapter, the researcher has used the various financial and statistical
tools systematically to present, analyze and measure the portfolio management
practices of Kumari Bank Ltd. and Everest Bank Ltd. so that the findings,
summary, conclusions and recommendation of the study can be presented. The
presentation and analysis of the various investment aspects of the ba nk is as
follows:
4.1 Liquidity Ratios
Liquidity ratios measure the firms’ ability to meet its current obligation. The
following ratios which measure the liquidity position of banks are calculated:
Table-1
Liquidity Ratios
FY KBL EBL
1. 2. 3. 4. 1. 2. 3. 4.
2059/60 1.05 0.12 0.11 0.09 1.06 0.17 0.14 0.20
2060/61 1.02 0.14 0.14 0.12 1.06 0.08 0.07 0.26
2061/62 1.07 0.07 0.06 0.15 1.08 0.10 0.09 0.18
2062/63 1.06 0.04 0.04 0.13 1.04 0.10 0.09 0.23
2063/64 1.05 0.05 0.05 0.11 1.05 0.09 0.08 0.23
Mean 1.05 0.08 0.08 0.12 1.06 0.11 0.09 0.22
S.D. 0.02 0.04 0.04 0.02 0.02 0.04 0.03 0.03
(Source: Appendix I-IV)
Where, 1= Current Ratio
2 = Cash and Bank Balance to Total Deposit Ratio
3= Cash & Bank Balance to Current Assets Ratio
4= Investment on Govt. Securities to Total Current Assets
Ratio
46
1. Current Ratio
This ratio shows the bank’s short term solvency. It shows the ratio of current
assets over the current liabilities. Higher ratio indicates the strong short -term
solvency position and vice-versa. As being the commercial organization and
dependent upon the deposits of the customers’, the organizations use to
maintain the ratio just as the directives of the NRB.
In the above table, the current ratios of KBL are 1.05, 1.02, 1.07, 1.06, and
1.05 for five years starting from FY 2059/60 till 2063/64 respectively with the
mean ratio of 1.05 and S.D. 0.02. But in case of EBL the ratios are 1.06, 1.06,
1.08, 1.04, and 1.05 of the same period with the mean of 1.06 and S.D. 0.02.
This can be regarded as the good since it can meet its current obligations. In
the periods, the ratio is slightly fluctuated over the periods. Same as the KBL,
EBL also maintained its current ratio and slightly fluctuated over the periods.
2. Cash and Bank Balance to Total Deposit Ratio
Cash and bank balances are the most liquid current assets. This ratio measures
the percentage of most liquid fund with the bank to make immediate payment
to the depositor. Higher ratio shows the bank’s ability to meet its demand for
cash. This ratio can be regarded as the combination of the CRR and LRR.
CRR means the Cash Reserve Ratio and LRR means the Liquidity Reserve
Ratio. CRR is the amount that is deposited in NRB and LRR is the cash with
the bank in its vault. Currently, the CRR fixed by the NRB is 5% of the total
deposit.
In the above table, this ratio of KBL is: 0.12, 0.14, 0.07, 0.04, and 0.05 in the
years starting from FY 2059/60 till 2063/64 respectively with the mean ratio
of 0.08 and S.D.0.04. In the year 2062/63 the ratio is only 0.04 which is less
47
than the minimum ratio set by the NRB. But in case of EBL the ratio is: 0.17,
0.08, 0.10, 0.10, and 0.09 respectively with the mean ratio of 0.11 and S.D.
0.04. The EBL has succeeded to manage the adequate ratio set by the NRB.
3. Cash & Bank Balance to Current Assets Ratio
This ratio measures the proportion of most liquid assets viz. cash and bank
balance among the total current assets of the bank. Higher ratio shows the
bank’s ability to meet its demand for cash. This ratio should be adequately
managed by the bank; neither too high nor too low since high ratio doesn’t
yield might any interest and low ratio is failure to meet the request of the
customers.
In the table above, this ratio of KBL is: 0.11, 0.14, 0.06, 0.04 , and 0.05 in the
subsequent years starting from the FY 2059/60 with the mean ratio of 0.08 and
S.D. 0.04. And the ratio of EBL is: 0.14, 0.07, 0.09, 0.09, and 0.08 in the
same order as in KBL has been presented with the mean ratio of 0.12 and S.D.
0.03. Here, this ratio of both the bank is highly fluctuated over the periods
which are not good as it has been highly fluctuated.
4. Investment on Govt. Securities to Total Current Assets Ratio
This ratio shows the proposition of government securities of commercial
banks in its current assets. The commercial banks invest their funds to various
types of government securities such as treasury bills, development bonds and
national saving bond. Government securities are not liquidable as much as
cash & bank balance. The main objective of the ratio is to examine the portion
of government in current assets.
In the table above, this ratio of KBL is: 0.09, 0.12, 0.15, 0.13, and 0.11 in the
years starting from FY 2059/60 respectively with the mean ratio of 0.12 and

48
S.D. 0.02. And the ratio of EBL is: 0.20, 0.26, 0.18, 0.23, and 0.23 as in the
order of KBL is presented with the mean ratio of 0.22 and S.D. 0.03. Here, the
ratio of EBL is higher than that of KBL in every year
4.2 Assets Management Ratios
The assets management ratio is used to measure the efficiency of asset
utilization of a bank. A commercial bank should be able to manage its assets
to gain a sustainable profit so that it can survive is the competitive
environment. It is used to measure the banks’ efficiency towards its fund
mobilization. Following ratios are used to measure the assets management
efficiency:
Table-2
Assets Management Ratios
FY KBL EBL
1. 2. 3. 4. 5. 6. 7. 8. 1. 2. 3. 4. 5. 6. 7. 8.
2059/60 0.84 0.17 0.71 0.08 1.01 0.83 0.09 0.85 0.73 0.25 0.61 0.20 0.98 0.75 0.24 0.81
2060/61 0.76 0.20 0.66 0.11 0.96 0.79 0.13 0.84 0.73 0.31 0.61 0.26 1.04 0.70 0.29 0.88
2061/62 0.89 0.19 0.75 0.15 1.08 0.82 0.17 0.91 0.75 0.21 0.65 0.18 0.97 0.78 0.22 0.83
2062/63 0.89 0.18 0.76 0.12 1.07 0.83 0.13 0.92 0.71 0.30 0.61 0.22 1.01 0.70 0.25 0.88
2063/64 0.85 0.16 0.75 0.11 1.01 0.84 0.12 0.89 0.75 0.27 0.64 0.22 1.03 0.73 0.25 0.87
Mean 0.85 0.18 0.73 0.11 1.03 0.82 0.13 0.88 0.73 0.27 0.62 0.22 1.01 0.73 0.25 0.85
S.D. 0.05 0.02 0.04 0.03 0.05 0.02 0.03 0.04 0.02 0.04 0.02 0.03 0.03 0.03 0.03 0.03
(Source: Appendix V-XII)
Where, 1= Loans & Advances to Total Deposit Ratio
2= Total Investment to Total Deposit Ratio
3= Loans & Advances to Total Working Fund Ratio
4= Investment on Govt. Securities to Total Working Fund Ratio
5= Total outside Assets to Total Deposits Ratio
6= Loan & Advances to Total outside Assets Ratio
7= Investment on Govt. Securities to Total outside Assets Ratio

49
8= Total outside Assets to Total Assets Ratio
1. Loans & Advances to Total Deposit Ratio
This ratio measures the efficiency of the bank in mobilizing its deposits on
loans and advances to generate the profit of the bank. A high ratio indicates
the better the performance of the bank and vice- versa. But the every bank
should manage capital adequacy for which the bank should balance between
the loans and advances and total deposit. The ratio should be less than or
equal to 90% as set by the NRB.
In the above table, this ratio of KBL is: 0.84, 0.76, 0.89, 0.89, and 0.85 in the
years starting from FY 2059/60 till 2063/64 respectively with the mean ratio
of 0.85 and S.D.0.05. But in case of EBL the ratio is: 0.73, 0.73, 0.75, 0.71,
and 0.75 respectively with the mean ratio of 0.73 and S.D. 0.02. This seems to
be good enough as the ratio is duly maintained by both the bank. In addition to
that KBL has utilized the available funds in better way.
2. Total Investment to Total Deposit Ratio
A commercial bank may mobilize its deposits by investing its fund in different
securities issued by the government and other financial and non-financial
institutions. Now the efforts have been made to measure the efficiency of bank
in mobilizing its deposits to its investing activities. A high ratio indicates the
better performance of the bank in mobilizing its deposits in investment
activities and vice- versa. The bank should maintain the balance between the
return from the investment and the risk of liquidation from the investment
In the above table, this ratio of KBL is: 0.17, 0.20, 0.19, 0.18, and 0.16 in the
years starting from FY 2059/60 till 2063/64 respectively with the mean ratio
of 0.18 and S.D. 0.02. But in case of EBL the ratio is: 0.25, 0.31, 0.21, 0.30,
50
and 0.27 respectively with the mean ratio of 0.27 and S.D. 0.04. And in this
regard the EBL has better managed its deposits in the investment activities in
comparison to KBL.
3. Loans & Advances to Total Working Fund Ratio
A commercial bank’s working fund plays very significant role in profit
generation act ivity. The ratio reflects the extent to which the bank is
successful to mobilize its total assets on loan and advances for the purpose of
income generation. A high ratio indicates a better fund mobilization as loan
and advances and vice-versa.
In the above table, this ratio of KBL is: 0.71, 0.66, 0.75, 0.76, and 0.75 in the
years starting from FY 2059/60 till 2063/64 respectively with the mean ratio
of 0.73 and S.D. 0.04. But in case of EBL the ratio is: 0.61, 0.61, 0.65, 0.61,
and 0.64 respectively with the mean ratio of 0.62 and S.D. 0.02. In this regard,
the KBL is succeeded to mobilize its funds than that of EBL.
4. Investment on Govt. Securities to Total Working Fund Ratio
This ratio presents the proposition of fund invested in government securities
to total working fund of the bank. From liquidity viewpoint, higher the ratio
of investment on government securities to total working funds higher the
liquidity of the bank and vice versa. But higher the ratio also implies the
banks’ inefficiency in investing in other high income generating investment
activities. Therefore, the bank should maintain an optimum level of
investment in government securities so that the balance between the liquidity
and the return can be maintained.
In the above table, this ratio of KBL is: 0.08, 0.11, 0.15, 0.12, and 0.11 in the
years starting from FY 2059/60 till 2063/64 respectively with the mean ratio

51
of 0.11 and S.D. 0.03. But in case of EBL the ratio is: 0.20, 0.26, 0.18, 0.22,
and 0.22 respectively with the mean ratio of 0.22 and S.D. 0.03. Here, the
ratio of EBL is as twice more as the KBL has in almost all the years. This
means EBL is more curious to invest in Govt. securities than that of KBL.
5. Total outside Assets to Total Deposits Ratio
The total outside assets of a bank includes its loan and advances and
investment. They are the major fund utilization activity of the bank for
generating its income. Loan & advances has return and high risk whereas
investment has comparatively low return and risk. Loan & advances and
investment to total deposits show the firms fund mobilizing power in gross.
The main source of the banks’ fund is its deposits. The ratio shows how the
bank is efficient in utilizing its collected deposits in total outside activities.
In the above table, this ratio of KBL is: 1.01, 0.96, 1.08, 1.07, and 1.01 in the
years starting from FY 2059/60 till 2063/64 respectively with the mean ratio
of 1.03 and S.D. 0.05. But in case of EBL the ratio is: 0.98, 1.04, 0.97, 1.01,
and 1.03 respectively with the mean ratio of 1.01 and S.D. 0.03. In this regard
both the banks are equally capable in managing this ratio.
6. Loan & Advances to Total outside Assets Ratio
Loan and advances and investment made by the bank comprise the total
outside assets of a commercial bank. This is the portion of assets employed by
the bank for the purpose of income generation. This ratio measures the
contribution made by loan & advances in total amount of loans & advances
and investment. The proportion between investment and loans and advances
measures the management’s attitude towards the risky assets. Loans &
advances are more risky and also generate more return in comparison to
investments. The total mobilized fund i.e. loan and advances and investment
52
in whole doesn’t provide the quality of assets that the bank has created. Thus,
this ratio measures the risk of the banking business also. The high ratio
indicates the mobilization of funds in more risky area and vice-versa.
In the above table, this ratio of KBL is: 0.83, 0.79, 0.82, 0.83, and 0.84 in the
years starting from FY 2059/60 till 2063/64 respectively with the mean ratio
of 0.82 and S.D. 0.02. But in case of EBL the ratio is: 0.75, 0.70, 0.78, 0.70,
and 0.73 respectively with the mean ratio of 0.73 and S.D. 0.03. In
comparison between KBL and EBL, KBL has the more ratios in all the years.
Thus the KBL has lent its funds in risky area as described above.
7. Investment on Govt. Securities to Total outside Assets Ratio
The total outside assets indicates composition of total risky and risk free
assets. The investment on government securities is the risk- free risk free
assets where the total outside assets is the composition of risky and risk -free
assets or assets holding average risk. This ratio helps us to measure the risk of
the banks’ business. Higher the ratio lowers the banks’ business and vice -
versa. This also presents the management’s attitude towards the risk. In the
other hand, higher the ratio lowers the return and vice-versa. Here the bank
should also maintain the optimum level of these two assets so that the balance
between risk and return is maintained.
In the above table, this ratio of KBL is: 0.09, 0.13, 0.17, 0.13, and 0.12 in the
years starting from FY 2059/60 till 2063/64 respectively with the mean ratio
of 0.13 and S.D. 0.03. But in case of EBL the ratio is: 0.24, 0.29, 0.22, 0.25,
and 0.25 respectively with the mean ratio of 0.25 and S.D. 0.03. This shows
that the ratio of EBL in comparison to KBL is higher in all the years as the
huge amount invested in the government sector.

53
8. Total outside Assets to Total Assets Ratio
Commercial banks’ outside assets includes its loans & advances and
investment. Total outside assets is the fund that in used for income generating
purpose where as the total assets include both the income generating assets
and non-income generating assets. A high ratio indicates better mobilization
of funds in the form of income generating assets from the return viewpoint
vice-versa.
In the above table, this ratio of KBL is: 0.85, 0.84, 0.91, 0.92, and 0.89 in the
years starting from FY 2059/60 till 2063/64 respectively with the mean ratio
of 0.88 and S.D. 0.04. But in case of EBL the ratio is: 0.81, 0.88, 0.83, 0.88,
and 0.87 respectively with the mean ratio of 0.85 and S.D. 0.03. This shows
that the ratio is consistent over the periods.
4.3 Activity Ratios
The activity ratio which is also called performing ratio is calculated to
measure the lending efficiency in terms of quality and turnover. To measure
the ratios of various relationships between balance sheet items and P/L items
are established. The following ratios are calculated to measure the activity
ratios, which are presented as follows:
Table -3
Activity Ratios
FY KBL EBL
1. 2. 1. 2.
2059/60 0.02 0.02 0.03 0.02
2060/61 0.01 0.01 0.04 0.02
2061/62 0.02 0.01 0.04 0.02
2062/63 0.02 0.01 0.03 0.01
2063/64 0.01 0.01 0.03 0.01
Mean 0.016 0.012 0.034 0.016
S.D. 0.001 0.004 0.004 0.01
(Source: Appendix XIII-XIV)
54
Where, 1= Loan Loss Provision to Total Loans & Advances Ratio
2= Non-Performing Loans to Total Loans & Advances Ratio
1. Loan Loss Provision to Total Loans & Advances Ratio
The loan loss ratio shows how efficiently the bank manages its loans and
advances and makes effort for timely recovery of loans & advances. NRB has
directed the commercial banks to classify its loans & advances into the
category of pass, substandard, doubtful, and loss to make the provision of
1%., 25%, 50 %, and 100% respectively. NRB has classified the pass loan as
performing loan and other three types of loans as non performing Assets
(NPA) of the commercial banks. Loan loss provision set aside for performing
loans is defined as general loan loss provision and loss provision set aside of
non-performing is defined as specific loan loss provision. The higher the ratio
indicates increasing probability of non-performing loans in the volume of loan
& advances. On the other hand, loan loss provision signifies the cushion
against future contingency created by the default of the borrowers. The high
ratio signifies the relatively more risky assets in the volume of loans &
advances.
In the above table, this ratio of KBL is: 0.02, 0.01, 0.02, 0.02, and 0.01 in the
years starting from FY 2059/60 till 2063/64 respectively with the mean ratio
of 0.016 and S.D. 0.001. But in case of EBL the ratio is: 0.03, 0.04, 0.04,
0.03, and 0.03 respectively with the mean ratio of 0.034 and S.D. 0.004. This
shows that the ratio of KBL is less than that of EBL over the periods.
2. Non-Performing Loans to Total Loans & Advances Ratio
Non-performing loan includes the loan, which lies in the category of sub-
standard, doubtful, and bad loan. The ratio measures the proportion of non-
performing loan on the volume of loan & advances. It shows the quality of

55
lending of the bank. Higher the ratio indicates the poor performance of the
bank in terms of collecting loan and vice-versa.
In the above table, this ratio of KBL is: 0.02, 0.01, 0.01, 0.01, and 0.01 in the
years starting from FY 2059/60 till 2063/64 respectively with the mean ratio
of 0.012 and S.D. 0.004. But in case of EBL the ratio is: 0.02, 0.02, 0.02,
0.01, and 0.01 respectively with the mean ratio of 0.016 and S.D. 0.01. This
shows that the ratio is consistent over the periods.
4.4 Profitability Ratios
Each and every business organization is established to earn profit. The main
objective of commercial banks is to earn profit by providing different types of
banking services to its customers. Profitability ratios are helpful to measure
the overall efficiency of a bank. The profit of the bank is affected by the
various activities of the bank such as: liquidity activity, assets management
activity, and leverage activity. Therefore, profit is the major indicator of the
efficiency of the operation of the bank. Higher profit ability ratio shows the
better efficiency of the bank and vice-versa. The following ratios are
calculated to measure the profitability ratios which are presented below:
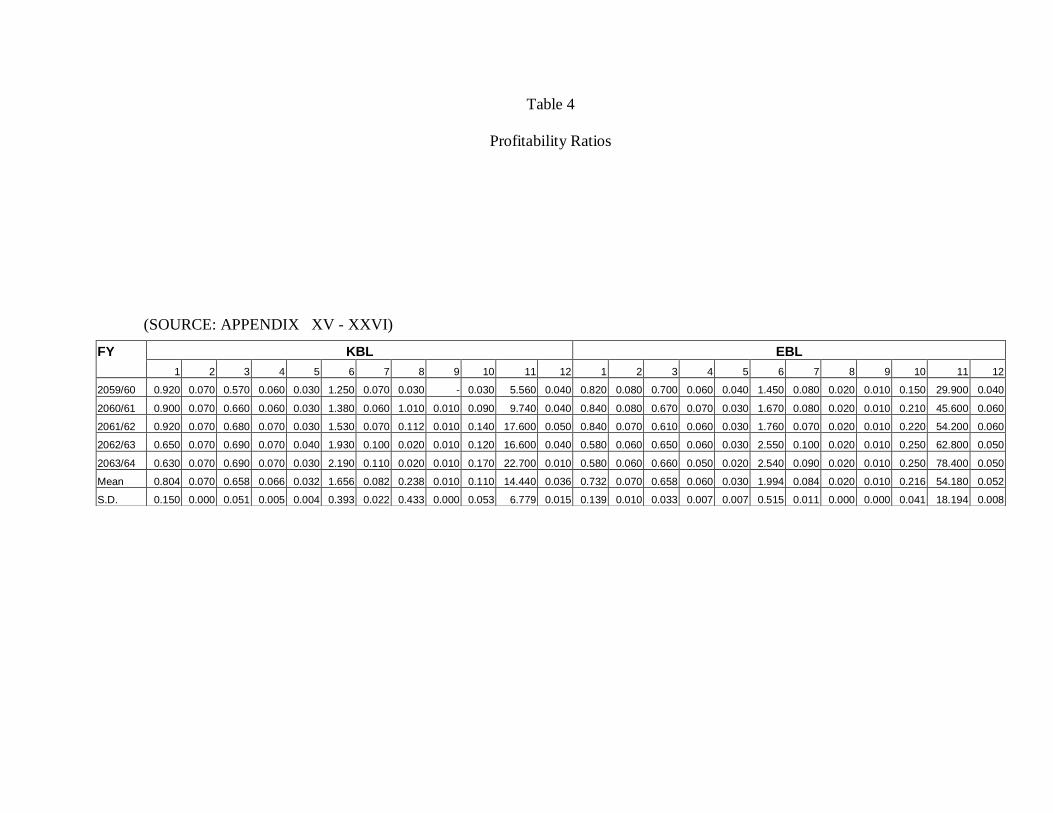
Table 4
Profitability Ratios
(SOURCE: APPENDIX XV - XXVI)
FY KBL EBL
1 2 3 4 5 6 7 8 9 10 11 12 1 2 3 4 5 6 7 8 9 10 11 12
2059/60 0.920 0.070 0.570 0.060 0.030 1.250 0.070 0.030 - 0.030 5.560 0.040 0.820 0.080 0.700 0.060 0.040 1.450 0.080 0.020 0.010 0.150 29.900 0.040
2060/61 0.900 0.070 0.660 0.060 0.030 1.380 0.060 1.010 0.010 0.090 9.740 0.040 0.840 0.080 0.670 0.070 0.030 1.670 0.080 0.020 0.010 0.210 45.600 0.060
2061/62 0.920 0.070 0.680 0.070 0.030 1.530 0.070 0.112 0.010 0.140 17.600 0.050 0.840 0.070 0.610 0.060 0.030 1.760 0.070 0.020 0.010 0.220 54.200 0.060
2062/63 0.650 0.070 0.690 0.070 0.040 1.930 0.100 0.020 0.010 0.120 16.600 0.040 0.580 0.060 0.650 0.060 0.030 2.550 0.100 0.020 0.010 0.250 62.800 0.050
2063/64 0.630 0.070 0.690 0.070 0.030 2.190 0.110 0.020 0.010 0.170 22.700 0.010 0.580 0.060 0.660 0.050 0.020 2.540 0.090 0.020 0.010 0.250 78.400 0.050
Mean 0.804 0.070 0.658 0.066 0.032 1.656 0.082 0.238 0.010 0.110 14.440 0.036 0.732 0.070 0.658 0.060 0.030 1.994 0.084 0.020 0.010 0.216 54.180 0.052
S.D. 0.150 0.000 0.051 0.005 0.004 0.393 0.022 0.433 0.000 0.053 6.779 0.015 0.139 0.010 0.033 0.007 0.007 0.515 0.011 0.000 0.000 0.041 18.194 0.008

57
Where, 1= Interest Income to Total Income Ratio
2= Total Interest Earned to Total outside Assets Ratio
3= Interest Expenses to Total Expenses Rat io
4= Total Interest Income to Total Working Fund Ratio
5= Total Interest Expenses to Total Working Fund Ratio
6= Total Income to Total Expenses Ratio
7= Total Income to Total Working Fund Ratio
8= Return on Loans & Advances Ratio
9= Return on Total Working Fund Ratio (ROA)
10= Return on Equity (ROE)
11= Earning Per Share (EPS)
12= Net Interest Margin
1. Interest Income to Total Income Ratio
Interest income is the major source of the banks’ total income. It measures the
proportion of interest income in total income of the bank. This ratio also
indicates how well the bank is able to mobilize its fund in interest generating
activity.
In the above table, this ratio of KBL is: 0.92, 0.90, 0.92, 0.65, and 0.63 in the
years starting from FY 2059/60 till 2063/64 respectively with the mean ratio
of 0.804 and S.D. 0.15. But in case of EBL the ratio is: 0.82, 0.84, 0.84, 0.58,
and 0.58 respectively with the mean ratio of 0.732 and S.D. 0.14. This shows
that the ratio of KBL is more than that of EBL over the periods.
2. Total Interest Earned to Total outside Assets Ratio
The outside assets include loan & advances and investment of commercial
banks. It is the sources of interest income of the bank. The ratio reflects the
extent to which the bank is successful to earn interest as major income from
58
the outside assets. A high ratio indicates high earning power of total outside
assets and vice-versa.
In the above table, this ratio of KBL is: 0.07, 0.07, 0.07, 0.07, and 0.07 in the
years starting from FY 2059/60 till 2063/64 respectively with the mean ratio
of 0.07 and S.D. 0. But in case of EBL the ratio is: 0.08, 0.08, 0.07, 0.06, and
0.06 respectively with the mean ratio of 0.07 and S.D. 0.01. This shows that
the ratio of KBL is consistent over the periods and the ratio of EBL is
fluctuating slightly in the years.
3. Interest Expenses to Total Expenses Ratio
The ratio measures the proportion of interest expenses to total expenses.
Higher the ratio means higher cost of funds of the bank.
In the above table, this ratio of KBL is: 0.57, 0.66, 0.68, 0.69, and 0.69 in the
years starting from FY 2059/60 till 2063/64 respectively with the mean ratio
of 0.66 and S.D. 0.05. But in case of EBL the ratio is: 0.70, 0.67, 0.61, 0.65,
and 0.66 respectively with the mean ratio of 0.66 and S.D. 0.03. This shows
that the ratio of KBL is less than that of EBL in the preceding years but in the
last two this ratio is higher than the EBL.
4. Total Interest Income to Total Working Fund Ratio
The ratio reflects the proportion of total interest income to total working fund.
Higher the ratio indicates the bank has portion of interest income with respect
to total working fund and vice-versa. The higher ratio shows the better
efficiency of the bank.
In the above table, this ratio of KBL is: 0.06, 0.06, 0.07, 0.07, and 0.07 in the
years starting from FY 2059/60 till 2063/64 respectively with the mean ratio

59
of 0.066 and S.D. 0.004. But in case of EBL the ratio is: 0.06, 0.07, 0.06,
0.06, and 0.05 respectively with the mean ratio of 0.06 and S.D. 0.01. This
shows that the ratio of KBL is more consistent over the periods than that of
EBL.
5. Total Interest Expenses to Total Working Fund Ratio
The total interest expenses to total working fund ratio shows the proportion of
total interest expenses to total working fund. It shows the efficiency of cost
management relating to interest expenses with respect to total working fund.
Higher the ratio indicates higher the interest cost of total working fund and
vice-versa.
In the above table, this ratio of KBL is: 0.03, 0.03, 0.03, 0.04, and 0.03 in the
years starting from FY 2059/60 till 2063/64 respectively with the mean ratio
of 0.032 and S.D. 0.003. But in case of EBL the ratio is: 0.04, 0.03, 0.03,
0.03, and 0.02 respectively with the mean ratio of 0.03 and S.D. 0.01. This
shows that the ratio is consistent over the periods.
6. Total Income to Total Expenses Ratio
The ratio shows the proportion of total income with respect to total expenses.
The profit of the business organization is affected by these two variables. The
income increases the profit and the loss decreases the profit of a business
organization. It is the measurement of the productivity of the expenses in
generating the income of a business organization. The amount of income that a
unit of expenses generates is measured by the ratio of total income to total
expenses. The high ratio is the indication of higher productivity of expenses
and vice-versa.

60
In the above table, this ratio of KBL is: 1.25, 1.38, 1.53, 1.93, and 2.19 in the
years starting from FY 2059/60 till 2063/64 respectively with the mean ratio
of 1.656 and S.D. 0.39. But in case of EBL the ratio is: 1.45, 1.67, 1.76, 2.55,
and 2.54 respectively with the mean ratio of 1.994 and S.D. 0.52. This shows
that the ratio of both the bank is in increasing trend but in the last year the
ratio is slightly declined.
61
7. Total Income to Total Working Fund Ratio
The ratio measures the proportion of total income tot total working fund. It
measures the efficiency of total working fund in generating total income. The
ratio is calculated by dividing the total income by total working fund.
In the above table, this ratio of KBL is: 0.07, 0.06, 0.07, 0.10, and 0.11 in the
years starting from FY 2059/60 till 2063/64 respectively with the mean ratio
of 0.082 and S.D. 0.02. But in case of EBL the ratio is: 0.08, 0.08, 0.07, 0.10,
and 0.09 respectively with the mean ratio of 0.084 and S.D. 0.01. This shows
that the ratio is consistent over the periods.
8. Return on Loans & Advances Ratio
Return on loan and advances ratio measures the proportion of net income to
loan and advances. It measures the efficiency of the loans and advances in
generating the net income. It is calculated by dividing net profit of the bank
by its loans and advances. Higher the ratio is the indication of higher
performance of loans and advances in generating net profit and vice-versa.
In the above table, this ratio of KBL is: 0.01, 0.01, 0.02, 0.02, and 0.02 in the
years starting from FY 2059/60 till 2063/64 respectively with the mean ratio
of 0.016 and S.D. 0.004. But in case of EBL the ratio is: 0.02, 0.02, 0.02,
0.02, and 0.02 respectively with the mean ratio of 0.02 and S.D. 0. This shows
that the ratio of EBL is more consistent over the periods than that of KBL.
9. Return on Total Working Fund Ratio (ROA)
This ratio measures the proportion of net profit of the bank to total working
fund. It measures the efficiency of the working fund in generating its net
profit. The ratio is calculated by dividing the net profit by working fund.
62
Higher the ratio means the higher the efficiency of the bank in utilizing its
working fund and vice-versa.
In the above table, this ratio of KBL is: 0, 0.01, 0.01, 0.01, and 0.01 in the
years starting from FY 2059/60 till 2063/64 respectively with the mean ratio
of 0.01 and S.D. 0.004. But in case of EBL the ratio is: 0.01, 0.01, 0.01, 0.01,
and 0.01 respectively with the mean ratio of 0.01 and S.D. 0.001. This shows
that the ratio is consistent over the periods.
10. Return on Equity (ROE)
Return on equity shows the proportion of net profit of the bank to its
shareholders equity. It measures the efficiency of equity in generating the net
profit of the bank. The ratio is calculated by dividing the net profit of the bank
by its shareholders equity.
In the above table, this ratio of KBL is: 0.03, 0.09, 0.14, 0.12, and 0.17 in the
years starting from FY 2059/60 till 2063/64 respectively with the mean ratio
of 0.11 and S.D. 0.05. But in case of EBL the ratio is: 0.15, 0.21, 0. 22, 0.25,
and 0.25 respectively with the mean ratio of 0.216 and S.D. 0.04. This shows
that the ratio is in increasing trend over the periods.
11. Earning Per Share (EPS)
EPS is calculated by dividing the total net earning of the by total number of
shares. It shows the net profit per share. Higher the ratio indicates the higher
the efficiency of the bank and vice-versa. It represents the overall efficiency
of the bank.
In the above table, this ratio of KBL is: 3.56, 9.74, 17.6, 16.6, and 22.7 in the
years starting from FY 2059/60 till 2063/64 respectively with the mean EPS of

63
14.04 and S.D. 7.47. But in case of EBL the ratio is: 29.9, 45.6, 54.2, 62.8,
and 78.4 respectively with the mean EPS of 54.18 and S.D. 18.2. This shows
that the ratio of both the bank is increasing over the periods.
64
12. Net Interest Margin
Net interest margin measures the proportion of net interest (interest income-
interest expenses) to loan and advances. It shows the efficiency of the bank to
earn profit to meet the other various costs like office, staffing, and etc.
expenses and to provide the attractive return to shareholders. The ratio is
calculated by dividing net interest by loans and advances. Higher the ratio
indicates the higher the bank’s efficiency to meet other expense s and to
provide return to shareholders.
In the above table, this ratio of KBL is: 0.04, 0.04, 0.05, 0.04, and 0.04 in the
years starting from FY 2059/60 till 2063/64 respectively with the mean ratio
of 0.042 and S.D. 0.003. But in case of EBL the ratio is: 0.04, 0.06, 0.06,
0.05, and 0.05 respectively with the mean ratio of 0.052 and S.D. 0.01. This
shows that the ratio is consistent over the periods.
4.5 Growth Ratios
The study is based on the annual reports published by the banks for 5 years
starting from FY 2059/60 to 2063/64. And the study is comparative. That is
why; the findings of the study cannot be generalized. The growth ratio helps
the researchers to determine the trend of the various parameters so that a
conclusion about the various parameters of the bank can be outlined. The
growth ratio can be calculated by dividing the last period figure by the
preceding period figure. Here, the growth ratios related to investment policies
are presented and analyzed.
a.) Deposits Growth Rate
The growth ratio of total deposit shows the trend of the deposits of the bank.
It shows the banks’ efficiency in increasing its deposits.

65

66
Table- 5
Deposits Growth Rate
FY KBL EBL
Total deposit (Rs.in
million)
Growth rate
(In %)
Total deposit (Rs.in
million)
Growth
rate (In
%)
2059/60 2513.14 - 6694.96 -
2060/61 4807.94 131.31 8063.90 120.44
2061/62 6268.96 130.39 10097.69 125.22
2062/63 7768.96 123.93 13802.44 136.69
2063/64 10557.42 135.89 18186.25 131.76
In the above table, the growth rate of KBL is: -, 131.31%, 130.39%, 123.93%,
and 135.89% in the years starts from FY 2059/60 till 2063/64 respectively.
But in case of EBL the growth rate is: -, 120.44%, 125.22%, 136.69%, and
131.76% respectively. This shows that the growth rate of both the bank is
fluctuating slightly over the periods.
b.) Loans & Advances Growth Rate
The loan and advances growth rate shows the trend of the loan and advances
of the bank.
Table- 6
Loans & Advances Growth Rate
FY KBL EBL
Loans & Advances
(Rs in million)
Growth Rate
(In %)
Loans & Advances (Rs in
million)
Growth
Rate (In %)
2059/60 2105.74 - 4908.46 -
2060/61 3649.01 173.29 5884.12 119.88
2061/62 5590.93 153.22 7618.67 129.48
2062/63 6891.86 123.27 9801.31 128.65
2063/64 8929.01 129.56 13664.08 139.41
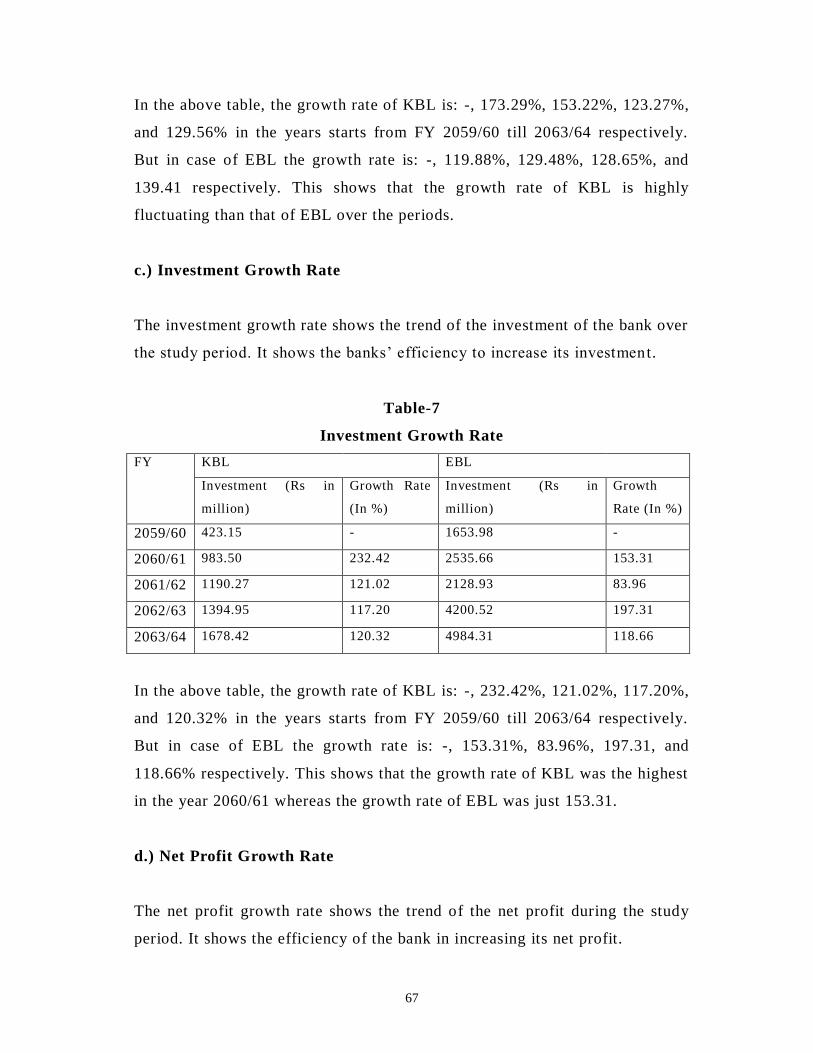
67
In the above table, the growth rate of KBL is: -, 173.29%, 153.22%, 123.27%,
and 129.56% in the years starts from FY 2059/60 till 2063/64 respectively.
But in case of EBL the growth rate is: -, 119.88%, 129.48%, 128.65%, and
139.41 respectively. This shows that the growth rate of KBL is highly
fluctuating than that of EBL over the periods.
c.) Investment Growth Rate
The investment growth rate shows the trend of the investment of the bank over
the study period. It shows the banks’ efficiency to increase its investmen t.
Table-7
Investment Growth Rate
FY KBL EBL
Investment (Rs in
million)
Growth Rate
(In %)
Investment (Rs in
million)
Growth
Rate (In %)
2059/60 423.15 - 1653.98 -
2060/61 983.50 232.42 2535.66 153.31
2061/62 1190.27 121.02 2128.93 83.96
2062/63 1394.95 117.20 4200.52 197.31
2063/64 1678.42 120.32 4984.31 118.66
In the above table, the growth rate of KBL is: -, 232.42%, 121.02%, 117.20%,
and 120.32% in the years starts from FY 2059/60 till 2063/64 respectively.
But in case of EBL the growth rate is: -, 153.31%, 83.96%, 197.31, and
118.66% respectively. This shows that the growth rate of KBL was the highest
in the year 2060/61 whereas the growth rate of EBL was just 153.31.
d.) Net Profit Growth Rate
The net profit growth rate shows the trend of the net profit during the study
period. It shows the efficiency of the bank in increasing its net profit.

68

69
Table-8
Net Profit Growth Rate
FY KBL EBL
Net Profit (Rs in
million)
Growth Rate
(In %)
Net profit (Rs in million) Growth
Rate (In %)
2059/60 12.47 - 94.18 -
2060/61 48.69 390.46 143.57 152.44
2061/62 87.88 180.49 170.81 118.97
2062/63 103.67 117.97 237.29 138.92
2063/64 170.26 164.23 296.41 124.91
In the above table, the growth rate of KBL is: -, 390.46%, 180.49%, 117.97%,
and 164.23% in the years starts from FY 2059/60 till 2063/64 respectively.
But in case of EBL the growth rate is: -, 152.44%, 118.97%, 138.92%, and
124.91% respectively. This shows that the growth rate of KBL is highly
increasing in the first two years than that of EBL.
4.6 Correlation Coefficient Analysis
Under this topic, Karl Pearson’s co-efficient of correlation is used to find out
the relationship between various independent and dependant variables such as
deposits and loans and advances, deposits and investments, loans and
advances and net profit, investments and net profit etc. The relationship may
be positive and negative. It may be highly significant or insignificant. It helps
the researcher to measure the nature and the degree of movement of the
relationship between dependant and independent variables.
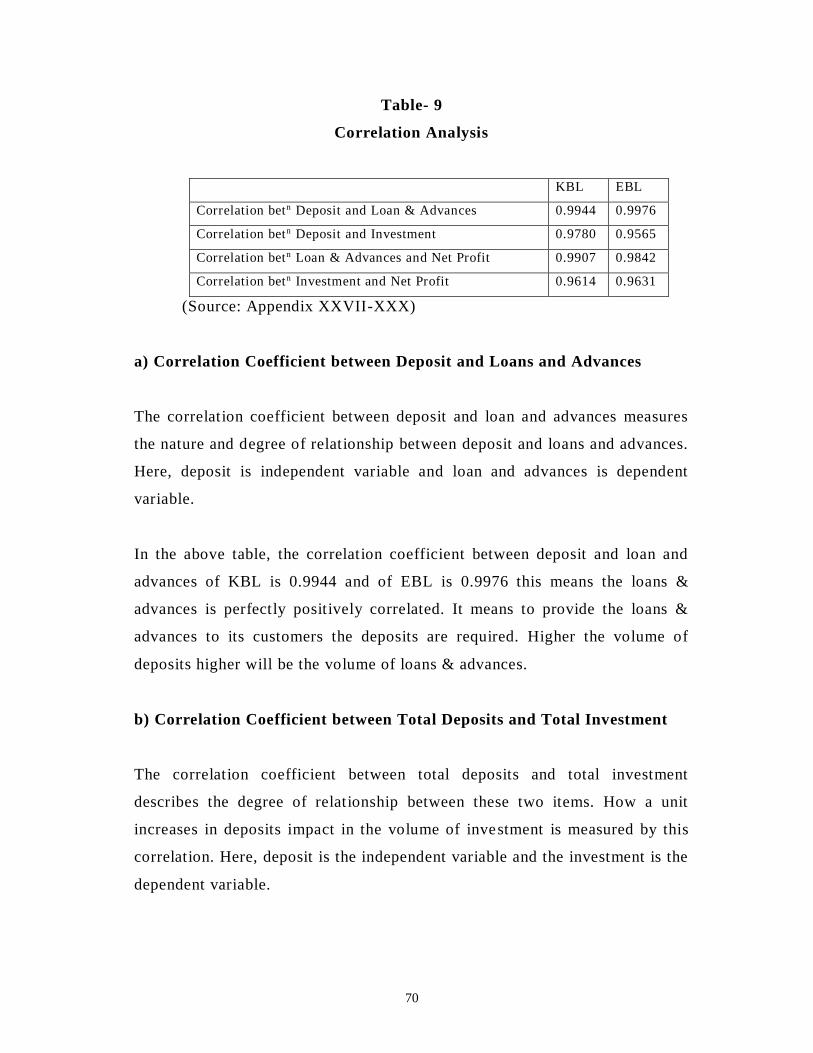
70
Table- 9
Correlation Analysis
KBL EBL
Correlation betn Deposit and Loan & Advances 0.9944 0.9976
Correlation betn Deposit and Investment 0.9780 0.9565
Correlation betn Loan & Advances and Net Profit 0.9907 0.9842
Correlation betn Investment and Net Profit 0.9614 0.9631
(Source: Appendix XXVII-XXX)
a) Correlation Coefficient between Deposit and Loans and Advances
The correlation coefficient between deposit and loan and advances measures
the nature and degree of relationship between deposit and loans and advances.
Here, deposit is independent variable and loan and advances is dependent
variable.
In the above table, the correlation coefficient between deposit and loan and
advances of KBL is 0.9944 and of EBL is 0.9976 this means the loans &
advances is perfectly positively correlated. It means to provide the loans &
advances to its customers the deposits are required. Higher the volume of
deposits higher will be the volume of loans & advances.
b) Correlation Coefficient between Total Deposits and Total Investment
The correlation coefficient between total deposits and total investment
describes the degree of relationship between these two items. How a unit
increases in deposits impact in the volume of investment is measured by this
correlation. Here, deposit is the independent variable and the investment is the
dependent variable.

71
In the above table, the correlation coefficient between deposits and investment
of KBL is 09780 and of EBL is 0.9565. This means the deposits and
investments are positively correlated but not perfectly.
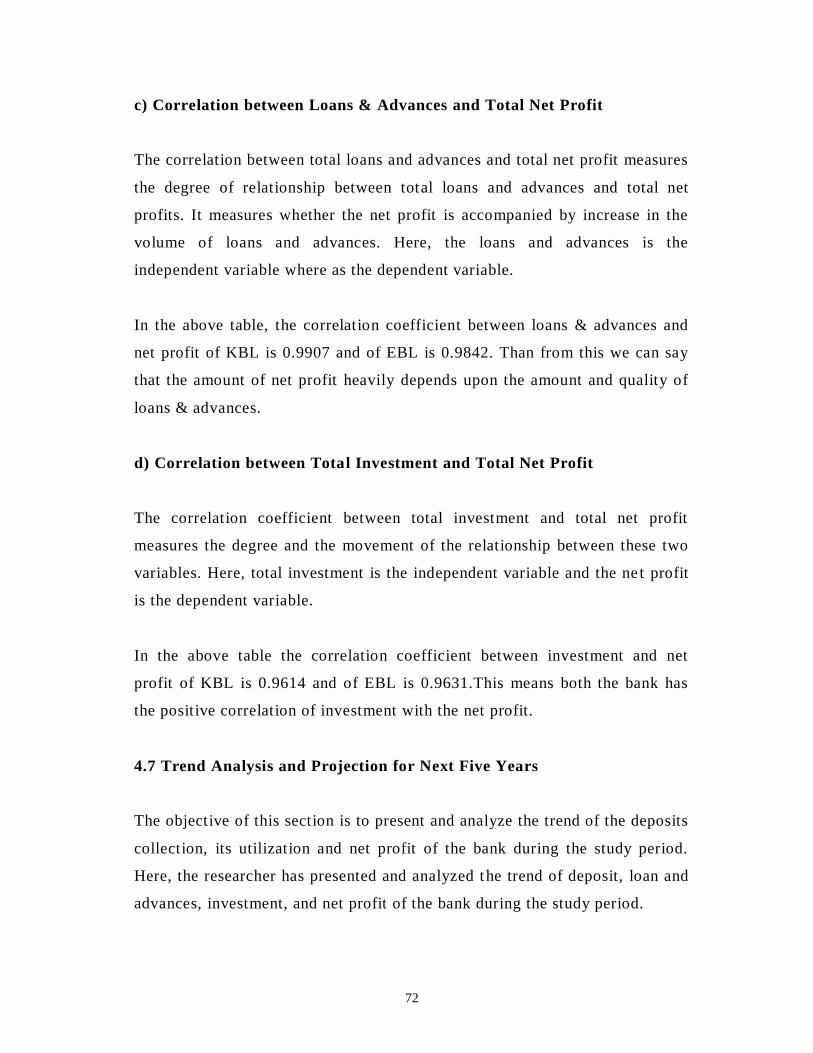
72
c) Correlation between Loans & Advances and Total Net Profit
The correlation between total loans and advances and total net profit measures
the degree of relationship between total loans and advances and total net
profits. It measures whether the net profit is accompanied by increase in the
volume of loans and advances. Here, the loans and advances is the
independent variable where as the dependent variable.
In the above table, the correlation coefficient between loans & advances and
net profit of KBL is 0.9907 and of EBL is 0.9842. Than from this we can say
that the amount of net profit heavily depends upon the amount and quality of
loans & advances.
d) Correlation between Total Investment and Total Net Profit
The correlation coefficient between total investment and total net profit
measures the degree and the movement of the relationship between these two
variables. Here, total investment is the independent variable and the ne t profit
is the dependent variable.
In the above table the correlation coefficient between investment and net
profit of KBL is 0.9614 and of EBL is 0.9631.This means both the bank has
the positive correlation of investment with the net profit.
4.7 Trend Analysis and Projection for Next Five Years
The objective of this section is to present and analyze the trend of the deposits
collection, its utilization and net profit of the bank during the study period.
Here, the researcher has presented and analyzed the trend of deposit, loan and
advances, investment, and net profit of the bank during the study period.

73
a.) Trend Analysis of Total Deposits
The trend value of deposit is presented in the table from 2059/60 to 2068/69.
The trend value of deposit from 2064/65 to 2068/69 is expected values of the
deposits in the respective years.
Table-10
Trend Analysis of Total Deposits
(Rs. in million)
FY KBL EBL
x Trend Value x Trend Value
2059/60 -2 2,573.36 -2 5625.05
2060/61 -1 4,478.32 -1 8497.05
2061/62 0 6,383.28 0 11369.05
2062/63 1 8,288.24 1 14241.05
2063/64 2 10,193.20 2 17113.05
2064/65 3 12,098.16 3 19985.05
2065/66 4 14,003.12 4 22857.05
2066/67 5 15,908.08 5 25729.05
2067/68 6 17,813.04 6 28601.05
2068/69 7 19,718.00 7 31473.05
(Source: APPENDIX- XXXI)
Figure-1

74
Trend Analysis of Deposits
0.00
5,000.00
10,000.00
15,000.00
20,000.00
25,000.00
30,000.00
35,000.00
2059/60 2060/61 2061/62 2062/63 2063/64 2064/65 2065/66 2066/67 2067/68 2068/69
Fiscal Year
Tre
nd
Va
lues
(in
mil
lio
n)
KBL
EBL
Here, the effort has been made to analyze the trend values of total deposit of
KBL and EBL from 2059/60 to 2068/69, which includes the forecasting of
five years. The above table shows the trend values deposits of different period
from 2059/60 to 2068/69. The deposit forecasted for the FY 2064/65 of KBL
is NPR. 12098.16 million and that for the FY 2068/69 is NPR. 19718 million.
And of EBL is NPR. 19985.05 million for the FY 2064/65 and NPR. 31473.05
million for the FY 2068/69. The t rend of deposit in both the bank is
increasing.
b.) Trend Analysis of Loans and Advances
The trend values of loans & advances are presented in the table. The trend
values of loans & advances from 2064/65 to 2068/69 are expected value of
loans & advances in the respective years.
Table-11
Trend Analysis of Loans & Advances
(Rs. in million)

75
FY KBL EBL
x Trend Value x Trend Value
2059/60 -2 2055.43 -2 4091.33
2060/61 -1 3744.37 -1 6233.33
2061/62 0 5433.31 0 8375.33
2062/63 1 7122.25 1 10517.33
2063/64 2 8811.19 2 12659.33
2064/65 3 10500.13 3 14801.33
2065/66 4 12189.07 4 16943.33
2066/67 5 13878.01 5 19085.33
2067/68 6 15566.95 6 21227.33
2068/69 7 17255.89 7 23369.33
(Source: APPENDIX- XXXII)

76
Figure- 2
Trend Analysis of Loans & Advances
0
5000
10000
15000
20000
25000
2059/60 2060/61 2061/62 2062/63 2063/64 2064/65 2065/66 2066/67 2067/68 2068/69
Fiscal Year
Tre
nd
Val
ues
(in
mill
ion
)
KBL
EBL
The above table shows that the loans & advances of both the bank is in
increasing trend. The expected value of loans & advances of KBL in 2064/65
and 2068/69 are NPR.10500.13 million and 17255.89 million respectively.
And of EBL in 2064/65 is 14801.33 million and 23369.33 million in the year
2068/69.
c.) Trend Analysis of Investment
The trend values of investment are presented in the table. The trend values of
investment from 2064/65 to 2068/69 are expected values of loans & advances
in the respective years.
Table- 12
Trend Analysis of Investments
(Rs. in million)
FY KBL EBL
x Trend Value x Trend Value
2059/60 -2 549.66 -2 1435.98
2060/61 -1 841.86 -1 2268.33
2061/62 0 1134.06 0 3100.68
2062/63 1 1426.26 1 3933.03
2063/64 2 1718.46 2 4765.38
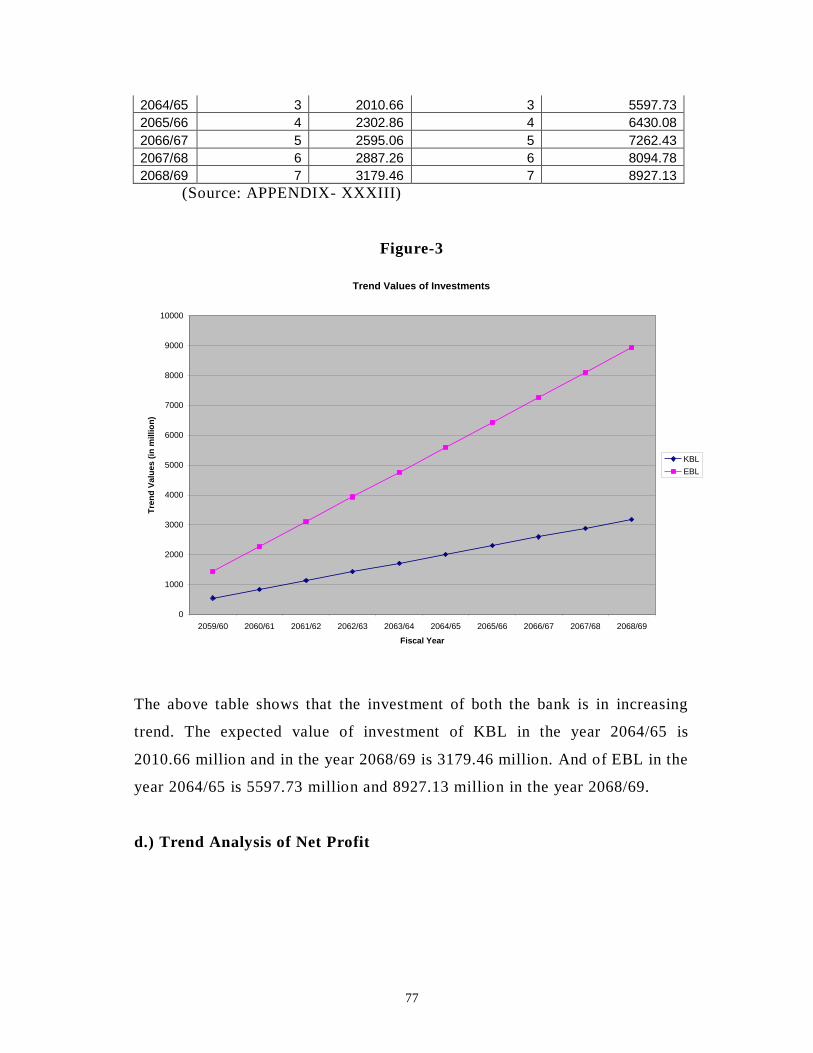
77
2064/65 3 2010.66 3 5597.73
2065/66 4 2302.86 4 6430.08
2066/67 5 2595.06 5 7262.43
2067/68 6 2887.26 6 8094.78
2068/69 7 3179.46 7 8927.13
(Source: APPENDIX- XXXIII)
Figure-3
Trend Values of Investments
0
1000
2000
3000
4000
5000
6000
7000
8000
9000
10000
2059/60 2060/61 2061/62 2062/63 2063/64 2064/65 2065/66 2066/67 2067/68 2068/69
Fiscal Year
Tre
nd
Valu
es (
in m
illio
n)
KBL
EBL
The above table shows that the investment of both the bank is in increasing
trend. The expected value of investment of KBL in the year 2064/65 is
2010.66 million and in the year 2068/69 is 3179.46 million. And of EBL in the
year 2064/65 is 5597.73 million and 8927.13 million in the year 2068/69.
d.) Trend Analysis of Net Profit

78
The trend values of net profit are presented in the table. The trend values of
net profit from 2064/65 to 2068/69 are expected value of net profit in the
respective years.
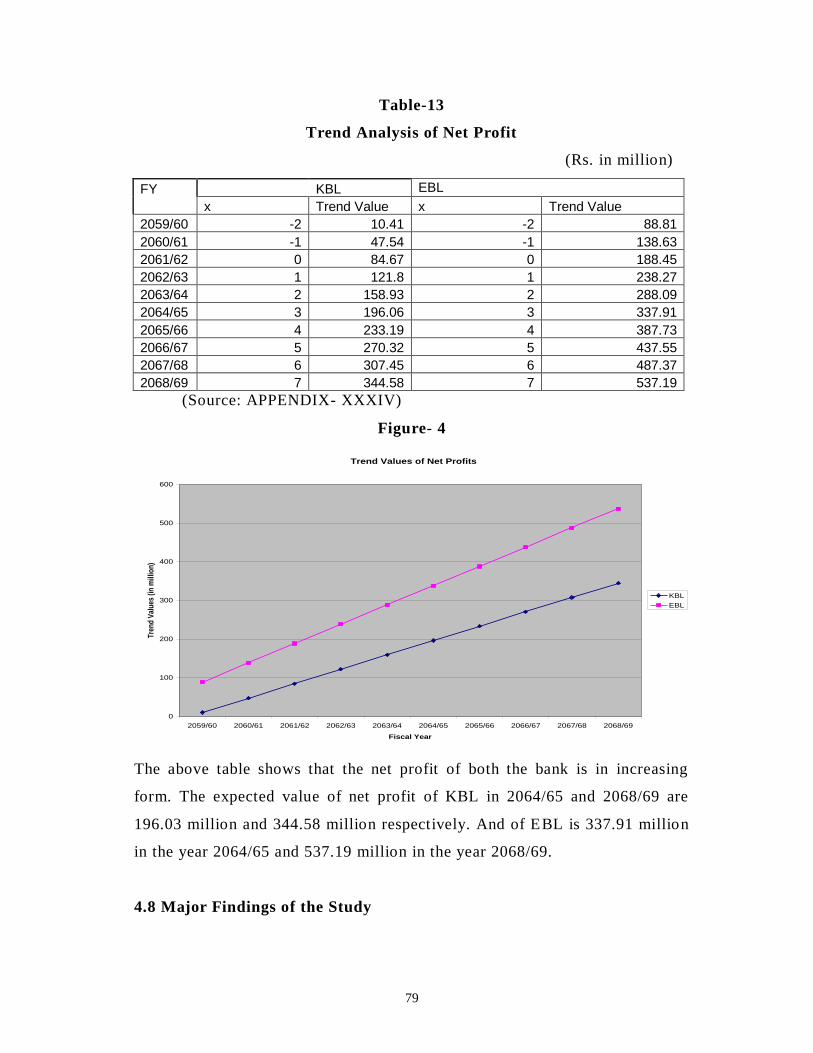
79
Table-13
Trend Analysis of Net Profit
(Rs. in million)
FY KBL EBL
x Trend Value x Trend Value
2059/60 -2 10.41 -2 88.81
2060/61 -1 47.54 -1 138.63
2061/62 0 84.67 0 188.45
2062/63 1 121.8 1 238.27
2063/64 2 158.93 2 288.09
2064/65 3 196.06 3 337.91
2065/66 4 233.19 4 387.73
2066/67 5 270.32 5 437.55
2067/68 6 307.45 6 487.37
2068/69 7 344.58 7 537.19
(Source: APPENDIX- XXXIV)
Figure- 4
Trend Values of Net Profits
0
100
200
300
400
500
600
2059/60 2060/61 2061/62 2062/63 2063/64 2064/65 2065/66 2066/67 2067/68 2068/69
Fiscal Year
Tre
nd
Val
ues
(in
mill
ion
)
KBL
EBL
The above table shows that the net profit of both the bank is in increasing
form. The expected value of net profit of KBL in 2064/65 and 2068/69 are
196.03 million and 344.58 million respectively. And of EBL is 337.91 million
in the year 2064/65 and 537.19 million in the year 2068/69.
4.8 Major Findings of the Study
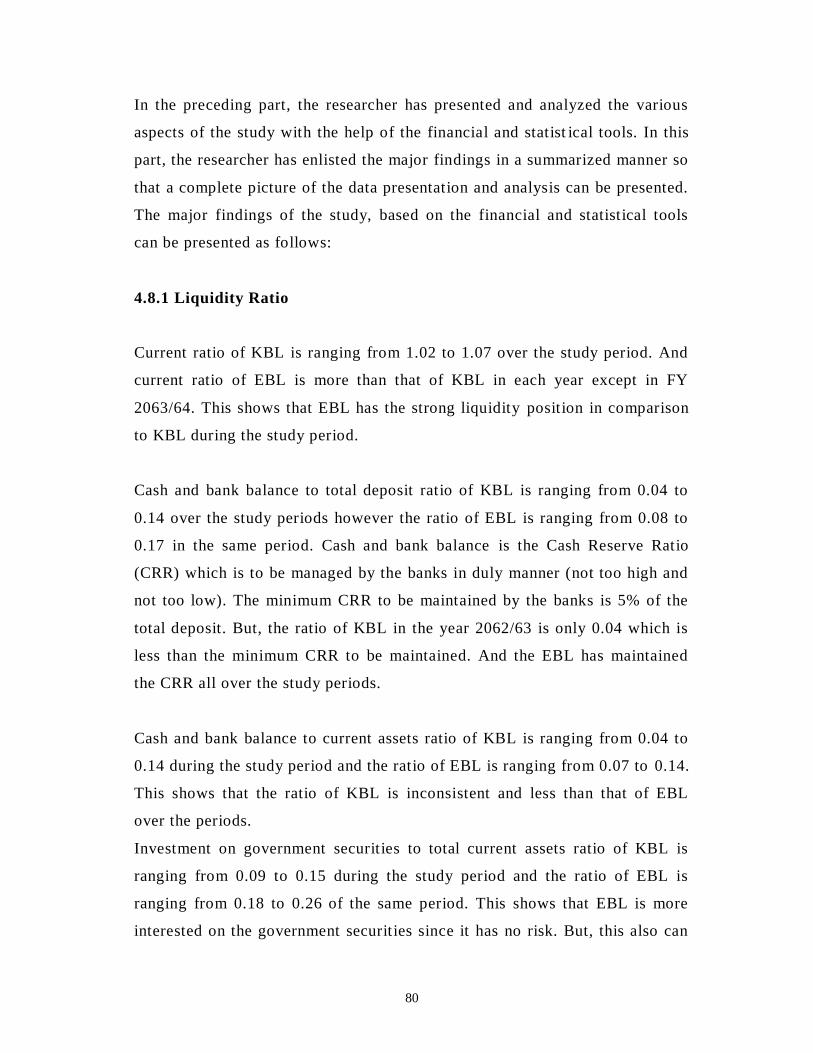
80
In the preceding part, the researcher has presented and analyzed the various
aspects of the study with the help of the financial and statist ical tools. In this
part, the researcher has enlisted the major findings in a summarized manner so
that a complete picture of the data presentation and analysis can be presented.
The major findings of the study, based on the financial and statistical tools
can be presented as follows:
4.8.1 Liquidity Ratio
Current ratio of KBL is ranging from 1.02 to 1.07 over the study period. And
current ratio of EBL is more than that of KBL in each year except in FY
2063/64. This shows that EBL has the strong liquidity position in comparison
to KBL during the study period.
Cash and bank balance to total deposit ratio of KBL is ranging from 0.04 to
0.14 over the study periods however the ratio of EBL is ranging from 0.08 to
0.17 in the same period. Cash and bank balance is the Cash Reserve Ratio
(CRR) which is to be managed by the banks in duly manner (not too high and
not too low). The minimum CRR to be maintained by the banks is 5% of the
total deposit. But, the ratio of KBL in the year 2062/63 is only 0.04 which is
less than the minimum CRR to be maintained. And the EBL has maintained
the CRR all over the study periods.
Cash and bank balance to current assets ratio of KBL is ranging from 0.04 to
0.14 during the study period and the ratio of EBL is ranging from 0.07 to 0.14.
This shows that the ratio of KBL is inconsistent and less than that of EBL
over the periods.
Investment on government securities to total current assets ratio of KBL is
ranging from 0.09 to 0.15 during the study period and the ratio of EBL is
ranging from 0.18 to 0.26 of the same period. This shows that EBL is more
interested on the government securities since it has no risk. But, this also can
81
be stated that KBL has succeeded to search the lending market in comparison
to EBL.
Loan & advances to current assets ratio of KBL ranging from 0.72 to 080 but
the ratio of EBL is 0.62 to 0.66. The ratio of EBL is low due to the greater
portion invested in the government securities.
If the overall liquidity position is analyzed, it is found that the KBL has
reduced its cash and bank balance significantly during the period. In
comparison to KBL, EBL has the strong liquidity position.
4.8.2 Assets Management Ratio
Loans & advances to total deposit ratio of KBL is ranging from 0.76 to 0.89
where as the ratio OF EBL is ranging from 0.71 to 0.75. The ratio of EBL is
less than that of KBL because of higher portion of amount invested into the
government securities.
Total investment to total deposit ratio of KBL is ranging from 0.16 to 0.20
where as the ratio of EBL is 0.21 to 0.31. This shows that the ratio of EBL is
higher than that of KBL during the study period.
Loans & advances to total working fund ratio of KBL is ranging in between
0.66 and 0.76 whereas the ratio of EBL is ranging from 0.61 to 0.65 over the
periods. This shows that the ratio of KBL is inconsistent in comparison to
EBL.
Investment on government securities to total working fund ratio of KBL is
ranging from 0.08 to 0.15 whereas the ratio of EBL is 0.18 to 0.26 over the
periods. EBL uses to invest the huge portion of total assets into the
government securities during the study period.
82
Total outside assets to total deposits ratio of KBL is ranging from 0.96 to 1.08
where as the ratio of EBL is 0.97 to 1.04 over the periods. This shows that the
ratio of KBL is more than that of EBL in most of the years.
Loans & advances to total outside assets ratio of KBL is ranging from 0.79 to
0.84 where as the ratio of EBL is 0.70 to 0.78 over the periods. This shows
that the ratio of KBL is higher than that of EBL since it invests the large
amount in the risky area than that of EBL.
Investment on government securities to total outside assets ratio of KBL is
ranging from 0.09 to 0.17 where as the ratio of EBL is 0.22 to 0.29 over the
periods. This shows that the ratio of KBL is less than that of EBL since EBL
has invested the huge portion in the risk less area.
Total outside assets to total assets ratio of KBL is ranging in between 0.84 and
0.92 where as the ratio of EBL is in between 0.81 and 0.88 over the per iods.
The ratio of KBL is higher than that of EBL.
4.8.3 Activity Ratio
Loan loss provision to total loans & advances ratio of KBL is ranging from
0.01 to 0.02 where as the ratio of EBL is 0.03 to 0.04. This shows that KBL
has less loan loss provision to total loans & advances than that of EBL.
Non-performing loans to total loans & advances ratio of KBL & EBL is
ranging in between 0.01 and 0.02. In the FY 2059/60 the NPL of KBL is 0.02
and in other FYs the NPL is only 0.01. But in case of EBL, in the FYs
2059/60, 2060/61, and 2061/62 the NPL is 0.02 and only in the FYs 2062/63
and 2063/64 is 0.01. This means the NPL is the same in the last two years.
4.8.4 Profitability Ratio

83
Interest income to total income ratio of KBL is ranging in between 0.63 and
0.92 where as the ratio of EBL is ranging in between 0.58 and 0.84. The ratio
of KBL is more than that of EBL in every year. But the ratio of both the bank
is decreasing since last three years.
Total interest earned to total outside assets ratio of KBL is 0.07 throughout
the period which is very consistent where as the ratio of EBL is ranging in
between 0.06 and 0.08 over the periods.
Interest expenses to total expenses ratio of KBL is ranging in between 0.57
and 0.69 where as the ratio of EBL is ranging in between 0.61 to 0.70. The
ratio of KBL is constantly increasing over the periods but in case of EBL the
ratio is in decreasing form for the first three years and in the last three years
the ratio is in increasing form.
Total interest income to total working fund ratio of KBL is in between 0.06
and 0.07 where as the ratio of EBL is in between 0.05 and 0.07. This shows
that the ratio of both the banks is consistent over the periods.
Total interest expenses to total working fund ratio of KBL is in between 0.03
and 0.04 where as the ratio of EBL is in between 0.02 and 0.04. The ratio of
KBL is higher than that of EBL in the last two years.
Total income to total expenses ratio of KBL is in between 1.25 and 2.19 where
as the ratio of EBL is in between 1.45 and 2.55. The ratio of KBL is in
increasing trend throughout the periods but in case of EBL the ratio is in
decreasing form in the last two years.
Total income to total working fund ratio of KBL is in between 0.06 and 0.11
and of EBL is in between 0.07 and 0.10. The ratio of KBL is increasing all

84
over the periods keeping except for the first year. But in case EBL, ratio is ups
and downs.
Return on loans & advances ratio of KBL is in between 0.01 and 0.02 but in
case of EBL the ratio is consistent i.e. 0.02 all over the periods. The ratio of
KBL also seems consistent in the last three years.
Return on total working fund ratio (ROA) of KBL and EBL in all the years is
0.01 which is very consistent.
Return on equity (ROE) of KBL is in between 0.03 and 0.17 where as the ROE
of EBL is in between 0.15 and 0.25. Here, the ROE of both the bank is
increasing however the ratio of EBL is higher than that of KBL in all the years
of study period.
Earning per share (EPS) of KBL is in between 3.56 and 22.7 where as the EPS
of EBL is in between 29.9 and 78.4. Here, the EPS of EBL is higher than KBL
in all the years.
Net interest margin of KBL is in between 0.04 and 0.05 where as the NIM of
EBL is in between 0.04 and 0.06 the ratio of KBL is consistent in the first two
years, increased in the third year and decreased in the last two years. But in
case of EBL, the ratio is increased in 2 nd & 3rd years and decreased in last two
years.
85
CHAPTER-V
SUMMARY, CONCLUSION AND RECOMMENDATION
There are two aspects included in the chapter. The first aspect focuses on the
summary and the conclusion of the study while the second aspect focuses on
the suggestions and recommendations that are useful to improve the portfolio
management practices of KBL and EBL.
5.1 Summary
Economic development is essential for the development of the country. For
this, it is required to transform savings into actual investment. Economic
development is supported by financial infrastructure of the country. The
financial institutions transfer funds from surplus spending units to deficit
units.
The basic task of financial institutions is to mobilize the saving of the
community and ensure efficient allocation of the savings to high yielding
investment projects to offer attractive and secured returns to different sectors
of the economy according to planned priorities of the country, on the other
hand, this process of financial institutions give rise to money and other
financial assets which therefore have a central place in the development
process of the economy. Banking sector plays an important role in the
economic development of the country. It provides an effective payment and
credit system, which facilitates the channeling of funds from the surplus
(savers) units to the deficit units (investors) in the economy.
Investment operation of commercial banks is very risky one. For this,
commercial banks have to pay due consideration while formulating investment
policy. A healthy development of any commercial bank depends upon its
86
investment policy. A good investment policy attracts both the borrowers and
lenders, which helps to increase the volume of quality deposits and
investment.
In most years, banks are the leading buyers of bonds and notes issued by
government to finance public facilities, ranging from hospital and football
stadium to airport and highways. Moreover, bank reserves the principal
channel for government economic policy to stabilize the economy. And banks
are also the most important sources of short -term working capital needed for
the businesses. They have become increasingly active in recent years in
making long-term business loans for new plant and equipment. When
businesses and consumers must make payments for the purchase of goods and
services, more often they use bank provided cheques, credit or debit cards, or
electronic accounts connected to a computer network. It is the banker to whom
they turn most frequently for advice and counsel when they need financial
information and financial planning.
A bank always puts in effort to maximize its profitabil ity. The profit is excess
of income over expenses. To maximize profit income should be reasonably
excess over expenses. The major source of income of a bank is interest income
from loans, investments and fee based income. As loan and advances dominate
the asset side of the balance sheet of any bank; similarly, earnings from such
loan and advances occupy a major space in income statement of the bank.
However, it is very important to be reminded that most of the bank failures in
the world are due to the shrinkage in the value of loan and advances. Hence,
loan is known as risky asset and investment operation of commercial banks is
very risky one. Risk of non-performing loans erodes even existing capital.
Considering the importance of lending to the individual banks and also to the
society it serves, it is imperative that the bank meticulously plans its credit
operations.
87
The major problem in almost all underdeveloped countries and Nepal is no
exception, is that of capital formation and proper utilization. In such
countries, the commercial banks have to shoulder more responsibilities and
acts as development banks, due to the lack of other specialized institutions.
Commercial banks in the developing countries like Nepal have the greatest
responsibility towards the economic development of the country. In modern
times, since credit or bank money constitutes bulk is of the economy’s
aggregate money supply, it mostly changes the volume of bank money or
credit rather than changes in the total supply of the high-powered money
issued by the reserves held by the bank against their deposit liabilities that
account for changes in the aggregated money supply. The main goal of the
bank as a commercial organization is to maximize the surplus by the efficient
use of its funds and resources. In spite of being a commercial institution, it too
have a responsibility (obligation) to provide social service oriented
contribution for the social economic upliftment to the country by providing
specially considered loans and advances towards less privileged sectors.
A bank’s marketing starts with proper relationship with customers either to
attract savings or for the loan disbursement. Both the depositors and creditors
are customers of the banks. Banks offer various products for deposit
mobilization and disburse the credit products as per the portfolio management.
Customers as per their need purchase different types of product offered in the
market. Deposit products offered to the customers are categorized into general
products and special products. And credit products can be bifurcated into fund
based products and non-fund based products. The fund based products in
practice are developed from the credit products generally known as overdraft,
working capital loan, Term loan, bills purchase or negotiation, export and
import bills, import/trust receipt loan, export credit, loan against fixed deposit
receipt, loan against shares, loan against securities, and loan against bank
guarantee and deprived sector loan. The term loan used in practice generally
88
addresses short term loam medium term loan and long term loan to be
advanced in various forms such as housing loan, hire purchase loan and bridge
financing. The non-fund based product is composed of letter of credit (LC)
and bank guarantees with different forms (bid bonds, performance bonds, etc.)
Among the different banking products available in the market, the product
with high demand are consumer credit, export and import credit, term loan,
Project loan and syndicate loan. All banks and financial institution on the
basis of their capital base and liquidity position offer these credit products but
none of them so far have been found to have expertise in any one of them for
marketing. Relying on any one product by portfolio seems more risky. Banks
in foreign countries are known to bring out numerous products. As an
example, the bank of America has the vast range of banking business serving
individuals and small firms and a big share of the loan syndicate market. It
means markets are there for some products and it is created for others. Banks
in Nepal are weak in locating the existing market and in creating new markets
too.
Loan disbursement is a trade of win-win game lenders and borrowers both get
benefited out of it. Customers, not products are the ultimate source of income.
For the analysis of customers several questions need to be answered. These
includes questions such as which customers buy the product and how they use
it, where customers buy the product, when customer buy, how customer
choose, why they preferred that product, how they respond, and will they buy
it again. All these data available in the respective files of the customer make
the marketing activities quite easier and effective.
Portfolio is the holding of a collection of investment . For some individuals
and institutions, it is the entire holdings consisting of both assets and
liabilities. An investment held as part of a portfolio is less risky then the same
investment held individually. So, every individuals and institutions should
89
manage the portfolio by which the individuals and institutions get maximum
return. The concept of portfolio comes from "not putting all the eggs in one
basket". Portfolio theory evaluates the reduction of non-systematic or
diversifiable risks through the selection of securities or other instruments in to
a composite holding or efficient portfolio. This efficiency means that a
portfolio would offer lower risks or more stable returns for a targeted return
level. Instruments that have independent returns lower non-systematic risks.
Also, instruments that are inversely related on a return basis reduce the
diversifiable risks. The basic theory assumes that returns are independent,
investors expectations are homogeneous, and that the normalized probability
distributions are stable.
Investment positions are undertaken with the goal of earning some expected
rate of return. Investors seek to minimize inefficient deviations from this
expected rate of return. Diversification is essential to the creation of an
efficient investment because it can reduce the variability of returns around the
expected return.
5.2 Conclusions
1. The mean of current ratio of KBL is 1.05 and of EBL is 1.06 during the
study period. Since the ratio is more than one, the banks are able to
meet its current obligations. The current ratio is decreasing in the most
recent years in both the banks. The mean of cash and bank balance to
total deposit ratio of KBL is 0.08 and of EBL is 0.11. The cash and
bank balance to total deposit ratio of KBL is highly f luctuated in FY
2061/62. The mean of cash and bank balance to current ratio of KBL is
0.08 whereas of EBL is 0.09. Likewise the mean of investment of
government securities to current assets ratio of KBL is 0.12 and of EBL
is 0.22.and loans and advances to current assets ratio of KBL is 0.77
and of EBL is 0.64. In conclusion, it can be said that the liquidity
90
position of both the banks is satisfactory since the current ratio of both
the banks are more than one over the period.
2. The liquidity position of KBL is decreasing. It suggests that the banks
are maintaining low liquidity. It will help to increase the overall profit
of the bank. The cash and bank balance to total deposit ratio as stated
earlier should be more than 5% of total deposit, which is set by NRB.
But in case of KBL, in the year 2062/63 the ratio is only 0.04. It means
the bank couldn’t maintain CRR as set by NRB. Investment on
government securities to current assets ratio of EBL is more than that
of KBL in all the years. This might be taken as the risk minimization
strategy than the KBL.
3. The mean CD ratio of KBL is 0.85 and of EBL is 0.73. The CD ratio of
70% (i.e. 0.70) is considered as good. Here, the CD ratio of both the
banks is greater than 0.76. It shows that the banks are aggressive in
lending. The ratio of KBL is decreasing in the last two years.Mean of
investment to total deposit ratio of KBL is 0.18 whereas of EBL is
0.27. The ratio is highly fluctuating over the periods than that of KBL.
The loans and advances to total working fund ratio of KBL is more
fluctuating and mean ratio than that of EBL. It shows that the KBL has
more productive investment. However, it increases the liquidity risk of
the bank.Mean of investment on government securities to total working
fund ratio of KBL is 0.11 whereas of EBL is 0.22. It shows that the
EBL is maintaining its liquidity by increasing its investment in
government securities.
4. The mean of total outside assets to total deposits ratio of KBL is 1.03
and of EBL is 1.01. The ratio of KBL is highly fluctuating over the
periods than that of EBL. Mean of loans and advances to total outside
assets ratio of KBL is 0.82 and of EBL is 0.73.In this also, the ratios
are fluctuating over the periods.The mean of loan loss provision to total
loans and advance ration of KBL is 0.016 and of EBL is 0.034. It shows

91
KBL has low ratio than that of EBL in all the years. It means KBL has
the more quality loans than that of EBL.
5. The means of non-performing loans to total loans and advances ratio of
KBL is 0.012 and of EBL is 0.016. It shows that the KBL has less NPL
than that of EBL. The mean of interest income to total income ratio of
KBL is 0.804 and EBL is 0.732. It shows that interest income has the
greater portion of total income is KBL than that of EBL. However, the
ratio is in decreasing trend in both the banks.
6. The mean of interest earned to total outside assets ratio of both the
bank is 0.07 which is consistent over the periods. The mean of interest
expenses to total expenses ratio of both the banks is 0.66. However, the
ratio is increasing in KBL throughout the period whereas in EBL the
ratio is decreased in first two years and is increased in last three years.
7. The mean of total income to total expenses ratio of KBL is 1.656 and of
EBL is 1.994. The ratio of both the bank is increasing. However, the
EBL has more ratio than that of KBL.
8. The mean of ROA of both the bank is 0.01. It shows that the ratio is
consistent over the periods. The mean of ROE of KBL is 0.11 and of
EBL is 0.216. It shows that the ROE of EBL is nearly as twice as of
KBL. However, the ratio of both the bank is increasing. The mean of
EPS of KBL is 7.47 and of EBL is 54.18. However, the ratio is
increasing in both the banks.
9. The growth rate of deposit for the period of KBL is more than that of
EBL in last years. However the total amount of deposit is greater of
EBL than to KBL. The growth rate of KBL of loans & advances is less
than that of EBL in the last year. The EBL is increasing the volume of
loans & advances. The growth rate of investment and net profit of both
the bank is highly fluctuating over the periods.

92
10. Correlations of both the bank with the different variables are positive
with more than +0.95 it means all the variable are positively correlated
with the variables used in the research. Trend analysis of all the
variables are in increasing throughout the periods. The trend of EBL in
almost the years is more increasing than that of KBL.
93
5.3 Recommendations
Based on the analysis and finding of the study, the following
recommendations can be made as suggestions to make the portfolio
management practices of KBL and EBL effective and efficient.
1. As the current ratios of both the banks are more than 1:1, it is good as
it can meet the short-term obligations. The cash and bank balance to
total deposit ratio of KBL is only 0.04 in the year 2062/63 which is less
than the CRR set by NRB. So, the bank is to be conscious to maintain
its CRR. Investment on government securities to total current assets
ratio of KBL is low than EBL. So, the KBL has to increase the volume
of investment in the government securities.
2. As stated earlier, the CD ratio of 70% is regarded as good but both the
banks have more than 70%. So these banks should minimize the CD
ratio. Moreover, the KBL has to decrease its CD ratio signific antly.
Total investment to deposit of KBL is less than that of EBL, hence it is
to be increased.
3. The loan loss provisions to total loans and advances of KBL are less
than that of EBL. So, the EBL has to maximize in the quality lending.
Hence, the loan loss provision will be minimized. NPL of KBL is also
lower than the EBL So, EBL should minimize its NPL since it doesn’t
indicate good.
4. Interest income of KBL is greater than EBL as it has more CD ratio.
ROA of both the banks are equal. ROE of KBL is less than EBL. So,
the KBL has to increase its ROE significantly. EPS of KBL is also less
than that of EBL.
Keeping all these in consideration, the KBL has less performance than that of
EBL. This might be due to the EBL is established six years before than KBL.
So, in this short span of time the KBL has earned the good reputation in the

94
market. Another thing is EBL is the joint -venture. So, in the future ahead, the
KBL improve its weaknesses by adopting the innovative approach to
marketing. In the light of growing competition in the banking sector, the
business of the bank should be customer oriented. It should strengthen and
activate its marketing function as it is an effective tool to attract and retain the
customers. For the purpose, the bank should develop an innovative approach
to bank marketing and formulate new strategies of serving customers in a
more convenient and satisfactory way by optimally utilizing the modern
technology and offering new facilities to the customers at competitive prices.
The bank is also required to explore the new market areas. For this purpose, it
is recommended to form a strong market department in its central level, which
deals with the banking products, places, price and promotion.

95
BIBLIOGRAPHY
Books
Bhandari, D. Raj (2003) Principle and Practices of Banking and Insurance,
Asia Publications, Baghbazar, Kathmandu
Crosse, H.D. (1963), Management Policies for Commercial Banks, New
Jersey: Prentice Hall Inc.
Doweri, G.W. & Fuller D.R. (1950), Investment, New York: Mc Graw Hill
Book Company
Edmister R.O. (1980), Financial Institutions, New York: Mc Graw Hill Inc.
Francis, J. Clark, (2003), Investment Analysis and Management, Post Graduate
Publications, Eleventh Edition
Gupta, S.C. (2002), Fundamental of Statistics, Himalayan Publishing House,
Bombay
Gupta, S.P. (2002), Statistical Methods, Educational Publisher, Sultan Chand
and Son’s, New Delhi
Howard K. Wolff and P.R. Pant (2005), Social Science research and Thesis
writing, Buddha Academic publishing and distributors, Kathmandu,
Nepal
Joshi, P.R. (2001), Research Methodology, Buddha Academic Publishers and
Distributors Pvt. Ltd, Kathmandu
Joshi, Shyam, (2056), Micro & Macro Economic Analysis, Taleju Prakashan,
Bhotahity, Katmandu
Kohn, M. (1999), Financial Institutions & Markets, Tata McGraw Hill
Publishing Co. Ltd. New York.
Koirala, Parashar (2007), A Consolidated Effort for Marketing in Commercial
Banks, Economic Review 19.
Kothari, C.R., (1994), Research Methodology, Methods and Techniques,
Vikash Publication House Pvt. Ltd, New Delhi
Pant, G.D. & Chaudhary, A.K. (1999), Business Statistics and Mathematics,
96
Bhandupuran Prakashan, Kathmandu
Pant, P. Raj (2003), Business Environment in Nepal, Buddha Academic
Publishers and Distributors Pvt. Ltd. Kathmandu, Nepal
Paul, E. Green and Donald. S. Till; Research for Marketing Decisions.
Radhaswamy, M. and VasuDevan S.V. (1979), Text Book of Banking, S.Chand
& Company ltd., New Delhi
Rose, Peter S. (2003), Money and Capital Markets, Financial Institution and
Instruments in a Global Marketplace, Irwin, Chicago
Samuelson, Paul A. & Nordhus, William D. Economics, Sixteen edition,
Tata Mc Graw Hill Publishing Company Limited, New Delhi, P. 469
Sharma, P. K. and Chaudhary, A.K (2058), Statistical Methods, Khanal Books
Prakashan, Minbhawan, Kathmandu
Sharma, P. Kumar and Silwal D. Prasad, (2058), Text Book of Business
Mathematics and Statistics, Taleju Prakashan, Bhotahity, Katmandu
Sharpe, W.F, Alexander, G. J., Bailey, J.V. (2003), Investments, Prentice Hall
of India Private Limited, New Delhi
Shrestha, M Krishna and Bhandari D. Bahadur (2004), Financial Markets and
Institutions, Asmita Books Publishers and Distributors, Kathmandu
Shrestha, Sunity and Silwal, D. Prasad (2059), Statistical Methods in
Management, Taleju Prakashan, Bhotahity, Katmandu
Thygerson, Kennith J. (1992), Financial Institutions and Capital Markets,
Harper Collings College Publisher, New York
Vaidhya, S., Financial Market and Institutions, Taleju Prakashan, Kathmandu
Van Horne, J.C. (1998), Financial Management and Policy, Prentice Hall of
India Pvt. Ltd, New Delhi
Weston, J. F. and Copeland, J.E. (1992), Managerial Finance, The Dryden
Press, Chicago
97
Weston, J. Fred and Engene, F. Brigham, Managerial Finance, University of
California, Los Angel’s University of Florida
Wolff, H.K. and Pant, P.R. (2005), Social Science Research & Thesis Writing,
Buddha Academy & Distributors, Kathmandu, Nepal.
Thesis & Articles
Bajracharya, Rabina, (2000), Investments of Commercial Banks in Priority
Sector, Master’s Degree Thesis, shankar Dev Campus.
Bhattarai, Ramala, (1978), Lending Policy o Commercial Banks in Neapl,
Master’s Degree Thesis, Patan Multiple Campus, Lalitpur.
Lamichhane, Mukunda Prasad, (2000), Investment Policy of the Joint Venture
Banks in Nepal, Master’s Degree Thesis, Central Department of
Management, T.U.
Pandit, Kul Chandra, (2003), A Study on Investment Policy, Analysis of
Standard Chartered Bank Nepal Limited in comparison to Nabil and
Nepal Bangaladesh Bank, Master’s Degree Thesis, Shankar Dev
Campus.
Poudel, Kishor, (2002), Liquidity & Investment Position of Joint Venture
Commercial Bank in Nepal, Master’s Degree Thesis, Shankar Dev
Campus.
Pradhan, Radhe Shyam, (2003), Role of Saving, Investment & Capital
Formation in Economic Development, A case of Nepal, Master’s Degree
Thesis, Central Department of Management, T.U.
Shrestha, Dr. Sunity, (1993), Investment Planning of Commercial Banks in
Nepal, Phd Dessertation, University of Delhi.
Thapa, Dr. Gobinda Bahadur, (1994), Financial System of Nepal, Development
Divison, Patan Multiple Campus, Lalitpur, Vol.3.
Wagle, Sharad, (2000), A Study on Trends of Savings, Investment and Capital
Formation in Nepal, Master’s Degree Thesis, Central Department of
Management, T.U.

98
Websites
www.everestbankltd.com www.kumaribank.com
www.nepalstock.com
www.nrb.org www.sebon.com

99
APPENDIX- I
Current Ratio
FY KBL EBL
Current Assets Current Liabilities Ratio Current Assets Current Liabilities
2059/60 2,758.23 2625.14 1.05 7887.99 7439.38
2060/61 5,055.13 4960.77 1.02 9420.97 8928.25
2061/62 7284.62 6792.44 1.07 11629.42 10722.51
2062/63 8634.12 8139.55 1.06 15147.86 14581.81
2063/64 11346.04 10770.39 1.05 20902.79 19847.63
Mean 1.05
S.D. 0.02
APPENDIX- II
Cash & Bank Balance to total Deposit Ratio
FY KBL EBL
Cash & Bank Balance Total Deposit Ratio Cash & Bank Balance Total Deposit
2059/60 291.71 2513.14 0.12 1139.57 6694.96
2060/61 685.48 4807.94 0.14 631.8 8063.9
2061/62 443.37 6268.95 0.07 1049.99 10097.69
2062/63 344.96 7768.96 0.04 1398.86 13802.44
2063/64 574.46 10557.42 0.05 1713.19 18186.25
Mean 0.09
S.D. 0.04
APPENDIX- III
Cash & Bank Balance to Current Assets Ratio
FY KBL EBL
cash & Bank Balance Current Assets Ratio cash & Bank Balance Current Assets
2059/60 291.71 2,758.23 0.11 1139.57 7887.99
2060/61 685.48 5,055.13 0.14 631.8 9420.97
2061/62 443.37 7284.62 0.06 1049.99 11629.42
2062/63 344.96 8634.12 0.04 1398.86 15147.86
2063/64 574.46 11346.04 0.05 1713.19 20902.79
Mean 0.08
S.D. 0.04
APPENDIX- IV
Invest. On Govt. securities to Current assets Ratio
FY KBL EBL
Invest. On Govt. Securities Current Assets Ratio
Invest. On Govt. Securities Current Assets
2059/60 235.63 2,758.23 0.09 1599.35 7887.99
2060/61 601.61 5,055.13 0.12 2466.43 9420.97

100
2061/62 1119.99 7284.62 0.15 2100.29 11629.42
2062/63 1114.32 8634.12 0.13 3548.62 15147.86
2063/64 1297.87 11346.04 0.11 4704.63 20902.79
Mean 0.12
S.D. 0.02
APPENDIX- V
Loans & Advances to total deposit ratio
FY KBL EBL
Loans & Advances Total Deposit Ratio
Loans & Advances Total Deposit
2059/60 2,105.74 2513.14 0.84 4908.46 6694.96
2060/61 3,649.01 4807.94 0.76 5884.12 8063.9
2061/62 5590.93 6268.95 0.89 7618.67 10097.69
2062/63 6891.86 7768.96 0.89 9801.31 13802.44
2063/64 8929.01 10557.42 0.85 13664.08 18186.25
Mean 0.84
S.D. 0.05
APPENDIX- VI
Total Investment to total Deposit Ratio
FY KBL EBL
Total Investment Total Deposit Ratio
Total Investment Total Deposit
2059/60 423.15 2513.14 0.17 1653.98 6694.96
2060/61 983.5 4807.94 0.2 2535.66 8063.9
2061/62 1190.27 6268.95 0.19 2128.93 10097.69
2062/63 1394.95 7768.96 0.18 4200.52 13802.44
2063/64 1678.42 10557.42 0.16 4984.31 18186.25
Mean 0.18
S.D. 0.02
APPENDIX- VII
Loans & Advances to Total Working Fund Ratio
FY KBL EBL
Loans & Working Ratio Loans & Working Fund

101
Advances Fund Advances
2059/60 2,105.74 2,986.18 0.71 4908.46 8052.21
2060/61 3,649.01 5,494.18 0.66 5884.12 9608.57
2061/62 5590.93 7437.88 0.75 7618.67 11732.52
2062/63 6891.86 9010.28 0.76 9801.31 15959.28
2063/64 8929.01 11918.31 0.75 13664.08 21432.57
Mean 0.73
S.D. 0.04
Table 4
Profitability Ratios
(SOURCE: APPENDIX XV - XXVI)
FY KBL EBL
1 2 3 4 5 6 7 8 9 10 11 12 1 2 3 4 5 6 7 8 9 10 11 12
2059/60 0.920 0.070 0.570 0.060 0.030 1.250 0.070 0.030 - 0.030 5.560 0.040 0.820 0.080 0.700 0.060 0.040 1.450 0.080 0.020 0.010 0.150 29.900 0.040
2060/61 0.900 0.070 0.660 0.060 0.030 1.380 0.060 1.010 0.010 0.090 9.740 0.040 0.840 0.080 0.670 0.070 0.030 1.670 0.080 0.020 0.010 0.210 45.600 0.060
2061/62 0.920 0.070 0.680 0.070 0.030 1.530 0.070 0.112 0.010 0.140 17.600 0.050 0.840 0.070 0.610 0.060 0.030 1.760 0.070 0.020 0.010 0.220 54.200 0.060
2062/63 0.650 0.070 0.690 0.070 0.040 1.930 0.100 0.020 0.010 0.120 16.600 0.040 0.580 0.060 0.650 0.060 0.030 2.550 0.100 0.020 0.010 0.250 62.800 0.050
2063/64 0.630 0.070 0.690 0.070 0.030 2.190 0.110 0.020 0.010 0.170 22.700 0.010 0.580 0.060 0.660 0.050 0.020 2.540 0.090 0.020 0.010 0.250 78.400 0.050
Mean 0.804 0.070 0.658 0.066 0.032 1.656 0.082 0.238 0.010 0.110 14.440 0.036 0.732 0.070 0.658 0.060 0.030 1.994 0.084 0.020 0.010 0.216 54.180 0.052
S.D. 0.150 0.000 0.051 0.005 0.004 0.393 0.022 0.433 0.000 0.053 6.779 0.015 0.139 0.010 0.033 0.007 0.007 0.515 0.011 0.000 0.000 0.041 18.194 0.008


