Business Analysis All shook Up
Karin Lehmann Sonia Chaker
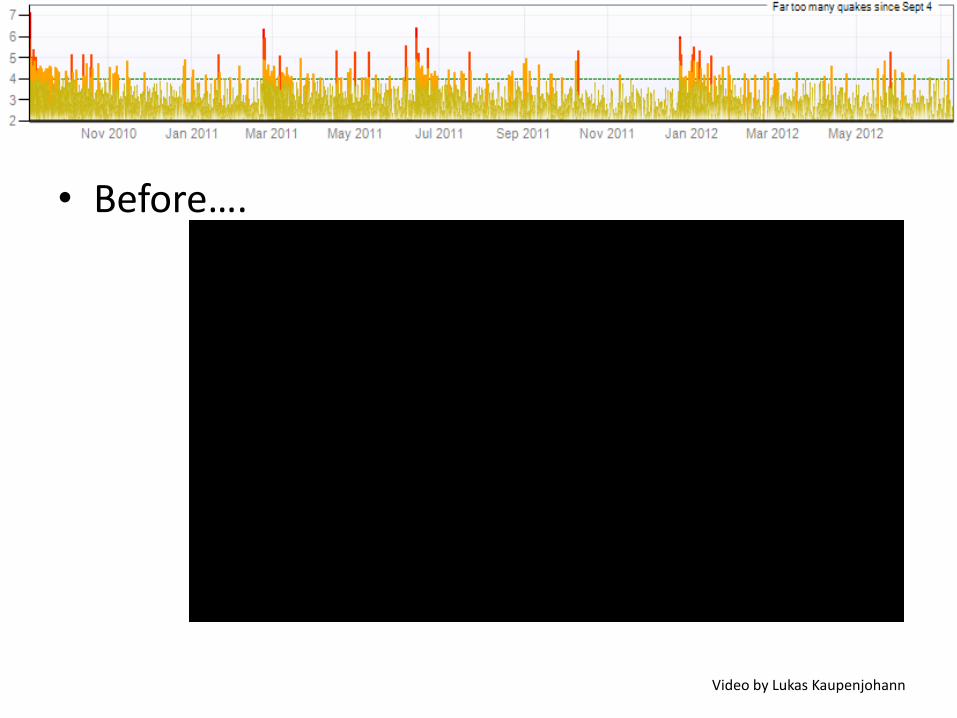
• Before….
Video by Lukas Kaupenjohann
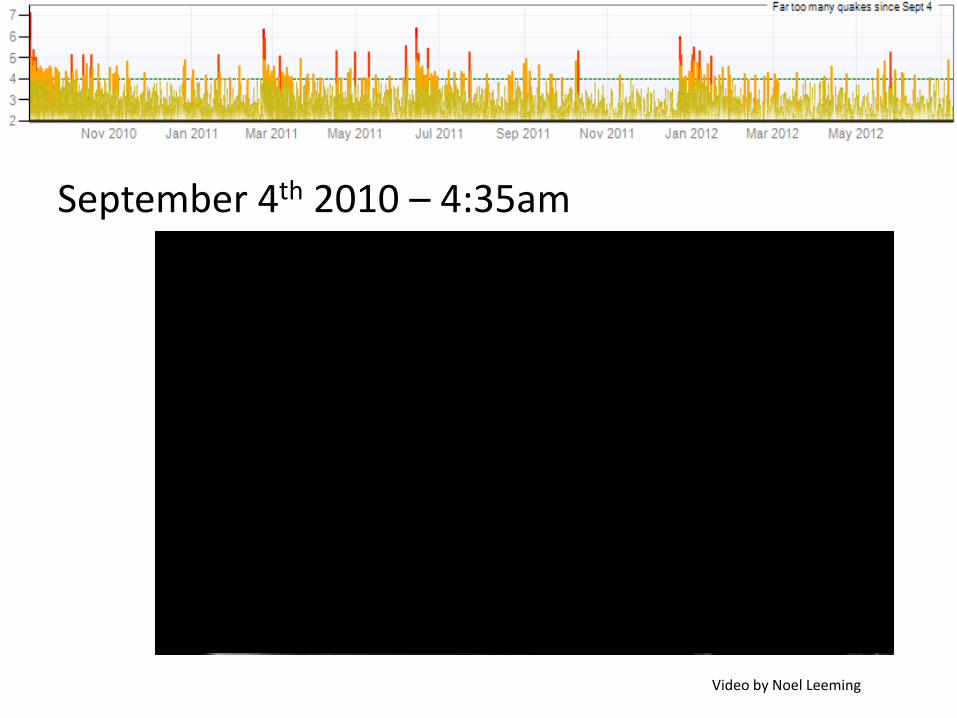
September 4th 2010 – 4:35am
Video by Noel Leeming


Canterbury
Earthquake
Recovery
Authority
FILE :
DRAFTING CHECKED
DRAWN
APPROVED
FIG. No. REV. PROJECT No.
APPROX. SCALE (AT A3 SIZE)
CERA CANTERBURY EARTHQUAKE RECOVERY
Land Damage Map
NTS
0
.
Notes: Low-resolution aerial photos sourced from Google Earth (Copyright: 2009). High-resolution aerials provided by New Zealand Aerial Mapping (February 2011) Property boundaries provided by Christchurch City Council
Land Damage After 4 September 2010
!
Approx Scale 1:50,000 0 500 1000 1500 2000 2500 (m)
Legend
Areas of observed liquefaction
Port Hills area

Canterbury
Earthquake
Recovery
Authority
FILE :
DRAFTING CHECKED
DRAWN
APPROVED
FIG. No. REV. PROJECT No.
APPROX. SCALE (AT A3 SIZE)
CERA CANTERBURY EARTHQUAKE RECOVERY
Aggregated Building Damage Map
Building Damage After 4 September 2010 NTS
0
.
Notes: Low-resolution aerial photos sourced from Google Earth (Copyright: 2009). High-resolution aerials provided by New Zealand Aerial Mapping (February 2011) Property boundaries provided by Christchurch City Council Building damage based on data provided by AMI, Ansvar, EQC, FMG, Housing New Zealand, IAG, Lumley, MAS, Tower and Vero
!
Approx Scale 1:50,000 0 500 1000 1500 2000 2500 (m)
Legend
Repairs > $100k (houses which had significant damage but could be economically repaired
Rebuilds (houses which are beyond economic repair)
Legend
Repairs > $100k (houses which had significant damage but could be economically repaired
Rebuilds (houses which are beyond economic repair)
Confirmed rebuilds (houses which were confirmed to be beyond economic repair)

Christchurch City Council (CCC) set up the Infrastructure Rebuild Management Office (IRMO) to fix “Horizontal Infrastructure”:
• Roads
• Waste Water Systems
• Fresh Water Systems
• Storm Water Systems


February 22nd 2011 – 12:51pm
Material sourced from the Ministry of Civil Defence and Emergency Management(MCDEM) Christchurch Earthquake Footage which is licensed by MCDEM for re-use under the Creative Commons Attribution 3.0 New Zealand Licence.

Canterbury
Earthquake
Recovery
Authority
FILE :
DRAFTING CHECKED
DRAWN
APPROVED
FIG. No. REV. PROJECT No.
APPROX. SCALE (AT A3 SIZE)
CERA CANTERBURY EARTHQUAKE RECOVERY
Land Damage Map
NTS
0
.
Notes: Low-resolution aerial photos sourced from Google Earth (Copyright: 2009). High-resolution aerials provided by New Zealand Aerial Mapping (February 2011) Property boundaries provided by Christchurch City Council
Land Damage After 4 September 2010
!
Approx Scale 1:50,000 0 500 1000 1500 2000 2500 (m)
Legend
Areas of observed liquefaction
Port Hills area
Canterbury
Earthquake
Recovery
Authority
FILE :
DRAFTING CHECKED
DRAWN
APPROVED
FIG. No. REV. PROJECT No.
APPROX. SCALE (AT A3 SIZE)
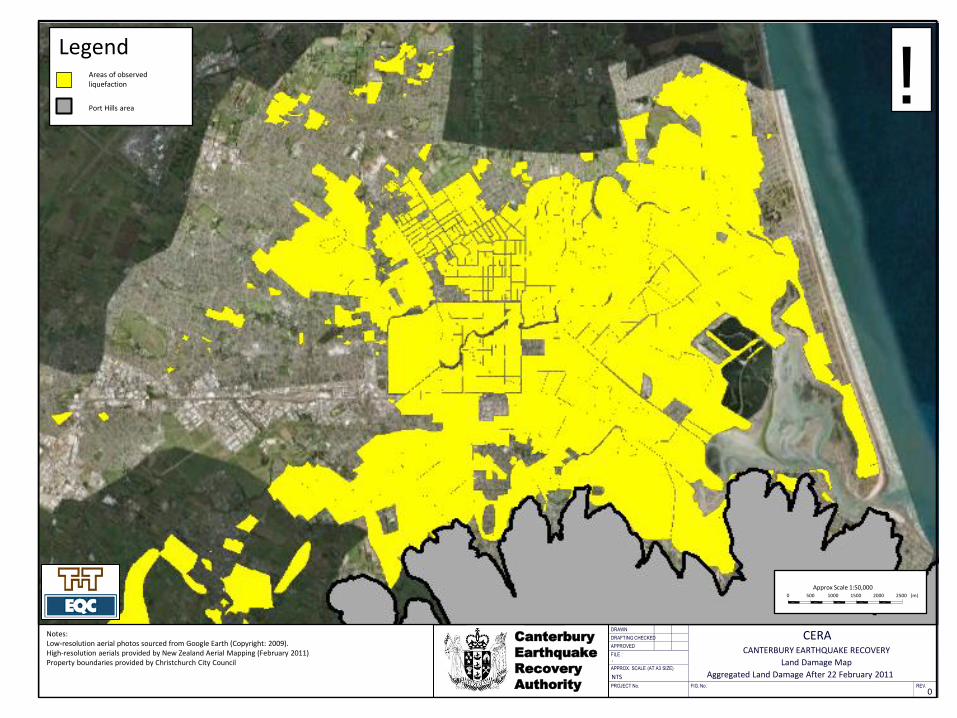
CERA CANTERBURY EARTHQUAKE RECOVERY
Land Damage Map
Aggregated Land Damage After 22 February 2011 NTS
0
.
Notes: Low-resolution aerial photos sourced from Google Earth (Copyright: 2009). High-resolution aerials provided by New Zealand Aerial Mapping (February 2011) Property boundaries provided by Christchurch City Council
!
Approx Scale 1:50,000 0 500 1000 1500 2000 2500 (m)
Legend
Areas of observed liquefaction
Port Hills area

Canterbury
Earthquake
Recovery
Authority
FILE :
DRAFTING CHECKED
DRAWN
APPROVED
FIG. No. REV. PROJECT No.
APPROX. SCALE (AT A3 SIZE)
CERA CANTERBURY EARTHQUAKE RECOVERY
Aggregated Building Damage Map
Building Damage After 4 September 2010 NTS
0
.
Notes: Low-resolution aerial photos sourced from Google Earth (Copyright: 2009). High-resolution aerials provided by New Zealand Aerial Mapping (February 2011) Property boundaries provided by Christchurch City Council Building damage based on data provided by AMI, Ansvar, EQC, FMG, Housing New Zealand, IAG, Lumley, MAS, Tower and Vero
!
Approx Scale 1:50,000 0 500 1000 1500 2000 2500 (m)
Legend
Repairs > $100k (houses which had significant damage but could be economically repaired
Rebuilds (houses which are beyond economic repair)
Legend
Repairs > $100k (houses which had significant damage but could be economically repaired
Rebuilds (houses which are beyond economic repair)
Confirmed rebuilds (houses which were confirmed to be beyond economic repair)

Canterbury
Earthquake
Recovery
Authority
FILE :
DRAFTING CHECKED
DRAWN
APPROVED
FIG. No. REV. PROJECT No.
APPROX. SCALE (AT A3 SIZE)
CERA CANTERBURY EARTHQUAKE RECOVERY
Aggregated Building Damage After 22 February 2011 NTS
0
.
Notes: Low-resolution aerial photos sourced from Google Earth (Copyright: 2009). High-resolution aerials provided by New Zealand Aerial Mapping (February 2011) Property boundaries provided by Christchurch City Council Building damage based on data provided by AMI, Ansvar, EQC, FMG, Housing New Zealand, IAG, Lumley, MAS, Tower and Vero
!
Approx Scale 1:50,000 0 500 1000 1500 2000 2500 (m)
Aggregated Building Damage Map
Legend
Building Damage Ratio (Repair cost estimate / replacement cost)
0% - 20%
20% - 40%
40% - 60%
60% - 80%
80% - 100%
100% (rebuild because it is uneconomic to repair the building)
Legend
Building Damage Ratio (Repair cost estimate / replacement cost)
0% - 20%
20% - 40%
40% - 60%
60% - 80%
80% - 100%
100% (rebuild because it is uneconomic to repair the building)
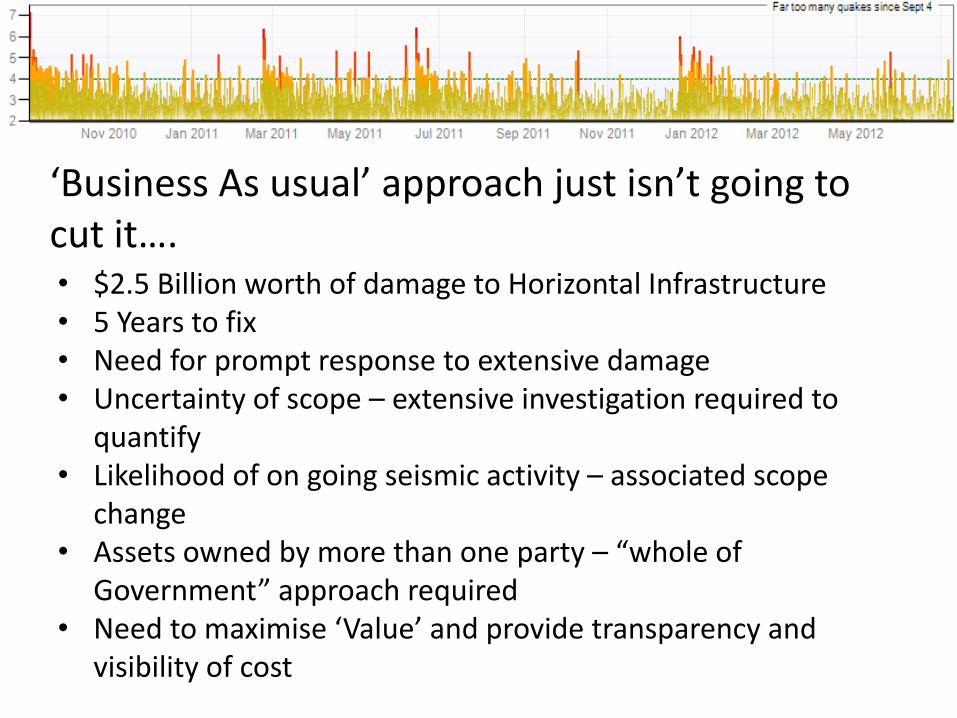
‘Business As usual’ approach just isn’t going to cut it…. • $2.5 Billion worth of damage to Horizontal Infrastructure • 5 Years to fix • Need for prompt response to extensive damage • Uncertainty of scope – extensive investigation required to
quantify • Likelihood of on going seismic activity – associated scope
change • Assets owned by more than one party – “whole of
Government” approach required • Need to maximise ‘Value’ and provide transparency and
visibility of cost

• Create a purpose built organisation to deliver infrastructure
• An alliance of public and private organisations • A $500 million a year business over 5 years
Solution:
Define the Solution
Establish the Architecture
Implement Operationalise
(Deliver results!)

Delivery Teams
Integrated Services Team (IAT)
Mgt Team
People of Christchurch and New Zealand
Board
City Care Downer Fletchers Fulton Hogan McConnell Dowell
Consultants
Design
CCC

Collaboration Competition
So what’s so different about SCIRT?
Clear common Vision Clear measureable KRAs/KPIs which drive the required behaviours
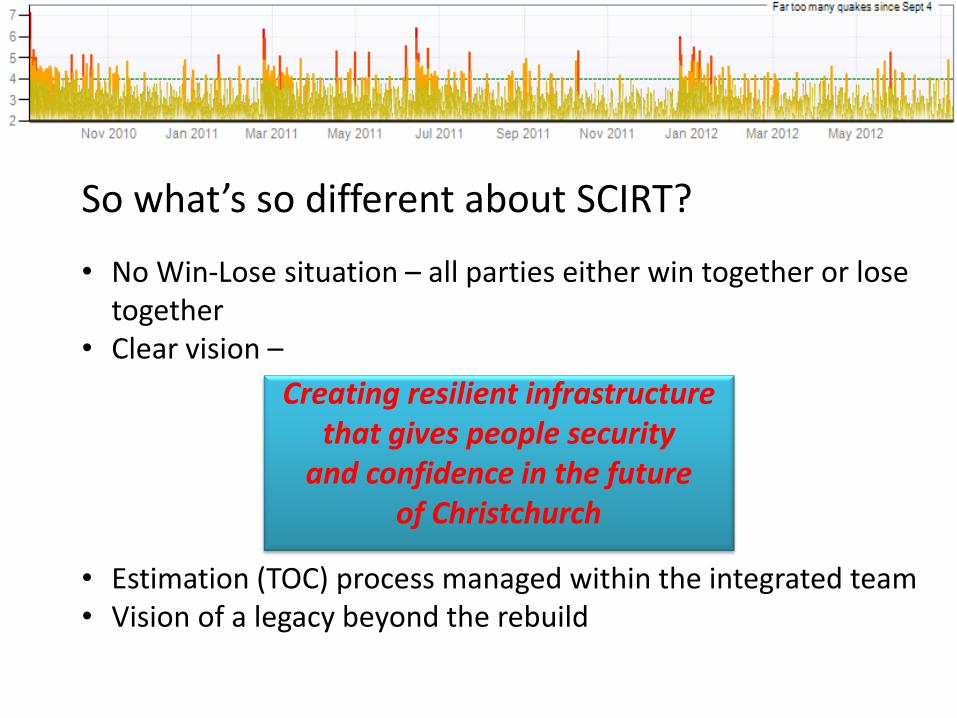
So what’s so different about SCIRT?
• No Win-Lose situation – all parties either win together or lose together
• Clear vision –
• Estimation (TOC) process managed within the integrated team • Vision of a legacy beyond the rebuild
Creating resilient infrastructure that gives people security
and confidence in the future of Christchurch


Timeline…. March 2011 – Alliance concept conceived 6 weeks later (4th May 2011) – Stronger Christchurch Infrastructure Rebuild Team (SCIRT) formed and contract signed 9th May – 1st SCIRT employee (Duncan Gibb – General Manager) 4th July – Temporary site (15 people to 60 People) 31st August 2011 – Transition of IRMO to SCIRT July to October - Office Build (move in 9th October) End of October – 245 people fully productive in new office

EQ
Alliance contract Temporary office
245 personnel in new office
First teams move to new office
Process Analysis work

From This: To This:
To This:
In 12 Weeks!!!


Define the Solution
Establish the Architecture
Implement
Operationalise (Deliver results!)
Commercial Agreement Drivers, Values, Mindsets, Behaviours
BAs!
Organisational structure Programme of projects – define lifecycle Systems
Enable to ability to deliver results
Projects being delivered
Define the Solution
Establish the Architecture
Implement Operationalise
(Deliver results!)

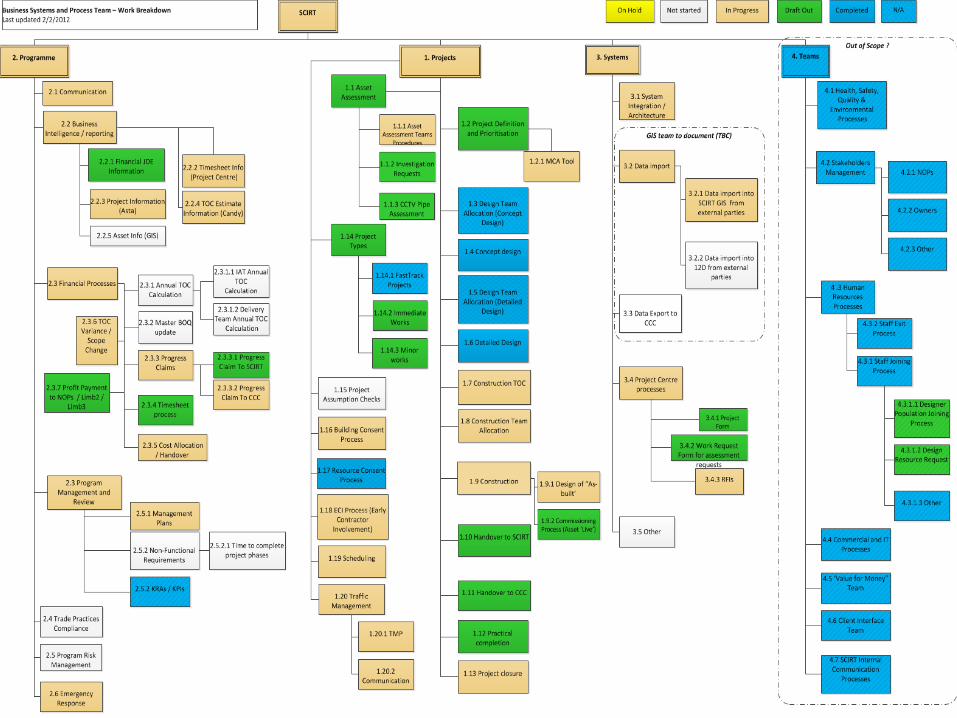
Processes and Systems

The Challenge: •Timeframes! •Develop Processes & Systems WHILE work being carried out •26 different organisations come together:
• Different cultures • Different language • Different processes & systems
•Create and document all processes – 2 BAs, 4 months •Visibility •‘Extreme Agile’ – changing environment and priorities •Aftershocks!

Project Definition
Concept
Detailed Design
Construction
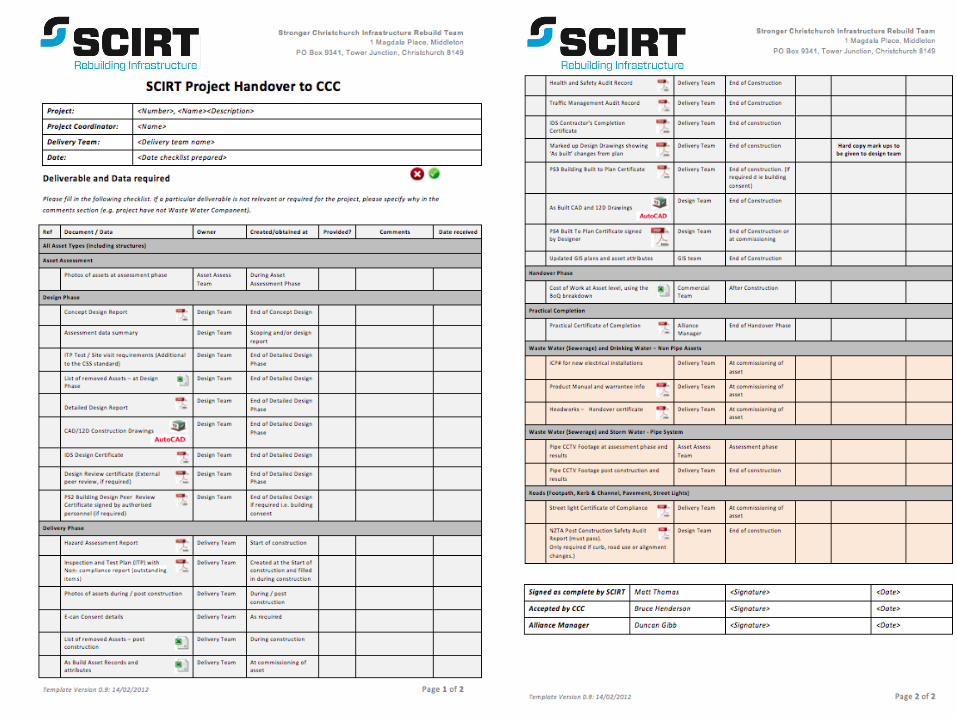
Handover
Strategy and Asset Assessment
Project Life Cycle • Create certainty in changing context

Project Definition Project Definition Manager
Professional Services Manager
CCC, NZTA, Delivery Team
Alliance Manager
Project Allocation Design
Business Systems Manager
Commercial Manager
Professional, Services, VFM
Alliance Manager
Concept Design Design Manager Professional Services Manager
Asset Owner, ECI Delivery Manager
Detailed Design Design Manager Professional Services Manager
ECI
TOC Estimating Manager Commercial Manager
VFM, ECI Alliance Manager Delivery Manager
Project Allocation Construction
Business Systems Manager
Commercial Manager
VFM, Delivery Managers
Alliance Manager
Construction Project Co-ordinator Delivery Manager Commercial Team, VFM
Handover Business Systems Manager
Commercial Manager
CCC CCC
Practical Completion Alliance Manager Alliance Leadership Team
CCC
Project Completion Alliance Manager Alliance Leadership Team
CCC
Phase Responsible Accountable Consulted Informed Gateway
1
2
6
3
4
5
0
7
8
9

Some efficiency achievements….
Project lifecycle – from concept to physical works – Most construction projects = 2-3 years SCIRT = 6-7 months Annual revenue of $450 Million - month end processing carried out by 3 people in 3 days Monthly board reports – done in a day…. Productive teams hitting the ground running from day 1 $40 Million a month of Design work pumped out
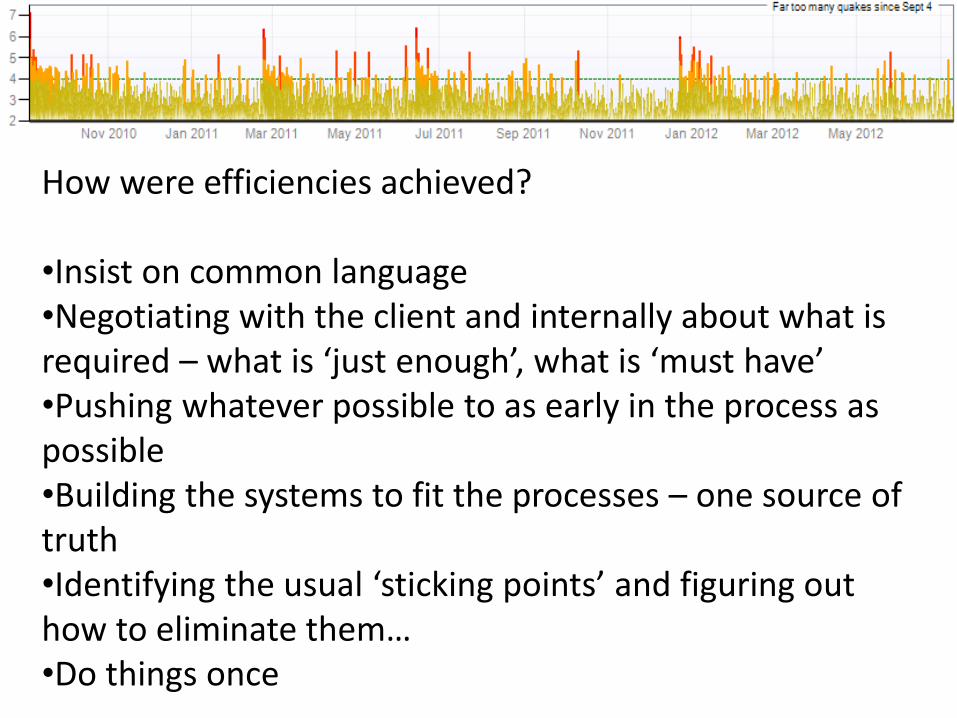
How were efficiencies achieved? •Insist on common language •Negotiating with the client and internally about what is required – what is ‘just enough’, what is ‘must have’ •Pushing whatever possible to as early in the process as possible •Building the systems to fit the processes – one source of truth •Identifying the usual ‘sticking points’ and figuring out how to eliminate them… •Do things once

How were efficiencies achieved?

The vision – Lived and measured

BA Mandate: • Design and document all the processes • Gather the system integration requirements • Business Intelligence tool configuration and reporting
requirements • Process Training

Techniques

The Enterprise BA: BABOK =
Or for us…..


What we did…

BA value proposition…
Change – Transformational rather than incremental
A storm is an opportunity for a rainbow…
PASSION


