BURGAN CAPE TERMINALS (PTY) LTD
Revised NERSA Tariff Application
Date: 17 July 2017

Contents
1 Introduction .......................................................................................................................................... 1
2 Background ........................................................................................................................................... 1
2.1 Summary of project ...................................................................................................................... 1
2.2 Business model ............................................................................................................................. 2
2.3 Value to the economy ................................................................................................................... 3
2.4 Purpose of this tariff application .................................................................................................. 4
3 The Facility ............................................................................................................................................ 4
Loading facility ...................................................................................................................... 4
Storage facility and auxiliary equipment .............................................................................. 5
Pipeline ................................................................................................................................. 5
4 Tariff methodology ............................................................................................................................... 5
4.1 Imposing a regulated tariff in a competitive environment ........................................................... 5
4.2 Tariff methodology per facility ..................................................................................................... 6
Loading and storage facilities ............................................................................................... 6
Pipeline ................................................................................................................................. 7
4.3 Useful life ...................................................................................................................................... 7
5 The Project Costs .................................................................................................................................. 7
5.1 Capital expenditure ...................................................................................................................... 7
5.2 Operating costs ............................................................................................................................. 8
5.3 Decommissioning costs ................................................................................................................. 9
5.4 Working capital ............................................................................................................................. 9
5.5 Tax .............................................................................................................................................. 10
IOC tax calculation .............................................................................................................. 10
Rate of Return tax calculation ............................................................................................ 10
5.6 Cost schedule per facility ............................................................................................................ 11
Loading facility .................................................................................................................... 11
Storage facility .................................................................................................................... 12
Pipeline ............................................................................................................................... 13
6 Regulatory Asset Base and the calculation of Trended Original Cost (TOC) ....................................... 14
6.1 Loading facility ............................................................................................................................ 14
6.2 Storage facility ............................................................................................................................ 15
6.3 Pipeline ....................................................................................................................................... 15
7 Discount Rate ...................................................................................................................................... 17
7.1 Cost of equity .............................................................................................................................. 17
Risk free rate....................................................................................................................... 18
Market risk premium .......................................................................................................... 18
Beta .................................................................................................................................... 18

Small stock premium .......................................................................................................... 18
Project specific risk ............................................................................................................. 19
Liquidity risk ....................................................................................................................... 20
Calculation of Ke ................................................................................................................. 20
7.2 Gearing and cost of debt ............................................................................................................ 22
7.3 Weighted Average Cost of Capital (WACC) ................................................................................. 22
8 Volume forecast .................................................................................................................................. 23
8.1 Total volumes ............................................................................................................................. 23
9 Tariff calculation ................................................................................................................................. 24
9.1 Loading facility tariff calculation ................................................................................................. 24
Levelised IOC tariff calculation for the loading facility ....................................................... 24
9.2 Storage facility tariff ................................................................................................................... 26
Levelised IOC tariff calculation for the storage facility ....................................................... 26
9.3 Pipeline tariff .............................................................................................................................. 28
Rate of Return tariff calculation for the pipeline ................................................................ 28
10 Conclusion and request for Approval and Setting of Tariffs ........................................................... 29
10.1 Request for approval of the tariff for loading ............................................................................. 29
10.2 Request for approval of the tariff for storage ............................................................................ 30
10.3 Request for setting of the pipeline tariff .................................................................................... 30
11 Appendix A ...................................................................................................................................... 31
11.1 Economic Indicators .................................................................................................................... 31
11.2 Capital Expenditure and allocation per facility ........................................................................... 32

Figures
Figure 1 Location of facility at the Eastern Mole site in the Port of Cape Town ........................................... 2
Figure 2 Layout of the facility........................................................................................................................ 3
Figure 3: Tariff path comparison for the loading facility ............................................................................. 26
Figure 4: Tariff path comparison for the storage facility ............................................................................ 27
Figure 5: Tariff path and expected throughput for the pipeline ................................................................. 29

Tables
Table 1: Capex for the loading facility (R’m) ............................................................................................... 11
Table 2: Operating costs including decommissioning for the loading facility (R’m) ................................... 11
Table 3: Working capital for the loading facility (R’m) ................................................................................ 11
Table 4: Tax calculation for the loading facility (R’m) ................................................................................. 12
Table 5: Capex for the storage facility (R’m) ............................................................................................... 12
Table 6: Operating costs including decommissioning for the storage facility (R’m) ................................... 12
Table 7: Working capital for the storage facility (R’m) ............................................................................... 12
Table 8: Tax calculation for the storage facility (R’m) ................................................................................. 13
Table 9: Capex for the pipeline (R’m) ......................................................................................................... 13
Table 10: Operating costs including decommissioning for the pipeline (R’m) ............................................ 13
Table 11: Working capital for the pipeline (R’m) ........................................................................................ 13
Table 12: Tax calculation for the pipeline ................................................................................................... 14
Table 13: Asset table for the loading facility (R’m) ..................................................................................... 14
Table 14: Asset table for the storage facility (R’m) ..................................................................................... 15
Table 15: Asset table for the pipeline (R’m) ............................................................................................... 16
Table 16: Small stock premium (PWC Valuation Methodology Survey 2014/15) ....................................... 18
Table 17: Risk assessment of the Burgan project ....................................................................................... 20
Table 18: Cost of equity (Ke) for the loading and the storage facility (IOC) ............................................... 21
Table 19: Cost of equity (Ke) for the pipeline (ROR) ................................................................................... 21
Table 20: Weighted Average Cost of Capital (WACC) for the loading and storage facility ......................... 22
Table 21: Weighted Average Cost of Capital (WACC) for the pipeline ....................................................... 22
Table 22: Throughput capacity for Burgan terminal ................................................................................... 23
Table 23: Volume forecast (million litres) ................................................................................................... 24
Table 24: Allowable revenue for the loading facility using the IOC method (R’m) ..................................... 25
Table 25: Levelised IOC tariff calculation for the loading facility ................................................................ 25
Table 26: Levelised IOC tariff and revenue for the loading facility ............................................................. 26
Table 27: Allowable revenue for the storage facility using the IOC method (R’m) ..................................... 26
Table 28: Levelised IOC tariff calculation for the storage facility ................................................................ 27
Table 29: Levelised IOC tariff and revenue for the storage facility ............................................................. 28
Table 30: Allowable revenue for the pipeline using the rate-of-return tariff method (R’m) ..................... 28
Table 31 Tariff for the pipeline using the rate-of-return method ............................................................... 29
Table 32: Macroeconomic indicators .......................................................................................................... 31
1
1 Introduction
In this tariff application document1 we discuss the three tariffs required by Burgan Cape Terminals. The
tariffs are for a loading facility, a storage facility and a pipeline. For the storage and the loading facility
we have made the case for NERSA to approve a multi-year tariff for the period FY172 to FY19, based on
the levelised NERSA IOC methodology for loading and storage facilities. The loading and storage tariffs
for FY17 and beyond are based on a reference base value combined with an inflationary escalation
mechanism. The reference base value is calculated for FY17. Burgan Cape Terminals requests NERSA to
approve a maximum base value of 1.47 cents/litre for the loading facility for FY17. This tariff must be
escalated with inflation to obtain the maximum tariff that will apply for subsequent years during the
period for which the approval is sought: FY17 to FY19. Burgan Cape Terminals similarly requests NERSA
to approve a maximum base value of 23.01 cents/litre for the storage facility for FY17. This tariff must
also be escalated with inflation to obtain the tariff that will apply for subsequent years during the period
for which the approval is sought: FY17 to FY19. For the interconnecting pipeline we have made the case
for NERSA to set a multi-year tariff starting from FY17 to FY19, based on the NERSA ROR methodology
for pipelines. Burgan Cape Terminals requests NERSA to set the pipeline tariff for the period as set out in
Table 31 below.
2 Background
2.1 Summary of project
Burgan Cape Terminals (Pty) Ltd is a black empowered and independent South African oil storage
company. Its shareholders are Thebe Investment Corporation (15%) with experience in the downstream
petroleum market, Jicaro (15%) a newly established 100% black owned BBBEE company and VTTI B.V.
(70%) a global terminal owner that operates in 5 continents with more than 8 million m3 of oil storage
and LPG capacity.
After being identified as the most suitable bidder, Burgan Cape Terminals was awarded a 20-year
contract by TNPA3 to develop and manage fuel storage and distribution facilities at the Eastern Mole of
Cape Town Harbour. The Burgan project is supportive of national polices and plans related to security of
supply, the maintenance of strategic stocks, infrastructure needs, spatial and capacity planning at the
1 This tariff application incorporates revisions to the original application in order to address concerns raised by NERSA during the application process. More accurate cost information is now available than at the time of the initial application and this updated information has been included in the tariff calculation.
2 Burgan’s financial years coincide with calendar years thus FY17 is the period from 1 January 2017 to 31 December 2017.
3 Transnet National Ports Authority

2
Port of Cape Town and the facilitation of greater competition. The importance of the Burgan project has
resulted in Government including it as a strategic project under Operation Phakisa – a government
initiative to unlock the potential of South Africa’s oceans in growing the economy and creating jobs. This
Greenfield project was officially launched in November 2015 by the Dutch Minister of Agriculture and
State Secretary of Economic Affairs, Martijn van Dam and the South African Director-General of the
Department of Trade and Industry (DTI), Lionel October.
The location of the facility is shown in Figure 1.
Figure 1 Location of facility at the Eastern Mole site in the Port of Cape Town
2.2 Business model
Burgan Cape Terminals will provide a multi-purpose fuel storage facility used for the distribution of both
locally produced and imported fuels. The storage of refined petroleum products will be received either
by sea with the loading facilities in Eastern Mole Berth 2 or piped from the Chevron refinery in
Milnerton (Cape Town). Tanker vessels will decant at Eastern Mole Berth 2 using the Burgan marine
loading arms. Locally produced product may also be pumped from the Chevron Oil Refinery to the
Burgan storage facility. The Burgan pipeline will connect the existing Chevron refined product pipeline
to the Burgan storage facility. Product will be dispatched from the Burgan facility via the road loading
gantry. Burgan’s state of the art truck loading facility will allow for an efficient and swift distribution to
end-users with limited impact on the surroundings. Customers will pay Burgan a fee for the use of these
facilities based on throughput of product.
The layout of the facility is shown in Figure 2. The terminal is capable of performing the following
operations:
• Jetty operations
o vessel import

3
• Storage facilities
o diesel storage (Diesel 500ppm and 50ppm with separate biodiesel system) o petrol storage (ULP with ethanol blending) o truck loading facility o Additive blending facility
• Pipeline connections
o pipeline import from Chevron refinery
Figure 2 Layout of the facility
2.3 Value to the economy
Ports are considered an integral part of the petroleum industry’s logistical value chain. However, the
increased demand for imports has put additional strains on Cape Town harbour. This will be amplified in
the future as there is a rapidly growing demand for cleaner fuels in the South African market.
Infrastructure to handle additional imports will therefore be critical. This project will result in increased
fuel storage infrastructure and allow for fuel importation thereby increasing the security of supply to the
Western Cape. The project will also help with improving the fuel distribution capacity in the Western
Cape. There have been cases of long queues and congestion at the current road loading gantries. Last
but not least is that the Burgan facility is an independent facility. i.e. it does not belong to a marketer.
This means any company with a market in Cape Town will be able to import and distribute product. The
facility will therefore enable the entrance of new players thus improving competition. The Burgan
project is compatible with and supportive of key policies and plans that include: The Liquid Fuels Energy
Security Master Plan (2007), The Port of Cape Town Port Development Plan (2013), The Draft Strategic
Stocks Petroleum Policy (2013), The National Development Plan (2012), Competition policy with respect
to the petroleum industry and The Review of Fuel Specifications and Standards (2011). Government has
included Burgan Cape Terminals as a strategic project under Operation Phakisa.
In addition, the Burgan facility will have a positive impact on security of supply in Cape Town and the
Western Cape in the following unplanned circumstances:

4
A harbour incident involving a vessel at either of the existing bulk liquid berths.
A refinery incident (fire, critical equipment failure, industrial action) which causes an
unplanned outage or slowdown of more than 6 weeks.
Damage to or failure of Chevron’s 13km white oil pipeline linking the refinery to the
harbour.
An urgent demand by Eskom for diesel as a result of county wide power shortages
The facility will also enable the following benefits to be achieved:
Making imported diesel50 available to all motorists whose vehicles require these grades and
bridging the supply gap due to the likely delay in meeting the target date of July 2017 for
refineries to upgrade to produce these fuels.
Provide storage for Clean Fuel strategic stock holding requirements4.
2.4 Purpose of this tariff application
On 9 December 2014, the Energy Regulator issued a combined licence (PPL.sf.lf.F3/174/2014) to Burgan
Cape Terminals for the operation of a petroleum storage facility, a petroleum loading facility and a
petroleum pipeline. This tariff application is submitted to NERSA in order to comply with license
condition 16 of the operating license.
In this tariff application Burgan requests NERSA to:
Approve the tariff for the Loading facility
Approve the tariff for the Storage facility
Set the tariff for the Pipeline
3 The Facility
The facility comprises marine loading arms, transfer pipes to a storage tank farm, a storage tank farm,
transfer pipes to the road loading gantry, a road loading gantry and a pipeline connecting the storage
facility to the Chevron refined product pipeline. The set of infrastructure to be built and operated is set
out in more detail in the combined licence construction application and the combined licence operation
application. In summary the separate facilities consist of the following:
Loading facility
The loading facility will be mounted on the Eastern Mole Berth 2. The loading facility consists of two 12
inch diameter marine loading arms that are capable of 1 250m3 per hour for each arm and two auxiliary
16 inch diameter (approximately 156 meter long) bidirectional pipelines. The pipelines run between the
4 The Draft Strategic Stocks Petroleum Policy, DOE (2013). The policy identifies the age of the refineries as a strategic concern that may severely disrupt supply of refined product. The draft policy recommends that petroleum manufacturers hold 14 days of refined product stocks relative to their respective market shares.

5
loading arms on Eastern Mole Berth 2 and the storage facility. The facility will therefore be capable of
loading and offloading tanker vessels.
Storage facility and auxiliary equipment
The storage facility will be located on the Eastern Mole. The storage facility will consist of 12 storage
tanks with a combined maximum storage capacity of approximately 118 670 m3 and a combined
working storage capacity of approximately 109 400 m3. The storage tank area will be covered in a raft
type foundation which will be reinforced by concrete piles. The storage tanks will be surrounded by a
bund wall with a capacity of 110% of the total tank capacity for that bund area. The storage tanks will be
able to store petrol, diesel, ethanol and bio fame. The majority of the product consisting of diesel and
unleaded petrol (ULP) will be received via the Eastern Mole Berth 2 and the Chevron Oil Refinery.
Ethanol, biodiesel and other additives needed for blending will be received via road tanker. All product
will leave the storage facility by road tanker. The distribution facility will include a 5 truck loading gantry
capable of loading multiple products simultaneously. The auxiliary infrastructure includes an office
block, fire-fighting system and a drainage system.
Pipeline
The pipeline to be constructed will be a 10 inch diameter (approximately 700 meter long) bidirectional
pipeline which will run above ground connecting the storage facility to the Chevron 12 inch diameter
refined product (“white oil”) pipeline. The pipeline will run aboveground alongside the Eastern Mole
Berth service road and enter the Burgan terminal past the FFS Refiners (Pty) Ltd facility, terminating at
the Burgan import fuel manifold.
4 Tariff methodology
4.1 Imposing a regulated tariff in a competitive environment
Although subject to NERSA regulation, the storage market is an increasingly competitive environment.
The tariff that Burgan is able to charge for storage services is thus dictated less by what the regulatory
framework will allow, and entirely by what the market is prepared to pay at any given point in time. This
is a vital consideration when determining the tariff path over time that Burgan requests NERSA to
approve.
Section 28(3) of the Petroleum Pipeline Act (60 of 2003) states the following:
(3) The tariffs set or approved by the Authority must enable the licensee to -
(a) recover the investment;
(b) operate and maintain the system; and
(c) make a profit commensurate with the risk.
6
The Act requires that the tariffs that NERSA approves (in other words the tariff path over the life of the
project) “must enable” the licensee to recover the full costs of providing the service – in other words the
approved tariffs have to comply with section 28(3) of the Act and with Regulation 4(2). For tariffs to
“enable” the full recovery of costs they must be:
Cost reflective (result in tariff levels over the life of the project that are fully reflective of the
costs); and
Recoverable (result in tariff levels that are in practice recoverable in the market over the life of
the project).
In order to compete in the storage market Burgan will have to offer commercial pricing arrangements
that are competitive and similar to what customers would expect from other suppliers in the market.
The recoverability of the tariff is thus a primary consideration when choosing the appropriate
methodology for calculating the lifetime tariff trajectory for approval by NERSA. As most commercial
storage contracts are of a multi-year nature and subject to some annual inflationary clause, the
approved tariff needs to incorporate some inflationary escalation. Rate-of-return (ROR) methods as
used for the setting of petroleum pipeline tariffs and historically for storage and loading tariffs result in
tariffs that fall in real terms over the life of the project and thus are structurally inappropriate for a
market whose expectation is to contract around constant real tariffs.
Whilst in reality the market price for new storage contracts will likely fluctuate over the life of the
project subject to the cyclical vagaries of the petroleum market, the contracts will be structured with
annually escalating clauses tied to inflation. The best proxy for the market price is thus a tariff that is
constant in real terms over the life of the project that allows the recovery of sufficient revenue to satisfy
the cost-recovery and profit provisions of the Act and Regulations.
4.2 Tariff methodology per facility
Loading and storage facilities
Burgan has used the IOC tariff methodology5 comprehensive option in order to calculate the annual
allowable revenue for the loading and storage facilities. Due to the ramping of volumes at the start of
the project it is necessary to levelise these annual allowable revenues over all project volumes in order
to derive a real starting tariff and generate a tariff path that is recoverable. The starting tariff is
calculated by dividing the present value of the allowable revenues (calculated using the nominal After
Tax WACC) by the present value of the volumes over the life of the project (calculated using the real
After Tax WACC) in order to “levelise” the costs over the volumes and provide a constant real tariff. This
tariff must be indexed by inflation on an annual basis.
5 Tariff Methodology for Storage and Loading facilities Version 3, Approved 29 March 2016

7
Pipeline
The pipeline tariff is set by NERSA and Burgan has submitted all relevant information in order to
facilitate the calculation of the pipeline tariff based on the ROR method, in line with the latest NERSA
methodology for the setting of pipeline tariffs6. Burgan has calculated a proposed tariff for the pipeline
and the results of this calculation are presented in section 9.3.1.
4.3 Useful life
Burgan is bound by the contractual terms of the lease agreement signed with TNPA. As per the TNPA
lease agreement, the operational period of the terminal is defined as “a period of 20 years commencing
1 July 2017”. In addition, the TNPA lease agreement states that twelve months prior to the Handback
Date the Authority shall notify Burgan that the terminal will either be decommissioned or transferred to
the Authority (including equipment and works related to the development). Burgan is not privy to
TNPA’s future plans and intention on the use of its land beyond the end of the lease period. As such the
appropriate economic life of all the facilities is limited to the period of the lease agreement as there is
significant possibility that Burgan will need to decommission the entire site at the lease termination. In
any event, Burgan is unable to extract any revenue from the facilities beyond the termination of the
lease agreement.
The question of appropriate useful life is moot for the IOC calculation used for the loading and storage
facility tariffs, however this is an important consideration for the pipeline tariff. Burgan’s interactions
with NERSA regarding the appropriate useful life to use for tariff calculation purposes have indicated
that despite the aforementioned lease terms, NERSA would consider the physical life of the pipeline
asset when setting the tariff. Burgan’s engineering advisory has suggested that the physical life of the
pipeline is approximately 40 years before significant sustaining capex would be required to ensure a life
extension. The figure of 40 years has been used in Burgan’s calculation of the proposed tariff that NERSA
will set. We request however that should the terms of the lease agreement be enforced and that the
facility including the pipeline is due to be demolished, that the remaining asset value at that time be
depreciated to the end date of the lease.
5 The Project Costs
5.1 Capital expenditure
Capital expenditure is expected to be limited to a project development phase and a building phase,
spanning the periods from FY14 to FY17. Amounts for the second half of FY16 and later are based on
best estimates at time of application. The loading facility, storage facility and pipeline are all built as part
of the same EPC (Engineering, Procurement, and Construction) contract and thus the appropriate capex
6 Tariff methodology for the setting of pipeline tariffs in the Petroleum Pipelines industry, Version 7, Approved 29 October 2015

8
cost of each facility is based on a rational apportionment of the EPC cost between the facilities. This
apportionment has been based on a detailed assessment of the materials requirement and construction
complexity associated with each of the facilities. The Loading facility assets are demarcated by the exit
flange on each of the two 12 inch diameter pipelines linking the Marine loading arms to the storage
facility.
The pipeline asset is limited to the pipeline that connects the Chevron “white products” pipeline to the
storage facility and is bounded by the exit flange at the point where the pipeline enters the storage
facility.
5.2 Operating costs
There are no variable operating costs associated with the facilities.
The fixed operating costs for the Loading and Storage facilities consist of the following:
Direct Personnel
o Salaries / Wages o Training
Operating Expenses o Insurance o Utilities and Energy o Environment and Safety o Other Operating Expenses
Maintenance and Repairs7
Indirect Personnel Expenses o Salaries / Wages o Allowances o Training o Other Personnel Expenses
General Expenses o Travel o Consultancy and Professional Fees o Information and Communications Technology o Office costs o Property Tax
Lease I/C Cross Charge Indirect Costs
Due to the integrated nature of the operation of the loading and storage facilities it is not possible to
distinguish the operating costs easily between the facilities. Operating costs have been allocated to the
facilities based on the Capex allocation.
The pipeline is expected to incur negligible operating costs over its lifetime and this has been set to nil.
7 Maintenance and Repairs has been estimated at 2% of the replacement cost of the facility in accordance with the methodology

9
5.3 Decommissioning costs
Provision for decommissioning has been calculated in accordance with NERSA’s proposed methodology
as set out in the Frequently Asked Questions related to the methodology for the Setting and Approval of
Tariffs in the Petroleum Pipelines Industry. In this respect the decommissioning cost is treated as an
operational expense.
The decommissioning amount is raised over the life of the project by calculating the real value of the
difference between the full liability and what has already been raised in money of the year in question.
The difference is divided by the number of years left of the project life to yield the amount that must be
raised for the current project year.
Decommissioning of a chemical plant involves the following key processes that should be taken into
account:
Decontamination
Dismantling
Disposal
Rehabilitation
Typical decommissioning and rehabilitation costs for a plant such as the Burgan Facility are in the order
of 5 – 10% of the capital expenditure. The actual quantum depends on a large number of variables,
including the extent to which the site must be restored to its original state. The decommissioning
expense has been set at a level that will not only allow Burgan to fulfil its obligations in terms of the
lease agreement with TNPA but will allow for sufficient funds to be transferred to TNPA at the
termination of the agreement for the ultimate complete dismantling and restoration of the site to its
present condition, should TNPA exercise its right to take over the assets. We have allowed for
decommissioning and rehabilitation costs at 8% of the capital expenditure.
5.4 Working capital
An assumption of 30 days has been made for both creditors and debtors resulting in the net working
capital requirement for the year being the difference between 30/365 of the annual revenue minus
30/365 of the annual operating expenses. The working capital allowance for the loading and storage
facilities has been calculated in accordance with the IOC tariff methodology by adding the annual
balance to the IOC-trended value of PPE.
Allowable revenue on working capital in our ROR calculation for the pipeline has been calculated by
allowing a nominal after tax WACC as the opportunity cost on the working capital balance. This is
different from the NERSA methodology where working capital is incorrectly added to the RAB and a real
return granted thereon. Working capital does not have an inflationary write-up each year and therefore
it is an error to apply a real after tax WACC to the working capital balance in the ROR method.8
8 We will provide NERSA with a simple demonstration model to prove this point if requested.
10
5.5 Tax
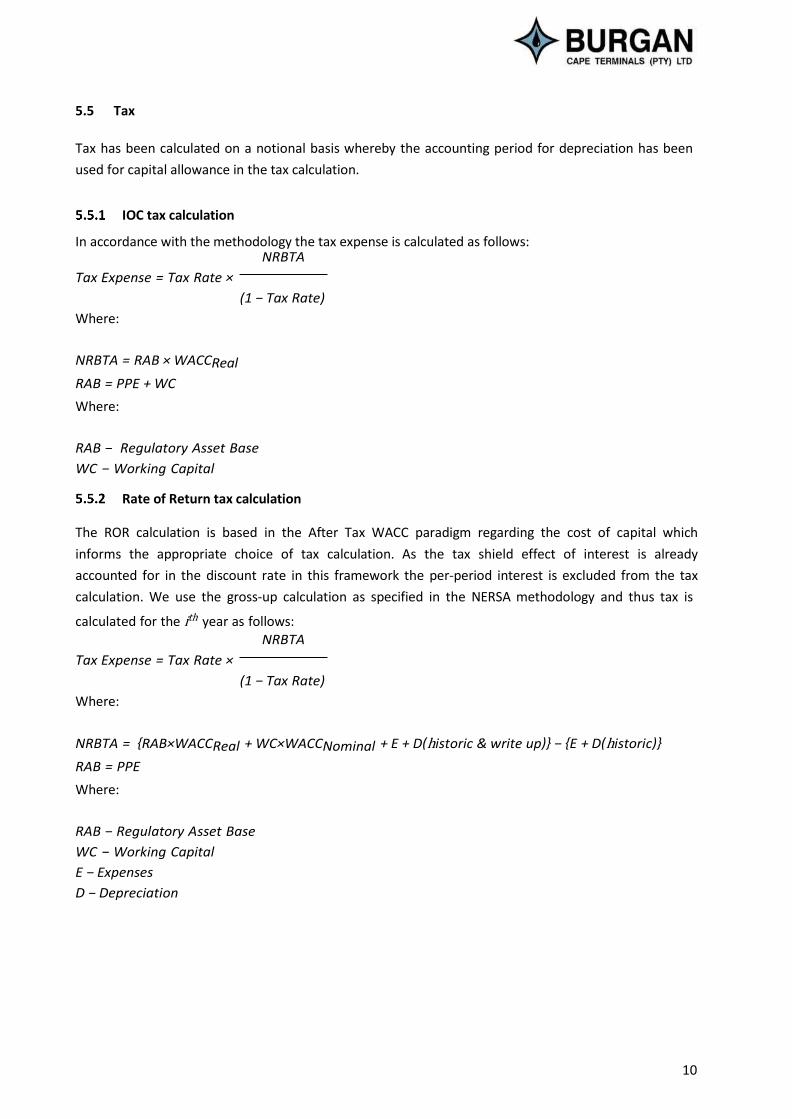
Tax has been calculated on a notional basis whereby the accounting period for depreciation has been
used for capital allowance in the tax calculation.
IOC tax calculation
In accordance with the methodology the tax expense is calculated as follows: NRBTA
Tax Expense = Tax Rate ×
(1 − Tax Rate)
Where:
NRBTA = RAB × WACCReal
RAB = PPE + WC
Where:
RAB − Regulatory Asset Base
WC − Working Capital
Rate of Return tax calculation
The ROR calculation is based in the After Tax WACC paradigm regarding the cost of capital which
informs the appropriate choice of tax calculation. As the tax shield effect of interest is already
accounted for in the discount rate in this framework the per-period interest is excluded from the tax
calculation. We use the gross-up calculation as specified in the NERSA methodology and thus tax is
calculated for the ith year as follows: NRBTA
Tax Expense = Tax Rate ×
(1 − Tax Rate)
Where:
NRBTA = {RAB×WACCReal + WC×WACCNominal + E + D(historic & write up)} − {E + D(historic)}
RAB = PPE
Where:
RAB − Regulatory Asset Base
WC − Working Capital
E − Expenses
D − Depreciation
11
5.6 Cost schedule per facility
In this section we present the full schedule of actual project costs used for the calculation of the tariff
for each facility.
The capital costs for all three facilities are part of the same EPC contract and all three facilities have
shared the same project development costs. In order to allocate an appropriate portion of the capital to
each facility the total capital has been split by applying an appropriate percentage allocation per line
item of costs. Where there is no direct apportionment possible the allocation has been based on the
percentage derived in conjunction with the EPC contractor. The line item breakdown of total capitalised
costs is presented in the Appendix in section 11.2 along with the allocation of the costs per facility.
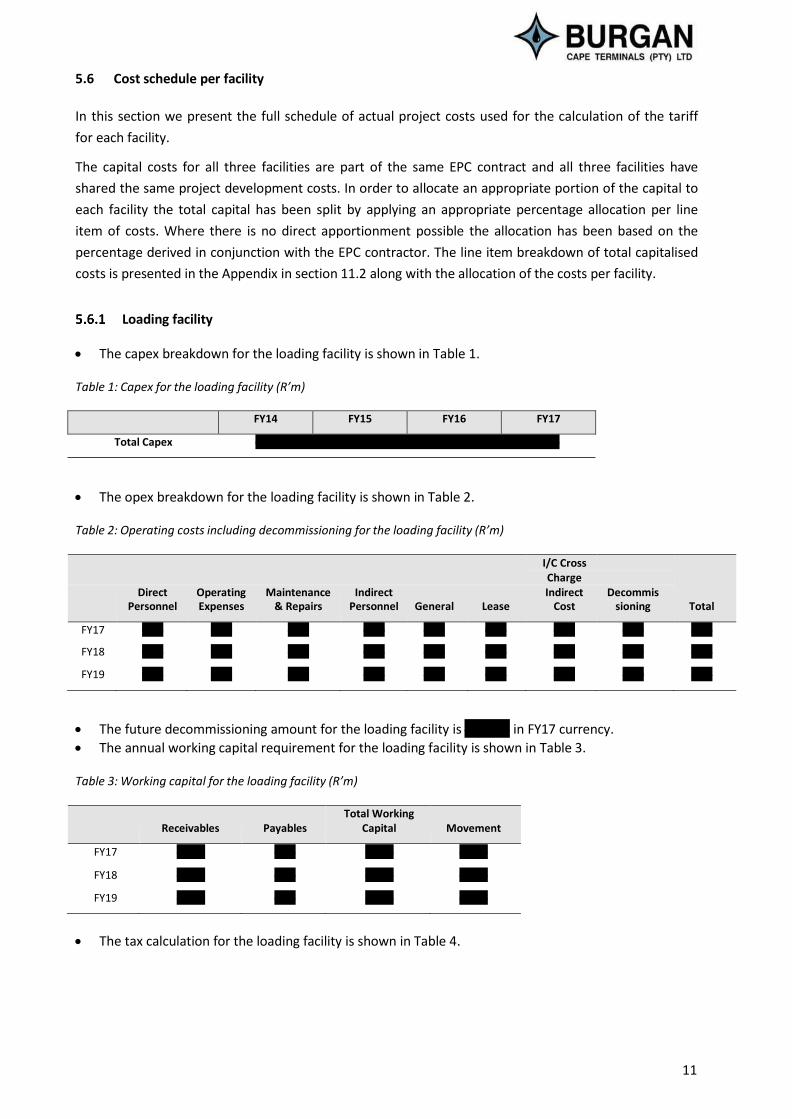
Loading facility
The capex breakdown for the loading facility is shown in Table 1.
Table 1: Capex for the loading facility (R’m)
FY14 FY15 FY16 FY17
Total Capex 0.47 1.63 13.80 6.08
The opex breakdown for the loading facility is shown in Table 2.
Table 2: Operating costs including decommissioning for the loading facility (R’m)
I/C Cross Charge
Direct Operating Maintenance Indirect Indirect Decommis Personnel Expenses & Repairs Personnel General Lease Cost sioning Total
FY17 0.17 0.18 0.46 0.20 0.55 0.27 0.00 0.09 1.93
FY18 0.18 0.19 0.49 0.22 0.58 0.30 0.00 0.09 2.05
FY19 0.19 0.20 0.51 0.23 0.62 0.33 0.00 0.10 2.18
The future decommissioning amount for the loading facility is R1.76m in FY17 currency.
The annual working capital requirement for the loading facility is shown in Table 3.
Table 3: Working capital for the loading facility (R’m)
Total Working Receivables Payables Capital Movement
FY17 (0.49) 0.15 (0.34) (0.34)
FY18 (0.53) 0.16 (0.37) (0.03)
FY19 (0.56) 0.17 (0.39) (0.02)
The tax calculation for the loading facility is shown in Table 4.

12
Table 4: Tax calculation for the loading facility (R’m)
RAB WACC (After
Tax, Real)
RAB x WACC
RAB x WACC (1 − Tax)
Tax
FY17 23.45 12.48% 2.93 4.06 (1.14)
FY18 25.11 12.54% 3.15 4.37 (1.22)
FY19 26.47 12.61% 3.34 4.64 (1.30)
Storage facility
The capex breakdown for the storage facility is shown in Table 5.
Table 5: Capex for the storage facility (R’m)
FY14 FY15 FY16 FY17
Total Capex 17.42 60.05 509.72 173.57
The opex breakdown for the storage facility is shown in Table 6.
Table 6: Operating costs including decommissioning for the storage facility (R’m)
FY17 5.84 6.11 16.03 7.08 19.13 9.33 0.12 3.07 66.71
FY18 6.19 6.53 16.93 7.50 20.23 10.26 0.12 3.24 71.00
FY19 6.56 6.98 17.84 7.95 21.49 11.29 0.13 3.41 75.67
The future decommissioning amount for the storage facility is R60.86m in FY17 currency.
The working capital requirement for the storage facility is shown in Table 7.
Table 7: Working capital for the storage facility (R’m)
Receivables Payables Total Working
Movement Capital
FY17 (17.09) 5.23 (11 .86) (11.86)
FY18 (18.33) 5.57 (12 .76) (0.90)
FY19 (19.47) 5.94 (13 .53) (0.76)
Direct Operating Maintenance Personnel Expenses & Repairs
Indirect Personnel
General Lease
I/C Cross Charge Indirect
Cost
Decommis sioning
Total

13
The tax calculation for the storage facility is shown in Table 8.
Table 8: Tax calculation for the storage facility (R’m)
RAB WACC (After
Tax, Real)
RAB x WACC
RAB x WACC (1 − Tax)
Tax
FY17 815.22 12.48% 101.72 141.27 (39.56)
FY18 872.73 12.54% 109.48 152.06 (42.58)
FY19 920.12 12.61% 116.05 161.18 (45.13)
Pipeline
The capex breakdown for the pipeline is shown in Table 9.
Table 9: Capex for the pipeline (R’m)
FY14 FY15 FY16 FY17
Total Capex 0.49 1.68 14.28 17.26
The opex breakdown for the pipeline is shown in Table 10.
Table 10: Operating costs including decommissioning for the pipeline (R’m)
Operating Costs Decommissioning Total
FY17 - 0.07 0.07
FY18 - 0.08 0.08
FY19 - 0.08 0.08
The future decommissioning amount for the pipeline is R2.70m in FY17 currency.
The net working capital requirement and the annual change in the net working capital requirement for the pipeline is shown in Table 11.
Table 11: Working capital for the pipeline (R’m)
FY17 (0.30) - (0.30) (0.30)
FY18 (0.62) - (0.62) (0.32)
FY19 (0.65) - (0.65) (0.03)
Receivables Payables Total Working
Capital Movement

14
The tax calculation for the pipeline is shown in Table 12. The tax calculation is based on the ROR tariff.
Table 12: Tax calculation for the pipeline
FY17 2.76 (0.41) - (0.07) 2.28 3.17 (0.89)
FY18 5.68 (0.85) - (0.08) 4.75 6.60 (1.85)
FY19 5.95 (0.85) - (0.08) 5.01 6.96 (1.95)
6 Regulatory Asset Base and the calculation of Trended Original Cost (TOC)
The calculation of a Regulatory Asset Base (RAB) based on the value of Plant, Property and Equipment is
required for both the IOC and ROR tariff calculation.
The tables below show the calculation of RAB using the IOC methodology for the loading and storage
assets and the TOC asset base for the Pipeline. The financing cost of work in progress is calculated at the
WACC (After Tax) until the plant is brought into operation. The financing cost is capitalised and used in
determining the total original cost to be trended from the year of first operation.
The IOC methodology applied to the loading and storage assets trends the RAB at CPI from the year the
plant is brought into operation.
In accordance with the TOC methodology the depreciation of the pipeline asset is on a straight line basis
from year of first operation in FY17 to the end of the pipeline physical life in FY56. Amortisation of the
inflation write-up has been calculated in accordance with the NERSA methodology.
6.1 Loading facility
The asset table for the loading facility is shown in Table 13.
Table 13: Asset table for the loading facility (R’m)
Capex
CWIP CWIP
CWIP
Financing Brought
Carried
Cost into
Forward Operation
IOC b / f
Current Period Write-Up
IOC c / f
Regulatory Asset Base
(PPE)
FY14 0.47 0.00 0. 00 0.47 0.00 0.00 0.00 0.00
FY15 1.63 0.09 0. 00 2.19 0.00 0.00 0.00 0.00
FY16 13.80 0.43 16 .42 0.00 0.00 0.00 16.42 0.00
FY17 6.08 0.00 6. 08 0.00 16.42 0.95 23.45 23.45
FY18 0.00 0.00 0. 00 0.00 23.45 1.31 24.77 24.77
FY19 0.00 0.00 0. 00 0.00 24.77 1.34 26.10 26.10
Revenue Capital Operating Decommis Income
Allowance Costs sioning Before Tax
Income Gross Up for Tax
Tax Expense

15
6.2 Storage facility
The asset table for the storage facility is shown in Table 14.
Table 14: Asset table for the storage facility (R’m)
Capex
CWIP CWIP
CWIP
Financing Brought
Carried
Cost into
Forward Operation
IOC b / f
Current Period Write-Up
IOC c / f
Regulatory Asset Base
(PPE)
FY14 17.42 0.00 0.00 17.42 0.00 0.00 0.00 0.00
FY15 60.05 3.32 0.00 80.78 0.00 0.00 0.00 0.00
FY16 509.72 15.97 606 .47 0.00 0.00 0.00 606.47 0.00
FY17 173.57 0.00 173 .57 0.00 606.47 35.18 815.22 815.22
FY18 0.00 0.00 0.00 0.00 815.22 45.65 860.87 860.87
FY19 0.00 0.00 0.00 0.00 860.87 46.49 907.36 907.36
6.3 Pipeline
The asset table for the pipeline is shown in Table 15.

Table 15: Asset table for the pipeline (R’m)
0.00 0.00 0.00 0.00 0.00 0.00
0.00 0.00 0.00 0.00 0.00 0.00
0.00 0.00 0.00 16.99 0.00 0.00
0.99 0.02 0.96 34.79 0.45 17.97
2.91 0.07 2.83 35.79 0.94 36.73
4.77 0.13 4.64 36.73 0.99 37.73
16
Write-Up Bal on which Return Earned
Write-Up Amortisation
Accumulated TOC c/f
Write-Up c/f
Total Depreciation
& Amortisation
Regulatory Asset Base
(PPE)
Capex CWIP
CWIP CWIP
Financing Brought
Carried
Cost into
Forward Operation
Current Period
Depreciation
Depreciated Original Cost c/f
Current Period
Write-Up
FY14 0.49 0.00 0.00 0.49 0.00 0.00 0.00
FY15 1.68 0.09 0.00 2.26 0.00 0.00 0.00
FY16 14.28 0.45 16. 99 0.00 0.00 16.99 0.00
FY17 17.26 0.00 17. 26 0.00 0.42 33.83 0.99
FY18 0.00 0.00 0.00 0.00 0.87 32.96 1.95
FY19 0.00 0.00 0.00 0.00 0.87 32.09 1.93
17
7 Discount Rate
As described in the tariff methodologies in section 4, the applicable discount rate for the IOC tariff
calculation performed in this application is the After Tax WACC. The ROR calculations performed to
calculate the pipeline tariff also require an after tax WACC to be used as the discount rate. In this
section we specify Burgan’s cost of equity, debt and the resultant WACC.
7.1 Cost of equity
The cost of equity is built up using the Capital Asset Pricing model. The method we have used is
informed by NERSA’s “Cost of Equity Adjustments Discussion Document for Petroleum Storage and
Loading Facilities”, 6th May 2014. We have additionally made use of the PWC Valuation Methodology
Survey, 7th Edition, 2014/20159.
We consider three adjustments to the market-derived cost of equity – a small stock premium, a project
specific risk premium and a liquidity premium. The liquidity premium is treated as a multiplier on all
other cost of equity factors as contemplated in NERSA’s FAQ document.
Our Cost of equity calculation is thus as follows: Ke = (Rf + MRP × Beta + SSP + a)× (1 + LP)
Where:
Ke − real after tax cost of equity
Rf − real risk free rate
MRP − market risk premium
Beta − appropriate stock Beta i. e. taking account of gearing −
SSP − small stock premium
a − Project Specific Risk
LP − liquidity premium
The individual elements of the calculation are described below:
9 Africa: A close look at value - Valuation methodology survey 2014/15, 7th edition, PWC (2015). Available at http://www.pwc.co.za/valuation-survey

18
Risk free rate
As determined from NERSA’s provided data10 for the tariff period 1 Jan 2017 – 31 Dec 2017 a value of
3.73% has been used.
Market risk premium
As determined from NERSA’s provided data for the tariff period 1 Jan 2017 – 31 Dec 2017 a value of
6.35% has been used.
Beta
Beta has been determined from NERSA’s document11 for the tariff period 1 Jan 2017 – 31 Dec 2017. The
unlevered value of 0.57 is used in our modelling and levered to 0.88 at a gearing level of 35% once debt
is incurred.
Small stock premium
The small stock premium assumed for Burgan is due to the following reasons:
1. Burgan is a small unlisted company which has recently been formed
2. Burgan has no access to legal expertise within its own structures, these services are purchased from
external legal counsel
3. Burgan has to purchase legal, operational and technical expertise from third parties rather than in-
house expertise
4. Burgan has never had access to operational and technical expertise under a previous shareholding
dispensation
5. Burgan is a new operator within the South African context
Using the PWC Valuation Methodology survey 2014/15 as a guide we use a small stock premium of 3.8%
based on the initial RAB and Table 16 from page 54 of the survey.
Table 16: Small stock premium (PWC Valuation Methodology Survey 2014/15)
2014 6.5% 5.2% 3.8% 2.3% 1.5% 0.7%
2012 6.7% 4.4% 2.8% 1.7% 0.9% 0.1%
2010 4.9% 3.7% 2.8% 1.3% 0.7% 0.1%
2007 5.2% 4.0% 2.7% 1.7% 1.3% 0.4%
10 Document from Nersa website: Economic Data – 30YR Market Risk Premium up to January 2016 – Petroleum Pipelines Industry.xls
11 Document from Nersa website: Beta Values – January 2015 – March 2016 Tariff Gearing May 2016 – Petroleum Pipelines Industry.pdf
Rm 0 – 250 251 – 500 501 – 1000 1001 – 1500 1501 – 2000 2001+

19
Project specific risk
The project specific risk assumed for Burgan is based on the following reasons:
1. The Eastern Mole project is a Greenfield project and is a completely new activity (independent
import terminal) with no similar previous undertaking and thus has numerous unquantifiable risks
which might only be encountered during the construction and operational phase of the project.
2. Burgan being an independent storage terminal owner and operator is fully exposed to the oil
marketers in Western Cape as potential customers to the terminal. Although discussions with these
potential customers have started, until sufficient long term contracts are signed, the returns of the
investment are uncertain. This is unlike the existing assets in Cape Town which are owned and
operated by oil marketers who have their respective market volume to utilize the assets. Note further
that Burgan will bear the risk of not finding replacement off-take agreements should the initial long-
term contracts come to an end.
3. The Eastern Mole project will be built on reclaimed land within the Port of Cape Town and as such
has brought about construction challenges due to voids etc. within the ground. These issues may
require Burgan to pile to bedrock in order to construct the planned terminals which might trigger
other potential challenges. Furthermore these challenges may impact on the construction period of
the project and given that the lease period is limited to an operational period of 20 years. This could
significantly reduce the period in which Burgan may generate returns to fund the project.
4. With no additional land/space for further expansion, Burgan’s return on this project is limited to the
current terminal design of 118,670 m3 i.e. there are no further opportunities for Burgan to generate
additional revenues from the site.
5. Competition from incumbent oil marketers who have older depreciated assets, long term
presence/experience in the South African market and coupled with strong corporate support in the
form of ‘steady state’ volumes and prices. Burgan does not have this kind of support and may need
to reduce its tariffs to compete within the market despite a higher NERSA tariff being granted. Given
the above there is further risk to Burgan that the asset may not generate the required returns to fund
the project. Note there are competing berths and pipelines currently in operation in the port of Cape
Town.
6. Burgan is being constructed based on a view of expected supply and demand factors within the port
of Cape Town. Should the above expectations not materialize there is significant market risk
exposure that the required returns for the project will not be met.
7. NERSA’s recent methodology revision has removed the claw-back provision resulting in the licensee
i.e. Burgan, shouldering the risk of annual volume fluctuations and their impact on project cash flows.
Variations in project cash flows, cash flow timing risk or financing risk, will impact considerably on the
returns Burgan expects to generate from the Eastern Mole project. Furthermore given that Burgan is
an independent storage company and not an integrated oil major, volume variations (and
consequently cash flow timing risk) are far more likely. This situation is further exacerbated by the
limited operating period for Burgan under the TNPA lease.
8. In order to meet some of its operational requirements, Burgan will need to connect to and leverage
off the Chevron pipeline. It is submitted that Burgan has little to no control over the Chevron
pipeline and any factors (outside of the control of Burgan) will impact on the returns of the project.
This infrastructural risk can manifest in the form of an inability to service a customer’s needs to
unscheduled stoppages and down time.
9. TNPA Lease agreement. Burgan faces additional project risks in respect of the lease agreement with
TNPA, for example the lease escalation is not fixed nor tied to CPI. Furthermore the lease expires in

20
2037 with Burgan being obliged to vacate and clear the site or hand over the site to TNPA, thus there
is at this stage no prospect for Burgan to generate revenue from the facility after this date.
While the determination of a project risk adjustment is a very subjective exercise, Burgan has attempted
to analyse the adjustment applied to the factors described above in Table 17.
Table 17: Risk assessment of the Burgan project
Risk Rate Assumed Likely Rate Range Refer above
Finance/cash flow 3.0% 2% - 8% 1, 2, 3, 5, 7
Market 1.25% 1% - 5% 5, 6
Other 0.75% 0.25% - 5% 2, 4, 8
Total 5.00% 3.25% - 18%
The rate assumed for project risk is within the ranges indicated in the PWC Valuation methodology
survey 2014/2015 for Southern Africa for adding specific risk premiums which falls between 1%-4% for
lower ranges and 5%-10% for upper ranges.
Liquidity risk
A liquidity risk premium of 5% has been assumed.
The liquidity risk premium assumed for Burgan is due to the following reasons:
1. Burgan shares are not publicly traded nor listed on any public exchange
2. Burgan’s main shareholder, VTTI, is not listed on any public exchange nor are its shares publicly
traded
3. Burgan has limited access to financial markets and institutions for the purposes of raising finance
5% is in line with the value proposed in NERSA’s discussion document12.
Calculation of Ke
Using the parameters described above and the equation for Ke the real after tax cost of equity can be
calculated as follows:
Ke = (Rf + MRP × Beta + SSP + a)× (1 + LP)
= (3.73% + 6.35%×0.88 + 3.80% + 5.00%)×(1 + 5%)
= 19.02% This figure represents a total premium above the market of 9.70%13
12 Cost Of Equity Adjustments Discussion Document For Petroleum Storage And Loading Facilities, 6th May 2014,Page 17, Nersa (2014)
13 19.02% - (3.73% + 6.35% x 0.88)
21
Real Ke Nominal Ke
Discount Factors Discount Factors
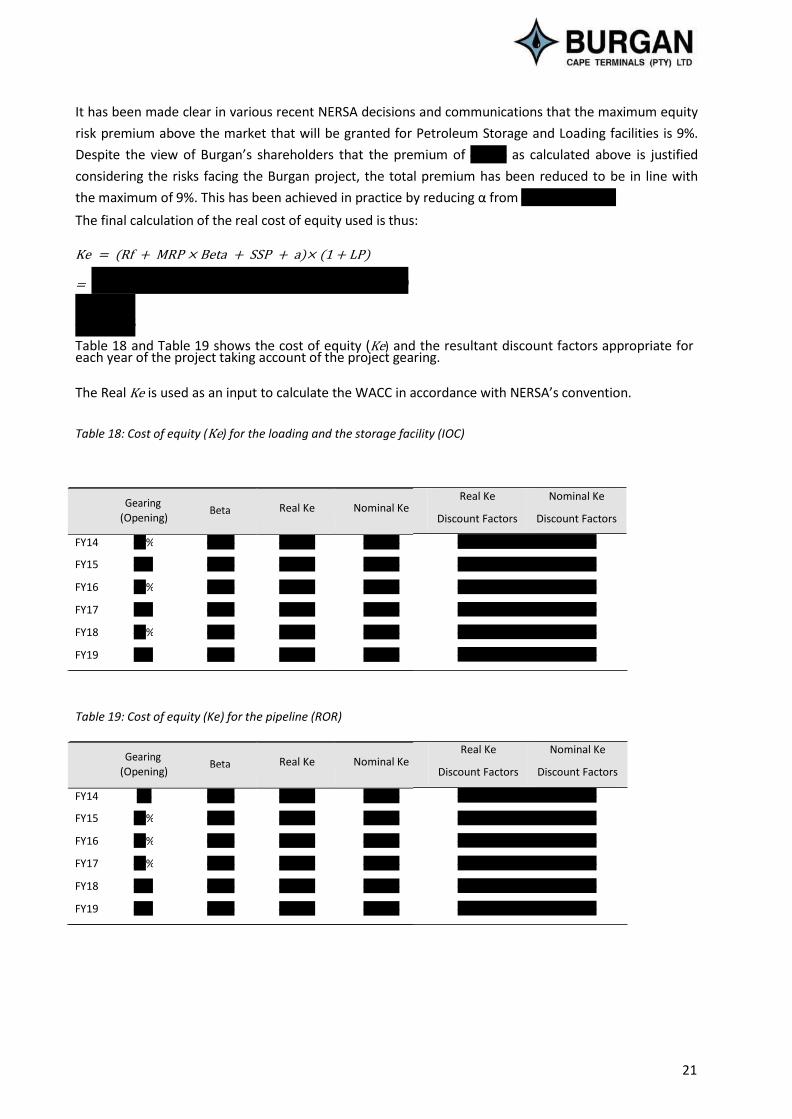
It has been made clear in various recent NERSA decisions and communications that the maximum equity
risk premium above the market that will be granted for Petroleum Storage and Loading facilities is 9%.
Despite the view of Burgan’s shareholders that the premium of 9.70% as calculated above is justified
considering the risks facing the Burgan project, the total premium has been reduced to be in line with
the maximum of 9%. This has been achieved in practice by reducing α from 5.00% to 4.33%.
The final calculation of the real cost of equity used is thus:
Ke = (Rf + MRP × Beta + SSP + a)× (1 + LP)
= (3.73% + 6.35%×0.88 + 3.80% + 4.33%)×(1 + 5%)
= 18.30%
Table 18 and Table 19 shows the cost of equity (Ke) and the resultant discount factors appropriate for each year of the project taking account of the project gearing.
The Real Ke is used as an input to calculate the WACC in accordance with NERSA’s convention.
Table 18: Cost of equity (Ke) for the loading and the storage facility (IOC)
1.65560 1.98723
1.39949 1.58135
1.18300 1.25161
1.00000 1.00000
0.84531 0.80048
0.71455 0.64199
Table 19: Cost of equity (Ke) for the pipeline (ROR)
1.65560 1.98723
1.39949 1.58135
1.18300 1.25161
1.00000 1.00000
0.84531 0.80048
0.71455 0.64199
Real Ke Nominal Ke
Discount Factors Discount Factors
Gearing Beta
(Opening)
Real Ke
Nominal Ke
FY14 35% 0.877 18.30% 23.54%
FY15 35% 0.877 18.30% 25.67%
FY16 35% 0.877 18.30% 26.34%
FY17 35% 0.877 18.30% 25.16%
FY18 35% 0.877 18.30% 24.92%
FY19 35% 0.877 18.30% 24.69%
Gearing Beta
(Opening)
Real Ke
Nominal Ke
FY14 0% 0.570 16.25% 21.40%
FY15 35% 0.877 18.30% 25.67%
FY16 35% 0.877 18.30% 26.34%
FY17 35% 0.877 18.30% 25.16%
FY18 35% 0.877 18.30% 24.92%
FY19 35% 0.877 18.30% 24.69%

22
7.2 Gearing and cost of debt
For the purpose of this tariff application debt has been modelled as a constant 35% of the asset base in
line with the IOC methodology for the Loading and Storage facility. For the pipeline ROR calculation the
TOC gearing is zero in FY14 and thereafter modelled as a constant 35% of TOC assets for the remaining
periods of the project i.e. from FY15 – FY37, in order to maintain consistency with Burgan’s expected
capital structuring schedule.
Based on the interactions with potential lenders to date, the Prime rate is a reasonable estimate of the
cost of debt that Burgan will be able to raise. As at time of application this would indicate a debt cost of
10.50% before Tax, yielding 7.56% After Tax. Using Burgan’s assumption of 5.8% for inflation for FY17
the Real After tax cost of debt is 1.66% for FY17.
7.3 Weighted Average Cost of Capital (WACC)
As described earlier the after tax WACC is required for both the IOC annual allowable revenue
calculation and the ROR method.
The appropriate values for WACC are shown in Table 20 and Table 21 using the above calculations for
the cost of equity (Ke), the cost of debt (Kd), the gearing assumptions and the macro-economic
estimates. The discount factors are based in FY17 in order to derive the FY17 tariff. All present values
are thus FY17 values.
Table 20: Weighted Average Cost of Capital (WACC) for the loading and storage facility
1.41360 1.69675
1.26137 1.42527
1.12477 1.19001
1.00000 1.00000
0.88854 0.84142
0.78902 0.70890
Table 21: Weighted Average Cost of Capital (WACC) for the pipeline
1.413595591 1.696746723
1.26137 1.42527
1.12477 1.19001
1.00000 1.00000
After Tax WACC After Tax WACC Discount Factor Discount Factor
Real Nominal
After Tax WACC After Tax WACC Discount Factor Discount Factor
Real Nominal
Gearing (Opening)
Ke (after Tax, Real)
Kd (after Tax, Real)
After Tax WACC Real
After Tax WACC Nominal
FY14 35% 18.30% 2.01% 12.60% 17.59%
FY15 35% 18.30% 0.50% 12.07% 19.05%
FY16 35% 18.30% 0.71% 12.14% 19.77%
FY17 35% 18.30% 1.66% 12.48% 19.00%
FY18 35% 18.30% 1.86% 12.54% 18.85%
FY19 35% 18.30% 2.05% 12.61% 18.69%
Gearing (Opening)
Ke (after Tax, Real)
Kd (after Tax, Real)
After Tax WACC Real
After Tax WACC Nominal
FY14 0% 16.25% 2.01% 16.25% 21.40%
FY15 35% 18.30% 0.50% 12.07% 19.05%
FY16 35% 18.30% 0.71% 12.14% 19.77%
FY17 35% 18.30% 1.66% 12.48% 19.00%

23
0.88854 0.84142
0.78902 0.70890
8 Volume forecast
8.1 Total volumes
Burgan will run its operation on a throughput basis, charging customers per cubic metre of product
dispatched from the terminal. Actual throughput rates achieved per year will fluctuate substantially
depending on factors outside of Burgan’s control and related to the business requirements of its
customers. In order to ensure the maximum efficient use of the assets Burgan will contract with its
customers based on minimum annual throughput through the use of take-or-pay provisions.
In order to calculate a reasonable annual throughput volume forecast for tariff calculation purposes
Burgan has considered the constraints on the terminal’s outbound capacity (the inbound capacity being
subject to fewer constraints). The outbound capacity is limited by health, safety and environmental
considerations. These relate to the extent to which the terminal infrastructure is utilised in order to
maximise the number of tank turns, and the natural restrictions on the dispatch of product by road
created by traffic considerations through the port area. Due to safety restrictions tanker truck vehicles
may not operate after 10pm and before 5am which restricts the ability for the terminal to operate in a
true 24/7 mode. Table 22 shows the calculation of annual throughput based on a conservative
assumption of average truck capacity, resulting in a figure of 928.2 million litres. NERSA’s own
assessment of the terminal capacity as stated in the RFD for the operating license suggested an annual
throughput volume of 1 051 200m3 (1 051.2 million litres) based on a traffic study associated with the
Environmental Impact Assessment process.
For tariff calculation purposes Burgan has assumed an annual volume of 1 000 million litres. This figure
is considered to be a reasonable assessment of the capacity of the terminal.
Table 22: Throughput capacity for Burgan terminal
Amount Unit
Average Truck Capacity 30 m3
0.03 million litres
Number of Loading Bays 5
Loading Bay Dispatch Rate 1 trucks per hour
Hours per Day 17
Days per Week 7
Weeks per Year 52
Total Throughput 928.2 million litres per annum
After Tax WACC After Tax WACC Discount Factor Discount Factor
Real Nominal
Gearing Ke (after Kd (after After Tax After Tax WACC (Opening) Tax, Real) Tax, Real) WACC Real Nominal
FY18 35% 18.30% 1.86% 12.54% 18.85%
FY19 35% 18.30% 2.05% 12.61% 18.69%

24
Burgan expects to begin operations in mid FY17 and thus will not have full throughput for the FY17
financial year. A throughput capacity of 500 million litres has been assumed for the first year of
operation. As Burgan’s lease agreement with TNPA terminates end of June FY37 the last financial year
will also only have half a year’s volumes.
Burgan expects to receive product into the terminal via both the loading facility and the pipeline. Based
on current indications from customers the volume split is expected to be 45% via the Loading facility
and 55% via the pipeline. Table 23 shows the volume forecast for each facility for all operational years
considered in this application.
Table 23: Volume forecast (million litres)
500
1 000
1 000
9 Tariff calculation
In this section we present the calculation of the loading, storage and pipeline tariffs. The loading and
storage tariffs are calculated using the IOC formulation of section 4.2.1 levelised over the project
volumes which results in a base value for FY17 that must be escalated by inflation for subsequent years
of the project. We calculate the estimated future tariff and tabulate the estimated revenue for each
year of the project based on the estimated inflation and volume assumptions.
As NERSA will set the pipeline tariff using the ROR /Allowable Revenue methodology we have calculated
a tariff using this methodology for the pipeline.
9.1 Loading facility tariff calculation
Levelised IOC tariff calculation for the loading facility
Table 24 shows the annual allowable revenue calculation for the loading facility.
Storage Facility
Loading Pipeline
Facility
FY17 22 5 275
FY18 45 0 550
FY19 45 0 550

25
Table 24: Allowable revenue for the loading facility using the IOC method (R’m)
FY17 2.93 1.84 0.09 1.14 5.99
FY18 3.15 1.96 0.09 1.22 6.42
FY19 3.34 2.09 0.10 1.30 6.82
The annual allowable revenues for the project life are discounted at the nominal After Tax WACC to
yield a present value of R50.69m in FY17 money.14 Volumes are discounted at the real After Tax WACC
to yield the present value of the volumes at 3 442.29 million litres. The FY17 base value is calculated by
dividing the present value of the revenue by the present value of the volumes to yield 1.47 cents/litre in
FY17 money.
Table 25: Levelised IOC tariff calculation for the loading facility
PV at WACC (After Tax, Nominal)
Allowable Revenue R'm 50.69
PV at WACC (After Tax, Real)
Volume Million Litres 3 442.29
Tariff T0, FY17 (cents / litre) 1.47
For illustrative purposes we plot the levelised tariff path for the loading facility in Figure 3 and show the
levelised revenue for each year in Table 26.
14 The full Excel dataset required for this calculation will be submitted to NERSA as part of this application.
Return on RAB
Operating Costs
Decommissioning Tax Total
Allowable Revenue

26
Volumes Levelised IOC IOC
9
8
7
6
5
4
3
2
1
0
500
450
400
350
300
250
200
150
100
50
0
Figure 3: Tariff path comparison for the loading facility
Table 26: Levelised IOC tariff and revenue for the loading facility
Volume million IOC Allowable IOC Tariff Levelised IOC Levelised IOC litres Revenue R'm cents/litre Tariff cents/litre Revenue R'm
FY17 225 5.99 2.66 1.47 3.31
FY18 450 6.42 1.43 1.55 7.00
FY19 450 6.82 1.52 1.64 7.38
9.2 Storage facility tariff
Levelised IOC tariff calculation for the storage facility
Table 27 shows the annual allowable revenue calculation for the storage facility.
Table 27: Allowable revenue for the storage facility using the IOC method (R’m)
FY17 101.72 63.64 3.07 39.56 207.98
FY18 109.48 67.77 3.24 42.58 223.06
FY19 116.05 72.25 3.41 45.13 236.85
Return on RAB
Operating Costs
Decommissioning Tax Total
Allowable Revenue
Tari
ff (
cen
ts/l
itre
)
FY1
5
FY1
6
FY1
7
FY1
8
FY1
9
FY2
0
FY2
1
FY2
2
Vo
lum
e m
illio
n li
tres
/an
nu
m
FY3
6
FY3
7
FY2
3
FY2
4
FY2
5
FY2
6
FY2
7
FY2
8
FY2
9
FY3
0
FY3
1
FY3
2
FY3
3
FY3
4
FY3
5
27
FY1
5
FY1
6
FY1
7
FY1
8
FY1
9
FY2
0
FY2
1
FY2
2
FY2
3
FY2
4
FY2
5
FY2
6
FY2
7
FY2
8
FY2
9
FY3
0
FY3
1
FY3
2
FY3
3
FY3
4
FY3
5
FY3
6
FY3
7
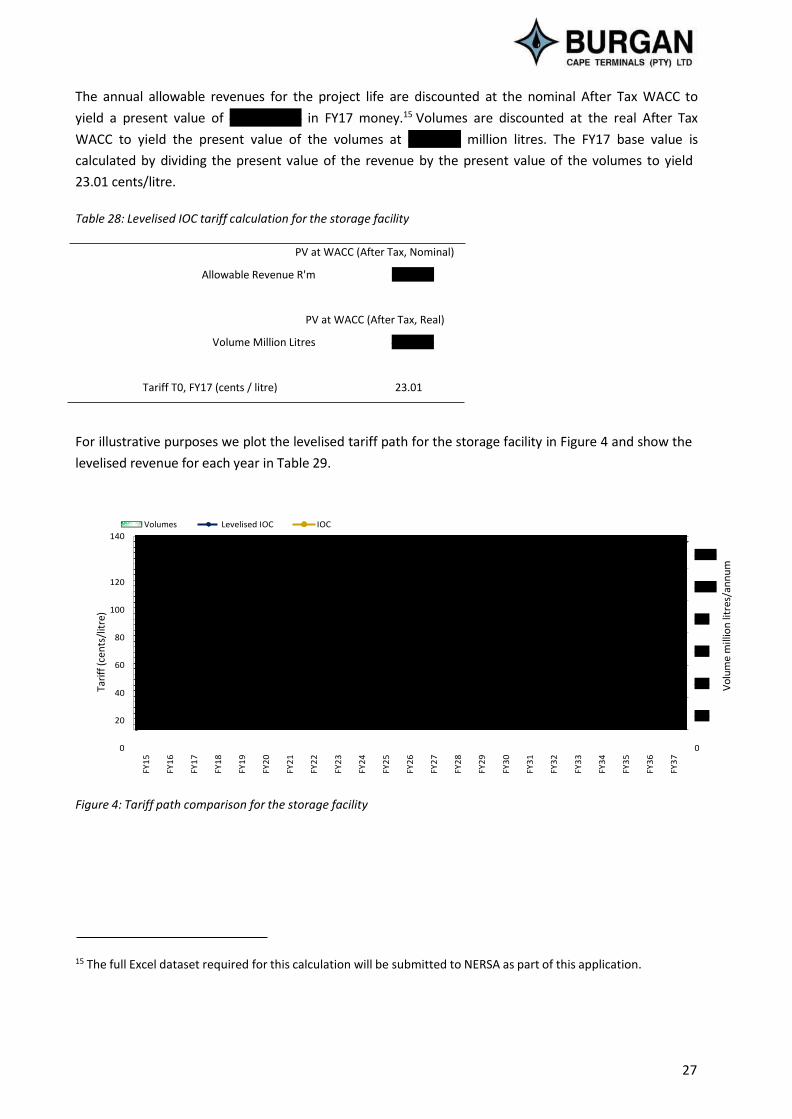
The annual allowable revenues for the project life are discounted at the nominal After Tax WACC to
yield a present value of R1 759.97m in FY17 money.15 Volumes are discounted at the real After Tax
WACC to yield the present value of the volumes at 7 649.54 million litres. The FY17 base value is
calculated by dividing the present value of the revenue by the present value of the volumes to yield
23.01 cents/litre.
Table 28: Levelised IOC tariff calculation for the storage facility
PV at WACC (After Tax, Nominal)
Allowable Revenue R'm 1 759.97
PV at WACC (After Tax, Real)
Volume Million Litres 7 649.54
Tariff T0, FY17 (cents / litre) 23.01
For illustrative purposes we plot the levelised tariff path for the storage facility in Figure 4 and show the
levelised revenue for each year in Table 29.
140
Volumes Levelised IOC IOC
1 200
120 1 000
100
80
60
40
20
800
600
400
200
0 0
Figure 4: Tariff path comparison for the storage facility
15 The full Excel dataset required for this calculation will be submitted to NERSA as part of this application.
Vo
lum
e m
illio
n li
tres
/an
nu
m
Tari
ff (
cen
ts/l
itre
)

28
Table 29: Levelised IOC tariff and revenue for the storage facility
Volume IOC Allowable IOC Tariff Levelised IOC Levelised IOC million litres Revenue R'm cents/litre Tariff cents/litre Revenue R'm
FY17 500 207.98 41.60 23.01 115.04
FY18 1 000 223.06 22.31 24.30 242.96
FY19 1 000 236.85 23.68 25.61 256.08
9.3 Pipeline tariff
Rate of Return tariff calculation for the pipeline
Following the NERSA methodology16, we use the ROR method to calculate the pipeline tariff. The
allowable revenue calculation for the pipeline is shown in Table 30. Return on Assets is calculated by
multiplying the RAB from Table 15 by the real After Tax WACC from Table 21. Return on Working Capital
is calculated by multiplying the total working capital of Table 11 by the nominal After Tax WACC from
Table 21. Depreciation and Amortisation is per Table 15 and the Operating costs, decommissioning
provision and tax expense are from the cost schedules in section 5.6.3.
Table 30: Allowable revenue for the pipeline using the rate-of-return tariff method (R’m)
FY17 2.24 0.00 0.45 - 0.07 0.89 3.65
FY18 4.61 0.06 0.94 - 0.08 1.85 7.53
FY19 4.76 0.12 0.99 - 0.08 1.95 7.90
The pipeline tariff for FY17 is given by
Allowable Revenue in FY17
Pipeline Tariff, FY17 =
=
Volume in FY17
R3.65m
275 million litres
= 1.33 cents/litre
We show the tariff path and throughput volume for the pipeline in Table 31 and Figure 5.
16 Tariff methodology for the setting of pipeline tariffs in the petroleum pipelines industry, Version 7, Approved 29 October 2015
Return on Return on
Assets Working
Capital
Depreciation and
Amortisation
Operating Costs Decommissioning Tax
Total Allowable Revenue

29
Volume million litres
Allowable Tariff cents/litre
Revenue R’m
FY1
5
FY1
6
FY1
7
FY1
8
FY1
9
FY2
0
FY2
1
FY2
2
FY2
3
FY2
4
FY2
5
FY2
6
FY2
7
FY2
8
FY2
9
FY3
0
FY3
1
FY3
2
FY3
3
FY3
4
FY3
5
FY3
6
FY3
7
Table 31 Tariff for the pipeline using the rate-of-return method
FY17 275 3.65 1.33
FY18 550 7.53 1.37
FY19 550 7.90 1.44
Volumes ROR
5
600
4.5
4
500
3.5
3
400
2.5 300
2
1.5
200
1
0.5
100
0 0
Figure 5: Tariff path and expected throughput for the pipeline
10 Conclusion and request for Approval and Setting of Tariffs
This tariff application is for loading, storage and pipeline tariffs to be charged by Burgan Cape Terminals.
For the loading and the storage facility we have made the case for NERSA to approve multi-year tariffs
starting from FY17 to FY19, based on the levelised IOC methodology. For the pipeline we have made the
case for NERSA to set a multi-year tariff for the period FY17 to FY19, based on the ROR methodology.
The terminal facilities have been operational since mid 2017 and will be operating up to the full capacity
of 1 000 million litres per year by 2018.
Burgan requests that NERSA approve the loading and storage tariffs, and sets the pipeline tariff as
follows:
10.1 Request for approval of the tariff for loading
For the marine loading facility Burgan requests that NERSA approve the maximum tariff for the FY17
period (1 January 2017 to 31 December 2017) of 1.47 cents/litre. Burgan further requests the approval
of an inflationary mechanism for future tariff periods up to FY19 as follows:
Vo
lum
e m
illio
n li
tres
/an
nu
m
Tari
ff (c
ents
/lit
re)

30
CP/
CP/
Tariff FYn = Tariff FYn-1×KCPI,n
The inflationary factor KCPI,n will be determined by dividing the CPI index value for the ninth month in
FYn-1 by the CPI index value twelve months prior. The inflationary factor KCPI,n and therefore the
tariff for FYn is thus known in the 10th month of the financial year prior to the new financial year
beginning.
This is illustrated by way of example as follows:
Assuming the financial year ends in December
Tariff determination for FY18 i.e. the period 1 January 2018 to 31 December 2018
CP/30 Sep 2017
Tariff FY 18 = Tariff FY17×
30 Sep 2016
CP/30 Sep 2017 will be published by STATSSA before the end of October 2017.
10.2 Request for approval of the tariff for storage
For the storage facility Burgan requests that NERSA approve the maximum tariff for the FY17 period (1
January 2017 to 31 December 2017) of 23.01 cents/litre. Burgan further requests the approval of an
inflationary mechanism for future tariff periods up to FY19 as follows:
Tariff FYn = Tariff FYn-1×KCPI,n
The inflationary factor KCPI,n will be determined by dividing the CPI index value for the ninth month in
FYn-1 by the CPI index value twelve months prior. The inflationary factor KCPI,n and therefore the
tariff for FYn is thus known in the 10th month of the financial year prior to the new financial year
beginning.
This is illustrated by way of example as follows:
Assuming the financial year ends in December
Tariff determination for FY18 i.e. the period 1 January 2018 to 31 December 2018
CP/30 Sep 2017
Tariff FY18 = Tariff FY17×
30 Sep 2016
CP/30 Sep 2017 will be published by STATSSA before the end of October 2017.
10.3 Request for setting of the pipeline tariff
Burgan requests that NERSA set a three-year tariff for the pipeline as set out in Table 31 above.
11 Appendix A
11.1 Economic Indicators
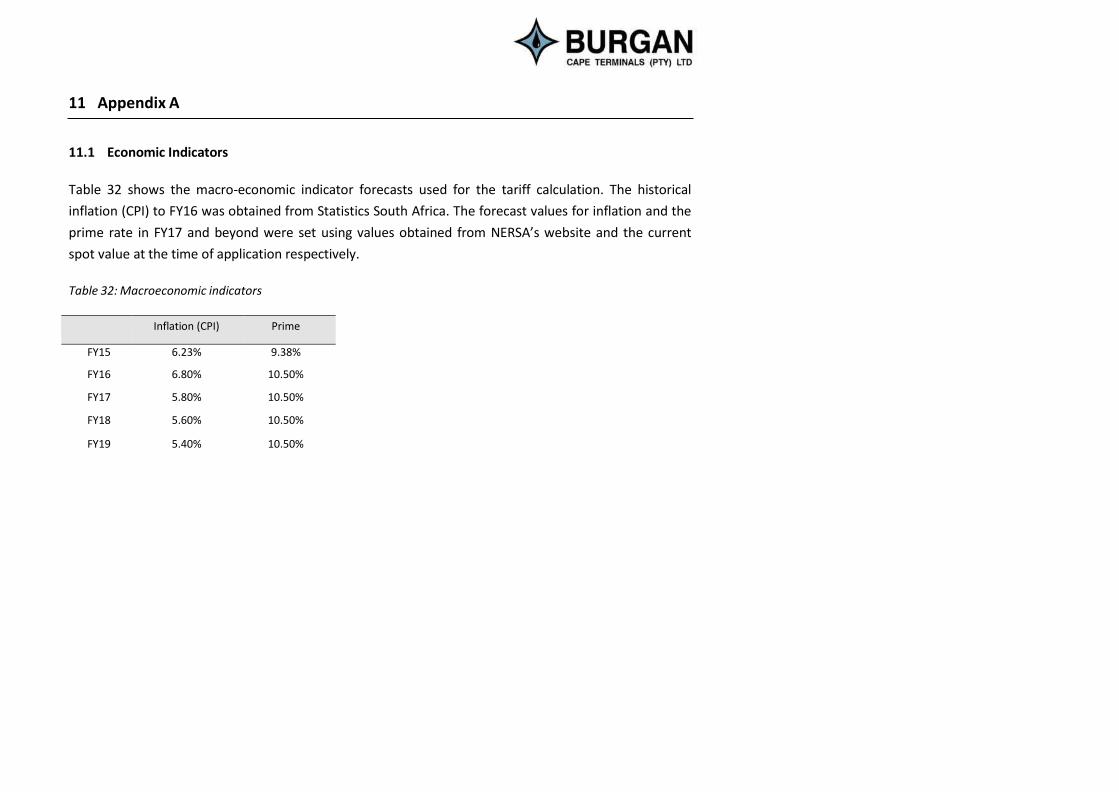
Table 32 shows the macro-economic indicator forecasts used for the tariff calculation. The historical
inflation (CPI) to FY16 was obtained from Statistics South Africa. The forecast values for inflation and the
prime rate in FY17 and beyond were set using values obtained from NERSA’s website and the current
spot value at the time of application respectively.
Table 32: Macroeconomic indicators
Inflation (CPI) Prime
FY15 6.23% 9.38%
FY16 6.80% 10.50%
FY17 5.80% 10.50%
FY18 5.60% 10.50%
FY19 5.40% 10.50%

11.2 Capital Expenditure and allocation per facility
Ref 1 Ref 2 Description Storage Loading Pipeline 2014 2015 2016 2017 1.0 100 Project Management Team 94.78% 2.57% 2.65% R - R 3 415 753 R 13 811 226 R 6 660 000 2.0 200 Flight Tickets - International 94.78% 2.57% 2.65% R - R 504 342 R 406 004 R 250 000 3.0 300 Flight Tickets - Local 94.78% 2.57% 2.65% R - R - R 5 190 R 10 000 4.0 400 Lodging / House Rental 94.78% 2.57% 2.65% R - R - R 816 967 R 12 154 5.0 500 Car Rental / Purchase 94.78% 2.57% 2.65% R - R 16 588 R 188 931 R 60 000 6.0 600 Visa Cost 94.78% 2.57% 2.65% R - R - R 390 R - 7.0 700 Transfers 94.78% 2.57% 2.65% R - R 6 289 R 5 650 R - 8.0 800 Laptops / Desktops 94.78% 2.57% 2.65% R - R - R 177 348 R - 9.0 900 Office Cost 94.78% 2.57% 2.65% R - R 57 920 R 373 028 R 180 000
10.0 1000 3G Cards and Phones 94.78% 2.57% 2.65% R - R 8 849 R 221 400 R 60 000 11.0 1100 Communication (VHF etc.) 94.78% 2.57% 2.65% R - R - R - R 360 000 12.0 1200 Training of Team 94.78% 2.57% 2.65% R - R - R - R 350 000 13.0 1300 General Cost 94.78% 2.57% 2.65% R - R - R 184 610 R 60 000 14.0 1400 VTTI Overhead 94.78% 2.57% 2.65% R - R - R 2 418 859 R 325 000 15.0 1500 ICT Cost - General 94.78% 2.57% 2.65% R - R - R 227 677 R 950 000 16.0 1600 General Operating Cost (Team Building etc.) 94.78% 2.57% 2.65% R - R - R 323 445 R 270 000 17.0 1700 Engineering Support 94.78% 2.57% 2.65% R - R 1 280 149 R 1 524 125 R 740 000 18.0 1800 Commissioning Support 94.78% 2.57% 2.65% R - R - R - R 600 000 19.0 1900 BMT Cost for Marine Study 94.78% 2.57% 2.65% R - R - R 3 014 531 R - 20.0 2000 3rd Party Inspection 94.78% 2.57% 2.65% R - R 61 000 R 3 798 964 R 1 500 000 21.0 2100 CAR 94.78% 2.57% 2.65% R - R - R 2 781 374 R - 22.0 2200 Geldof Option 94.78% 2.57% 2.65% R - R 13 742 R 938 190 R - 23.0 2300 HAZOP 94.78% 2.57% 2.65% R - R - R 165 499 R 400 000 24.0 2400 Various 94.78% 2.57% 2.65% R - R 13 710 R 49 252 R 9 644 663 24.1 2410 - PIMS System 0 0 100% R - R - R - R 12 400 281 24.2 2420 - Vessel Loading 0 100% 0 R - R - R - R 1 377 809 25.0 2500 FEED Engg 94.78% 2.57% 2.65% R 16 797 716 R 4 959 203 R 392 974 R - 26.0 2600 Contingency 94.78% 2.57% 2.65% R - R - R 4 161 355 R 23 400 000 27.0 2700 FEC Contract 94.78% 2.57% 2.65% R - R - R 76 711 906 R - 27.0 2710 Chemie-Tech 94.78% 2.57% 2.65% R - R 30 634 580 R 397 462 767 R 128 301 198 28.0 2800 Additional Capitalised 94.78% 2.57% 2.65% R 1 579 327 R 22 381 088 R 27 638 532 R 9 000 000
32


