
BUCKLING AND ULTIMATE LOADS
FOR PLATE GIRDER WEB PLATES
UNDER EDGE LOADING
FRITZ ENGINEERING[ABORATORY LIBRARY
by
Theodore W. Bossert·
and.
Alexis Ostapenko
Fritz Engineering Labo~atory
Department of Civil EngineeringLehigh University
Bethlehem, Pennsylvania
June 1967
Fritz Engineering Laboratory Report No. 319.1

.'
319.1
TABLE OF CONTENTS
ABSTRACT
1. INTRODUCTION
1.1 Scope
1.2 Historical Background
1.3 General Review of the Problem andSummary of the Investigation
2 .. DESCRIPTION OF TESTS
2.1 Description of Test Specimens
2.2 Instrumentation
2.3 Test Set-ups and .Loads
2.4 Testing Procedure
3. THEORY
3.1 Introduction
3.2 Finite Difference Operators for thePlane Stress Analysis
3.3 Stress Function Values for Mesh Pointson the Plate Edge
3.4 Relation of Boundary Stress FunctionValues and Finite Difference Operator
3.5 Determination of Stresses
3.6 Buckling Analysis and Finite DifferenceOperators
3.7 Boundary Conditions
1
2
2
3
4
7
7
8
11
13
16
16
19
24
25
26
28
-i
319.1
4. TEST RESULTS
4.1 Material Properties
4.2 Lateral Web Deflections
4.3 Stresses in the Web Plate
4.4 Vertical Plate Girder Deflections
4.5 Ultimate Load
4.6 Failure Mechanism
4.7 Boundary Conditions
5. COMPARISON OF TEST RESULTS WITH THEORY ANDAISI SPECIFICATION
5.1 Introduction
5.2 Definitions of K Values
5.3 Presentation and Comparison of AISCSpecification and Buckling Loads
5.4 Comparison of Test Results with Theoryand the AISC Specification
5.5 Behavior of Web
5.6 Items Not Considered
5. 7 Future Work
6. SUMMARY AND CONCLUSIONS
7. ACKNOWLEDGEMENTS
8. NOMENCLATURE
9. TABLES AND FIGURES
10 . REFERENCES
29
29
30
33
36
36
37
38
39
39
39
40
42
43
45
46
47
49
50
52
97
-ii
319.1
ABSTRAcr
-1
This investigation is a study of the buckling and ultimate
strength of the web plate of a plate girder subjected to vertical
compressive load bearing through the compression flange between
transverse stiffeners. The effect of the compressive load
combined with bending and shear stresses was considered.
A computer analysis was performed to find the buckling
strength of the web plate, and the ultimate strength was found from
tests on three girders .. The ultimate loads were compared with
buckling loads and Formulas 15 and 16 of the 1961 AISC Specifi
cation.
The ultimate loads were found to be from three to four times
the buckling loads, indicating considerable post-buckling
strength. A tentative relation between the buckling and
ultimate strength was established incorporating the influence of
bending stress and aspect ratio. The investigation showed that
the factor of safety based on the AISC Specification reduces
considerably with increasing bending stress intensity.
An ultimate strength theory should be developed and more
tests performed for various bit ratios and materials.

•
319.1
1. INTRODUCTION
-2
1
•
1.1 Scope
In plate girder construction, current practice has been to
place a bearing stiffener at the location of a concentrated load
to prevent web crippling or web buckling. There are some situ
ations, however, when the exact location of an expected concen
trated load is not knownor cannot be determined. Such a situation
occurs in plate girders which support crane rails or railroad
tracks directly on top of the compression flange. Since concrete
slabs, ties, rails, etc. tend to distribute the load over the
panel, uniform loading, such as that shown in Fig. 1 is assumed:
The purpose of this investigation is to study the buckling
characteristics and ultimate strength of the web plate when it is
subjected to the loading condition described above. Figure 2
shows the web plate of a plate girder panel with the edge loads
which would correspond approximately to the loading condition in
Fig. 1. Tbe edge loads are those that would occur on a panel
under uniform moment and under vertical compression through the
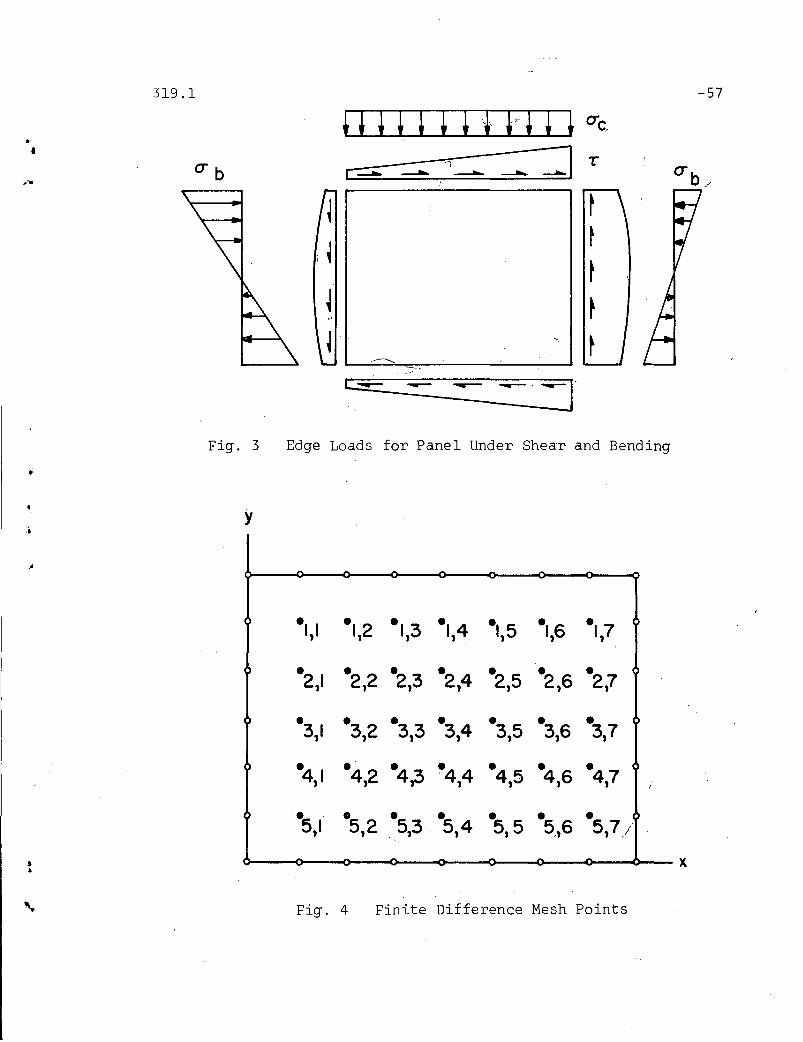
top flange. Some consideration will also be made of panels
subjected to combined moment, shear and vertical compression, as
shown in Fig. 3 .

319.1
In this paper, the resuits of the ultimate strength tests
and the buckling analysis of the web plate under the loading
-3
,
condition shown in Fig. 2 are presented to see what relation, if
an% exists between linear buckling theory and the ultimate
strength of the panel. In the tests, the loads shown in Fig. 2
were approximated'on panels of various aspect ratios. The z value
was also varied throughout the test series. Test specimens and
methods of testing are also described.
1.2 Historical Background
A limited amount of, work has already been done on the buckling
characteristics of plate girder webs under the vertical compres-
sive load~ but no test data have been published so far. Wilkesmann,
K18ppel, Wagemann, and Warkenthin have done some buckling analyses
using energy methods.(1)(2)(3) In Japan, buckling stresses for
simply supported plates have been analyzed in connection with
ship structures by Yoshiki, Ando, Yamamoto and Kawai.(4)
The American Institute of Steel Construction issued in 1961
a specification which incorporated provisions for plate girders
under loads applied between transverse stiffeners~5)These provi-
sions are based on an approximate buckling analysis developed by
Basler.(6) However, in his analysis, no con~ideration was given
to bending or shear on the plate panel. Only compressive load
applied through the compression'flange was,. taken into account.
319.1
No other specifications have been introduced to limit vertical
compressive stress on a plate girder panel acting through the.
compression flange.
-4
1.3 General Review of the Problem and Summary of the Investigation
The investigation consisted of two major phases, a theoret-
ical analysis of the buckling behavior of rectangular web plates,
and a test program of plate girder panels to determine the
ultimate capacity.
The theoretical work was mainly concerned with the buckling
behavior of the web plate under the loading shown in Fig. 2. It
was assumed that shear stresses on the vertical edges of the web
plate were uniform over the depth of the web and that the flange
took no transverse shear. This assumption allowed the analysis
of the web plate to be independent of tfie relative sizes of the
flange and web plates. The computer program developed for the
analysis can handle other loading conditions as well, for example,
the one shown in Fig. 3.
In the panel shown in Fig. 2, the parameter z is the ratio
of the maximum compressive bending stress, crb' to the vertical
compressive stress, cr. During the analysis of a web plate underc.
a particular edge loading distribution, the loads are assumed to be
proportional, and the critical load is assumed to be that value
of cr which, together with proportional bending and shear loads,c

319.1
causes the plate to buckle. The buckling coefficient was
determined for various values of z and the aspect ratio of the
plate panel, a. The relationship between the buckling coeffi-
cient, k,and the buckling stress is
-5
2TT.E k ( 1.1)
where
E = modulus of elasticity
\) = PoissonTs ratio
t = plate thickness
b = vertical dimension of the plate
To see what relationship, if any, exists between buckling
and ultimate strengths of .web plates of plate girders, ten tests
on three plate girders were conducted during the fall of 1966 and
the winter of 1966-1967. The primary purpose of these tests was
to determine the following:
amount of the post-buckling strength,
variation of the post-buckling strength with respect
to the two variables, z and a,
the appearance and the behavior of the failed web plate
to guide anyone desiring to formulate an ultimate
strength theory for web plates under this type of
loading.

319.1 -6
-.
The secondary purposes were to find out how the failure of the
web panel affects the overall behavior of the plate girder, to
see what the variation of lateral deflection vs. load was,
whether or not the actual buckling loads could be verified from
the tests, and to,see how edge loading through the compression
flange affects other modes of failure typical for plate girders.
The testing program is described in more detail in the next
chapter.
S19.1
2. DESCRIPTION OF TESTS
-7
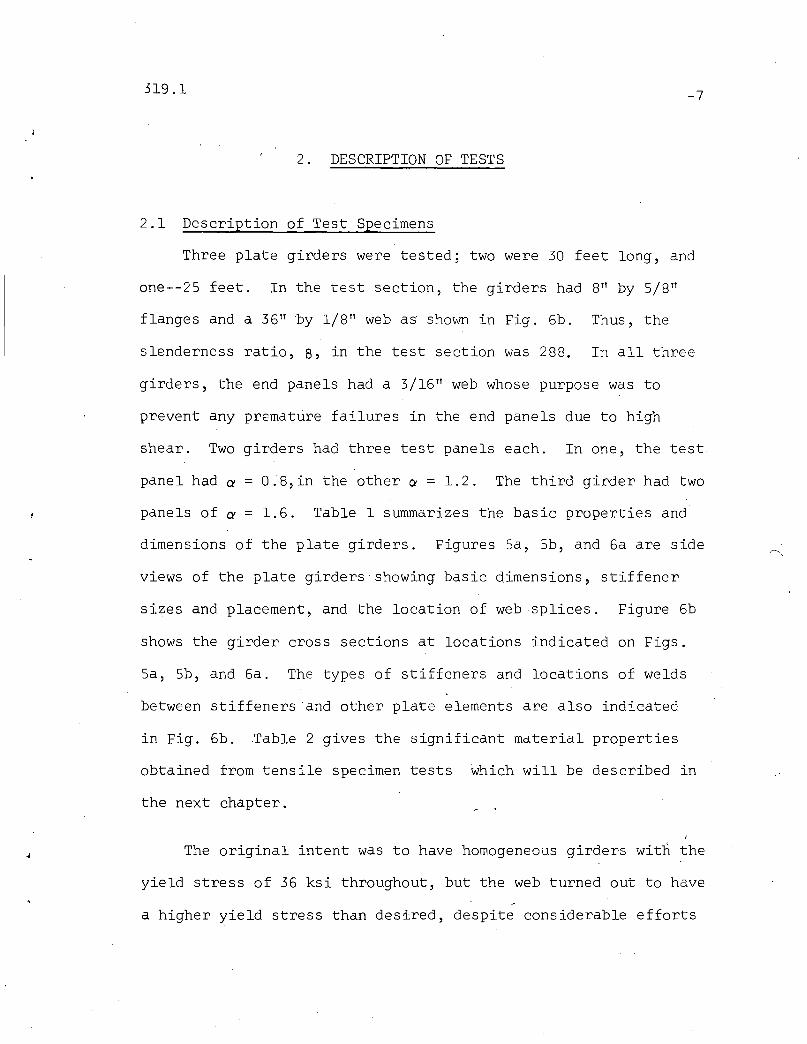
2.1 Description of Test Specimens
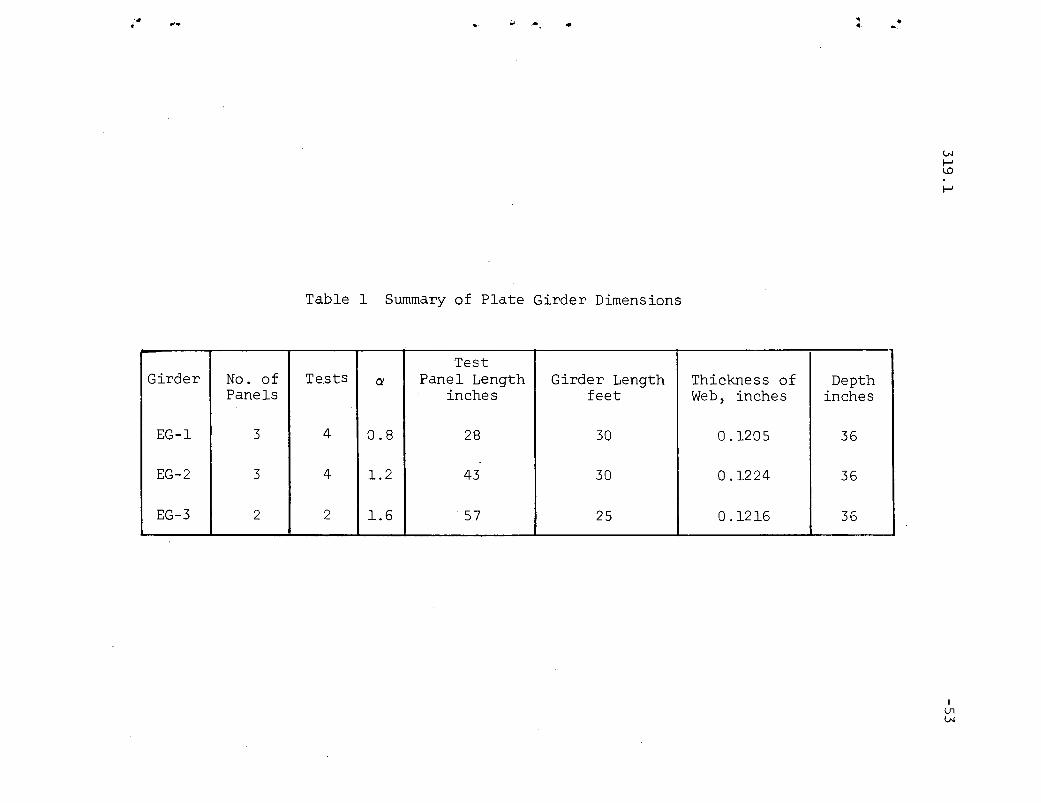
Three plate girders were tested; two were 30 feet long, and
one--25 feet. In the test section, the girders had 8t1 by 5/8 t1
flanges and a 36 Tl ·by 1/8 t1 web as shown in Fig. 6b. Thus, the
slenderness ratio, 8, in the test section was 288. In all three
girders, the end panels had a 3/16 t1 web whose purpose was to
prevent any premature failures in the end panels due to high
shear. Two girders had three test panels each. In one, the test
panel had a = 0.8,in the other a = 1.2. The third girder had two
panels of a = 1.6. Table 1 summarizes the basic properties and
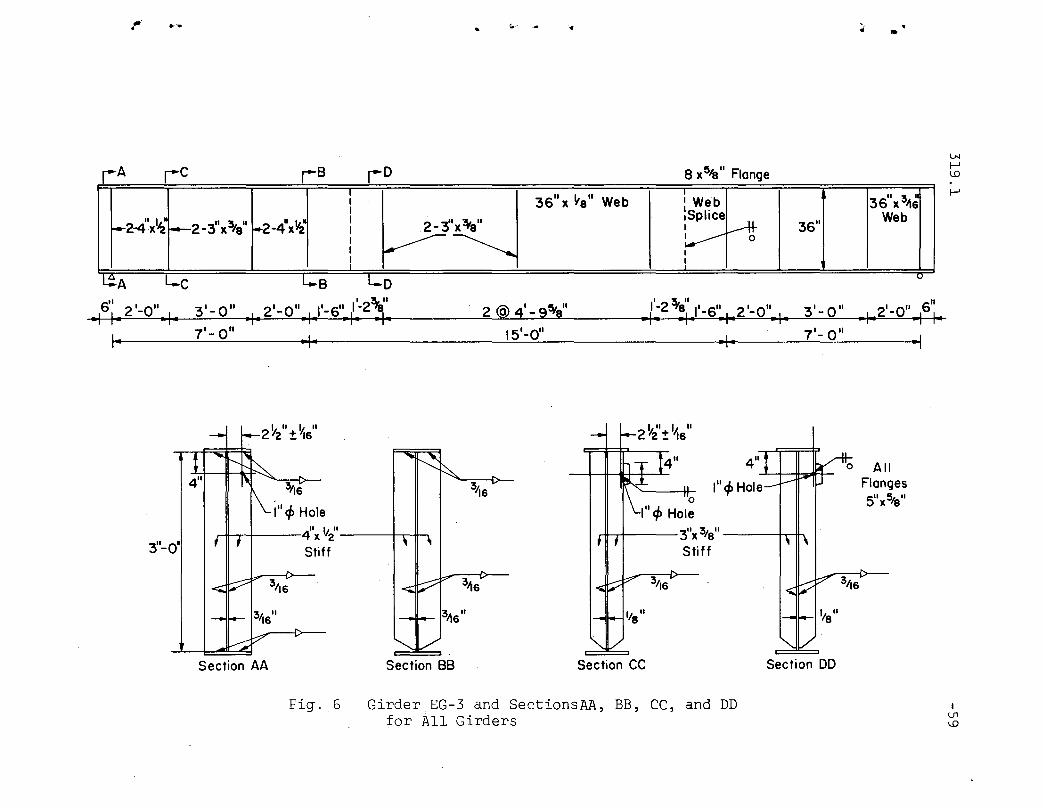
dimensions of the plate girders. Figures 5a, 5b, and 6a are side
views of the plate girders showing basic dimensions, stiffener
sizes and placement, and the location of web splices. Figure 6b
shows the girder cross sections at locations indicated on Figs.
5a, 5b, and 6a. The types of stiffeners and locations of welds
between stiffeners and other plate elements are also indicated
in Fig. 6b.Table 2 gives the significant material properties
obtained from tensile specimen tests which will be described in
the next chapter.
The original intent was to have homogeneous girders with the
yield stress of 36 ksi throughout, but the web turned out to have
a higher yield stress than desired, despite considerable efforts

319.1 -8
to match yield stresses by means of hardness tests on the plate
elements during their selection. The difference in yield
stresses between the flanges and the web produced an unfavorable
condition for panels tested under heavy bending.
The test specimens had relatively large initial web
deflections due to the slenderness of the web and a fabrication
procedure which was not as successful in preventing initial
deformations as was hoped.
2.2 Instrumentation
Instrumentation was needed to measure lateral deflections
of the web, vertical deflection of the entire plate girder, and
strains at a number of points on the girder surface. Correspond
ingly, the instrumentation consisted of a dial gage rig and strain
gages.
The dial gage rig, shown in Fig. 7, was used for measuring
web plate deflections relative to the top and bottom flanges.
It was applied at several stations along the test panel and at
some stations at neighboring panels. The rig was originally
designed to measure lateral deflections on 50 inch girders which
were tested several years ago for another project. For the 36
inch girders in these tests, it was modified to the one shown in
the figure. Figure 7 shows the dial rig in the proper position
for lateral deflection measurement. The dial gages had the finest
division of one thousandth of an inch. A set of lateral deflection
measurements was taken after each increment of load.
319.1
For strain measurement, linear SR4, A-l-SX* gages and
SR-4 AR-l* rosettes were used. The gage length of the linear
-9
gages was 13/16 inch, for the rosettes--3/4 inch. The estimated
accuracy for this type of gage is about 1%. Most of the gages
and rosettes were placed so that edge stresses in the panels
could be measured~ The most significant gages were those
at the top edge of the test panel which gave the vertical
compressive stress distribution in the web. The placement of
strain gages for typical test panels is shown in Fig. 8. Other
panels had fewer rosettes along the sides. There were also some
rosettes placed in the interior of some of the test panels to
detect the occurrence of any unusual stress conditions. The
number of gages was limited because of the expense and the limit on
the number of channels available on the strain gage indicators.
The strains were digitized by a Budd** strain gage indicator
which allowed reading of the strains directly when the unit was
switched to a particular strain gage.
The installation of the strain gages on the plate girder, and
the wiring of the gages to the indicators was a very time consum-
ing operation. In future tests this job should be started as
early as possible to avoid delays in testing.
-* Company that made gages was Baldwin-Lima-Hamilton**Manufactured by Instruments Division of Budd Company
319.1 -w
The loads were applied with Amsler* 110 kip and 55 kip jacks
which have a five inch stroke for static testing. The loads
were measured with Amsler* pendulum dynamometers which provide
both the hydraulic pumping mechanism to apply the load and a
mechanism for measuring it. The scale on the pendulum dyna
mometer can be adjusted so that when the indicator is at full
scale, the jack is exerting its full capacity. Thus, 55 kip or
110 kip jacks can be used without loss of accuracy in load
measurement.
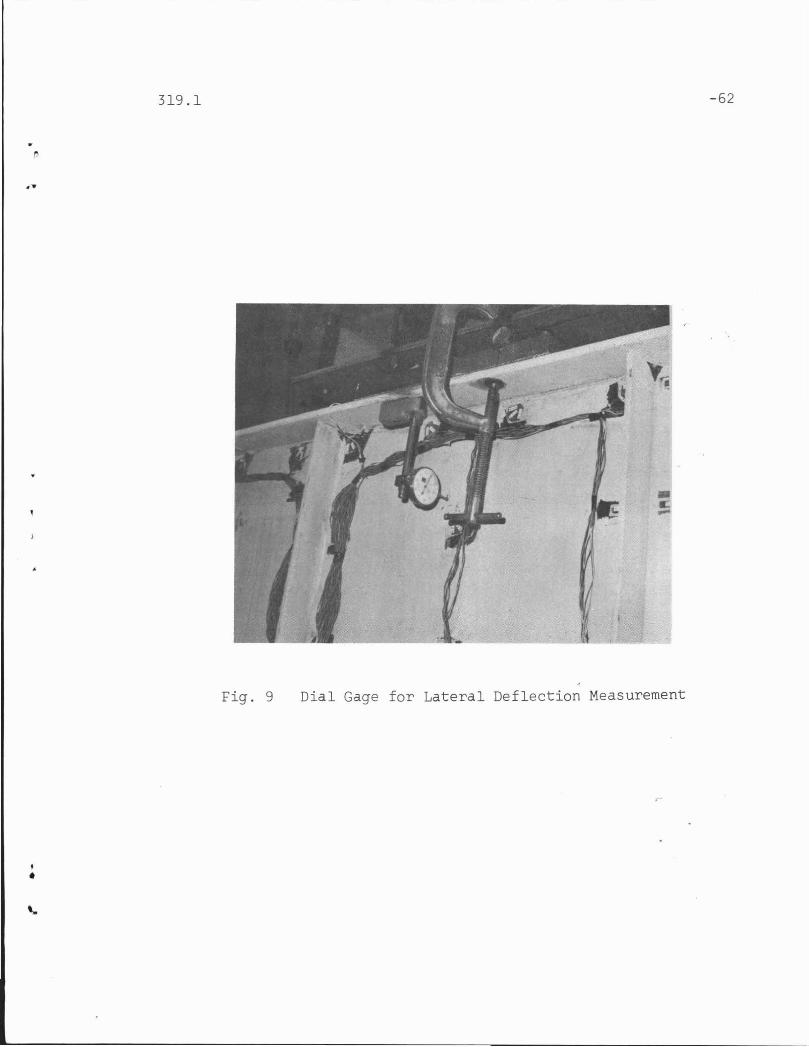
A dial gage under the girder was used to measure the vertical
deflection in order to give an indication of the overall behavior
of the girder. Also, a dial gage was mounted near the top of the
piate girder is shown in Fig. 9 to indicate the lateral movement
of the web. This gage was not necessarily an accurate measure of
the web deflection at this point, since the flange to which it
was fastened could twist. However, it was sufficiently accurate
to detect the advent of web failure. Lateral deflections were
also measured at the same point with the dial rig. Twisting of
the top flange was sometimes caused by eccentricity of the
vertical compressive load in relation to the line of the web,
and usually it was relatively sudden. To detect the flange
twisting, a level was placed on top of the flange and the
movement of the bubble observed.
*Manufactured by Alfred J. Amsler Co., Schaffhouse, Switzerland
•-, .
'.
319.1
2.3 Test Set-Ups and Loads
The basic set-ups for all of the tes'ts are shown schemat-
-11
ically in Figs. 10, 11 and 12. All loads which were not placed
directly over the test panel were used to subject the panel to a
greater moment (and shear) than that provided by the load over
the test panel alone. In Fig. 13 are photographs of two of the
test set-ups used in the test series.
The girders were braced at each transverse stiffener against
lateral-torsional buckling of the top flange, as shown in Fig. 13b.
Despite this, some later.al buckling did occur in tests where the
flange was subjected to high stresses resulting from heavy
bending of the plate girder. The bracing consisted of pipes
fastened to the stiffeners with a hinged connection as shown in
Fig. 14. These pipes were supported at the other end by a beam,
which was bolted to columns of the building.
As was mentioned in Section 2.2, loads were applied with
Amsler hydraulic jacks acting in conjunction with Amsler
pendulum dynamometers. In some tests, two independent loads
were applied with two pendulum dynamometers so that the desired
proportions between the loads could be obtained. It was possible
and practical for one man to operate the two pendulum dynamometers
simultaneously during the period when the load was to be main-
tained at a constant level, but during loa.ding and unloading, a
separate man was needed to operate each dynamometer, since loading

319.1
of one dynamometer would unload the other because of the
deflection of the plate girder.
The load over the test panel was distributed as shown in
Figure 13, 14, and 15b. The bearing plates on the top flange
were of sufficient size to prevent local web crippling. This
did not provide an exactly uniform load distribution, but it
-12
did provide a loading situation which was somewhat more severe.
The loading mechanism also allowed all of the load to be carried
by the web so that none of it went directly into the stiffeners
at the side edgesof the panel.
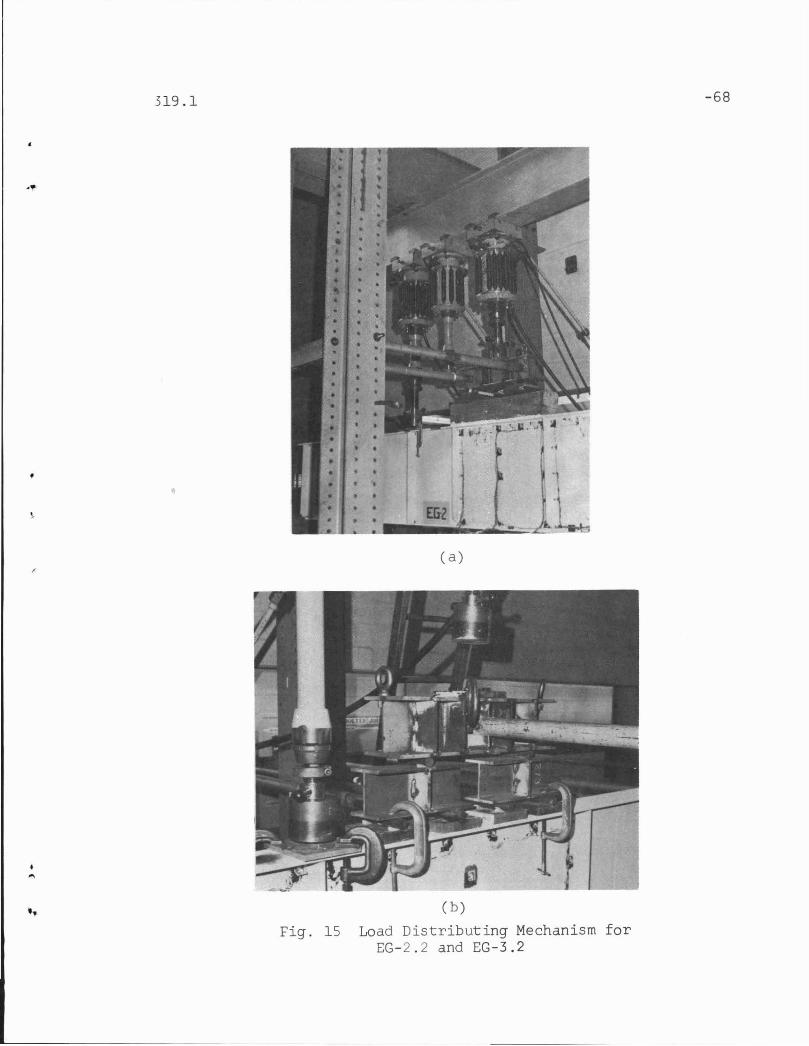
In one test, EG-2.2, a wood beam was used in an attempt to
distribute the load more evenly as shown in Fig. 15a. However,
this was found to be unsatisfactory because the beam transmitted
some of the load to the stiffeners. Also, it acted compositely
with the plate girder thus reducing the bending stress at the top
of the test panel.
It can be seen from the photographs in Fig. 15 that a brace
was needed to stabilize the load distributing mechanism. This
was necessary on all of the tests on EG-3, and in test EG-2.2.
One or two pipes were fastened to the loading beam directly under
the jack to provide stability in the load distributing mechanism
and to prevent damage to the girder if twisting of the flange
should take place.
319.1
2.4 Testing Procedure
-13
Basically, the testing procedure for all of the tests was
the same. For each test the loads were kept proportional.
First, zero readings were taken for all strain and dial gages.
To measure the initial deflections of the web a set of lateral
deflection readings was taken at the desired locations along the
girder and compared to readings on a flat machined surface.
The zero readings for each dial were subtracted from the
corresponding dial readings taken on the girder, thus giving the
lateral deflections at the points where the dial gages were
located. Upon one placement of the dial rig at a station on the
girder, the lateral deflection was measured at seven points along
a vertical line. The measurement was performed at from four to
six horizontal locations, or stations, along the test panel and
at about three to six stations outside the test panel on adjacent
panels.
After all zero strain readings and initial deflection read-
ings were taken, the first load (P = 2 kips) was applied. During
the application of the first loaj, the jacks were lined up so that
they acted directly over the center line of the web. This was
designed to reduce the possibility of twisting of the flange due
to eccentricity of the load. This operation was done by eye;
therefore there was always some uncertainty about the accuracy of
the alignment. As the test progressed, the load increment was
..
319.1
held constant at two, three, or four kips, depending on the
expected ultimate load on the panel, which could be between
30 and 55 kips, depending on the bending stress and the aspect
-14
ratio of the panel. Usuall~ when inelastic behavior was detected
in the web or in the plate girder as a whole, the load increment
was cut to one kip or one-half kip. The load then was held
constant and the reading deferred until the needle on the dial
gage measuring lateral deflection stopped moving. A 'set of
strain gage and lateral deflection readings were taken, and the
load increased by one-half kip. Usually, the dial needle would
move a few divisions during the reading, but at this point,
lateral deflections of the web were so large that this change
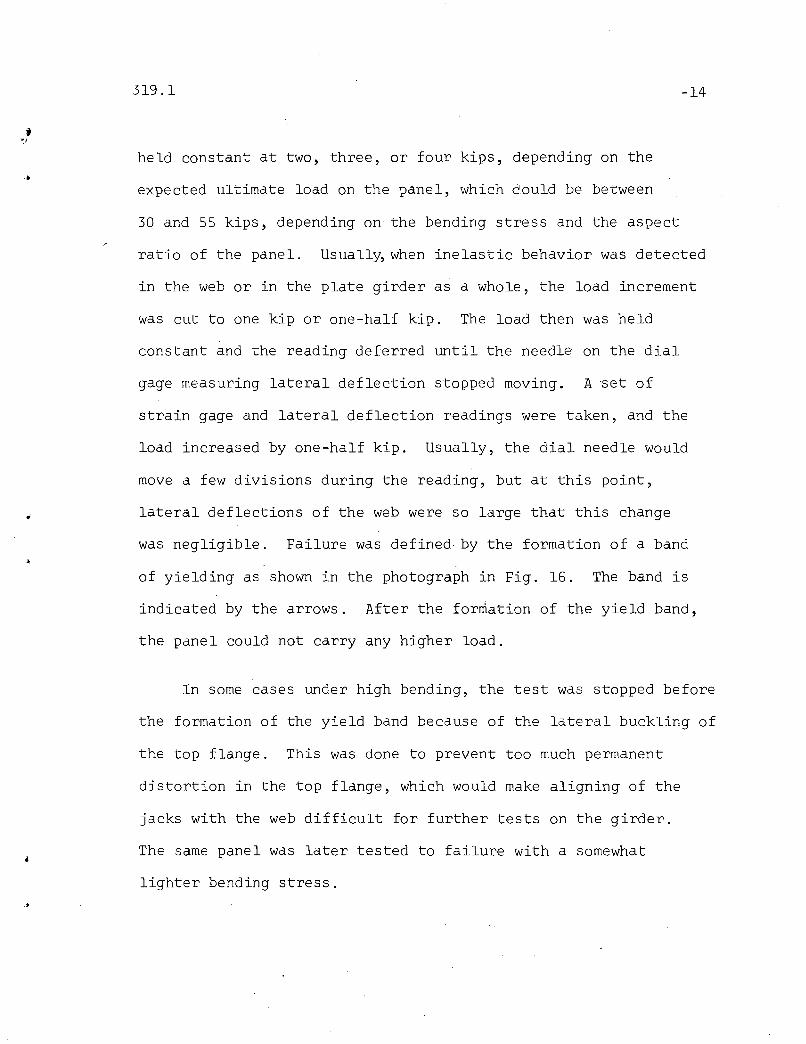
was negligible. Failure was defined by the formation of a band
of yielding as shown in the photograph in Fig. 16. The band is
indicated by the arrows. After the formation of the yield band,
the panel could not carry any higher load.
In some cases under high bending, the test was stopped before
the formation of the yield band because of the lateral buckling of
the top flange. This was done to prevent too much permanent
distortion in the top flange, which would make aligning of the
jacks with the web difficult for further tests on the girder.
The same panel was later tested to failure with a somewhat
lighter bending stress.

319.1
In most of the tests, the girder was unloaded gradually,
with sets of readings taken at ten to fifteen kip increments
in order to establish the unloading curve.
-15

319.1
3. THEORY
3.1 Introduction
In this section, an explanation of the buckling analysis
and equations used in the computer program are presented. The
first part of the chapter is devoted to the finite difference
-16
method of determining stresses in the plate due to edge loading.
In the second part of the chapter, the finite difference method
for determining the buckling coefficient from the resulting plane
stress distribution is given. In both the stress and buckling
analyses, the basic equations, the finite difference operators
and their use, the methods used for dealing with the boundary
conditions, and any necessary matrix operations are described.
3.2 Finite Difference Operators for the Plane Stress Analysis
For the purpose of analysis, the web plate panel is
subdivided into a mesh as shown in Fig. 4.
It can be shown that
(3.1)
or
(3.1a)
satisfies the equilibrium and compatibility equations associated
319.1
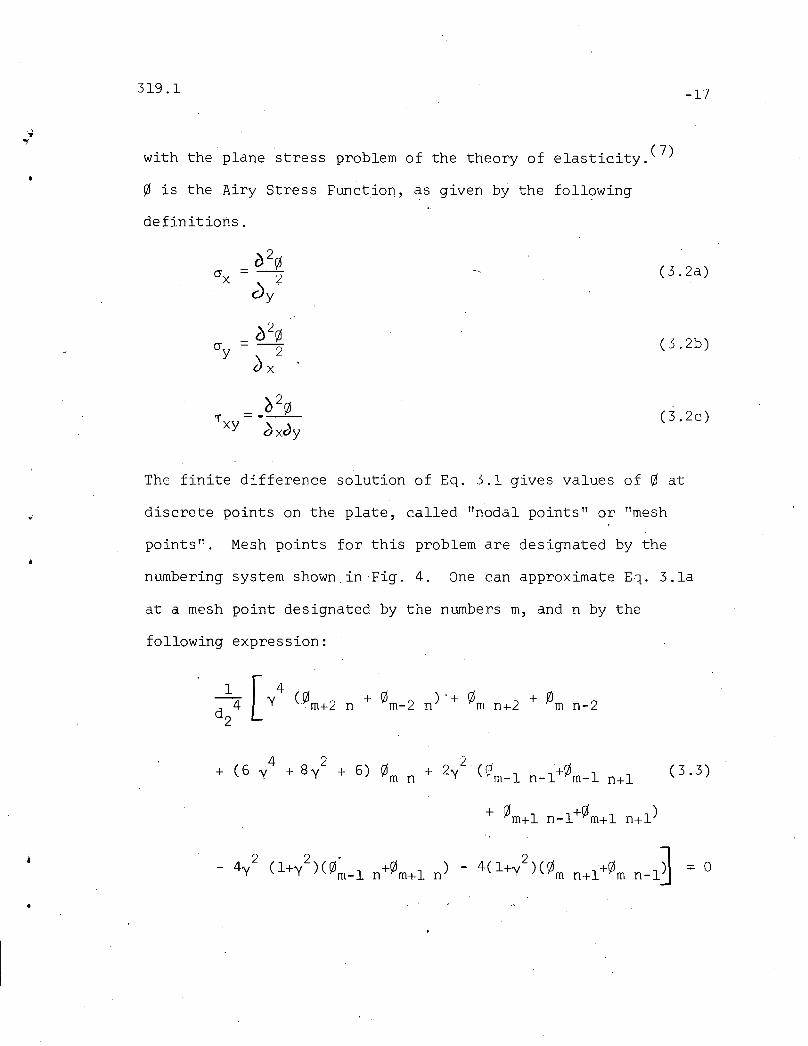
with the plane stress problem of the theory of elasticity.(7)
o is the Airy Stress Function, as given by the foll?wing
definitions.
-17
_ ~20crx --2
C)y
_ 020cry --2
;;x
_ ~20'T - ---
xy dxdy
(3.2a)
(3.2b)
(3.2c)
The finite difference solution of Eq. 3.1 gives values of 0 at
discrete points on the plate, called "nodal points" or "mesh
points". Mesh points for this problem are designated by the
numbering system shown. in Fig. 4. One can approximate El. 3.1a
at a mesh point designated by the numbers m, and n by the
following expression:
( 6 4 8 2 6) rl 2y2 (p rl+ Y + Y + ~m n + ~m-l n-l+~m-l n+l (3.3)
•
319.1
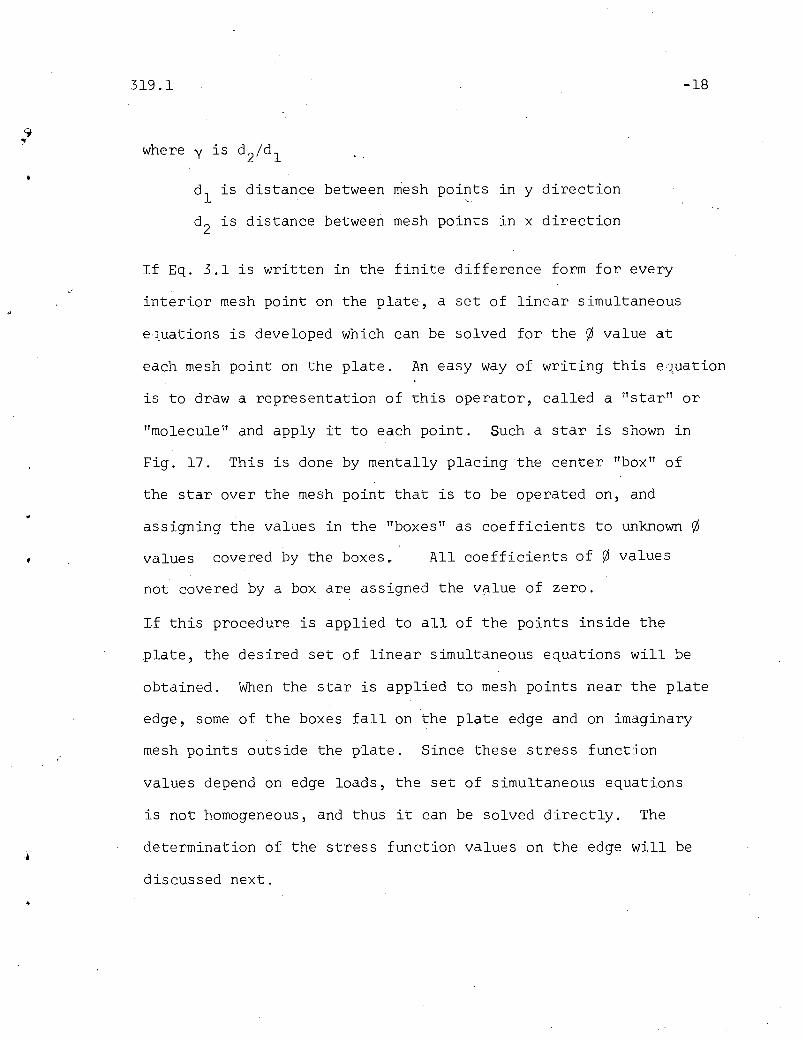
where y is d2/d l
d l is distance between mesh points in y direction
d2 is distance between mesh points in x direction
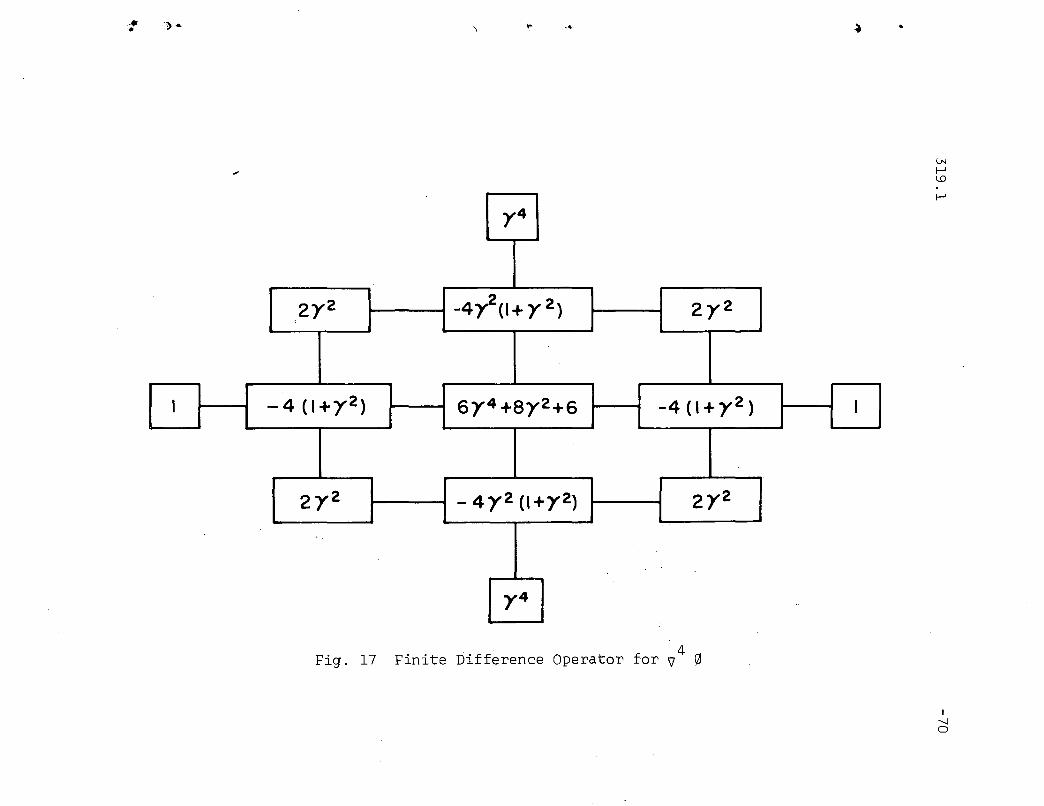
If Eq. 3.1 is written in the finite difference form for every
-18
interior mesh point on the plate, a set of linear simultaneous
e{Uations is developed which can be solved for the 0 value at
each mesh point on the plate .. An easy way of writing this e1.uation
is to draw a representation of this operator, called a "starT! or
llmolecule,T and apply it to each point. Such a star is shown in
Fig. 17. This is done by mentally placing the center llbox ll of
the star over the mesh point that is to be operated on, and
assigning the values in the llboxesT! as coefficients to unknown 0
values covered by the boxes. All coefficients of 0 values
•
not covered by a box are assigned the vqlue of zero.
If this procedure is applied to all of the points inside the
plate, the desired set of linear simultaneous equations will be
obtained. When the star is applied to mesh points near the plate
edge, some of the boxes fallon the plate edge and on imaginary
mesh points outside the plate. Since these stress function
values depend on edge loads, the set of simultaneous equations
is not homogeneous, and thus it can be solved directly. The
determination of the stress function values on the edge will be
discussed next .
.519.1
3.3 Stress Function Values for Mesh Points on the Plate Edge
Although the determination of the values at the edge is a
-19
straight forward mathematical procedure, it is somewhat tricky.
Since to the author's knowledge, it has not been described any-
where in detail, the procedure will be given in this section.
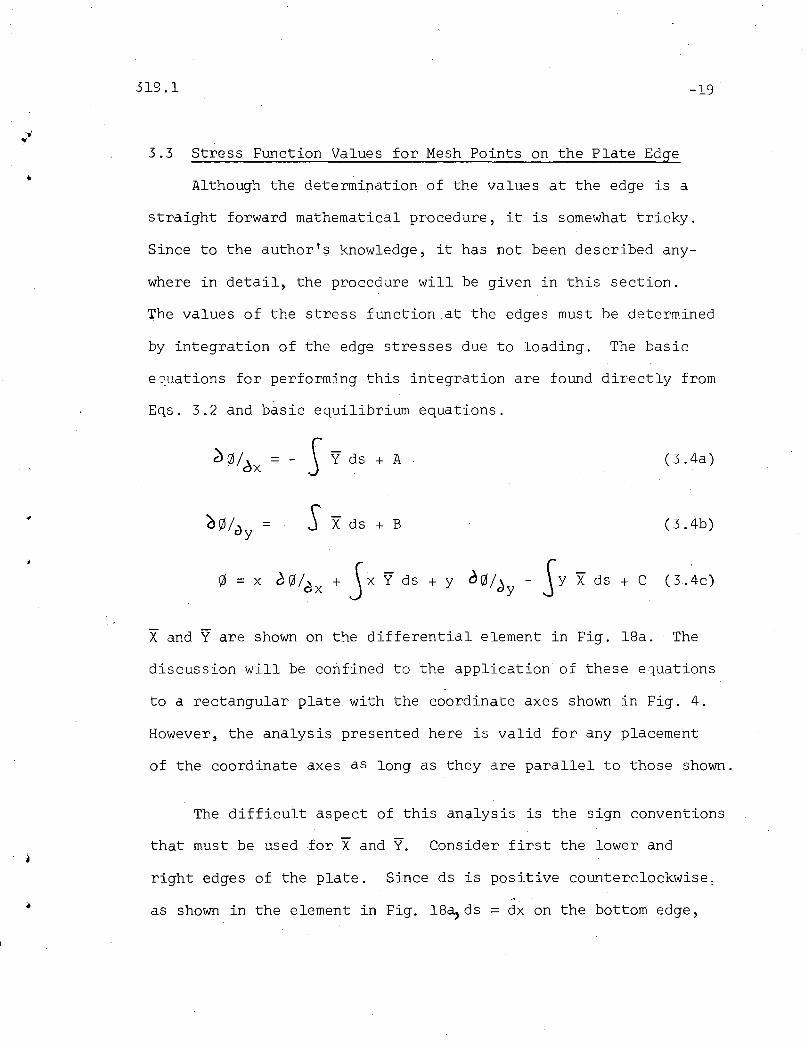
The values of the stress function at the edges must be determined
by integration of the edge stresses due to loading. The basic
eluations for performing this integration are found directly from
Eqs. 3.2 and basic equilibrium equations.
5Y ds + A
SX ds + B
(3.4a)
(3.4b)
X and Yare shown on the differential element in Fig. 18a. The
discussion will be confined to the application of these equations
to a rectangular plate with the coordinate axes shown in Fig. 4.
However, the analysis presented here is valid for any placement
of the coordinate axes as long as they are parallel to those shown.
The difficult aspect of this analysis is the sign conventions
that must be used .for X and Y. Consider first the lower and
right edges of the plate. Since ds is positive counterclockwise:
as shown in the element in Fig. 18~ds = dx on the bottom edge,

, .
.519.1
and ds = dy on the right edge of the plate.
The general expressions for X and Yare
x = crx cos (N,x) + ~xy cos (N,y)
y = cry cos (N,y) + ~xy cos (N,x)
N is the outer normal to the plate edge
-20
(3.5a)
(3.5b)
Therefore, along a bottom edge, cos (N,y) = -1, and cos (N,x) = 0;
therefore, Y - - cr and X= - ~ On the right edge, Y = ~y' xy xy
and X= cr .. Thus, Eq. 3.4a and 3.4b become:x
Bottom edge
d rjJ /Ox = - 5(-cry) dx + A; c) rjJ =c)y
c~ dx + B,~ xy
(3.6a,b)
Right edge
<l~/<lx ~ -S'Xy dy + A; orjJ = Scr dy + BOy x
(3.6c,d)
(3.7)
This is the form in which these equations were used in the
computer program. The sign convention for the stresses is shown
on the element in Fig. 18b.
Along the bottom edge, the equation for rjJ (Eq. 3.4c) becomes
~ ~ x ~~ + Jx Y dx + YSj( dx + By - Iy X dx + C

Along the lower edge, y = 0; therefore, the equation reduces to, .
319.1
o = x ~0 - JX (J dx· + Cox y
-21
(3.8)
At the right edge, dy = ds; therefore
o = - x rY.dy + A x + 5x Y dy + yO 0 - sy X dy + C (3.9)j (~y
Since x is constant along this edge,
~ = -~ + .AX +~ + Y ~~-S Y j( dy + C (3.10)
Ax +- C = D
.' Thus,
o = y d 0 - Sy (J dY + Doy x( 3 . 11)
In determining d0/ Jx' d0/ dy' and 0 at the mesh points on the
plate edge, it is desirable to locate the origin of the
coordinate axes at a. convenient starting point. The starting
point can be anywhere; thus for an" unsymmetrically loaded plate,
the lower left corner WgS chosen. However, for a symmetrically
loaded plate, -:he center line of the lower plate edge was moTe(
suitable. This way, only one-half of a symmetrically loaded
plate needs to be analyzed. The points mentioned above were
selected for ease of programming for a computer.

.319.1-22
A segment of loading is defined as a length of the plate edgeJ •
over which cr and ~ can be given as a continuous function of
distance along the edge. If both cr and ~ for a whole edge can
be expressed as one function, the length of this segment of
loading is the length of the edge. For example, in Fig. 2, the
whole top edge could be considered a single segment of loading
since all edge loads can be expressed as a single analytical
function of a distance x along the top edge. If, however, the
normal stress in the middle half of the top edge were twice that
on the remainder of the edge, the top edge would need to be
divided into three segments of loading, one over the right
quarter of the top edge, one over the middle section and one
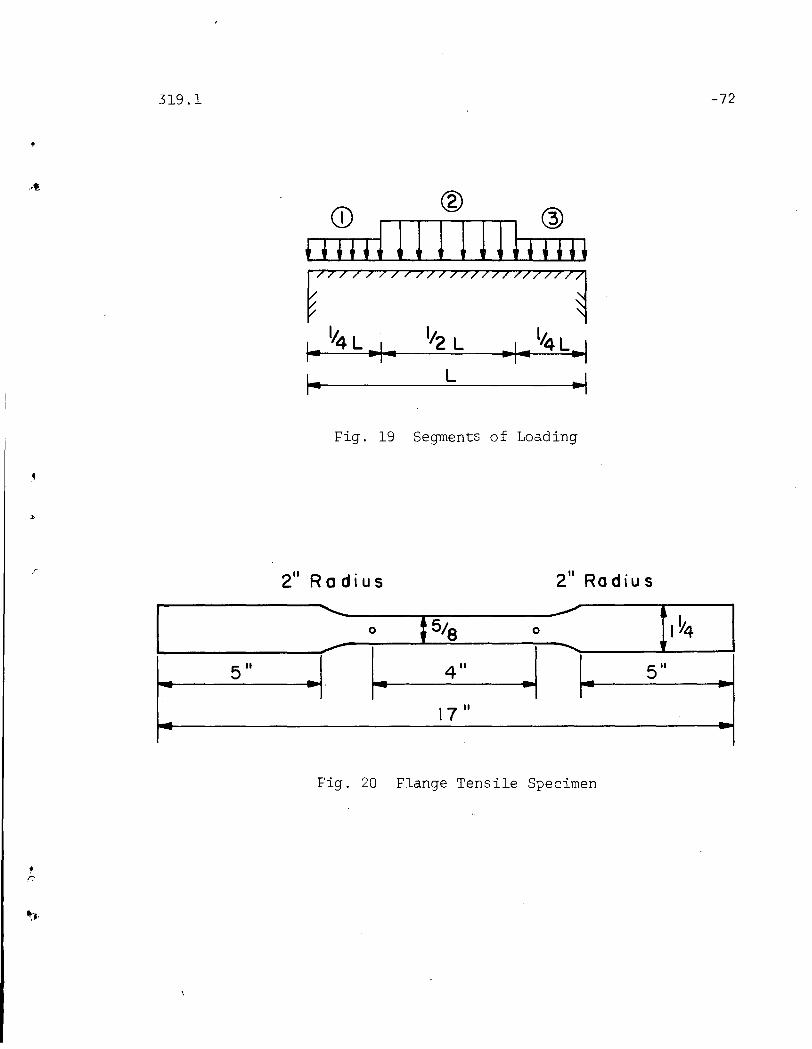
over the left quarter, as shown in Fig. 19. If there is a length.
of plate without load, this length is still considered a segment
of loading, but cr and ~ are set equal to zero.
At the starting point, A, B, and C are set equal to zero,
although they can have any arbitrary values. A function is
written for cr and~~ on the first segment of loading assuming that
the origin of coordinates is at the starting point of the segment
of loading. The integrations indicated by Eq. 3.6a and 3.6b are
performed. The values of d 0/ 6X and e-0/ dy at all mesh points
within the segment of loading can be obtained by substituting the
distance between the mesh point in question and the starting point
of the segment of loading. The 0 values for the mesh points are
then determined according to Eq. 3.8. At the end of the segment
.I •
319.1
of loading, the values of 0, d01 ~ x and d01 c)y are found and
used as integration constants A, B, and C in the next segment
of loading. For the next segment of loading, the functions to
be integrated are written using the beginning of this new seg
ment of loading as the new origin of coordinates. The values
of 0, J010x and o0/dy are determined in the same way as
-23
before, remembering that the constants A, B, and C must be added
according to Eqs. 3.6a, 3.6b and 3.8. When the first corner
(the lower right corner) is reached, the analyst proceeds as if
he had reached the end of a segment of loading except that Eq.
3.6c, 3.6d and 3.11 instead of Eq. 3.6a, 3.6b and 3.8 are used to
determine the 0, J01 oX, and J01 dY values. At the corner the
constants D, A, and B are set equal to 0, ~01Jx and 'd01 dY,
respectively.
Upon reaching the upper right corner, a transformation of
the original coordinate axes is made in order to allow are-use
of the procedure just described fqr the two other edges. One can
visualize a three dimensional plot of 0 with respect to x and y.
This can be thought of as a surface over the plate with a slope
~ 01 ~ x in the x direction and slope () 01 d y in the y direction.
If the axes were rotated 180 degres3, 0 would remain unaffected
with respect to the rotated axes, and the values of 6 01 () x and
00/ c.y would be changed only in sign. Thus, the process of
finding the values of 0, d 01 ox and 0 0/'d y at the mesh points on
the top plate edge can be continued by rotating the plate with
J ..
319.1
respect to the axes 180 degrees so that the top right corner
becomes the lower left corner. Thus,the top edge becomes the
lower edge, and the left edge becomes the right edge, and the
-24
analysis can be continued as if it were started on a new plate.
The constants A, B, and C are set equal to - ~ r/J/ C. x, - 6 r/J/ c'> y
and + r/J found in the previous step at the former top corner of
the plate. The procedure is continued until all remaining
stress function values and derivatives are determined. Since
the derivatives at the mesh points on the top and left edges of
the plate are desired in terms, of the' original coordinate axes,
the signs of ~ r/J/ J x and ~ r/J/ ay found using the rotated axes
must be changed. The signs of r/J itself remain the same.
3.4 Relation of Boundary Stress Function Values and FiniteDifference Operator 9 4 r/J = 0
It was mentioned before that the finite difference operator
would have Tlboxes lt which would fallon boundary points and on
fictitious mesh points outside the plate. For points on the
boundary, the r/J values are merely multiplied by the coefficient
inside the box and added to form the nonhomogeneous constant term in
the equation. For points outside the plate the values of r/J must
be found.
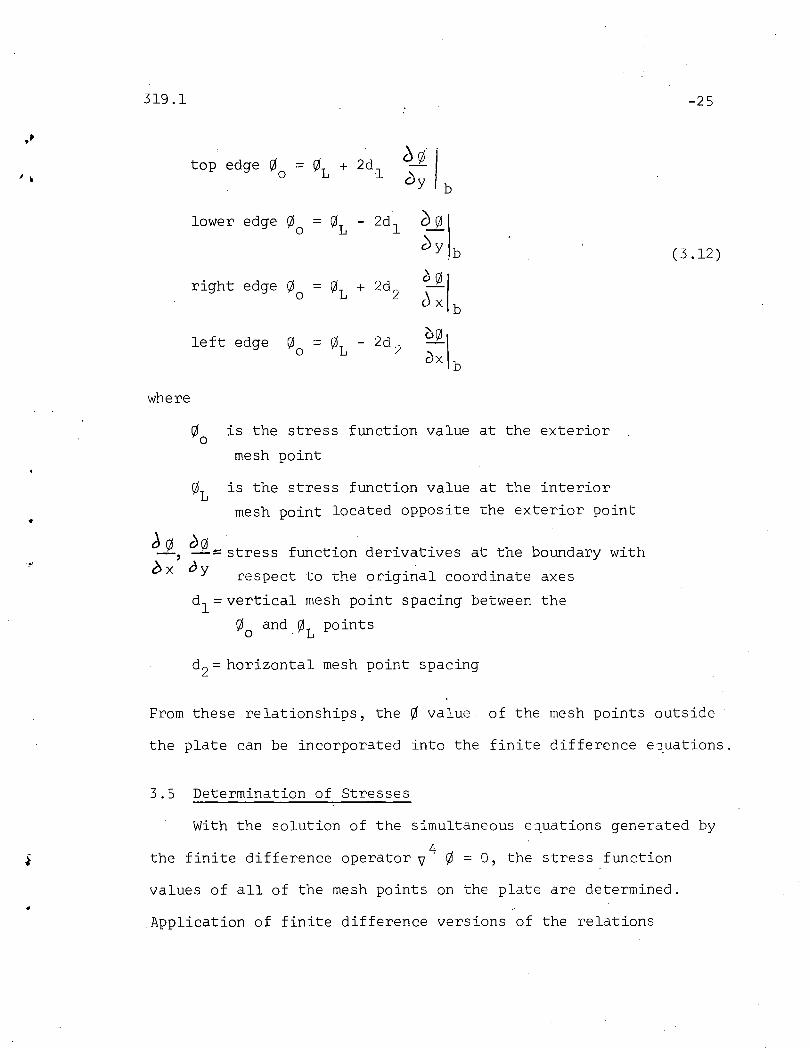
f It is assumed that the r/J surface is continuous over the plate
edge. Then the relationship between the r/J'value at a point
outside the plate and the r/J value at the nearest interior mesh
point can be established from finite differences as:
, ..
319.1
top edge 00
= 0L + 2d1
where
n is the stress function value at the exterior'Pomesh point
0L is the stress function value at the interior
mesh point located opposite the exterior point
-25
(3.12 )
derivatives at the boundary withJ ~. ..1, 1=: stress function
ox 0 y respect to the original coordinate
dl = vertical mesh point spacing between
00
and.0 L points
d2 = horizontal mesh point spacing
axes
the
From these relationships, the 0 value of the mesh points outside
the plate can be incorporated into the finite difference equations.
3.5 Determination of Stresses
With the solution of the simultaneous equations generated by
the finite difference operator v4 0 = 0, the stress function
values of all of the mesh points on the plate are determined.
Application of finite difference versions of the relations
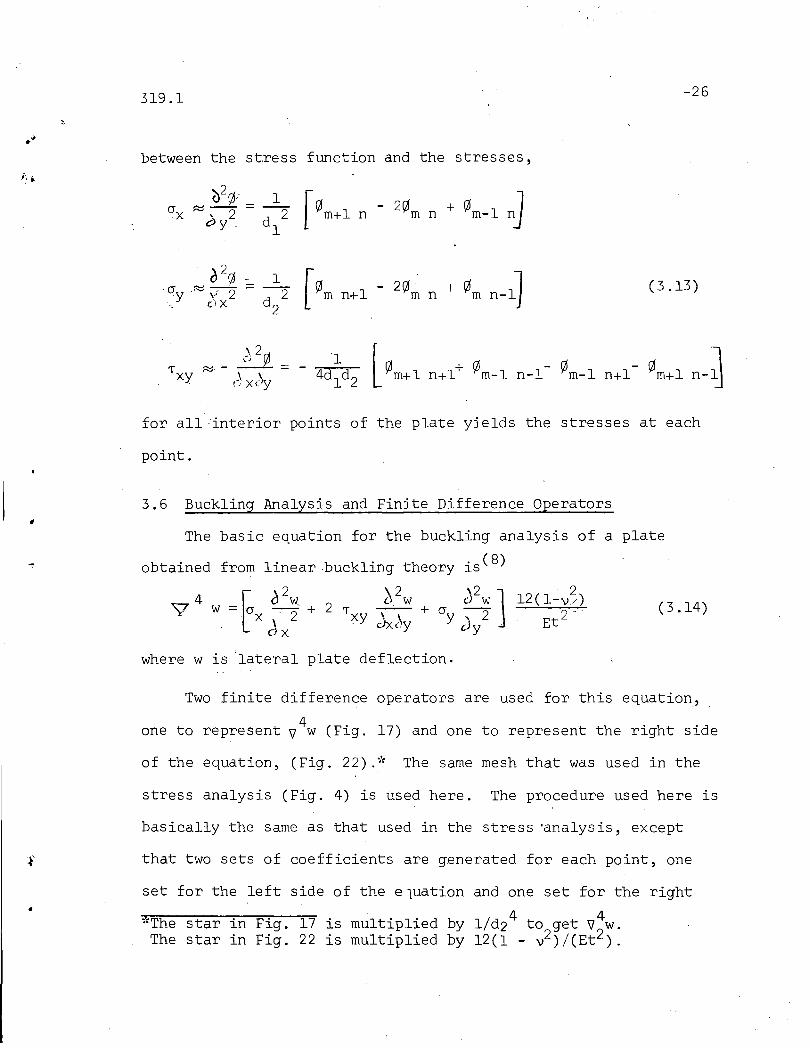
319.1
between the st,ress function and the stresses,
{)2(}, _ 1 r0m+l n- 2(j + 0m- l n]o-x ~::--2- -2 m nc>y_ dl
~2(j -=- 1[¢m n+l - 2¢m + (jm n-l)'0- .~ \T2 - d2 n,y
(; x2
-26
(3.13 )
), 2~'-' 'fJ
'T xy ~, - () X{~y =
for all interior points of the plate yields the stresses at each
point.
3.6 Buckling Analysis and Finite Difference Operators•
The basic equation for the buckling analysis of a plate
- obtained from linear buckling theory . (8)lS
- d2 J2w J2" ]
. 2'9'4 t W 2
12( 1-\1/) (3.14)w,=.,O-x)2+ 'T --+0---Et 2xy Jy}y Y J y
2 .ex
where w is 'lateral plate deflection.
Two finite difference operators are used for this equation,
one to represent v4w (Fig. 17) and one to represent the right side
of the equation, (Fig. 22).* The same mesh that was used in the
stress analysis (Fig. 4) is used here. The procedure used here is
basically the same as that used in the stress 'analysis, except
that two sets of coefficients are generated for each point, one
set for the left side of the e1uation and one set for the right
*The star in Fig. 17 is multiplied by ljd24 to get v;w.The star in Fig. 22 is multiplied by 12(1 - v2)j(Et ).

319.1 -27
side. In this manner, a set of homogeneous simultaneous equations
is generated. These equations are functions of the lateral
deflection wand the stresses.
In Section 1.3 the stipulation was made that all edge
stresses were a linear function of the edge compressive load, ~ .c
Since the ITboxes IT of the operator representing the right side 0 f
the buckling equation are linear functions of the stresses, they
are also linear functions of ~c. Therefore, the set of equations
will have the matrix form:
(3.15 )
U is the matrix of coefficients generated by the4operator \1 w
V is the matrix generated by the operator of the right
side of the equation
wis the deflection vector
Equation 3.15 is re-arranged into the following form which is then
solved by iteration:
The largest eigenvalue of the matrix [u -1] [v]giVeS the lowest
non-zero value of the ~ stress. This value of ~ is the desiredc . c
buckling stress.

319.1 -28
..
J
3.7 Boundary Conditions
As in the stress analysis, some of the boxes of the operators
fallon points on the outside of the plate edge. The boundary
conditions considered in the situation at hand were either a
fixed edge or a simply supported edge. For simply supported
edges, fictitious points outside the edge have a deflection
equal in magnitude and opposite in sign to the adjacent mesh
points inside the plate. For fixed edges, the deflections at
both the inside and outside points are equal in magnitude and
sign. These two conditions were incorporated into the finite
difference operations.
For the present analysis, the boundary conditions assumed
were the following:
Case 1. All edges simply supported
Case 2. Top edge fixed, all others simply supported.
.319.1
4. TEST RESULTS
-29
4.1 Material Properties
Three coupons from each flange plate and five coupons from
each web were tested to determine the yield stresses and other
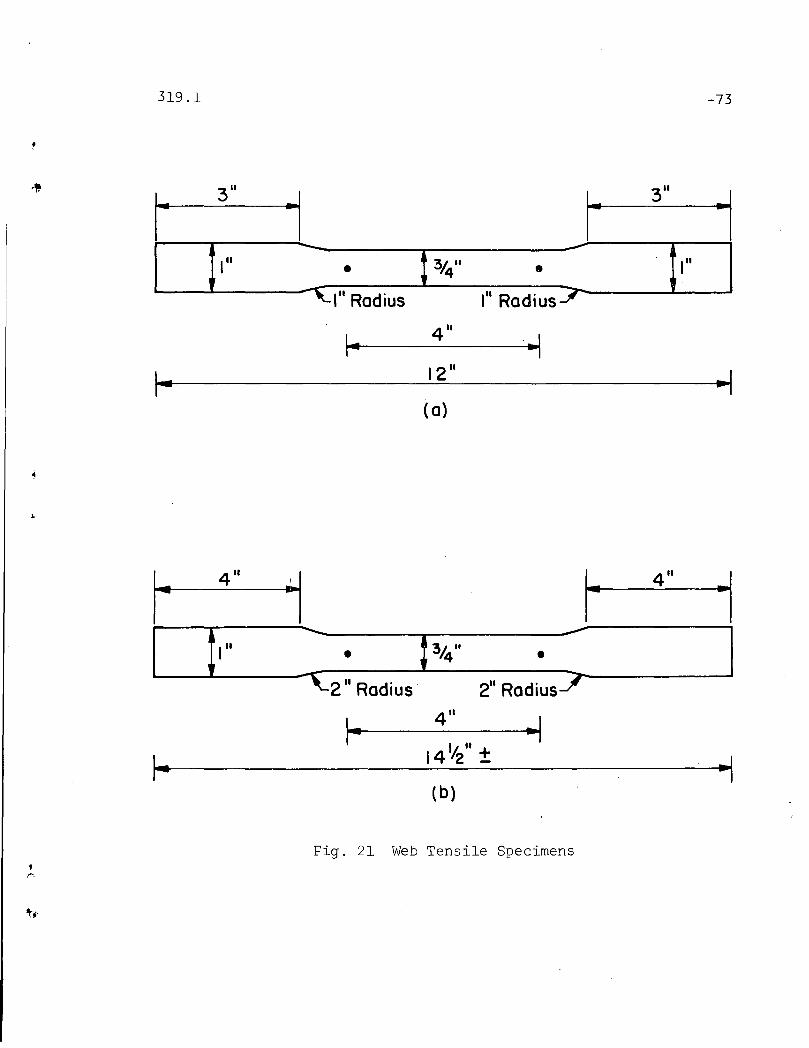
material properties; Figure 20 shows the shape and dimensions
of the flange coupons. Figures 21a and 21b show coupons from
the web cut in the vertical and horizontal directions, respec
tively. All coupons had a four inch gage length.
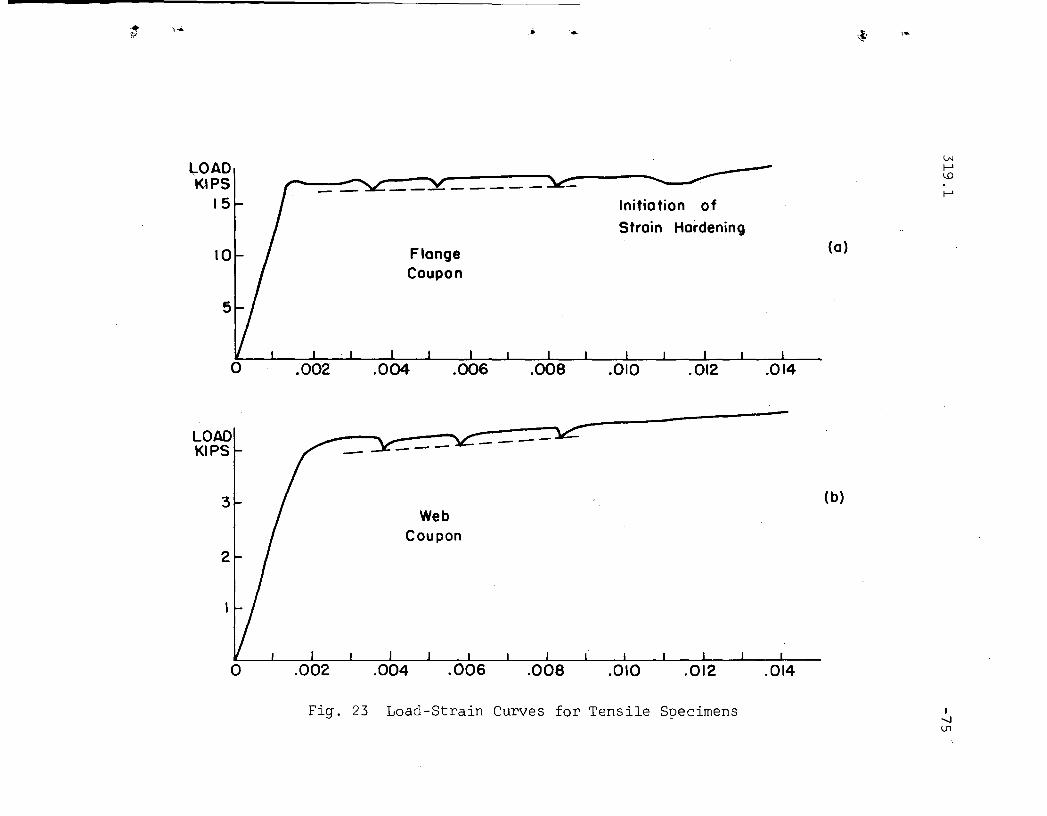
The results of the coupon tests are shown in Table 2. The
coupons taken from the flanges behaved in a fashion typical for
mild structural steel, as shown in Fig. 23a. A definite hori
zontal plateau followed by strain hardening should be noted.
However, web coupons behaved as shown in Fig. 23b, displaying no
flat yield plateau. The static yield load was taken to be the
intersection of two straight lines, one parallel to the elastic
portion of the load-strain curve s~arting at 0.002in/in on the
strain axis, and the line determined by the lower kink points,
which are found by stopping the deformation during a coupon test
and l~tting the load settle down to a static value (see Fig. 23b).
The lower values of the percent elongation for web coupons should
be also noted. Each value represents an average from at least
two coupon tests.

319.1
The results show that the web yield stresses were higher
than the flange yield stresses. This was an undesirable
-30
condition since it limited the value of z that could be used in
tests.
4.2 Lateral Web Deflections
The lateral web deflection pattern is of interest for
studies on the ultimate and fatigue strength of plate girders.
Two important considerations are discussed here, the variation
of the lateral deflection at a point with the load, and the shape
of the deflected plate.
For panels under light bending, z ~ 1, the deflection curves
have very little curvature until the ultimate load is approached
(see Fig. 24a c~d 24b). There appears to be no drastic increase
in the slope of the curve at the theoretical buckling load. The
slope decreases gradually to a horizontal line near the ultimate
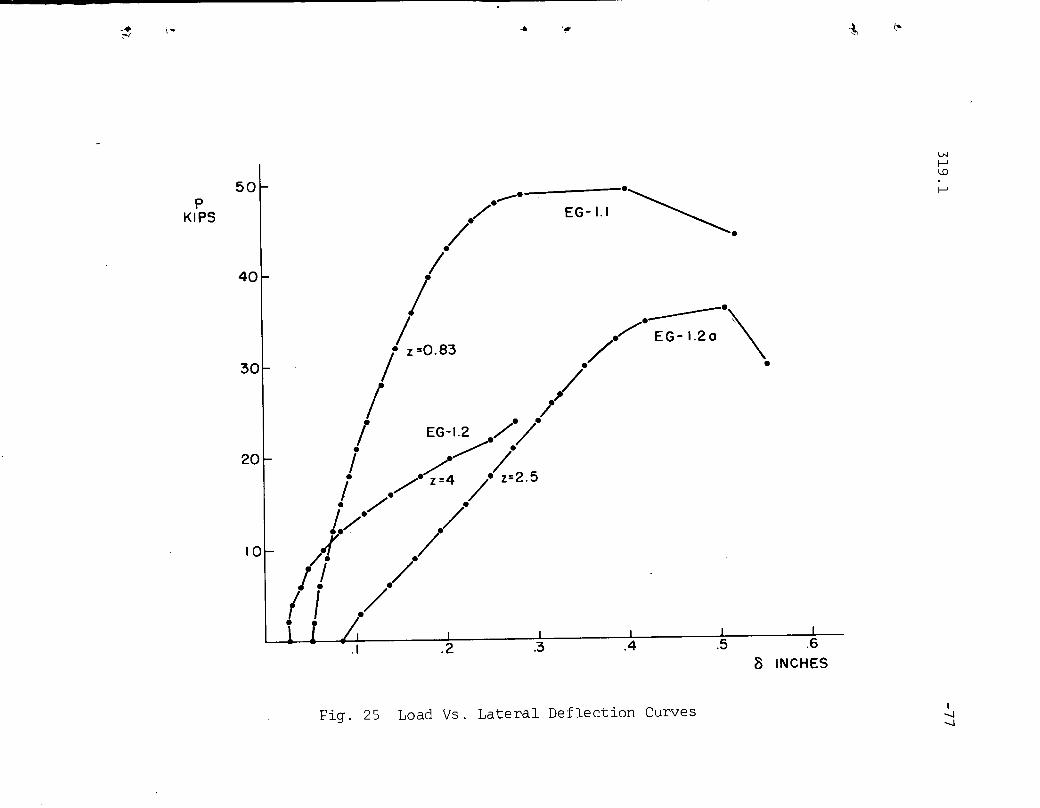
load. For the case shown in Fig. 25 for heavy bending, z ~ 4 ,
there appear to be two quasi-linear sections with the increase in
slope occurring at about the point where the flange started
yielding under .the combination of applied and residual stresses.
The yielding was manifested by the flaking off of the whit2wash.
In the tests on EG-l (Fig. 25) the differences can be seen
in the slopes of the load-deflection curves for various z values.
The lateral deflection for the same edge load is much larger for
higher z values, thus causing the formation of the yield band
319.1 -31
•
at a lower load. Thus, an increase in bending stresses leads to
a reduction of the ultimate eqge load.
The magnitude of the lateral deflection should be also
considered. At about half the ultimate load, the web deflected
from its initial position from about 1 times its thickness at
a = 0.8 to about twice its thickness at a = 1.6. At working
loads, the plate could deflect from 0.5t to 1.Ot. In all cases,
the point of maximum·deflection was in the upper quarter of the
plate. A significant consideration here is whether these
deflections are large enough to cause unfavorable stress distri
butions at the flange-to-web connection that would cause failure
under repeated loading. Future research may be~needed to answer
this question.
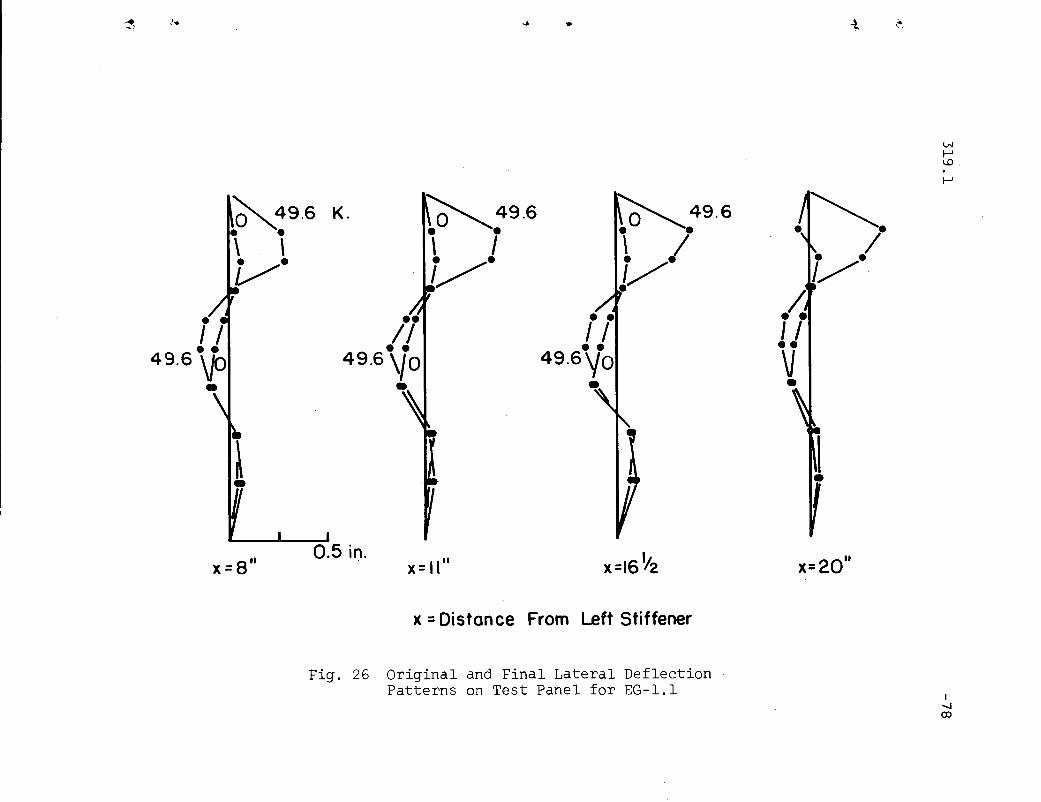
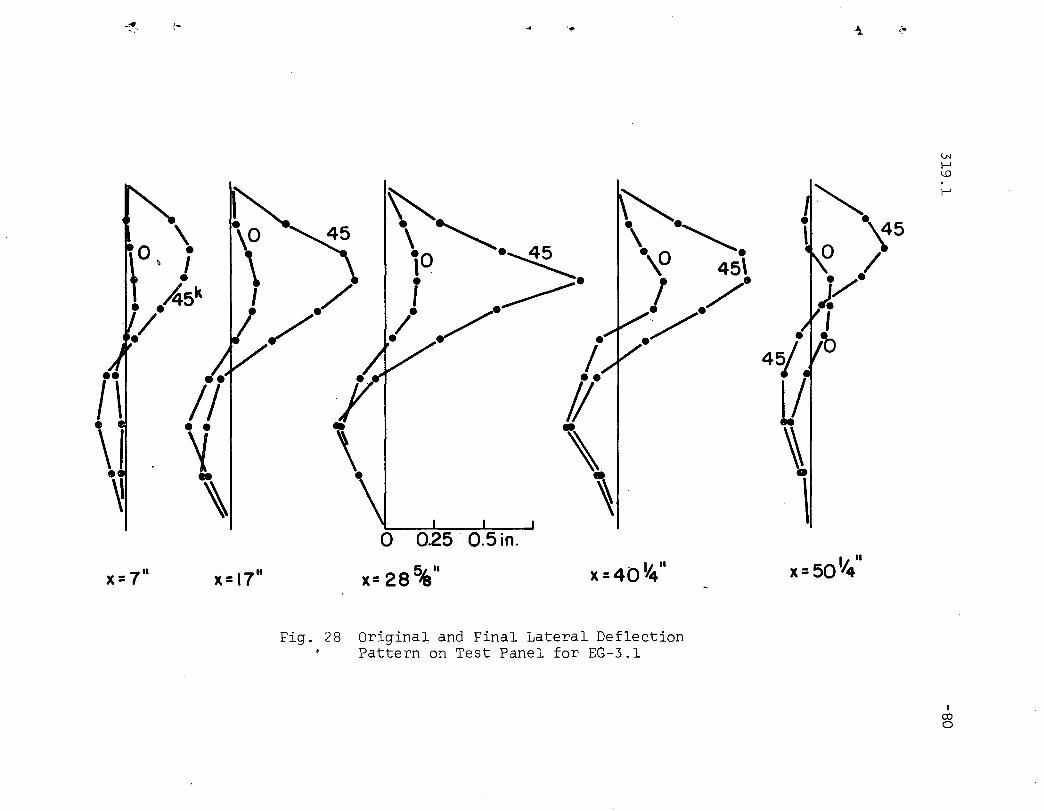
The second aspect associated with lateral deflections is how
the overall panel shape changed with the increasing load. The
initial and final lateral deflection patterns can be seen in Fig.
26, 27, and 28 for typical test panels for the three aspect
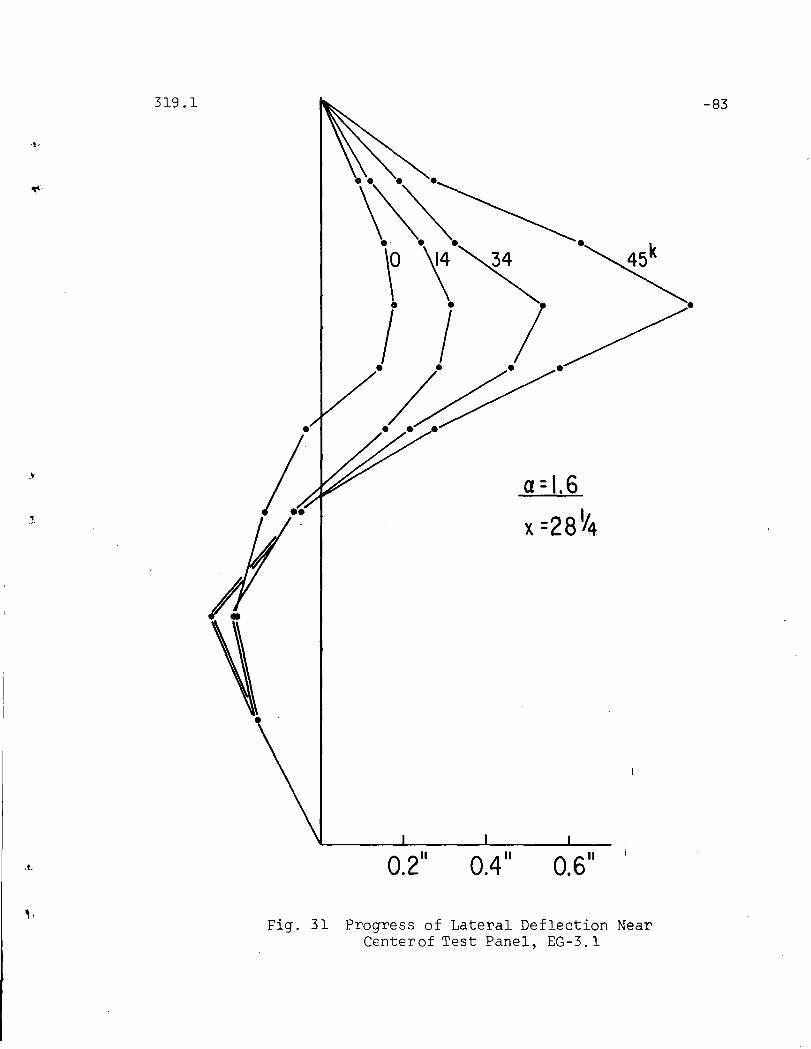
ratios. Figs. 29, 30 and 31 show the lateral deflections over the
panel depth taken at the centers of the three test panels for two
intermediate loads as well as the zero and ultimate loads. It
should be noted that the point of maximum deflection moves up as
a decreases. The final basic shape is very much the same for all
panels despite large differences in initial deflection. In all
cases, primary movement appears to be an extreme outward displace-
319.1 -32
•
ment of the top half of the panel. This movement is most
pronounced in the center portion of the panel, while the
deflection near the stiffeners remains small. In most cases,
the lower half of the web plate showed little lateral movement.
Sometimes the final deflection was less than the initial
deflection because the lower half of the plate was in tension.
Sometimes, this effect was offset by a wrinkling effect caused
by the large lateral movement of the top half. One can predict
little about the lower half of the web plate unless an accurate
analysis taking into consideration initial imperfections is
performed. However, these deflections were small compared to
the deflections in the top half of the plate, where failure
took place.
In tests where the panel was subjected to shear, there was
some tension field action in the region of high shear, but the
tension field was dissipated in the lower shear region. At the
end, the deflected shape had the large outward movement in the
top half of the panel, but the movement was not symmetrical as
it was in the tests where the compressive vertical load was
supplemented by bending alone. The deflections near the high
shear end were larger because of the effects of the tension field.
However, it is interesting to note that the yield band in the
deformed web pattern had the same shape as in the panels subjected
to bending.

.-319.1 -33
, ..
.'
4.3 Stresses in the Web Plate
An important consideration in the test series was the actual
stress distribution in the web plate and a comparison with the
distribution assumed in the theoretical analysis. Throughout the
test series, some significant differences between the test
results and theory were noted due to considerable initial
imperfections and a discrepancy between the assumed and actual
boundary conditions. These differences will be cited and
explained. An evaluation of the vertical compressive load
distribution will also be made.
The stresses were obtained from the strain readings of the
linear gages and rosettes mentioned in Section 2.2. Membrane
~stresses are plotted as stresses obtained from tRe average of
the strains from the gages mounted on opposite sides of the web
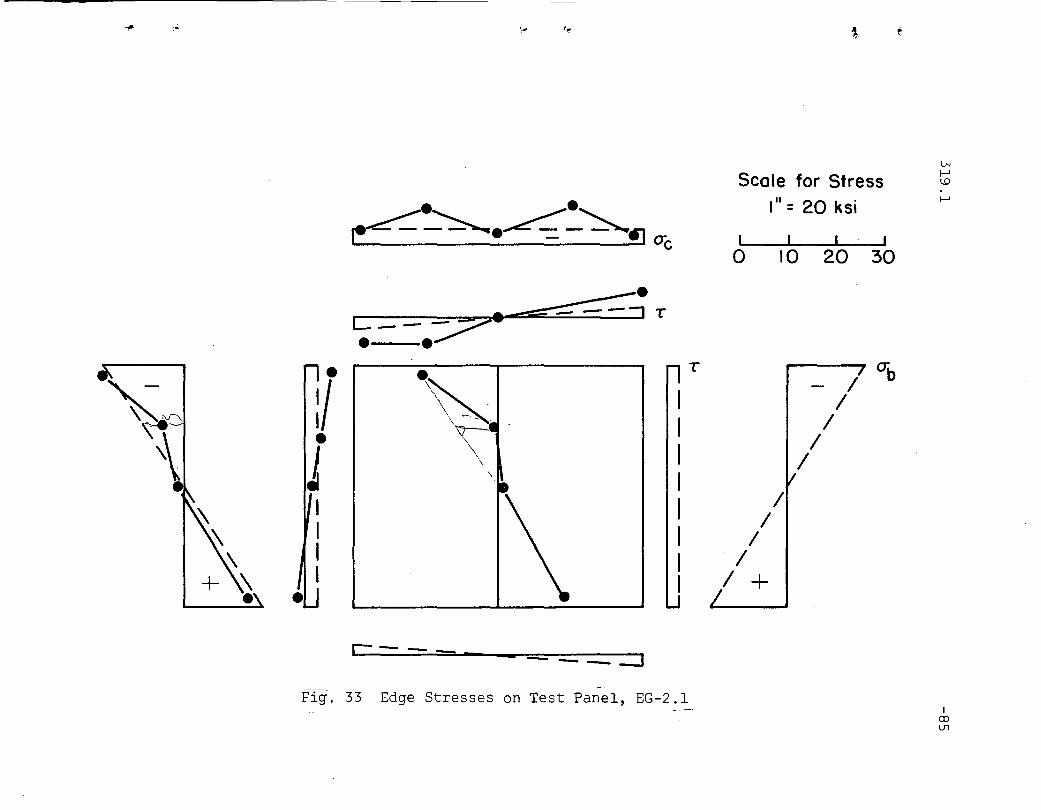
plate. Figures 32 and 33 show two test panels with theoretical
edge stress distributions given in dashed lines and actual stress
distributions shown by points conne.cted with straight solid lines.'
On the left edge of both test panels and in the middle of the
panel from test EG-2.1, the actual stress near the center of the
top half of the panel is lower than the assumed stress. This
effect is much more pronounced in the center of the panel from
test EG-2.1 (Fig. 33). This is due to a transfer of the stress
from the web to the top flange as the top portion of the web
moves out. Near the top of the web plate, the bending stress is
noticeably larger than the predicted value.

319.1 -34
J.
.'
The shearing stresses near the top of the plate are much
larger than those predicted by assuming a uniform distribution
along the side edge and dividing the shear force by the web area.
Most of the shear load in both Fig. 32 and 33 was carried"near
the top of the web plate. Very little was carried at the bottom.
The assumption on which the uniform shear stress distribution is
based is that the vertical compressive stress at the stiffener
varies in a linear fashion with the vertical distance from its
maximum value at the top of the panel to zero at the bottom.
Actually, the compressive stress is dissipated considerably
faster than this. Even some small tensile stresses in the
vertical direction (of the order of 1 ksi) were observed at the
bottom of the panel.
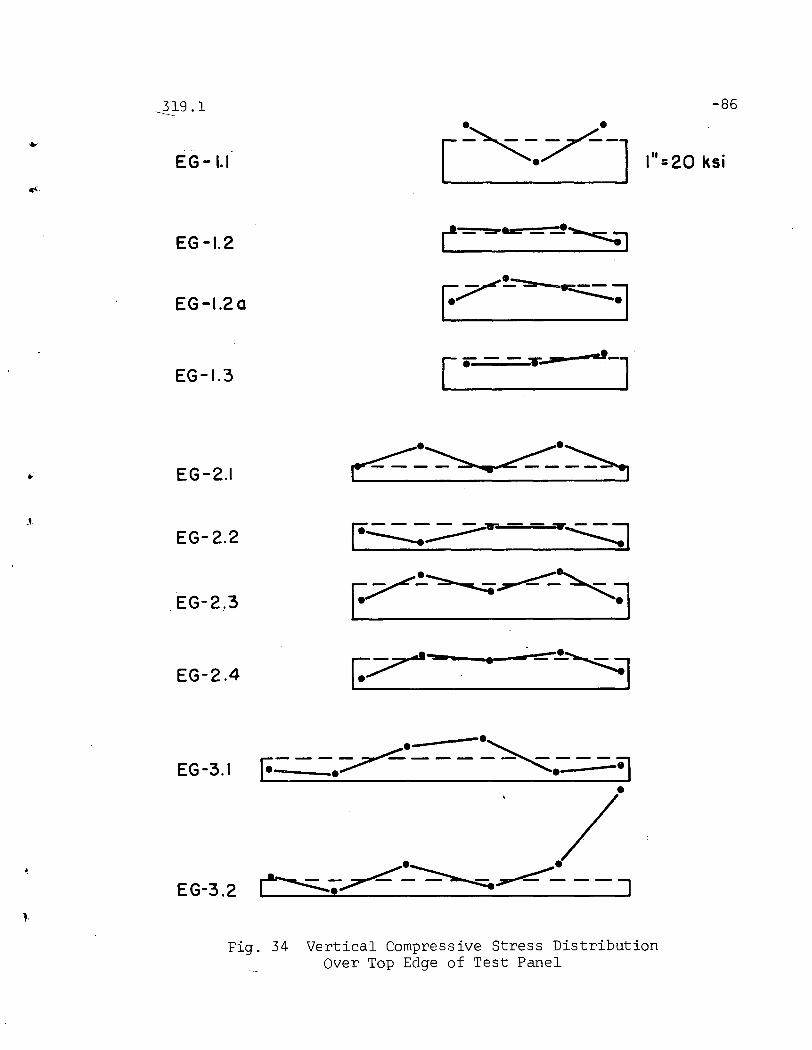
As was mentioned in Article 2.3, the vertical compressive
load was distributed to the panel through bearing plates in all
of the tests except EG-2.2. On panels with a = 0.8 and 1.2, two
plates were used, each set at about the third point of the panel.
On panels with a = 1.6, four bearing plates were used because the
panel was wider, thus making more plates necessary. Figure 34
shows the compressive stress distribution over the top of the test
panel for all tests. The agreement with the assumed distribution
was not very good. The discrepancy seems to lie mainly in the
accuracy of the stress evaluation rather than in the actual
condition. The section of the web plate was subjected to severe
bending because of the lateral deflection near the top, so that
.519.1 -35
,~. the average strain of the two gages placed on opposite sides of the
web was the average of a large positive number and a large
negative one. This could cause the readings to be erratic.
Also, localized stresses due to the bearing plates contributed
to the errors. However, in most cases, with the exception of
test EG-2.2, the total area under the dotted line showing the
assumed stress distribution and the area under the plot of the
test points is essentially the same indicating that the overall
effect on the plate was adequately consistent.
In test EG-3.2, an extremely high vertical stress occurred
at one end of the panel. A concentrated load was placed over
the stiffener bounding the side of the panel thus causing a very
high compressive stress in that region. The purpose of the load
was to subject the panel to high shear.
In test EG-2.2, a wood beam was used to distribute the
vertical stress more evenly over the top of the test panel. As
mentioned in Article 2.3, the wood beam carried too much load to
the stiffeners bounding the test panel, thus causing a low
vertical stress near the middle of the panel away from the
stiffeners. Also, some composite action took place between the
girder and the wood beam ':hus reducing t.he bending stress in the.
test panel.

319.1 -36
,. 4.4 Vertical Plate Girder Deflections
The vertical delfection of the plate girder at the center
line of the test panel was a measure of the general behavior of
the girder. In low bending tests, the load vs. deflection curve
remained linear up until failure as shown in Fig. 35a and 36a,
thus indicating that failure of the test panel had little effect
on the general plate girder behavior. On tests of high z where
some flange yielding occurred, some flatteni~g of the load vs.
deflection curve did take place as shown in Fig. 35b. Figure 36b
shows the plot for the shear test EG-3.3. A little flattening
did take place at the end thus indicating a little yielding of
the flange and possibly some inelastic deflection due to the shear
on the panel.
4.5 Ultimate Load
The most important information gained from the test series
is the variation of the ultimate load with respect to a and z.
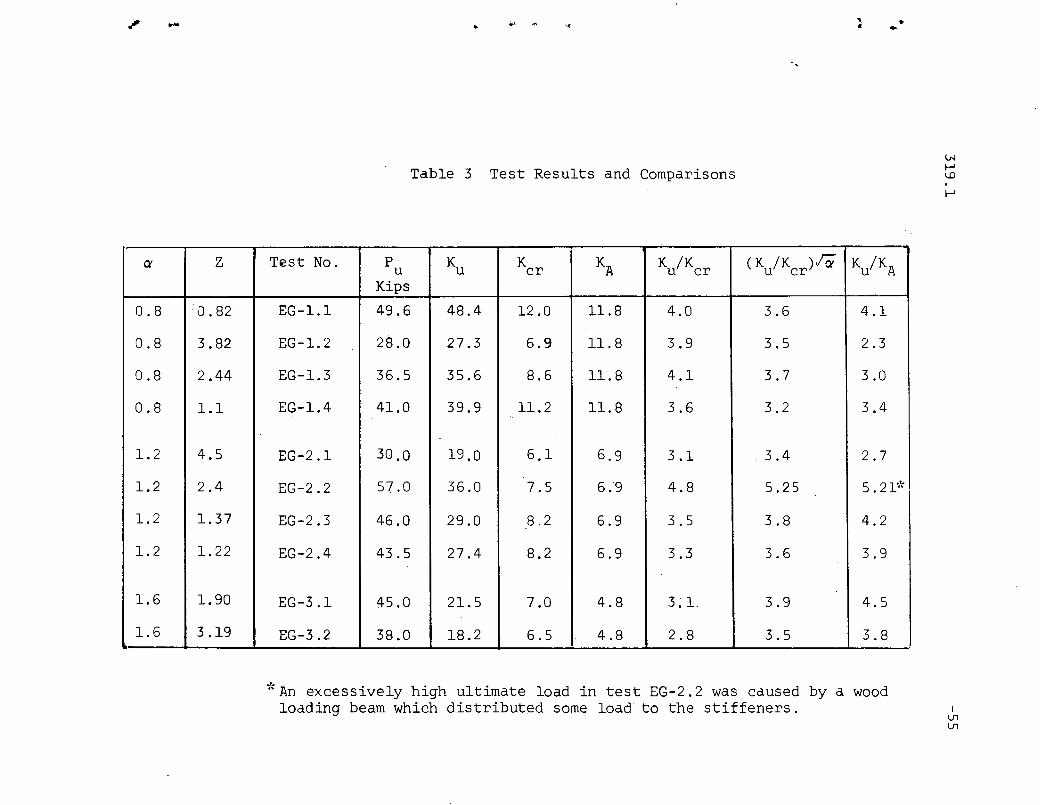
The ultimate loads obtained in each test, as well as the ratios
of the ultimate load to the buckling load are shown in Table 3 *
For a particular aspect ratio, the maximum load does become
smaller as z increases. Also, the ratio of the ultimate load to
the buckling load remains approximately constant for various z
values and a constant a, but the ratio becomes lower as a
increases. A comparison of the ultimate load with the buckling
load and the AISC specification is discussed in more detail in
the next chapter.
*Shown in terms of stress coefficients as explained in Chapter 5.
319.1 -37
••
~J
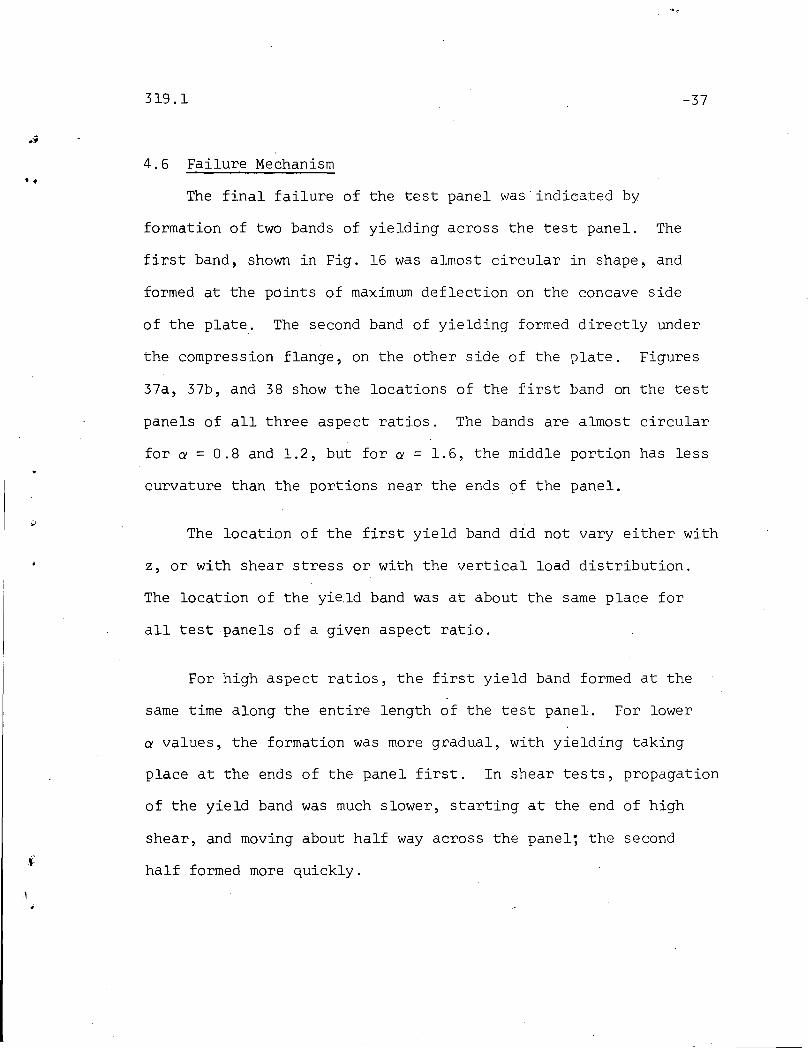
4.6 Failure Mechanism
The final failure of the test panel was· indicated by
formation of two bands of yielding across the test panel. The
first band, shown in Fig. 16 was almost circular in shape, and
formed at the points of maximum deflection on the concave side
of the plate.. The second band of yielding formed directly under
the compression flange, on the other side of the plate. Figures
37a, 37b, and 38 show the locations of the first band on the test
panels of all three aspect ratios. The bands are almost circular
for a = 0.8 and 1.2, but for a = 1.6, the middle portion has less
curvature than the portions near the ends of the panel.
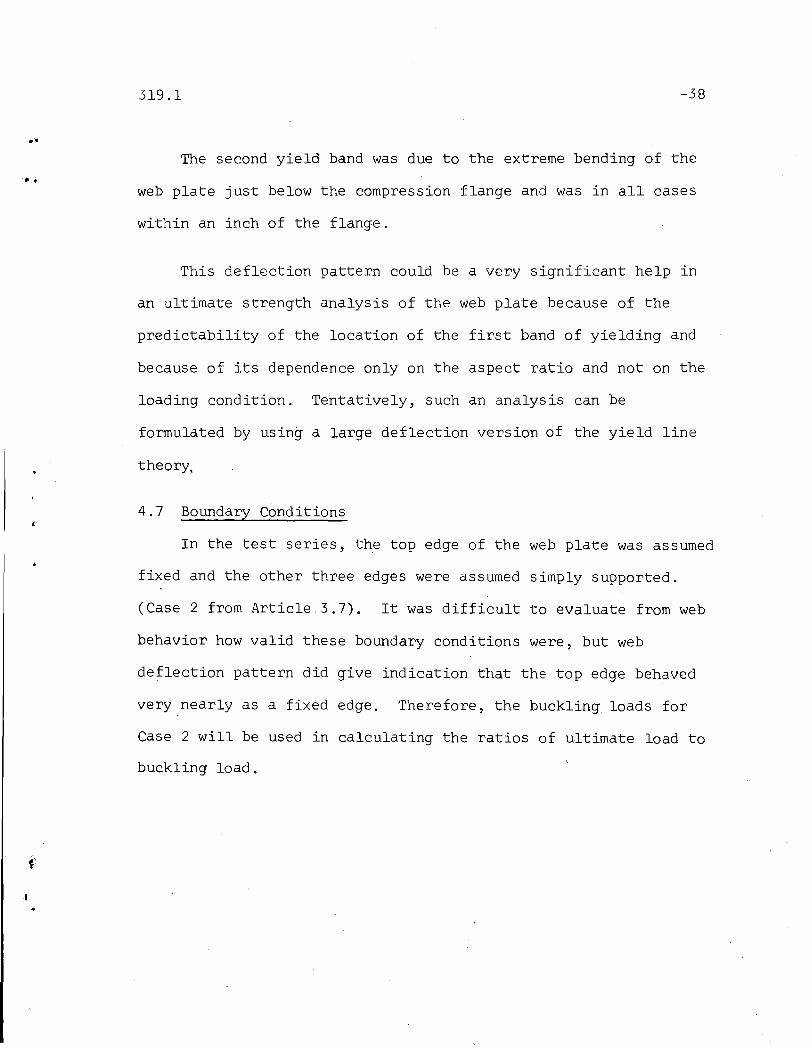
The location of the first yield band did not vary either with
z, or with shear stress or with the vertical load distribution.
The location of the yield band was at about the same place for
all test panels of a given aspect ratio.
For high aspect ratios, the first yield band formed at the
same time along the entire length of the test panel. For lower
a values, the formation was more gradual, with yielding taking
place at the ends of the panel first. In shear tests, propagation
of the yield band was much slower, starting at the end of high
shear, and moving about half way across the panel; the second
half formed more quickly.
319.1 -38
".. The second yield band was due to the extreme bending of the
web plate just below the compression flange and was in all cases
within an inch of the flange.
This deflection pattern could be a very significant help in
an ultimate strength analysis of the web plate because of the
predictability of the location of the first band of yielding and
because of its dependence only on the aspect ratio and not on the
loading condition. Tentatively, such an analysis can be
formulated by using a large deflection version of the yield line
theory.
4.7 Boundary Conditions
In the test series, the top edge of the web plate was assumed
fixed and the other three edges were assumed simply supported.
(Case 2 from Article 3.7). It was difficult to evaluate from web
behavior how valid these boundary conditions were, but web
deflection pattern did give indication that the top edge behaved
very nearly as a fixed edge. Therefore, the buckling loads for
Case 2 will be used in calculating the ratios of ultimate load to
buckling load.

••
319.1
5. COMPARISON OF TEST RESULTS WITH THEORYAND AISC SPECIFICATION
5.1 Introduction
The purpose of this chapter is to compare the results of
-39
the tests, the theory, and the AISC Specification, to evaluate
the results, and to explain the differences.
5.2 Definitions of K values
All of the results can be expressed in terms of the non-
dimensional stress parameter K.
parameter is the following
The relationship defining this
(5.1)
where
E = modulus of elasticity
v = Poisson's ratio
t = plate thickness
b = panel depth
K = the stress parameter
P = load
A = area of compression edge of webw
2E (t)2Since TI 2 b for a plate girder panel is a constant dependent1,( l-v )
only onthe material properties and the slenderness ratio, K is
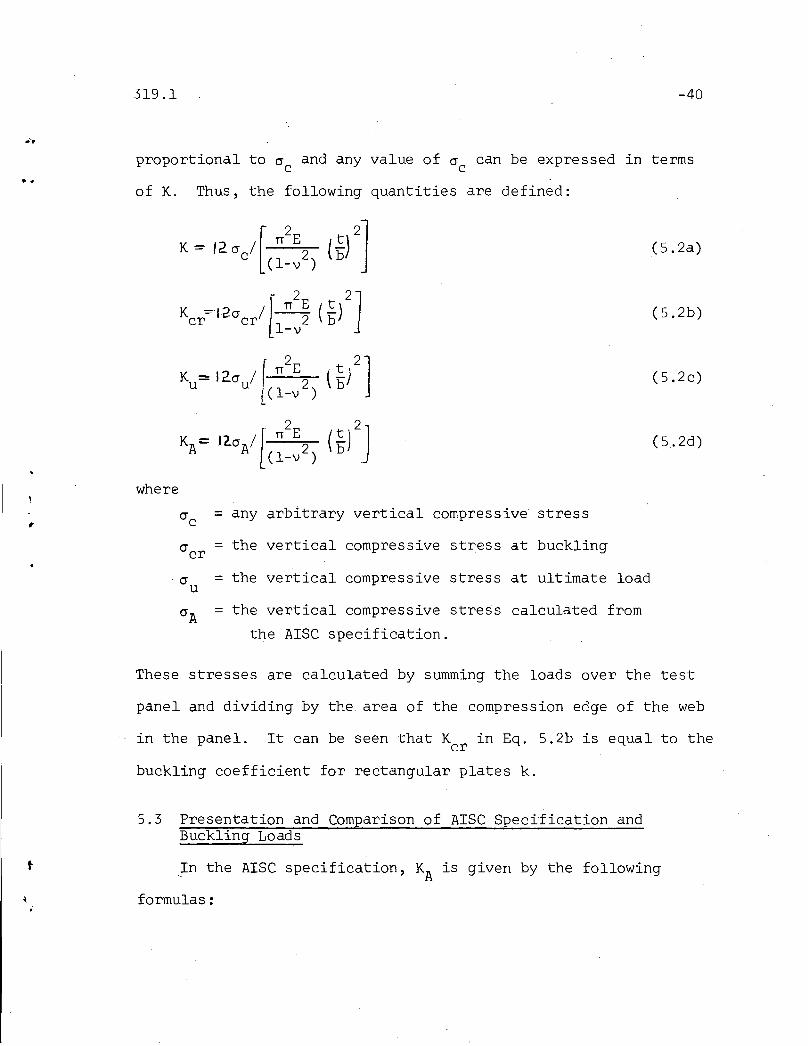
319.1 -40
••proportional to cr and any value of cr can be expressed in termsc c
of K. Thus, the following quantities are defined:
(5.2a)
(5.2b)
(5.2c)
(5.2d)
,
K = I' 1[· T/E (t)2JA~crA 2 b(l-v )
where
crc = any arbitrary vertical compressive stress
crcr = the vertical compressive stress at buckling
. cr = the vertical compressive stress at ultimate loadu
crA = the vertical compressive stress calculated from
the AISC specification.
These stresses are calculated by summing the loads over the test
panel and dividing by the. area of the compression edge of the web
in the panel. It can be seen that K in Eq. 5.2b is equal to thecr
buckling coefficient for rectangular plates k.
5.3 Presentation and Comparison of AISC Specification andBuckling Loads
t In the AISC specification, KA is given by the following
formulas:

.,;
319.1
top edge fixed
K = 5.5 + 4/(a)2A
KA
= (5.5 + 4/a2
)1/a
top edge simply supported
a < 1
a > 1
a < 1
a > 1
-41
( 5. 3a)
(5.3b)
(5.4a)
( 5. 4b)
These values of KA were obtained by multiplying the allowable
vertical stress given by formulas 15 and 16 of the AISC Specifi-
cation by the built-in safety factor (equal to 2.6) and dividing
2E t)2the result by the factor TI 2 '(b Notice that these'2.(l-v )
equatjnns is independent of z. Figures 39 and 40 show plots of
KA vs. a for the simply supported and fixed cases, respectively.
Also shown are plots of K for z = 0 given by the bucklingcr
theory. Since the AISC specification is based on a simplified
buckling model of a plate, there should be some correlation
between the two. For the simply supported case, the correlation
is reasonably good but for the fixed case the difference is more
significant. In Fig. 40, Kcr for z = 3 is also plotted. Here,
the K values given by the theory are much lower than KA for low
values of a.

319.1 -42
.. ,-
,:
In Fig. 39, the values of K obtained by Wilkesmann arecr
also plotted for z = O. The correlation between the Wilkesmann
curve and that obtained from the computer program is reasonably
good.
Figures 41 and 42 show the Kcr values obtained for the edge
loading in Fig. 2 from the computer program. It can be seen here
also that for low ~ values K drops drastically as z increases.cr
From these plots and that in Fig. 40, it can be seen that the
simplified theory on which the AISC specification is based is not
adequate when the panel is subjected to high bending stresses.
5.4 Comparison of Test Results With Theory and theAISC Specification
The primary purpose of the test series was to see what
relation existed be-"':ween Ku and Kcr The test results will now
be compared with the AISC specifications and the buckling theory
for Case 2 (Art. 3.7), and an empirical relation between K andu
Kcr given. Table 3 gives the Ku values for each test panel.
Notice that as expected, the K values decrease with increasingu
z. Table 3 also gives the ratios of K IK and KulKA for theu cr
tests. The ratios of K IK show considerable post-bucklingu cr
strength, as expected. Also, the ratios of K IK are approxiu cr
mately constant, thus indicating that a relation does exist
between the ultimate and buckling l03ds. It can be seen that the
ratios of KulKA decrease with increasing z, thus again showing the
inadequacy of the AISC specification to predict the true behavior.

"...:"
319.1
From the discussion above, the following conclusions can
be drawn:
1. The effect of bending must be taken into account.
2. There is a considerable amount of post-buckling
strength, and buckling does not mean failure.
3. Buckling theory does appear to predict the variation
of the ultimate load with z.
-43
..
There is also a slight reduction of K IK with a. It is shown inu cr
Fig. 43 that the quantity ;a Ku/Kcr is essentially a constant for
all the tests. Thus, the post buckling strength appears to vary
inversely with the square root of a. On the basis of the plot in
Fig. 43 it may be concluded that the ultimate strength can be given
conservatively by:
(5.5)
f
5.5 Behavior of Web
A secondary purpose of the tests was to attempt to verify the"
buckling loads given by the computer program, and in so doing, to
determine what the actual boundary conditions of the web plate
were. A mathematical theory for determining buckling loads on
uniformly compressed rectangular plates from tests was proposed
by Yoshiki and Fujita.(9) The buckling loads is determined by
plotting. load vs. the square of the lateral deflection. The
second part of the curve is supposed to be straight, and the
319.1 -44
buckling load is determined by extending the straight line back
to the P axis, as shown in Fig. 44. The load-deflection
relationships from the current test series did not lend themselves
readily to such a construction because of large initial imper
fections in the web plate. These large initial deflections
apparently did not significantly affect the ultimate load because
they were still small compared with the final deflections.
It was noted that in some of the tests, the vertical
deflection remained linear up through the ultimate load, and
returned very close to zero upon removal of the loads. This
means that a failure of a loaded panel had little effect on the
overall general behavior of the girder. Moreover, the panel
which had been failed did carry the loads required of it when a
neighboring panel was tested. The compression flange of a
previously tested panel did not show any tendency to buckle into
the web, even under high bending stresses. However, if the panel
had been allowed to deform excessively during the test, the damage
might have had an adverse effect on the general behavior of the
girder. Also, a web failure under vertical compressive load
could take place even if the remainder of the girder was elastic.
This situation can become very critical for girders made of high
strength steels.
".
319.1
There was no additional strength left in the test panel
after formation of the yield band. In test EG-2.3, when the
-45
load was kept on after the formation of the yield band, the panel
simply crumpled. Thus, the formation of the yield band is the
signal that the failure is about to take place. If upon formation
of the yield band~ some of the vertical compressive load were
taken off, the girder could be subjected to increased loads
outside the test panel. However, the load which was still on
cannot exceed the ultimate load for the increased z that would
result from the increased load outside the test panel.
5.6 Items Not Considered
, In this test series, no consideration of the effect of the
slenderness ratio was made. ~or smaller S ratios, the effect of
the web instability is probably less critical, and it wouid have
less tendency to control the design proportions of the web.
One test at a lower slenderness ratio of.192 for z = 0 was
performed at Lehigh in 1963, giving a value of 2.0 for K /K .u cr
More tests should be conducted before any conclusions can be
drawn with respect to the influence of s.
No consideration on the effect of the yield stress of the
web was made in this test series since all of the test panels had
the same cry. Since this failure mode is expected to be more
critical for higher strength steels, Eq. 5.5 would be
conservative. For lower yield stresses, Eq. 5.5 would not be a
safe prediction of the ultimate load.

",5.7
-46
Future Work
First, a method for the ultimate strength analysis should
,
f .
be developed for rectangular plates. The present test results
could be used to check the validity of such a method. The web
plate deformation pattern can ~e used as a guideline in formu-
lating such a theory since the location of the yield pattern is
well defined and predictable.
Secondly, more tests should be run on high strength plate
girders so that the effect of high z and different yield stress
on K can be established. In any future tests, a strongeru
effort should be made to ensure that the yield stress of the
flanges is equal to or greater than that of the web. Tests
should also be conducted for different slenderness ratios.
These tests would establish the variation of K with yield stressu
and the slenderness ratio, and more test points would be
provided for comparison with the ultimate strength theory.
Thirdly, in future t.ests, it would be des irable to obtain
more information about the strain distribution at the junction
between the edge of the web and the top flange at working loads.
Then, the results can be combined with existing fatigue studies
to learn whether or not fatigue is a problem and how it can be)
taken into account.
319.1
6. SUMMARY AND CONCLUSIONS
The objective of this investigation was to determine the
buckling characteristics and the ultimate strength of the web
of plate girder panels subjected to vertical compressive load
bearing through the compression flange between stiffeners
combined with bending and shear on the panel.
-47
A computer program was developed to determine the buckling
loads of the web plate under vertical compression and bending
using some simplifying assumptions with respect to the stress
distribution. The results, of this analysis are shown in Figs.
41 and 42.
Ten tests on three plate girders were conducted to determine
the Ku value of the web plate when subjected to combined bending
and vertical compressive load; and combined shear, bending and
compressive load.
The test results showed that the ultimate load was between
three and four times the buckling load, thus indicating a consid-
era~le post buckling strength. The ratio of K /K was approxi~u cr
mately constant for a given aspect ratio, and it varied inversely
with the square root of the aspect ratio, a.

319.1 -48
"
t
Failure of the test panel occurred before any other inelastic
behavior in tests with low z, and it had little effect on the
overall behavior of the girder except in tests where yielding
took place in plate elements other than the web.
Web deflections were of the order of three to six times the
plate thickness at ultimate load.
Failure was caused by the formation of a band of yielding
across the web panel whose location varied only with a and not
with load distribution.
319.1
7. ACKNOWLEDGEMENTS
-49
I'
f
This report was prepared in connection with a research
project on plate girders conducted in the Department of Civil
Engineering, Fritz Engineering Laboratory, Lehigh University,
Bethlehem, Pennsylvania. Dr. Lynn S. Beedle is the Acting Head
of the Department and Director of the Laboratory.
The work described here was sponsored by the American
Institute of Steel Instruction. The authors wish to thank this
organization and in particular, Messrs. T. R. Higglnsand
W. A. Milek for sponsoring this research.
Sincere appreciation is expressed for the able help of the
Fritz Engineering Laboratory staff and technicians, and espe
cially to James Dimitri for his help during the testing program.
Also, sincere thanks goes to Sharon Gubich andJ. M. Gera for
their help with the drawings, R. N. Sopko for this help on the
photographs and to Marilyn Courtright for her patience in typing
the manuscript.
319.1
.~
.,,~
a
A,B,C,D
Aw
b
d l
d 2
E
k
K,KA,K ,Kcr u
L
1m
n
N
p
t
U,V
w
W
x.,Y
t z
'.
-50
8. NOMENCLATURE
panel length
integration constants
area of web
panel depth
vertical distance between mesh points
horizontal distance between mesh points
modulus of elasticity
buckling coefficient
stress parameters
length
index giving location of a mesh point in a column
index giving location of a mesh point in a row
normal
load
plate thickness
coefficient .matrices generated from finite
difference operators
lateral deflection; lateral deflection vector
distributed load
components of distributed edge forces per
unit area
<Jb/<Jc ' ratio of maximum compressive bending stress to
the vertical compressive edge stress

319.1
.."4
ex
......13
y
!
t:.
E:
\)
cr
crA
crb
crc..
crcr
cru
crx
cry
'T
'Txy
0
••
-51
aspect ratio alb
slenderness ratio bit
experimental lateral deflection
experimental vertical deflection
strain
Poisson1s ratio
normal stress
allowable vertical compressive stress given by
AISC specification
maximum compressive bending stress
vertical compressive stress
buckling vertical compressive stress
ultimate vertical' compressive stress; ultimate stress
normal stress in x direction
normal stress in y direction; yield stress
shear stress
shear stress on differential element
stress function

.,•
t
319.1
9. TABLES AND FIGURES
5',- L
... ..
Table 1 Summary of Plate Girder Dimensions
•.
TestGirder No. of Tests ex Panel Length Girder Length Thickness of Depth
Panels inches feet Web, inches inches
EG-l 3 4 0.8 28 30 0.1205 36
EG-2 3 4 1.2 43 30 0.1224 36
EG-3 2 2 1.6 57 25 0.1216 36
IV1LN

....
Table 2 Material Properties
,oj
cry ksi cry StrainGirder Component 0.2% 0.5% cr ksi % Elong. % Area Hardening
Offset Strain yReduction Modulus ksi
EG-l Top Flange 34.2 -- 62.5 35.0 61.1 825
EG-l Bottom Flange 33.3 -- 63.1 37.1 61. 8 527
EG-l Web-Horizontal 42.4 44.3 68.1 27.6 49.3 534Direction
EG-l Web-Vertical 44.4 45.7 72.7 30.0 52.2 - 718Direction
EG-2 Top Flange 36.7 -- 65.0 38.4 58.2 827
EG-2 Bottom Flange 36.1 -- 65.4 36.2 57.1 488
EG-2 Web-Deflection 43.2 43.9 69.6 27.0 52.0 729Direction
EG-2 Web-Vertical 43.6 44.9 70.9 25.6 48.1 483Direction
EG-3 Top Flange 33.3 -- 63.4 38.6 60.3 726
EG-3 Bottom Flange 34.9 -- 65.1 35.6 59.1 703
EG-3 Web-Horizontal 43.4 44.1 70.3 28.3 54.5 559Direction
EG-3 Web-Vertical 43.5 43.8 69.8 23.3 49.6 597Direction
IlJl.j::>
.... .' ~ '. •..
Table 3 Test Results and Comparisons
Q' Z T~st No. P K K KA Ku/Kcr (K /K )~ KulKAu u cr u crKips
0.8 '0.82 EG-1.1 49.6 48.4 12.0 11.8 4.0 3.6 4.1
0.8 3.82 EG-1.2 28.0 27.3 6.9 11. 8 3.9 3.5 2.3
0.8 2.44 EG-1.3 36.5 35.6 8.6 11.8 4.1 3.7 3.0
0.8 1.1 EG-1.4 41.0 39.9 11.2 11.8 3.6 3.2 3.4
1.2 4.5 EG-2.1 30.0 19.0 6.1 6.9 3.1 .3.4 2.7
1.2 2.4 EG-2.2 57.0 36.0 7.5 6.9 4.8 5.25 5.21*
1.2 1. 37 EG-2.3 46.0 29.0 8.2 6.9 3.5 3.8 4.2
1.2 1. 22 EG-2.4 43.5 27.4 8.2 6.9 3.3 3.6 3.9
1.6 1. 90 EG-3.1 45.0 21.5 7.0 4.8 3. L 3.9 4.5
1.6 3.19 EG-3.2 38.0 18.2 6.5 4.8 2.8 3.5 3.8
*An excessively high ultimate load in test EG-2.2 was caused by a woodloading beam which distributed some load to the stiffeners. I
V1V1

319.1 -56
..i
,...w
+•++,~
~.l C
Fig. 1 Plate Girder Under Edge Comparison
CTC
,~T' =CTc a _ CTC a
'. 2b ~ "l"- 2 b
-.~
t~
~ b
~
~
CTb =Z CTC ~
a:=ZCTb c
~~ .
·0
Fig. 2 Assumed Edge Loading for Panel Under Uniform Moment
••
319.1 -57
0'"Cr
-J T'/)
r-- --- ---- --~
, ~1
~"
~-------
c-- J'-- --- ---.
••....
Fig. 3
•
c. y:t
,.
Edge Loads for Panel Under Shear and Bending
°1I °12 °13 °14 °15 °16 °17, , , , , , ,
°21 °22 °23 °24 °25 °26 °2,7, , , , , ,
° °32 ° ° ° ° °3,1 3,3 3,4 3,5 3,6 3,7,
°41 °42 °4 ,3 °44 °45 °46 °47, , , , , ,
° ' 0 ° ° ° ° °5,1 5,2 5,3, 5,4 5,5 5,,6 5,7/--. ... X•~
" Fig. 4 Finite Difference Mesh Points

... .• •
"
, 5 "8 - "a Flange10 ISymmetrical About <l
"""'"
~6"X~": ~"X~."
I 1
v-.Web 3S"x 3/IS'I , I
"~" Web 2-4'xIt2"I Web I ~ Splice Web
I------ -2-4 x 2 I
~I 3S
2-3'x~";--\ I 2-3"x 3/a" ~I rII ~II 8 I --::.,.. r-2-3 x a ,
I IL: L L L, 1
A C SO, 3" 10'lJa"S" I'-O"S"3 @2 4 !I. 3 @a2'-0"_I I. -I- _I I.. _I. - 4 -I" -I I" - -I .. -I \..
5'-0" 7'-0"11-·-------.....-1--.. ----~-I--.. -~-~---I--.. -----'---=----~-I
" 5 "8 x ra FlangeI Symmetrical About <t, :,
~2-4'X~2'~~
~~"~I 3S"x Va" : Web 3S"x3tls",
II .. II II I Web ~SPlice Web2·3 x". 2-4 x":., f I 3S"
I VtI ,
~A L-c l-s L-o I "-"3 @ 3'-7~4" 7'8 I'-S" 2'-0" 2 @2'-S" S"., I.. -I· -1· -I I" -1 I" -I" -I.. -I I..
7'-S" 7'-0"1__.. -----------1--1-.. --------1-.. --------!.~------I--+-I·~------!~--------i ..1
Fig. 5 Girders EG-l and EG-2
IlJ1OJ
l*. .. .. ~.,
•
~ II8 X "e Flange
oBcA
I
~.~36"x ~en Web 36"x 3t16I I Web
I :Splice--2-4'x1t;f--2 - 3
11x3/e" -2-4'x"2
I
~ 36"Web
I I
I ~I II I
L; L- L-I l..-I
6" 2'-0"..I I- .. I- 3'-0 11
7'-0 11
@·'II{.II2 a 4 -9""'e
15'-0"
3'-0 11
-I
Section DOSection CCSection BBSection AA
411 4" All
3t16 3/16 I"ep Hole Flanges0 5"x5/a"
III ep Hole I" ep Hole
4" II." 3"x 3/a"311-0.
x 2Stiff Stiff
3t16 3/16
Fig. 6 Girder EG-3 and SectionsAA, BB, CC, and DDfor All Girders
IV1\..D

•
319.1
Fig. 7 Dial Rig for Lateral Deflection Measurement
-60

I
....
319.1
a sO.8
-61
" " 71
" "I' I' a =1.2
')
IL
...
71 71
71
71 a =1.6
Fig. 8 Strain Gage Arrangement for Typical Test Panels
·-.
319.1 -62
,•
Fig. 9 Dial Gage for Lateral Deflection Measurement
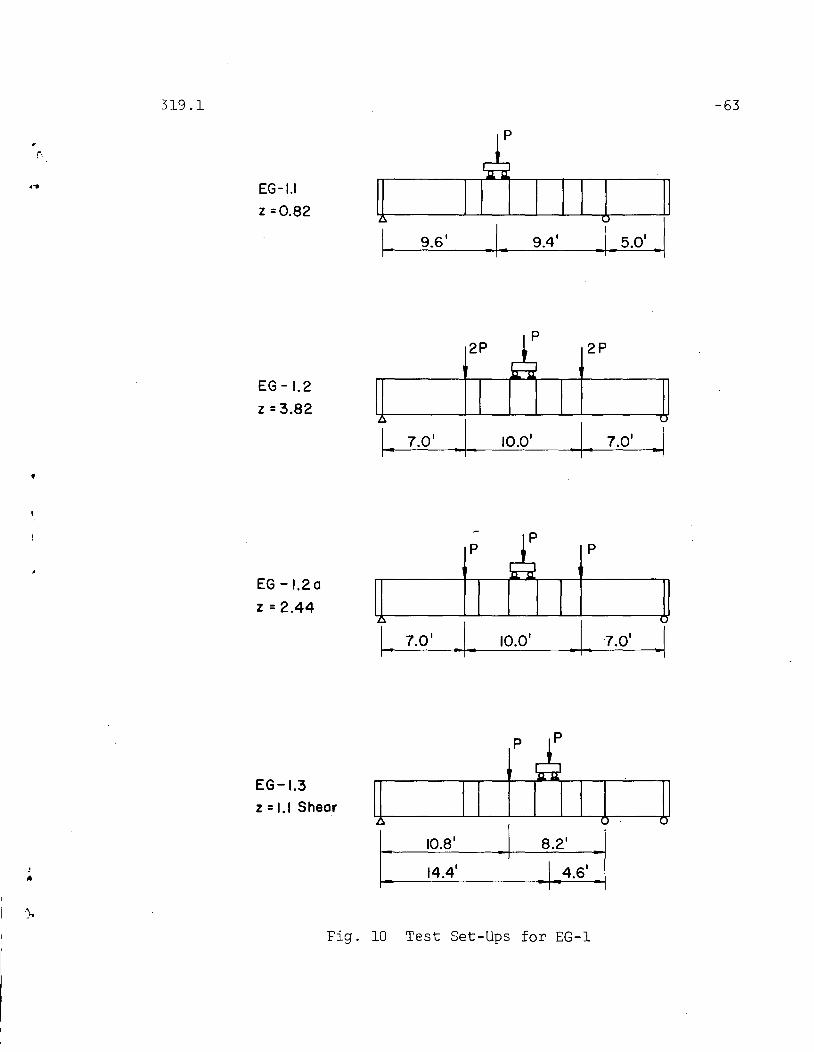
319.1
EG-I.I
z =0.82
EG - I. 2
z =3.82
I. 9.61 .1.. 9.4
1
2P
-63
I.. 7.0 1 jt--_-10-.O-1 _-+_1 7_.0_1 I
EG-1.2a
z=2.44
1_ 7.01 _1. 10.0'
P
.I 7.0' .1
,..
EG-1.3
z =1.1 Shear
10.8 1
14.41
Fig. 10 Test Set-Ups for EG-1
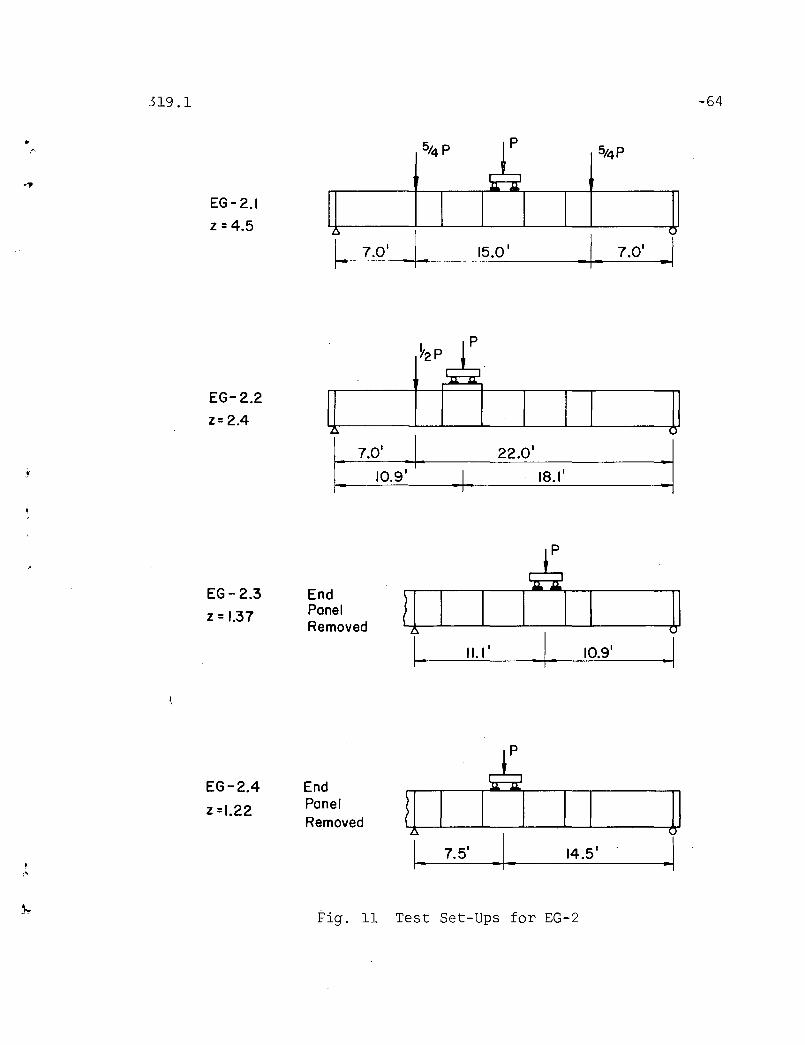
319.1
EG-2.1
Z =4.5
1_ 7.0' .1 --15_.0 _'-_~_ 7.0' J
-64
EG-2.2
Z= 2.4
! I: 7.~~.)~.__22._0'------:11-. ---'-"--'-'---_.. 1_ 18.1' -
EG- 2.3
Z = 1.37
EndPonelRemoved
1__-_1---'.1._1' .. 1. 10.9' -I
,....
EG-2.4
z=1.22
EndPonelRemoved
I.. 7.5' 14.5' . -IFig. 11 Test Set-Ups for EG-2

(
319.1
p
-65
EG - 3.1
z =1.90
~
~~
~::.(,
12.1 1II. 9
1
I
PI,
rI,
EG-32
z =3.19
Shear
1=~
I9.5
1
=1
14.51
16.91 -1- 7.1 1
Fig. 12 Test Set-Ups for EG-3
,•

•'"
319.1
( a)
(b)
-66
Fig. 13 Test Set-Ups for (a) EG1.2 and (b) EG-3.1

319.1
Fig. 14 Load Distribution Mechanism OverTest Panel EG-2.1
-67
..
319.1
(a)
(b)
Fig. 15 Load Distributing Mechanism forEG-2.2 and EG-3.2
-68

•"
319.1
Fig. 16 Failure Panel Showing Yield Bend
-69
2y2
Fig. 17 Finite Difference Operator for 94 ~
I--..Jo

319.1 -71
Txy
y
~----..... y (0)
'-------.-------=-~--x
y
•y
x (b)
y
C1'y
.. TXY
TXY
~Txy
X C1'X-
1
...T xy
~
~.'Fig. 18 Differential Elements
319.1 -72
CD ®
V77 7 7 777 77 7777777777777~
~ 1f4 L -1 4 V2 L .l~ "4 L.I
~ L ~
Fig. 19 Segments of Loading
2 11 Rod ius 211
Ro diu s
~ ~5 11 4 11 5 11
-
- 17 II
Fig. 20 Flange Tensile Specimen
319.1 -73
~ 3"
l r 3"
lII 11" =:I"·Radius I" Radi:s;
.tI" It3/4 "
~4 11
'-1r- 12 11
~I(0)
I~4 11
l r 411
lI 11" ~ · Iw'
2" Radi:S;I
2" Radius
~4"
--iIt II +r- 14 2 - ,
(b)
•r.
Fig. 21 Web Tensile Specimens

I (jy/ dl2 I
- ~(2 dl d2 ) Txy /(2 d ld2) Txy
(jX/d 2 -2 ((jX/d2+(jY/d~' (jX/di2 2 I'
1/(2 dld2) Txy (jy /d ~ _1/{2 dl d2) Txy
Fig. 22 Finite Difference Operator
-~
,...
Initiation of
Strain Hardening(a)
.014.012.010.008.006
FlangeCoupon
.004.002
5
10
LOADKIPS
15
LOADKIPS
3
2
o .002
WebCoupon
.004 .008 .010 .012 .014
(b)
Fig. 23 Load-Strain Curves for Tensile Specimens I-.....JV1

EG-I.I
.--.-----~..-------./~
/./
Pcr
/1--,- - - - - - - - -- - --
-76
0.2 0.3
8 INCHES
(a)
0.4 0.5
~I;
PKIPS
50
40
30
20
10
o
EG- 3.1
0.5
8 INCHES
( b)
.. pu-----
1.0
Fig. 24 Load Vs. Lateral Deflection Curves
..c:-1
\'
LNI--'
50\.D
P .--- EG-1.1'~I--'
KIPS // ••
40 // '--'\/ ./ EG-1.20
30I· z=0.83 ./ .
/I! • •
EG-1.2 //• ~. .
20 / /. /• /. z=4 /. z=2.5
! /.//. /.
10 ? /.Ii / .
•
f J ./.2 .3 .4 .5 .6
8 INCHES
Fig. 25 Load Vs. Lateral Deflection Curves I-...J-...J
x=2011
~49.6• •
t/-.• •I /• •
49.6YO•
~49.6• •\ Ii/·
x=1111
••II• •49.6 \/0
•
0.5 in.
~49.6 K.• •\ \v·
a llx=
x =Distance From Left Stiffener
Fig. 26 Original and Final Lateral DeflectionPatterns on Test Panel for EG-l.l
I-...JCXl

.,.
LNf-'\..0
"" ~ ""f-'
\0 ·~6 .~ o ·~6
l / • •/ /. /. / . I· •/• • •,
X·• •
• •\ /0
1/0 0.25 0.5in.
511
x=IO" X =17" x= 25" x:. 3411X =38"x=
Fig. 27 Original and Final Lateral DeflectionPattern on Test Panel for EG-2.3
·.~. '~
\,,,.0 ·~5I. ~; ~.
/. ./..~ .
/if\ ,
/71 \"
7 11x= x= 17"5 II
x= 28 ~
I IIx=50 V4
Fig. 28•
Original and Final Lateral DeflectionPattern on Test Panel for EG-3.l
Icoo
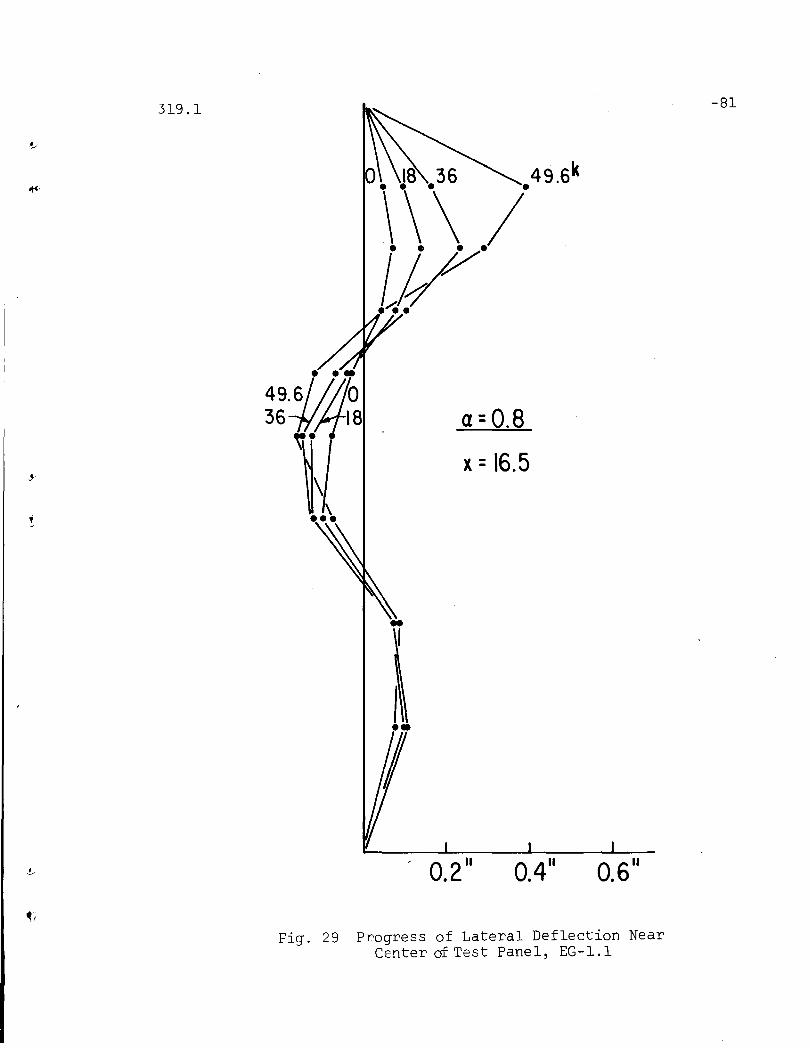
319.1
..I
a =0.8
x= 16.5
-81
~i
0.4 110.6
11
Fig. 29 Progress of Lateral Deflection NearCenter of Test Panel, EG-l.l

319.1
0.2"
a =1.2
x=16.5
0.411 0.6"
-82
Fig. 30 Progress of Lateral Deflection NearCenter 0 f Test Panel, EG-2. 3
.1
319.1
•
0.2"
.~•
a=1.6
X =28 '14
0.6"
-83
Fig. 31 Progress of Lateral Deflection NearCenter of Test Panel, EG-3.1

- ~I
•
l/Ie
~IIIIIII
c-- -- -===- ]---
Scole for Stress
1"= 20 ksi, , ',Io 10 20 30ksi
//
-//
//
/
//
//
// +
/
319.1 Fig. 32 Edge Stresses on Test Panel, EG-l.2aI'
00-Po
.~-;Tr;--.~
Scale for StressI" = 20 ksi
I I I I
o 10 20 30
•
•:1•JIIII
r CTb- /
//
//
//
//
/ +
c---- - - -- ::::::J
Fig. 33 Edge Stresses on Test Panel, EG-2.1I
coUl
-2].9 . 1 -86
'.. [.~./.-JEG-I.I 1"=20 ksi
~.
L :a=--= J~EG-1.2
EG -1.2 a ~!--=~
[.--~d_
JEG-1.3
...
EG-2.1
EG-2.2
.EG-2,3
EG-2.4
EG -3.1
EG-3.2
r~-==-===-~- = T~
~!-~~~
V · -~
Fig. 34 Vertical Compressive Stress DistributionOver Top Edge of Test Panel

319.1
P-r" KIPS
50
40
30
20
10
,I-" 0P
,~- KIPS
30
20
10
o
EG - 2.3
0.1( a)
0.5
(b)
0.2
~,INCHES
1.0~, INCHES
-87
Fig. 35 Load Vs. Vertical Deflection

319.1 -88
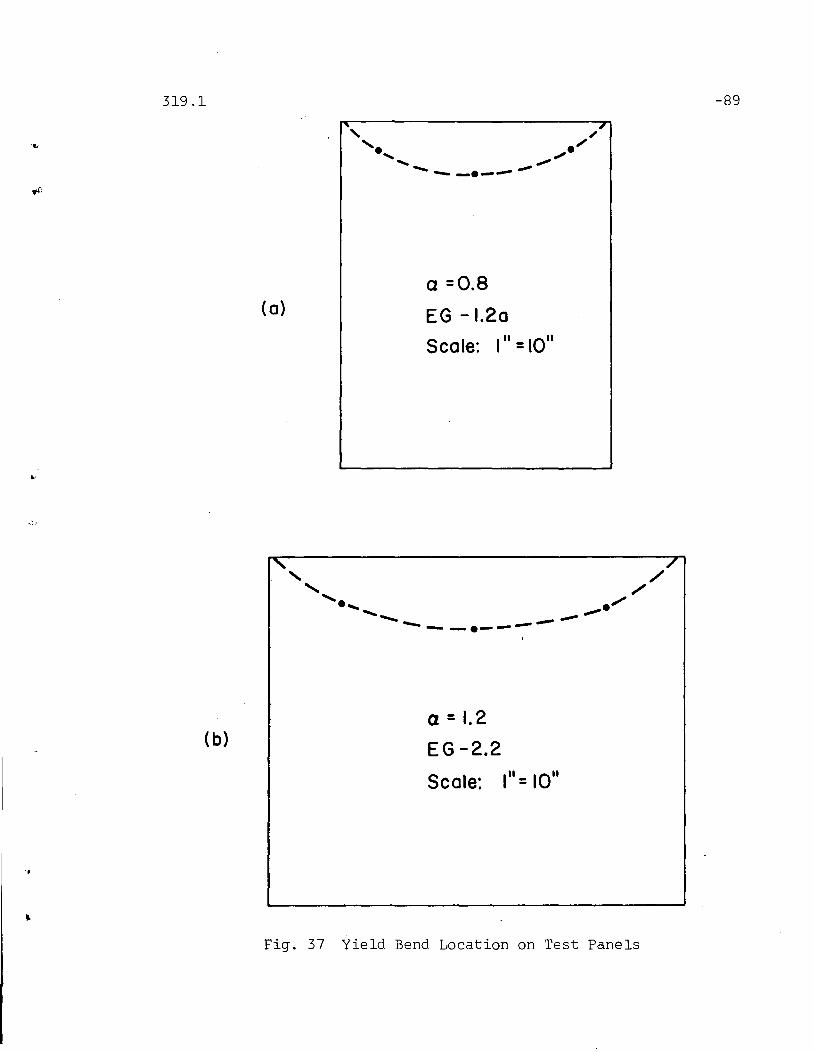
,t·'
319.1
(a)a =0.8
EG -1.20II 011Scale: I = I
-89
"
(b)a = I. 2
EG -2.2
Scole: III =lOll
Fig. 37 Yield Bend Location on Test Panels
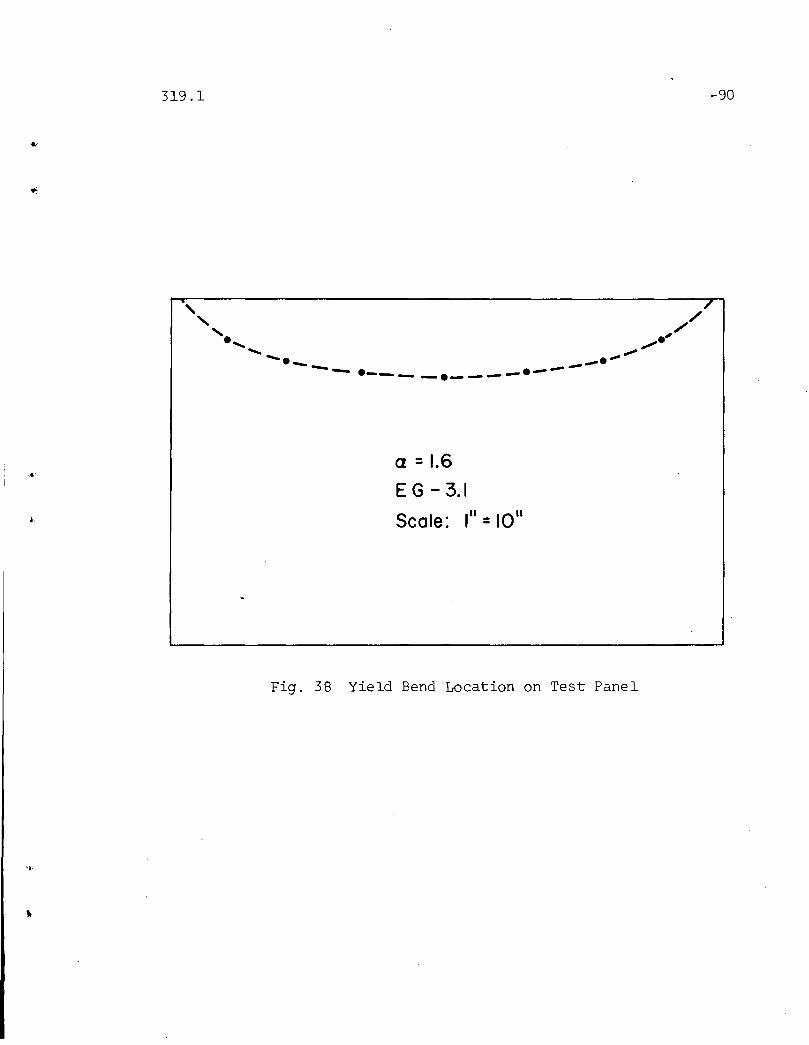
319.1 -90
" .~, /, /e, ~, ~/-e_ __e'"
-- e e----- -e-----
a =1.6.' E G - 3.1
I Scale: III =lOll
Fig. 38 Y{eld Bend Location on Test Panel
..
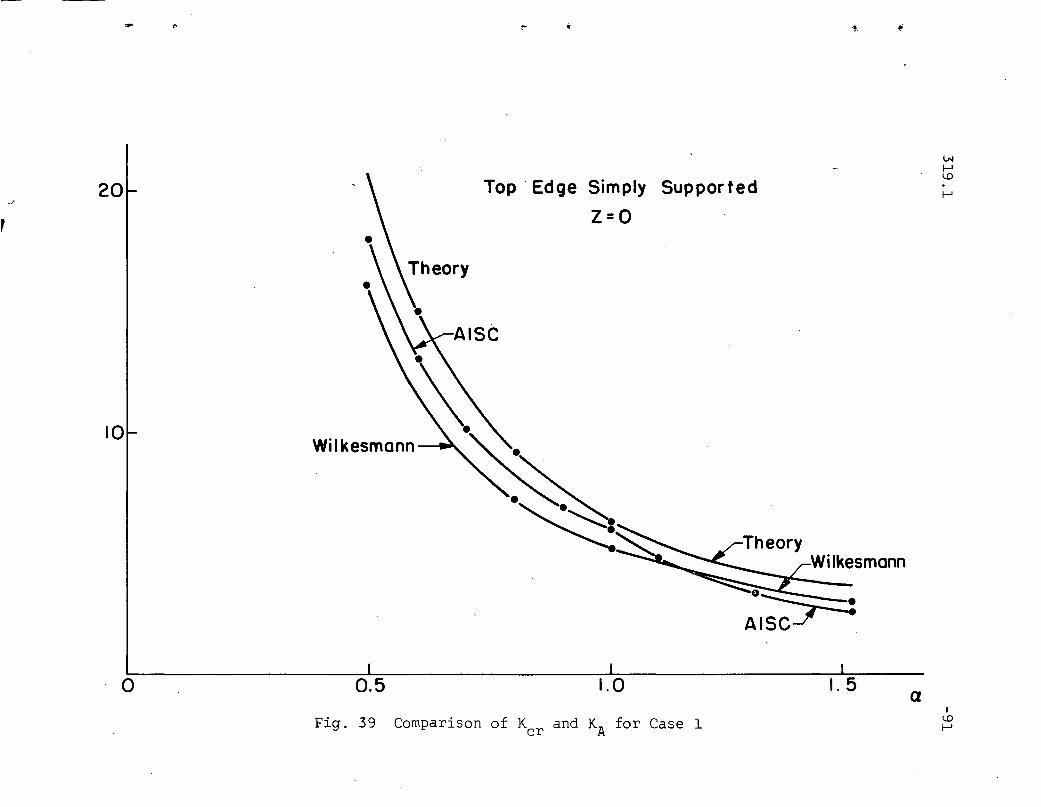
, 20
10
Top· Edge Simply Supported
Z=o
AISC
TheoryWilkesmann
•.....
.f-J
o 0.5 1.0 1.5 aFig. 39 Comparison of Kcr and KA for Case 1
I1Of-J
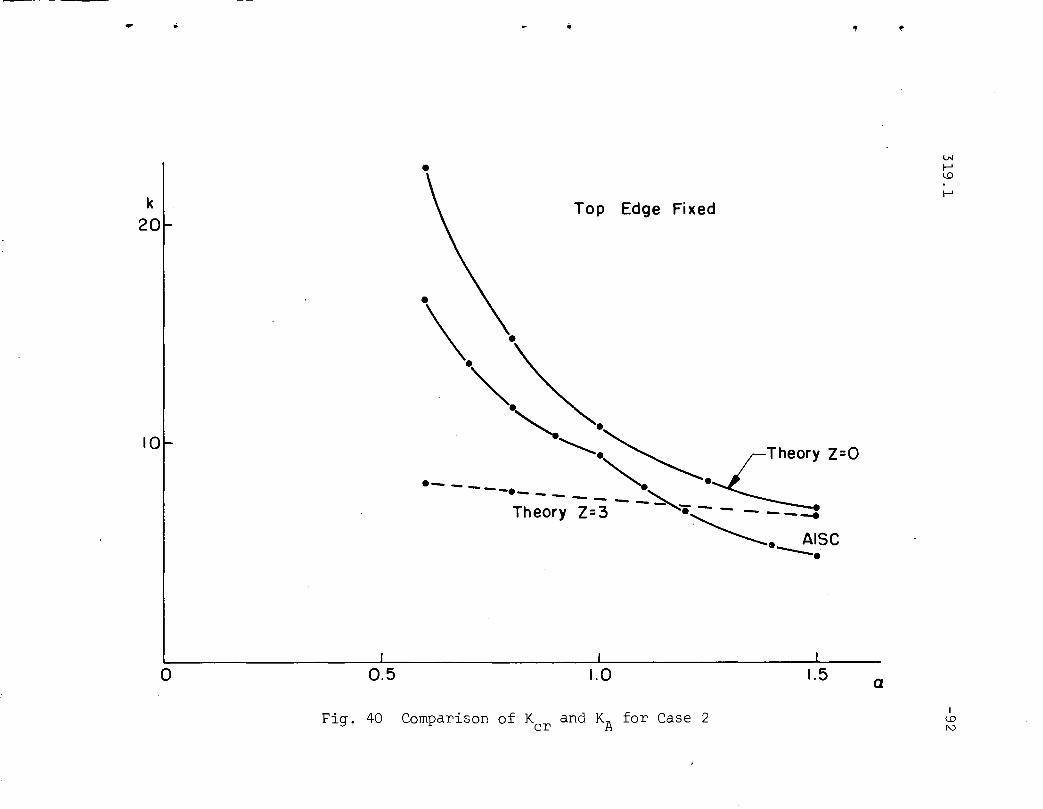
.. ,
•
Top Edge Fixed
•0\0~o
o ... '-...~o fTheory
ZoO
Theory Z=3 - -~. -~~. AISC--- .•
10
k20
o 0.5 1.0 1.5 a
Fig. 40 Comparison of Kcr and KA for Case 2IillN
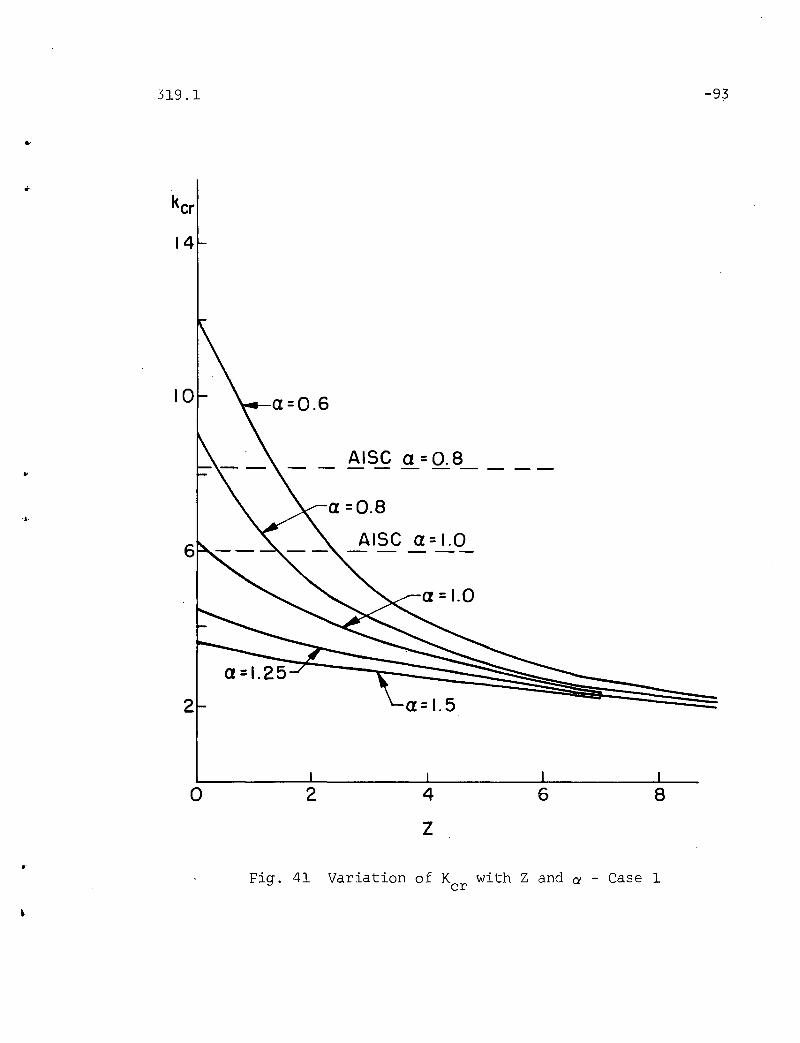
319.1
14
10
AISC a =0.8--------
AISC a =1.0
-93
o 2 4
Z
6 8
Fig. 41 Variation of K with Z and a - Case 1cr

..
319.1
--------AISC, a=0.8
.- - - - - -AISC, 0 =1.00=1.0
-94
o 2 4z
6 8
, Fig. 42 Variation of K with Z and a - Case 2cr

Ku .jcl- aKcr
4 6- 06-
00 0 0
0 03 5
", •
-2
--~_---.--------
AISC a =0.8~
- -------- - AISC a= 1.2~_--------- -o a=0.86- a= 1.2o a = I. 6
o 2 3 4 5
Fig. 43 Variation of K /K ,fa with Zu cr I1OlJl
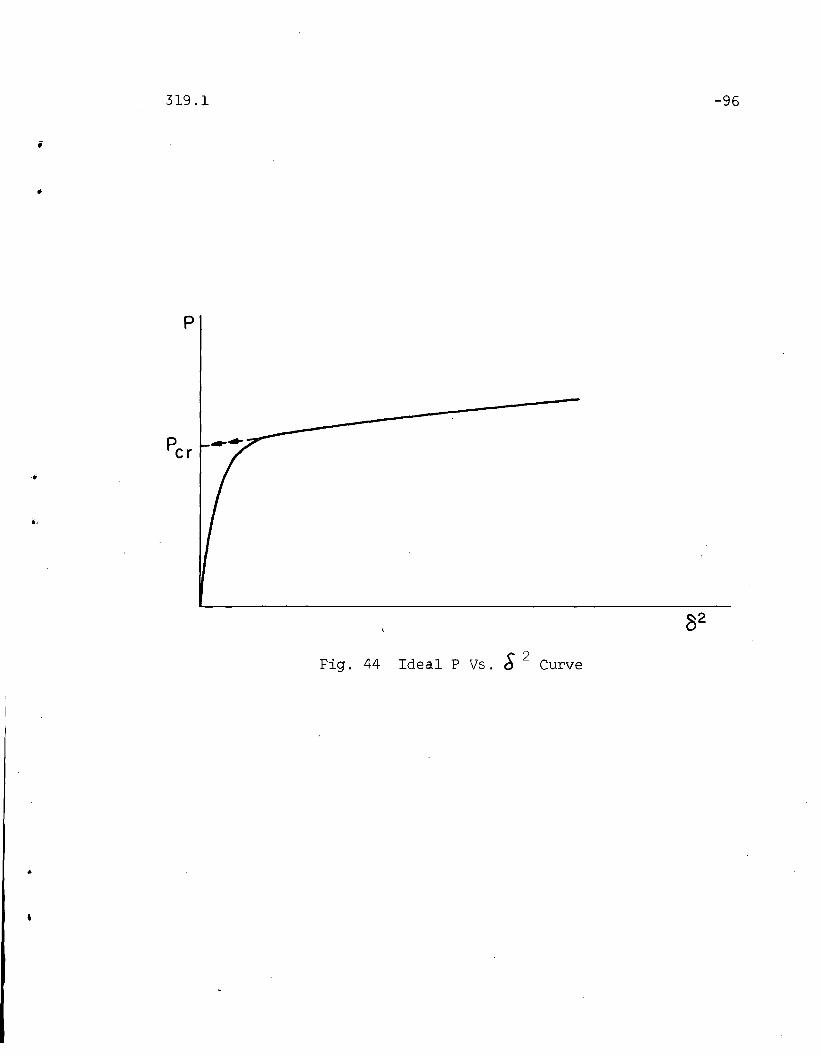
i
319.1 -96
Fig. 44 Ideal P Vs. £ 2 Curve
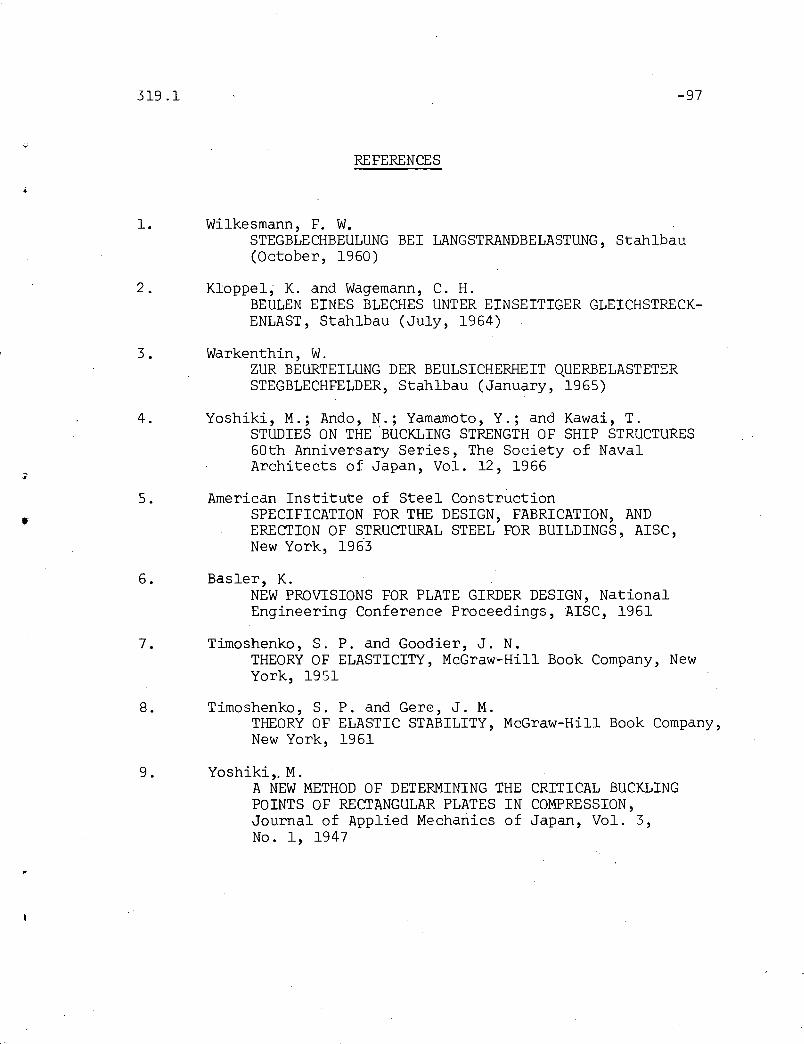
319.1
REFERENCES
-97
1. Wilkesmann, F. W.STEGBLECHBEULUNG BEl LANGSTRANDBELASTUNG, Stahlbau(October, 1960)
2. Kloppel; K. and Wagemann, C. H.BEULEN EINES BLECHES UNTER EINSEITIGER GLEICHSTRECKENLAST, Stahlbau (July, 1964)
3. Warkenthin, W.ZUR BEURTEILUNG DER BEULSICHERHEIT QUERBELASTETERSTEGBLECHFELDER, Stahlbau (January, 1965)
•
4.
5.
Yoshiki, M.; Ando, N.; Yamamoto, Y.; and Kawai, T.STUDIES ON THE 'BUCKLING STRENGTH OF SHIP STRUCTURES60th Anniversary Series, The Society of NavalArchitects of Japan, Vol. 12, 1966
American Institute of Steel ConstructionSPECIFICATION FOR THE DESIGN, FABRICATION, ANDERECTION OF STRUCTURAL STEEL FOR BUILDINGS, AISC,New York, 1963
6. Basler, K.NEW PROVISIONS FOR PLATE GIRDER DESIGN, NationalEngineering Conference Proceedings, AISC, 1961
7. Timoshenko, S.P. and Goodier, J. N.THEORY OF ELASTICITY, McGraw-Hill Book Company, NewYork, 1951
8. Timoshenko, S. P. and Gere, J. M.THEORY OF ELASTIC STABILITY, McGraw-Hill Book Company,New York, 1961
9. Yoshiki" M.A NEW METHOD OF DETERMINING THE CRITICAL BUCKLINGPOINTS OF RECTANGULAR PLATES IN COMPRESSION,Journal of Applied Mechanics of Japan, Vol. 3,No.1, 1947


