
Brookfield Property Partners & GGP
INVESTOR PRESENTATION
MAY 2018
2
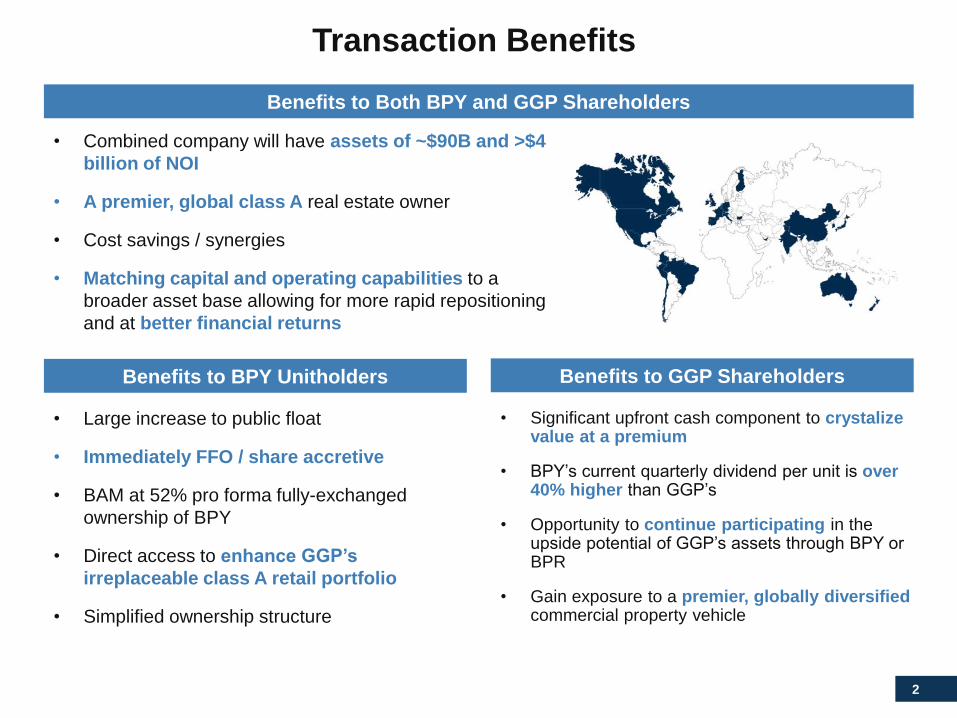
Transaction Benefits
Benefits to Both BPY and GGP Shareholders
Benefits to BPY Unitholders Benefits to GGP Shareholders
• Combined company will have assets of ~$90B and >$4
billion of NOI
• A premier, global class A real estate owner
• Cost savings / synergies
• Matching capital and operating capabilities to a
broader asset base allowing for more rapid repositioning
and at better financial returns
• Significant upfront cash component to crystalize value at a premium
• BPY’s current quarterly dividend per unit is over 40% higher than GGP’s
• Opportunity to continue participating in the upside potential of GGP’s assets through BPY or BPR
• Gain exposure to a premier, globally diversified commercial property vehicle
• Large increase to public float
• Immediately FFO / share accretive
• BAM at 52% pro forma fully-exchanged
ownership of BPY
• Direct access to enhance GGP’s
irreplaceable class A retail portfolio
• Simplified ownership structure

3
Transaction Details
◼ On March 26, 2018, Brookfield Property Partners L.P. (“BPY”) and GGP Inc. (“GGP”) entered
into a definitive agreement for BPY to acquire all of the outstanding common shares of GGP
other than those shares currently held by BPY and its affiliates
◼ For each GGP common share, holders can elect to receive, subject to proration:
◼ $23.50 in cash; or
◼ Either one BPY unit or one share in a new Brookfield Property REIT (“BPR”) which is
structured to provide an economic return equivalent to that of BPY units
◼ A fixed amount of $9.25B cash and approximately 254M of BPR shares / BPY units are
expected to be issued in the transaction
◼ Results in an aggregate cash / equity consideration ratio of approximately 60% / 40%
◼ Cash portion is fully funded with a committed acquisition facility and ~$4B of equity from
strategic and noteworthy joint venture partners. The financing will be repaid through
additional asset sales and asset-level financings over time
The Special Committee of GGP’s Board of Directors has unanimously recommended
the transaction to GGP shareholders
4
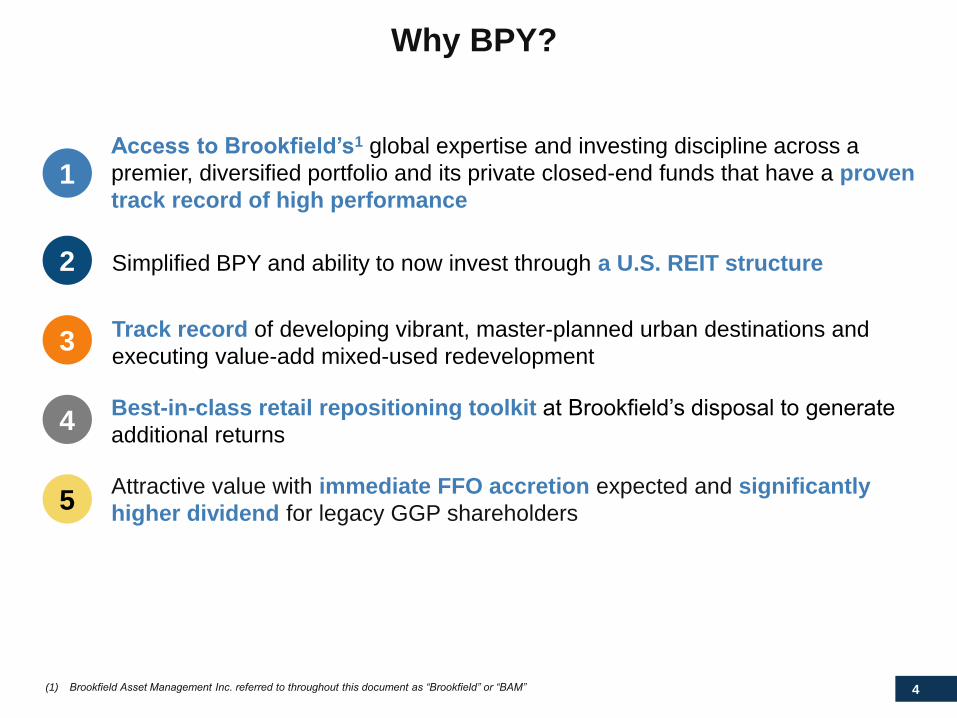
Why BPY?
Attractive value with immediate FFO accretion expected and significantly
higher dividend for legacy GGP shareholders
2
Access to Brookfield’s1 global expertise and investing discipline across a
premier, diversified portfolio and its private closed-end funds that have a proven
track record of high performance1
3
4
5
Track record of developing vibrant, master-planned urban destinations and
executing value-add mixed-used redevelopment
Best-in-class retail repositioning toolkit at Brookfield’s disposal to generate
additional returns
Simplified BPY and ability to now invest through a U.S. REIT structure
(1) Brookfield Asset Management Inc. referred to throughout this document as “Brookfield” or “BAM”

5
Vehicle: Brookfield Property Partners (BPY)1
With ~$159B1 in AUM, BPY is BAM’s primary vehicle to make
investments across all strategies in real estate
Our goal is to be the leading global owner and operator of
high-quality real estate, generating an
attractive total return for our unitholders comprised of:
1Current yield supported
by stable and
diversified cash flow
2
5% ‒ 8% annual
distribution growth
3
Capital appreciation
of our asset base
(1) At the Brookfield Property Group level which includes assets of BPY and Brookfield-managed funds
6
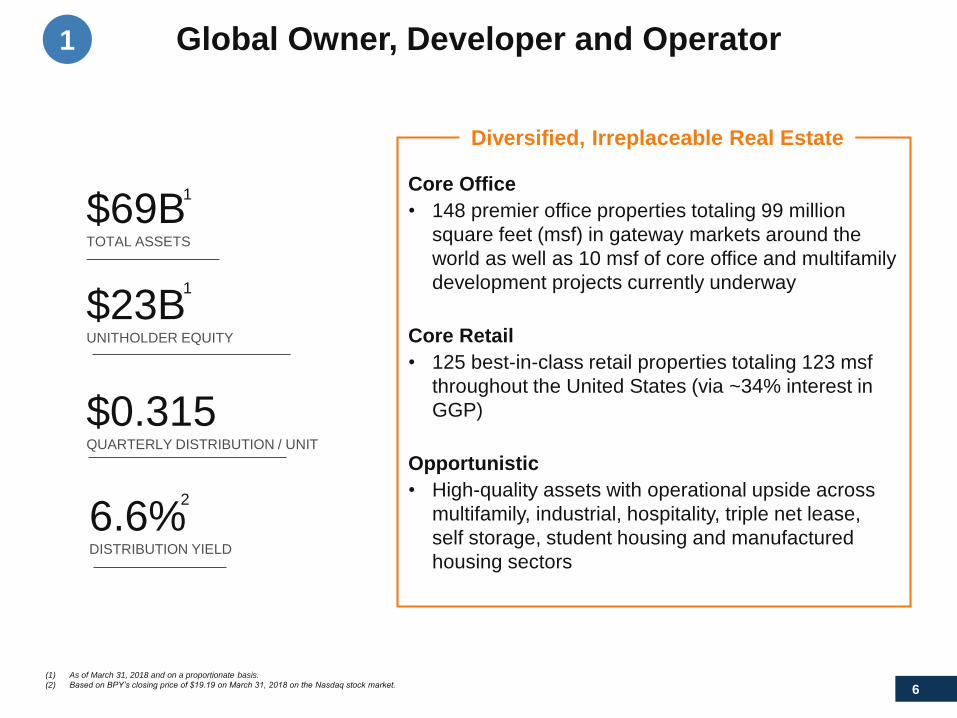
(1) As of March 31, 2018 and on a proportionate basis.
(2) Based on BPY’s closing price of $19.19 on March 31, 2018 on the Nasdaq stock market.
Global Owner, Developer and Operator
Core Office
• 148 premier office properties totaling 99 million
square feet (msf) in gateway markets around the
world as well as 10 msf of core office and multifamily
development projects currently underway
Core Retail
• 125 best-in-class retail properties totaling 123 msf
throughout the United States (via ~34% interest in
GGP)
Opportunistic
• High-quality assets with operational upside across
multifamily, industrial, hospitality, triple net lease,
self storage, student housing and manufactured
housing sectors
$69B TOTAL ASSETS
Diversified, Irreplaceable Real Estate
$23BUNITHOLDER EQUITY
1
$0.315QUARTERLY DISTRIBUTION / UNIT
6.6%DISTRIBUTION YIELD
2
1
1
7
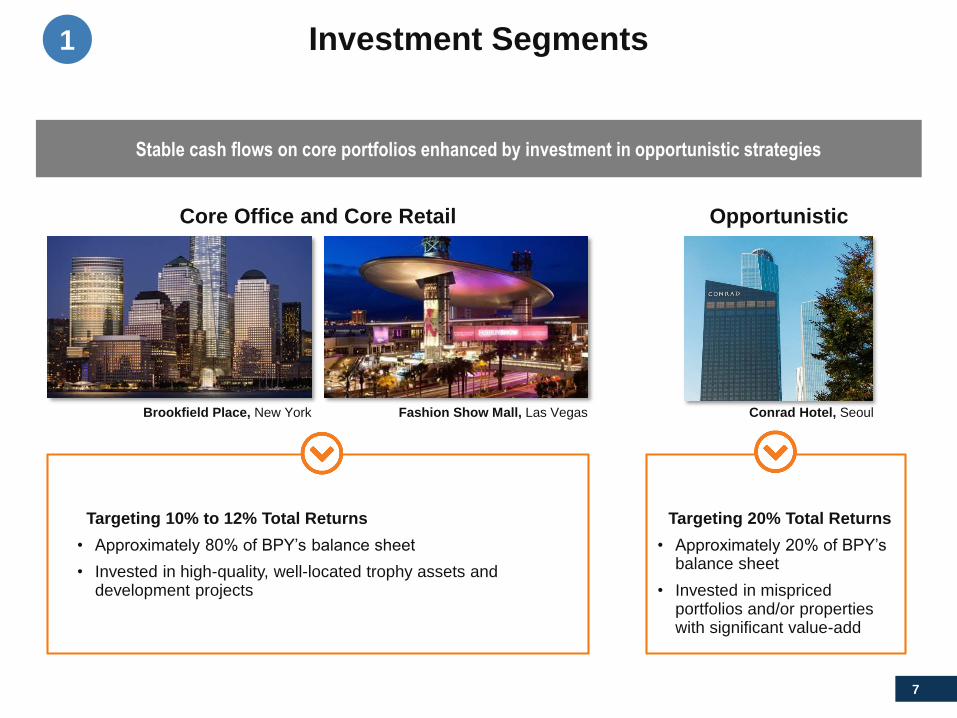
Investment Segments1
Core Office and Core Retail Opportunistic
Brookfield Place, New York Fashion Show Mall, Las Vegas Conrad Hotel, Seoul
Targeting 10% to 12% Total Returns
• Approximately 80% of BPY’s balance sheet
• Invested in high-quality, well-located trophy assets and development projects
Targeting 20% Total Returns
• Approximately 20% of BPY’s balance sheet
• Invested in mispriced portfolios and/or properties with significant value-add
Stable cash flows on core portfolios enhanced by investment in opportunistic strategies
8
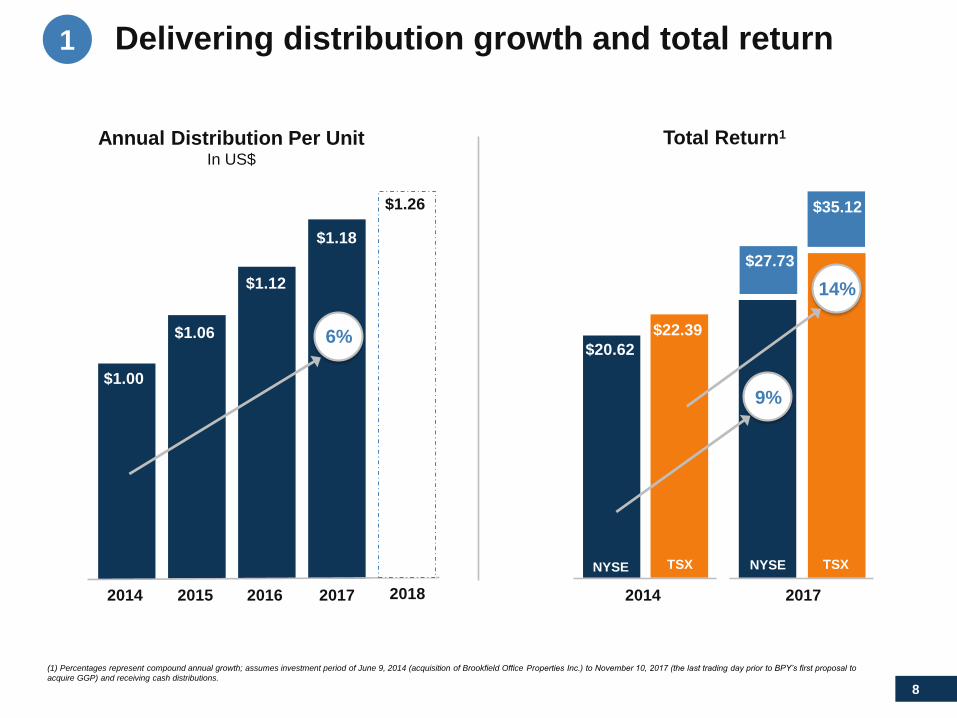
Delivering distribution growth and total return
(1) Percentages represent compound annual growth; assumes investment period of June 9, 2014 (acquisition of Brookfield Office Properties Inc.) to November 10, 2017 (the last trading day prior to BPY’s first proposal to
acquire GGP) and receiving cash distributions.
2014 2015
$1.06
2016
$1.12
2017
$1.00
$1.18
6%
Annual Distribution Per UnitIn US$
2014
$20.62
$22.39
9%
14%
Total Return1
$35.12
$27.73
NYSE TSX NYSE TSX
1
20172018
$1.26
9
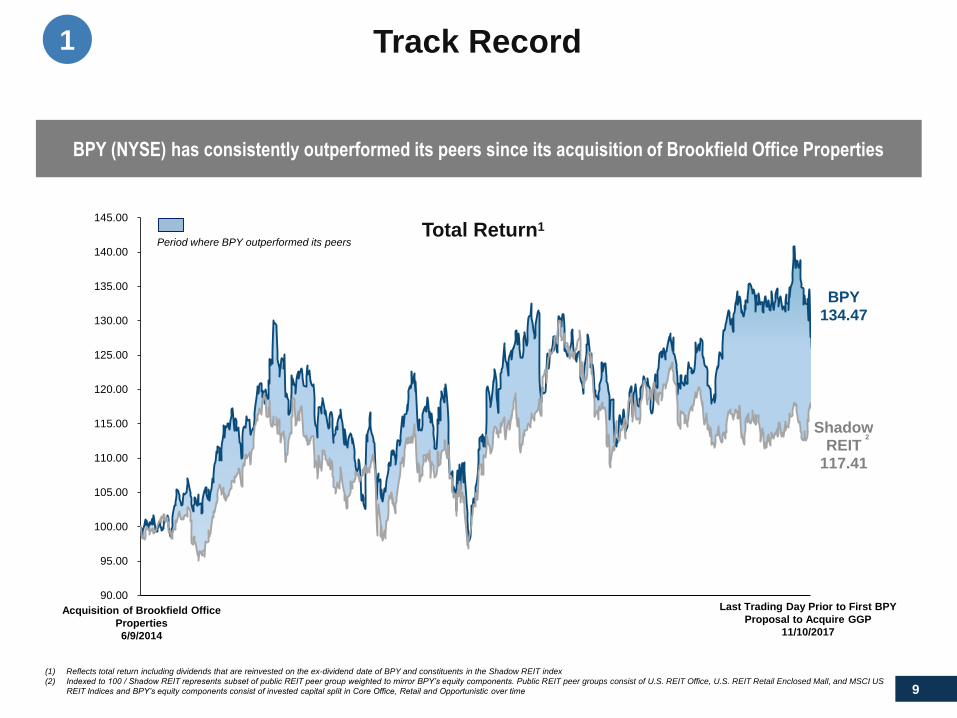
Track Record
BPY (NYSE) has consistently outperformed its peers since its acquisition of Brookfield Office Properties
(1) Reflects total return including dividends that are reinvested on the ex-dividend date of BPY and constituents in the Shadow REIT index
(2) Indexed to 100 / Shadow REIT represents subset of public REIT peer group weighted to mirror BPY’s equity components. Public REIT peer groups consist of U.S. REIT Office, U.S. REIT Retail Enclosed Mall, and MSCI US
REIT Indices and BPY’s equity components consist of invested capital split in Core Office, Retail and Opportunistic over time
90.00
95.00
100.00
105.00
110.00
115.00
120.00
125.00
130.00
135.00
140.00
145.00
BPY 134.47
Shadow REIT
117.41
Acquisition of Brookfield Office
Properties
6/9/2014
Last Trading Day Prior to First BPY
Proposal to Acquire GGP
11/10/2017
Period where BPY outperformed its peers
2
1
Total Return1

10
Value-oriented, counter-cyclical investors
Specialize in executing multi-faceted transactions that allow us to acquire high-quality assets at a discount to replacement cost
Leverage our business units and operational expertise to enhance the value of our investments
Flexibility to allocate capital to the sectors and geographies with the best risk-adjusted returns at various points in the real estate cycle
Continually recycle capital from stabilized assets to higher-yielding opportunities in order to build long-term value for unitholders
Proven Investment Approach1
11
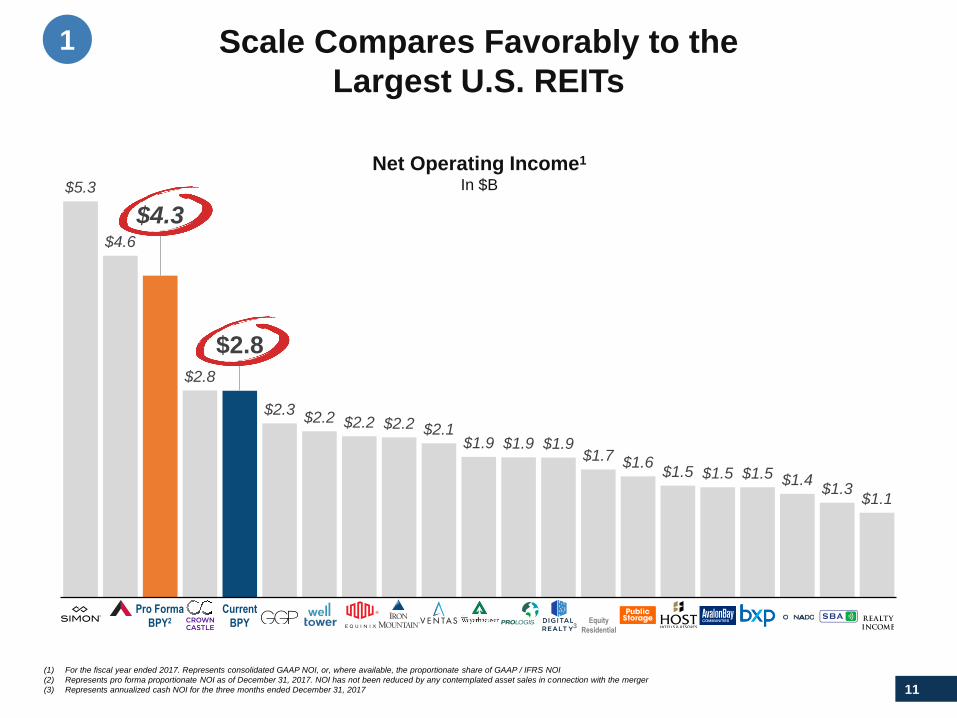
$5.3
$4.6
$4.3
$2.8
$2.8
$2.3 $2.2 $2.2 $2.2 $2.1
$1.9 $1.9 $1.9 $1.7 $1.6
$1.5 $1.5 $1.5 $1.4 $1.3
$1.1
(1) For the fiscal year ended 2017. Represents consolidated GAAP NOI, or, where available, the proportionate share of GAAP / IFRS NOI
(2) Represents pro forma proportionate NOI as of December 31, 2017. NOI has not been reduced by any contemplated asset sales in connection with the merger
(3) Represents annualized cash NOI for the three months ended December 31, 2017
Scale Compares Favorably to the
Largest U.S. REITs
3
Pro Forma
BPY2
Current
BPY Equity
Residential
1
Net Operating Income1
In $B
12
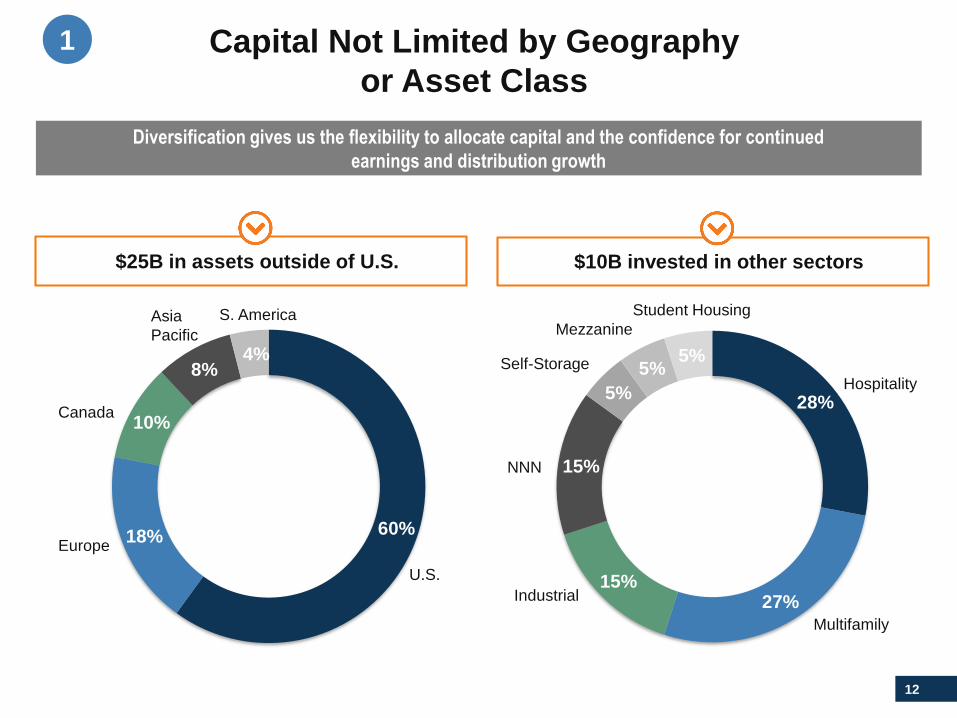
Capital Not Limited by Geography
or Asset Class
60%18%
10%
8%4%
U.S.
S. America
Canada
Europe
Asia
Pacific
28%
27%15%
15%
5%
5%5%
Student Housing
NNN
Industrial
Mezzanine
Self-Storage
Multifamily
Hospitality
1
Diversification gives us the flexibility to allocate capital and the confidence for continued
earnings and distribution growth
$25B in assets outside of U.S. $10B invested in other sectors
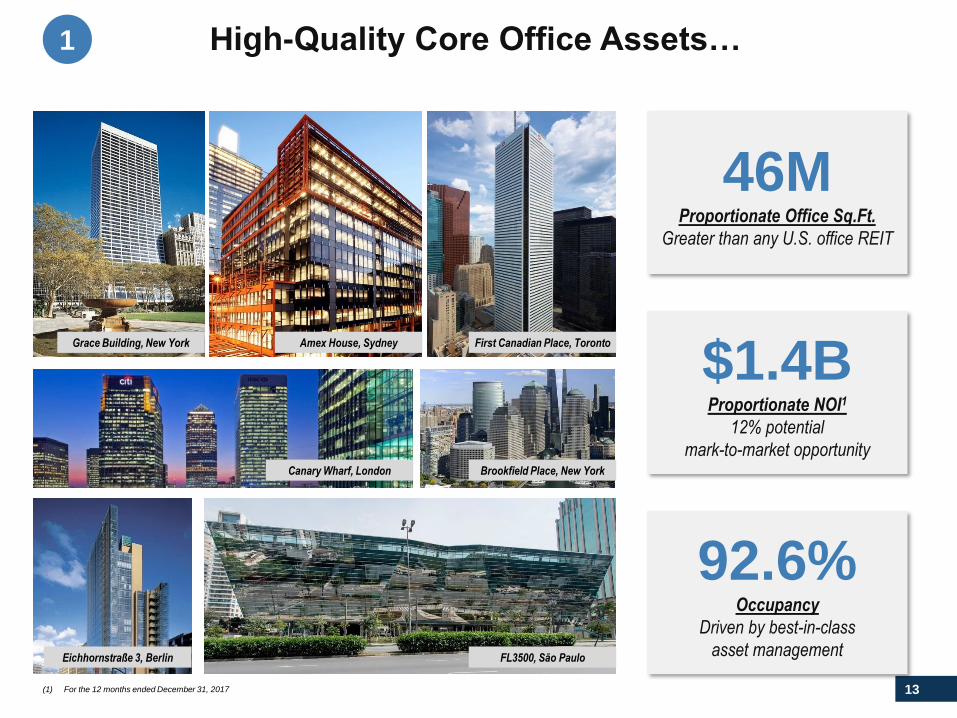
13(1) For the 12 months ended December 31, 2017
46MProportionate Office Sq.Ft.
Greater than any U.S. office REIT
$1.4BProportionate NOI1
12% potential
mark-to-market opportunity
92.6%Occupancy
Driven by best-in-class
asset management
High-Quality Core Office Assets…1
Grace Building, New York Amex House, Sydney First Canadian Place, Toronto
Canary Wharf, London Brookfield Place, New York
FL3500, São PauloEichhornstraße 3, Berlin
14
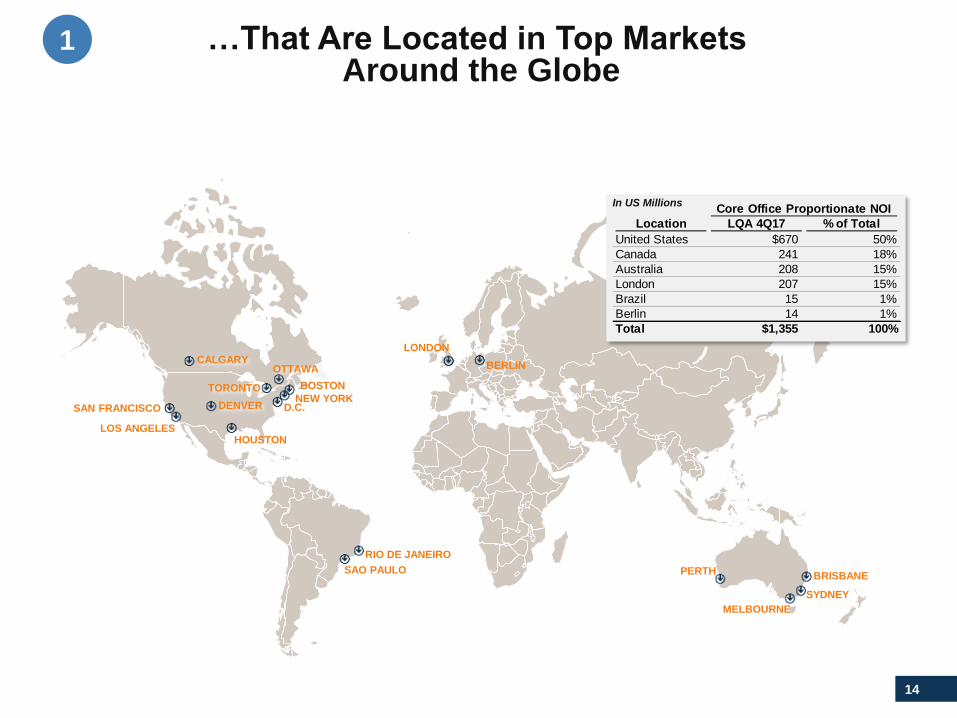
…That Are Located in Top MarketsAround the Globe
SYDNEY
NEW YORK
HOUSTON
BOSTON
LOS ANGELES
SAN FRANCISCO
CALGARYLONDON
BERLIN
MELBOURNE
PERTHBRISBANE
SAO PAULO
RIO DE JANEIRO
DENVER
OTTAWA
TORONTO
D.C.
Core Office Proportionate NOI
Location LQA 4Q17 % of Total
United States $670 50%
Canada 241 18%
Australia 208 15%
London 207 15%
Brazil 15 1%
Berlin 14 1%
Total $1,355 100%
1
In US Millions
15
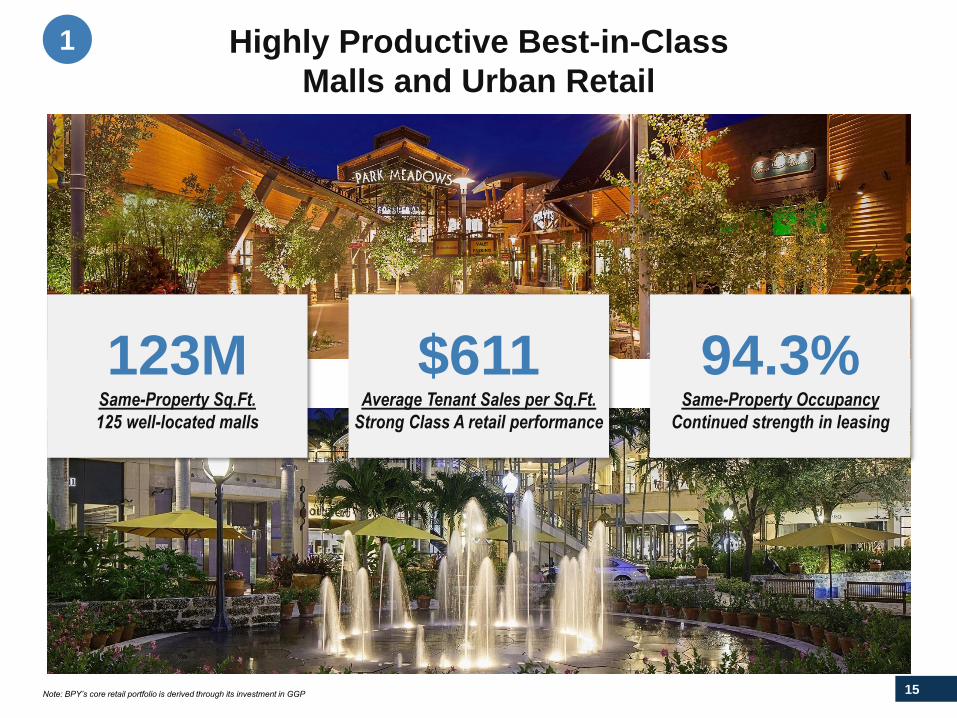
123MSame-Property Sq.Ft.
125 well-located malls
Highly Productive Best-in-Class
Malls and Urban Retail
$611Average Tenant Sales per Sq.Ft.
Strong Class A retail performance
94.3%Same-Property Occupancy
Continued strength in leasing
Note: BPY’s core retail portfolio is derived through its investment in GGP
1
16
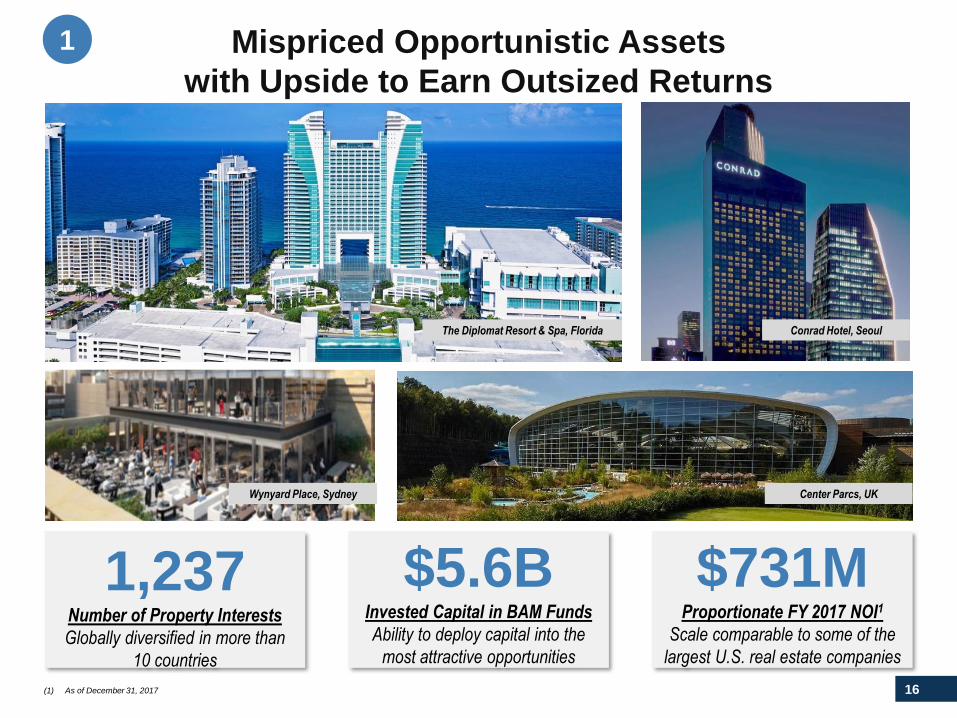
Mispriced Opportunistic Assets
with Upside to Earn Outsized Returns
The Diplomat Resort & Spa, Florida Conrad Hotel, Seoul
Center Parcs, UKWynyard Place, Sydney
1
$5.6BInvested Capital in BAM Funds
Ability to deploy capital into the
most attractive opportunities
$731MProportionate FY 2017 NOI1
Scale comparable to some of the
largest U.S. real estate companies
1,237Number of Property Interests
Globally diversified in more than
10 countries
(1) As of December 31, 2017

17
47%GROSS IRR
$590MNET PROCEEDS TO BPY
€2.4BGROSS SALE PRICE
4.5xGROSS MOC
Assembled a 45 million square feet global logistics business through the acquisition of three
industrial companies in North America and Europe
◼ Positioned to capitalize on the growing demand for
high-quality logistics space
◼ Developed and delivered 25 million square feet of new
space
◼ Leased over 40 million square feet to achieve 94%
occupancy
◼ Sold $1.9 billion of properties to focus on prime
logistics markets
◼ Increased rent by 12% on rollover leases
◼ Streamlined and strengthened the organization
◼ 47% investment return in just 4-year hold period
BAM Fund Case Study:
IDI Gazeley Returned 47% IRR in 4 Years
1
18
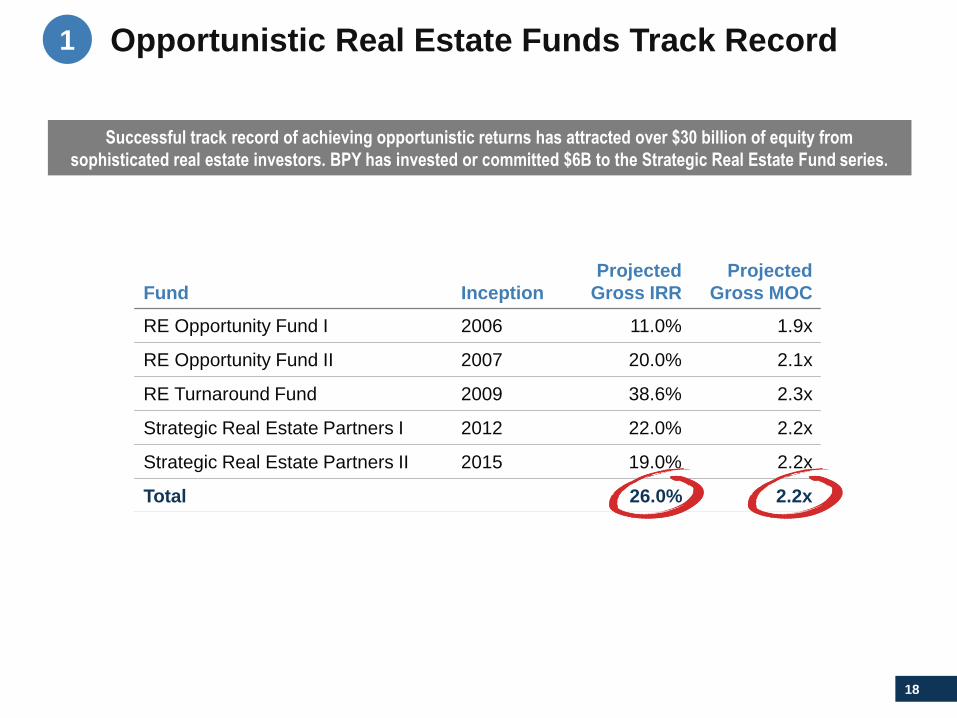
Opportunistic Real Estate Funds Track Record1
Fund Inception
Projected
Gross IRR
Projected
Gross MOC
RE Opportunity Fund I 2006 11.0% 1.9x
RE Opportunity Fund II 2007 20.0% 2.1x
RE Turnaround Fund 2009 38.6% 2.3x
Strategic Real Estate Partners I 2012 22.0% 2.2x
Strategic Real Estate Partners II 2015 19.0% 2.2x
Total 26.0% 2.2x
Successful track record of achieving opportunistic returns has attracted over $30 billion of equity from
sophisticated real estate investors. BPY has invested or committed $6B to the Strategic Real Estate Fund series.
19
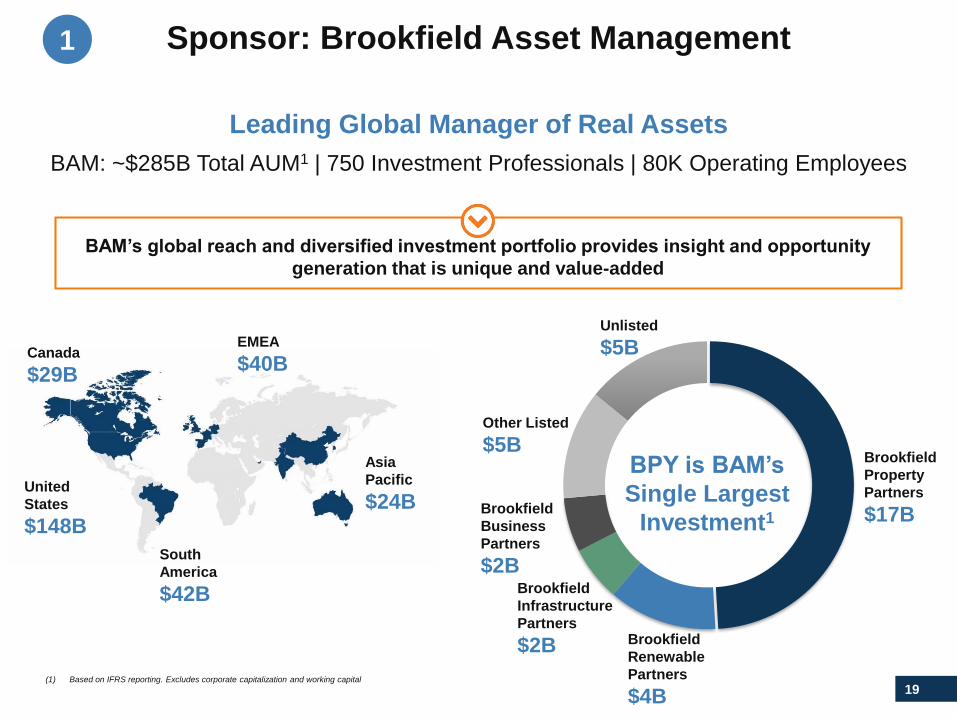
Sponsor: Brookfield Asset Management
(1) Based on IFRS reporting. Excludes corporate capitalization and working capital
BAM: ~$285B Total AUM1 | 750 Investment Professionals | 80K Operating Employees
BAM’s global reach and diversified investment portfolio provides insight and opportunity
generation that is unique and value-added
Leading Global Manager of Real Assets
1
BPY is BAM’s
Single Largest
Investment1
Canada
$29B
United
States
$148B
South
America
$42B
Asia
Pacific
$24B
EMEA
$40B
Unlisted
$5B
Other Listed
$5B
Brookfield
Business
Partners
$2BBrookfield
Infrastructure
Partners
$2B Brookfield
Renewable
Partners
$4B
Brookfield
Property
Partners
$17B
20
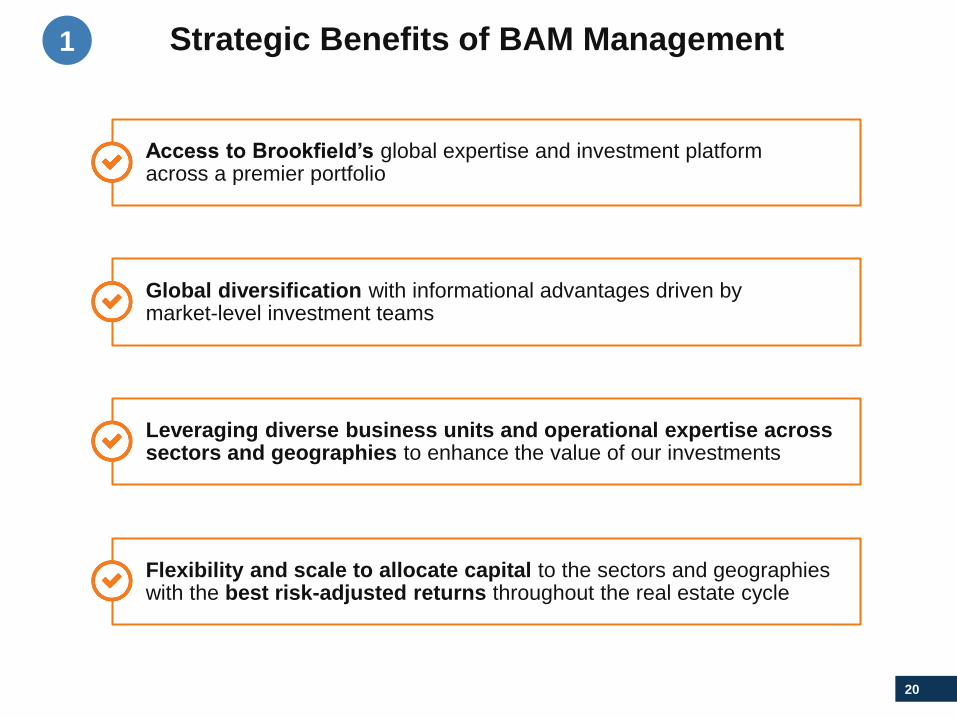
Access to Brookfield’s global expertise and investment platform across a premier portfolio
Global diversification with informational advantages driven by market-level investment teams
Leveraging diverse business units and operational expertise across sectors and geographies to enhance the value of our investments
Flexibility and scale to allocate capital to the sectors and geographies with the best risk-adjusted returns throughout the real estate cycle
Strategic Benefits of BAM Management1

21
Brookfield Property REIT
22
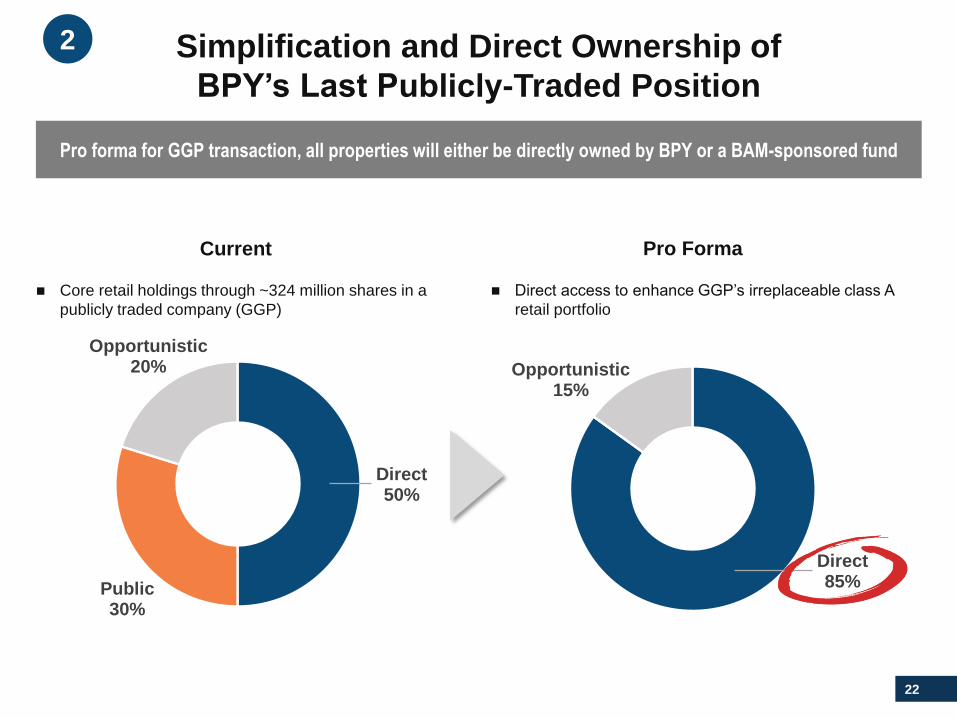
Direct85%
Opportunistic15%
Pro forma for GGP transaction, all properties will either be directly owned by BPY or a BAM-sponsored fund
Direct50%
Public30%
Opportunistic20%
Simplification and Direct Ownership of
BPY’s Last Publicly-Traded Position
Current Pro Forma
◼ Direct access to enhance GGP’s irreplaceable class A
retail portfolio
◼ Core retail holdings through ~324 million shares in a
publicly traded company (GGP)
2
23
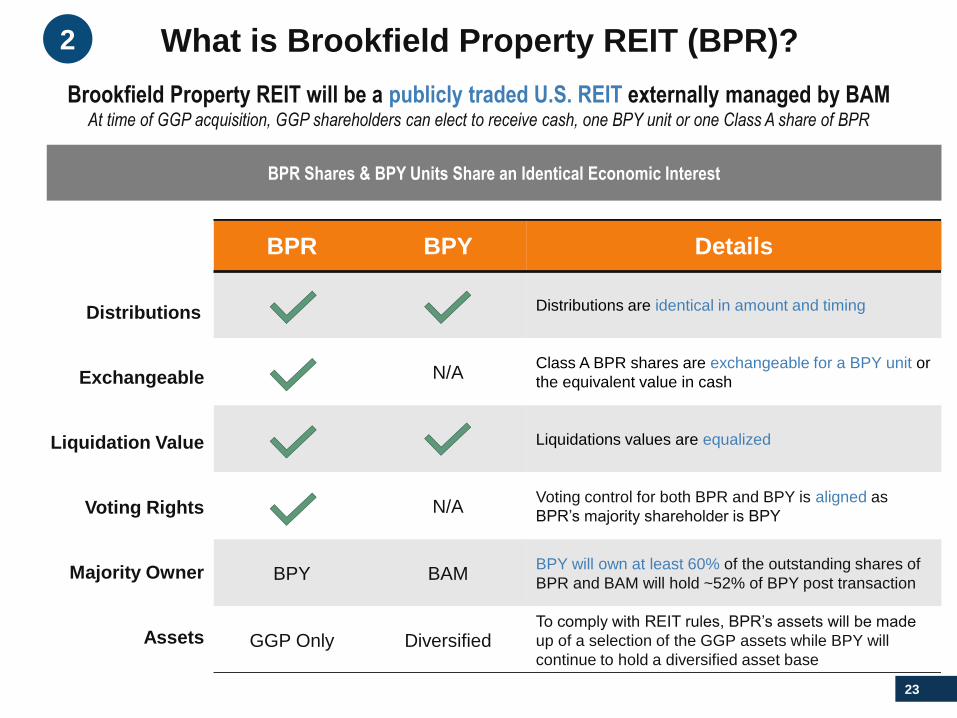
What is Brookfield Property REIT (BPR)?
BPR Shares & BPY Units Share an Identical Economic Interest
BPR BPY Details
Distributions are identical in amount and timing
N/AClass A BPR shares are exchangeable for a BPY unit or
the equivalent value in cash
Liquidations values are equalized
N/AVoting control for both BPR and BPY is aligned as
BPR’s majority shareholder is BPY
BPY BAMBPY will own at least 60% of the outstanding shares of
BPR and BAM will hold ~52% of BPY post transaction
GGP Only DiversifiedTo comply with REIT rules, BPR’s assets will be made
up of a selection of the GGP assets while BPY will
continue to hold a diversified asset base
Brookfield Property REIT will be a publicly traded U.S. REIT externally managed by BAMAt time of GGP acquisition, GGP shareholders can elect to receive cash, one BPY unit or one Class A share of BPR
Distributions
Exchangeable
Liquidation Value
Voting Rights
Majority Owner
Assets
2
24
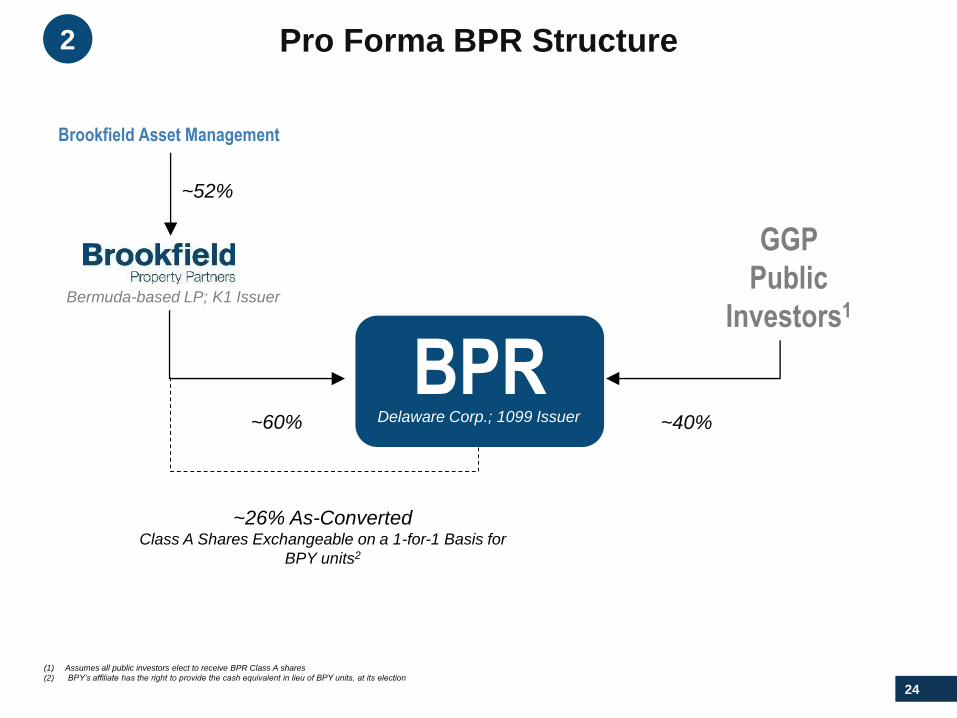
Pro Forma BPR Structure
(1) Assumes all public investors elect to receive BPR Class A shares
(2) BPY’s affiliate has the right to provide the cash equivalent in lieu of BPY units, at its election
GGP
Public
Investors1
BPR~60% ~40%
~26% As-ConvertedClass A Shares Exchangeable on a 1-for-1 Basis for
BPY units2
Brookfield Asset Management
~52%
Bermuda-based LP; K1 Issuer
Delaware Corp.; 1099 Issuer
2

25
Brookfield Placemaking & Development

26(1) Source: U.N.
(2) Source: “Millennials: Myths and Realities,” CBRE, Inc, 2016, www.cbre.com
(3) Source: Wall Street Journal, July 25, 2017. The percentage of U.S. workers who performed some or all their work remotely fell from 24% in 2015 to 22% in 2016
54%of global population lives
in a city, and
continues to grow1
78%of millennials see workplace
quality as important when
choosing an employer2
2%decrease in the percentage of
U.S. workers performing work
remotely in 20163
the Brookfield placemaking edge
◼ Premier office assets
◼ Centralized locations with seamless connectivity
to public transportation
◼ Destination retail and dining
◼ Abundant tenant amenities
◼ Best practices in sustainability
◼ Enjoyable and appealing green spaces
◼ World-class arts and events programs
◼ Hotel and residences
CALGARY
TORONTO
NEW YORK
LONDON BERLIN
DUBAI
SEOUL
PERTH SYDNEY
Placemaking locations
Brookfield: Placemaking Leader
in Premier Mixed-Use Destinations
HOUSTON
3

27
Brookfield Placemaking Destinations Today
Brookfield Place, New York Manhattan West, New York
IFC, Seoul Canary Wharf, London
Potsdamer Platz, Berlin ICD Brookfield Place, Dubai
3
28
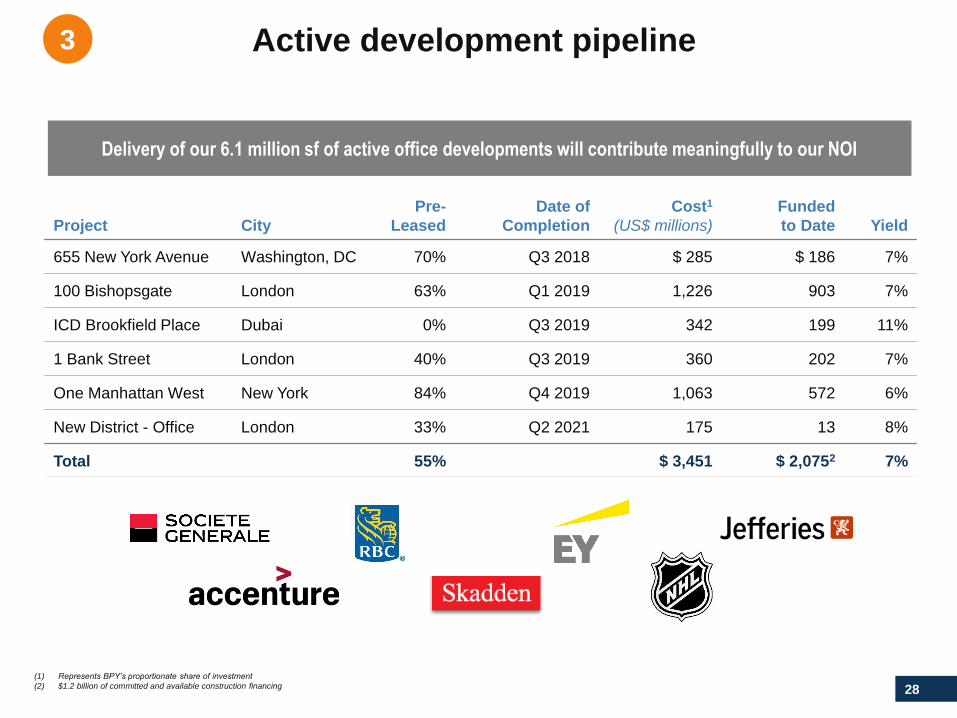
Active development pipeline
Project City
Pre-
Leased
Date of
Completion
Cost1
(US$ millions)
Funded
to Date Yield
655 New York Avenue Washington, DC 70% Q3 2018 $ 285 $ 186 7%
100 Bishopsgate London 63% Q1 2019 1,226 903 7%
ICD Brookfield Place Dubai 0% Q3 2019 342 199 11%
1 Bank Street London 40% Q3 2019 360 202 7%
One Manhattan West New York 84% Q4 2019 1,063 572 6%
New District - Office London 33% Q2 2021 175 13 8%
Total 55% $ 3,451 $ 2,0752 7%
3
Delivery of our 6.1 million sf of active office developments will contribute meaningfully to our NOI
(1) Represents BPY’s proportionate share of investment
(2) $1.2 billion of committed and available construction financing
29
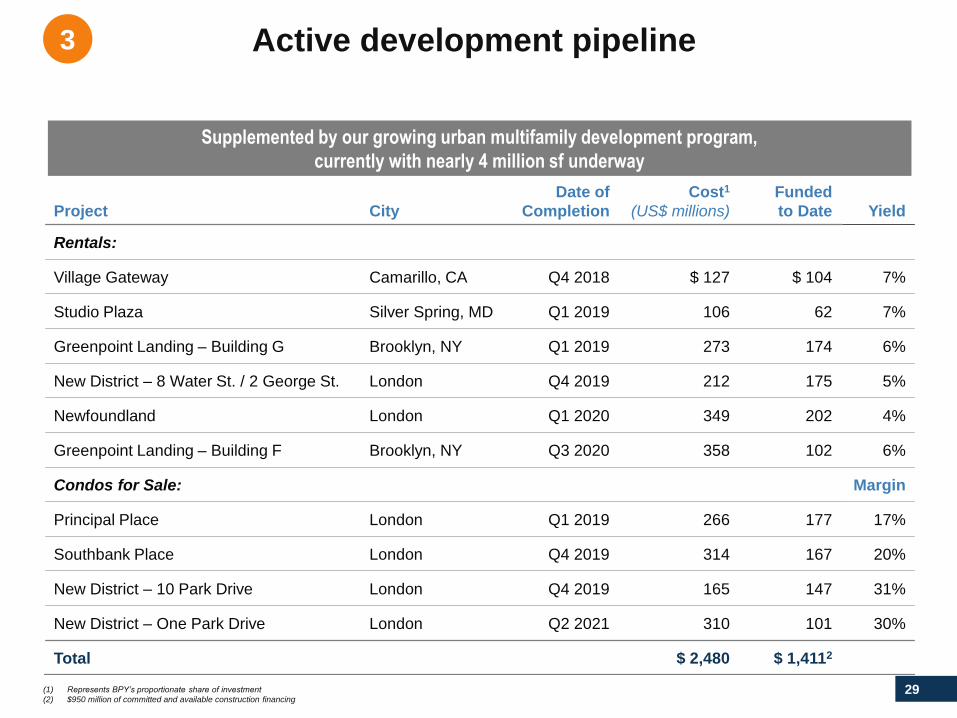
Active development pipeline
Project City
Date of
Completion
Cost1
(US$ millions)
Funded
to Date Yield
Rentals:
Village Gateway Camarillo, CA Q4 2018 $ 127 $ 104 7%
Studio Plaza Silver Spring, MD Q1 2019 106 62 7%
Greenpoint Landing – Building G Brooklyn, NY Q1 2019 273 174 6%
New District – 8 Water St. / 2 George St. London Q4 2019 212 175 5%
Newfoundland London Q1 2020 349 202 4%
Greenpoint Landing – Building F Brooklyn, NY Q3 2020 358 102 6%
Condos for Sale: Margin
Principal Place London Q1 2019 266 177 17%
Southbank Place London Q4 2019 314 167 20%
New District – 10 Park Drive London Q4 2019 165 147 31%
New District – One Park Drive London Q2 2021 310 101 30%
Total $ 2,480 $ 1,4112
(1) Represents BPY’s proportionate share of investment
(2) $950 million of committed and available construction financing
3
Supplemented by our growing urban multifamily development program,
currently with nearly 4 million sf underway
30
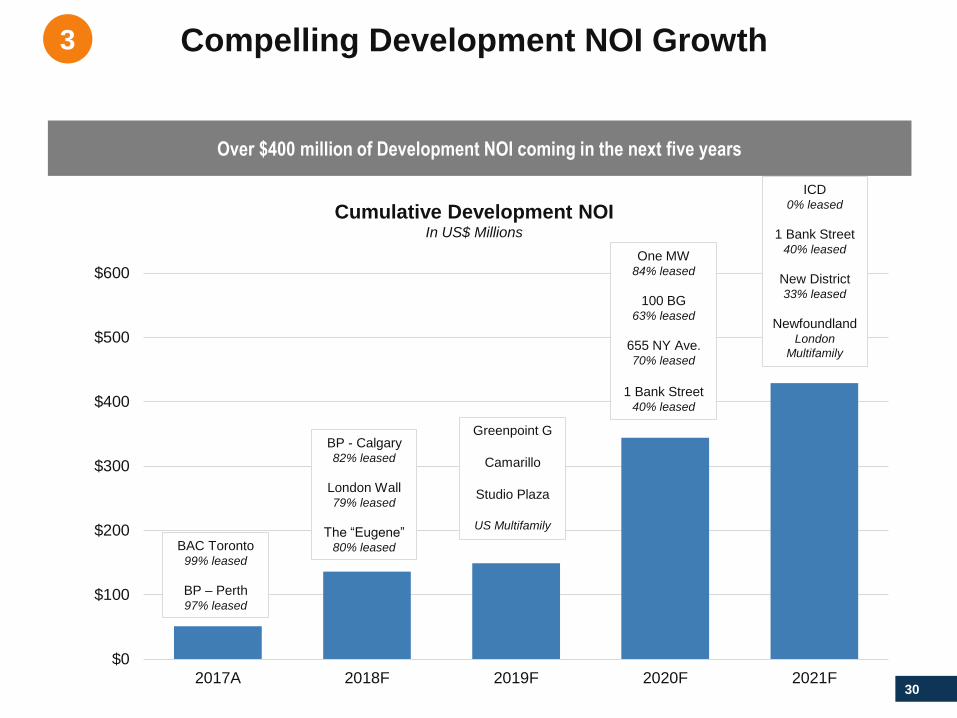
Compelling Development NOI Growth
$0
$100
$200
$300
$400
$500
$600
2017A 2018F 2019F 2020F 2021F
Cumulative Development NOI In US$ Millions
BAC Toronto99% leased
BP – Perth97% leased
Greenpoint G
Camarillo
Studio Plaza
US Multifamily
BP - Calgary82% leased
London Wall79% leased
The “Eugene”80% leased
One MW84% leased
100 BG63% leased
655 NY Ave.
70% leased
1 Bank Street40% leased
3
ICD0% leased
1 Bank Street40% leased
New District33% leased
NewfoundlandLondon
Multifamily
Over $400 million of Development NOI coming in the next five years
31
Brookfield’s Retail Toolkit
32
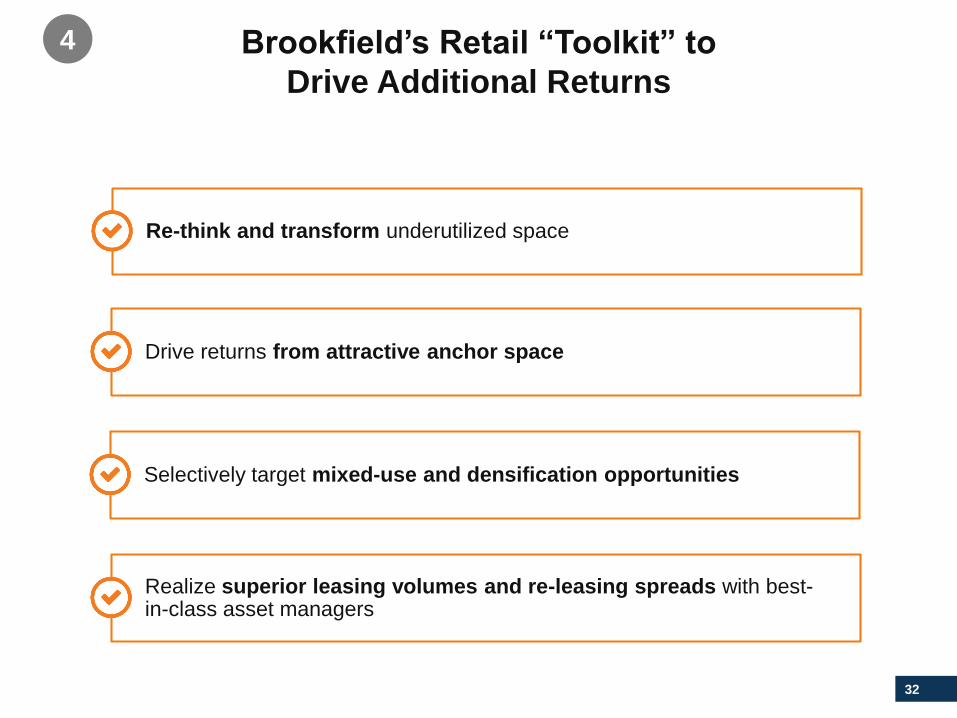
Brookfield’s Retail “Toolkit” to
Drive Additional Returns
4
Re-think and transform underutilized space
Drive returns from attractive anchor space
Selectively target mixed-use and densification opportunities
Realize superior leasing volumes and re-leasing spreads with best-in-class asset managers
33
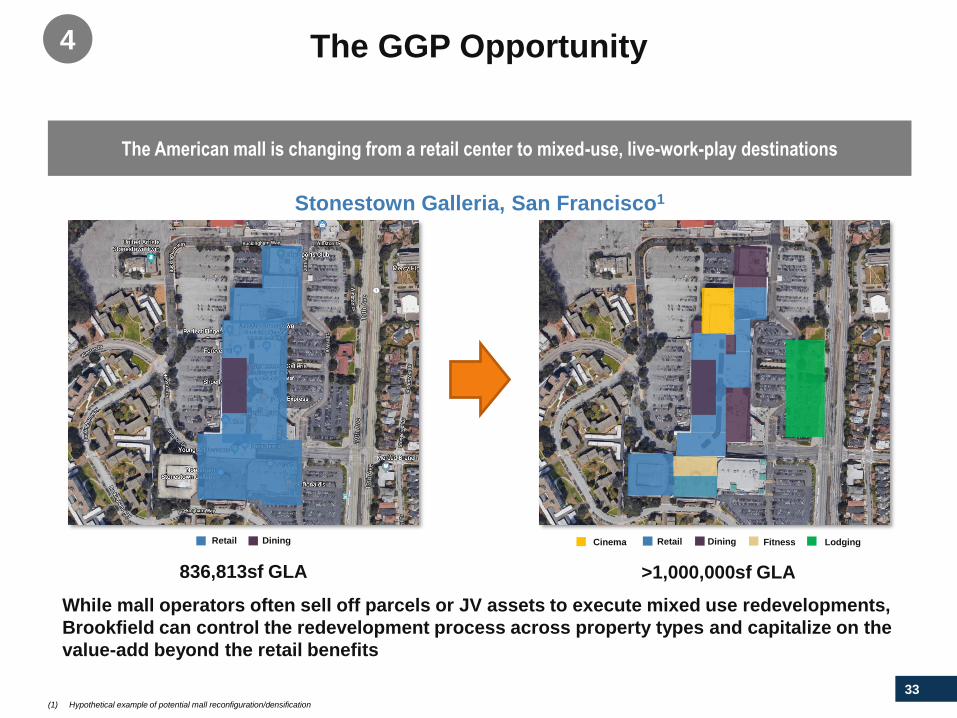
The GGP Opportunity
While mall operators often sell off parcels or JV assets to execute mixed use redevelopments,
Brookfield can control the redevelopment process across property types and capitalize on the
value-add beyond the retail benefits
Stonestown Galleria, San Francisco1
Fitness Lodging
836,813sf GLA >1,000,000sf GLA
Cinema Retail DiningRetail Dining
4
(1) Hypothetical example of potential mall reconfiguration/densification
The American mall is changing from a retail center to mixed-use, live-work-play destinations
34
$0
$5
$10
$15
$20
$25
$0
$50
$100
$150
$200
$250
$300
2012 2013 2014 2015 2016 2017Fcst
2018Fcst
2019Fcst
Incre
menta
l NO
I (US
$ M
illions)C
apital S
pend (
US
$ M
illio
ns)
Act. Capital Proj. Capital Incr. NOI
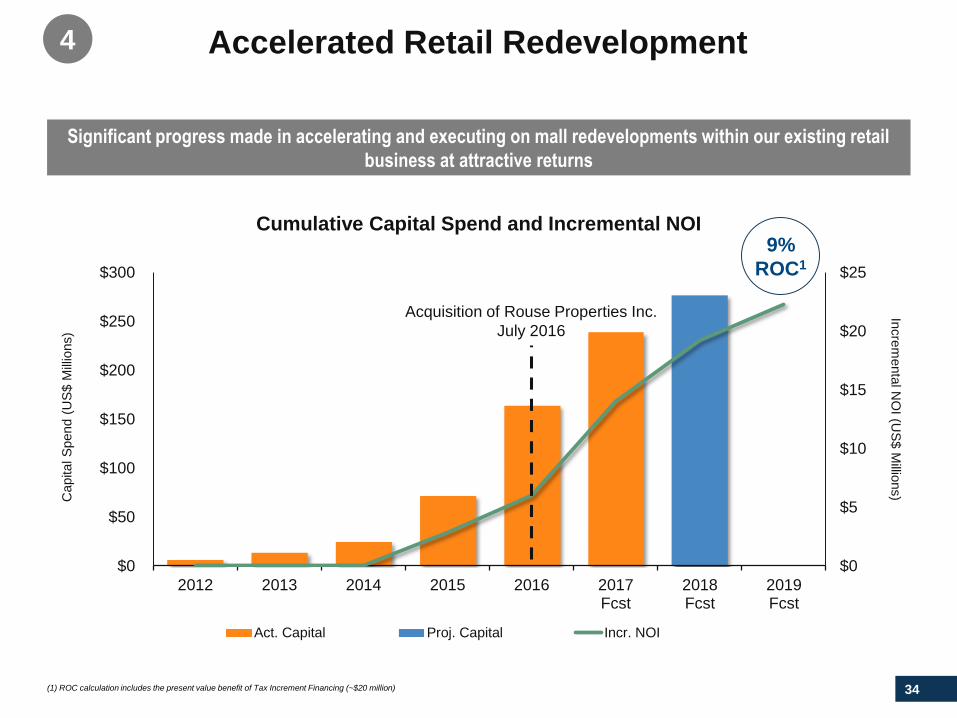
9%
ROC1
Acquisition of Rouse Properties Inc.
July 2016
Accelerated Retail Redevelopment4
Significant progress made in accelerating and executing on mall redevelopments within our existing retail
business at attractive returns
Cumulative Capital Spend and Incremental NOI
(1) ROC calculation includes the present value benefit of Tax Increment Financing (~$20 million)

35
Newark, CA
Newpark Mall Circa 20124
36
Rendering Rendering
RenderingRendering
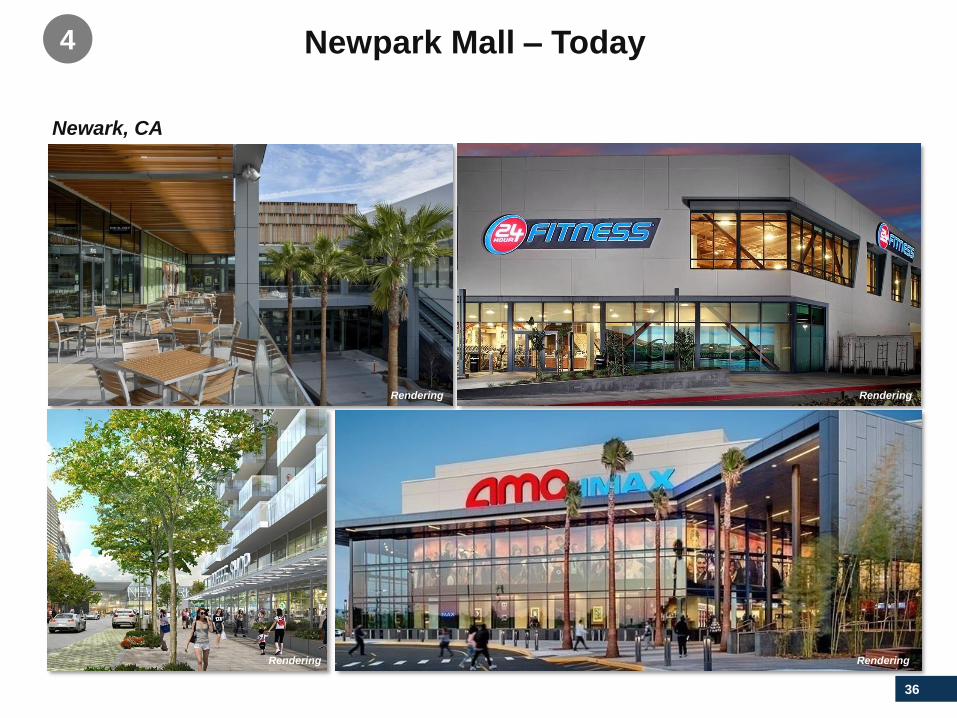
Newark, CA
Newpark Mall – Today 4
37
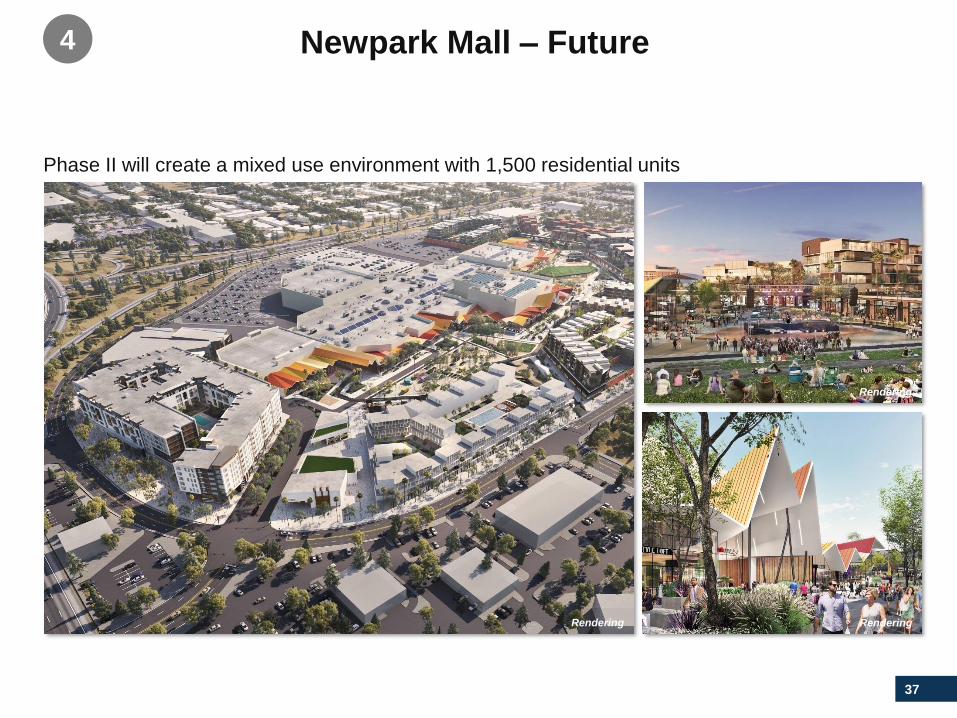
Phase II will create a mixed use environment with 1,500 residential units
Rendering
Rendering
Rendering
Newpark Mall – Future 4
38
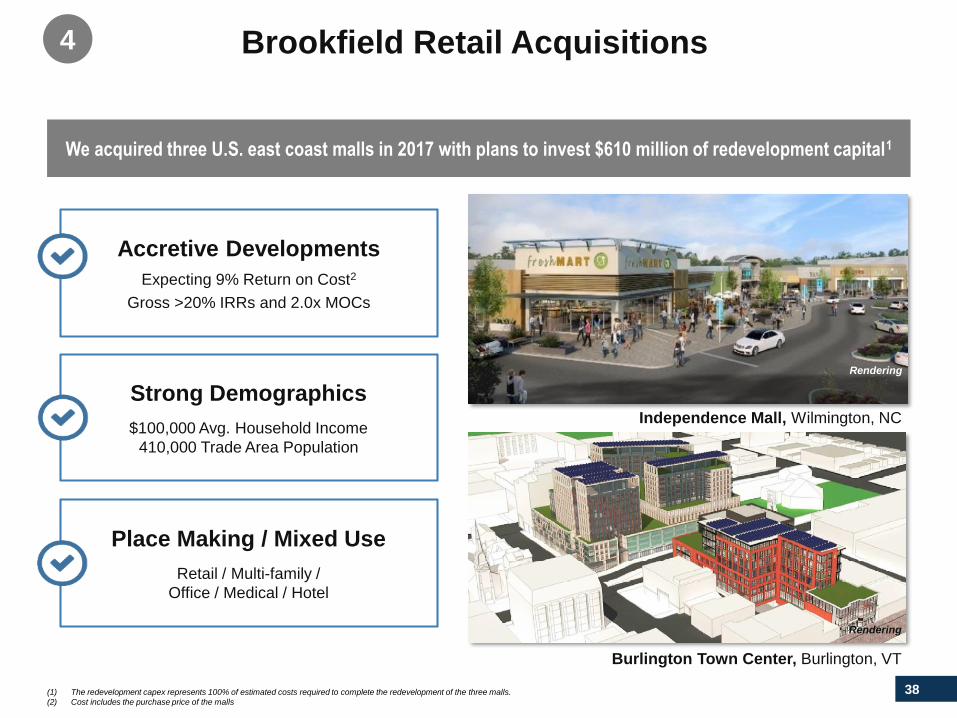
Burlington Town Center, Burlington, VT
Independence Mall, Wilmington, NC
Accretive Developments
Expecting 9% Return on Cost2
Gross >20% IRRs and 2.0x MOCs
Place Making / Mixed Use
Retail / Multi-family /
Office / Medical / Hotel
Strong Demographics
$100,000 Avg. Household Income
410,000 Trade Area Population
Rendering
Rendering
Brookfield Retail Acquisitions4
We acquired three U.S. east coast malls in 2017 with plans to invest $610 million of redevelopment capital1
(1) The redevelopment capex represents 100% of estimated costs required to complete the redevelopment of the three malls.
(2) Cost includes the purchase price of the malls
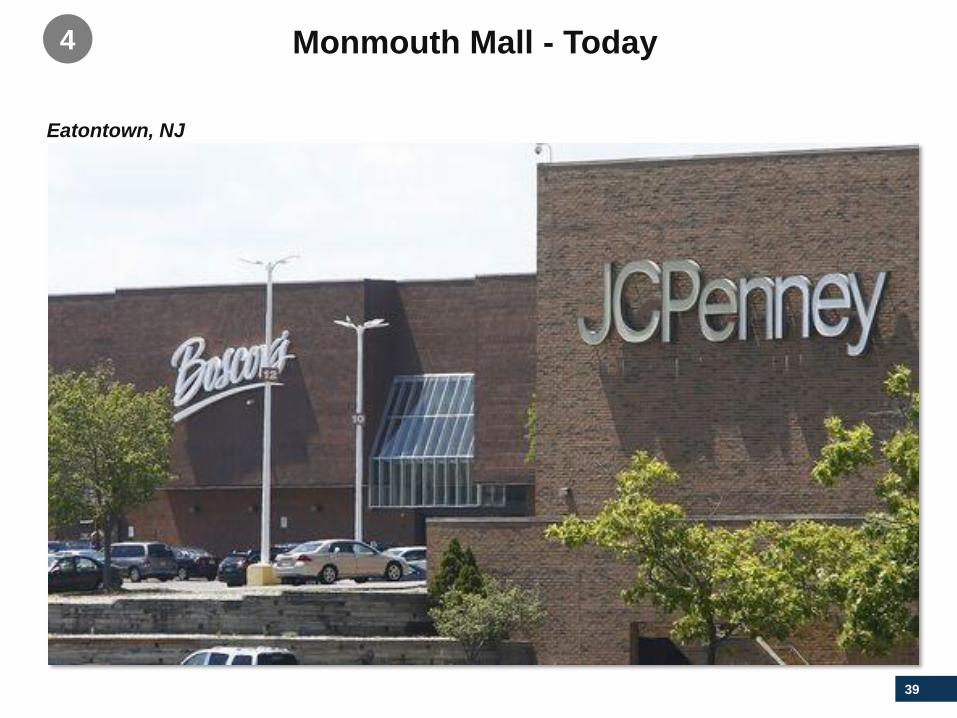
39
Eatontown, NJ
Monmouth Mall - Today4
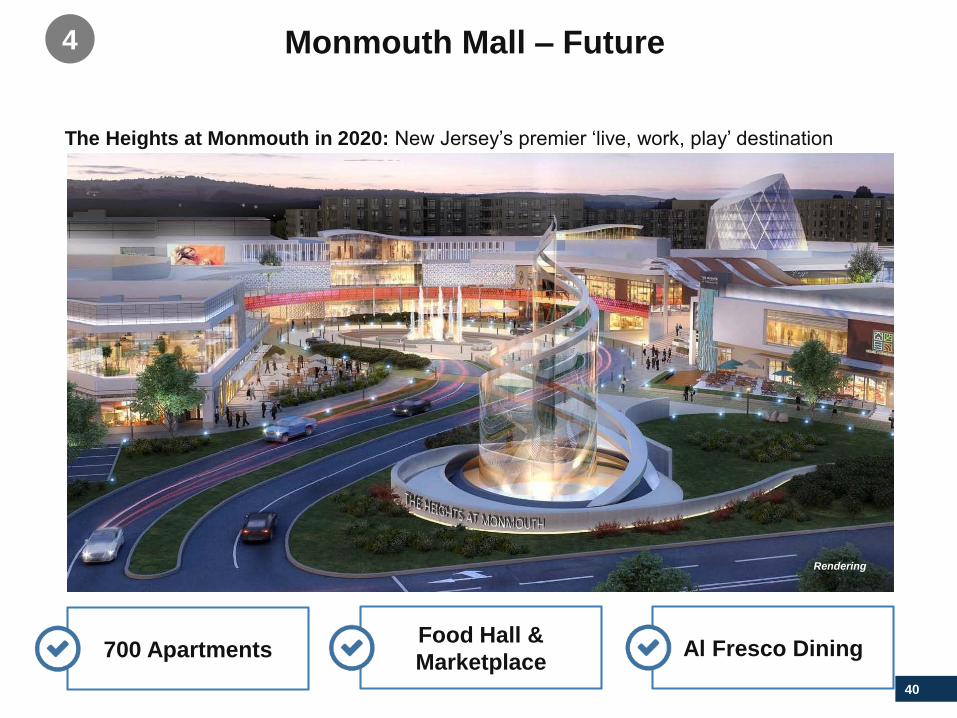
40
The Heights at Monmouth in 2020: New Jersey’s premier ‘live, work, play’ destination
Rendering
700 Apartments Al Fresco DiningFood Hall &
Marketplace
Monmouth Mall – Future 4
Rendering
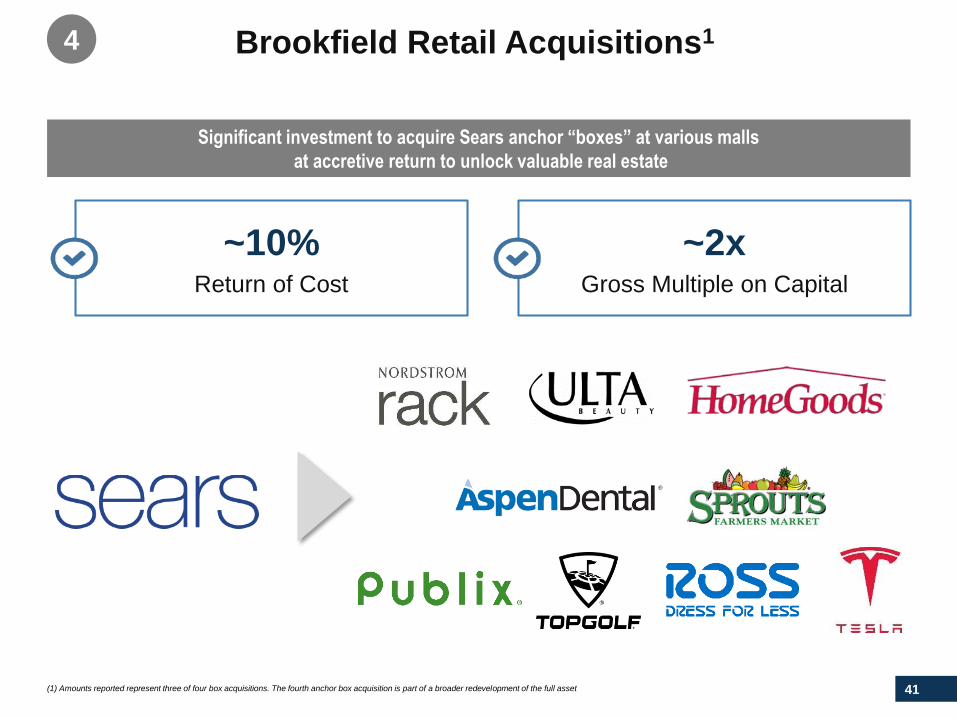
41
~10%Return of Cost
~2xGross Multiple on Capital
Brookfield Retail Acquisitions1
Significant investment to acquire Sears anchor “boxes” at various malls
at accretive return to unlock valuable real estate
4
(1) Amounts reported represent three of four box acquisitions. The fourth anchor box acquisition is part of a broader redevelopment of the full asset

42
Carlsbad, CA
The Shoppes at Carlsbad Sears – Today 4

43
Shoppes at Carlsbad 2019: Top Golf, 320 residential units and new exterior streetscape
Rendering
The Shoppes at Carlsbad – Future 4

44
BPY’s Pro Forma Growth

45
Merger Pro Forma5
Metric BPY Pro Forma at Close
Proportionate Assets $ 68,000 $ 90,000
Proportionate Net Debt $ 34,200 $ 49,000
Debt/EBITDA 13.7 13.0
Consolidated LTV 50% 54%
At close of the transaction, BPY’s total assets increase to almost $90 billion and net debt including
acquisition financing to $49 billion
◼ Subsequent to close, we expect to sell additional assets to repay up to $3 billion of
acquisition debt to reduce leverage to 50% and debt/EBITDA to 12.5x
◼ Transaction is expected to be immediately accretive to BPY’s FFO per unit by
approximately 5%
◼ More than doubles BPY’s public float to 460 million units with the potential for real
estate index inclusion for a portion of the float
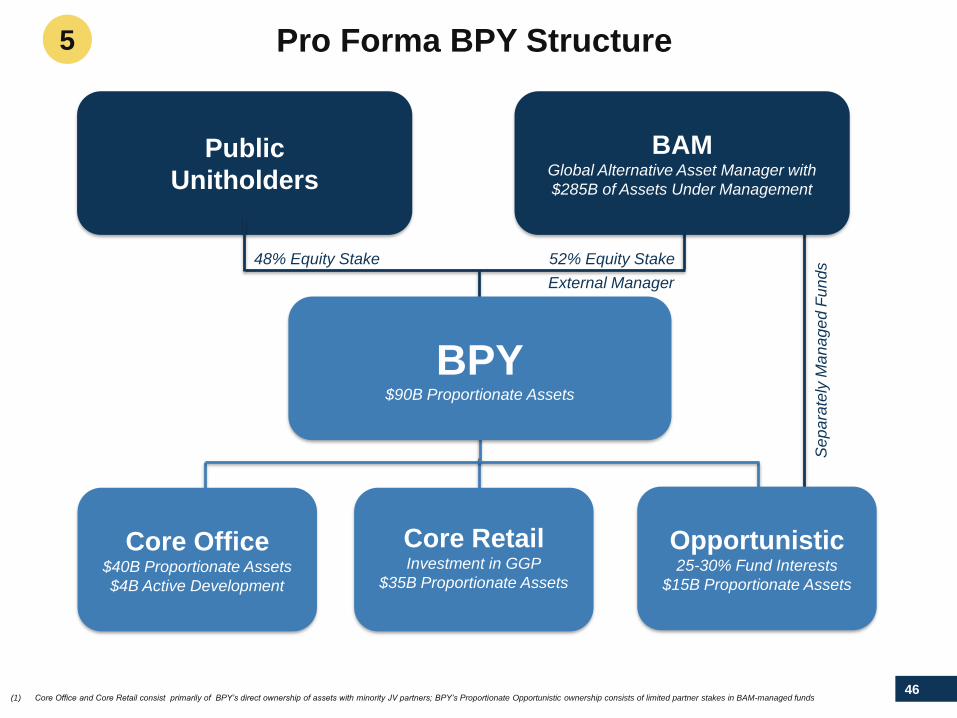
46
Pro Forma BPY Structure
Core Office$40B Proportionate Assets
$4B Active Development
Core Retail Investment in GGP
$35B Proportionate Assets
Public
Unitholders
Opportunistic25-30% Fund Interests
$15B Proportionate Assets
52% Equity Stake48% Equity Stake
BPY$90B Proportionate Assets
Se
pa
rate
ly M
an
ag
ed F
un
ds
External Manager
(1) Core Office and Core Retail consist primarily of BPY’s direct ownership of assets with minority JV partners; BPY’s Proportionate Opportunistic ownership consists of limited partner stakes in BAM-managed funds
5
BAMGlobal Alternative Asset Manager with
$285B of Assets Under Management
47
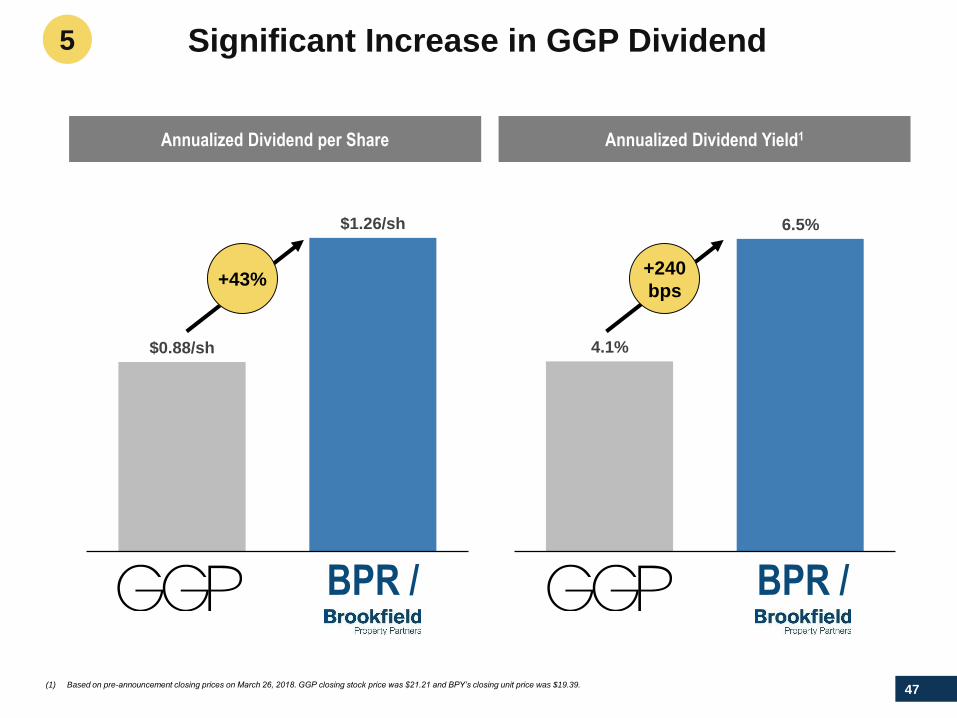
4.1%
6.5%
$0.88/sh
$1.26/sh
Significant Increase in GGP Dividend
+43%+240
bps
BPR / BPR /
Annualized Dividend per Share Annualized Dividend Yield1
(1) Based on pre-announcement closing prices on March 26, 2018. GGP closing stock price was $21.21 and BPY’s closing unit price was $19.39.
5
48
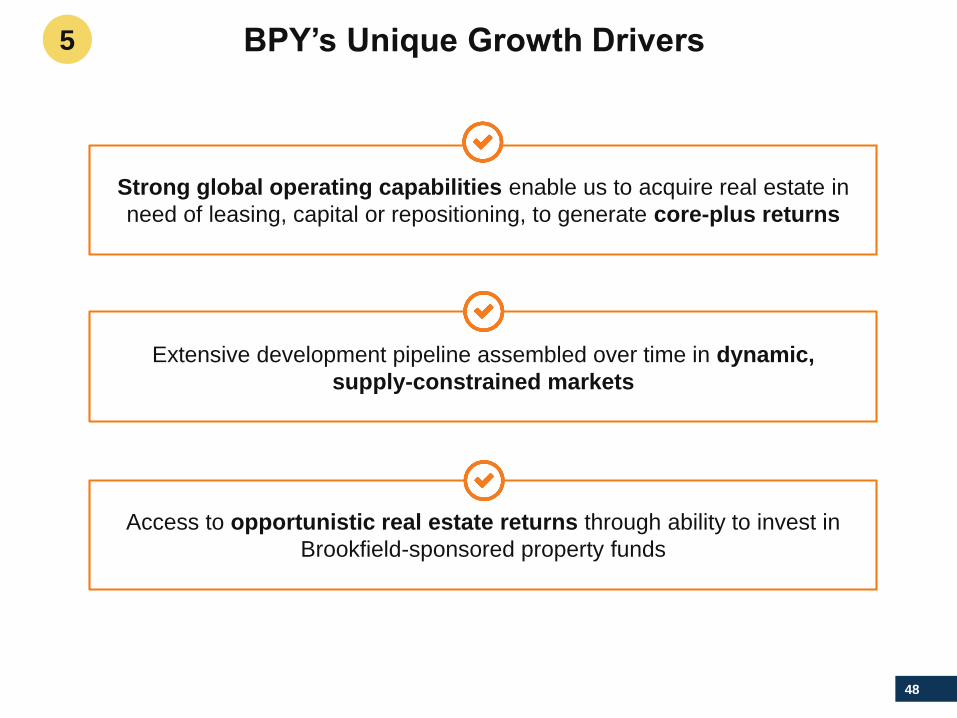
BPY’s Unique Growth Drivers
Strong global operating capabilities enable us to acquire real estate in
need of leasing, capital or repositioning, to generate core-plus returns
Extensive development pipeline assembled over time in dynamic,
supply-constrained markets
Access to opportunistic real estate returns through ability to invest in
Brookfield-sponsored property funds
5
49
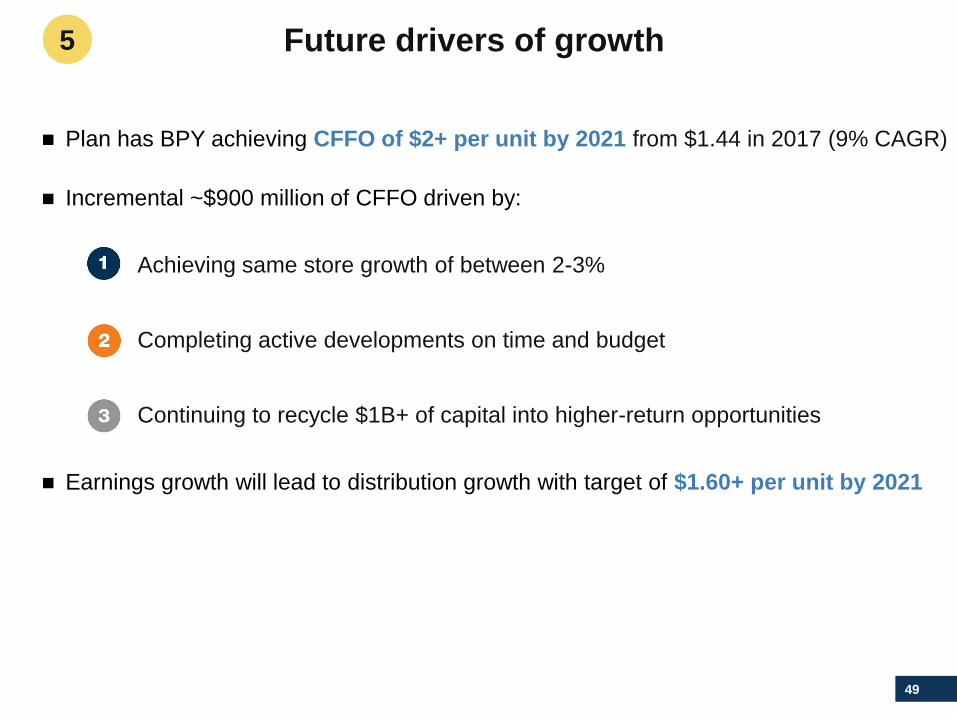
Future drivers of growth
$1.18
◼ Plan has BPY achieving CFFO of $2+ per unit by 2021 from $1.44 in 2017 (9% CAGR)
◼ Incremental ~$900 million of CFFO driven by:
Achieving same store growth of between 2-3%
Completing active developments on time and budget
Continuing to recycle $1B+ of capital into higher-return opportunities
◼ Earnings growth will lead to distribution growth with target of $1.60+ per unit by 2021
5
50
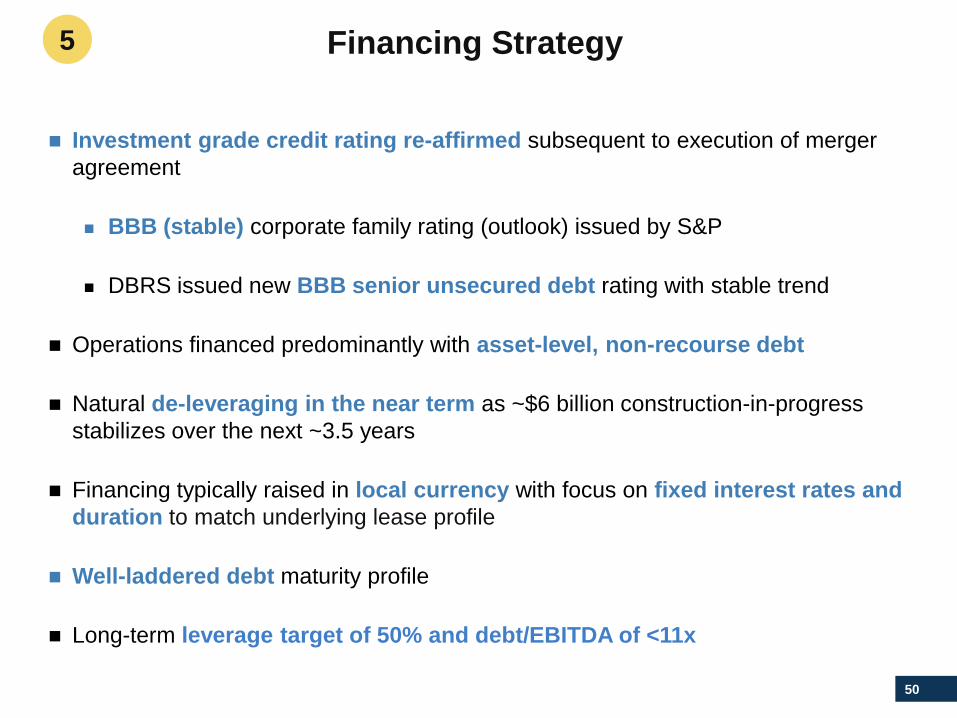
◼ Investment grade credit rating re-affirmed subsequent to execution of merger
agreement
◼ BBB (stable) corporate family rating (outlook) issued by S&P
◼ DBRS issued new BBB senior unsecured debt rating with stable trend
◼ Operations financed predominantly with asset-level, non-recourse debt
◼ Natural de-leveraging in the near term as ~$6 billion construction-in-progress
stabilizes over the next ~3.5 years
◼ Financing typically raised in local currency with focus on fixed interest rates and
duration to match underlying lease profile
◼ Well-laddered debt maturity profile
◼ Long-term leverage target of 50% and debt/EBITDA of <11x
Financing Strategy5
51
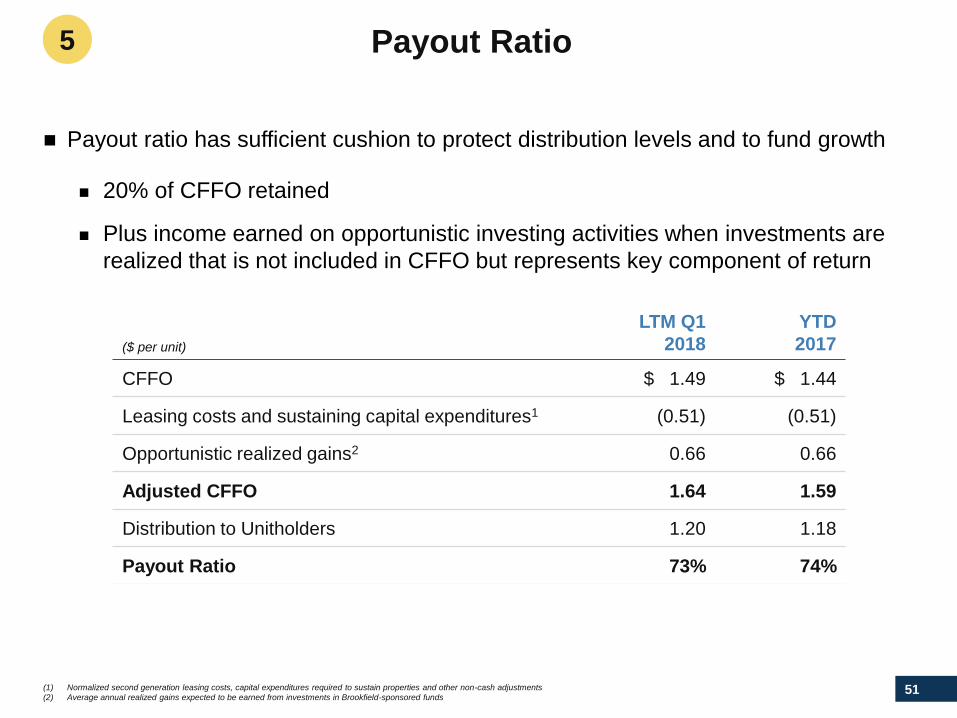
Payout Ratio
◼ Payout ratio has sufficient cushion to protect distribution levels and to fund growth
◼ 20% of CFFO retained
◼ Plus income earned on opportunistic investing activities when investments are
realized that is not included in CFFO but represents key component of return
($ per unit)
LTM Q1
2018
YTD
2017
CFFO $ 1.49 $ 1.44
Leasing costs and sustaining capital expenditures1 (0.51) (0.51)
Opportunistic realized gains2 0.66 0.66
Adjusted CFFO 1.64 1.59
Distribution to Unitholders 1.20 1.18
Payout Ratio 73% 74%
(1) Normalized second generation leasing costs, capital expenditures required to sustain properties and other non-cash adjustments
(2) Average annual realized gains expected to be earned from investments in Brookfield-sponsored funds
5

52
Appendix

53
BPY Senior Management Team
Brian Kingston – Chief Executive Officer and Senior Managing PartnerSince Mr. Kingston joined Brookfield in 2001, he has been engaged in a wide range of merger
& acquisition activities, including Brookfield’s investments in Canary Wharf, O&Y REIT and
O&Y Corp., Trizec Properties and Multiplex. From 2008 to 2013 he led Brookfield’s Australian
business activities, holding the positions of CEO of Brookfield Office Properties Australia, CEO
of Prime Infrastructure and CFO of Multiplex.
Mr. Kingston serves as a member of the Investment Committee and Director of Brookfield’s
real estate company-affiliated boards, including GGP and Canary Wharf. He holds a Bachelor
of Commerce degree from Queen’s University.
Bryan Davis – Chief Financial Officer and Managing Partner
Mr. Davis was Chief Financial Officer at Brookfield’s global office property company for eight
years and spent five years in senior finance roles. Mr. Davis also held various senior finance
positions including Chief Financial Officer of Trilon Financial Corp., Brookfield's financial
services subsidiary. Prior to joining Brookfield in 1999, he worked in restructuring and advisory
services at Deloitte.
Mr. Davis is a Chartered Accountant and holds a Bachelor of Commerce degree from Queen's
University.
Ric Clark – Chairman and Senior Managing Partner
Mr. Clark serves as a director on several of Brookfield’s real estate affiliate company boards,
including chairman of Brookfield Property Partners, and board member of GGP and Canary
Wharf. He serves on the executive committee of the Real Estate Board of New York and is on
the board of directors of the Real Estate Roundtable, Alliance for Downtown New York, 9/11
Memorial Board and the Perelman Performing Arts Center at the World Trade Center. Mr.
Clark also chairs the board of the National Eating Disorders Association.
Mr. Clark holds a Bachelor of Science in Business from the Indiana University in Pennsylvania.
54
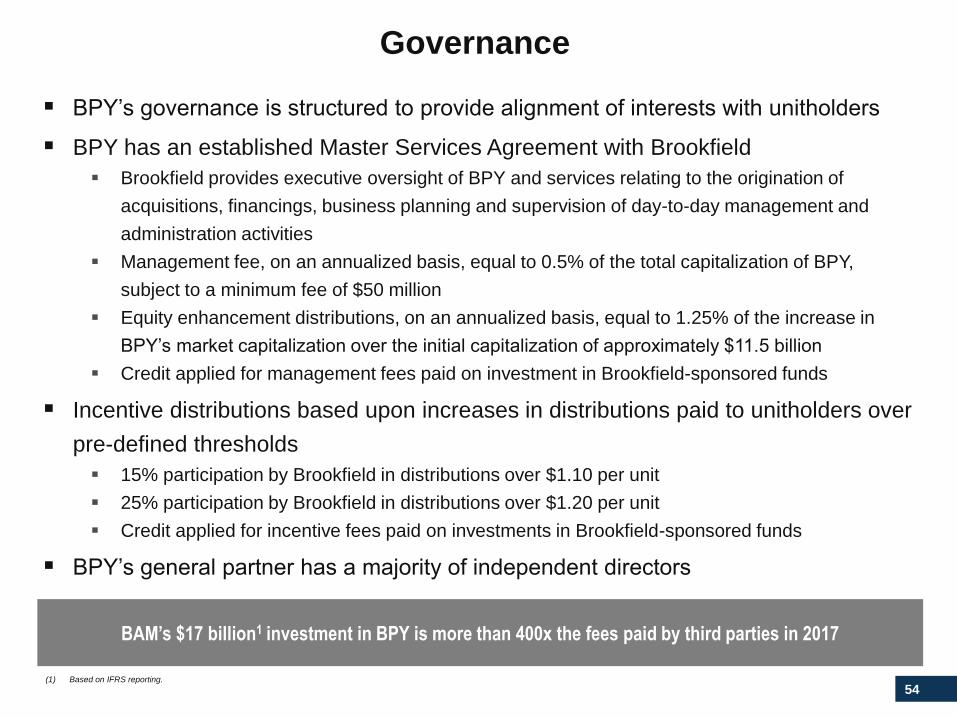
Governance
▪ BPY’s governance is structured to provide alignment of interests with unitholders
▪ BPY has an established Master Services Agreement with Brookfield
▪ Brookfield provides executive oversight of BPY and services relating to the origination of
acquisitions, financings, business planning and supervision of day-to-day management and
administration activities
▪ Management fee, on an annualized basis, equal to 0.5% of the total capitalization of BPY,
subject to a minimum fee of $50 million
▪ Equity enhancement distributions, on an annualized basis, equal to 1.25% of the increase in
BPY’s market capitalization over the initial capitalization of approximately $11.5 billion
▪ Credit applied for management fees paid on investment in Brookfield-sponsored funds
▪ Incentive distributions based upon increases in distributions paid to unitholders over
pre-defined thresholds
▪ 15% participation by Brookfield in distributions over $1.10 per unit
▪ 25% participation by Brookfield in distributions over $1.20 per unit
▪ Credit applied for incentive fees paid on investments in Brookfield-sponsored funds
▪ BPY’s general partner has a majority of independent directors
BAM’s $17 billion1 investment in BPY is more than 400x the fees paid by third parties in 2017
(1) Based on IFRS reporting.
55
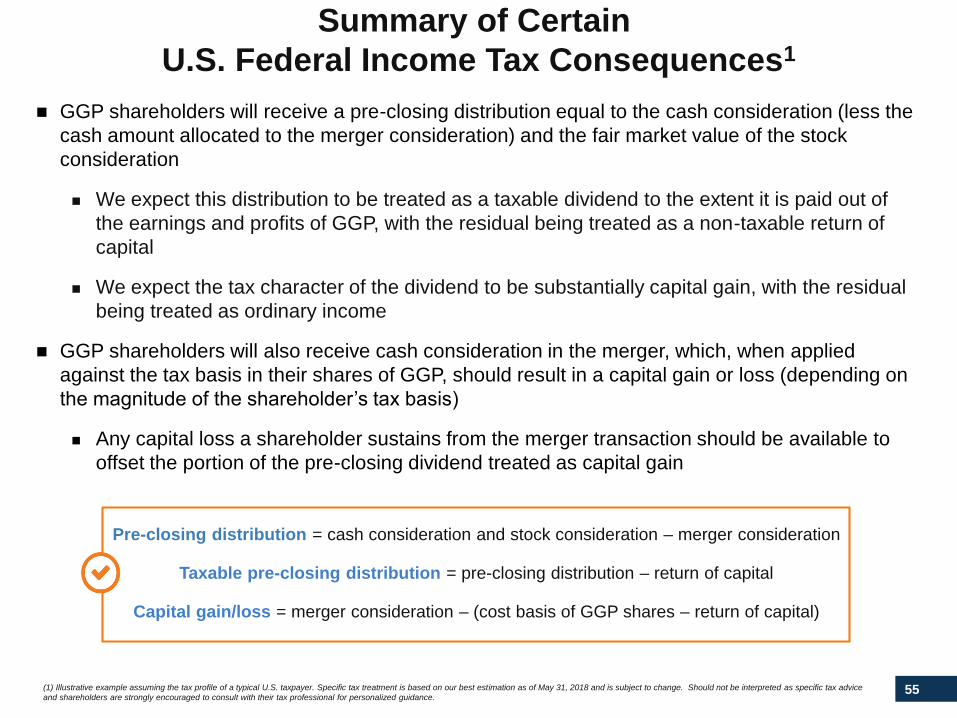
Summary of Certain
U.S. Federal Income Tax Consequences1
◼ GGP shareholders will receive a pre-closing distribution equal to the cash consideration (less the
cash amount allocated to the merger consideration) and the fair market value of the stock
consideration
◼ We expect this distribution to be treated as a taxable dividend to the extent it is paid out of
the earnings and profits of GGP, with the residual being treated as a non-taxable return of
capital
◼ We expect the tax character of the dividend to be substantially capital gain, with the residual
being treated as ordinary income
◼ GGP shareholders will also receive cash consideration in the merger, which, when applied
against the tax basis in their shares of GGP, should result in a capital gain or loss (depending on
the magnitude of the shareholder’s tax basis)
◼ Any capital loss a shareholder sustains from the merger transaction should be available to
offset the portion of the pre-closing dividend treated as capital gain
Pre-closing distribution = cash consideration and stock consideration – merger consideration
Taxable pre-closing distribution = pre-closing distribution – return of capital
Capital gain/loss = merger consideration – (cost basis of GGP shares – return of capital)
(1) Illustrative example assuming the tax profile of a typical U.S. taxpayer. Specific tax treatment is based on our best estimation as of May 31, 2018 and is subject to change. Should not be interpreted as specific tax advice
and shareholders are strongly encouraged to consult with their tax professional for personalized guidance.
56
Disclosure
All amounts are in U.S. dollars unless otherwise specified.
Unless otherwise indicated, the statistical and financial data in this documentis presented as of March 31, 2018.
Caution Regarding Forward-Looking Statements
This presentation contains “forward-looking information” within the meaningof Canadian provincial securities laws and applicable regulation and“forward-looking statements” within the meaning of “safe harbor” provisionsof the United States Private Security Litigation Reform Act of 1995. Forward-looking statements include statements that are predictive in nature, dependupon or refer to future events or conditions, include statements regarding ouroperations, business, financial condition, expected financial results,performance, prospects, opportunities, priorities, targets, goals, ongoingobjectives, strategies and outlook, as well as the outlook for North Americanand international economies for the current fiscal year and subsequentperiods, and include words such as “expects,” “anticipates,” “plans”,“believes,” “estimates”, “seeks,” “intends,” “targets,” “projects,” “forecasts,”“likely,” or negative versions thereof and other similar expressions, or futureor conditional verbs such as “may,” “will,” “should,” “would” and “could”.
Forward-looking statements include, without limitation, statements about theexpected timing, completion and effects of the GGP acquisition and formationof BPR, target earnings and distribution growth, the growth potential of ourexisting and new investments, return on invested capital, gains on mark-to-market releasing and occupancy, targeted same-store growth, expectedcompletion and stabilization dates for our development projects, returns onredevelopment and development projects, the availability of suitableinvestment opportunities, and the availability of financing and our financingstrategy.
Although we believe that our anticipated future results, performance orachievements expressed or implied by the forward-looking statements andinformation are based upon reasonable assumptions and expectations, thereader should not place undue reliance on forward-looking statements andinformation because they involve known and unknown risks, uncertaintiesand other factors, many of which are beyond our control, which may causeour actual results, performance or achievements to differ materially fromanticipated future results, performance or achievement expressed or impliedby such forward-looking statements and information.
Factors that could cause actual results to differ materially from thosecontemplated or implied by forward-looking statements include, but are notlimited to: the occurrence of any event, change or other circumstance thatcould affect the acquisition and formation of BPY on the anticipated termsand timing, including the risk that the proposed transaction may not beconsummated; risks related to our ability to integrate GGP’s business into ourown and the ability of the combined company to attain expected benefitstherefrom; risks incidental to the ownership and operation of real estateproperties including local real estate conditions; the impact or unanticipatedimpact of general economic, political and market factors in the countries inwhich we do business; the ability to enter into new leases or renew leases onfavorable terms; business competition; dependence on tenants’ financialcondition; the use of debt to finance our business; the behavior of financialmarkets, including fluctuations in interest and foreign exchanges rates;uncertainties of real estate development or redevelopment; global equity andcapital markets and the availability of equity and debt financing andrefinancing within these markets; risks relating to our insurance coverage; thepossible impact of international conflicts and other developments includingterrorist acts; potential environmental liabilities; changes in tax laws and othertax related risks; dependence on management personnel; illiquidity ofinvestments; the ability to complete and effectively integrate acquisitions intoexisting operations and the ability to attain expected benefits therefrom;
operational and reputational risks; catastrophic events, such as earthquakesand hurricanes; and other risks and factors detailed from time to time in ourdocuments filed with the securities regulators in Canada and the UnitedStates.
We caution that the foregoing list of important factors that may affect futureresults is not exhaustive. When relying on our forward-looking statements orinformation, investors and others should carefully consider the foregoingfactors and other uncertainties and potential events. Except as required bylaw, we undertake no obligation to publicly update or revise any forward-looking statements or information, whether written or oral, that may be as aresult of new information, future events or otherwise.
Use of Non-IFRS Measures
This presentation makes reference to net operating income (“NOI”), fundsfrom operations (“FFO”), and Company funds from operations (“CFFO”). NOI,FFO and CFFO do not have any standardized meaning prescribed byInternational Financial Reporting Standards (“IFRS”) and therefore may notbe comparable to similar measures presented by other companies. ThePartnership uses NOI, FFO and CFFO to assess its operating results. Thesemeasures should not be used as alternatives to Net Income and otheroperating measures determined in accordance with IFRS but rather toprovide supplemental insights into performance. Further, these measures donot represent liquidity measures or cash flow from operations and are notintended to be representative of the funds available for distribution tounitholders either in aggregate or on a per unit basis, where presented.
For further reference, specific definitions of NOI, FFO, and CFFO areavailable in the Partnership’s press releases announcing its financial resultseach quarter.
Market and Industry Data
This presentation includes estimates regarding market and industry data thatwe prepared based on management's knowledge and experience in themarkets in which it operates, together with information obtained from varioussources, including publicly available information and industry reports andpublications. While we believe such information is reliable, it cannotguarantee the accuracy or completeness of this information. We have notindependently verified any third-party information.
Additional Information and Where to Find It
A portion of this communication is being made in respect of the proposedtransaction contemplated by the Agreement and Plan of Merger, dated as ofMarch 26, 2018, among BPY, Goldfinch Merger Sub Corp. and GGP Inc..This communication may be deemed to be solicitation material in respect ofthe proposed transaction involving BPY and GGP. In connection with theproposed transaction, on May 2, 2018, BPY filed with the U.S. Securities andExchange Commission (the “SEC”) a registration statement on Form F-4 thatincludes a prospectus of BPY (the “BPY prospectus”), and GGP filed with theSEC a registration statement on Form S-4 that includes a proxystatement/prospectus of GGP (the “GGP proxy statement/prospectus”). Theparties also filed on May 2, 2018 a Rule 13E-3 transaction statement onSchedule 13E-3. The registration statements have not yet become effective.Each of BPY and GGP may also file other documents with the SEC regardingthe proposed transaction. This communication is not a substitute for the BPYprospectus, the GGP proxy statement/prospectus, the registration statementsor any other document which BPY or GGP may file with the SEC. The GGPproxy statement/prospectus, when in definitive form, will be mailed to GGPstockholders in connection with the proposed transaction. INVESTORS AND
SECURITY HOLDERS ARE URGED TO READ THE ABOVE-REFERENCEDAND OTHER RELEVANT DOCUMENTS FILED OR TO BE FILED WITHTHE SEC, AS WELL AS ANY AMENDMENTS OR SUPPLEMENTS TOTHESE DOCUMENTS, CAREFULLY AND IN THEIR ENTIRETY WHENTHEY BECOME AVAILABLE BECAUSE THEY CONTAIN OR WILLCONTAIN IMPORTANT INFORMATION ABOUT BPY, GGP, THEPROPOSED TRANSACTION AND RELATED MATTERS. Investors andstockholders may obtain free copies of the above-referenced and otherdocuments filed with the SEC by BPY and GGP, when available, through theSEC’s website at http://www.sec.gov. In addition, investors may obtain freecopies of the above-referenced and other documents filed with the SEC byBPY, when available, by contacting BPY Investor Relations [email protected] or +1 (855) 212-8243 or at BPY’s website atbpy.brookfield.com, and are able to obtain free copies of the above-referenced and other documents filed with the SEC by GGP, when available,by contacting GGP Investor Relations at (312) 960-5000 or at GGP’s websiteat http://www.ggp.com.
Non-solicitation
This communication shall not constitute an offer to sell or the solicitation of anoffer to buy any securities, nor shall there be any sale of securities in anyjurisdiction in which such offer, solicitation or sale would be unlawful prior toregistration or qualification under the securities laws of any such jurisdiction.No offering of securities shall be made except by means of a prospectusmeeting the requirements of Section 10 of the U.S. Securities Act of 1933, asamended.
Participants in Solicitation
BPY, GGP and their respective directors and executive officers and otherpersons may be deemed to be participants in the solicitation of proxies fromGGP stockholders in respect of the proposed transaction that is described inthe BPY prospectus and the GGP proxy statement/prospectus. Informationregarding the persons who may, under the rules of the SEC, be deemedparticipants in the solicitation of proxies from GGP stockholders in connectionwith the proposed transaction, including a description of their direct or indirectinterests, by security holdings or otherwise, is set forth in the BPY prospectusand the GGP proxy statement/prospectus. You may also obtain thedocuments that BPY and GGP file electronically free of charge from theSEC’s website at http://www.sec.gov. Information regarding BPY’s directorsand executive officers is contained in BPY’s 2017 Annual Report on Form 20-F filed with the SEC on March 9, 2018. Information regarding GGP’s directorsand executive officers is contained in GGP’s 2017 Annual Report on Form10-K filed with the SEC on February 22, 2018 and its 2018 Annual ProxyStatement on Schedule 14A filed with the SEC on April 27, 2018.


