
ORIGINAL PAPER
Breast cancer screening of underserved women in the USA:results from the National Breast and Cervical Cancer EarlyDetection Program, 1998–2012
David H. Howard1• Florence K. L. Tangka2
• Janet Royalty2• Lucinda P. Dalzell3 •
Jacqueline Miller2• Brett O’Hara3
• Kristy Joseph4• Kristy Kenney2
•
Gery Guy2• Ingrid J. Hall2
Received: 23 September 2014 / Accepted: 4 March 2015 / Published online: 17 March 2015
� Springer International Publishing Switzerland 2015
Abstract
Objective To describe the number and proportion of
eligible women receiving mammograms funded by the
National Breast and Cervical Cancer Early Detection Pro-
gram (NBCCEDP).
Methods Low-income, uninsured, and underinsured
women aged 40–64 are eligible for mammography screening
through the NBCCEDP. We used data from the NBCCEDP,
the Current Population Survey, and Medical Expenditure
Panel Survey to describe the number and proportion of
women screened by the NBCCEDP and overall.
Results In 2011 and 2012, the NBCCEDP screened 549,043
women aged 40–64, an estimated 10.6 % (90 % confidence
interval [CI] 10.4–10.9 %) of the eligible population. We
estimate that 30.6 % (90 % CI 26.4–34.8 %) of eligible
women aged 40–64 were screened outside the NBCCEDP,
and 58.8 % (90 % CI 54.6–63.0 %) were not screened. The
proportion of eligible women screened by the NBCCEDP
varied across states, with an estimated range of 3.2 % (90 %
CI 2.9–3.5 %) to 52.8 % (90 % CI 36.1–69.6 %) and a
median of 13.7 % (90 % CI 11.0–16.4 %). The estimated
proportion of eligible women aged 40–64 who received
mammograms through the NBCCEDP was relatively constant
over time, 11.1 % (90 % CI 10.2–11.9 %) in 1998–1999 and
10.6 % (90 % CI 10.4–11.9 %) in 2011–2012 (p = 0.23),
even as the number of women screened increased from
343,692 to 549,043.
Conclusions Although the NBCCEDP provided screen-
ing services to over a half million low-income uninsured
women for mammography, it served a small percentage of
those eligible. The majority of low-income, uninsured
women were not screened.
Keywords Medically uninsured � Health services
accessibility � Early detection of cancer � Mammography
Introduction
In 2009, the United States Preventive Services Task Force
recommended that women aged 50–74 receive biennial
mammograms [1]. However, lack of insurance coverage
often serves as a barrier to women getting mammograms.
Studies have shown that uninsured women are less likely to
be screened [2, 3]. For example, in 2008, Oregon used a
lottery to select uninsured, low-income adults off a waiting
list for Medicaid coverage. Women randomly assigned to
no insurance versus Medicaid coverage were 60 % less
likely to have a mammogram [4]. Among those who have
insurance coverage, there are still barriers to getting
screened. Even small copayments have a large, negative
effect on the proportion of women screened [5].
The US Congress passed the Breast and Cervical Cancer
Mortality Prevention Act of 1990 (Public Law 101-354) to
provide breast and cervical cancer screening services to
The findings and conclusions in this report are those of the authors
and do not necessarily represent the official position of the Centers for
Disease Control and Prevention or the US Census Bureau.
& David H. Howard
1 Department of Health Policy and Management, Emory
University, 1518 Clifton Road NE, Atlanta, GA 30030, USA
2 Division of Cancer Prevention and Control, Centers for
Disease Control and Prevention, Atlanta, GA, USA
3 Social, Economics and Household Statistics Division,
US Census Bureau, Washington, DC, USA
4 Division of Global Health Protection, Centers for Disease
Control and Prevention, Atlanta, GA, USA
123
Cancer Causes Control (2015) 26:657–668
DOI 10.1007/s10552-015-0553-0
low-income, uninsured and underinsured women. The Act
authorized the Centers for Disease Control and Prevention
(CDC) to establish the National Breast and Cervical Cancer
Early Detection Program (NBCCEDP). In 2012, the
NBCCEDP provided $158 million to 67 grantees. Grantees
include all 50 states, the District of Columbia, five US
territories, and 11 American Indian or Alaska Native or-
ganizations. Per congressional mandate, at least 60 % of
federal funds received by the grantees must be spent on
clinical services. The remaining 40 % are used to fund
other components including program management, data
collection, quality assurance and improvement, partnership
development, professional education, public education,
outreach, and evaluation. Treatment is covered by state
Medicaid funding through the Breast and Cervical Cancer
Treatment Act of 2000 (Public Law 106-354), the Native
American Breast and Cervical Cancer Treatment Technical
Amendment Act of 2001 (Public Law 107-121), and other
outside sources. A detailed description of the history of the
NBCCEDP is provided in a forthcoming paper [6].
The NBCCEDP provides both breast cancer screening
services to low-income, uninsured women aged 40–64 and
cervical cancer screening services to low-income, unin-
sured women aged 21–64. Most women older than 64 have
coverage for screening through Medicare. (Estimates of
program reach for cervical cancer screening are reported
elsewhere in this monograph—Tangka et al. [7].) Although
women aged 40–64 are eligible for breast cancer screening,
NBCCEDP performance standards state that at least 75 %
of federally funded mammograms be provided to the pri-
ority population of women aged 50 and older.
Previously, Tangka et al. [8] described the number of
women screened for breast cancer by the NBCCEDP, the
number of women eligible for screening services, and the
proportion of eligible women screened by race/ethnicity
and state. They found that the NBCCEDP screened 13.2 %
(90 % CI 12.5–13.9) of eligible women 40–64 years old in
2002–2003. The NBCCEDP screened 16.4 % (90 %
CI 14.7–18.1) of eligible Hispanic women, 10.4 % (90 %
CI 9.2–11.6) of eligible non-Hispanic black women, and
11.2 % (90 % CI 10.4–12.0) of non-Hispanic white
women. These types of data are useful for understanding
the reach of the NBCCEDP and identifying populations
that could benefit from better access to screening services.
The objective of this study is to update Tangka et al.’s
2002–2003 analysis using data for 2011–2012. In addition,
we expanded this analysis by describing trends in the
numbers of women screened, the number of eligible
women, and the proportion of eligible women screened
from 1998 to 2012. The data do not permit us to distinguish
between mammograms provided for purposes of screening
versus diagnosis or follow-up of suspicious results. In
keeping with standard NBCCEDP terminology and the
primary purpose of the NBCCEDP program, we refer to the
‘‘number of women screened’’ and ‘‘screening rates.’’
However, we recognize that we are using these terms more
broadly than they are used in clinical settings.
Methods
Eligibility
Women aged 40–64 who do not have health insurance or
whose insurance does not cover mammography screening
are eligible for breast cancer screening through the
NBCCEDP if their family incomes fall below state-specific
income thresholds, which vary between 185 and 250 % of
the federal poverty level. The federal poverty level was
$23,850 for a family of four in 2013 in the 48 contiguous
states [9]. We used the 1998–2012 Annual Social and
Economic Supplement to the Current Population Survey
(CPS ASEC) conducted by the US Census Bureau to
measure the number of eligible women by state, based on
the federal poverty level selected by each state grantee. The
Current Population Survey is a monthly national survey
undertaken primarily to determine the characteristics of the
labor force of the US civilian non-institutional population
[10]. About 75,000 of the households participating in the
Current Population Survey are included in the Annual
Social and Economic Supplement. Respondents are asked a
set of supplementary questions about health insurance
coverage, income, and place of residence during the pre-
vious year [11]. The methods used to collect and report
Current Population Survey and Annual Social and Eco-
nomic Supplement data have been described previously
[12]. We counted a woman as eligible if she was between
the ages of 40 and 64, was uninsured, and had a family
income at or below her state’s income eligibility threshold.
Respondents were considered uninsured if they were not
covered by any type of private or government health in-
surance for the entire previous year [10].
Questions about age, family size, sex, race, and Hispanic
origin were included in the basic Current Population Sur-
vey. Respondents were asked to identify their race by se-
lecting one or more options from a list. Separately,
respondents were asked about Hispanic origin. Following
Census Bureau convention, we categorized women who
reported that they were of Hispanic origin as Hispanic re-
gardless of race. We categorized the remaining women,
who were non-Hispanic, into one of the following racial
groups: white, black, American Indian/Alaska Native, or
Asian/Native Hawaiian/other Pacific Islander. We esti-
mated the number of women eligible for the NBCCEDP by
race and ethnicity (Hispanic origin) at the national level
from CPS ASEC using Census Bureau methods [13].
658 Cancer Causes Control (2015) 26:657–668
123
Screening by the NBCCEDP
Data on the number of women screened by the NBCCEDP
were obtained from data collected from NBCCEDP gran-
tees (states, territories, and American Indian/Alaska Native
organizations). Grantees collect income, family size, and
insurance information to determine eligibility and collect
and report to CDC standardized screening information on
each encounter. These data include demographic charac-
teristics, service dates, test performed, test results, and
outcomes. Demographic data are self-reported. Reporting
of race and Hispanic origin is optional. The structure of the
NBCCEDP and methods for collecting and reporting data
have been described in a Morbidity and Mortality Weekly
Report paper [6].
We report the number of women screened by
NBCCEDP over overlapping 2-year periods and the pro-
portion of women screened. The number of women
screened and the proportion of women screened were cal-
culated independently for each 2-year period in accordance
with current United States Preventive Services Task Force-
recommended screening intervals [1]. We calculated the
proportion of eligible women screened by NBCCEDP us-
ing the 2-year count from NBCCEDP as the numerator and
the CPS 2-year estimate of eligible population as the
denominator.
Screening outside the NBCCEDP
We used the Household Component of the Agency for
Healthcare Research and Quality’s Medical Expenditure
Panel Survey (MEPS) to measure the proportion of women
receiving mammograms in the eligible population. MEPS
uses a 2-year overlapping panel design. The MEPS sample
is drawn from the previous year’s National Health Inter-
view Survey sample and is designed to be representative of
the civilian, non-institutionalized population. Respondents
are interviewed five times over a two and a half-year pe-
riod. Response rates vary by year and survey round but are
approximately 60 % for the first round interviews. Re-
spondents are asked ‘‘When did (PERSON) have (PER-
SON)’s most recent mammogram?’’ and are provided with
a short, non-technical description of a mammogram if
necessary. Response categories include a range of
1–5 years, ‘‘more than 5 years,’’ and ‘‘never.’’ The pro-
portion of women screened calculated using MEPS closely
matches the proportion calculated from the Health and
Retirement Study but is higher than the proportion calcu-
lated using insurance claims [14]. Using the 2011 MEPS,
we calculated the proportion of women aged 40–64 who
were uninsured for the entire year, lived in households with
incomes below 250 % of the federal poverty level, and
reported having received a mammogram in the past
2 years. We applied sample weights to produce nationally
representative estimates. We calculated the proportion of
women having been screened outside the NBCCEDP by
subtracting the proportion screened by the NBCCEDP from
the proportion of the eligible population screened that we
estimated using MEPS.
Data analysis
We report the number of women eligible for NBCCEDP
screening, the number of women screened by the
NBCCEDP, and the percentage of eligible women screened
by the NBCCEDP by race and ethnicity group, age-group
(40–64 and 50–64), year, and state. State designation is
based on the woman’s residence rather than the grantee
program providing the service, and the state percentages
include the screening data from American Indian/Alaska
Native grantees. We report the number of women eligible
and the proportion of women in the population who are
eligible in each state. In compliance with the NBCCEDP
data use agreement, grantee- and state-specific reports of
the number and proportion of women screened are de-
identified.
Screening totals and proportions based on NBCCEDP
data represent mammograms provided with NBCCEDP
funds. There was one state that included mammograms
paid for by state appropriations in its reports of
NBCCEDP-funded mammograms over the period from
2002 to 2006. The state discontinued this reporting ap-
proach in 2006. While the combined data may better rep-
resent results of publicly funded screening for low-income
uninsured women, this paper is limited NBCCEDP-funded
services. Lacking these data for the period 2002–2006, we
used linear interpolation to estimate the number of women
screened by NBCCEDP and the proportion of eligible
women screened by NBCCEDP over this period.
Estimates of the number of women eligible are based on
a random sample of the population and are thus subject to
sampling error. Estimates of variance for estimates of the
number of women eligible and the proportion of eligible
women screened in the US population account for the
complex survey design of the CPS ASEC [11] and MEPS
[15]. Methods for computing confidence intervals for the
estimates of the eligible population have been described
previously [8]. Consistent with Census Bureau convention,
we report 90 % confidence intervals for estimates of the
eligible population and the percent of the eligible popula-
tion who received mammograms through the NBCCEDP.
Confidence intervals for the proportion of women screened
outside the NBCCEDP account for uncertainty in the es-
timate of the proportion of women screened by the
NBCCEDP and uncertainty in the estimate of the propor-
tion of eligible women screened overall (from MEPS). We
Cancer Causes Control (2015) 26:657–668 659
123
use t tests to assess the significance of differences in the
proportion of women screened between periods, assuming
independent variances. We treated the number of eligible
women screened by the NBCCEDP as an exact count with
no error. We estimated least-squares regressions where
yearly counts of the number of women screened, counts of
the number of eligible women, and the proportion of
eligible women screened were dependent variables and the
independent variable was year (a continuous variable run-
ning from 1999 to 2012) to assess the significance of
trends.
Results
The NBCCEDP screened 549,043 women aged 40–64 in
2011 and 2012, an estimated 10.6 % (90 % CI 10.4–10.9 %)
of the 5 million women eligible for breast screening through
NBCCEDP. The NBCCEDP screened 476,651 women aged
50–64, an estimated 17.3 % (90 % CI 16.7–18.0 %) of the
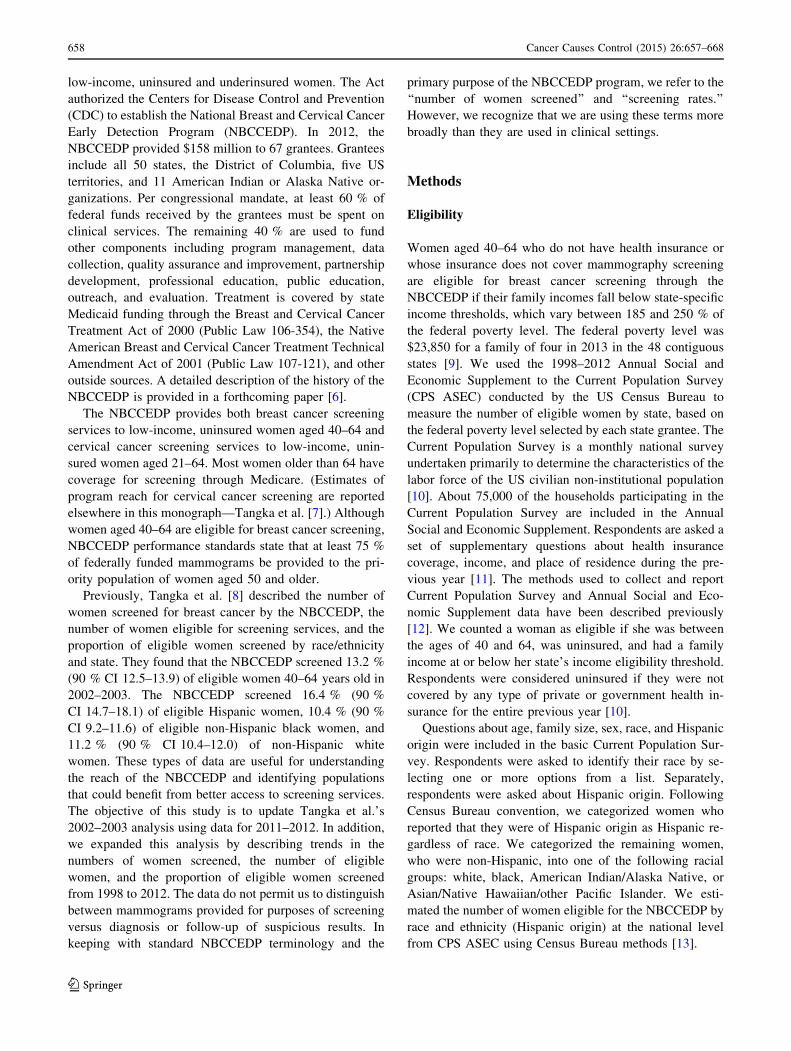
eligible women in the age-group. Figure 1 shows the pro-
portion of eligible women screened using NBCCEDP funds
and using funds from other sources by age-group. Using the
MEPS, we estimated that 30.6 % (90 % CI 90 %
CI 26.4–34.8 %) of eligible women aged 40–64 received a
mammogram outside the NBCCEDP in 2011–2012. More
than half of eligible women aged 40–64 women—an esti-
mated 58.8 % (90 % CI 54.6–63.0 %)—did not receive a
mammogram. We estimated that 26.5 % (90 %
CI 18.8–34.2 %) of eligible women aged 50–64 received a
mammogram outside the NBCCEDP in 2011–2012 and
56.2 % (90 % CI 48.5–63.9 %) were not screened.
Table 1 reports the number of women eligible for
NBCCEDP screening and the number and proportion of
these women who received mammograms through the
NBCCEDP by race and ethnicity. Among women aged
40–64, the estimated proportion of women eligible ranged
from 6.7 % (90 % CI 6.4–7.0 %) among non-Hispanic
white women to 22.4 % (90 % CI 21.4–23.4 %) among
Hispanic women. The estimated proportion of eligible
women screened ranged from 8.7 % (90 % CI 8.4–9.1 %)
among Hispanic women to 33.1 % (90 % CI 25.8–40.3 %)
of American Indians and Alaska Natives. Among women
aged 50–64, the estimated proportion of women eligible
ranged from 6.2 % (90 % CI 5.8–6.6 %) among non-His-
panic white women to 19.9 % (90 % CI 18.5–21.3 %)
among Hispanic women. The estimated proportion of
eligible women screened ranged from 15.8 % (90 %
CI 14.9–16.6 %) among non-Hispanic white women to
more than half of American Indians and Alaska Natives.
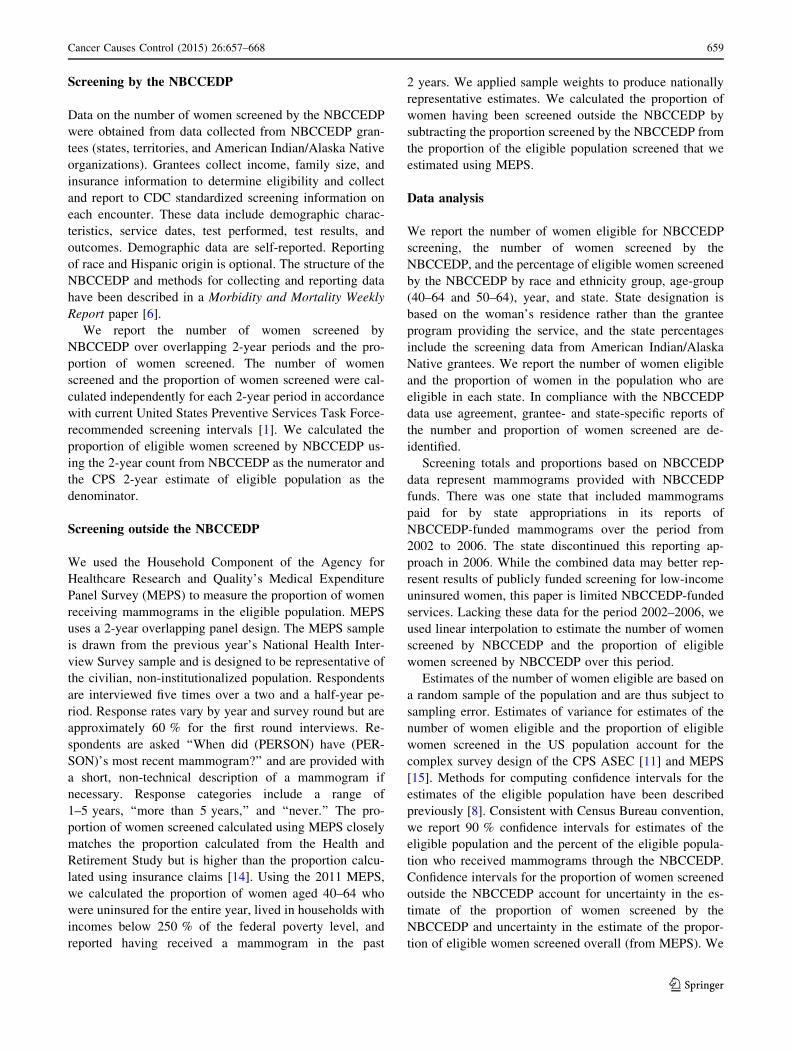
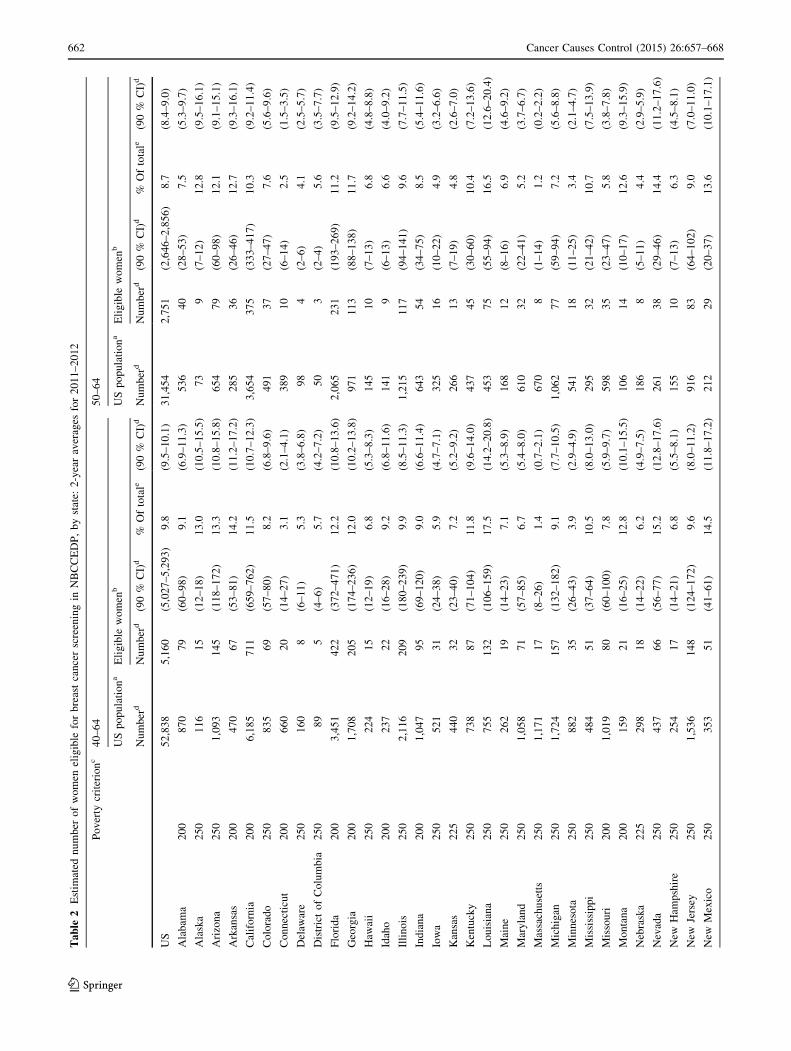
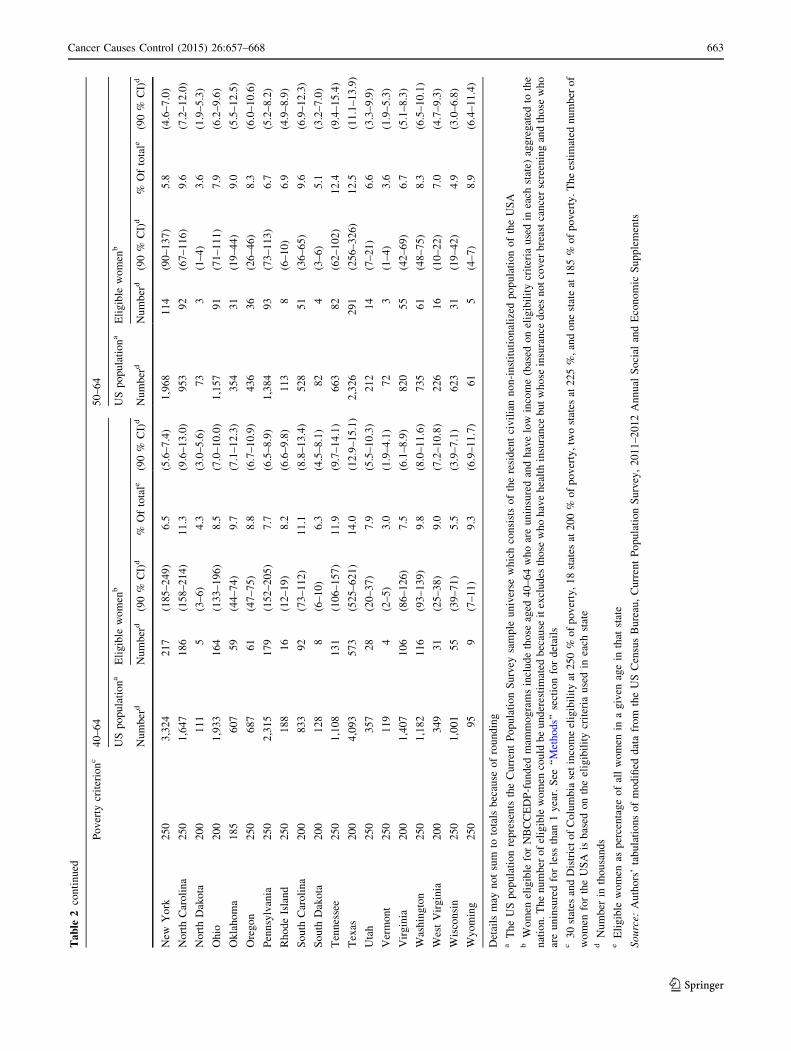
Table 2 reports the number and proportion of women
eligible by state. Figure 2 depicts the proportion of eligible
women who received mammograms through the
NBCCEDP by state. The horizontal lines represent the
proportion of all eligible women screened in the USA. Two
states are excluded from comparison because they use
different program implementation or eligibility criteria.
The proportion of eligible women screened by the
NBCCEDP varied across states, with an estimated range of
3.2 % (90 % CI 2.9–3.5 %) to 52.8 % (90 %
CI 36.1–69.6 %) and a median of 13.7 % (90 %
CI 11.0–16.4 %). The estimated 25th and 75th percentiles,
reflecting the markers that are the third from the left and
third from the right on the figure, are 8.7 % (90 %
CI 7.4–10.0 %) and 24.4 % (90 % CI 17.2–31.7 %). For
women aged 50–64, the estimated range is 6.3 % (90 %
CI 5.5–7.0 %) to 83.8 % (90 % CI 43.5–124.0 %) with an
estimated median of 21.6 % (90 % CI 14.5–28.8 %). The
estimated 25th and 75th percentiles are 13.7 % (90 %
CI 10.1–16.0 %) and 35.9 % (90 % CI 25.5–68.8 %),
respectively.
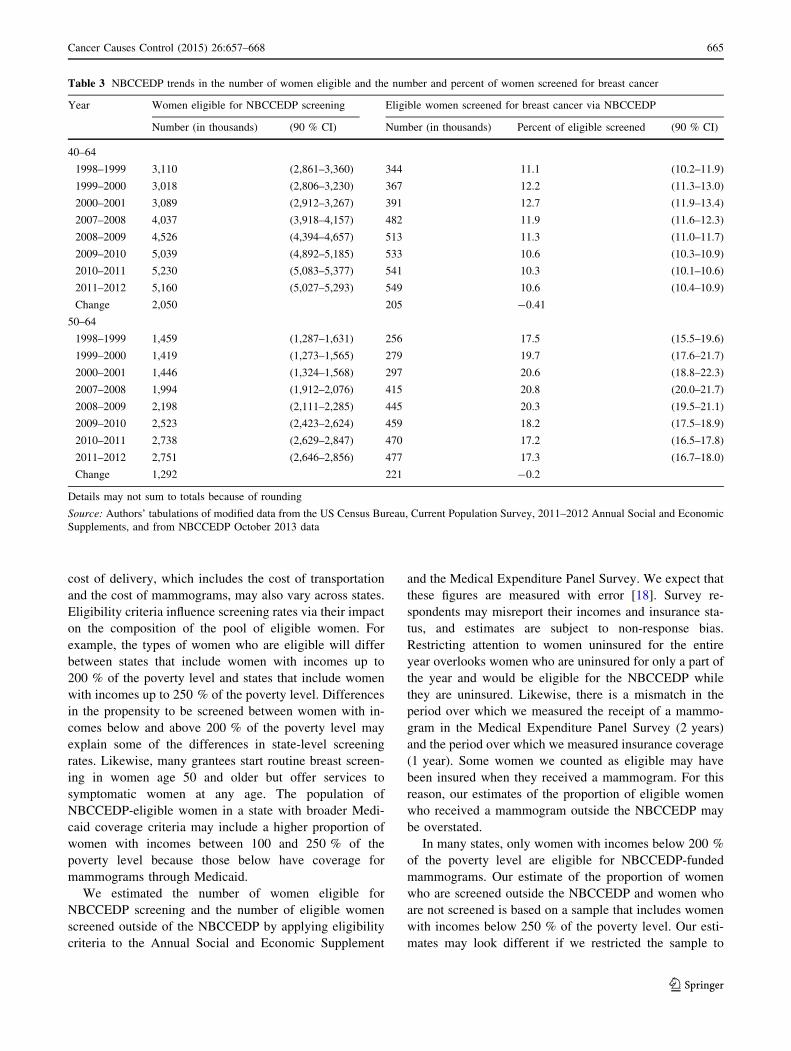
Table 3 reports the number of women eligible for
screening and the number and proportion of eligible
women screened by period and by age-group. Differences
in the proportions of eligible women who were screened by
NBCCEDP between 1998–1999 and 2011–2012 were not
statistically significant in either age-group (p = 0.23 for
women aged 40–64 and p = 0.44 for women aged 50–64).
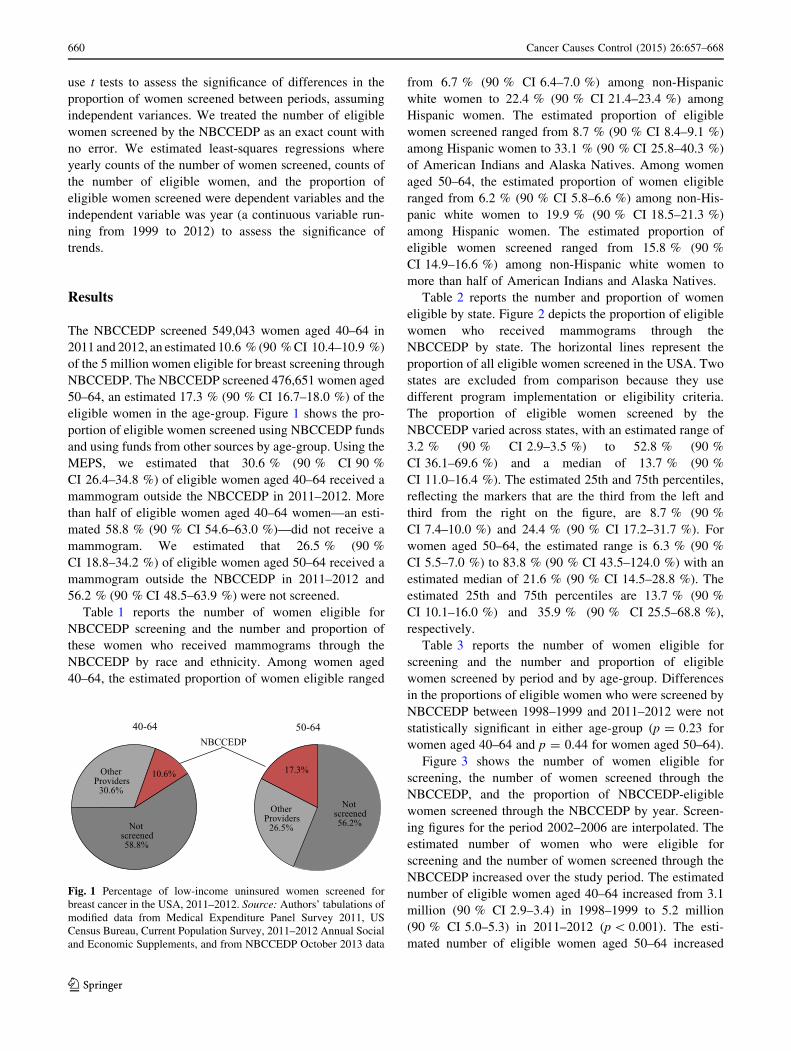
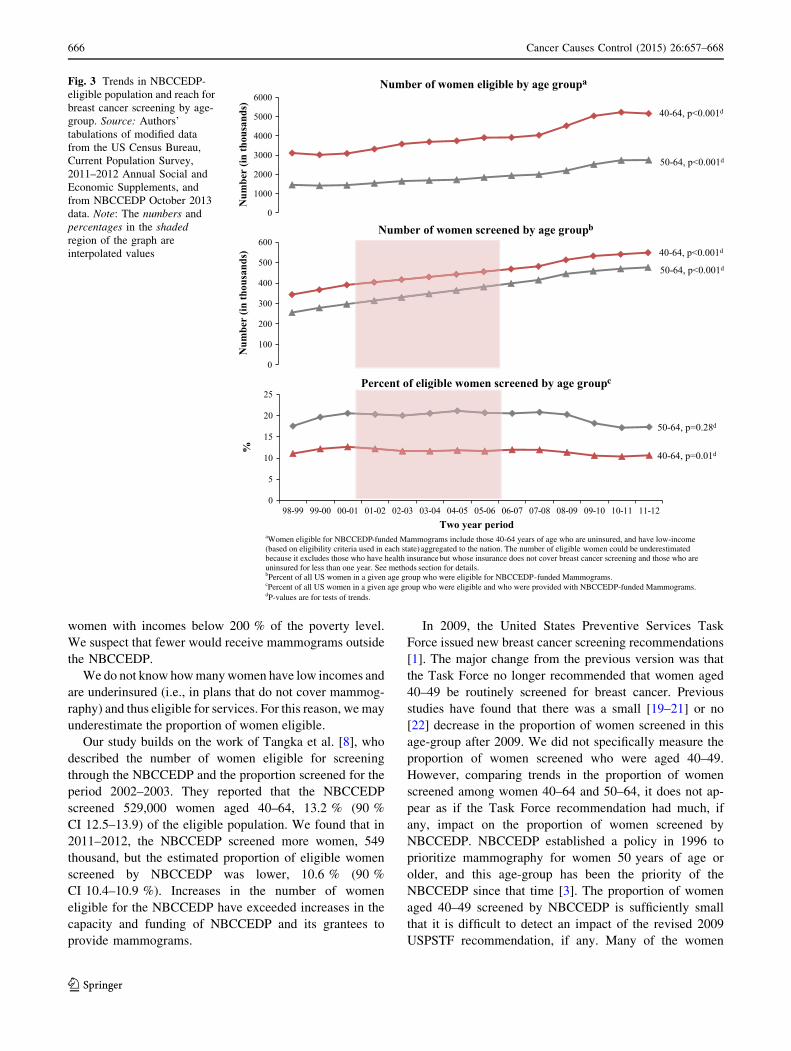
Figure 3 shows the number of women eligible for
screening, the number of women screened through the
NBCCEDP, and the proportion of NBCCEDP-eligible
women screened through the NBCCEDP by year. Screen-
ing figures for the period 2002–2006 are interpolated. The
estimated number of women who were eligible for
screening and the number of women screened through the
NBCCEDP increased over the study period. The estimated
number of eligible women aged 40–64 increased from 3.1
million (90 % CI 2.9–3.4) in 1998–1999 to 5.2 million
(90 % CI 5.0–5.3) in 2011–2012 (p\ 0.001). The esti-
mated number of eligible women aged 50–64 increased
Not screened58.8%
Other Providers
30.6%
10.6%
40-64
Not screened56.2%
Other Providers
26.5%
17.3%
50-64NBCCEDP
Fig. 1 Percentage of low-income uninsured women screened for
breast cancer in the USA, 2011–2012. Source: Authors’ tabulations of
modified data from Medical Expenditure Panel Survey 2011, US
Census Bureau, Current Population Survey, 2011–2012 Annual Social
and Economic Supplements, and from NBCCEDP October 2013 data
660 Cancer Causes Control (2015) 26:657–668
123
from 1.5 million (90 % CI 1.3–1.6) in 1998–1999 to 2.8
million (90 % CI 2.6–2.9) in 2011–2012 (p\ 0.001). The
number of women aged 40–64 who were screened through
the NBCCEDP increased from 344,000 in 1998–1999 to
549,000 in 2011–2012 (we do not report a p value because
these are exact values). The number of women aged 50–64
who were screened increased from 265,000 in 1998–1999
to 477,000 in 2011–2012.
Increases in the number of women eligible for screening
offset increases in the number of women screened, leaving
the estimated proportion of women screened relatively
unchanged. Note that trends in the proportion of women
screened between 2002 and 2006 incorporate interpolated
values for the number of women screened (the numerator).
Estimates of the number of women eligible (the de-
nominator) were not interpolated.
The difference in estimates of the proportion of eligible
women aged 40–64 who were screened through the
NBCCEDP between the beginning and the end of the study
period was nonsignificant [11.1 % (90 % CI 10.2–11.9 %)
in 1998–1999 and 10.6 % (90 % CI 10.4–10.9 %) in
2011–2012; p = 0.23]. Similarly, the difference in estimates
of the proportion of eligible women aged 50–64 who were
screened between the beginning and the end of the study
Table 1 National Breast and Cervical Cancer Early Detection Program (NBCCEDP) Eligibility and Screening for Breast Cancer, by age-group,
race, and ethnicity, 2011–2012
Race/ethnicity US populationa Women eligible for NBCCEDP screeningb Eligible women screened for
breast cancer via NBCCEDP
Number (in thousands) Number (in thousands) (90 % CI) Percentc (90 % CI) Number Percentd (90 % CI)
40–64
Total 52,838 5,160 (5,027–5,293) 9.8 (9.5–10.1) 549,043 10.6 (10.4–10.9)
Non-Hispanic 46,201 3,675 (3,561–3,790) 8 (7.8–8.2) 412,126 11.2 (10.9–11.6)
White 36,320 2,422 (2,326–2,518) 6.7 (6.4–7.0) 253,348 10.5 (10.0–10.9)
Black 6,555 908 (854–961) 13.8 (13.0–14.6) 101,838 11.2 (10.6–11.9)
AIAN 341 57 (45–70) 16.7 (13.2–20.2) 18,889 33.1 (25.8–40.3)
ANHOPI 2,984 289 (258–320) 9.7 (8.7–10.7) 35,365 12.2 (10.9–13.5)
Multiracial – – – – – 2,686 – –
Hispanic 6,637 1,485 (1,419–1,550) 22.4 (21.4–23.4) 129,769 8.7 (8.4–9.1)
Unknown – – – – – 9,834 – –
50–64
Total 31,454 2,751 (2,646–2,856) 8.7 (8.4–9.0) 476,651 17.3 (16.7–18.0)
Non-Hispanic 28,197 2,103 (2,012–2,195) 7.5 (7.2–7.8) 361,476 17.2 (16.4–17.9)
White 22,622 1,407 (1,328–1,486) 6.2 (5.8–6.6) 221,653 15.8 (14.9–16.6)
Black 3,789 518 (480–556) 13.7 (12.7–14.7) 90,976 17.6 (16.3–18.8)
AIAN 182 27 (18–36) 15 (10.3–19.7) 14,326 52.4 (35.0–69.9)
ANHOPI 1,604 151 (129–173) 9.4 (8.1–10.7) 32,278 21.4 (18.3–24.4)
Multiracial – – – – – 2,243 – –
Hispanic 3,257 647 (601–693) 19.9 (18.5–21.3) 109,061 16.8 (15.6–18.0)
Unknown – – – – – 8,357 – –
AIAN American Indian/Alaska Native; ANHOPI Asian, Native Hawaiian, and Pacific Islander. Details may not sum to totals because of
roundinga The US population represents the Current Population Survey sample universe which consists of the resident civilian non-institutionalized
population of the USAb Women eligible for NBCCEDP-funded mammograms include those 40–64 years of age who are uninsured and have low income (based on
eligibility criteria used in each state) aggregated to the nation. The number of eligible women could be underestimated because it excludes those
who have health insurance but whose insurance does not cover breast cancer screening and those who are uninsured for less than 1 year. See
‘‘Methods’’ section for detailsc Percent of all US women in a given age-group, racial group, and ethnic group who were eligible for NBCCEDP-funded mammogramsd Percent of all US women in a given age-group, racial group, and ethnic group who were eligible and who were provided with NBCCEDP-
funded mammograms
Source: Authors’ tabulations of modified data from the US Census Bureau, Current Population Survey, 2011–2012 Annual Social and Economic
Supplements, and from NBCCEDP October 2013 data
Cancer Causes Control (2015) 26:657–668 661
123
Ta
ble
2E
stim
ated
nu
mb
ero
fw
om
enel
igib
lefo
rb
reas
tca
nce
rsc
reen
ing
inN
BC
CE
DP
,b
yst
ate:
2-y
ear
aver
ages
for
20
11
–2
01
2
Po
ver
tycr
iter
ion
c4
0–
64
50
–6
4
US
po
pu
lati
on
aE
lig
ible
wo
men
bU
Sp
op
ula
tio
na
Eli
gib
lew
om
enb
Nu
mb
erd
Nu
mb
erd
(90
%C
I)d
%O
fto
tale
(90
%C
I)d
Nu
mb
erd
Nu
mb
erd
(90
%C
I)d
%O
fto
tale
(90
%C
I)d
US
52
,83
85
,16
0(5
,02
7–
5,2
93
)9
.8(9
.5–
10
.1)
31
,45
42
,75
1(2
,64
6–
2,8
56
)8
.7(8
.4–
9.0
)
Ala
bam
a2
00
87
07
9(6
0–
98
)9
.1(6
.9–
11
.3)
53
64
0(2
8–
53
)7
.5(5
.3–
9.7
)
Ala
ska
25
01
16
15
(12
–1
8)
13
.0(1
0.5
–1
5.5
)7
39
(7–
12
)1
2.8
(9.5
–1
6.1
)
Ari
zon
a2
50
1,0
93
14
5(1
18
–1
72
)1
3.3
(10
.8–
15
.8)
65
47
9(6
0–
98
)1
2.1
(9.1
–1
5.1
)
Ark
ansa
s2
00
47
06
7(5
3–
81
)1
4.2
(11
.2–
17
.2)
28
53
6(2
6–
46
)1
2.7
(9.3
–1
6.1
)
Cal
ifo
rnia
20
06
,18
57
11
(65
9–
76
2)
11
.5(1
0.7
–1
2.3
)3
,65
43
75
(33
3–
41
7)
10
.3(9
.2–
11
.4)
Co
lora
do
25
08
35
69
(57
–8
0)
8.2
(6.8
–9
.6)
49
13
7(2
7–
47
)7
.6(5
.6–
9.6
)
Co
nn
ecti
cut
20
06
60
20
(14
–2
7)
3.1
(2.1
–4
.1)
38
91
0(6
–1
4)
2.5
(1.5
–3
.5)
Del
awar
e2
50
16
08
(6–
11
)5
.3(3
.8–
6.8
)9
84
(2–
6)
4.1
(2.5
–5
.7)
Dis
tric
to
fC
olu
mb
ia2
50
89
5(4
–6
)5
.7(4
.2–
7.2
)5
03
(2–
4)
5.6
(3.5
–7
.7)
Flo
rid
a2
00
3,4
51
42
2(3
72
–4
71
)1
2.2
(10
.8–
13
.6)
2,0
65
23
1(1
93
–2
69
)1
1.2
(9.5
–1
2.9
)
Geo
rgia
20
01
,70
82
05
(17
4–
23
6)
12
.0(1
0.2
–1
3.8
)9
71
11
3(8
8–
13
8)
11
.7(9
.2–
14
.2)
Haw
aii
25
02
24
15
(12
–1
9)
6.8
(5.3
–8
.3)
14
51
0(7
–1
3)
6.8
(4.8
–8
.8)
Idah
o2
00
23
72
2(1
6–
28
)9
.2(6
.8–
11
.6)
14
19
(6–
13
)6
.6(4
.0–
9.2
)
Illi
no
is2
50
2,1
16
20
9(1
80
–2
39
)9
.9(8
.5–
11
.3)
1,2
15
11
7(9
4–
14
1)
9.6
(7.7
–1
1.5
)
Ind
ian
a2
00
1,0
47
95
(69
–1
20
)9
.0(6
.6–
11
.4)
64
35
4(3
4–
75
)8
.5(5
.4–
11
.6)
Iow
a2
50
52
13
1(2
4–
38
)5
.9(4
.7–
7.1
)3
25
16
(10
–2
2)
4.9
(3.2
–6
.6)
Kan
sas
22
54
40
32
(23
–4
0)
7.2
(5.2
–9
.2)
26
61
3(7
–1
9)
4.8
(2.6
–7
.0)
Ken
tuck
y2
50
73
88
7(7
1–
10
4)
11
.8(9
.6–
14
.0)
43
74
5(3
0–
60
)1
0.4
(7.2
–1
3.6
)
Lo
uis
ian
a2
50
75
51
32
(10
6–
15
9)
17
.5(1
4.2
–2
0.8
)4
53
75
(55
–9
4)
16
.5(1
2.6
–2
0.4
)
Mai
ne
25
02
62
19
(14
–2
3)
7.1
(5.3
–8
.9)
16
81
2(8
–1
6)
6.9
(4.6
–9
.2)
Mar
yla
nd
25
01
,05
87
1(5
7–
85
)6
.7(5
.4–
8.0
)6
10
32
(22
–4
1)
5.2
(3.7
–6
.7)
Mas
sach
use
tts
25
01
,17
11
7(8
–2
6)
1.4
(0.7
–2
.1)
67
08
(1–
14
)1
.2(0
.2–
2.2
)
Mic
hig
an2
50
1,7
24
15
7(1
32
–1
82
)9
.1(7
.7–
10
.5)
1,0
62
77
(59
–9
4)
7.2
(5.6
–8
.8)
Min
nes
ota
25
08
82
35
(26
–4
3)
3.9
(2.9
–4
.9)
54
11
8(1
1–
25
)3
.4(2
.1–
4.7
)
Mis
siss
ipp
i2
50
48
45
1(3
7–
64
)1
0.5
(8.0
–1
3.0
)2
95
32
(21
–4
2)
10
.7(7
.5–
13
.9)
Mis
sou
ri2
00
1,0
19
80
(60
–1
00
)7
.8(5
.9–
9.7
)5
98
35
(23
–4
7)
5.8
(3.8
–7
.8)
Mo
nta
na
20
01
59
21
(16
–2
5)
12
.8(1
0.1
–1
5.5
)1
06
14
(10
–1
7)
12
.6(9
.3–
15
.9)
Neb
rask
a2
25
29
81
8(1
4–
22
)6
.2(4
.9–
7.5
)1
86
8(5
–1
1)
4.4
(2.9
–5
.9)
Nev
ada
25
04
37
66
(56
–7
7)
15
.2(1
2.8
–1
7.6
)2
61
38
(29
–4
6)
14
.4(1
1.2
–1
7.6
)
New
Ham
psh
ire
25
02
54
17
(14
–2
1)
6.8
(5.5
–8
.1)
15
51
0(7
–1
3)
6.3
(4.5
–8
.1)
New
Jers
ey2
50
1,5
36
14
8(1
24
–1
72
)9
.6(8
.0–
11
.2)
91
68
3(6
4–
10
2)
9.0
(7.0
–1
1.0
)
New
Mex
ico
25
03
53
51
(41
–6
1)
14
.5(1
1.8
–1
7.2
)2
12
29
(20
–3
7)
13
.6(1
0.1
–1
7.1
)
662 Cancer Causes Control (2015) 26:657–668
123
Ta
ble
2co
nti
nu
ed
Po
ver
tycr
iter
ion
c4
0–
64
50
–6
4
US
po
pu
lati
on
aE
lig
ible
wo
men
bU
Sp
op
ula
tio
na
Eli
gib
lew
om
enb
Nu
mb
erd
Nu
mb
erd
(90
%C
I)d
%O
fto
tale
(90
%C
I)d
Nu
mb
erd
Nu
mb
erd
(90
%C
I)d
%O
fto
tale
(90
%C
I)d
New
Yo
rk2
50
3,3
24
21
7(1
85
–2
49
)6
.5(5
.6–
7.4
)1
,96
81
14
(90
–1
37
)5
.8(4
.6–
7.0
)
No
rth
Car
oli
na
25
01
,64
71
86
(15
8–
21
4)
11
.3(9
.6–
13
.0)
95
39
2(6
7–
11
6)
9.6
(7.2
–1
2.0
)
No
rth
Dak
ota
20
01
11
5(3
–6
)4
.3(3
.0–
5.6
)7
33
(1–
4)
3.6
(1.9
–5
.3)
Oh
io2
00
1,9
33
16
4(1
33
–1
96
)8
.5(7
.0–
10
.0)
1,1
57
91
(71
–1
11
)7
.9(6
.2–
9.6
)
Ok
lah
om
a1
85
60
75
9(4
4–
74
)9
.7(7
.1–
12
.3)
35
43
1(1
9–
44
)9
.0(5
.5–
12
.5)
Ore
go
n2
50
68
76
1(4
7–
75
)8
.8(6
.7–
10
.9)
43
63
6(2
6–
46
)8
.3(6
.0–
10
.6)
Pen
nsy
lvan
ia2
50
2,3
15
17
9(1
52
–2
05
)7
.7(6
.5–
8.9
)1
,38
49
3(7
3–
11
3)
6.7
(5.2
–8
.2)
Rh
od
eIs
lan
d2
50
18
81
6(1
2–
19
)8
.2(6
.6–
9.8
)1
13
8(6
–1
0)
6.9
(4.9
–8
.9)
So
uth
Car
oli
na
20
08
33
92
(73
–1
12
)1
1.1
(8.8
–1
3.4
)5
28
51
(36
–6
5)
9.6
(6.9
–1
2.3
)
So
uth
Dak
ota
20
01
28
8(6
–1
0)
6.3
(4.5
–8
.1)
82
4(3
–6
)5
.1(3
.2–
7.0
)
Ten
nes
see
25
01
,10
81
31
(10
6–
15
7)
11
.9(9
.7–
14
.1)
66
38
2(6
2–
10
2)
12
.4(9
.4–
15
.4)
Tex
as2
00
4,0
93
57
3(5
25
–6
21
)1
4.0
(12
.9–
15
.1)
2,3
26
29
1(2
56
–3
26
)1
2.5
(11
.1–
13
.9)
Uta
h2
50
35
72
8(2
0–
37
)7
.9(5
.5–
10
.3)
21
21
4(7
–2
1)
6.6
(3.3
–9
.9)
Ver
mo
nt
25
01
19
4(2
–5
)3
.0(1
.9–
4.1
)7
23
(1–
4)
3.6
(1.9
–5
.3)
Vir
gin
ia2
00
1,4
07
10
6(8
6–
12
6)
7.5
(6.1
–8
.9)
82
05
5(4
2–
69
)6
.7(5
.1–
8.3
)
Was
hin
gto
n2
50
1,1
82
11
6(9
3–
13
9)
9.8
(8.0
–1
1.6
)7
35
61
(48
–7
5)
8.3
(6.5
–1
0.1
)
Wes
tV
irg
inia
20
03
49
31
(25
–3
8)
9.0
(7.2
–1
0.8
)2
26
16
(10
–2
2)
7.0
(4.7
–9
.3)
Wis
con
sin
25
01
,00
15
5(3
9–
71
)5
.5(3
.9–
7.1
)6
23
31
(19
–4
2)
4.9
(3.0
–6
.8)
Wy
om
ing
25
09
59
(7–
11
)9
.3(6
.9–
11
.7)
61
5(4
–7
)8
.9(6
.4–
11
.4)
Det
ails
may
no
tsu
mto
tota
lsb
ecau
seo
fro
un
din
ga
Th
eU
Sp
op
ula
tio
nre
pre
sen
tsth
eC
urr
ent
Po
pu
lati
on
Su
rvey
sam
ple
un
iver
sew
hic
hco
nsi
sts
of
the
resi
den
tci
vil
ian
no
n-i
nst
itu
tio
nal
ized
po
pu
lati
on
of
the
US
Ab
Wo
men
elig
ible
for
NB
CC
ED
P-f
un
ded
mam
mo
gra
ms
incl
ud
eth
ose
aged
40
–6
4w
ho
are
un
insu
red
and
hav
elo
win
com
e(b
ased
on
elig
ibil
ity
crit
eria
use
din
each
stat
e)ag
gre
gat
edto
the
nat
ion
.T
he
nu
mb
ero
fel
igib
lew
om
enco
uld
be
un
der
esti
mat
edb
ecau
seit
excl
ud
esth
ose
wh
oh
ave
hea
lth
insu
ran
ceb
ut
wh
ose
insu
ran
ced
oes
no
tco
ver
bre
ast
can
cer
scre
enin
gan
dth
ose
wh
o
are
un
insu
red
for
less
than
1y
ear.
See
‘‘M
eth
od
s’’
sect
ion
for
det
ails
c3
0st
ates
and
Dis
tric
to
fC
olu
mb
iase
tin
com
eel
igib
ilit
yat
25
0%
of
po
ver
ty,
18
stat
esat
20
0%
of
po
ver
ty,
two
stat
esat
22
5%
,an
do
ne
stat
eat
18
5%
of
po
ver
ty.
Th
ees
tim
ated
nu
mb
ero
f
wo
men
for
the
US
Ais
bas
edo
nth
eel
igib
ilit
ycr
iter
iau
sed
inea
chst
ate
dN
um
ber
inth
ou
san
ds
eE
lig
ible
wo
men
asp
erce
nta
ge
of
all
wo
men
ina
giv
enag
ein
that
stat
e
Source:
Au
tho
rs’
tab
ula
tio
ns
of
mo
difi
edd
ata
fro
mth
eU
SC
ensu
sB
ure
au,
Cu
rren
tP
op
ula
tio
nS
urv
ey,
20
11
–2
01
2A
nn
ual
So
cial
and
Eco
no
mic
Su
pp
lem
ents
Cancer Causes Control (2015) 26:657–668 663
123

period was nonsignificant [17.5 % (90 % CI 15.5–19.6 %)
in 1998–1999 and 17.3 % (90 % CI 16.7–18.0 %) in
2011–2012; p = 0.44].
In 2007–2008, the estimated proportion of eligible
women aged 40–64 screened by NBCCEDP was 11.9 %
(90 % CI 11.6–12.3 %). The estimated proportion was
10.3 % (90 % CI 10.1–10.6 %) in 2010–2011, a decrease
of 1.6 % (90 % CI 0.8–1.8 %) percentage points
(p\ 0.001). However, the estimated proportion of eligible
women aged 50–64 screened by NBCCEDP declined from
20.8 % (90 % CI 20.0–21.7 %) in 2007–2008 to 17.2 %
(90 % CI 16.8–17.8 %) in 2010–2011, a decrease of 3.6 %
(90 % CI 2.5–4.7 %) percentage points (p\ 0.001).
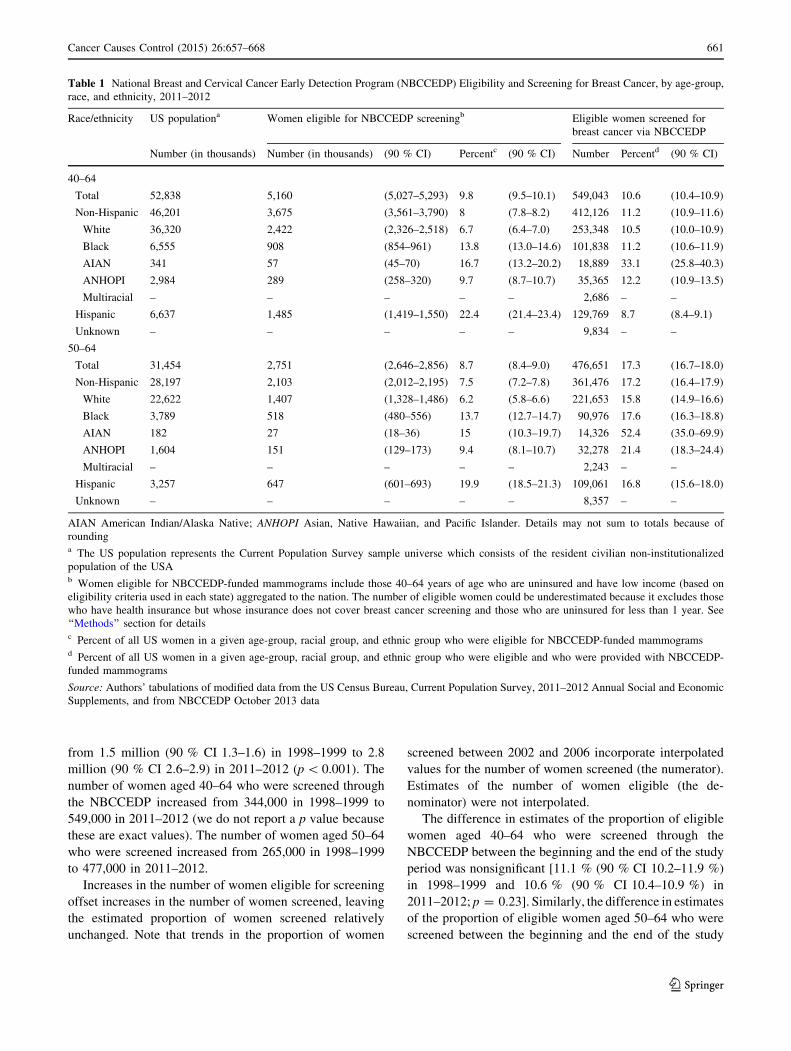
Figure 4 shows trends in the estimated proportion of
eligible women screened aged 50–64 by race and ethnicity.
Screening rates for American Indians and Alaskan Natives,
which are much higher than for other groups, are shown on a
separate graph to facilitate display. Estimates of changes in
the proportion of women screened over the study period for
black [from 16.0 % (90 % CI 11.6–20.4 %) to 17.6 %
(90 % CI 16.3–18.8 %)], Asian/Native Hawaiian, other
Pacific Islander [from 17.3 % (90 % CI 10.2–11.9 %) to
21.4 % (90 % CI 10.2–11.9 %)], Hispanic [from 14.3 %
(90 % CI 10.6–18.0 %) to 16.9 % (90 % CI 15.7–18.0 %)],
and white women [from 17.9 % (90 % CI 15.0–20.7 %) to
15.8 % (90 % CI 14.9–16.6 %)] were nonsignificant.
Discussion
We estimated that the NBCCEDP screened about 10.6 %
(90 % CI 10.4–10.9 %) of eligible women aged 40–64 for
breast screening in 2011–2012. An estimated 30.6 %
(90 % CI 26.4–34.8 %) of eligible women aged 40–64 are
screened outside NBCCEDP, leaving around 58.8 % (90 %
CI 54.6–63.0 %) of eligible women not screened with a
2-year period. The comparable figure from the Center for
Disease Control and Prevention’s Health, United States,
2013 report, which was calculated using the 2010 National
Health Interview Survey, is 64 % (see Table 83 [16]).
Health, United States, 2013 reports that 24.4 % of women
aged 40–64 with private insurance were not screened and
35.6 % of women aged 40–64 with Medicaid were not
screened. Screening under the NBCCEDP yields an esti-
mated benefit of 0.056 life years per women screened, and
women who are not screened forgo this benefit [17].
The proportion of women screened may vary across
grantees because of differences in funding, the costs of
delivering, and grantee-specific eligibility criteria and the
characteristics of eligible women. Some grantees supple-
ment CDC funds with funds allocated from the state bud-
get, and funding from the CDC to grantees is not directly
tied to the number of eligible women. Thus, the number of
grant dollars per eligible woman varies across states. The
0.0
10.0
20.0
30.0
40.0
50.0
60.0
70.0
80.0
90.0
Perc
ent S
cree
ned
US States and District of Columbia
Women 50-64
Women 40-64
Women 50-64, US percentage is 17.3%
Women 40-64, US percentage is 10.6%
Fig. 2 Percent of NBCCEDP-eligible women screened for breast
cancer by state and District of Columbia compared to national
average, 2011–2012. Source: Authors’ tabulations of modified data
from the US Census Bureau, Current Population Survey, 2011–2012
Annual Social and Economic Supplements, and from NBCCEDP
October 2013 data. Notes: The symbols show the percentage of
eligible women screened by each state and District of Columbia. Two
states that used different eligibility/implementation criteria are not
included. Data points for each age-group sorted by percentage of
eligible women screened. The proportion of women screened by the
NBCCEDP across the USA is 10.6 % aged 40–64 and 17.3 % aged
50–64
664 Cancer Causes Control (2015) 26:657–668
123
cost of delivery, which includes the cost of transportation
and the cost of mammograms, may also vary across states.
Eligibility criteria influence screening rates via their impact
on the composition of the pool of eligible women. For
example, the types of women who are eligible will differ
between states that include women with incomes up to
200 % of the poverty level and states that include women
with incomes up to 250 % of the poverty level. Differences
in the propensity to be screened between women with in-
comes below and above 200 % of the poverty level may
explain some of the differences in state-level screening
rates. Likewise, many grantees start routine breast screen-
ing in women age 50 and older but offer services to
symptomatic women at any age. The population of
NBCCEDP-eligible women in a state with broader Medi-
caid coverage criteria may include a higher proportion of
women with incomes between 100 and 250 % of the
poverty level because those below have coverage for
mammograms through Medicaid.
We estimated the number of women eligible for
NBCCEDP screening and the number of eligible women
screened outside of the NBCCEDP by applying eligibility
criteria to the Annual Social and Economic Supplement
and the Medical Expenditure Panel Survey. We expect that
these figures are measured with error [18]. Survey re-
spondents may misreport their incomes and insurance sta-
tus, and estimates are subject to non-response bias.
Restricting attention to women uninsured for the entire
year overlooks women who are uninsured for only a part of
the year and would be eligible for the NBCCEDP while
they are uninsured. Likewise, there is a mismatch in the
period over which we measured the receipt of a mammo-
gram in the Medical Expenditure Panel Survey (2 years)
and the period over which we measured insurance coverage
(1 year). Some women we counted as eligible may have
been insured when they received a mammogram. For this
reason, our estimates of the proportion of eligible women
who received a mammogram outside the NBCCEDP may
be overstated.
In many states, only women with incomes below 200 %
of the poverty level are eligible for NBCCEDP-funded
mammograms. Our estimate of the proportion of women
who are screened outside the NBCCEDP and women who
are not screened is based on a sample that includes women
with incomes below 250 % of the poverty level. Our esti-
mates may look different if we restricted the sample to
Table 3 NBCCEDP trends in the number of women eligible and the number and percent of women screened for breast cancer
Year Women eligible for NBCCEDP screening Eligible women screened for breast cancer via NBCCEDP
Number (in thousands) (90 % CI) Number (in thousands) Percent of eligible screened (90 % CI)
40–64
1998–1999 3,110 (2,861–3,360) 344 11.1 (10.2–11.9)
1999–2000 3,018 (2,806–3,230) 367 12.2 (11.3–13.0)
2000–2001 3,089 (2,912–3,267) 391 12.7 (11.9–13.4)
2007–2008 4,037 (3,918–4,157) 482 11.9 (11.6–12.3)
2008–2009 4,526 (4,394–4,657) 513 11.3 (11.0–11.7)
2009–2010 5,039 (4,892–5,185) 533 10.6 (10.3–10.9)
2010–2011 5,230 (5,083–5,377) 541 10.3 (10.1–10.6)
2011–2012 5,160 (5,027–5,293) 549 10.6 (10.4–10.9)
Change 2,050 205 -0.41
50–64
1998–1999 1,459 (1,287–1,631) 256 17.5 (15.5–19.6)
1999–2000 1,419 (1,273–1,565) 279 19.7 (17.6–21.7)
2000–2001 1,446 (1,324–1,568) 297 20.6 (18.8–22.3)
2007–2008 1,994 (1,912–2,076) 415 20.8 (20.0–21.7)
2008–2009 2,198 (2,111–2,285) 445 20.3 (19.5–21.1)
2009–2010 2,523 (2,423–2,624) 459 18.2 (17.5–18.9)
2010–2011 2,738 (2,629–2,847) 470 17.2 (16.5–17.8)
2011–2012 2,751 (2,646–2,856) 477 17.3 (16.7–18.0)
Change 1,292 221 -0.2
Details may not sum to totals because of rounding
Source: Authors’ tabulations of modified data from the US Census Bureau, Current Population Survey, 2011–2012 Annual Social and Economic
Supplements, and from NBCCEDP October 2013 data
Cancer Causes Control (2015) 26:657–668 665
123
women with incomes below 200 % of the poverty level.
We suspect that fewer would receive mammograms outside
the NBCCEDP.
We do not know how many women have low incomes and
are underinsured (i.e., in plans that do not cover mammog-
raphy) and thus eligible for services. For this reason, we may
underestimate the proportion of women eligible.
Our study builds on the work of Tangka et al. [8], who
described the number of women eligible for screening
through the NBCCEDP and the proportion screened for the
period 2002–2003. They reported that the NBCCEDP
screened 529,000 women aged 40–64, 13.2 % (90 %
CI 12.5–13.9) of the eligible population. We found that in
2011–2012, the NBCCEDP screened more women, 549
thousand, but the estimated proportion of eligible women
screened by NBCCEDP was lower, 10.6 % (90 %
CI 10.4–10.9 %). Increases in the number of women
eligible for the NBCCEDP have exceeded increases in the
capacity and funding of NBCCEDP and its grantees to
provide mammograms.
In 2009, the United States Preventive Services Task
Force issued new breast cancer screening recommendations
[1]. The major change from the previous version was that
the Task Force no longer recommended that women aged
40–49 be routinely screened for breast cancer. Previous
studies have found that there was a small [19–21] or no
[22] decrease in the proportion of women screened in this
age-group after 2009. We did not specifically measure the
proportion of women screened who were aged 40–49.
However, comparing trends in the proportion of women
screened among women 40–64 and 50–64, it does not ap-
pear as if the Task Force recommendation had much, if
any, impact on the proportion of women screened by
NBCCEDP. NBCCEDP established a policy in 1996 to
prioritize mammography for women 50 years of age or
older, and this age-group has been the priority of the
NBCCEDP since that time [3]. The proportion of women
aged 40–49 screened by NBCCEDP is sufficiently small
that it is difficult to detect an impact of the revised 2009
USPSTF recommendation, if any. Many of the women
0
1000
2000
3000
4000
5000
6000
Num
ber
(in th
ousa
nds)
Number of women eligible by age groupa
40-64, p<0.001d
50-64, p<0.001d
0
100
200
300
400
500
600N
umbe
r (in
thou
sand
s)Number of women screened by age groupb
40-64, p<0.001d
50-64, p<0.001d
0
5
10
15
20
25
98-99 99-00 00-01 01-02 02-03 03-04 04-05 05-06 06-07 07-08 08-09 09-10 10-11 11-12
%
Two year period
Percent of eligible women screened by age groupc
50-64, p=0.28d
40-64, p=0.01d
aWomen eligible for NBCCEDP-funded Mammograms include those 40-64 years of age who are uninsured, and have low-income (based on eligibility criteria used in each state) aggregated to the nation. The number of eligible women could be underestimated because it excludes those who have health insurance but whose insurance does not cover breast cancer screening and those who are uninsured for less than one year. See methods section for details.bPercent of all US women in a given age group who were eligible for NBCCEDP-funded Mammograms.cPercent of all US women in a given age group who were eligible and who were provided with NBCCEDP-funded Mammograms.dP-values are for tests of trends.
Fig. 3 Trends in NBCCEDP-
eligible population and reach for
breast cancer screening by age-
group. Source: Authors’
tabulations of modified data
from the US Census Bureau,
Current Population Survey,
2011–2012 Annual Social and
Economic Supplements, and
from NBCCEDP October 2013
data. Note: The numbers and
percentages in the shaded
region of the graph are
interpolated values
666 Cancer Causes Control (2015) 26:657–668
123

aged 40–49 screened by NBCCEDP grantees are symp-
tomatic [23], and so we would not necessarily expect to see
a decline in the proportion screened.
Our data predate many of the major insurance coverage
expansions under the Affordable Care Act. Previously, Levy
et al. [24] estimated that there will be 1.7 million low-income
uninsured women aged 40–64 who remain eligible for the
NBCCEDP in 2014 after implementation of the Affordable
Care Act’s major insurance expansion provisions. They
conclude that the NBCCEDP ‘‘will still only be able to meet
the needs of one-fifth to one-third of those eligible.’’ Levy
et al. assumed that coverage expansions under the Affordable
Care Act would mirror the expansions that occurred in
Massachusetts after it implemented its reform in 2006. They
also assumed that all states would expand Medicaid. In April
2014, the Congressional Budget Office projected that 30
million non-elderly adults will be uninsured in 2016 and
beyond given what was known about states’ expansion of
Medicaid at the time [25]. Twenty-three states have not yet
expanded Medicaid. There are roughly 5 million uninsured
adults in these states who do not qualify for Medicaid (under
the pre-Affordable Care Act policies that remain in place)
but do not earn enough to receive subsidies to buy insurance
on the Health Insurance Marketplaces [26]. The number of
uninsured women will increase if the Supreme Court rules
that the Affordable Care Act prohibits the federal govern-
ment for providing subsidies to people who buy insurance
through federally operated exchanges (as opposed to state-
based exchanges). Either way, we expect that the number of
uninsured will continue to outpace the capacity of the
NBCCEDP to provide cancer screenings.
Acknowledgments Dr. Howard received support for this research
from the Centers for Disease Control and Prevention (12IPA1203126).
Conflict of interest None.
References
1. Nelson HD, Tyne K, Naik A, Bougatsos C, Chan BK, Humphrey
L (2009) Screening for breast cancer: an update for the US
Preventive Services Task Force. Ann Intern Med 151:727–737
86.2
0102030405060708090
100
Perc
ent s
cree
ned
via
NB
CC
ED
Pb
Two year period
AIAN, p=0.355c
All races, p=0.28c
24.2
10
12
14
16
18
20
22
24
26
Perc
ent s
cree
ned
via
NB
CC
ED
Pb
Black, p=0.38c
All races, p=0.28c
White, p=0.03c
ANHOPI, p=0.003c
Hispanic, p=0.925c
14.3
17.2
aWomen eligible for NBCCEDP-funded Mammograms include those who are uninsured, and have low-income (based on eligibility criteria used in each state) aggregated to the nation. The number of eligible women could be underestimated because it excludes those who have health insurance but whose insurance does not cover breast cancer screening and those who are uninsured for less than one year. See methods section for details. bPercent of all US women ages 50-64 years in a given racial and ethnic group who are eligible and who were provided with NBCCEDP- funded Mammograms.cP-values are for tests for trends.
Fig. 4 NBCCEDP trends in the
percent of eligible women
screened for breast cancer, aged
50–64, by race and ethnicitya.
Source: Authors’ tabulations of
modified data from the US
Census Bureau, Current
Population Survey, 2011–2012
Annual Social and Economic
Supplements, and from
NBCCEDP October 2013 data.
Notes: AIAN American Indian
or Alaska Native; ANHOPI
Asian American, Native
Hawaiian, or Pacific Islander.
Highest and lowest points are
marked to point out scale
Cancer Causes Control (2015) 26:657–668 667
123
2. Sabatino SA, Coates RJ, Uhler RJ, Breen N, Tangka F, Shaw KM
(2008) Disparities in mammography use among US women aged
40–64 years, by race, ethnicity, income, and health insurance
status, 1993 and 2005. Med Care 46:692–700
3. Centers for Disease Control and Prevention (2012) Cancer
screening—United States, 2010. MMWR 61:41–46
4. Finkelstein A, Taubman S, Wright B, Bernstein M, Gruber J,
Newhouse JP, Allen H, Baicker K, Oregon Health Study Group
(2012) The Oregon health insurance experiment: evidence from
the first year. Quart J Econ 127:1057–1106
5. Trivedi AN, Rakowski W, Ayanian JZ (2008) Effect of cost
sharing on screening mammography in medicare health plans.
N Engl J Med 358:375–383
6. Lee NC, Wong FL, Jamison PM, Jones SF, Galaska L, Brady KT,
Wethers B, Stokes-Townsend GA (2014) Implementation of the
National Breast and Cervical Cancer Early Detection Program:
the beginning. Cancer 120(Suppl 16):2540–2548
7. Tangka FKL, Howard D, Royalty J, Danzell LP, O’Hara B, Miller
J, Sabatino S, Joseph K, Guy G, Hall IJ (2014) Cervical cancer
screening of underserved women in the United States: results from
the National Breast and Cervical Cancer Early Detection Program,
1997–2012. Cancer Causes Control (this supplement)
8. Tangka FKL, Dalaker J, Chattopadhyay SK, Gardner JG, Royalty
J, Hall IJ, DeGroff A, Blackman DK, Coates RJ (2006) Meeting
the mammography screening needs of underserved women: the
performance of the National Breast and Cervical Cancer Early
Detection Program in 2002–2003. Cancer Causes Control
17:1145–1154
9. U.S. Department of Health and Human Services (2013) 2013
Poverty guidelines. http://aspe.hhs.gov/poverty/13poverty.cfm.
Accessed 21 July 2014
10. DeNavas-Walt C, Proctor BD, Smith J (2013) Current Population
Reports, P60–245. Income, poverty, and health insurance cover-
age in the United States: 2012. US Government Printing Office.
http://www.census.gov/prod/2013pubs/p60-245.pdf. Accessed 21
July 2014
11. US Census Bureau (2013) Source and accuracy of estimates for
income, poverty, and health insurance coverage in the United
States: 2012. http://www.census.gov/hhes/www/p60_245sa.pdf.
Accessed 21 July 2014
12. US Census Bureau (2006) Current Population Survey: design and
methodology. Technical paper 66. http://www.census.gov/prod/
2006pubs/tp-66.pdf. Accessed 21 July 2014
13. US Census Bureau. Modified race summary methodology. http://
www.census.gov/popest/data/historical/files/MRSF-01-US1.pdf.
Accessed 21 July 2014
14. Howard DH, Richardson LC, Thorpe KE (2009) Cancer screen-
ing and age in the United States and Europe. Health Aff
28:1838–1847
15. Machlin S, Yu W, Zodet M (2015) Computing standard errors for
MEPS estimates. http://meps.ahrq.gov/survey_comp/standard_
errors.jsp. Accessed 25 July 2015
16. National Center for Health Statistics (2014). Health, United
States, 2013: with special feature on prescription drugs. http://
www.cdc.gov/nchs/data/hus/hus13.pdf#083. Accessed 21 July
2014
17. Hoerger TJ, Ekwueme DU, Miller JW, Uzunangelov V, Hall IJ,
Segel J, Royalty J, Gardner JG, Smith JL, Li C (2011) Estimated
effects of the National Breast and Cervical Cancer Early Detec-
tion Program on breast cancer mortality. Am J Prev Med
40:397–404
18. DeNavas-Walt C, Proctor BD, Mills RJ (2004) US Census
Bureau Current Population Reports, P60-226, Income, Poverty,
and Health Insurance Coverage in the United States: 2003. US
Government Printing Office, Washington, DC
19. Sharpe RE Jr, Levin DC, Parker L, Rao VM (2013) The effect of
the controversial US Preventive Services Task Force recom-
mendations on the use of screening mammography. J Am Coll
Radiol 10:21–24
20. Wang AT, Fan J, Van Houten HK, Tilburt JC, Stout NK, Montori
VM, Shah ND (2014) Impact of the 2009 US Preventive Services
Task Force guidelines on screening mammography rates on
women in their 40s. PLoS ONE 9:e91399
21. Howard DH, Adams EK (2012) Mammography rates after the
2009 US Preventive Services Task Force breast cancer screening
recommendation. Prev Med 55:485–487
22. Pace LE, He Y, Keating NL (2013) Trends in mammography
screening rates after publication of the 2009 US Preventive
Services Task Force recommendations. Cancer 119:2518–2523
23. White A, Miller J, Royalty J, Ryerson BA, Benard V, Helsel W,
Kammerer W (2015). Clinical outcomes of mammography in the
National Breast and Cervical Cancer Early Detection Program,
2009–2012. Cancer Causes Control (this supplement)
24. Levy AR, Bruen BK, Ku L (2012) Health care reform and
women’s insurance coverage for breast and cervical cancer
screening. Prev Chronic Dis 9:E159
25. Congress of the United States, Congressional Budget Office
(2014) Updated estimates of the effects of the insurance coverage
provisions of the Affordable Care Act, April 2014. http://www.
cbo.gov/sites/default/files/cbofiles/attachments/45231-ACA_Esti
mates.pdf. Accessed 15 May 2014
26. Kaiser Family Foundation (2014) The coverage gap: uninsured poor
adults in states that do not expand Medicaid. http://kff.org/health-
reform/issue-brief/the-coverage-gap-uninsured-poor-adults-in-
states-that-donot-expand-medicaid/. Accessed 21 July 2014
668 Cancer Causes Control (2015) 26:657–668
123
ERRATUM
Erratum to: Breast cancer screening of underserved womenin the USA: results from the National Breast and Cervical CancerEarly Detection Program, 1998–2012
David H. Howard1 • Florence K. L. Tangka2 • Janet Royalty2 • Lucinda P. Dalzell3 •
Jacqueline Miller2 • Brett O’Hara3 • Kristy Joseph4 • Kristy Kenney2 •
Gery Guy2 • Ingrid J. Hall2
Published online: 1 May 2015
� Springer International Publishing Switzerland 2015
Erratum to: Cancer Causes ControlDOI 10.1007/s10552-015-0553-0
In the original publication of the article, reference 7 has not
been cited properly. The corrected reference is provided
below.
Reference
7. Tangka FKL, Howard D, Royalty J et al (2015) Cervical cancer
screening of underserved women in the United States: results from
the National Breast and Cervical Cancer Early Detection Program,
1997–2012. Cancer Causes Control. doi:10.1007/s10552-015-
0524-5
The online version of the original article can be found under doi:10.
1007/s10552-015-0553-0.
& David H. Howard
1 Department of Health Policy and Management, Emory
University, 1518 Clifton Road NE, Atlanta, GA 30030, USA
2 Division of Cancer Prevention and Control, Centers for
Disease Control and Prevention, Atlanta, GA, USA
3 Social, Economics and Household Statistics Division, US
Census Bureau, Washington, DC, USA
4 Division of Global Health Protection, Centers for Disease
Control and Prevention, Atlanta, GA, USA
123
Cancer Causes Control (2015) 26:669
DOI 10.1007/s10552-015-0591-7


