BOARD OF COUNTY COMMISSIONERS
OFFICE OF THE COMMISSION AUDITOR
M E M O R A N D U M TO: Honorable Chairman Jean Monestime
and Members, Board of County Commissioners FROM: Charles Anderson, CPA Commission Auditor DATE: February 24, 2015 SUBJECT: The Beacon Council’s Use of Eight Percent of the Business Tax Previously Used
by the Metro-Miami Action Plan Pursuant to Resolution No. R-552-09, the Office of the Commission Auditor has concluded a review of The Beacon Council’s use of eight percent of the business tax previously used by the Metro-Miami Action Plan (MMAP) (now Miami-Dade Economic Advocacy Trust (MDEAT)), for the fiscal years ended September 30, 2010, 2011, 2012 and 2013. If you have any questions or need additional information, please contact me at (305) 375-2524. c: Honorable Carlos Gimenez, County Mayor
R. A. Cuevas, Jr., County Attorney Jack Osterholt, Deputy Mayor/Director, Regulatory and Economic Resources Department Edward Marquez, Deputy Mayor/Finance Director Mary T. Cagle, Inspector General Cathy Jackson, Director, Audit and Management Services John Dixon, Executive Director, Miami-Dade Economic Advocacy Trust Larry K. Williams, President & CEO, The Beacon Council Camela Glean-Jones, Chief Financial Officer and Executive Vice President, Budget & Administration, The Beacon Council Stephen M. Beatus, Executive Vice President, Economic Development, The Beacon Council Ivette Arango O'Doski, Vice President, Government & Community Relations, The Beacon
Council Jacqueline Guerra, Director, Accounting, The Beacon Council Neil R. Singh, Audit Manager, Office of the Commission Auditor

THIS PAGE INTENTIONALLY BLANK
MIAMI-DADE COUNTY BOARD OF COUNTY COMMISSIONERS
OFFICE OF THE COMMISSION AUDITOR
Auditors
Luis E. Carrazana, CPA Auditor-In-Charge Norma Roig, CPA, CGMA Senior Auditor Noel Aranha, CPA, CGMA, CRMA Senior Auditor Neil R. Singh, CPA Audit Manager
111 NW First Street, Suite 1030 Miami, Florida 33128
305-375-4354
The Beacon Council’s Use of Eight Percent of the Business Tax Previously Used by the
Metro-Miami Action Plan
Project Number 09-184101
February 24, 2015
Charles Anderson, CPA Commission Auditor

ii
THIS PAGE INTENTIONALLY BLANK
iii
TABLE OF CONTENTS I. Objective and Scope ...........................................................................................................1 II. Methodology .......................................................................................................................1 III. Background ........................................................................................................................2 IV. Summary Results ...............................................................................................................3 V. Detailed Results ..................................................................................................................3 VI. Recommendation................................................................................................................4 VII. Attachments ........................................................................................................................5
Attachment I. TUA and EZ Completed Projects and Visitations Analysis Sample ..7 Attachment II. TUA and EZ Completed Projects and Visitations Consolidated
Report ...............................................................................................8
Attachment III. Management Response .......................................................................9

iv
THIS PAGE INTENTIONALLY BLANK

1
I. OBJECTIVE AND SCOPE
Pursuant to Resolution No. R-552-09, approved by the Miami-Dade County Board of County Commissioners (BCC) on May 5, 2009, the Office of the Commission Auditor (OCA) conducted this review, a non-audit service, on The Miami-Dade Beacon Council, Inc.’s (the Council) use of the eight percent of the local business tax revenues previously allocated to the Metro-Miami Action Plan Trust (MMAP) for the Fiscal Years (FY) ended September 30, 2010, 2011, 2012, and 2013. MMAP is now Miami-Dade Economic Advocacy Trust (MDEAT). The objective of the review was to prepare a report for the BCC in accordance with Ordinance No. 08-112, adopted October 7, 2008, designating the Council to utilize these revenues for similar purposes in economically disadvantaged neighborhoods as set forth in the former Grant Agreement with MMAP. Economically disadvantaged neighborhoods are designated as Enterprise Zones (EZ), Empowerment Zones (EMP), and Targeted Urban Areas (TUAs) of this County.1 OCA reviewed data provided by the Council for the fiscal years referenced above. In addition, when deemed necessary, we interviewed staff and reviewed pertinent records about activities before October 1, 2009 and after September 30, 2013.
II. METHODOLOGY
We prepared this report with information provided by the Council. This review consisted principally of inquiries of personnel and examinations of documents and programmatic data. It was substantially less detailed in scope than an audit, the objective of which is the expression of an opinion regarding financial statements or programs taken as a whole. Since the adoption of Resolution No. R-552-09, OCA has been reviewing quarterly information submitted by the Council to the BCC and the County Mayor. After much deliberation, on May 29, 2013, OCA and the Council substantially agreed on a reporting format and the terms of the review. Further amendments to the reporting format were discussed over the ensuing months. On August 27, 2014, OCA met with the Council’s staff to review the information prepared by them regarding the use of the eight percent of the local business tax revenues previously used by MMAP.
1 Pursuant to Ordinance 97-33, the County EMP neighborhoods and its developable sites also became TUAs. All completed projects located in a TUA are also located within an EZ.
2
III. BACKGROUND
Resolution No. R-1066-88, adopted July 19, 1988, authorized the execution of a retroactive agreement with the Council as the Economic Development Agency (EDA) to implement the Economic Development Strategy (EDS) within the County according to the provisions of Ordinance No. 87-38. According to the agreement, the services the Council would render in overseeing and implementing the EDS for the County would include, but would not be limited to:
Advertising; promotional activities; stimulation of grants and contributions to Small Business Administration licensed venture capital entities (MSBICs/Section 301(d) Investment Companies); merchandising; general marketing, in all its forms; direct sales; the securing and encouragement of private sector funding; aggressive recruitment of new industries; the retention and expansion of existing businesses; and any other appropriate sales and marketing techniques to promote Dade County.2
On June 7, 1994, the Council and MMAP entered into a Grant Agreement which allocated to MMAP eight percent of the local business tax revenues received by the Council. MMAP was required to use these revenues in accordance with state and local laws and to oversee and implement a comprehensive economic development strategy.3 On October 7, 2008, the BCC adopted Ordinance No. 08-112 which rescinded its policy requiring the Council to allocate eight percent of the local business tax revenues to MMAP, and designated that the Council utilize this eight percent of the local business tax revenues for similar purposes in economically disadvantaged neighborhoods as set forth in the former Grant Agreement with MMAP. Ordinance No. 08-112 also stipulated that the Council submit a written annual report to the BCC and include a clear statement on the uses of these funds which were previously allocated to MMAP. The definition of “similar purposes” as “set forth in the former Grant Agreement with MMAP”, and in accordance with Ordinance No. 08-112, is “to oversee and implement a comprehensive economic development strategy through advertising, promotional activities, and other sales and marketing techniques.” On May 5, 2009, the BCC adopted Resolution No. R-552-09 which directed the OCA to prepare quarterly reports to the BCC on the Council’s use of the eight percent of the local business tax revenues previously allocated to MMAP, in accordance with Ordinance No. 08-112.
2 Agreement between Metro-Dade County (County) and The Beacon Council dated October 1, 1987. Article I.: Responsibilities of BCI (The Beacon Council). 3 Grant Agreement between Metro-Miami Action Plan (MMAP) and The Beacon Council dated June 7, 1994, page 2.
3
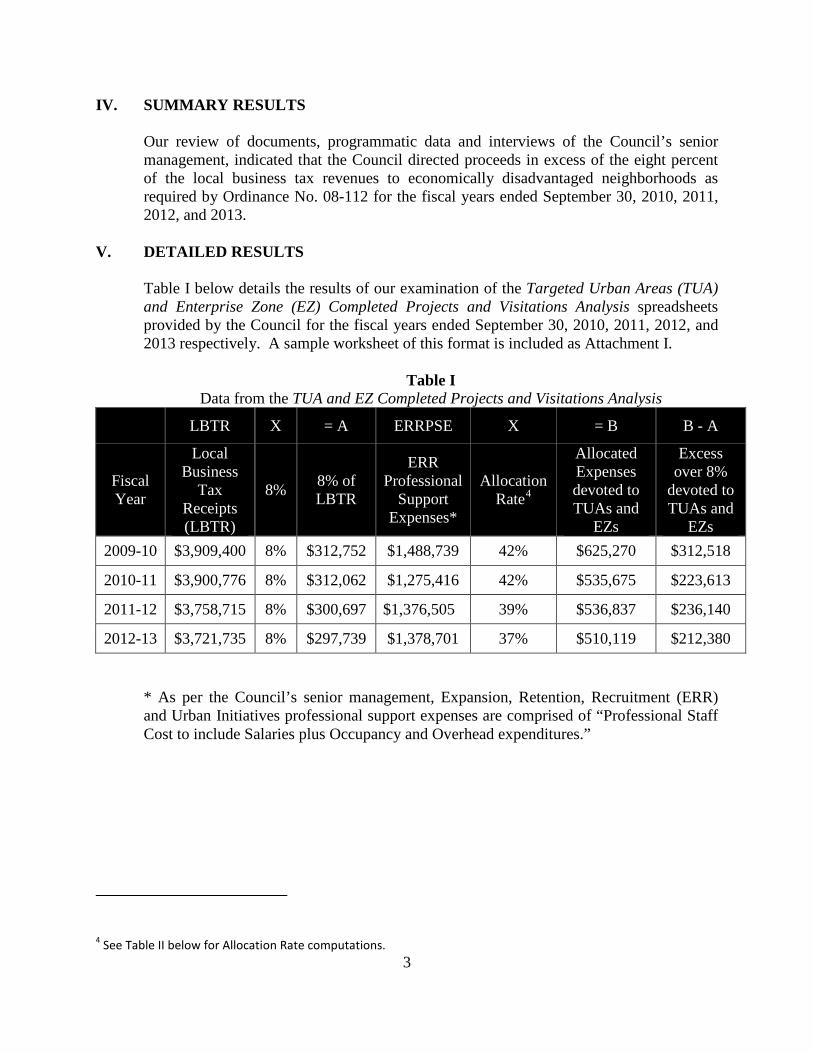
IV. SUMMARY RESULTS Our review of documents, programmatic data and interviews of the Council’s senior management, indicated that the Council directed proceeds in excess of the eight percent of the local business tax revenues to economically disadvantaged neighborhoods as required by Ordinance No. 08-112 for the fiscal years ended September 30, 2010, 2011, 2012, and 2013.
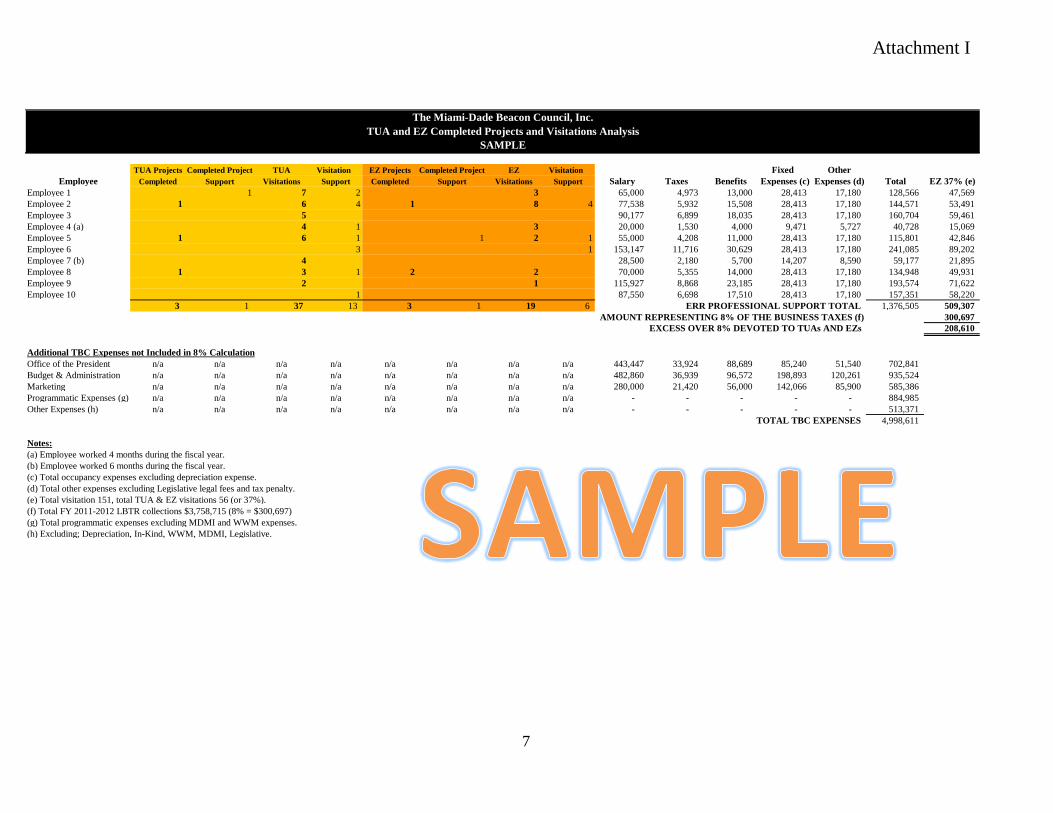
V. DETAILED RESULTS Table I below details the results of our examination of the Targeted Urban Areas (TUA) and Enterprise Zone (EZ) Completed Projects and Visitations Analysis spreadsheets provided by the Council for the fiscal years ended September 30, 2010, 2011, 2012, and 2013 respectively. A sample worksheet of this format is included as Attachment I.
Table I Data from the TUA and EZ Completed Projects and Visitations Analysis
LBTR X = A ERRPSE X = B B - A
Fiscal Year
Local Business
Tax Receipts (LBTR)
8% 8% of LBTR
ERR Professional
Support Expenses*
Allocation Rate4
Allocated Expenses devoted to TUAs and
EZs
Excess over 8%
devoted to TUAs and
EZs 2009-10 $3,909,400 8% $312,752 $1,488,739 42% $625,270 $312,518
2010-11 $3,900,776 8% $312,062 $1,275,416 42% $535,675 $223,613
2011-12 $3,758,715 8% $300,697 $1,376,505 39% $536,837 $236,140
2012-13 $3,721,735 8% $297,739 $1,378,701 37% $510,119 $212,380
* As per the Council’s senior management, Expansion, Retention, Recruitment (ERR) and Urban Initiatives professional support expenses are comprised of “Professional Staff Cost to include Salaries plus Occupancy and Overhead expenditures.”
4 See Table II below for Allocation Rate computations.

4
The Council provided the OCA with full access to their books and records, including information deemed by the Council to be proprietary and confidential. OCA traced the information provided by the Council on a test basis to various supporting documents, including subsidiary ledgers, payroll documents, and audited financial statements, for the fiscal years ended September 30, 2010, 2011, 2012, and 2013.
Table II below details the results of our examination of the TUA and EZ Completed Projects and Visitations Consolidated Report spreadsheets provided by the Council for the fiscal years ended September 30, 2010, 2011, 2012, and 2013 respectively. This report is included as Attachment II. This Attachment also provides details on jobs created, square feet occupied and new capital investment.
Table II Data from the TUA and EZ Completed Projects and Visitations Consolidated Report
A B A / B
Fiscal Year TUA
visitations only
EZ visitations
only
TUA and EZ visitations
Local Business
Local Jobs (LBLJ)
Visitations
Allocation Rate
2009-10 44 19 63 150 42% 2010-11 47 18 65 154 42% 2011-12 40 19 59 152 39% 2012-13 34 15 49 131 37%
OCA traced the information to the supporting documentation on a test basis for all fiscal years provided including all Total Summary and Empowerment Zones (EMP)/EZ/TUA totals to (1) Companies Assisted by the Council spreadsheets, (2) Visitations TUAs and Enterprise Zones Only spreadsheets and (3) Year End Key Performance Indicators.
VI. RECOMMENDATION Further improvements to the Council’s accounting information systems may be warranted. This system should take into account cost-benefit considerations in accommodating a more precise dollar-for-dollar accountability of all of the Council’s individual efforts in each of its core and varied endeavors in order to accommodate the reporting needs of its various stakeholders. For instance, a time and billing software may be added to the existing management accounting information systems that would integrate with an activity based cost accounting system as part of an overall reporting restructuring effort. The Council should periodically report to the County on the progress of implementing an activity based cost accounting system.

5
ATTACHMENTS

6
THIS PAGE INTENTIONALLY BLANK
Attachment I
7
The Miami-Dade Beacon Council, Inc.TUA and EZ Completed Projects and Visitations Analysis
SAMPLE
TUA Projects Completed Project TUA Visitation EZ Projects Completed Project EZ Visitation Fixed OtherEmployee Completed Support Visitations Support Completed Support Visitations Support Salary Taxes Benefits Expenses (c) Expenses (d) Total EZ 37% (e)
Employee 1 1 7 2 3 65,000 4,973 13,000 28,413 17,180 128,566 47,569 Employee 2 1 6 4 1 8 4 77,538 5,932 15,508 28,413 17,180 144,571 53,491 Employee 3 5 90,177 6,899 18,035 28,413 17,180 160,704 59,461 Employee 4 (a) 4 1 3 20,000 1,530 4,000 9,471 5,727 40,728 15,069 Employee 5 1 6 1 1 2 1 55,000 4,208 11,000 28,413 17,180 115,801 42,846 Employee 6 3 1 153,147 11,716 30,629 28,413 17,180 241,085 89,202 Employee 7 (b) 4 28,500 2,180 5,700 14,207 8,590 59,177 21,895 Employee 8 1 3 1 2 2 70,000 5,355 14,000 28,413 17,180 134,948 49,931 Employee 9 2 1 115,927 8,868 23,185 28,413 17,180 193,574 71,622 Employee 10 1 87,550 6,698 17,510 28,413 17,180 157,351 58,220
3 1 37 13 3 1 19 6 ERR PROFESSIONAL SUPPORT TOTAL 1,376,505 509,307 AMOUNT REPRESENTING 8% OF THE BUSINESS TAXES (f) 300,697
EXCESS OVER 8% DEVOTED TO TUAs AND EZs 208,610
Additional TBC Expenses not Included in 8% CalculationOffice of the President n/a n/a n/a n/a n/a n/a n/a n/a 443,447 33,924 88,689 85,240 51,540 702,841 Budget & Administration n/a n/a n/a n/a n/a n/a n/a n/a 482,860 36,939 96,572 198,893 120,261 935,524 Marketing n/a n/a n/a n/a n/a n/a n/a n/a 280,000 21,420 56,000 142,066 85,900 585,386 Programmatic Expenses (g) n/a n/a n/a n/a n/a n/a n/a n/a - - - - - 884,985 Other Expenses (h) n/a n/a n/a n/a n/a n/a n/a n/a - - - - - 513,371
TOTAL TBC EXPENSES 4,998,611
Notes:(a) Employee worked 4 months during the fiscal year.(b) Employee worked 6 months during the fiscal year.(c) Total occupancy expenses excluding depreciation expense.(d) Total other expenses excluding Legislative legal fees and tax penalty.(e) Total visitation 151, total TUA & EZ visitations 56 (or 37%).(f) Total FY 2011-2012 LBTR collections $3,758,715 (8% = $300,697)(g) Total programmatic expenses excluding MDMI and WWM expenses.(h) Excluding; Depreciation, In-Kind, WWM, MDMI, Legislative.

Attachment II
8
The Miami-Dade Beacon Council, Inc.TUA and EZ Completed Projects and Visitations Consolidated Report
Total Summary EZ/EMP/TUA Total Per Cent %Completed Projects 32 12 38%LBLJ Visitations* 131 49 37%Direct Jobs Created 2,339 917 39%Indirect Jobs Created 696 139 20%Total Jobs Created 3,035 1,056 35%Square Feet Occupied 1,240,524 472,511 38%New Capital Investment 534,643,718 45,340,718 8%
Total Summary EZ/EMP/TUA Total Per Cent %Completed Projects 27 6 22%LBLJ Visitations 152 59 39%Direct Jobs Created 1,877 502 27%Indirect Jobs Created 945 211 22%Total Jobs Created 2,822 713 25%Square Feet Occupied 575,989 318,760 55%New Capital Investment 111,590,000 13,580,000 12%
Total Summary EZ/EMP/TUA Total Per Cent %Completed Projects 29 17 59%LBLJ Visitations 154 65 42%Direct Jobs Created 1,591 798 50%Indirect Jobs Created 601 203 34%Total Jobs Created 2,192 1,001 46%Square Feet Occupied 346,376 215,441 62%New Capital Investment 117,150,000 77,100,000 66%
Total Summary EZ/EMP/TUA Total Per Cent %Completed Projects 32 13 41%LBLJ Visitations 150 63 42%Direct Jobs Created 1,543 842 55%Indirect Jobs Created 610 328 54%Total Jobs Created 2,153 1,170 54%Square Feet Occupied 236,605 73,127 31%New Capital Investment 69,606,000 28,805,000 41%
* Local Business Local Jobs Visitations
Source: The Miami-Dade Beacon Council Quarterly Reports to the Commission (Quarterly and Annually).
FISCAL YEAR ENDED SEPTEMBER 30, 2013
FISCAL YEAR ENDED SEPTEMBER 30, 2012
FISCAL YEAR ENDED SEPTEMBER 30, 2011
FISCAL YEAR ENDED SEPTEMBER 30, 2010


