1
2013-2014
City of San Antonio Office of Sustainability
Sustainable Transportation
San Antonio Bikes
Bicycle Counting Report
2
Table of Contents
Introduction ................................................................................................................................................ 3
Methodology & Data Collection ........................................................................................... 3
Average Annual Daily Bicyclists ......................................................................................... 4
Results and Limitations ................................................................................................................ 5
Analysis ............................................................................................................................................................ 5
Map Area of Studies ........................................................................................................................... 7
Figures ............................................................................................................................................................... 8
— Annual Census Commuting Maps .................................................................. 12
Table of Figures
Figure 1: Average Annual Daily Bicyclists for All Counting Locations ...........8
Figure 2: Off-Street Bicyclists vs. Pedestrians ....................................................................9
Figure 3: Weekday vs. Weekend Bicycle Ridership ................................................... 10
Figure 4: Annual Bicycle and Pedestrian Activity........................................................ 11
Figures 5A-5D: Annual Census Commuting Maps ........................................................ 12
3
Introduction
The City of San Antonio’s Office of Sustainability
initiated the Bicycle Counting program in 2013
based on recommendations within the City’s 2011
Bike Master Plan. Administered by San Antonio
Bikes in coordination with the Transportation and
Capital Improvements (TCI) Department, the
Bicycle Counting program is a critical tool that can
help planners and engineers understand bicycle
ridership throughout the city.
The 2013 Federal Highway Administration’s
(FHWA) Traffic Monitoring Guide1 includes
general guidance on traffic monitoring best
practices for non-motorized traffic, including
bicyclists and pedestrians. The methodology and
technology used to collect data within San
Antonio’s Bicycle Counting program follows the
recommendations within the FHWA’s Traffic
Monitoring Guide.
Methodology & Data Collection
Data collection of bicyclists is conducted with
temporary, mobile pneumatic tube counters as
well as permanent counters that utilize a
combination of inductance loops and infrared
sensors. The pneumatic tubes, which are portable
and capable of counting bicyclists on roadways,
are utilized to collect short duration counts of
bicyclists. Two parallel tubes are secured laying
perpendicular to the direction of roadway traffic
at selected geographic locations. The tubes are
placed to adequately cover the bicyclist’s path and
additionally cover as much of the street as
practical to limit the possibility of bicyclists
maneuvering around the tubes, thereby
undercounting the number of bicyclists. The
pneumatic tube counters are additionally
programmed to be bicycle oriented in terms of
speed and weight, yielding heavier and faster
vehicle types to be disregarded from counts. The
1 http://www.fhwa.dot.gov/policyinformation/tmguide/
pneumatic tube counters are capable of
determining the direction and volume of bicyclists
within 15 minute time increments.
Permanent counters are installed throughout the
city by removing a small portion of the facility’s
surface (each permanent counter thus far has
been installed along a concrete trail surface) and
placing inductive loop sensors within the
concrete, as well as an infrared sensor on the side
of the trail. The inductive loops discern bicycles
from other vehicles, whereas the infrared sensor
is solely able to count pedestrian traffic. The
utilization of permanent counters allows the
addition of continuous bicycle and pedestrian
direction and volume data within 15 minute time
intervals.
Pneumatic tube counting studies conducted in
2013 establish baseline “before” counts on
construction projects slated for future bicycle
facility improvements, including: Theo and
Malone Avenues, Hausman Road, and South
Alamo Street. A number of roadways that recently
received bicycle infrastructure implementation
were additionally counted in 2013, including:
Roadrunner Way, Cincinnati Avenue, and South
Flores Street.
Pneumatic tube counting studies conducted in
2014 were designed to capture variations in
bicycle volumes along the Linear Creek Greenway
Trail System, in particular Leon Creek and Salado
Creek. Although 2014 studies were primarily
designed to establish baseline volumes to better
understand the levels of activity occurring on the
greenway trails, future counting studies can be
programmed to capture changes in volumes along
the greenways over time as the trail system
continues to expand throughout the City of San
Antonio.
In November 2014, two permanent counters were
installed along the greenway trails to enhance
4
data collection for both bicyclists and pedestrians
on the greenway trails. These counters were
installed in addition to four permanent counters
installed along the Museum Reach and the
Mission Reach, which are owned and maintained
by the San Antonio River Authority.
Average Annual Daily Bicyclists (AADB)
Calculating the Average Annual Daily Bicyclists
(AADB) is a normalization methodology which
accounts for bicycle counting studies performed
at different times during the year. Due to the high
variability in bicycling volumes based on several
factors including weather and seasonality, the
AADB is a preferred volume adjustment to
compare volumes of bicycle activity throughout
the city. AADB accounts for seasonality,
precipitation, and other potential variables. For
this counting report, annual data was
extrapolated from the San Antonio River
Authority’s Theo and Malone (located on the
Mission Reach near Theo Avenue) permanent
counter due to its availability of annual data since
its February 2012 installation. Future reports will
be capable of incorporating additional permanent
counting data to improve AADB calculations.
AADB is calculated by applying adjustment factors
for the year the bicycle counts were administered.
First, the appropriate adjustment factors should
be calculated depending on the length of the
counting study (hourly, daily, and/or monthly
factors) 2:
2Nordback, Krista, et al. "Estimating annual average daily bicyclists: Error and accuracy." Transportation Research Record: Journal of the Transportation Research Board 2339 (2013): 90-97.
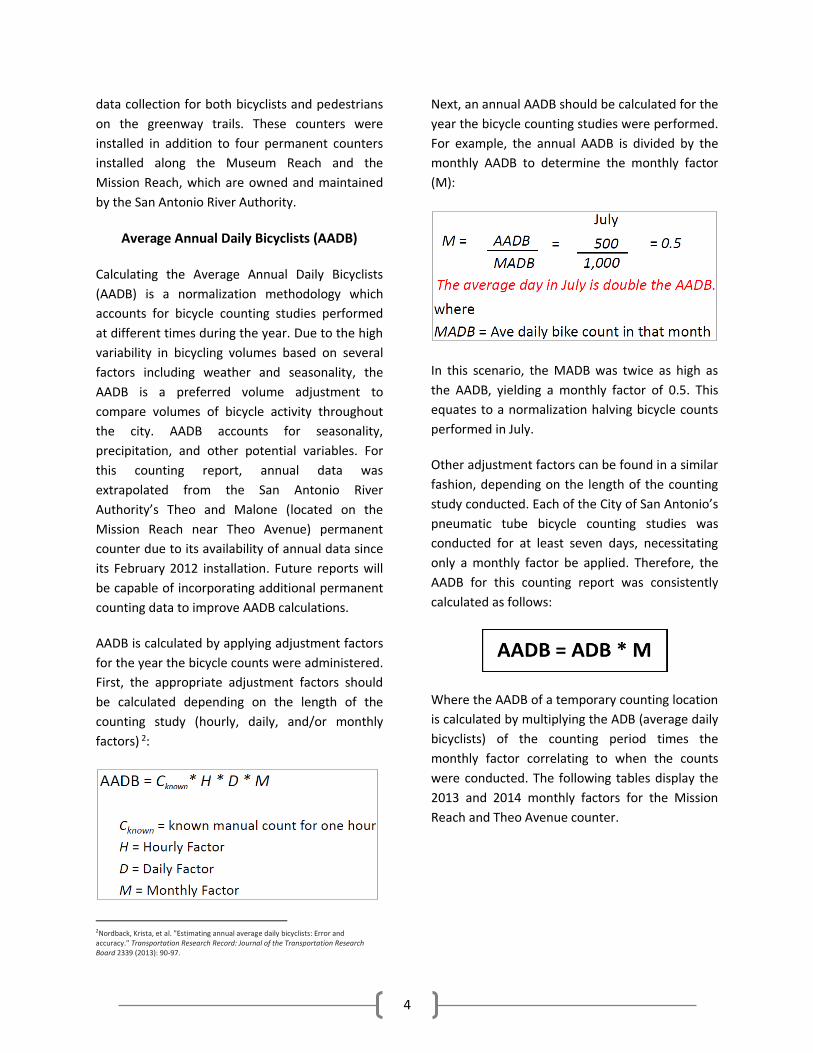
Next, an annual AADB should be calculated for the
year the bicycle counting studies were performed.
For example, the annual AADB is divided by the
monthly AADB to determine the monthly factor
(M):
In this scenario, the MADB was twice as high as
the AADB, yielding a monthly factor of 0.5. This
equates to a normalization halving bicycle counts
performed in July.
Other adjustment factors can be found in a similar
fashion, depending on the length of the counting
study conducted. Each of the City of San Antonio’s
pneumatic tube bicycle counting studies was
conducted for at least seven days, necessitating
only a monthly factor be applied. Therefore, the
AADB for this counting report was consistently
calculated as follows:
Where the AADB of a temporary counting location
is calculated by multiplying the ADB (average daily
bicyclists) of the counting period times the
monthly factor correlating to when the counts
were conducted. The following tables display the
2013 and 2014 monthly factors for the Mission
Reach and Theo Avenue counter.

5
2013 Annual AADB
Monthly AADB
Monthly Factor (M)
January 260 195 1.333333
February 260 251 1.035857
March 260 357 0.728291
April 260 361 0.720222
May 260 350 0.742857
June 260 163 1.595092
July 260 177 1.468927
August 260 284 0.915493
September 260 270 0.962963
October 260 309 0.841424
November 260 247 1.052632
December 260 157 1.656051
Results and Limitations
Prior to the initiation of the Bicycle Counting
program in 2013, the City of San Antonio did not
have available data on bicycle ridership. Without
an existing library of data, portable pneumatic
tube counts provide only a short duration
snapshot of bicycle ridership. Additionally, while
the presence of permanent counters is an
invaluable tool for understanding annual and
monthly variations in ridership, their placement
covers a limited geography that does not
necessarily reflect bicycle activity levels
throughout the entire city. These limitations can
be addressed and improved upon each year by
continuing to conduct counting studies and collect
a larger library of data. The results of the overall
2014 Annual AADB
Monthly AADB
Monthly Factor (M)
January 295 251 1.175299
February 295 289 1.020761
March 295 321 0.919003
April 295 353 0.835694
May 295 390 0.75641
June 295 392 0.752551
July 295 374 0.78877
August 295 211 1.398104
September 295 219 1.347032
October 295 343 0.860058
November 295 235 1.255319
December 295 172 1.715116
counting studies conducted in 2013 and 2014 are
summarized within this report.
Analysis
Several trends were observed during the Bicycle
Counting program and are highlighted in Figures
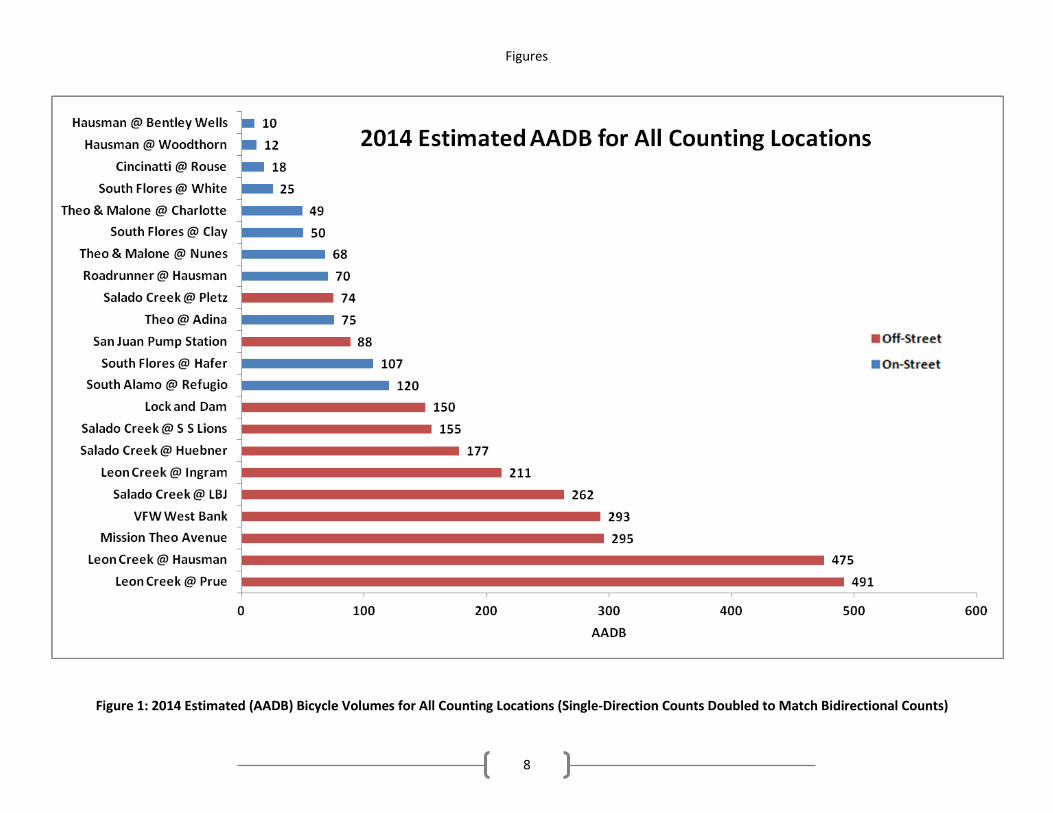
1-5. Figure 1 displays the estimated 2014 AADB
for all counting locations available within the
Bicycle Counting program. When comparing on-
street facilities such as shared routes (shared with
motorized traffic) and bike lanes with off-street
facilities (such as multi-use trails), the majority of
off-street facility estimated AADB exceeded the
AADB estimated for on-street facilities. Exceptions
to this trend were South Alamo Street at Refugio,
6
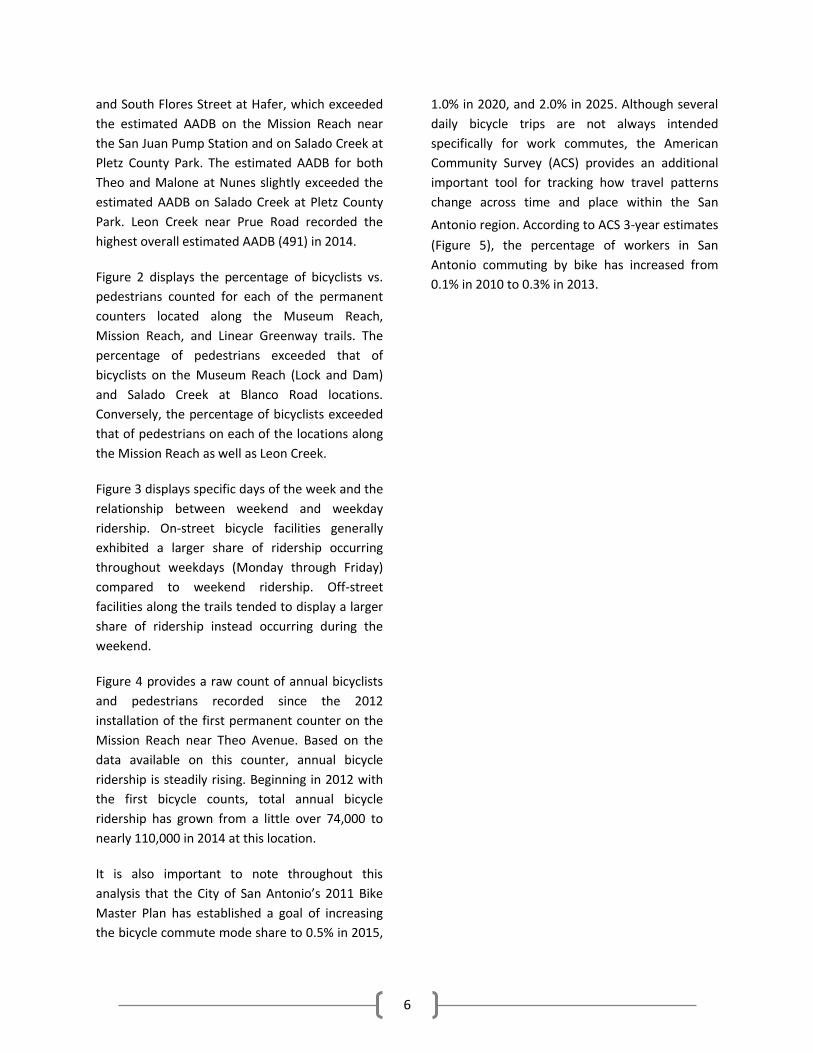
and South Flores Street at Hafer, which exceeded
the estimated AADB on the Mission Reach near
the San Juan Pump Station and on Salado Creek at
Pletz County Park. The estimated AADB for both
Theo and Malone at Nunes slightly exceeded the
estimated AADB on Salado Creek at Pletz County
Park. Leon Creek near Prue Road recorded the
highest overall estimated AADB (491) in 2014.
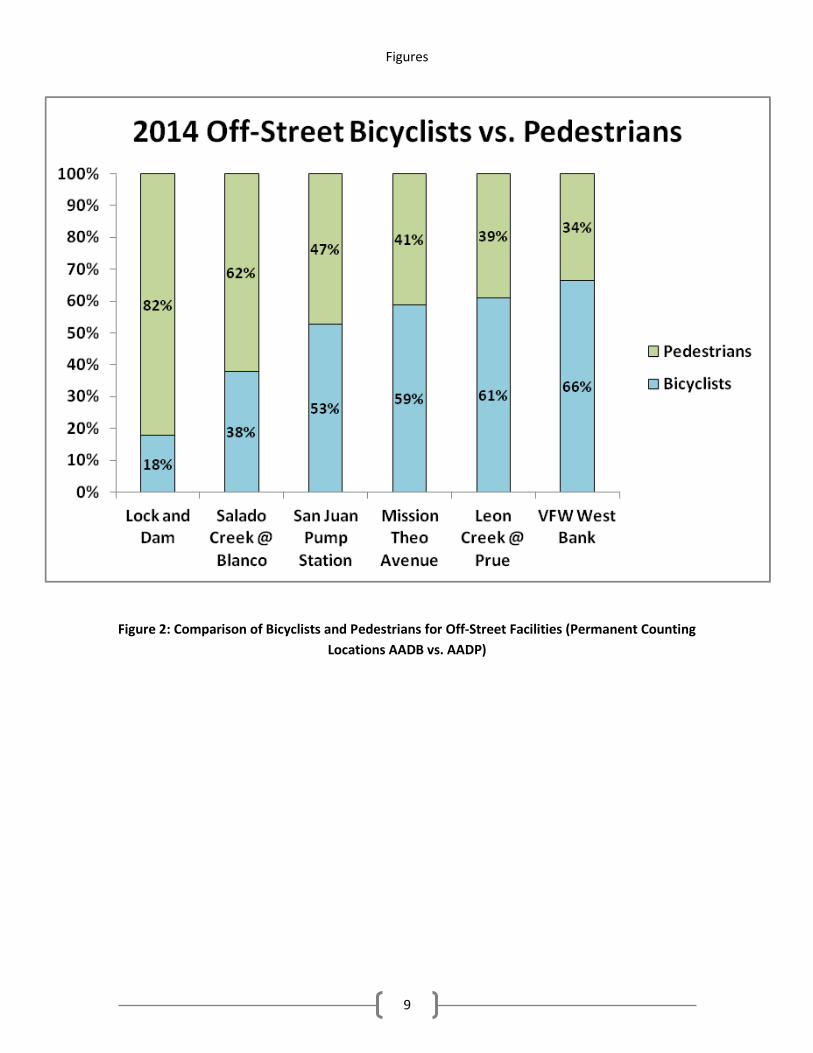
Figure 2 displays the percentage of bicyclists vs.
pedestrians counted for each of the permanent
counters located along the Museum Reach,
Mission Reach, and Linear Greenway trails. The
percentage of pedestrians exceeded that of
bicyclists on the Museum Reach (Lock and Dam)
and Salado Creek at Blanco Road locations.
Conversely, the percentage of bicyclists exceeded
that of pedestrians on each of the locations along
the Mission Reach as well as Leon Creek.
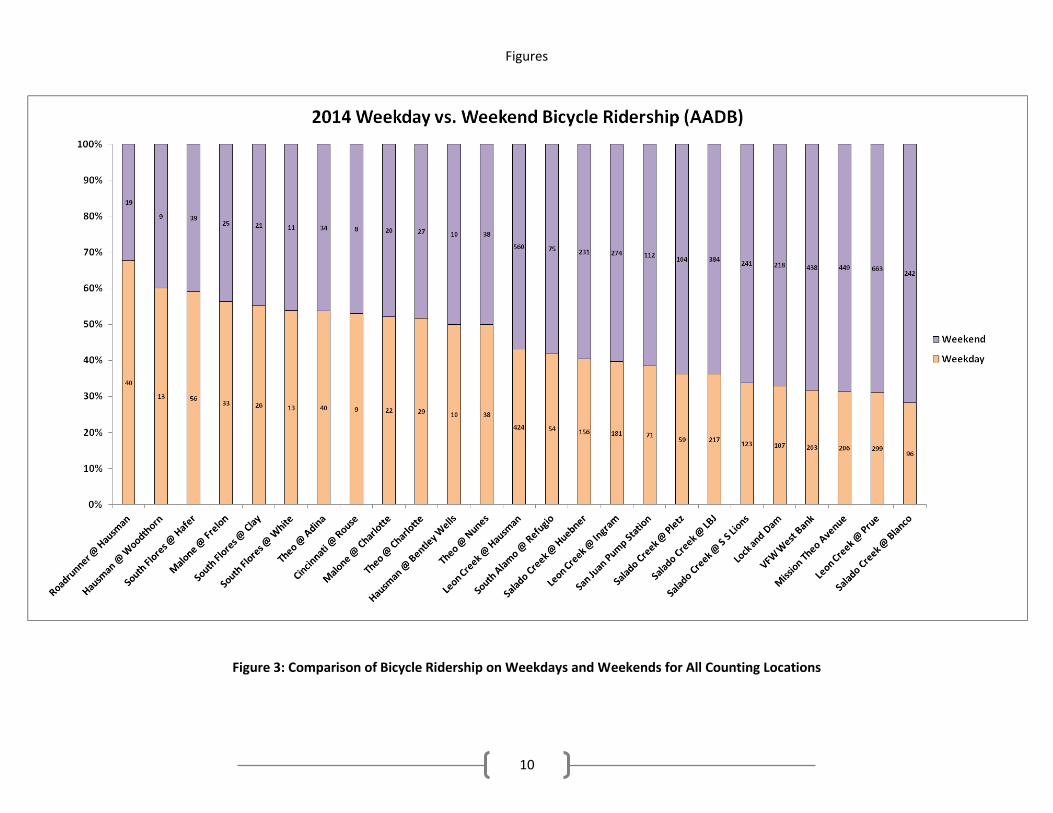
Figure 3 displays specific days of the week and the
relationship between weekend and weekday
ridership. On-street bicycle facilities generally
exhibited a larger share of ridership occurring
throughout weekdays (Monday through Friday)
compared to weekend ridership. Off-street
facilities along the trails tended to display a larger
share of ridership instead occurring during the
weekend.
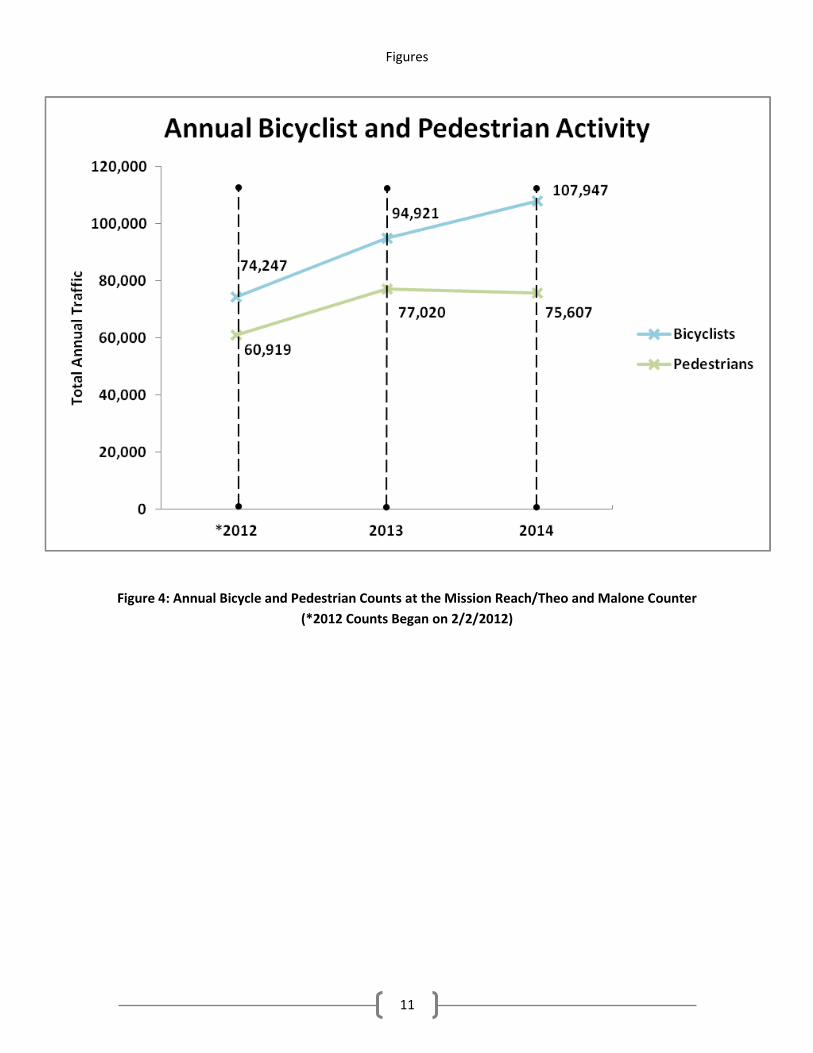
Figure 4 provides a raw count of annual bicyclists
and pedestrians recorded since the 2012
installation of the first permanent counter on the
Mission Reach near Theo Avenue. Based on the
data available on this counter, annual bicycle
ridership is steadily rising. Beginning in 2012 with
the first bicycle counts, total annual bicycle
ridership has grown from a little over 74,000 to
nearly 110,000 in 2014 at this location.
It is also important to note throughout this
analysis that the City of San Antonio’s 2011 Bike
Master Plan has established a goal of increasing
the bicycle commute mode share to 0.5% in 2015,
1.0% in 2020, and 2.0% in 2025. Although several
daily bicycle trips are not always intended
specifically for work commutes, the American
Community Survey (ACS) provides an additional
important tool for tracking how travel patterns
change across time and place within the San
Antonio region. According to ACS 3-year estimates
(Figure 5), the percentage of workers in San
Antonio commuting by bike has increased from
0.1% in 2010 to 0.3% in 2013.
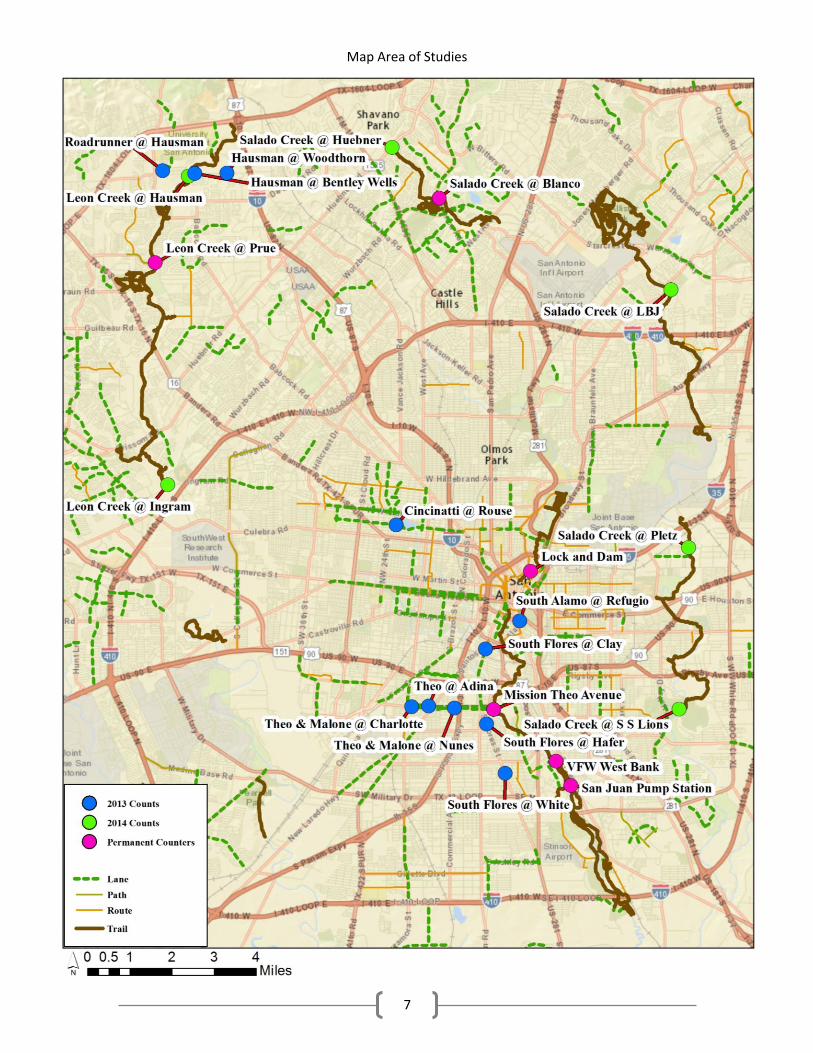
Map Area of Studies
7
Figures
8
Figure 1: 2014 Estimated (AADB) Bicycle Volumes for All Counting Locations (Single-Direction Counts Doubled to Match Bidirectional Counts)
Figures
9
Figure 2: Comparison of Bicyclists and Pedestrians for Off-Street Facilities (Permanent Counting
Locations AADB vs. AADP)
Figures
10
Figure 3: Comparison of Bicycle Ridership on Weekdays and Weekends for All Counting Locations
Figures
11
Figure 4: Annual Bicycle and Pedestrian Counts at the Mission Reach/Theo and Malone Counter
(*2012 Counts Began on 2/2/2012)

Figures Annual Census Commuting Maps
*Data Collected from ACS 3 Year Estimates
12
Figure 5A: 2010 Census Commuting Map
2010 % of Commute Trips by Bike: 0.1%
Figure 5C: 2012 Census Commuting Map
2012 % of Commute Trips by Bike: 0.2%
Figure 5B: 2011 Census Commuting Map
2011 % of Commute Trips by Bike: 0.2%
Figure 5D: 2013 Census Commuting Map
2013 % of Commute Trips by Bike: 0.3%


