Bibliometric survey of Swedish food re-search performed between 2005 and 2017
Anna Ström
Jenny Veide Vilg
Food Science Sweden
for the Swedish Research Council FORMAS
Chalmers University of Technology 2018
Bibliometric survey of Swedish food re-search performed between 2005 and 2017 Anna Ström Jenny Veide Vilg Food Science Sweden for the Swedish Research Council FORMAS
R8:2019 ISBN: 978-91-540-6114-3

2
TABLE OF CONTENTS
INTRODUCTION ................................................................................................................................................ 3
METHODOLOGY ............................................................................................................................................... 4
RESULTS .............................................................................................................................................................. 6
PUBLICATION DATA ............................................................................................................................................ 6 BIBLIOMETRIC INDICATORS AND ANALYSIS ........................................................................................................ 9
Outputs in Top 10 Citation Percentile (%) 2005-2017 ............................................................................... 10 Publications in Top Journal Percentiles (SNIP) 2005-2017 ....................................................................... 11 Collaborations 2005-2017 .......................................................................................................................... 12
SUMMARY AND CONCLUSION ................................................................................................................... 15
REFERENCES ................................................................................................................................................... 16
APPENDIX 1: PROCESS OVERVIEW .......................................................................................................... 17

3
1. INTRODUCTION
The ‘National Research Programme for Food’1 was initiated by the Swedish government
within the framework of the National Food Strategy.2 It is a ten-year research programme co-
ordinated by the Swedish research council FORMAS. The aim of the programme is to sup-
port the knowledge and innovation system so as to contribute to increased productivity and
innovation in the food supply chain and the sustainable production and consumption of food.
With this report we present a bibliometric analysis of the research carried out in the area of
food science and food systems in Sweden between 2005 and 2017. The bibliometric study
was commissioned by FORMAS and the National Committee for Food Science Research.3
FORMAS and the National Committee for Food Science Research were commissioned to de-
fine an agenda for national food science research with a 10-year perspective. The current re-
port provides a part of the information and background to be used to develop this agenda.
Bibliometric studies can be used in conjunction with other measures such as qualitative ex-
pert assessment to measure performance against national research missions.4 However, excel-
lence in locally important research fields may need to be protected, and variations in publica-
tion and citations between fields should be accounted for.
In this study the topic of the bibliometric search, ‘food science or food systems’, covers the
whole chain from primary production of food to consumption of food, including health re-
lated to food intake, breast feeding and vitamins. The publication data, which was collected
from Scopus and analysed using SciVal, has been divided into the following six categories:
• Primary Production
• Processing
• Consumption
• Safety
• Distribution and
• Waste
The categories chosen were requested by FORMAS and are based on the 2030 food systems
categories.5 The search criteria were supplemented to ensure that the FORMAS focus areas,
namely health, digitisation and urbanisation, would be covered in the analysis.
The bibliometric data for each category is presented as total publication output, field-
weighted citation impact (FWCI), outputs in top citation percentiles (10 and 1), publications
in top journal percentiles (SNIP) (10 and 1) and the percentage of international, national and
institutional co-publications. Further, we outline the most common collaborative nations in
each category and show the broadness of scientific subjects represented by the chosen catego-
ries (e.g. consumption, production and processing) as defined in this report.
1http://formas.se/Internationellt/Forskningsprogram/Nationella-forskningsprogrammet-for-livsmedel accessed
28th of January 2019. 2 En livsmedelsstrategi för Sverige – fler jobb och hållbar tillväxt i hela landet. En kortversion av regeringens
proposition 2016/17:104. Artikelnummer N2017.1. Diarienummer: N2017/00647/KOM. Näringsdepartementet. 3 http://formas.se/sv/Internationellt/Forskningsprogram/Nationella-kommitten-for-livsmedelsforskning accessed
28th of January 2019. 4 Hicks et al., The Leiden Manifesto for research metrics, Nature, 2015, 520: 439 5Assessment of Research and Innovation on Food Systems by European Member States, Policy and Funding
Analysis by Standing Committee on Agricultural Research (SCAR) Strategic Working Group on Food Systems,
2018, Publication Office of the European Union in Luxembourg, ISBN 978-92-79-81843-1.

4
To ensure coverage that is as complete as possible, the process of collecting the publication
data has been iterative, involving senior researchers from the different scientific subjects cov-
ered, research funding bodies and individual searches.
2. METHODOLOGY
In-scope: Peer-reviewed publications and reviews published from 2005 through 2017, with at
least one author with a Swedish affiliation.
Out of scope: Editorials, book chapters, patents, reports, comments and conference contribu-
tions. Conference contributions are of especial importance in the area of IT; however, few
conference papers were found in the Scopus searches. The impact of book chapters, editorials
and conference papers on the overall research quality is judged to be low in food science.
Database: The publication data was retrieved from the Scopus database using its analysis tool
SciVal. Scopus is the largest abstract and citation database of peer-reviewed literature: scien-
tific journals, books and conference proceedings. It can be considered equivalent to the Web
of Science (WoS), with the difference that Scopus also includes conference abstracts. The
electronic IDs (EID) of all publications were divided into the above categories in order to cre-
ate publication sets in SciVal for the bibliometric analyses.
Categories and subcategories: The chosen categories were requested by FORMAS, as stated
in the introduction. For consistency in categorising, subcategories (in bold, after the dash) were
employed. The subcategories are further defined below the category headlines.
1. Production – livestock, crops, inputs, fisheries, aquaculture
Studies covering animal, fish production and cultivation. Factors affecting production, such
as fodder, manure, veterinary medicine. Effects of production on climate and environment,
discharges from production, quality as an effect of the production process (such as choice of
cultivar and fodder). Life-cycle assessment (LCA) studies on production.
2. Processing – food, feed, packing, transformation of ingredients
The step after production included articles on processing of primary products and transfor-
mation of ingredients, as well as analyses and functionality when not in the context of direct
health, nutrition or dietetics, or for comparison of the effect of primary production. Packag-
ing, storing, labelling. LCA studies on processed products.
3. Distribution – hotel-catering-restaurant, transport-storage-logistics, retail, market-
ing, advertising
Also food security, availability, school meals.
4. Consumption – research on nutrition and health, consumer research
The effect of food (including single vitamins and minerals) on the human body. Also in vitro
and animal studies as well as analyses of known active substances in a health/nutrition con-
text. Dietary effects. Probiotics. Sensory. Health claims. Preferences, consumption patterns
and branding.
5. Food safety – production, processing, distribution, consumption
Chemical and biological risks/agents, allergens, toxicology.
6. Food waste – production, processing, distribution, consumption
Limit: not downstream processing of food waste, with poor connection to the production of
waste itself.

5
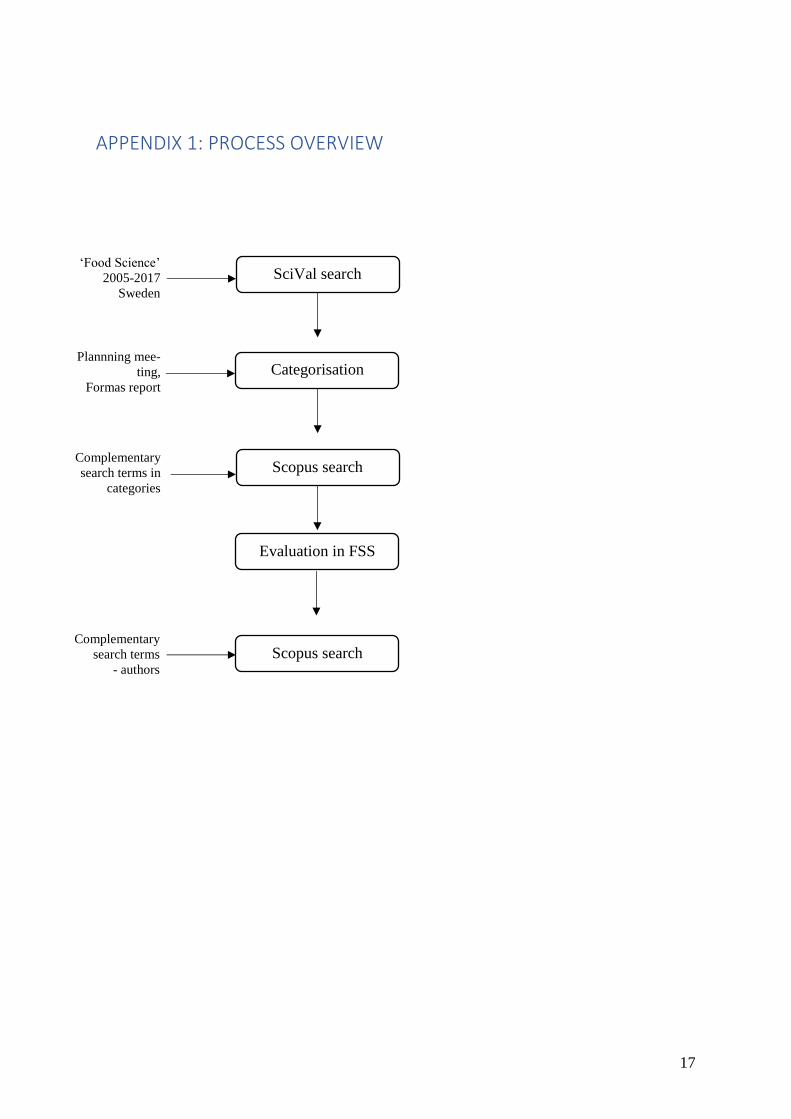
Procedure: The publications used in the analysis were selected from database searches in
three different steps (subject search within SciVal; subcategory terms; and collection of
names of active senior scientists). After each search step, all articles were manually catego-
rised based on their titles and, when applicable, their abstracts. An initial search was made in
SciVal, using their benchmarking tool to select articles within the predefined subject area
‘Food Science’. The resulting articles were categorised as indicated above. The initial search
was complemented with a second search on the subcategory terms, as shown in Table 1. Du-
plicate articles were removed after each iteration. The results were then evaluated in a review
within the Food Science Sweden network (FSS). Reviewers noted that the first two searches
provided adequate coverage regarding the number of authors, but incomplete publication
lists. That is, active researchers were largely covered by the subject search, but the list of
their publications was incomplete. The search was therefore supplemented with Scopus
searches on individual active senior researchers in all six categories (see Appendix 1 for a
scheme). These researchers were identified from the subject search, the FSS network, the
identification of relevant researchers via the homepages of Swedish research organisations
and by grant holders of Swedish Research Councils (Vetenskapsrådet and FORMAS) grants
as well as Handelsrådet (see Appendix 2). Each article or review identified in the three
searches was manually assigned to one of the six categories. Duplicates and publications that
were not within the area of food science were removed and not included in the subsequent
analysis. The publication data produced was used for the bibliometric analysis. The output
parameters chosen were total publications, citation rate (FWCI), outputs in top citation per-
centiles (10 % & 1 %), publications in top ten journal percentiles (SNIP) and collaborations.
To account for discipline-related differences, FWCI was used for citation rate in the present
study.
A minimum of 50 publications per year is considered necessary for analysis of bibliometric
data in terms of FWCI, outputs in top citation percentiles and SNIP. Categories with fewer
publications were therefore not described in these terms.
FWCI indicates how the number of citations received by a researcher’s publications com-
pares with the average number of citations received by all other similar publications, thereby
moderating differences in research behaviour across disciplines. Similar publications are all
publications in the Scopus database that are published in the same year, are of the same type
and belong to the same discipline. Citations received during the year of publication plus the
following 3 years are included in this metric.
A FWCI of 1.0 indicates that the number of citations matches the world average for similar
publications. The FWCI of the ‘world’ (i.e. the entire Scopus database) is 1.00. A FWCI <
1.00 indicates that a publication has been cited less that would be expected based on the
world average for similar publications, and a FWCI of > 1.00 indicates that a publication
have been cited more than would be expected based on the world average for similar publica-
tions.6 Moving averages of three-year periods were compared, rather than individual years, in
order to moderate transient peaks and valleys. Self-citations were excluded where possible.
6 Elsevier (2014) SciVal Metrics Guidebook Version 1.01, February 2014
6
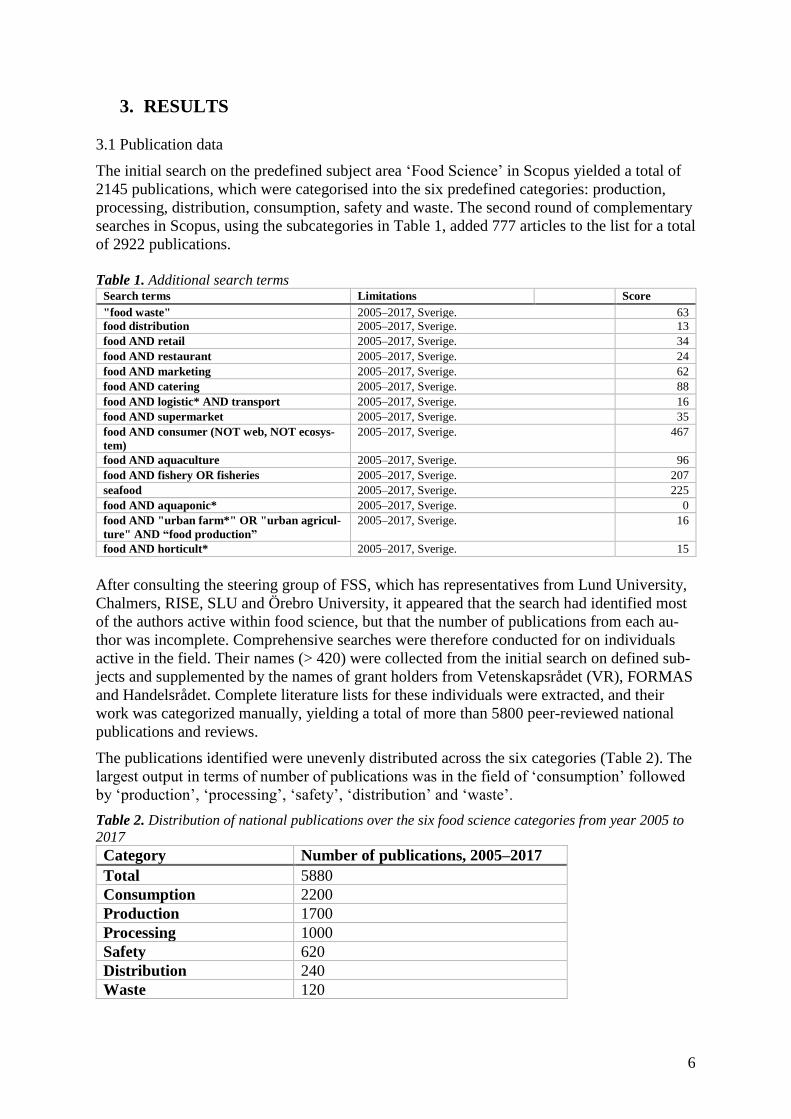
3. RESULTS
3.1 Publication data
The initial search on the predefined subject area ‘Food Science’ in Scopus yielded a total of
2145 publications, which were categorised into the six predefined categories: production,
processing, distribution, consumption, safety and waste. The second round of complementary
searches in Scopus, using the subcategories in Table 1, added 777 articles to the list for a total
of 2922 publications.
Table 1. Additional search terms
Search terms Limitations
Score
"food waste" 2005–2017, Sverige. 63
food distribution 2005–2017, Sverige. 13
food AND retail 2005–2017, Sverige. 34
food AND restaurant 2005–2017, Sverige. 24
food AND marketing 2005–2017, Sverige. 62
food AND catering 2005–2017, Sverige. 88
food AND logistic* AND transport 2005–2017, Sverige. 16
food AND supermarket 2005–2017, Sverige. 35
food AND consumer (NOT web, NOT ecosys-
tem)
2005–2017, Sverige. 467
food AND aquaculture 2005–2017, Sverige. 96
food AND fishery OR fisheries 2005–2017, Sverige. 207
seafood 2005–2017, Sverige. 225
food AND aquaponic* 2005–2017, Sverige. 0
food AND "urban farm*" OR "urban agricul-
ture" AND “food production”
2005–2017, Sverige. 16
food AND horticult* 2005–2017, Sverige. 15
After consulting the steering group of FSS, which has representatives from Lund University,
Chalmers, RISE, SLU and Örebro University, it appeared that the search had identified most
of the authors active within food science, but that the number of publications from each au-
thor was incomplete. Comprehensive searches were therefore conducted for on individuals
active in the field. Their names (> 420) were collected from the initial search on defined sub-
jects and supplemented by the names of grant holders from Vetenskapsrådet (VR), FORMAS
and Handelsrådet. Complete literature lists for these individuals were extracted, and their
work was categorized manually, yielding a total of more than 5800 peer-reviewed national
publications and reviews.
The publications identified were unevenly distributed across the six categories (Table 2). The
largest output in terms of number of publications was in the field of ‘consumption’ followed
by ‘production’, ‘processing’, ‘safety’, ‘distribution’ and ‘waste’.
Table 2. Distribution of national publications over the six food science categories from year 2005 to
2017
Category Number of publications, 2005–2017
Total 5880
Consumption 2200
Production 1700
Processing 1000
Safety 620
Distribution 240
Waste 120

7
Figure 1 shows the variation in total publication output and publication in each category over
the period studied. Increasing publication output was observed for ‘consumption’, ‘waste’
and ‘distribution’, while the output from ‘safety’ and ‘processing’ was steady over time. The
field of ‘production’ strongly increased in 2010 and 2013. It should be noted that the catego-
ries of ‘distribution’ and ‘waste’ had too few publications (< 50 / year) to be further analysed
for parameters such as FWCI and SNIP.
Figure 1. Total publication (peer-reviewed papers and reviews) output in (a)the field of food systems
and (b) per category: consumption (black), production (grey), processing (white), safety (red), distri-
bution (blue) and waste (green)
The total number of peer-reviewed publications and reviews published by national scientists
active in the area of food science can be compared to the more than 30,000 publications put
out by Wageningen University and Research (WUR) during the same period. WUR is the
leading agricultural university according to the National Taiwan (NT) ranking, and number
156 in the general ranking of universities. The NT ranking is based on scientific paper perfor-
mance, research productivity, research impact and excellence. After including education and
industry income, as done by Times Higher Education (THE), WUR is ranked 59.7 By the
same measures, the total publication output from Sweden in the field of food science is 5880,
which is considerably lower than the output from WUR in the Netherlands.
Researchers active in food science were affiliated with a broad range of organizations, as
shown in Figure 2.
7 https://www.wur.nl/en/Education-Programmes/Rankings.htm accessed on the 8th of November, 2018.
2006 2008 2010 2012 2014 20160
100
200
300
400
500
600
700
Tota
l nu
mb
er
of
pu
blic
atio
ns
Year
a)
2006 2008 2010 2012 2014 20160
50
100
150
200
250
300
Nu
mbe
r o
f p
ub
lica
tio
ns p
er
cate
go
ry
Year
b)

8
Figure 2. Proportion of researchers publishing within Food Science across national research organi-
sations.
A broad range of scientific subjects is represented within the search, as illustrated in Figure 3.
It should be noted, that while the subject area of agricultural and biological sciences is pre-
sent in all categories, other subject areas are more category specific. For example, the cate-
gory ‘consumption’ is dominated by medicine and nursing, followed by agricultural and bio-
logical sciences, indicating that health-related subjects are prominent in this category. The
category ‘production’ is dominated by the agricultural and biological sciences and biochemis-
try, genetics and molecular biology, followed by environmental sciences. Like ‘production’,
the category ‘processing’ is dominated by agricultural and biological sciences and biochemis-
try. The next largest category is chemistry, followed by genetics and molecular biology, and
then engineering, indicating the processing aspects within this category. The field of agricul-
tural and biological sciences is also important as regards ‘safety’, but medicine comes in as
the second largest subject and environmental sciences as the third. The category ‘distribution’
is the most diverse in terms of subject areas included. Business, management and accounting,
as well as social sciences, are relatively important subject areas in both ‘distribution’ and
‘waste’. Environmental sciences and energy are the two largest subject areas within the cate-
gory ‘waste’.
27%
17%
8%7%
6%
5%
5%
5%
5%
3%3%
1%8%
Swedish University of Agricultural Sciences Lund University
Uppsala University Gothenburg University
Umeå University RISE
Chalmers Karolinska institutet
Stockholm University Linköping University
KTH Royal Institute of Technology Örebro University
Others

9
Figure 3. Overview of subject areas within the categories of consumption, production, processing,
safety, distribution and waste
3.2 Bibliometric indicators and analysis
FWCI values of 1.5 or higher are generally considered well above average8 and indicate that
the publication outputs have been cited 50 % more than expected. On the contrary, a FWCI <
1.00 indicates that the publications have been cited less than would be expected based on the
world average for similar publications, for example, a score of 0.85 means 15 % less cited
than world average.
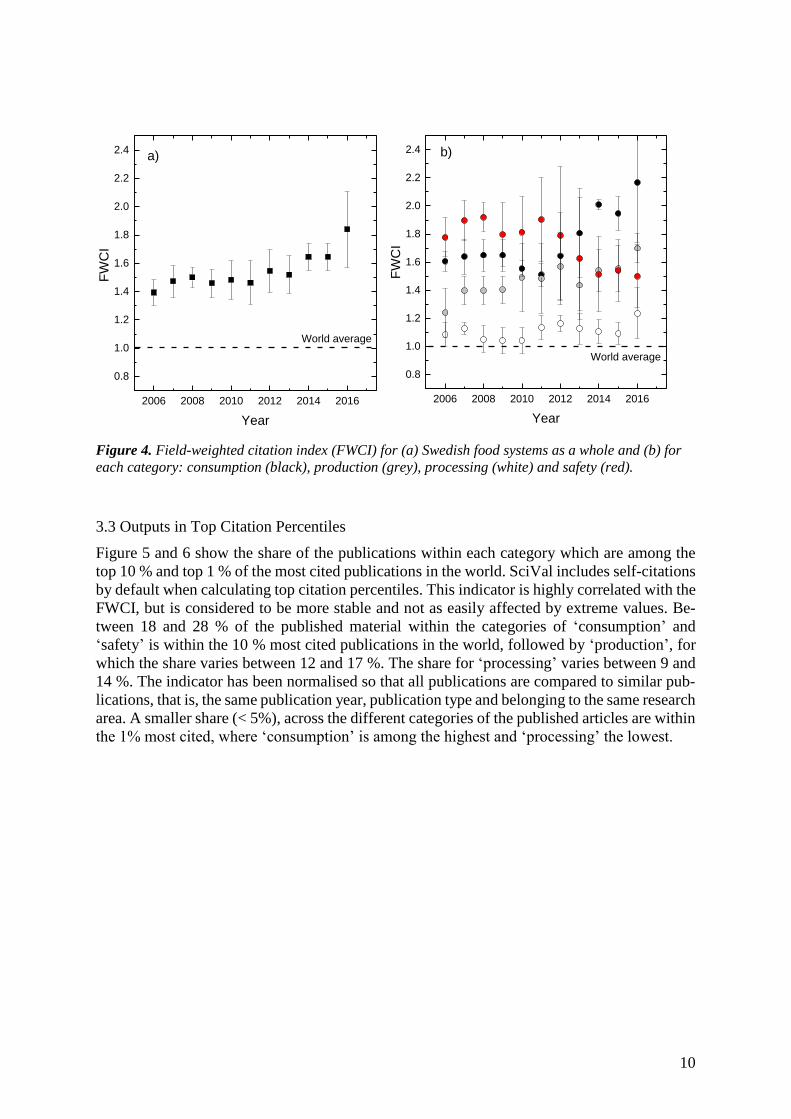
The total publications related to national food science or food systems have FWCI values
above the world average of 1 (Figure 4a). The FWCI across the different categories (Figure
4b), show that ‘consumption’, ‘production’ and ‘safety’ are cited well above (i.e., 1.5) the
world average of 1. The value of FWCI increases in the category of ‘consumption’ and ‘pro-
duction’, whereas the FWCI of ‘safety’, which was the most cited during the period of 2005–
2012, reduced after 2012. The values of FWCI for food science carried out in Sweden as a
whole (Figure 4a) compare well with those of WUR over the same time periods. For exam-
ple, the FWCI of WUR is 1.4, 1.5 and 1.94 for 2006, 2011 and 2016 respectively. It should
however be noticed that the comparison might look different if publications from the Nether-
lands as a whole were included instead of WUR as single university.
8 Elsevier (2014) SciVal Metrics Guidebook Version 1.01, February 2014
10
Figure 4. Field-weighted citation index (FWCI) for (a) Swedish food systems as a whole and (b) for
each category: consumption (black), production (grey), processing (white) and safety (red).
3.3 Outputs in Top Citation Percentiles
Figure 5 and 6 show the share of the publications within each category which are among the
top 10 % and top 1 % of the most cited publications in the world. SciVal includes self-citations
by default when calculating top citation percentiles. This indicator is highly correlated with the
FWCI, but is considered to be more stable and not as easily affected by extreme values. Be-
tween 18 and 28 % of the published material within the categories of ‘consumption’ and
‘safety’ is within the 10 % most cited publications in the world, followed by ‘production’, for
which the share varies between 12 and 17 %. The share for ‘processing’ varies between 9 and
14 %. The indicator has been normalised so that all publications are compared to similar pub-
lications, that is, the same publication year, publication type and belonging to the same research
area. A smaller share (< 5%), across the different categories of the published articles are within
the 1% most cited, where ‘consumption’ is among the highest and ‘processing’ the lowest.
2006 2008 2010 2012 2014 2016
0.8
1.0
1.2
1.4
1.6
1.8
2.0
2.2
2.4
FW
CI
Year
a)
World average
2006 2008 2010 2012 2014 2016
0.8
1.0
1.2
1.4
1.6
1.8
2.0
2.2
2.4
FW
CI
Year
World average
b)

11
Figure 5. Percent publications in top citation percentile (a) 10 and (b) 1, for each category; con-
sumption (black), production (grey), processing (white) and safety (red).
3.4 Publications in Top Journal Percentiles (SNIP)
The share of the publications that is published in the top journal percentile are shown in Fig-
ure 6, using the source-normalised impact per paper (SNIP indicator). The SNIP indicator
shows the ratio of articles that were published in the most cited journals in the world (Scopus
database). SNIP measures the number of citations in a journal, as compared to the normal
number of citations for eight journals within the same research area.
Figure 6. Publications in top journal percentiles (SNIP) (a) 10 and (b) 1 for each category; consump-
tion (black), production (grey), processing (white) and safety (red).
2006 2008 2010 2012 2014 2016
0
2
4
6
8
10
Pu
blic
atio
ns in
top
citatio
n p
erc
en
tile
(%
) Year
b)
2006 2008 2010 2012 2014 20160
5
10
15
20
25
30
35
40
45
50
Pu
blic
atio
ns in
top
citatio
n p
erc
en
tile
(%
)
Year
a)
2006 2008 2010 2012 2014 20160
10
20
30
40
50
Public
ation in top journ
al perc
entile
10 /%
Year
a)
2006 2008 2010 2012 2014 2016
0
2
4
6
8
10
Public
ations in top journ
al perc
entile
/%
Year
b)
12
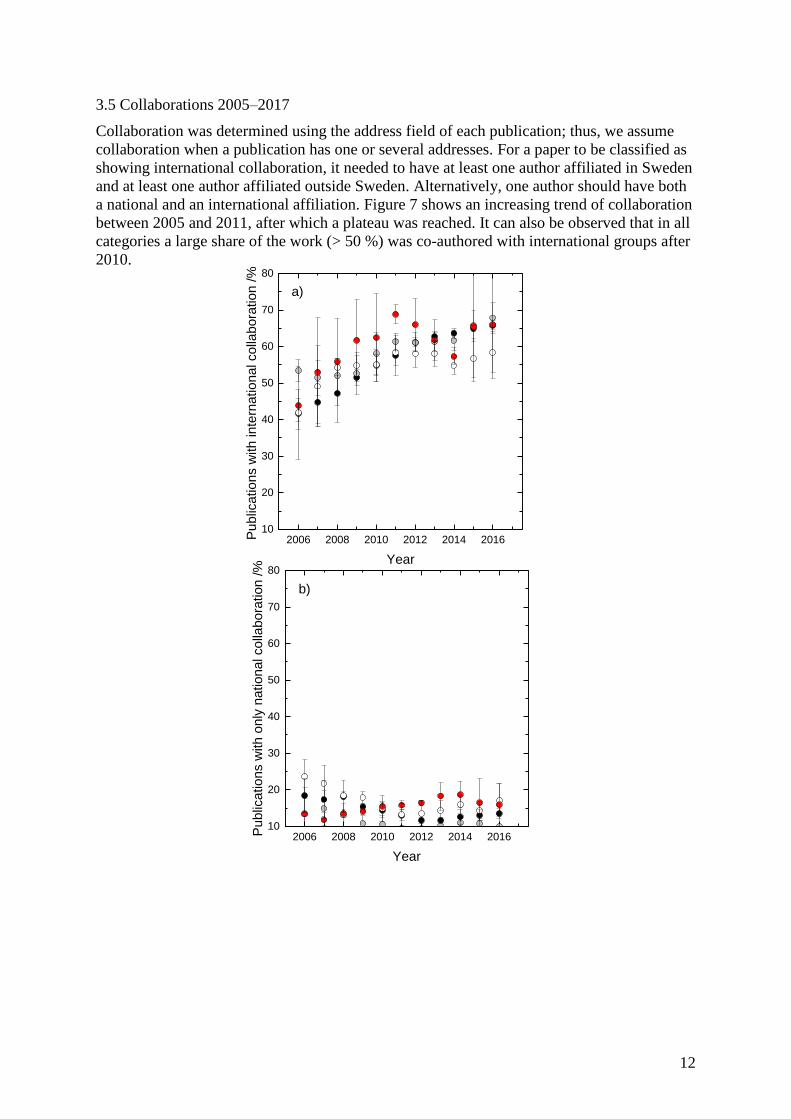
3.5 Collaborations 2005–2017
Collaboration was determined using the address field of each publication; thus, we assume
collaboration when a publication has one or several addresses. For a paper to be classified as
showing international collaboration, it needed to have at least one author affiliated in Sweden
and at least one author affiliated outside Sweden. Alternatively, one author should have both
a national and an international affiliation. Figure 7 shows an increasing trend of collaboration
between 2005 and 2011, after which a plateau was reached. It can also be observed that in all
categories a large share of the work (> 50 %) was co-authored with international groups after
2010.
2006 2008 2010 2012 2014 201610
20
30
40
50
60
70
80
Pu
blic
atio
ns w
ith
in
tern
atio
na
l colla
bora
tio
n /
%
Year
a)
2006 2008 2010 2012 2014 201610
20
30
40
50
60
70
80
Pu
blic
atio
ns w
ith
on
ly n
ation
al co
llabo
ration
/%
Year
b)
13
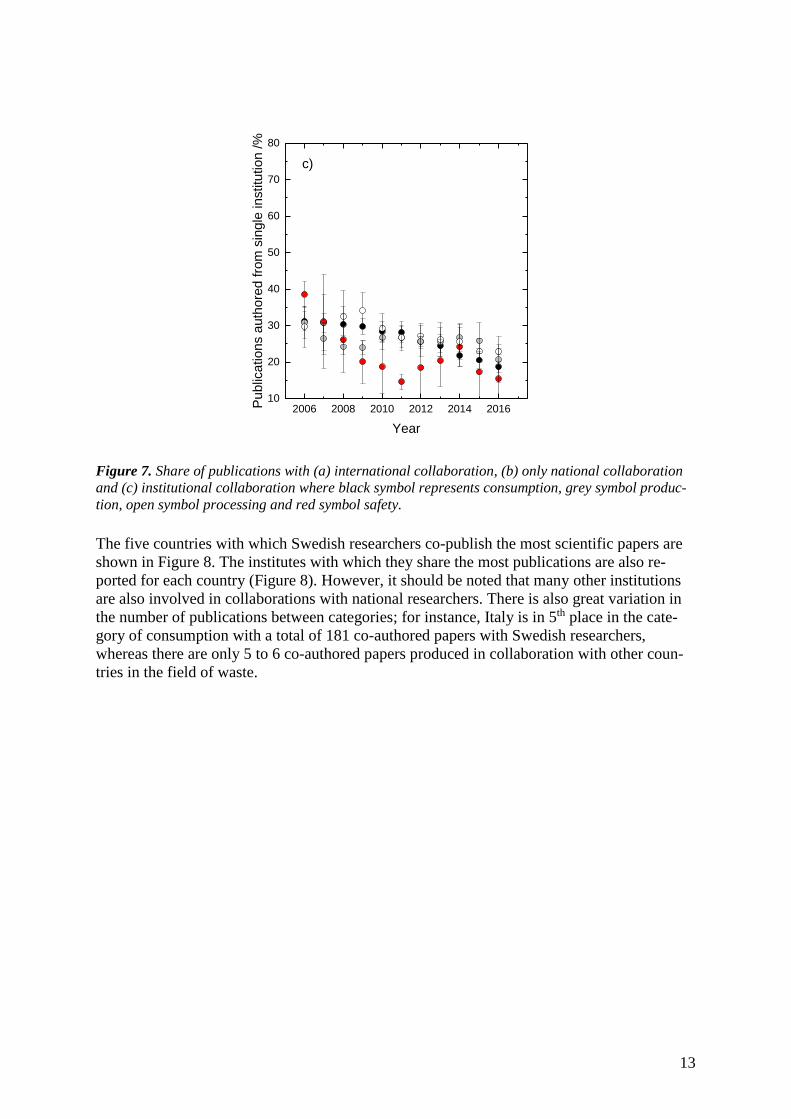
Figure 7. Share of publications with (a) international collaboration, (b) only national collaboration
and (c) institutional collaboration where black symbol represents consumption, grey symbol produc-
tion, open symbol processing and red symbol safety.
The five countries with which Swedish researchers co-publish the most scientific papers are
shown in Figure 8. The institutes with which they share the most publications are also re-
ported for each country (Figure 8). However, it should be noted that many other institutions
are also involved in collaborations with national researchers. There is also great variation in
the number of publications between categories; for instance, Italy is in 5th place in the cate-
gory of consumption with a total of 181 co-authored papers with Swedish researchers,
whereas there are only 5 to 6 co-authored papers produced in collaboration with other coun-
tries in the field of waste.
2006 2008 2010 2012 2014 201610
20
30
40
50
60
70
80
Pu
blic
atio
ns a
uth
ore
d fro
m s
ing
le in
stitu
tio
n /
%
Year
c)

14
Figure 8. The five countries with which Swedish researchers co-author the most publications within
each category. The institution in each country with which we co-author the most publications is also
shown.
National collaborations are publications written by authors with only national affiliations. A
paper written with two Swedish affiliated organisations, for example, Chalmers University of
Technology and SLU, will be counted as a national collaboration. However, if the publication
has a third author who is affiliated with Denmark, for example, the publication will be as-
signed to the international category. Further, if the publication is written by persons affiliated
with only one university, for example, Chalmers University of Technology, the publication is
counted as an institutional publication and is not included in the national collaborations.
The number of co-authored publications with only national affiliations is reducing between
2005 and 2011 (Figure 7), except for the category of ‘safety’, where it increased.
The share of publications co-authored within single research organisations, for example,
SLU, is decreasing over time for ‘production’ and ‘consumption’ (Figure 7). There is an indi-
cation that the share of publications co-authored within institutions is also decreasing with
time for ‘processing’ and ‘safety’. However, the trend is less clear compared to ‘consump-
tion’ and ‘production’.
Co-authored publications involving academic and corporate organisations are shown in Table
3, which shows the total number of publications as well as share of total publication volume.
The companies acting as co-authors are Nestlé, Danone, Thermo-Fischer, NovoNordisk,
TetraPak, Arla Foods, Lantmännen and Syngenta. While it could be interesting to evaluate

15
the numbers over time, we strongly advise against taking the share of co-authored publica-
tions as a measure of the actual extent of academic-corporate collaboration. There are many
reasons for a specific corporation not being included as an author in a publication despite
funding the study. For example, funding alone is usually not enough to be counted as an au-
thor, companies may not want to publically show interest in a specific field, or intellectual
property rights may be a consideration. It should also be noted that the percentage of publica-
tions from WUR reflecting industry cooperation is 5 %, which is similar to the value for Swe-
dish national food related-categories.
Table 3. Percent of total publications and absolute number of publications co-authored by academia
and industry within the different categories.
Category /% Number of publications
Consumption 4 45
Production 1 9
Processing 9 30
Safety 2 5
Distribution 2 2
Waste 0 0
SUMMARY AND CONCLUSION
The publication base used for the report was generated in two steps. First, a general search of
food-related subjects (for exact keywords, see the methods section) was done within SciVal
and Scopus. As this search did not generate a complete publication list (only 50 % of the final
total amount of publications was generated this way), a second step, a bibliometric search on
individuals, was performed. Individual searches related to senior scientists doubled the num-
ber of publications. The total output of peer-reviewed publications and reviews over the 10-
year period was close to 6000 publications. This suggests that meaningful bibliometric analy-
sis in the area of food science and in-depth review of individual research outputs requires
more powerful algorithms than were used in this study.
As demonstrated by the large number of organizations in which researchers are active, the
terms “food system” or “food science”, as defined in this report, are very broad and spans
widely different scientific subjects.
The largest publication output was found in the subcategory of ‘consumption’ followed by
‘production’, ‘processing’ and ‘safety’. The number of publications generated in ‘waste’ and
‘distribution’ was relatively low but was increasing with time.
The FWCI indicates that the national citation rate of publications on food systems or food
science is well above the world average of 1. Dividing the national FWCI for food systems
into the categories studied shows that the FWCI for ‘consumption’, ‘safety’ and ‘production’
are well above the world average (>1.5) from 2011 and onwards.

16
The share of publications with international co-authors increased until the year 2011, after
which a plateau was reached with more than 50 % of publications being produced with inter-
national collaboration.
It is notable that the number of publications in some of the six categories is growing while
others are stagnating both in terms of total scientific output and FWCI. Further analysis is
needed to explain the variations between categories, and also to investigate the reasons for
the difference in total publication output in comparison to groups like WUR. Available fund-
ing, overall national strategies, organizational aspects and number of active researchers are
all measures known to influence scientific output.
ACKNOWLEDGEMENT
We are grateful for support and professional advice on bibliometric analysis from Stina Jo-
hansson (Chalmers), Peter Lundin (VR) and Henrik Almberg (VR) as well as the input from
research councils and active researchers (Appendix 2).
17
APPENDIX 1: PROCESS OVERVIEW
SciVal search
‘Food Science’
2005-2017
Sweden
Scopus search
Complementary
search terms in
categories
Complementary
search terms
- authors
Categorisation
Plannning mee-
ting,
Formas report
Evaluation in FSS
Scopus search
18
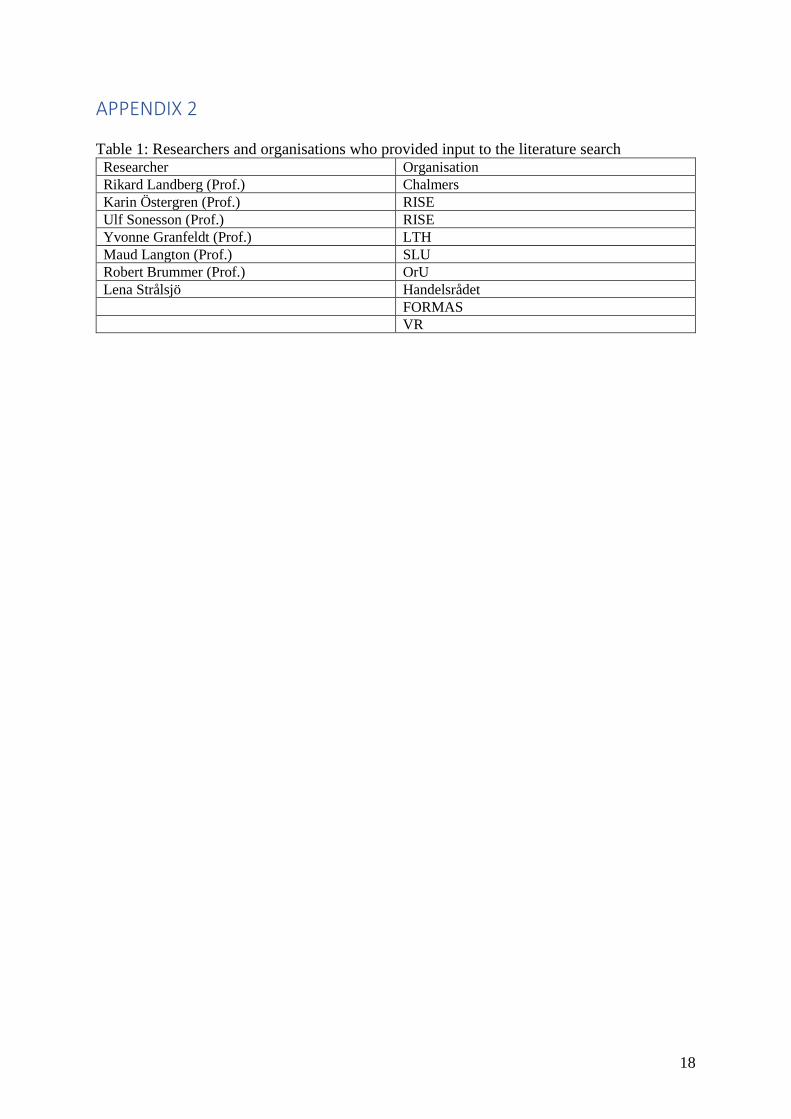
APPENDIX 2
Table 1: Researchers and organisations who provided input to the literature search Researcher Organisation
Rikard Landberg (Prof.) Chalmers
Karin Östergren (Prof.) RISE
Ulf Sonesson (Prof.) RISE
Yvonne Granfeldt (Prof.) LTH
Maud Langton (Prof.) SLU
Robert Brummer (Prof.) OrU
Lena Strålsjö Handelsrådet
FORMAS
VR


