
1
Benchmarking of Utilities for Performance
Improvement
Dennis D. Mwanza,Water and Sanitation Program8th December 2006
2
CONTEXT
Most public utilities not operating efficiently in Africa
• High Unaccounted for Water (NRW)• Low Cost recovery• Low Tarrif levels• High staff per 1000 connections• Availability of supply

2
3
Context cont’d
Problem of capacity to deliver…….Decades of public investmentPoor sector and institutional arrangement choicesMany public sector management issues– Problems of financial viability– Accountability– Autonomy– Lack of regulatory framework– Institutional organisation of water
service delivery
4
Performance Indicators and Benchmarking
“Benchmarking is the search for industry best practices that lead to superior performance.”
- Robert C. CampIt is understood as the process foridentification, understanding andadaptation of remarkable practices andprocesses of other organizations to helpthe improvement of its own performance
BENCHMARKING has been used as a toolby the water sector industry over the lasttwenty years

3
5
CONCEPTS OF BM FOR Utility
Better service qualityHigher resources productivityHigher satisfaction by ConsumersHigher general return for thecompanyEnvironment improvementBasically higher operationalefficiency
6
• Humility to accept that there may be otherCompanies with a better performance butunder similar socio-economic environment
• Wisdom to learn the changes that may arisefrom comparison
• Ambition to introduce the necessary actions• Effectiveness to accomplish the programmed
goals
The BENCHMARKING ProcessRequires:

4
7
Benchmarking initiatives
Global and other REgions:IWAIBNETSouth Asia Utility data bookBenchmarking of utilities in Brazil
RegionalWater Utility Partnership –Performance Indicators and Benchmarking Project
8
IWA Benchmarking initiative
The objectives of the initiative was to: develop generally accepted procedures and methodologies able to provide decision makers with an overall perception of the utility performance as a sound basis for making strategic choices. Clear definition of a reference framework for Performance Indicators and Benchmarking methodologies, as well as adequate models of aggregation that fit the basic needs of the key types of user.
5
9
IWA’s motivation
Demand from IWA members for guidelines on Performance Indicators
– the definition of a common reference for PI that fits the basic common needs of the key types of users in the Water Industry
Main target users: the utilities themselves.
10
Output
A standardised PI language, covering:
syntax (structure)morphology/semantics (vocabulary and definitions)
etymology (from data to PI)
6
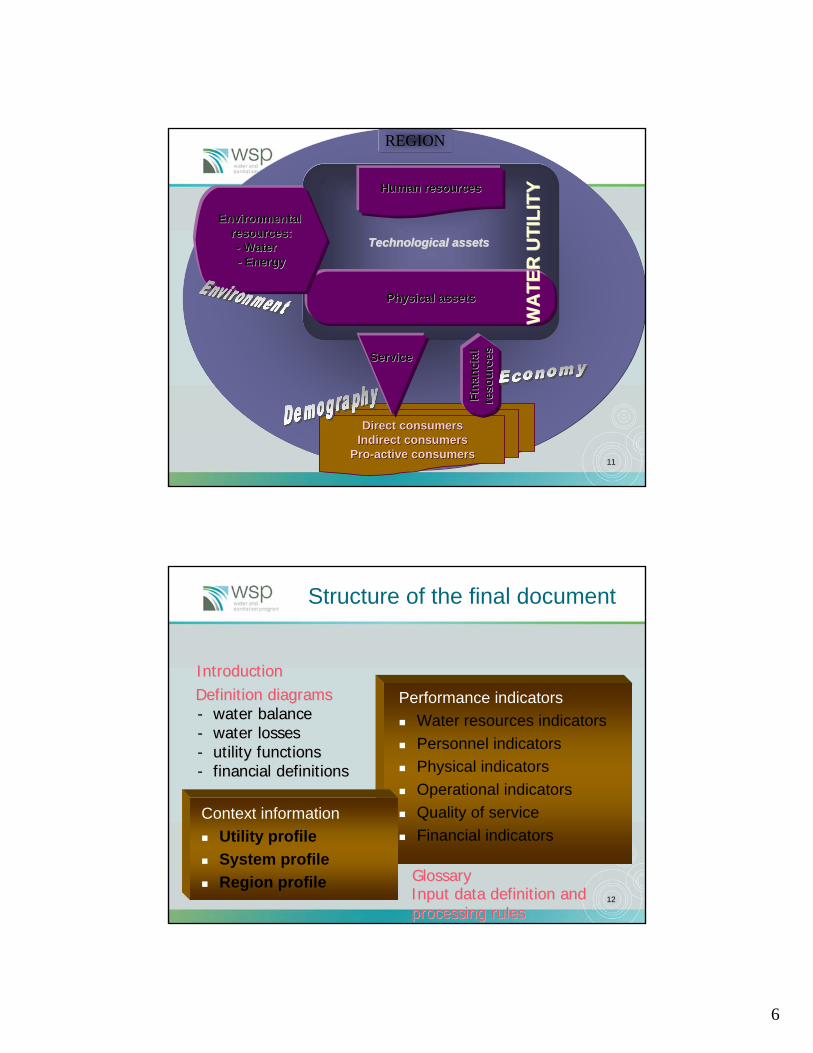
11
REGION
Direct consumersDirect consumersIndirect consumersIndirect consumers
ProPro--active consumersactive consumersFi
nanc
ial
Fina
ncia
lre
sour
ces
reso
urce
sService Service
Technological assetsTechnological assets
Human resourcesHuman resources
Physical assetsPhysical assets
WA
TER
UTI
LITY
WA
TER
UTI
LITY
Environmental Environmental resources:resources:-- Water Water -- EnergyEnergy
12
Structure of the final document
Context informationUtility profileSystem profileRegion profile
Performance indicatorsWater resources indicatorsPersonnel indicators Physical indicatorsOperational indicatorsQuality of serviceFinancial indicators
Input data definition and Input data definition and processing rules processing rules
Definition diagramsDefinition diagrams-- water balancewater balance-- water losseswater losses-- utility functionsutility functions-- financial definitionsfinancial definitions
IntroductionIntroduction
GlossaryGlossary

7
13
AGLOMMERATIONAGLOMMERATION
Definition of water balance terms
catchcatch--mentment
treattreat--mentment
transtrans--missionmission storagestorage distridistri--
butionbution
transmistransmis..water useswater uses& losses& losses
storagestoragewater useswater uses& losses& losses
distributiondistributionwater useswater usesand lossesand losses
treatmenttreatmentoperational operational
usesuses
AbstractedAbstractedmeteredmetered
waterwater
Produced Produced metered watermetered water
DistrictDistrictmeteringmetering
meteringmeteringapparentapparentlosseslosses
Imported Imported treated watertreated water
Exported Exported waterwater
Imported Imported raw waterraw water
Supplied Supplied waterwater
Distribution Distribution inputinputTransmissionTransmission
inputinput
M watermeter
MMMM
M
M
M M M
M
M M M
MMM
M M M
14
Total Total authorised authorised
consumptionconsumption[m[m3 3 /year]/year]
Total water Total water losseslosses
[m[m33 / year] / year]
Billed waterBilled water
[m[m3 3 /year]/year]
NonNon--revenue revenue water water
(unaccounted(unaccounted--for water)for water)
[m[m3 3 / year]/ year]
Billed authorised Billed authorised consumptionconsumption
[m[m33 / year]/ year]
Unbilled Unbilled authorised authorised
consumptionconsumption[m[m33 / year]/ year]
Billed metered consumptionBilled metered consumption(including exported water)(including exported water)
Billed Billed unmeteredunmetered consumptionconsumption
Unauthorised useUnauthorised use
Metering inaccuraciesMetering inaccuracies
Apparent lossesApparent losses[m[m33 / year]/ year]
Real lossesReal losses[m[m33 / year]/ year]
Unbilled metered consumptionUnbilled metered consumption
Unbilled Unbilled unmeteredunmetered consumptionconsumption
Leakage on service connections Leakage on service connections upstream the delivery pointupstream the delivery point
Leakage and overflows of Leakage and overflows of storage tanksstorage tanks
Leakage on transmission and Leakage on transmission and distribution systemdistribution system
Leakage on raw water mains & Leakage on raw water mains & treatment real lossestreatment real losses
TOTAL WATER IN
PUT

8
15
Water resources indicators
Personnel indicators
Physical indicators
Operational indicators
Quality of service indicators
Financial indicators
Number of PI proposed
HighHighLevelLevel
IntermedIntermed..LevelLevel
LowerLowerLevelLevel
11 101044 1515
00 8855 1313
88 16161313 3737
88 331919 3030
77 16161515 3838
2626 53535656 135135
22 0000 22
16
High level PI
Water resources indicators (2 PI)Efficiency of water resources use (%)Resources availability ratio (%)
Personnel indicators (1 PI)Employees per connection (No./1000
connections)Physical indicators (0 PI)
9
17
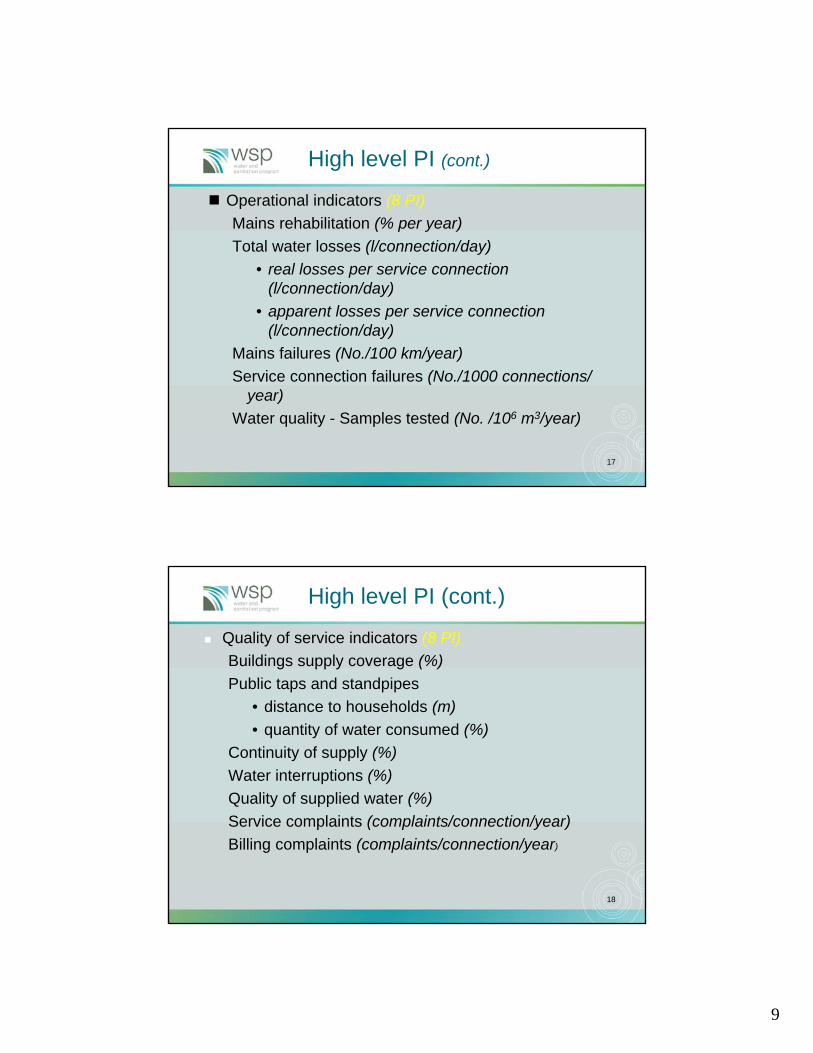
High level PI (cont.)
Operational indicators (8 PI)Mains rehabilitation (% per year)Total water losses (l/connection/day)
• real losses per service connection (l/connection/day)
• apparent losses per service connection (l/connection/day)
Mains failures (No./100 km/year)Service connection failures (No./1000 connections/
year)Water quality - Samples tested (No. /106 m3/year)
18
High level PI (cont.)
Quality of service indicators (8 PI)Buildings supply coverage (%)Public taps and standpipes
• distance to households (m)• quantity of water consumed (%)
Continuity of supply (%)Water interruptions (%)Quality of supplied water (%)Service complaints (complaints/connection/year)Billing complaints (complaints/connection/year)
10
19
High level PI (cont.)
Financial indicators (7 PI)Average water charges for direct consumption
(US$/m3)Average water charges for exported water (US$/m3)Total cost coverage ratio (-)Operating cost ratio (-)Contribution of internal sources to investment (%)Current ratio (-)Non-revenue water (%)
The output was in word files.Demonstration given below

11
21
WR_Efficiency_of_water_resourcesA_Authorised_ConsumptionA_Water_AbstractedA_Imported_raw_waterA_Imported_treated_waterA_Authorised_Consumption
22
A_Billed_Authorised_Consumption

12
23
International Benchmarking Network (IBNET)
24
WUP –SERVICE PROVIDER BENCHMARKING NETWORK (SPBNET)
Improvement of data collection and analysis of utilities in AfricaProvide a management tool for self evaluation for the operators, benchmarking for utilities with similar operating environments, Promoting experience sharing between the utilities and documenting and sharing information on emerging best practices and lessons on water supply and sanitation

13
25
Project organisation and implementation
Project funded by DfID, implemented by WUP with assistance from WRc as Benchmarking advisorsProject Manager (Consultant) assisted by 7 Regional Consultants –interface with utilitiesRegional Consultants workshopConsultation workshops for Development of questionnaire, clear understanding of all the questions e.t.c.
26
Regional arrangements

14
27
Development of questionnaire
Questionnaire defines the data available and forms the basis upon which utilities can benchmark one with anotherBalance what is desirable with what is achievable in terms of data and information soughtAlso balance between broadening the questionnaire to include a wider range of issues and maintaining an elemental simplicityMake use of existing performance indictors and definitions where this is possible rather than “re-inventing the wheel”Considered the works done by WUP, AsDB, IWA, World Bank (IBNET-Kit), UNHABITAT-WAC, SAAWU
28
Data analysis
Received questionnaire responses from 110 utilities but 112 questionnaires. 108 provided for water and 12 SanitationOut of the 112 Questionnaires received, 32 Full questionnaire and 80 water only
122001
672000
301999
31998
QuestionnairesYear

15
29
Performance Indicators
Utility Profile –functions undertaken, ownership, institutional arrangements e.t.c.Demand management –Service coverage, consumption, availability of waterOperations –losses, quality, costs, staffingRevenue –tariffs, cost recovery, assetsBalance sheet –liquidity ratios
30
Dissemination of results
Hard copy reportCD containing the report and analysis of resultsInformation is also be posted on the internet (http://www.wupafrica.org/spbnet/angl/index.html)
Confidential 2 page reports4 dissemination workshops held

16
31
Functions of the utilities
0 20 40 60 80 100 120
Undertake on-site sanitation services?
Undertake sewage treatment?
Undertake sewerage?
Undertake water distribution?
Undertake water treatment?
Undertake bulk supply?
Undertake water abstraction?
No. of utilities
32
Ownership and management of utilities
0 20 40 60 80 100 120
Autonomous?
Managed asgovernment/municipal?
Private ownership?
Public ownership?
No. of utilities
Almost all utilities are publicly owned, most automous and about half are managed as part of Government or municipal services
17
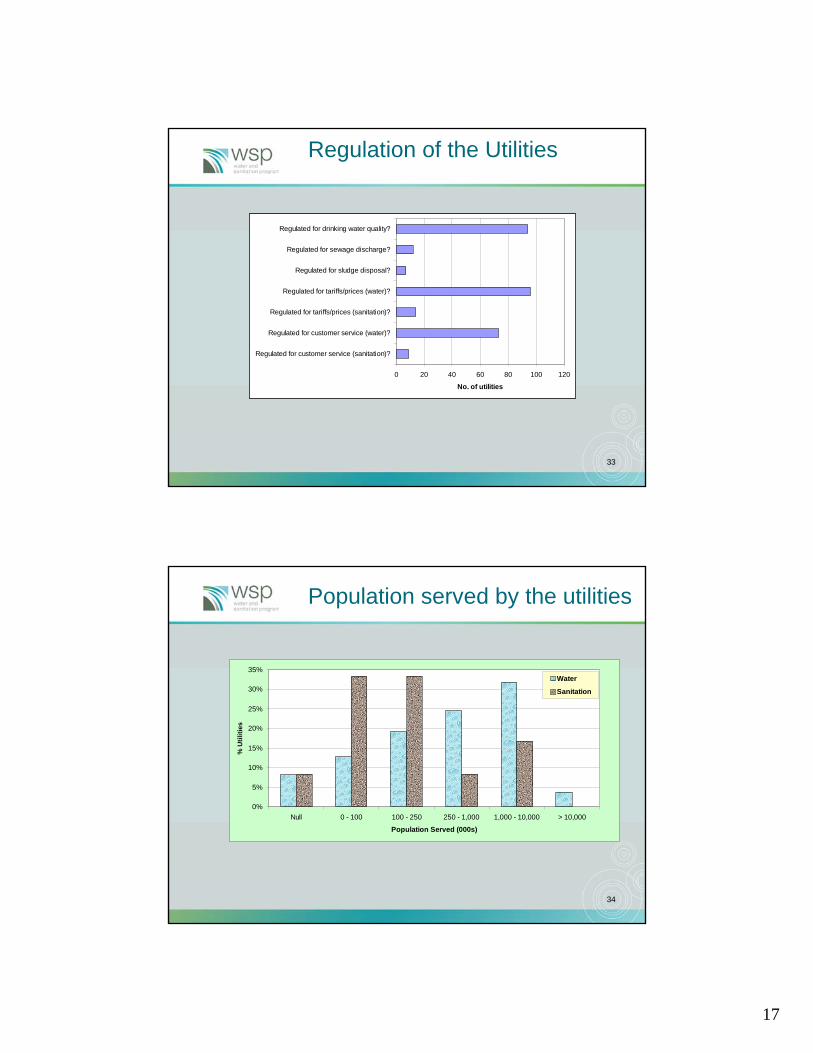
33
Regulation of the Utilities
0 20 40 60 80 100 120
Regulated for customer service (sanitation)?
Regulated for customer service (water)?
Regulated for tariffs/prices (sanitation)?
Regulated for tariffs/prices (water)?
Regulated for sludge disposal?
Regulated for sewage discharge?
Regulated for drinking water quality?
No. of utilities
34
Population served by the utilities
0%
5%
10%
15%
20%
25%
30%
35%
Null 0 - 100 100 - 250 250 - 1,000 1,000 - 10,000 > 10,000
Population Served (000s)
% U
tiliti
es
Water
Sanitation

18
35
Number of staff employed
0%
10%
20%
30%
40%
50%
60%
Null 0 - 100 100 - 500 500 - 1,000 1,000 - 5,000 > 5,000
Number of Staff
% U
tiliti
esWater
Sanitation
36
Problem of capacity to deliver…
General (UFW) for sample utilities in East Africa
Unaccounted for water
010203040506070
1 3 5 7 9 11 13 15 17
Utility Identification
UFW
(%)

19
37
Low cost recovery……..
Cost recovery of some utilities
0.0010.0020.0030.0040.0050.0060.0070.0080.0090.00
100.00
1 4 7 10 13 16 19 22 25 28 31
Utility Identification
% c
ost r
ecov
ery
38
LABOUR ISSUES
Many public utilities overstaffed more than 7 per 1000 connection.
Staff per 1000 connections
0102030405060
1 5 9 13 17 21 25
Utility identification
Staf
f per
100
0 co
nnec
tions

20
39
Sustainability of the project Funding
How much value does SPBNET add to utilities capabilities? –How do we motivate utilities?Funding is Key IssueBudget for undertaking this exercise and by who?
Possible optionsExternal –request Donors and othersSubscriptions from national organisations or utilities to WUPWUP partially commercializesIdentify key utilities that would help WUP steer the project
40
Ownership
How can we create a Sense of ownership and belonging to be built in (Donor, WOP or utilities)Issue of Effective Demand comes into considerationShould participation be obligatory (no supporting legislation)

21
41
Publication of data
Publicity of data (web site, publication e.t.c) How do we ensure enthusiasm of participationPublic accountability could create difficulties to utilities leading to loss of enthusiasmCurrent participant’s views on publicity issues should be sought.Is it acceptable for outputs to be made availableon the Internet?Can we compare operations between utilities of similar nature I.e. size, ownership structure e.t.c.
42
Frequency of provision of information
AnnualOptional submission of data that is availableAnnual submission of certain data that may be requested

22
43
Capacity building
What kind of capacity building elements should be there (training, competition on performance e.t.c)Exchange of informationSuch exchanges are more likely to be Sub-REGIONAL.The practicalities of best practice exchange will have to be reviewedHold regional workshops but on annual basis?
44
ORGANISATION
Should we have a central processing centre hosted by the Secretariat of WOPInvolvement of Regional Consultants/utilities in regions willing to coordinate collection of data Encourage national organisations to establish their own exercise (Govt Dept, Regulator, use of World Bank start up kit)Links with other PI initiatives should be explored for organizational support (i.e. South African initiative, Tanzania)Encourage national water sector initiatives and be affiliated to SPBNET.Africa (i.e Nigeria).

23
45
THANK YOU


