
ORIGINAL ARTICLE
Bearing-based selection in mobile spatial interaction
Steven Strachan Æ Roderick Murray-Smith
Received: 17 September 2007 / Accepted: 29 February 2008
� Springer-Verlag London Limited 2008
Abstract We introduce a mobile spatial interactive
application that uses a combination of a GPS, inertial
sensing, gestural interaction, probabilistic models and
Monte Carlo sampling, with vibration and audio feedback.
This system allows the probing or querying of targets in a
local area, based on a model of the local environment and
specific context variables of interest, to enable a rich,
embodied and location–aware spatial interaction. An
experiment was conducted to investigate how spatial target
selection at different distances, target separations and tar-
get widths is affected by a system with added ‘typical’
noise characteristics. Results showed that the successful
selection of targets in the virtual environment is maximised
with a combination of high angular separation and angular
width.
Keywords GPS Navigation � Uncertainty �Monte Carlo �Feedback � Audio � Tracking � Probabilistic display �Context � Selection
1 Introduction
Mobile spatial interaction is an emerging field prompted by
the growth of increasingly powerful and multi-functional
mobile devices. The provision of context or location-aware
information while ‘on the move’ has become increasingly
relevant in recent years. This information has traditionally
been delivered in a static, visual way via tools such as
Yahoo! Local or Google Maps. The ability to interact with
this data in a rich and natural manner is now possible and
with the incorporation of inertial sensing into mass market
devices a wealth of opportunity has emerged for the
development of applications with a dynamic, intuitive,
natural, flowing and embodied style of interaction. Meth-
ods of interaction with the mobile internet are currently
limited to traditional screen and button-based techniques.
These techniques are visually demanding, time consuming,
not contextually sensitive and can become hazardous
in situations where the user is required to focus their
attention on more safety critical tasks. Instead, techniques
that take more advantage of the users other senses (such as
the audio or touch senses) are considered more appropriate
for systems to be used whilst ‘on the move’ [1–4]. And
with the introduction of gesture-based systems to the
commercial market, such as the Nintendo Wii or the
Samsung SCH-S310 mobile phone, making gesture-based
techniques more socially acceptable, these techniques are
becoming increasingly relevant in this domain [5, 6].
Cheverst et al. [7] introduced the notion of information
push versus information pull for location-aware systems. A
‘pull’ system is one where the emphasis is on the user to
decide when context-aware information is presented to
them. They can then pull this information to their device. A
‘push’ system, on the other hand, is based on information
being presented automatically to the user, which is trig-
gered by contextual events. The system we describe here
takes the form of a highly interactive ‘push-pull’ system
with elements of both but with slightly more emphasis on
the ‘pull’ aspect. Our system both empowers and provides
a sense of control to the user as they probe the geo-coded
information in their immediate environment and actively
S. Strachan (&)
Hamilton Institute, NUI Maynooth, Maynooth, Ireland
e-mail: [email protected]
R. Murray-Smith
Department of Computing Science, University of Glasgow,
Glasgow, UK
e-mail: [email protected]
123
Pers Ubiquit Comput
DOI 10.1007/s00779-008-0205-4

pull information from their surroundings, rather than
relying on the system to push the information to them. This
system differs from other context-aware applications in
that we can directly interact in an ‘eyes-free’ manner with
the hybrid physical/virtual environment and any informa-
tion that may be placed there, eliminating the user’s
dependence on visual feedback from the device screen.
We first quantify the main sources of error and uncer-
tainty that can be detrimental to this kind of system,
focussing primarily on the effects of bearing and positional
error. We introduce a framework which deals with this
uncertainty and provide the first steps in quantifying the
effects of bearing based uncertainty on a pointing task
given varying target sizes and separations.
2 Related work
The representation and sensing of context is an important
but challenging area of research for location-aware mobile
applications. Some of the earliest work on mobile context-
aware computing includes that of Abowd et al. [8] who
describe the construction of a context-aware tour guide.
Similarly Feiner et al. [9] describe a self-contained back-
pack-based system that includes magnetometers and
accelerometers for head orientation tracking and a differ-
ential GPS for location information. Cheverst et al. [10]
also describe an intelligent electronic tourist guide,
GUIDE, which was built to overcome many of the limi-
tations of the traditional information and navigation tools
available to city visitors. Their system combines mobile
computing technology with a positioning system to present
city visitors with information tailored to both their personal
and environmental contexts. Although these ‘‘backpack’’
based outdoor systems have been successful proof-of-
concept prototypes, they lack the convenience of a fully
hand-held system.
Although GPS is the most often used positioning system
for location-aware applications, there exist a number of
systems which use other forms of positioning technology
such as Wi-Fi or GPRS cell based positioning. Drozd et al.
[11] describe a game for mobile phones, Hitchers, that
makes use of cellular positioning. Players create digital
hitch hikers, giving them names, destinations and questions
to ask other players, and then drop them into their current
phone cell. Players then search their current cell for hit-
chers, pick them up, answer their questions, carry them to
new locations and drop them again. One example of a
system that combines the use of GPS, Wi-Fi and GSM cell
positioning to provide a position estimate is Navizon [12],
detailed in [13]. This system uses GPS to build a database
of WiFi and GSM sources through war driving and a
position is provided to a user who queries this database
with information about which Wi-Fi points and cell towers
with which they are currently in contact. Such hybrid
approaches lead to variable accuracy as, for example, we
move from one form of positioning to another and such
systems can benefit from interfaces designed with this in
mind. Kontkanen et al. [14] describe probabilistic approa-
ches to locationing in wireless radio networks and
demonstrate the utility of a probabilistic modelling
framework in solving location estimation problems. An
example use of this kind of approach is given in [15],
which shows that it is possible to derive complex behav-
ioral patterns and device location from collected Bluetooth
data.
The development of smaller and more powerful devices
has led to the emergence of an increasing number of
applications on hand-held devices for truly mobile context
and location aware computing. Some completely handheld
applications make use of the screen and cameras available
on these devices. Baillie et al. [16] describe a context-
aware application in a fully contained handheld system
which combines GPS and attitude information in order to
visualise a virtual image of a building in the present or past
on screen by simply pointing their device at that building.
There are also a number of systems using mobile devices,
that aim to attach digital information to locations in the
real-world. E-grafitti [17] is a context-aware application,
which senses a user’s location and displays notes depen-
dent on that location. They conduct a field study with 57
participants, finding the idea of location-specific notes was
something that appealed to users. Espinoza et al. [18]
describe a similar system, GeoNotes, arguing that location-
based systems must allow users to participate as content
providers in order to achieve a social and dynamic infor-
mation space. Their system attempts to blur the boundary
between physical and digital space while at the same time
striving to socially enhance digital space by letting users
leave virtual messages, which are linked to specific geo-
graphical positions.
The exposure of locally relevant information has
become an active area of research. Rantanen et al. [19]
describe their novel radar style interface for accessing
messages placed in the real world to create an interface that
‘‘strives to create an isomorphic representation of the vir-
tual content relative to the directly observable physical
world’’. As a consequence they remove the need for a map
of the locality and provide the user with an intuitive
graphical representation of information in that area, unlike
the systems described before which use a list-based inter-
face and present a much lower positional resolution. An
initial field trial encouragingly indicates that location-based
aspects have a role to play in facilitating mobile commu-
nication. Simon and Frohlich [20] describe a system that
displays locally relevant wikipedia articles using a GPS
Pers Ubiquit Comput
123

equipped PDA and Jones et al. [21, 22] have introduced a
handheld system designed to expose to users what other
people have searched for in a particular location with the
aim of providing useful insights into the ‘character’ of that
location or context. Interaction with this information is a
new area of research. Frohlich and Simon describe their
GeoPointing [23] system that allows a user to point at an
object and discover information about that object. They
describe a study conducted with ‘real world’ conditions
highlighting the problems associated with GPS uncertainty
in differing contexts. Faisal [24] describes early work on
algorithms for pointing error correction. He develops an
efficient error compensation model to reduce the discrep-
ancy between the line-of-sight of the eye and the pointer
direction.
There are significant social and safety advantages to a
non-visual, eyes-free display in a mobile context where
visual attention is likely to be directed towards tasks not
involving the device display. As such, the utility of the
navigation system is greatly enhanced by the accurate
presentation of the feedback in the audio and haptic
modalities. This is also important in a social sense since it
allows people to concentrate more on social interactions
rather than focussing their attention on a small screen.
There are context-aware augmented reality systems which
focus completely on the audio sense, leaving a user’s visual
attention free. Bederson [25] describes a prototype auto-
mated tour guide which superimposes audio on the world
based on a user’s location. Users in a museum may hear
information about exhibits in their local vicinity using a
hand held device and sensors located in the ceiling of the
museum. Another example is the GuideShoes [26] appli-
cation, a shoe-based GPS navigation system, which
consists of a pair of shoes, equipped with a GPS and CPU.
They describe the use of emons, short musical ‘‘emotional
cues‘‘, to guide a user to their desired location. Similarly
Stahl [27] describes a system designed to guide customers
round a zoo using spatial audio. The audio is sourced in the
direction of the enclosure of a particular kind of animal
where the sound of that animal can be heard. He finds that a
‘lightweight’ navigational aid can be sufficient for way-
finding tasks in certain environments. Increasingly music is
being used as a mechanism for guiding users with context-
aware applications. Work on music-based guidance
includes the gpsTunes [28, 29] system where initial testing
of a prototypical system had shown that it was possible for
users to navigate in the real world using a combined audio/
GPS player to aid navigation along specified trajectories.
Similar systems include Melodious Walkabout [30] and
OnTrack [31]. Other work which utilises music as a tool for
influencing a user in this mobile domain was conducted by
Oliver et al. [32] who constructed a system that takes
advantage of the influence of music in exercise
performance, enabling users to more easily achieve their
exercise goals. It works by selecting music depending on a
user’s jogging speed and on their current heart rate. Like-
wise, Elliott et al. [33] describes a context aware music
player, which makes real time choices of music based on
user pace.
3 Uncertainty
The issue of uncertainty is an important one for mobile,
instrumented, continuously sensing systems. The kind of
system we present here is susceptible to a range of
uncertainties from a number of sources. These sources can
be broken into two main categories. ‘Human sources’ and
‘sensor sources’. Sensor sources can include the fact that
we are required to sense things indirectly, such as the
heading of the device from magnetometers or the tilt of the
device from accelerometers. Any disturbances to the data
from these sensors can in turn affect the estimates inferred
from them. Magnetic anomalies can cause deviations in
heading estimates and significant movements (e.g., gait,
muscle tremor, vehicle motion), sensed by the accelerom-
eters, can affect the estimation of the tilt of the device.
There is also considerable and varying uncertainty from the
kind of positioning system we choose to use. For example,
there are significant and well documented problems with
the spatially varying uncertainty arising from shadowing
and reflection artifacts in GPS fixation [34]. Seager et al.
[35] conducted a study, designed to assess the usefulness of
the GPS position information displayed by a commercial
GPS navigation system, which found that during a navi-
gation task users perceived the position information to be
‘‘at best, redundant and, at worst, confusing’’. This was
thought to be directly related to the inaccuracy of the
software position estimate, caused by lags with the GPS
data and inaccuracy with the map matching algorithm.
Likewise wireless positioning systems can display com-
plicated behaviour and so an important design decision is
how much of this inaccuracy to present to the user so that
they can appropriately modify their behaviour to improve
their location accuracy. In the GPS case, Seager advocates
the explicit display of uncertainty to the user in the form of
an icon with variable size.
Human sources of error are physiological in nature. Any
purposeful movement generated from the human body is
inherently variable and this affects the range of readings
measured on the sensors and the accuracy with which we
can define one particular movement. Our system is also
susceptible to tremor from our muscles, which injects a
further level of uncertainty. Morrison and Keogh [36],
whilst investigating the effects of tremor in goal-directed
pointing tasks found that the influence of tremor increased
Pers Ubiquit Comput
123
significantly for tasks that required more accuracy. These
kind of systematic physiological effects are something that
must be considered when designing systems of this nature.
3.1 Heading uncertainty
Our system makes use of bearing data calculated from a
combination of integrated magnetometers and accelerom-
eters. The earth has a magnetic field that resembles that of a
simple bar magnet with field lines originating at the south
pole and and terminating at the north pole. The field lines
have slightly varying strength and direction at different
points around the earth but at a local level we can think of
these fields as being constant and use them as a reference
for the direction our sensor is pointing, given a suitable
calibration. Determination of the compass heading is
achieved by first rotating the magnetometer data into the
horizontal plane, that is, the plane perpendicular to the
Earth’s gravitational vector, using accelerometer data then
using this magnetometer data to calculate a heading value
for the device [37]. Most systems would assume complete
accuracy from this heading estimate but in reality any
measured uncertainty in the magnetometer and acceler-
ometer data is propagated through to the final heading
calculation meaning that we do not have a pinpoint accu-
rate heading measurement with which to work.
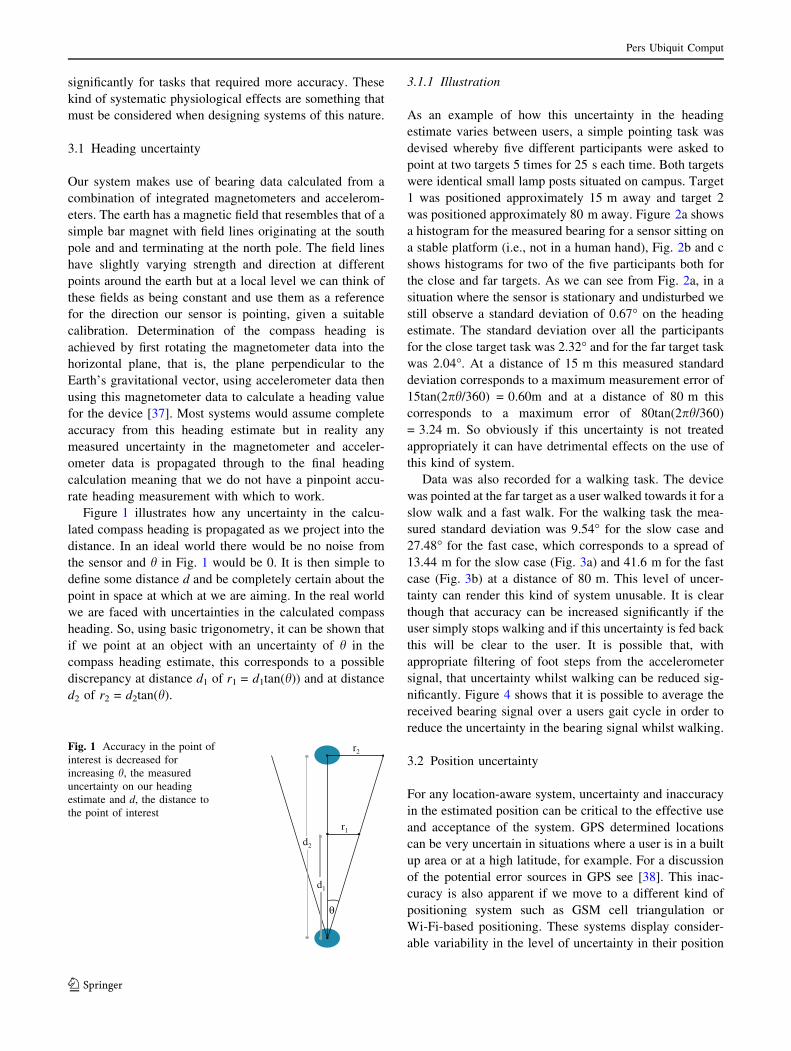
Figure 1 illustrates how any uncertainty in the calcu-
lated compass heading is propagated as we project into the
distance. In an ideal world there would be no noise from
the sensor and h in Fig. 1 would be 0. It is then simple to
define some distance d and be completely certain about the
point in space at which at we are aiming. In the real world
we are faced with uncertainties in the calculated compass
heading. So, using basic trigonometry, it can be shown that
if we point at an object with an uncertainty of h in the
compass heading estimate, this corresponds to a possible
discrepancy at distance d1 of r1 = d1tan(h)) and at distance
d2 of r2 = d2tan(h).
3.1.1 Illustration
As an example of how this uncertainty in the heading
estimate varies between users, a simple pointing task was
devised whereby five different participants were asked to
point at two targets 5 times for 25 s each time. Both targets
were identical small lamp posts situated on campus. Target
1 was positioned approximately 15 m away and target 2
was positioned approximately 80 m away. Figure 2a shows
a histogram for the measured bearing for a sensor sitting on
a stable platform (i.e., not in a human hand), Fig. 2b and c
shows histograms for two of the five participants both for
the close and far targets. As we can see from Fig. 2a, in a
situation where the sensor is stationary and undisturbed we
still observe a standard deviation of 0.67� on the heading
estimate. The standard deviation over all the participants
for the close target task was 2.32� and for the far target task
was 2.04�. At a distance of 15 m this measured standard
deviation corresponds to a maximum measurement error of
15tan(2ph/360) = 0.60m and at a distance of 80 m this
corresponds to a maximum error of 80tan(2ph/360)
= 3.24 m. So obviously if this uncertainty is not treated
appropriately it can have detrimental effects on the use of
this kind of system.
Data was also recorded for a walking task. The device
was pointed at the far target as a user walked towards it for a
slow walk and a fast walk. For the walking task the mea-
sured standard deviation was 9.54� for the slow case and
27.48� for the fast case, which corresponds to a spread of
13.44 m for the slow case (Fig. 3a) and 41.6 m for the fast
case (Fig. 3b) at a distance of 80 m. This level of uncer-
tainty can render this kind of system unusable. It is clear
though that accuracy can be increased significantly if the
user simply stops walking and if this uncertainty is fed back
this will be clear to the user. It is possible that, with
appropriate filtering of foot steps from the accelerometer
signal, that uncertainty whilst walking can be reduced sig-
nificantly. Figure 4 shows that it is possible to average the
received bearing signal over a users gait cycle in order to
reduce the uncertainty in the bearing signal whilst walking.
3.2 Position uncertainty
For any location-aware system, uncertainty and inaccuracy
in the estimated position can be critical to the effective use
and acceptance of the system. GPS determined locations
can be very uncertain in situations where a user is in a built
up area or at a high latitude, for example. For a discussion
of the potential error sources in GPS see [38]. This inac-
curacy is also apparent if we move to a different kind of
positioning system such as GSM cell triangulation or
Wi-Fi-based positioning. These systems display consider-
able variability in the level of uncertainty in their position
θ
r2
r1
d2
d1
Fig. 1 Accuracy in the point of
interest is decreased for
increasing h, the measured
uncertainty on our heading
estimate and d, the distance to
the point of interest
Pers Ubiquit Comput
123

estimates and any movement between two different kinds
of positioning system, for example, moving from an out-
door positioning system with fairly high resolution
estimates to an indoor positioning system with fairly low
resolution estimates, can cause sudden and large changes in
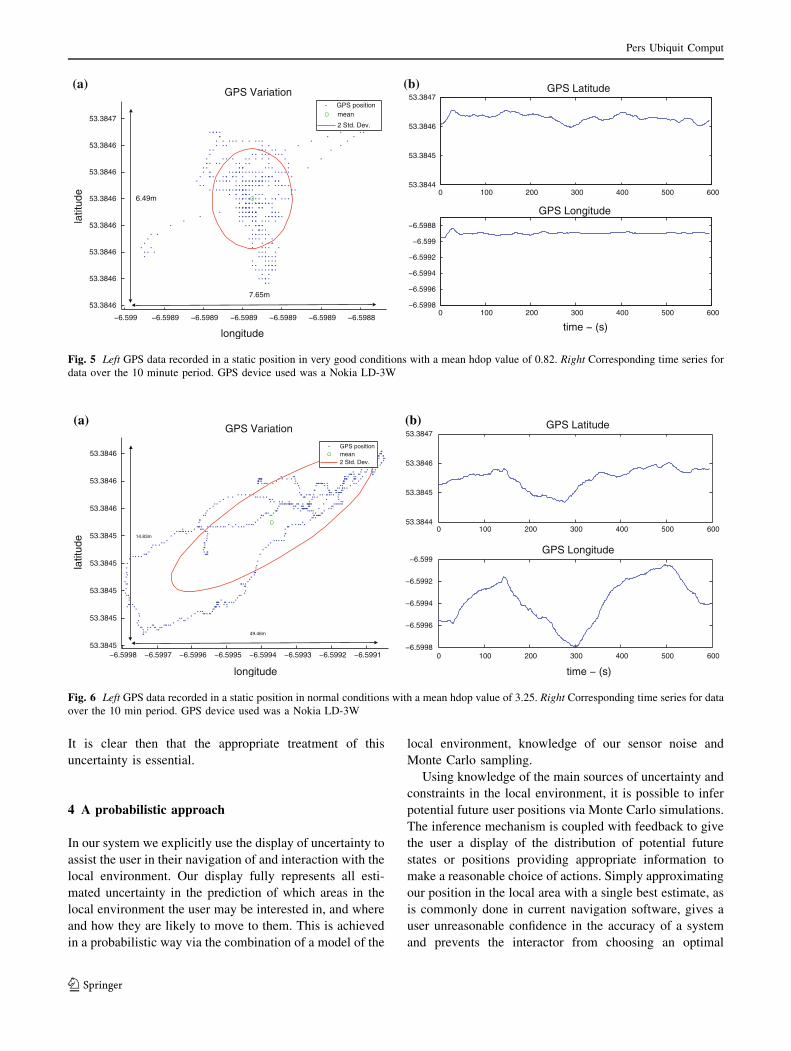
the measured uncertainty. Figure 5 shows the estimated
position for device over a 15 min period in very good
conditions on the top of a building with a mean hdop value
of 0.82. As we can see from Fig. 5, even with good con-
ditions in a relatively unobstructed environment the
standard deviation of the estimated position from the GPS
is 1.46 m in the latitude estimate and 0.96 m in the lon-
gitude estimate. Although more than sufficient for motor
vehicle and aircraft applications, this likely to disrupt any
pedestrian based location-aware system that requires the
kind of detailed interaction we desire and places constraints
on target placement and separation. It is unlikely though
that in typical use, a user is going to have such good
conditions. Figure 6 shows GPS data logged in the case
where the GPS antenna is attached to the side of the same
building, effectively shadowed from a number of potential
satellites.
In this case the standard deviation of the estimated
position from the GPS is 3.95 m in the latitude coordinate
and 13.55 m in the longitude coordinate in what are likely
to be much more typical conditions for this kind of system.
−10 −5 0 5 100
200
400
600
800
1000
1200
1400
1600
1800stable sensor − heading
−10 −5 0 5 100
200
400
600p2 − close − heading
−10 −5 0 5 100
200
400
600p2 − far − heading
−10 −5 0 5 100
200
400
600p5 − close − heading
−10 −5 0 5 100
200
400
600p5 − far − heading
(a) (b) (c)Fig. 2 a Histogram for data
recorded from our sensor
situated on a stable surface.
b and c show histograms for
heading data recorded from two
different participants for a close
target and a far target
−100 −80 −60 −40 −20 0 20 40 60 80 1000
20
40
60
80
100
120
140heading uncertainty − slow walk
−100 −80 −60 −40 −20 0 20 40 60 80 1000
10
20
30
40
50
60
70
80heading uncertainty − fast walk(a) (b)Fig. 3 Histograms for heading
data recorded for the walking
task. Uncertainty in the heading
estimate is increased
significantly when a user is
walking (a). Much higher
uncertainty is observed for a
faster walking pace (b)
7 7.5 8 8.5 9 9.5 10 10.5 11
200
210
220
230
240
250
time(s)
Bea
ring
(deg
)
step av.
instant.
38 39 40 41 42 43 44 45 46
205
210
215
220
225
230
235
240
245
250
time(s)
Bea
ring
(deg
)
step av.instant.
(a) (b)Fig. 4 Foot steps (blue circles)
are recorded from accelerometer
data and used to average the raw
bearing signal (black line) for a
slow walking case (left) and a
jogging case (right)
Pers Ubiquit Comput
123
It is clear then that the appropriate treatment of this
uncertainty is essential.
4 A probabilistic approach
In our system we explicitly use the display of uncertainty to
assist the user in their navigation of and interaction with the
local environment. Our display fully represents all esti-
mated uncertainty in the prediction of which areas in the
local environment the user may be interested in, and where
and how they are likely to move to them. This is achieved
in a probabilistic way via the combination of a model of the
local environment, knowledge of our sensor noise and
Monte Carlo sampling.
Using knowledge of the main sources of uncertainty and
constraints in the local environment, it is possible to infer
potential future user positions via Monte Carlo simulations.
The inference mechanism is coupled with feedback to give
the user a display of the distribution of potential future
states or positions providing appropriate information to
make a reasonable choice of actions. Simply approximating
our position in the local area with a single best estimate, as
is commonly done in current navigation software, gives a
user unreasonable confidence in the accuracy of a system
and prevents the interactor from choosing an optimal
−6.599 −6.5989 −6.5989 −6.5989 −6.5989 −6.5989 −6.5988
53.3846
53.3846
53.3846
53.3846
53.3846
53.3846
53.3846
53.3847
GPS Variation
longitude
latit
ude
GPS positionmean
2 Std. Dev.
6.49m
7.65m
0 100 200 300 400 500 60053.3844
53.3845
53.3846
53.3847GPS Latitude
0 100 200 300 400 500 600−6.5998
−6.5996
−6.5994
−6.5992
−6.599
−6.5988
GPS Longitude
time − (s)
(a) (b)
Fig. 5 Left GPS data recorded in a static position in very good conditions with a mean hdop value of 0.82. Right Corresponding time series for
data over the 10 minute period. GPS device used was a Nokia LD-3W
−6.5998 −6.5997 −6.5996 −6.5995 −6.5994 −6.5993 −6.5992 −6.599153.3845
53.3845
53.3845
53.3845
53.3845
53.3846
53.3846
53.3846
GPS Variation
longitude
latit
ude
GPS positionmean2 Std. Dev.
14.83m
49.46m
0 100 200 300 400 500 60053.3844
53.3845
53.3846
53.3847GPS Latitude
0 100 200 300 400 500 600−6.5998
−6.5996
−6.5994
−6.5992
−6.599GPS Longitude
time − (s)
(a) (b)
Fig. 6 Left GPS data recorded in a static position in normal conditions with a mean hdop value of 3.25. Right Corresponding time series for data
over the 10 min period. GPS device used was a Nokia LD-3W
Pers Ubiquit Comput
123

strategy for dealing with the true state of the world.
Unrealistically precise feedback can make smooth, stable
control difficult; this ‘‘jumpy’’ interaction is familiar to
users of conventional GPS devices where the postulated
location may sporadically shift in an unpredictable manner.
Displaying the position density, which incorporates the
best estimate of the uncertainty of the system, means that
the user can appropriately simplify their behaviour when
limited information is available [39], achieving a graceful,
interpretable degradation in interaction performance. For
example, if a user points at a target and there is a sudden
jump in the estimated position a loss of feedback might
lead to a loss of trust in the system.
The major novel feature of this system is the browsing
interface which facilitates active probing of the locality.
This is achieved by projecting possible paths into the future
from some location along a given heading. As the infor-
mation from our sensors is uncertain, any prediction by the
system of where in the locality we are interested will inherit
this uncertainty. Ideally, an estimate of a user’s area of
interest or potential future locations would be represented as
a probability density function over the whole navigable
space, taking into account available information such as
areas in the locality where the user would usually move to
or has moved to in the past, or sensor noise models, for
example. This function, however, is generally extremely
complex for non-trivial landscapes, and no solution of
simple form is available. Instead, we approximate using a
set of samples drawn from the density, known as Monte
Carlo sampling [40]. It is much more computationally
efficient to draw such approximating samples than it is to
directly evaluate the full probability density function.
For our browsing task, a simple algorithm for sampling
future possible trajectories is as follows:
• Draw samples x0... xS from a distribution e around the
current state. This distribution represents the sensor
uncertainty at the initial position (e.g., from the shadow
maps described later).
• For each step t until some horizon T:
– xst = xs
t-1 + h + l(xst) + r(xs
t) where r(xst) repre-
sents the model noise at the new point xst (Gaussian,
in our examples), and l(xst) represents the derivative
of the likelihood map at that point. h is the heading
from our magnetometers. r(xst) can be a constant
value or a more complex function; for example,
from a map indicating the resolution or quality of
the likelihood map.
• Display the samples xsT
This is similar to the Hamiltonian (or hybrid) Monte Carlo
sampling process; Chap. 30 of MacKay [40] has further
details.
4.1 User defined context landscapes
The process described above can be imagined as a beam of
particles flowing out from around an initial state, probing
into likely destinations or areas of interest. A straightforward
propagation of particles through the locality in time would
lead to a fairly simple distribution of points at the time
horizon, which would be unlikely to model possible user
destinations effectively. It is extremely unlikely, for exam-
ple, that the user would be inside a solid wall at any point in
the future or at the top of a mountain in the next 5 min. This
straightforward propagation of the particles also takes no
account of the varying uncertainty in sensor measurements.
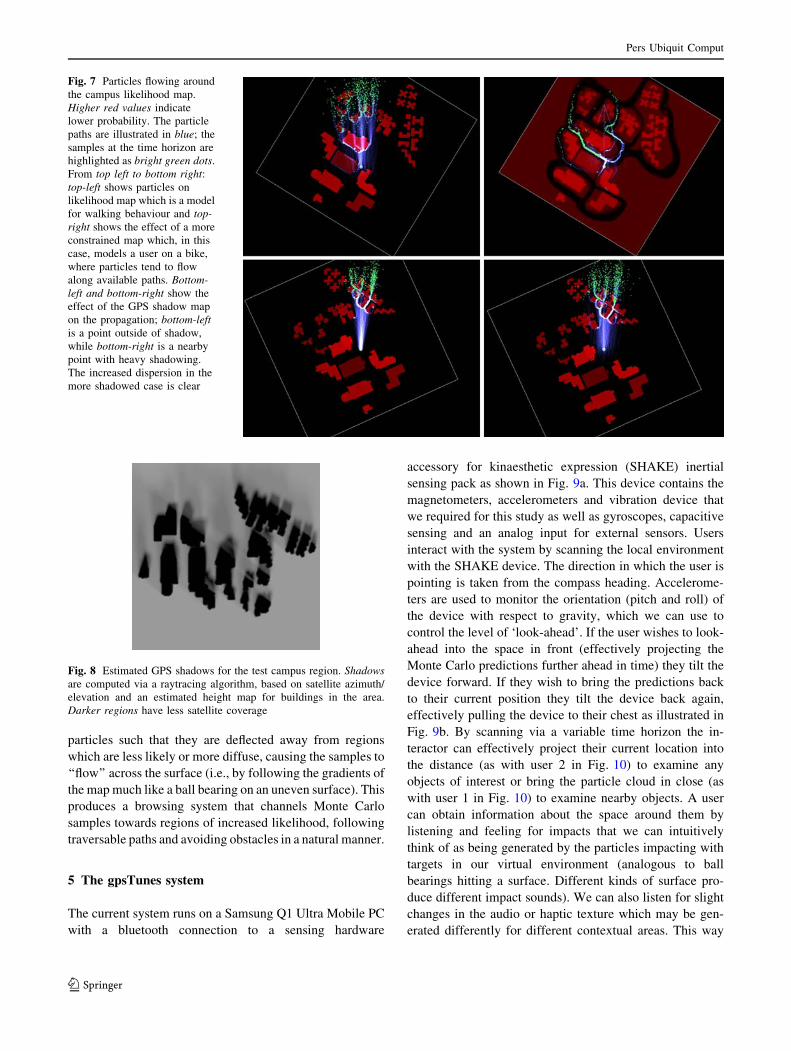
To represent these varying positional likelihoods we use
a likelihood map, giving a probability p of being in a par-
ticular position (as measured by the sensors) in the mapped
area. An example of such a map is shown in Fig. 7; in this
example the buildings have very low likelihood and there is
increased likelihood around pathways on the map. It is also
possible for particles to flow along walls and round the
corners of buildings, channeling themselves into areas of
increased likelihood. In this example, the landscape is
generated by hand from an existing map, but such land-
scapes can also, for example, be derived automatically from
digital photogrammetry maps or generated from a users
general behaviour or location history.
Representation of uncertainty in the measured position
can take the form of occlusion maps generated from
knowledge of the geometry of potential occlusions(for
example, see [41]). As an example we have constructed a
simple static occlusion map with a raytracing technique
based on currently locked satellite positions. An example
combined sensor uncertainty map resulting from estimated
shadow positions is shown in Fig. 8.
It is possible to include these sensor uncertainty maps in
the sampling algorithm by modulating the diffusion
parameter e at each time step by the calculated sensor
uncertainty at the point. The total sensor uncertainty will be
a combination of the map input and accuracy reading
produced by the GPS device itself. The accuracy of a GPS
fix is also computed in the sensor hardware in real-time.
This includes the number of satellites which have locks and
more specific data giving the fix quality. For example, the
‘‘horizontal dilution of precision’’ provides us with a
scaling factor for the current uncertainty from 1 to 50.
These values are combined with the a priori sensor maps to
obtain a certainty estimate for the current location.
In the simplest way the propagation algorithm can be
modified to take account of these maps simply by removing
particles at a rate inversely proportional to their likelihood
given their current position and the sensor uncertainty at that
point. For increased computational throughput; however,
our implementation instead modifies the dynamics of the
Pers Ubiquit Comput
123
particles such that they are deflected away from regions
which are less likely or more diffuse, causing the samples to
‘‘flow’’ across the surface (i.e., by following the gradients of
the map much like a ball bearing on an uneven surface). This
produces a browsing system that channels Monte Carlo
samples towards regions of increased likelihood, following
traversable paths and avoiding obstacles in a natural manner.
5 The gpsTunes system
The current system runs on a Samsung Q1 Ultra Mobile PC
with a bluetooth connection to a sensing hardware
accessory for kinaesthetic expression (SHAKE) inertial
sensing pack as shown in Fig. 9a. This device contains the
magnetometers, accelerometers and vibration device that
we required for this study as well as gyroscopes, capacitive
sensing and an analog input for external sensors. Users
interact with the system by scanning the local environment
with the SHAKE device. The direction in which the user is
pointing is taken from the compass heading. Accelerome-
ters are used to monitor the orientation (pitch and roll) of
the device with respect to gravity, which we can use to
control the level of ‘look-ahead’. If the user wishes to look-
ahead into the space in front (effectively projecting the
Monte Carlo predictions further ahead in time) they tilt the
device forward. If they wish to bring the predictions back
to their current position they tilt the device back again,
effectively pulling the device to their chest as illustrated in
Fig. 9b. By scanning via a variable time horizon the in-
teractor can effectively project their current location into
the distance (as with user 2 in Fig. 10) to examine any
objects of interest or bring the particle cloud in close (as
with user 1 in Fig. 10) to examine nearby objects. A user
can obtain information about the space around them by
listening and feeling for impacts that we can intuitively
think of as being generated by the particles impacting with
targets in our virtual environment (analogous to ball
bearings hitting a surface. Different kinds of surface pro-
duce different impact sounds). We can also listen for slight
changes in the audio or haptic texture which may be gen-
erated differently for different contextual areas. This way
Fig. 7 Particles flowing around
the campus likelihood map.
Higher red values indicate
lower probability. The particle
paths are illustrated in blue; the
samples at the time horizon are
highlighted as bright green dots.
From top left to bottom right:top-left shows particles on
likelihood map which is a model
for walking behaviour and top-right shows the effect of a more
constrained map which, in this
case, models a user on a bike,
where particles tend to flow
along available paths. Bottom-left and bottom-right show the
effect of the GPS shadow map
on the propagation; bottom-leftis a point outside of shadow,
while bottom-right is a nearby
point with heavy shadowing.
The increased dispersion in the
more shadowed case is clear
Fig. 8 Estimated GPS shadows for the test campus region. Shadowsare computed via a raytracing algorithm, based on satellite azimuth/
elevation and an estimated height map for buildings in the area.
Darker regions have less satellite coverage
Pers Ubiquit Comput
123

of interacting enables a user to obtain information from the
area around them without the explicit need to move to that
particular area as is the case with most location-aware
systems. A user of our system can effectively say ‘‘what
would I feel if I was over there?’’. This way of thinking
allows users to take a much more active, embodied and
empowering approach to the querying and retrieval of
information from their current context that would be
extremely difficult to implement in a responsive manner
without uncertain feedback.
6 Scenarios
There are a number of applications for this kind of system.
The predictive and probabilistic nature opens up a wealth
of opportunity for a more advanced form of route planning
or map matching, for example. We choose to focus though,
on the use of this system for mobile spatial interaction, as a
tool for interacting, probing and querying information in
the local environment. The notion of egocentric and exo-
centric interfaces becomes important here. Marentakis and
Brewster [42] in their work with a spatial audio interfaces,
define an egocentric display to be one where the sound
position is fixed to the user and remains unchanged no
matter what the direction of the user, whereas in an exo-
centric interface, sound position is fixed to the world and is
updated in real time based on the direction of the user
relative to the sounds. In an egocentric setting we have the
ability to build highly personal spatial interfaces. Exocen-
tric spatial interfaces on the other hand are much more
open and expansive. An exocentric interface, in this con-
text, becomes a place to store information in specific
locations or discover information left by other people,
creating new opportunities for the exploration and analysis
of the social mechanisms for this kind of interaction or
sharing of experiences.
The egocentric version of this system effectively
becomes a highly personal eyes-free desktop for the user
with his personal items stored on and around his body, a
similar concept to [6], as in shown Fig. 11a. We may
imagine a situation where a user is out and receives a text
message. He points his device at where he usually keeps his
text messages and the message appears. He then decides
Fig. 9 a The equipment used to
run the system. Samsung Q1
UMPC and the SHAKE inertial
sensing device. b Tilting the
device forward looks into the
distance (effectively projecting
the Monte Carlo predictions
further ahead in time as
illustrated in the inset). Tilting
the device back again, or pulling
it towards the chest, bring the
predictions back to the current
position
Fig. 10 User 1 takes a passive
approach to interacting with the
density with particles spread
around the body. User 2 takes a
more active and embodied
approach to interacting with the
density and any objects, which
that ‘contextual’ density may
contain. Interacting with
different kinds of density can
produce different kinds of
response from the system.
Fig. 11 a A user has a number of objects arranged around himself
which he can point at to activate. The objects are arranged in a
layered fashion creating more space. b The local area has a number of
objects left there by other users with which it is possible to interact
Pers Ubiquit Comput
123

that he would like to listen to some music so he points the
device in the direction he usually keeps his mp3 player.
This is a basic example but we also have here the oppor-
tunity to create a layered-ego system where by the user can
create increasingly large rings of items around his body, all
of which are selectable with skillful use of the system.
In an exocentric interface the user places items in spe-
cific locations in the world around him. As illustrated in
Fig. 11b, the user may interact with, for example, the
geocoded wikipedia article about the building ahead of
him. He may interact with the object containing informa-
tion about that building or look at some photographs left
outside the building by other users. He may even get the
attention of his friend who is close by or browse some
music files that have been left in that specific location. This
is effectively a form of geo-coded Internet for users to
interact with whilst mobile and paves the way for a new
kind of highly interactive mobile internet. Another appli-
cation of this kind of system is for the provision of
information in public spaces, at a train station, for example.
A user could access timetable or train information just by
pointing their device at the train station, or a specific part of
the train station as soon as they were in range. They could
then negotiate their way through a hierarchical system to
find out information about their specific train. Just as train
stations use specific colouring and fonts for signage, the
kind of feedback provided in this context would be specific
to that train station context.
7 Experiment
7.1 Background
We have shown previously that the explicit display of
uncertainty to a user can significantly improve their inter-
action with the local environment when compared to a
system that assumes complete accuracy [43]. So what
limits do ‘typical’ noise characteristics place on the overall
system design both in a high uncertainty walking situation
and a lower uncertainty still situation? How far apart can
we place targets and what size can we make these targets in
the virtual environment without it becoming impossible to
accurately resolve more than one target? And what effect,
if any, does the distance of a target have on user
performance?
7.2 Set-up
To answer these questions an experiment was conducted
with eight participants. Each participant was given a brief
introduction to the system with a visual example and were
allowed to practice for a number of minutes before the trial
began. The trial took place outdoors and involved users
remaining in a static position (with simulated noise added
to this position in order to mimic the effects of an uncertain
position estimate), scanning the area ahead for three dif-
ferent targets with each target having it’s own distinct
impact sound, described to the users as ‘pop’, ‘plastic’ and
‘metal’. This set-up is illustrated in Fig. 12. The typical
noise characteristics measured in Sect. 3 for both the
walking and standing still conditions were added to the
system, a standard deviation of 20.41� for the high uncer-
tainty trial and a standard deviation of 2.3� for the lower
uncertainty trial were added to the heading estimate and a
standard deviation of 3 m was added to the GPS position
estimate.
The experiment was conducted in two main parts (eight
participants for each). In part 1a, participants were asked to
complete two acquisitions of each target with the measured
low uncertainty for four different distances, d (7.5, 12.5,
17.5 and 22.5 m corresponding to tilt angles of 20�, 13.3�,
6.6� and 0�) and 4 different target angular separations, hs
(20�, 30�, 40� and 50�) with the aim of investigating both
the effect of varying distance on target acquisition and the
effect of varying angular separation on target acquisition at
this lower uncertainty level. Throughout this part of the
experiment the angular size of the targets, ht was kept
constant at 9� for each value of d and hs. This meant that
effectively the targets were increasing in size as they were
moved further into the distance.
Part 1b of the experiment involved the participants again
completing two acquisitions of each target for 4 different
distances but this time for a constant angular separation and
varying angular width of the target for angular widths of
10�, 16�, 24� and 32�.
Part 2 of the experiment consisted of the same set-up as
part 1 but with a higher uncertainty added to the system in
order to observe the effects of the high uncertainty levels
θs
θt
d
r
1
Fig. 12 Users stand at position 1 and scan the area ahead. The
angular size of the target is represented by ht and the angular
separation of the targets is represented by hs. The distance d to the
target is also varied throughout the experiment
Pers Ubiquit Comput
123

observed in the walking task. Part 2 of the experiment took
place in the same static location used for part 1. Although
this is slightly unrealistic, as actual walking data is likely to
introduce different kinds of disturbance, it was necessary in
order to compare the high and low uncertainty cases in a
valid way. The presentation of each combination of values
for each part was given in a counterbalanced order.
Selection of a target was achieved by activating a
capacitive switch on the device when the participant
believed that they had the best possible fix on the target and
had isolated the particular impact sound for that target.
They are then requested to select the next target and this
continues until the end of the run. The impact energy level
signals the number of impacts on each target and was
measured and recorded for each acquisition. This allows us
to examine any clear acquisitions or any cross-talk between
acquisitions.
7.3 Results
7.3.1 Low uncertainty experiment: Part 1
In part 1a of the experiment, out of a possible 96 selections
the average correct selection rate over all participants was
69.7%. The average clear correct selection rate, where
‘clear’ indicates that the target with the highest energy
level is at least 10% higher than the next highest, was
61.3% over all the conditions. Figure 13a shows how the
number of successful selections varies for different dis-
tances. There is a slight improvement overall at higher
distance (corresponding to a lower device tilt angle) indi-
cating not necessarily that the participants were more
comfortable with higher distances but that the participants
are more comfortable when the device was flatter in their
hand. Figure 13b shows the number of successful selec-
tions for varying angular separation, hs. There is a general
increase in the number of clear selections for higher
angular separation indicating, as we might expect, that in
general the participants found the task easier if the targets
were further apart.
In part 1b of the experiment (to examine the effects of
varying angular width) participants were more successful
with an average of 81% correct selections in the ‘non-clear’
case but slightly less successful in the ‘clear’ case with
54.2% correct selections. Figure 14a shows how the num-
ber of successful selections varies for increasing distance.
Participants perform consistently better for the targets at
lower distance (corresponding to a higher tilt angle). As
distance increases participants are slightly more successful.
Figure 14b shows the number of successful selections for
varying angular width, ht. This shows that participants were
less successful in making clear selections for increasing
angular width (i.e., decreasing space between targets) of the
target. But if we observe Fig. 14c for the case of correct
‘non clear’ selections only we see that the number of correct
selections actually increases slightly for large angular
width. And if we observe Fig. 15 we see that there is a slight
decrease in selection times for increasing angular width,
indicating that participants were finding it easier to locate
these targets. It is likely then that participants were
becoming much less precise for the perceived easier task
and so the number of clear selections was decreasing with
the decreasing concentration or attention of the user.
7.3.2 High uncertainty experiment: Part 2
In part 2a of the experiment the average correct selection
rate over all participants was 70%. The average clear
correct selection rate was 50% over all the conditions.
Figure 16a shows how the number of successful selections
varies for different distances. There is a slight improvement
overall at higher distance (lower device tilt angle) indi-
cating again that participants were more comfortable when
the device is flatter in their hand. This is backed up if we
examine Fig. 17, which shows the selection times for clear
selections over increasing distance. We observe a decrease
6 8 10 12 14 16 18 20 22 240
5
10
15
20
25
30
distance (m)
num
ber
succ
essf
ully
sel
ecte
d
number of correct selections at each distance
15 20 25 30 35 40 45 50 550
5
10
15
20
25
30
angular separation (degrees)
num
ber
succ
essf
ully
sel
ecte
d
number of correct selections for each angular separation(a) (b)Fig. 13 a Each column shows
the results for each distance
with red circles indicating the
number of clear correct
selections for each user in part
1a of the experiment. Bluecrosses indicate the mean value
for that distance. b Each column
shows the results for each
angular separation with redcircles showing the number of
clear correct selections for each
user in part 1a of the experiment
Pers Ubiquit Comput
123

in the selection time for higher distances, indicating that
users found this configuration slightly easier. It is likely
then that the increased uncertainty at shorter distances,
corresponding to higher tilt angles, severely affected per-
formance at this distance. Figure 16b shows the number of
successful selections for varying angular separation, hs.
There is a general increase in the number of clear selec-
tions for higher angular separation as was the case in part
1a. There is also a decrease in the selection times for
increasing angular separation (Fig. 18) indicating that in
general the participants found the task easier if the targets
were further apart, which is what we had expect from a
system with such high uncertainty.
In part 2b of the experiment participants were slightly
more successful with an average of 82.3% correct selections
and 60.3% clear correct selections. Figure 20a shows how
the number of successful selections varies for increasing
distance. There is little variation as distance increases. If we
observe the corresponding selection times for each distance
as shown in Fig. 19 we see that there is a general decrease in
selection time as the distance is increased or as the required
tilt level of the device is decreased, confirming somewhat
that which was observed in part 2a of the experiment. It is
interesting that this was not observed in part 1 of the
experiment for lower uncertainty, indicating again that high
uncertainty is a significant limiting factor. Figure 20b
shows the number of successful selections for varying
angular width, ht. We observe that participants were less
successful in making clear selections for increasing angular
width of the target, as was also observed in part 1b of the
experiment. But if we observe Fig. 20c for the case of
correct ‘non clear’ selections only there is again little var-
iation for increasing angular width. This indicates that while
participants found it easy to select targets with large width,
there is a point where clear selections become very difficult
as angular size is increased, particularly where there is high
uncertainty. Looking at Fig. 21 we see that there is a slight
decrease in the selection time as angular width increases for
both the left and right targets but not for the center target.
This indicates that in the case with maximum angular width
users were finding it difficult to localise one individual set
of impact sounds. In the left and right target case it is
possible to move to the outer edge of target to isolate one
kind of impact sound but in the center target case this is not
possible. Again, this shows that high uncertainty in a system
places limits on the system design.
8 Discussion
This experiment has shown that users can isolate their
desired targets effectively with a basic system that
6 8 10 12 14 16 18 20 22 240
5
10
15
20
25
30
35
40
num
ber
succ
essf
ully
sel
ecte
d
distance (m)
number of correct selections for each distance
10 15 20 25 300
5
10
15
20
25
30
35
40
num
ber
succ
essf
ully
sel
ecte
d
angular width
number of correct selections for each angular width
10 15 20 25 300
5
10
15
20
25
30
35
40
num
ber
succ
essf
ully
sel
ecte
d
angular width
number of correct selections for each angular width(a) (b) (c)
Fig. 14 a Red circles show the number of clear correct selections for
each user in part 1b of the experiment, with blue crosses indicating
the mean value for that distance. b The number of clear correct
selections in part 1b of the experiment drops for increasing angular
width where as the number of correct ‘non-clear’ selections actually
increases for increasing angular width indicating that participants
become less accurate as the perceived difficulty of the task decreases
as illustrated in c
10 16 24 320
5
10
15
20
25
30
35
40
time
(s)
angular width
selection times
Fig. 15 Mean selection times for each target for varying target
angular width in part 1b of the experiment. Selection time decreases
slightly with increasing angular width
Pers Ubiquit Comput
123

incorporates ‘typical’ noise conditions. It has shown that
although the range of distances used in this experiment was
perhaps smaller than it could have been (using a 30� range
mapped to a 15 m distance), in the high uncertainty case
users tended to be slightly quicker and slightly more
effective at higher distance, corresponding to a lower tilt
angle of the device. This is almost certainly down to the
increased uncertainty making selection at lower distance
(higher tilt) much more difficult. In the low uncertainty
case it was found that increasing width (decreasing tilt) had
little effect on the results. It must be mentioned that this
experiment was more a test of effects of varying the tilt
angle of a device since no real world objects were being
used for the pointing task.
The varying angular separation experiment has, quite
intuitively, illustrated to us that users are more effective
with increasing distance between targets. At lower sepa-
rations users tend to take longer to select the target due to
6 8 10 12 14 16 18 20 22 240
5
10
15
20
25
30
num
ber
succ
essf
ully
sel
ecte
d
disptance (m)
number of correct selections at each distance
15 20 25 30 35 40 45 50 550
5
10
15
20
25
30
num
ber
succ
essf
ully
sel
ecte
d
angular separation
number of correct selections for each angular separation(a) (b)Fig. 16 a Each column shows
the number of correct selections
for varying distance in part 2a of
the experiment. Red circlesshow the number of clear
correct selections for each user,
with blue crosses indicating the
mean value for that distance.
b Each column shows the
number of correct selections for
varying angular separation. The
red circles show the number
of clear correct selections for
each user
7.5 12.5 17.5 22.50
5
10
15
20
25
30
35
40
time
(s)
distance (m)
selection times
Fig. 17 Selection times for each target for varying distance in part 2a
of the experiment. Selection time decreases with increasing distance
to the target
10 16 24 320
5
10
15
20
25
30
35
40
time
(s)
angular width
selection times
Fig. 18 Selection times for each target for varying angular separation
in part 2a of the experiment. Selection time decreases with increasing
angular separation
7.5 12.5 17.5 22.50
5
10
15
20
25
30
35
40
time
(s)
distance (m)
selection times
Fig. 19 Selection times for each target for varying distance in part 2b
of the experiment. Selection time decreases with increasing distance
to the target
Pers Ubiquit Comput
123

significant cross-talk between the targets, especially in the
case with high uncertainty, although the minimum sepa-
ration between targets obviously depends on this level of
uncertainty in a particular environment or context.
The varying angular width experiment for both the high
and low uncertainty cases provided an intriguing insight to
the design of this kind of system. In the low uncertainty
case it was found that as the width of the target is increased
users in general become more successful. But the accuracy
of their target selections decreases significantly. This is
thought to be due to the participants taking a less accurate
approach when the task was perceived to be significantly
easier.
In the high uncertainty case the number of successful
and clear selections was found to fall off with increasing
width. This was found to be due to the decreasing distance
between the targets as the width increases leading to
increasing cross-talk between neighbouring targets. The
more successful participants were found to combat this by
moving to the outer-edge of the target in order to isolate the
correct impact sound but this was not possible with the
center target, leading to much higher selection times for
this target with higher angular width. Designers of this kind
of system then should be aware that although increasing the
width of a target will, in general, increase the ease of
selection for that target, care has to be taken not to decrease
too much the distance to any neighbouring targets. Highest
success was achieved in this experiment for angular widths
between 10� and 24�, implying a minimum distance
between targets of 26�.
The system described here is a basic one and highlights
some of the problems that may be encountered but there
exist a number of possible ways in which this basic system
that incorporates typical noise conditions can be improved.
One possible improvement to this kind of system could be
the use of a more complicated kind of dynamic adaptation
6 8 10 12 14 16 18 20 22 240
5
10
15
20
25
30
35
40
num
ber
succ
essf
ully
sel
ecte
d
distance (m)
number of correct selections for each distance
10 15 20 25 300
5
10
15
20
25
30
35
40
num
ber
succ
essf
ully
sel
ecte
d
angular width
number of correct selections for each angular width
10 15 20 25 300
5
10
15
20
25
30
35
40
num
ber
succ
essf
ully
sel
ecte
d
angular width
number of correct selections for each angular width(a) (b) (c)
Fig. 20 a Red circles show the number of clear correct selections for
each user in part 2b of the experiment, with blue crosses indicating
the mean value for that distance. b Red circles show the number of
clear correct selections for each user in part 2b of the experiment for
increasing angular width. c Red circles show the number of non-clear
correct selections for each user in part 2b of the experiment for
increasing angular width. This shows that although users were failing
to select the correct target clearly, they were still selecting the correct
target indicating that perhaps less effort is expended on the perceived
easier task
10 16 24 320
5
10
15
20
25
30
35
time
(s)
angular width
selection times − left target
10 16 24 320
5
10
15
20
25
30
time
(s)
angular width
selection times − center target
10 16 24 320
5
10
15
20
25
30
35
time
(s)
angular width
selection times − right target(a) (b) (c)
Fig. 21 Selection times for each target for varying target angular
width in part 2b of the experiment. Selection time decreases slightly
with increasing angular width for the left and right targets but not for
the center target. This is due to the space between targets decreasing
as the size of the target is increased making it increasingly difficult to
clearly select the center target without any interference from the other
targets. For both the left and the right targets a clear selection was
possible if the user focussed their selections on the outer edge of the
target
Pers Ubiquit Comput
123

of the system. For example, attractors could be placed
around targets that channel our particle probe to that par-
ticular target, reducing, if not eradicating, any cross-talk
between targets and allowing users to focus on a particular
target with greater ease. The explicit use of natural con-
straints in our environment can be used to channel our
probe into particular locations. For example, a natural
building corridor may exist in the real world that could be
incorporated into the virtual environment and used to
channel our probe and constrain it to any natural openings
in the real world where targets may be placed.
9 Conclusions
This paper has introduced a new framework for providing a
highly interactive and embodied context-based querying
mechanism to location-aware mobile spatial interactive
applications. We have quantified the main sources of error
present in this kind of system, focussing primarily on the
effect of bearing and positional errors and have introduced
and described a probabilistic framework which deals with
these sources of uncertainty.
An experiment was conducted to analyse the effect on
bearing-based selections in a virtual environment of vary-
ing target distance, target width and angular size. Although
it is difficult to give precise values after these initial
experiments, it was found that effective selection is
maintained down to 26� separation with a 9� target width in
the high uncertainty case. In the low uncertainty case it was
found that effective selection was maintained even at the
lowest limit examined in this experiment, that is, up to 20�separation with a 10� target width.
9.1 Outlook
There is great scope for extension of the ideas presented in
this paper. The implementation of this kind of system on a
commercial mobile phone is the next step and requires only
the incorporation of magnetometers and accelerometers
into a device for accurate heading and tilt determination.
The audio and vibrotactile feedback used at the moment is
relatively simple and there exist many degrees-of-freedom
in the display, which could be used creatively, balancing
the artistic presentation of the system augmenting the
physical environment with the information content avail-
able. As the richness of the models and feedback
mechanisms develop, we might find exciting new ways of
engaging with this augmented environment. For example,
it may become possible to perceive the shapes and sizes of
objects as we are interacting with them in the virtual
environment, and sculpt them interactively using a mobile
device.
In this work we have shown that with the use of
uncertain feedback it is possible for users to rapidly select
objects in a virtual environment. Without uncertain feed-
back target selection would be slower and less precise
unless targets were made very large and spaced far apart.
Future work in this area must include a study of how to
deal with uncertainty from walking user data compared to
static user data and in particular how to graciously move
between these two levels of uncertainty. It is likely that in
this high uncertainty walking or jogging environments
that new methods of target access will need to be
designed.
Acknowledgments We are grateful for support from:SFI grants 00/
PI.1/C067, 00/RFP06/CMS052, EPSRC project EP/E042740/1, IST
Programme of the European Commission, under PASCAL Network
of Excellence, IST 2002-506778, and OpenInterface Project. Nokia
provided a donation of funds and equipment which further supported
this work.
References
1. Sawhney N, Schmandt C (2000) Nomadic radio: speech and
audio interaction for contextual messaging in nomadic environ-
ments. ACM Trans Comput Hum Interact 7:353–383
2. Pirhonen A, Brewster S, Holguin C (2002) Gestural and audio
metaphors as a means of control for mobile devices. In: Pro-
ceedings of ACM CHI2002, Minneapolis. ACM Press/Addison-
Wesley, New York/Reading, pp 291–298
3. Brewster S (2002) Overcoming the lack of screen space on
mobile computers. Personal Ubiquitous Comput 6:188–205
4. Brewster S, Lumsden J, Bell M, Hall M, Tasker S (2003) Mul-
timodal ‘eyes-free’ interaction techniques for wearable devices.
In: CHI ’03: proceedings of the SIGCHI conference on Human
factors in computing systems. ACM Press, New York, pp 473–
480
5. Choi E, Bang W, Cho S, Yang J, Kim D, Kim S (2005) Beatbox
music phone: gesture-based interactive mobile phone using a tri-
axis accelerometer. In: IEEE international conference on indus-
trial technology, ICIT 2005, pp 97–102
6. Strachan S, Murray-Smith R, O’Modhrain S (2007) Bodyspace:
inferring body pose for natural control of a music player. In: CHI
’07: CHI ’07 extended abstracts on Human factors in computing
systems. ACM, New York, pp 2001–2006
7. Cheverst K, Mitchell K, Davies N (2001) Investigating context-
aware information push versus information pull to tourists. In:
Proceedings of Mobile HCI 01
8. Abowd G, Atkeson C, Hong J, Long S, Kooper R, Pinkerton M
(1997) Cyberguide: a mobile context-aware tour guide. Wirel
Netw 3:421–433
9. Feiner S, MacIntyre B, Hollerer T, Webster A (1997) A touring
machine: prototyping 3D mobile augmented reality systems for
exploring the urban environment. In: First international sympo-
sium on wearable computers. Digest of Papers, pp 74–81
10. Cheverst K, Davies N, Mitchell K, Friday A, Efstratiou C (2000)
Developing a context-aware electronic tourist guide: some issues
and experiences. In: CHI ’00: proceedings of the SIGCHI con-
ference on human factors in computing systems. ACM Press,
New York, pp 17–24
11. Drozd A, Benford S, Tandavanitj N, Wright M, Chamberlain A
(2006) Hitchers: designing for cellular positioning. In: UbiComp
Pers Ubiquit Comput
123
2006: ubiquitous computing, 8th international conference, vol
4206. Springer, Heidelberg, pp 279–296
12. Mexens (2005) Navizon. Project homepage: http://www.
navizon.com
13. Bell M (2007) Guidelines and infrastructure for the design and
implementation of highly adaptive, contextaware, mobile, peer-
to-peer systems. PhD Thesis, Department of Computing Science,
University of Glasgow
14. Kontkanen P, Myllymaki P, Roos T, Tirri H, Valtonen K, Wettig
H (2004) Probabilistic methods for location estimation in wireless
networks. In: Ganesh R, Kota S, Pahlavan K, Agustı R (eds)
Emerging location aware broadband wireless adhoc networks,
Chap. 11. Kluwer, Dordrecht
15. Hermersdorf M, Nyholm H, Perkio J, Tuulos V, Salminen J, Tirri
H (2006) Sensing in rich bluetooth environments. In: Proceedings
of workshop on World-Sensor-Web, SenSys
16. Baillie L, Kunczier H, Anegg H (2005) Rolling, rotating and
imagining in a virtual mobile world. In: MobileHCI ’05: pro-
ceedings of the 7th international conference on Human computer
interaction with mobile devices & services. ACM Press, New
York, pp 283–286
17. Burrell J, Gay GK (2002) E-graffiti: evaluating real-world use of
a context-aware system. Interact Comput 14:301–312
18. Espinoza F, Persson P, Sandin A, Nystrom H, Cacciatore E,
Bylund M (2001) Geonotes: social and navigational aspects of
location-based information systems. In: UbiComp ’01: proceed-
ings of the 3rd international conference on ubiquitous computing.
Springer, London, pp 2–17
19. Rantanen M, Oulasvirta A, Blom J, Tiitta S, Mantyla M (2004)
Inforadar: group and public messaging in the mobile context. In:
NordiCHI ’04: proceedings of the third Nordic conference on
human–computer interaction. ACM Press, New York, pp 131–140
20. Simon R, Frohlich P (2007) A mobile application framework for
the geospatial web. In: WWW ’07: proceedings of the 16th
international conference on World Wide Web. ACM Press, New
York, pp 381–390
21. Jones M, Buchanan G, Harper R, Xech PL (2007) Questions not
answers: a novel mobile search technique. In: CHI ’07: pro-
ceedings of the SIGCHI conference on Human factors in
computing systems. ACM Press, New York, pp 155–158
22. Arter D, Buchanan G, Jones M, Harper R (2007) Incidental
information and mobile search. In: MobileHCI ’07: proceedings
of the 9th conference on human–computer interaction with
mobile devices and services. ACM Press, New York
23. Simon R, Frohlich P (2007) Geopointing: evaluating the perfor-
mance of an orientation aware location based service under real-
world conditions. In: 4th International symposium on LBS and
teleCartography (LBS2007)
24. Faisal F (2003) Query-by-pointing: algorithms and pointing error
compensation. PhD Thesis, The University of Maine
25. Bederson BB (1995) Audio augmented reality: a prototype
automated tour guide. In: CHI ’95: conference companion on
Human factors in computing systems. ACM Press, New York, pp
210–211
26. Nemirovsky P, Davenport G (1999) Guideshoes: navigation
based on musical patterns. In: CHI ’99: CHI ’99 extended
abstracts on Human factors in computing systems. ACM Press,
New York, pp 266–267
27. Stahl C (2007) The roaring navigator: a group guide for the zoo
with shared auditory landmark display. In: MobileHCI ’07: pro-
ceedings of the 9th conference on human–computer interaction
with mobile devices and services. ACM Press, New York
28. Strachan S, Eslambolchilar P, Murray-Smith R, O’Modhrain S
(2005) gpsTunes—controlling navigation via audio feedback. In:
Mobile human–computer interaction 05
29. Strachan S, Williamson J, Murray-Smith R (2007) Show me the
way to Monte Carlo: density-based trajectory navigation. In:
Proceedings of ACM SIG CHI conference
30. Etter R (2005) Melodious walkabout—implicit navigation with
contextualized personal audio contents. In: Adjunct proceedings
of the third international conference on pervasive computing, vol
191(204)
31. Jones M, Jones S, Bradley G, Warren N, Bainbridge D, Holmes G
(2007) Ontrack: dynamically adapting music playback to support
navigation. Personal Ubiquitous Comput
32. Oliver N, Flores-Mangas F (2006) MPT rain: a mobile, music and
physiology-based personal trainer. In: MobileHCI ’06: proceed-
ings of the 8th conference on human–computer interaction with
mobile devices and services. ACM Press, New York, pp 21–28
33. Elliott GT, Tomlinson B (2006) Personalsoundtrack: context-
aware playlists that adapt to user pace. In: CHI ’06: CHI ’06
extended abstracts on human factors in computing systems. ACM
Press, New York, pp 736–741
34. Titterton DH, Weston JL (2004) Strapdown inertial navigation
technology, 2nd edn. The Institution of Electrical Engineers
35. Seager W (2007) User responses to gps positioning information
on a digital map. In: CHI 2007 Workshop on mobile spatial
interaction
36. Morrison S, Keogh J (2001) Changes in the dynamics of tremor
during goal-directed pointing. Hum Mov Sci 20:675–93
37. Caruso M (1999) Applications of magnetic sensors for low cost
compass systems. Technical report, Honeywell, SSEC
38. Aloi DN, Alsliety M, Akos DM (2007) A methodology for the
evaluation of a gps receiver performance in telematics applica-
tions. Instrum Meas IEEE Trans 56(1):11–24
39. Kording KP, Wolpert D (2004) Bayesian integration in sensori-
motor learning. Nature 427:244–247
40. MacKay DJC (2003) Information Theory, Inference, and Learn-
ing Algorithms. Cambridge University Press available from
http://www.inference.phy.cam.ac.uk/mackay/itila/
41. Steed A (2004) Supporting mobile applications with real-timevisualisation of GPS availability. In: Mobile HCI, pp 373–377
42. Marentakis G, Brewster SA (2005) A comparison of feedback
cues for enhancing pointing efficiency in interaction with
spatial audio displays. In: MobileHCI ’05: proceedings of the
7th international conference on human computer interaction
with mobile devices & services. ACM Press, New York,
pp 55–62
43. Williamson J, Strachan S, Murray-Smith R (2006) It’s a long way
to Monte Carlo: probabilistic display in GPS navigation. In:
MobileHCI ’06. ACM Press, New York, pp 89–96
Pers Ubiquit Comput
123


