AEROSPACE 305W STRUCTURES & DYNAMICS
LABORATORY
Laboratory Experiment #3
Beam Vibration
April 21, 2011
Brett Davis
Lab Section #17
Lab Partners:
Titos Gosalves
Kevin Harrigan
James Trexler
Zachary Watson
Course Instructor: Dr. Stephen Conlon
Lab TA: Kevin Brennan

2
Abstract
The objective of this experiment was to investigate beam vibrations. Specifically: mode shape,
natural frequency and damping ratio were examined. Additionally, four different sensors were used to
collect data in order to determine their usefulness in such applications. The four sensors were and
accelerometer, Laser Doppler Vibrometer (LDV), piezoelectric strain sensor and a strain gauge.
Aerospace structures are often subjected to dynamic forces and vibrations. It is important to understand
the effects of such forces on a structure, as well as the significance of resonance. Resonance frequencies
are always a major design consideration in any field and especially in aerospace engineering. In this
experiment an electromechanical vibration exciter was used to vibrate a long slender beam. The shaker
was not designed to operate at some of the lower frequencies used in the experiment, and may have
contributed to the error at these low frequencies. Other sources of error included signal noise, the
accelerometer being mounted with wax, torsional vibration modes of the beam and resonance frequencies
of the experimental apparatus such as the work bench. The natural frequencies were measured by
adjusting the input frequency until the largest signal oscillations were seen on an oscilloscope. These
frequencies were close to the theoretical values with less than 18% error; most of the error could be due to
the model not accounting for damping in the system. The damping ratios decreased as the natural
frequencies increased as expected. The locations of the nodes closely matched the predicted values. The
frequencies for each vibration mode decreased slightly when the accelerometer was mounted, as it added
mass to the tip of the beam. This was consistent with what was expected and shows the drawback of
mounting a heavier sensor on the specimen as it alters the frequencies of vibration. The natural
frequencies were also determined using spectrum analysis. The natural frequencies determined using this
method were comparable to those found with the oscilloscope, but were obtained much faster. All four
sensors showed high coherence at the natural frequencies. The piezoelectric sensor gave the best results
for phase shifts, which allowed the resonance frequencies to be confirmed to be those of the beam and not
of the experimental setup or from a torsional mode.

3
Results and Discussion
Figure 1 shows the theoretical mode shapes of the beam with no tip mass and the measured node
points. The measured locations of the nodes closely matched the theoretical mode shapes at every
location. The small deviations can be attributed to the error in measure their locations by hand with a tape
measure.
Figure 1. Mode Shapes and Node Locations without Tip Mass
Table 1 shows the measured locations of the nodes for both with and without the tip mass. The addition
of the tip mass caused the nodes to move slightly further down the beam as expected. The only node that
did not move further down the beam was the 2nd
node in mode 4. This node remained 6 inches from the
clamped end of the beam in both configurations.
Table 1. Measured Node Locations
Mode and Configuration 1st Node 2
nd Node 3
rd Node 4
th Node
Mode 1 (No Mass) 0” - - -
Mode 2 (No Mass) 0” 13 1/4” - -
Mode 3 (No Mass) 0” 8 9/16” 14 7/8” -
Mode 4 (No Mass) 0” 6” 10 15/16” 15 1/2”
Mode 1 (Tip Mass) 0” - - -
Mode 2 (Tip Mass) 0” 13 5/8” - -
Mode 3 (Tip Mass) 0” 8 7/8” 15 3/16” -
Mode 4 (Tip Mass) 0” 6” 11 1/4” 15 3/4”

4
The natural frequencies obtained by adjusting the input frequency until the maximum tip deflections
were found were close to the predicted theoretical frequencies. Figure 2 and Table 2 show that the natural
frequencies were close to the theoretical values predicted. The highest error was 17.5% for the natural
frequency in mode 2 without the tip mass. The main source of error was that the theoretical model does
not account for any damping in the system. Mode 1’s natural frequency decreased with the addition of
the tip mass from 13 Hz to 12 Hz. The other three modes decreased as well when the tip mass was added.
This change in frequency is consistent with the theoretical values as can be seen in Table 2.
Figure 2. Measured and Theoretical Natural Frequency
Table 2. Measured and Theoretical Natural Frequencies
Mode Measured
Frequency Hz
Theoretical
Frequency Hz % Error
Mode 1 (No Mass) 13 14.12 -7.93
Mode 2 (No Mass) 73 88.49 -17.50
Mode 3 (No Mass) 225 247.82 -9.21
Mode 4 (No Mass) 433 485.20 -10.76
Mode 1 (Tip Mass) 12 13.32 -9.88
Mode 2 (Tip Mass) 71 83.91 -15.38
Mode 3 (Tip Mass) 217 235.95 -8.03
Mode 4 (Tip Mass) 416 464.15 -10.37

5
The damping ratios of the beam are shown for each natural frequency measured during the experiment
in Figure 3. The Figure shows that the damping ratios decreased as the natural frequency increased. It
can also be seen that the damping ratios for the tip mass configuration were higher than the damping
ratios for the beam without the tip mass. This is consistent with the decreased frequencies for the tip mass
beam. The higher damping values decrease the observed frequency of oscillation. Table 3 gives the
values for the damping ratios at each frequency.
Figure 3. Damping Ratio and Natural Frequency
Table 3. Damping Ratios and Natural Frequency
Mode Frequency (Hz) Damping Ratio
Mode 1 (No Mass) 13 0.0274
Mode 2 (No Mass) 73 0.0248
Mode 3 (No Mass) 225 0.0191
Mode 4 (No Mass) 433 0.0141
Mode 1 (Tip Mass) 12 0.0362
Mode 2 (Tip Mass) 71 0.0289
Mode 3 (Tip Mass) 217 0.0232
Mode 4 (Tip Mass) 416 0.0147
6
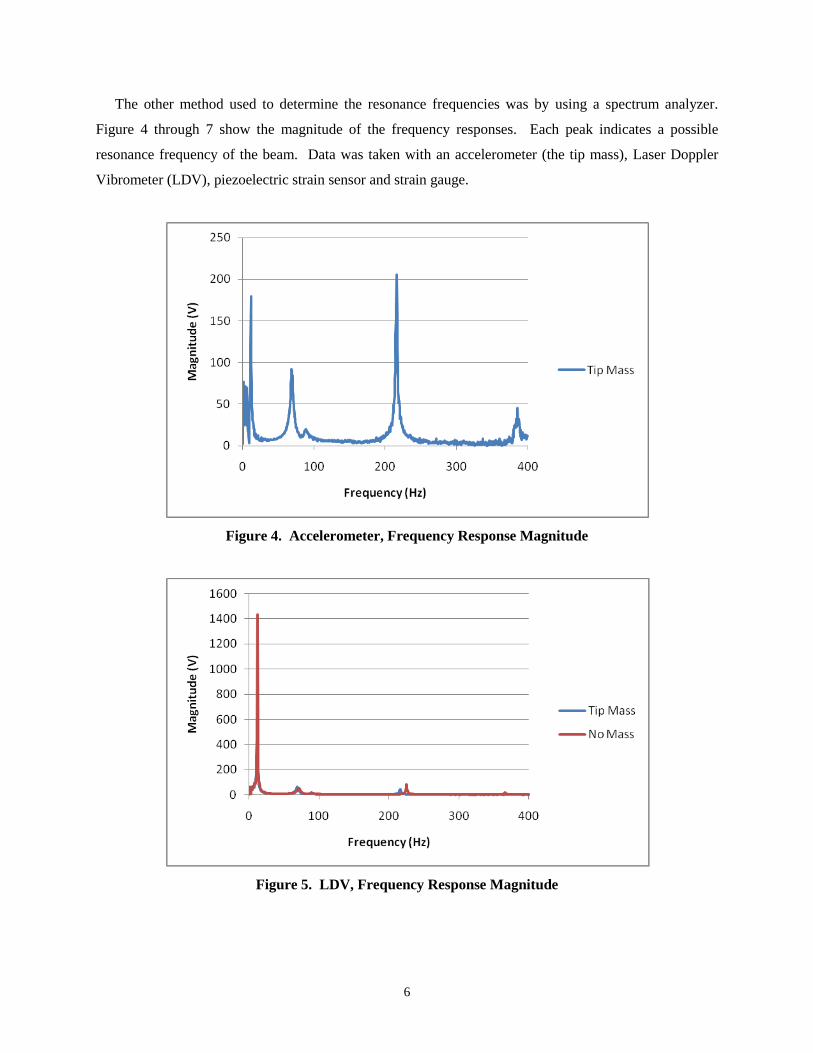
The other method used to determine the resonance frequencies was by using a spectrum analyzer.
Figure 4 through 7 show the magnitude of the frequency responses. Each peak indicates a possible
resonance frequency of the beam. Data was taken with an accelerometer (the tip mass), Laser Doppler
Vibrometer (LDV), piezoelectric strain sensor and strain gauge.
Figure 4. Accelerometer, Frequency Response Magnitude
Figure 5. LDV, Frequency Response Magnitude

7
Figure 6. Piezoelectric Strain Sensor, Frequency Response Magnitude
Figure 7. Strain Gauge, Frequency Response Magnitude

8
The LDV, strain sensor and strain gauge all had high magnitudes at 12.11 Hz for both with and
without the tip mass. Their other peaks were considerably lower, but still distinguishable. At the higher
frequencies, the tip mass beam had slightly lower frequencies; however, at low frequencies the peaks
coincided. In Figure 4, it can be seen that the accelerometer produced higher peaks at high frequencies
compared to the other three sensors, which made determining the resonance frequencies easier. From
Figure 4, it can also be seen that there was an additional peak at 83 Hz. A very small peak can be seen on
Figures 5 through 7 at 85 Hz. This frequency was not seen in the previous method of locating resonance
frequencies. This frequency could be due to a resonance frequency of the table or other apparatus near
the experiment. The LDV without a tip mass had an additional peak at 363 Hz and the accelerometer had
one at 385.5 Hz. These could possibly be the 4th mode’s resonance frequency, but t should be noted that
the frequency response data was for 0 to 400 Hz, therefore the resonance frequency of the 4th modes were
not able to be reliably determined using this method. Future experiments should include a range of
frequencies that captures all resonance frequencies of interest. Table 4 gives the peak frequencies for
each sensor and the resonance frequencies from Table 2.
Table 4. Natural Frequencies
Mode Frequency (Hz)
Methods Accelerometer LDV Pizo Strain
Sensor
Strain
Gauge
Previously
Measured Theoretical
Mode 1 (No Mass) - 12.11 12.11 12.11 13 14.12
Mode 2 (No Mass) - 69.9 68.34 67.97 73 88.49
Mode 3 (No Mass) - 225.8 225 224.22 225 247.82
Mode 4 (No Mass) - - - - 433 485.20
Mode 1 (Tip Mass) 11.72 12.11 12.11 12.11 12 13.32
Mode 2 (Tip Mass) 68.75 70.7 70.7 68.35 71 83.91
Mode 3 (Tip Mass) 216.02 214.8 214 214.06 217 235.95
Mode 4 (Tip Mass) - - - - 416 464.15
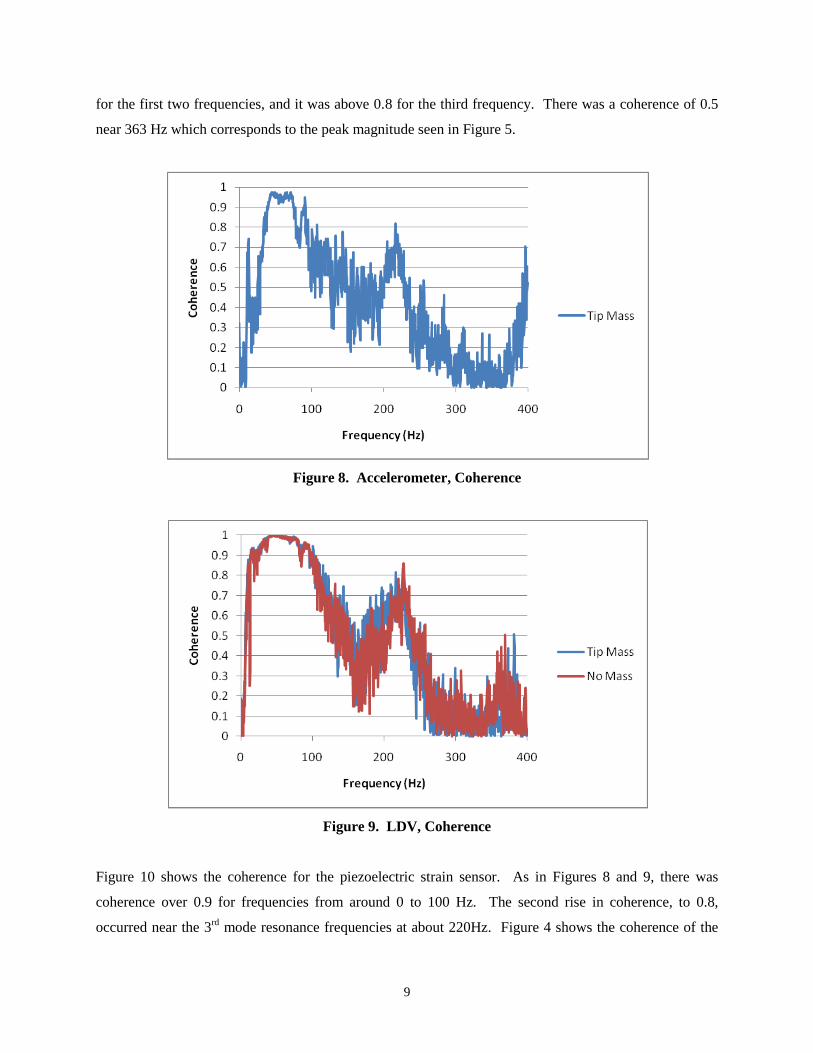
Figures 8 through 11 show the coherence for the signals from the four sensors. Figure 8 shows that
the accelerometer had a coherence of 0.7 at the first resonance frequency around 12 Hz. The coherence
was over 0.9 in the range of the second natural frequency at approximately 70 Hz. There was a large
spike in the coherence at 216 Hz which was the 3rd
natural frequency. The coherence was rising to 0.7 at
400 Hz, which was the end of the data collected and close to the 4th resonance frequency. The LDV also
showed high coherence at the natural frequencies as seen in Figure 9. The LDV coherence was above 0.9
9
for the first two frequencies, and it was above 0.8 for the third frequency. There was a coherence of 0.5
near 363 Hz which corresponds to the peak magnitude seen in Figure 5.
Figure 8. Accelerometer, Coherence
Figure 9. LDV, Coherence
Figure 10 shows the coherence for the piezoelectric strain sensor. As in Figures 8 and 9, there was
coherence over 0.9 for frequencies from around 0 to 100 Hz. The second rise in coherence, to 0.8,
occurred near the 3rd
mode resonance frequencies at about 220Hz. Figure 4 shows the coherence of the

10
strain gauge’s signal. It is consistent with the strain sensor’s coherence, except the strain gauge has a
more dramatic rise in coherence at the resonance frequencies. Figures 8 through 11 show that all four of
the sensors had high coherence at the resonance frequencies indicating they were reliable methods for
determining the resonance frequencies as they all had a strong correlation between the input frequency
and the measured response at the resonance frequencies. The accelerometer, LDV and strain gauge had
the most dramatic rise in coherence at the resonance frequencies. The data with and without the tip mass
were comparable in all cases, with only a small shift in frequency as expected.
Figure 10. Piezoelectric Strain Sensor, Coherence
Figure 11. Strain Gauge, Coherence
0
0.1
0.2
0.3
0.4
0.5
0.6
0.7
0.8
0.9
1
0 100 200 300 400
Co
he
ren
ce
Frequency (Hz)
Tip Mass
No Mass
0
0.1
0.2
0.3
0.4
0.5
0.6
0.7
0.8
0.9
1
0 100 200 300 400
Co
he
ren
ce
Frequency (Hz)
Tip Mass
No Mass
11
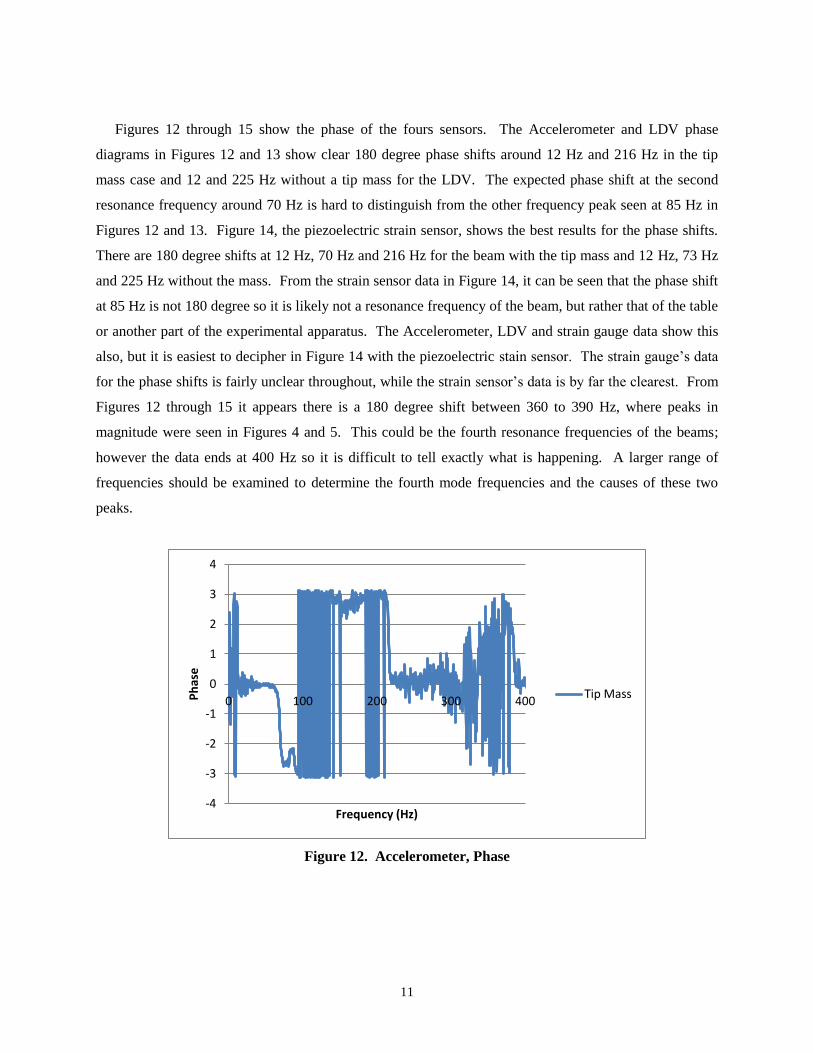
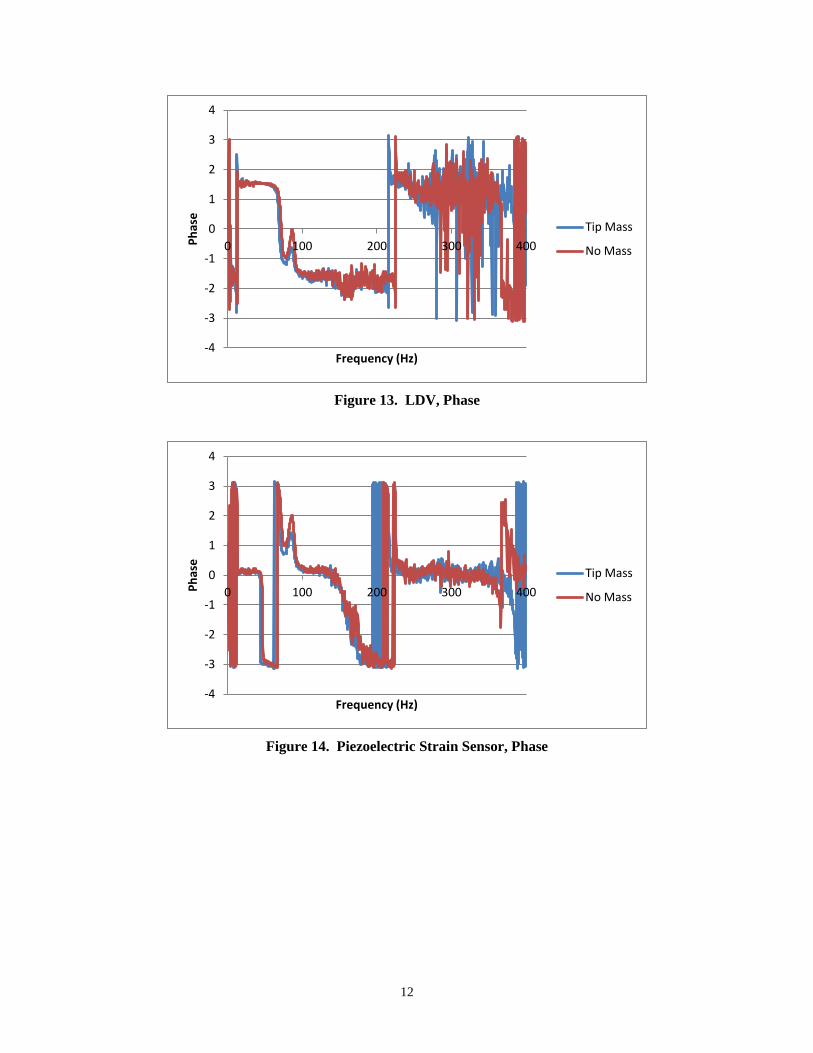
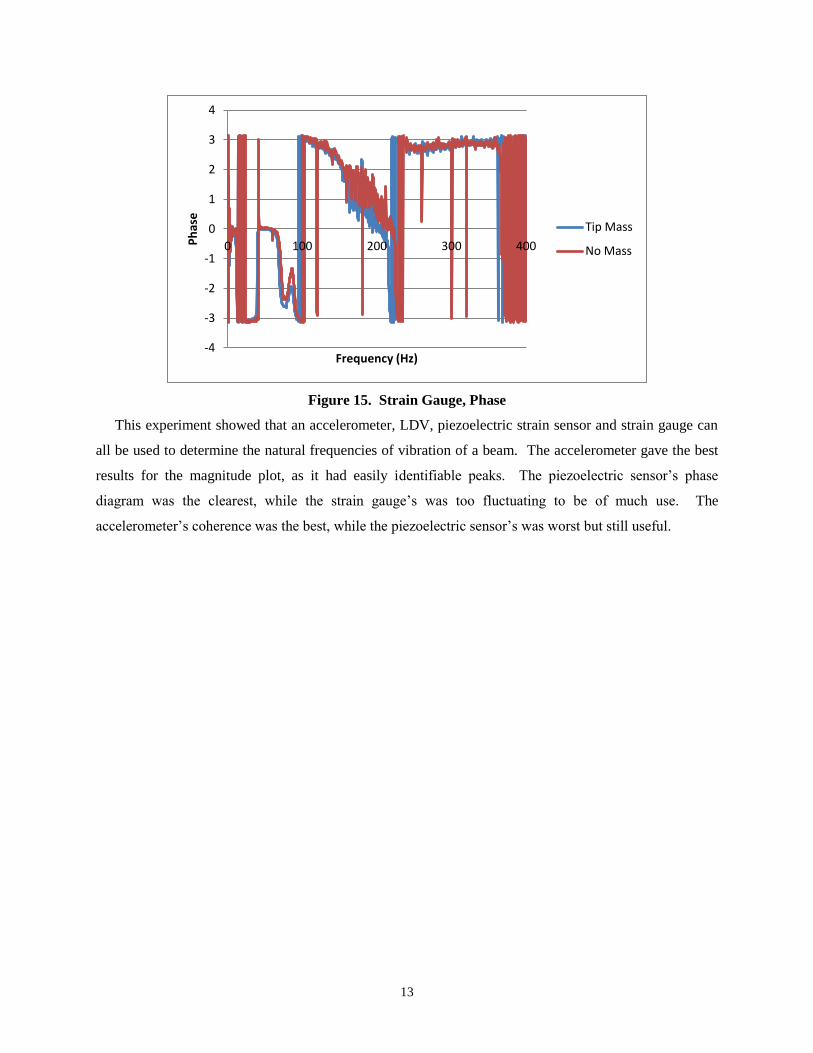
Figures 12 through 15 show the phase of the fours sensors. The Accelerometer and LDV phase
diagrams in Figures 12 and 13 show clear 180 degree phase shifts around 12 Hz and 216 Hz in the tip
mass case and 12 and 225 Hz without a tip mass for the LDV. The expected phase shift at the second
resonance frequency around 70 Hz is hard to distinguish from the other frequency peak seen at 85 Hz in
Figures 12 and 13. Figure 14, the piezoelectric strain sensor, shows the best results for the phase shifts.
There are 180 degree shifts at 12 Hz, 70 Hz and 216 Hz for the beam with the tip mass and 12 Hz, 73 Hz
and 225 Hz without the mass. From the strain sensor data in Figure 14, it can be seen that the phase shift
at 85 Hz is not 180 degree so it is likely not a resonance frequency of the beam, but rather that of the table
or another part of the experimental apparatus. The Accelerometer, LDV and strain gauge data show this
also, but it is easiest to decipher in Figure 14 with the piezoelectric stain sensor. The strain gauge’s data
for the phase shifts is fairly unclear throughout, while the strain sensor’s data is by far the clearest. From
Figures 12 through 15 it appears there is a 180 degree shift between 360 to 390 Hz, where peaks in
magnitude were seen in Figures 4 and 5. This could be the fourth resonance frequencies of the beams;
however the data ends at 400 Hz so it is difficult to tell exactly what is happening. A larger range of
frequencies should be examined to determine the fourth mode frequencies and the causes of these two
peaks.
Figure 12. Accelerometer, Phase
-4
-3
-2
-1
0
1
2
3
4
0 100 200 300 400 Ph
ase
Frequency (Hz)
Tip Mass
12
Figure 13. LDV, Phase
Figure 14. Piezoelectric Strain Sensor, Phase
-4
-3
-2
-1
0
1
2
3
4
0 100 200 300 400 Ph
ase
Frequency (Hz)
Tip Mass
No Mass
-4
-3
-2
-1
0
1
2
3
4
0 100 200 300 400 Ph
ase
Frequency (Hz)
Tip Mass
No Mass
13
Figure 15. Strain Gauge, Phase
This experiment showed that an accelerometer, LDV, piezoelectric strain sensor and strain gauge can
all be used to determine the natural frequencies of vibration of a beam. The accelerometer gave the best
results for the magnitude plot, as it had easily identifiable peaks. The piezoelectric sensor’s phase
diagram was the clearest, while the strain gauge’s was too fluctuating to be of much use. The
accelerometer’s coherence was the best, while the piezoelectric sensor’s was worst but still useful.
-4
-3
-2
-1
0
1
2
3
4
0 100 200 300 400 Ph
ase
Frequency (Hz)
Tip Mass
No Mass


