
IEE/10/380/SI2.589427 1st International Workshop – “Big changes start in small towns” - June 21st 2012 - Brussels
Baseline Emission Inventories: how to
build them?
Michele SansoniArpa Environment Agency of Emilia-Romagna
IEE/10/380/SI2.589427 1st International Workshop – “Big changes start in small towns” - June 21st 2012 - Brussels
2Agenda
• What we will see–GHG Inventories: context and importance–Key concepts for building a BEI–Examples of calculation–Planning an inventory: suggested phases– List of references and supporting tools
• What we will NOT see– other emissions than GHG (e.g. PM, NOx)

IEE/10/380/SI2.589427 1st International Workshop – “Big changes start in small towns” - June 21st 2012 - Brussels
3Context (DPSIR model)
ADAPTATION
MITIGATIONDDRIVERS
(SOURCES)
PPRESSURES(GHG)
SSTATE(ppm GHG in Atmosphere) IIMPACT
(Climate Change)
RRESPONSES
(SEAP and Climate Planning)

IEE/10/380/SI2.589427 1st International Workshop – “Big changes start in small towns” - June 21st 2012 - Brussels
4What is GHG Inventory?
• An organised list of greenhouse gases (GHG)– emitted in a territory (city, region, country…)– occurred in a defined amount of time (day, year, …)– from different sources (anthropogenic, natural)– and related sectors (buildings, transportation, industries, …)
• The Baseline Emission Inventory (BEI)– quantifies the amount of CO2 (or GHG) emitted due to energy
consumption in a territory of a local authority in the baseline year– allows to identify the principal anthropogenic sources of CO2
emissions and to prioritise the reduction measures accordingly
SEAP Guidelines par. 2.2, p.56

IEE/10/380/SI2.589427 1st International Workshop – “Big changes start in small towns” - June 21st 2012 - Brussels
5Why a local inventory?
• Climate change (CC) is a global problem…– … but 80% of energy consumption and CO2 emissions is associated with urban
activity: the fight against climate change will be won or lost in urban areas (CoM).
• Local governments (LG) play a crucial role in mitigating effects of CC– 2007 EU reduction objective for GHG (-20% in comparison to1990 by 2020)
– 2008 Covenant of Mayors for cities that commit to go beyond EU objective
– Europe‘s ambitious targets for cutting GHG will only be met when EU local and
regional authorities pull together and become involved as partners
• LG need to know their emission sources and reduction potentials– for climate action planning, the BEI is not the end, but a means to the end

IEE/10/380/SI2.589427 1st International Workshop – “Big changes start in small towns” - June 21st 2012 - Brussels
6Why inventories are useful?
INFORMINGpolicymakers, stakeholders and
citizens
KNOWINGthe state of the environment, environmental priorities and critical issues of the territory
SUPPORTINGplanning through definition of objectives and actions
EVALUATINGeffects of local plans/policies on the
environment and (environmental) costs and benefits of different strategies
MONITORINGactions chosen to ensure that
adopted strategies are effective in targeting objectives

IEE/10/380/SI2.589427 1st International Workshop – “Big changes start in small towns” - June 21st 2012 - Brussels
7
• Baseline (year)• Boundaries of an inventory
• Scope of emissions• GHG included in an inventory
• GWP coefficients and CO2eq• Sectors (and plants)
• How to quantify emissions
• How to monitor progresses
Key concepts

IEE/10/380/SI2.589427 1st International Workshop – “Big changes start in small towns” - June 21st 2012 - Brussels
8Baseline and baseline year
4400
4600
4800
5000
5200
5400
5600
580019
9019
9119
9219
9319
9419
9519
9619
9719
9819
9920
0020
0120
0220
0320
0420
0520
0620
0720
0820
0920
1020
1120
1220
1320
1420
1520
1620
1720
1820
1920
20
CO
2 eq
(Mil
ton)
Hystoric data
BAU scenario (without Plan)
Target(-20%)
Plan scenario
Baseline (1990)
Effect of Plan
GHG emissions (EU 27)
Baseline year is the year against which the achievements of the
emission reductions in 2020 shall be compared
(SEAP Guidelines par. 2.1, p.56)

IEE/10/380/SI2.589427 1st International Workshop – “Big changes start in small towns” - June 21st 2012 - Brussels
9Boundaries of an inventory
• “Geographical” boundaries– administrative boundaries of the territory of the LG (e.g. urban road transportation:
private and commercial transportation)• “Corporate” boundaries
– functions and facilities under direct/indirect control of the LG (e.g. urban road transportation: municipal fleet)
Community emissions
Government (Corporate) emissions
SEAP Guidelines par. 2.2, p.56

IEE/10/380/SI2.589427 1st International Workshop – “Big changes start in small towns” - June 21st 2012 - Brussels
10Scope of emissions
Direct emissions
Indirect emissions
Other direct emissions
community
corporate
related to fuel combustion in the territory (buildings, transportation, …)(e.g. GHG emissions from private transportation/from municipal fleet)
community
corporate
related to production of electricity,heat, or cold that are consumed in the territory regardless of the location of the production (e.g. GHG emissions from electricity consumptions in community/corporate)
community
corporate
other direct emissions that occur in the territory not related to energy (agriculture, waste management, …) (e.g. CH4 emissions from enteric fermentation/landfill controlled by LG)
SEAP Guidelines par. 2.2, p.56
scope 1
scope 1
scope 2

IEE/10/380/SI2.589427 1st International Workshop – “Big changes start in small towns” - June 21st 2012 - Brussels
11GHG included in an inventory
CO2 CH4 N2O F-gas (SF6, HFC, PFC)
Energy(Combustion,
Exploitation, Distribution, Processing)
Industrial Processes(Chemical reactions, fugitive emissions)
Waste(Landfills, Wastewater,
Incineration)
Agriculture(Animals, Fertilizers,
Land use)
+++
+++
+++
++
++
++
++
++
++
+
+
SectorsGH
G

IEE/10/380/SI2.589427 1st International Workshop – “Big changes start in small towns” - June 21st 2012 - Brussels
12
GHG emissions by gas and sector (EU27, 2009)
Carbon dioxide CO2the main contribution (82% of total)
Energy80% of total emissionsincludes energy industries, energy uses (commercial, residential), transports
Energy 79.3%
Industrial Processes7.0%
Waste 3.2%
Agriculture 10.3%
Solvents 0.2%
CO2 81.6%
F gas 1,8%
N2O 7.7%
CH4 9.0%
Source: EEA greenhouse gas - data viewer (http://www.eea.europa.eu/data-and-maps/data/data-viewers/greenhouse-gases-viewer)

IEE/10/380/SI2.589427 1st International Workshop – “Big changes start in small towns” - June 21st 2012 - Brussels
13Contribution of energy sector (EU27, 2009)
79.3%
30.6%
20.2%
11.5%
9.6%
3.7%
Source: EEA greenhouse gas - data viewer (http://www.eea.europa.eu/data-and-maps/data/data-viewers/greenhouse-gases-viewer)

IEE/10/380/SI2.589427 1st International Workshop – “Big changes start in small towns” - June 21st 2012 - Brussels
14Emissions shares by country(EU27, 2009 %)
DE 19.9%920 M tonnes
Fonte: EEA greenhouse gas - data viewer (http://www.eea.europa.eu/data-and-maps/data/data-viewers/greenhouse-gases-viewer)
IT10.6%
ES8.0%
HU1.4%
BG1.3%
RO2.8%
CY0.2%
Total EU27: 4614.5 M tonnesAverage EU27: 171 M tonnes
LV0.2%
IEE/10/380/SI2.589427 1st International Workshop – “Big changes start in small towns” - June 21st 2012 - Brussels
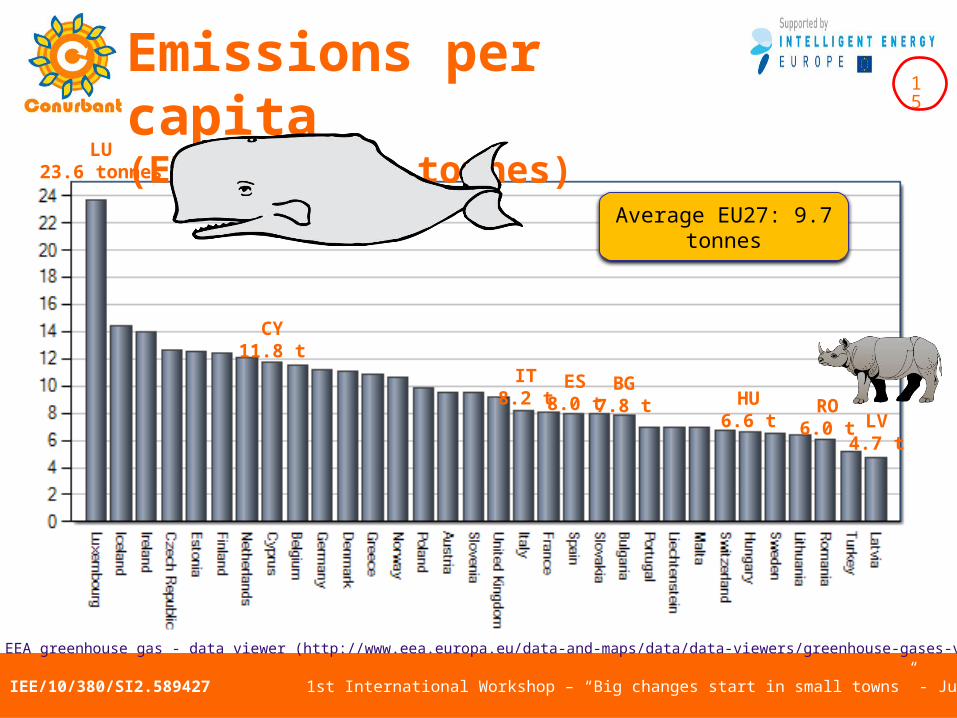
15Emissions per capita(EU27, 2009, tonnes)
LU23.6 tonnes
Fonte: EEA greenhouse gas - data viewer (http://www.eea.europa.eu/data-and-maps/data/data-viewers/greenhouse-gases-viewer)
IT8.2 t
ES8.0 t
CY11.8 t
LV4.7 t
BG7.8 t HU
6.6 tRO6.0 t
Average EU27: 9.7 tonnes

IEE/10/380/SI2.589427 1st International Workshop – “Big changes start in small towns” - June 21st 2012 - Brussels
16Average CO2 per capita
from 1 (Latvia) to about 6 rhinos (or a whale - Luxembourg) per year
Don’t worry, I will reduce my
GHG emissions
for other equivalencies see: Greenhouse Gas Equivalencies Calculatorhttp://www.epa.gov/cleanenergy/energy-resources/calculator.html#results

IEE/10/380/SI2.589427 1st International Workshop – “Big changes start in small towns” - June 21st 2012 - Brussels
17GWP coefficients and CO2e
• GWP – Global Warming Potentials– To measure different GHG coherently the reporting unit to be chosen is “CO2 equivalent
emissions” (CO2e)– CO2e is a standard unit that allow summing different quantities of different GHGs, taking into
account their specific impact on global warming– Standard GWP values for UNFCCC and Kyoto reporting are based on the IPCC SAR (Second
Assessment Report)
1t CO2 1t CO2e1t CH4 21t CO2e1t N2O 310t CO2e1t SF6 23900t CO2e1t HFC or PFC Different gases with different GWP
SEAP Guidelines par. 3.2, p.60

IEE/10/380/SI2.589427 1st International Workshop – “Big changes start in small towns” - June 21st 2012 - Brussels
18Sectors included in an inventory
• YES: inclusion of sector in BEI/MEI is strongly recommended
• YES if in SEAP: sector may be included if the SEAP includes measures for it (not mandatory but recommended to quantitatively show the emission reduction which took place as a result of measures)
• NO: inclusion in BEI/MEI is not recommended
SEAP Guidelines par. 2.2, p.57-58

IEE/10/380/SI2.589427 1st International Workshop – “Big changes start in small towns” - June 21st 2012 - Brussels
19
Sectors included in an inventory (buildings, equipment/facilities and industries)
SEAP Guidelines par. 2.2, p.57-58
NO ETS IndustriesYES other industries if in SEAP
Waste incineration here only if they do NOT produce energy

IEE/10/380/SI2.589427 1st International Workshop – “Big changes start in small towns” - June 21st 2012 - Brussels
20Sectors included in an inventory (transportation)
SEAP Guidelines par. 2.2, p.57-58
Airport and harbourNO from mobile combustion
YES from buildings and facilities
Rail transportationYES urban rail (tram, metro, …)
YES if in SEAP other rail (e.g. regional and long distance)

IEE/10/380/SI2.589427 1st International Workshop – “Big changes start in small towns” - June 21st 2012 - Brussels
21Sectors included in an inventory (other emission sources)
SEAP Guidelines par. 2.2, p.57-58
Other emissions sourcesNO fugitive and process emissions
NO agriculture emissions (fermentation, manure management, fertilizers, …)
Wastewater and waste treatmentYES in in SEAP for emissions not related
to energy (e.g. CH4 from landfills)

IEE/10/380/SI2.589427 1st International Workshop – “Big changes start in small towns” - June 21st 2012 - Brussels
22
Energy plants included in an inventory
• Focus of the CoM: demand (consumption) side• Local Electricity Production (LPE) concept and criteria for inclusion
of plants: the plant/unit is not included in the EU Emissions Trading Scheme (ETS) the plant/unit is ≤ 20MWfuel as thermal energy input in the case of fossil fuel and
biomass combustion plants or ≤ 20MWe as nominal output in the case of other renewable energy plants (e.g. wind
or solar) e.g. Waste incineration producing energyYES if in SEAP for
electricityYES for heat/cold

IEE/10/380/SI2.589427 1st International Workshop – “Big changes start in small towns” - June 21st 2012 - Brussels
23
Decision tree and identification table
1
1b
2
1a

IEE/10/380/SI2.589427 1st International Workshop – “Big changes start in small towns” - June 21st 2012 - Brussels
24
15%
10%
31%
24%
5%
12%3%
Residential Tertiary IndustryTransport Waste Energy ProductionMunicipality
Sectors included (sample report)
Residential 1.004.310
Emissions(tCO2e)Sector
Tertiary 669.540
Industry 2.031.343
Transport 1.619.189
Waste 320.856
Energy Production 827.276
Municipality 224.236
Municipality emissions usually have a little weight on total emissions

IEE/10/380/SI2.589427 1st International Workshop – “Big changes start in small towns” - June 21st 2012 - Brussels
25How to quantify emissions
It is necessary to estimate emissions on the basis of a relation between an activity indicator of the source and the emission itself -> emission factor
Ei – emissionof gas “i”(tons/year), i.e. the quantity
of gas “i” (in tons) generated and emitted by a given activity (e.g. tons
of CO2/year from energy production)
A – activity indicatordescribes the activity that emits GHG. e.g. unit of energy used for energy production
(MWh/year; m3/year; litre/year)
FEi – emission factor
coefficient whichquantify the emission of gas “i” per unit of activity A (e.g. tonCO2/MWh; tonCO2/m3;
tonCO2/litre)Ei = A x FEi

IEE/10/380/SI2.589427 1st International Workshop – “Big changes start in small towns” - June 21st 2012 - Brussels
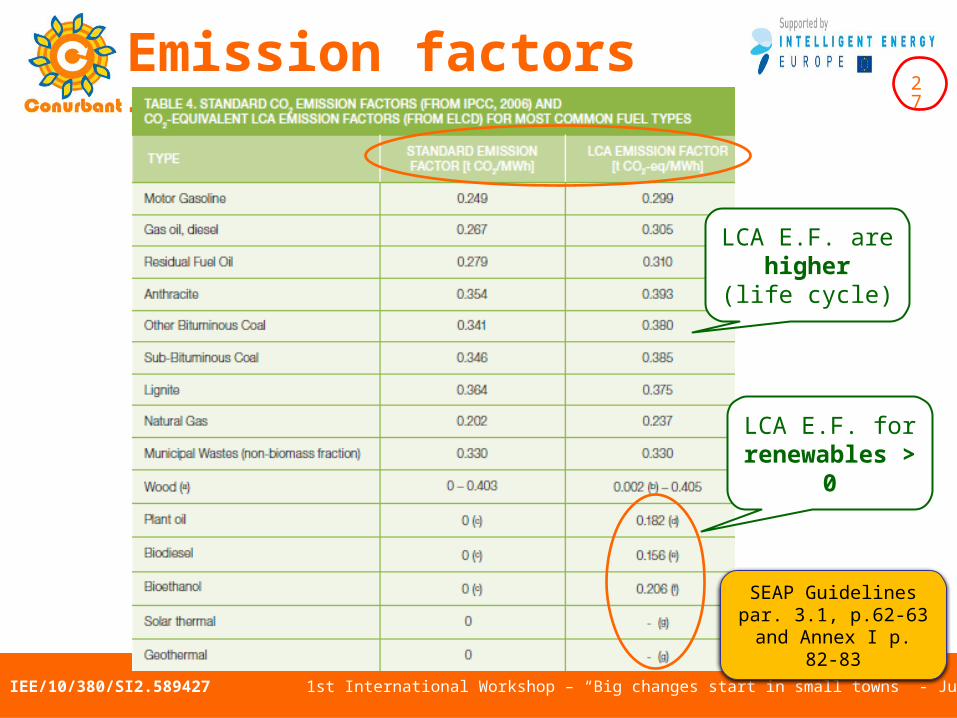
26Emission factors
• Standard– in line with the IPCC principles, cover all CO2e from energy
consumption (direct and indirect emissions)– based on the carbon content of each fuel, like in GHG
national inventories (UNFCCC and Kyoto protocol)– emissions from renewable energy = 0
• LCA (Life Cycle Analysis)– take into consideration the overall life cycle of the energy
carrier from supply chain (exploitation, transport, processing…) to final combustion
– emissions from renewable energy > 0
SEAP Guidelines par. 3.1, p.59-60
IEE/10/380/SI2.589427 1st International Workshop – “Big changes start in small towns” - June 21st 2012 - Brussels
27Emission factors for fuels
SEAP Guidelines par. 3.1, p.62-63 and Annex I p. 82-83
LCA E.F. are higher
(life cycle)
LCA E.F. for renewables > 0

IEE/10/380/SI2.589427 1st International Workshop – “Big changes start in small towns” - June 21st 2012 - Brussels
28
Emission factors for consumed electricity
• CO2 from EU or national generation of electricity
• Energy mix used (yearly)• Calculation of local EF
SEAP
Gui
delin
es p
ar.
3.4.
1, p
. 63;
3.4
4 p.
66

IEE/10/380/SI2.589427 1st International Workshop – “Big changes start in small towns” - June 21st 2012 - Brussels
29Calculation with EF: examples
Emissions from municipal buildings (Italy)Activity data (energy consumptions)• Aelectr=200 MWh electricity• Anatgas= 30,000 m3 natural gas;• Agasoil= 20 tons of gasoil
Find EF:• EFelectricity= 0.483 tCO2/MWh• EFnatgas= 0.202 tCO2/MWh• EFgasoil= 0.267 tCO2/MWh
Quantify emissions (E=A*EF)• Eelectr=Aelectr*EFelectr = 200 * 0.483 =96.6 tCO2• Eelectr=Anatgas*EFnatgas = 291 * 0.202 =58.8 tCO2• Eelectr=Agasoil*EFgasoil = 230 * 0.267 =61.4 tCO2
n.b. calculations are
easy, but we should
pay attention to
different units of
measure and different
EF (see SEAP
Guidelines Annex I p.
82)
Convert fuels in MWh• 30,000 m3 natural gas ->
291 MWh• 20 tons of gasoil-> 230
MWh

IEE/10/380/SI2.589427 1st International Workshop – “Big changes start in small towns” - June 21st 2012 - Brussels
30
• Top-down– estimation less accurate– local data not available or final
use do not justify survey of detailed data
– budget constraints: cost to collect data is too high
– time constraints: time required for data collection not compatible with deadlines
• Bottom-up– estimation more accurate– high level of resources required
(time, cost, people) to collect data
Top-down TD vs. Bottom-up BU
BOTTOM-UP (BU)(from a single emission or subset to a local scale -> scale up or summation)
TOP-DOWN (TD)(from a larger spatial scale to
a local scale with a scaling factor –> scale down)
often both used in the same BEI

IEE/10/380/SI2.589427 1st International Workshop – “Big changes start in small towns” - June 21st 2012 - Brussels
31TD and BU methodology
To obtain activity data at local level (starting from known data at larger or smaller level) scaling factors are needed (chosen for their high degree of correlation to variations in activity data)
FACTORy
FACTORxDATAy = * DATAx
________
data at local levelwe must estimate
data at larger/smaller levelwe must know
scaling factors we must know (related to both data)

IEE/10/380/SI2.589427 1st International Workshop – “Big changes start in small towns” - June 21st 2012 - Brussels
32Top-down example
• TD: scaling down residential energy consumption in the region to obtain residential consumption in the city– Datay: residential energy consumption in the city -> REScity = ?– Datax: residential energy consumption in the region -> RESregion= 20,000,000 MWh– Factory: population in the city POPcity = 300,000 inhabitants– Factorx: population in the region POPregion = 3,000,000 inhabitants
REScity= POPcity/POPregion * RESregionREScity = 300,000/3,000,000 * 20,000,000REScity = 1/10 * 20,000,000
REScity = 2,000,000 MWh
n.b. other
possible scaling
factor is volume
of buildings

IEE/10/380/SI2.589427 1st International Workshop – “Big changes start in small towns” - June 21st 2012 - Brussels
33Bottom-up example
• BU: scaling up residential consumption from a survey upon a sample set of buildings to obtain residential consumption in the city– Datay: residential energy consumption in the city -> REScity = ?– Datax: resid. energy consumption in the sample set -> RESsample= 35,000 MWh– Factory: population in the city POPcity = 300,000 inhabitants– Factorx: population in the sample set POPsample = 6,000 inhabitants
REScity= POPcity/POPsample * RESsampleREScity = 300,000/6,000 * 35,000REScity = 50 * 35,000
REScity = 1,750,000 MWhn.b. results from TD
and BU are different,
but they should have
the same order of
magnitude

IEE/10/380/SI2.589427 1st International Workshop – “Big changes start in small towns” - June 21st 2012 - Brussels
34Tiers
• International guidelines (e.g. IPCC) identify 3 possible levels of methodological complexity (“tiers”)– hierarchical structure– higher tier methods are generally considered to be more accurate (in
terms of methodology, activity data A and/or emission factors EF)
Tier 2similar to tier 1 (more
accuracy), but based on country-specific (or
local) EF
Tier 1the simplest (less accurate), readily
available statistical information for A and
standard values of EF
Tier 3facility level data and/or
complex models to calculate emissions, but
high accuracy
ACCURACY
SIMPLICITY

IEE/10/380/SI2.589427 1st International Workshop – “Big changes start in small towns” - June 21st 2012 - Brussels
35How to monitor progresses
0%200%
1990
1991
1992
1993
1994
1995
1996
1997
1998
1999
2000
2001
2002
2003
2004
2005
0%200%
1990
1991
1992
1993
1994
1995
1996
1997
1998
1999
2000
2001
2002
2003
2004
2005
850
900
950
1000
1050
1100
1150
1200
1250
1996
1997
1998
1999
2000
2001
2002
2003
2004
2005
2006
2007
2008
2009
2010
2011
2012
2013
2014
2015
Provincia Forlì-Cesena Provincia Forlì-Cesena (BAU) Provincia Forlì-Cesena (Piano)
Effettodel PEAP
a
a
b
b
d
d
f
f g
g
GHG
time

IEE/10/380/SI2.589427 1st International Workshop – “Big changes start in small towns” - June 21st 2012 - Brussels
36Planning an inventory: suggested phases
Adapted from: “Phases for preparing an inventory”, ANPA 2001 (in italian) and SEAP Guidelines
Planning
Data collection
Elaboration and Control

IEE/10/380/SI2.589427 1st International Workshop – “Big changes start in small towns” - June 21st 2012 - Brussels
37Planning activities
Available resources
Define objectives
Planning actvities
Identification of needed data
BaselineBoundariesGasesSectorsMethodological approachesMonitoring
Existing inventoriesTools and methodologiesTimeStaff
Procedure for data collectionIdentification of emission sourcesProcedure for emission calculation/estimation

IEE/10/380/SI2.589427 1st International Workshop – “Big changes start in small towns” - June 21st 2012 - Brussels
38Data collection
Data collection
Data sources (energy suppliers, consumers, national/regional statistics)Activity indicatorsEmission factors (standard, LCA)Scaling factors for TD and BU (proxy variables)
Available resources
Define objectives
Planning actvities
Identification of needed data
BaselineBoundariesGasesSectorsMethodological approachesMonitoring
Existing inventoriesTools and methodologiesTimeStaff
Procedure for data collectionIdentification of emission sourcesProcedure for emission calculation

IEE/10/380/SI2.589427 1st International Workshop – “Big changes start in small towns” - June 21st 2012 - Brussels
39Elaboration and Control
EMISSION CALCULATION
Quality Assurance and Quality Control
REPORTING and PUBLICATION of
RESULTS(basis for SEAP
planning activities and for next MEI)
Elaboration and Control
Data collection
Data sources (energy suppliers, consumers, national/regional statistics)Activity indicatorsEmission factors (standard, LCA)Scaling factors for TD and BU (proxy variables)

IEE/10/380/SI2.589427 1st International Workshop – “Big changes start in small towns” - June 21st 2012 - Brussels
40
Supporting tools and methodologies to build a BEI
• BALANCE project (Ecofys in the framework of BALANCE)• Bilan carbone (ADEME)• California Climate Action Registry Project Protocols• DESGEL program energetic diagnostic and climate change emissions accountability (Barcelona Provincial Council)• ECO2Region (Climate Alliance)• Global Protocol for Community-Scale GHG Emissions – GPC (C40 Cities Climate Leadership Group and ICLEI in collaboration
with: World Resources Institute, World Bank, UNEP, and UN-HABITAT) • GRIP tool (Tyndall centre Manchester)• INEMAR (Inventario Emissioni Aria - Regione Lombardia e Regioni Bacino Padano)• International Local Government GHG emission Analysis Protocol (ICLEI)• LAKS Inventory tool (Local Accountability for Kyoto Goals Life+ project) www.municipio.re.it/laks• Local and regional CO2 emissions estimates for 2005-2009 for the UK (Dept of Energy and Climate Change)• Local Government Operations Protocol For the quantification and reporting of greenhouse gas emissions inventories (California
Air Resources Board, California Climate Action Registry, ICLEI, The Climate Registry)• The “CO2 Grobbilanz” and the “EMSIG” tool (Klimabündnis Österreich, Energieagentur der Regionen)• The CO2 Calculator (Danish National Environmental Research Institute, Local Government Denmark and COWI)• The Greenhouse Gas Protocol: A Corporate Accounting and Reporting Standard (World Business Council for Sustainable
Development and World Resources Institute )• The Greenhouse Gas Protocol: The GHG Protocol for Project Accounting (WRI/WBCSD)

IEE/10/380/SI2.589427 1st International Workshop – “Big changes start in small towns” - June 21st 2012 - Brussels
41
Suggestions for further reading…
• ARPA (2009) International review - Tools and methodologies for GHG accounting.
http://www.municipio.re.it/sottositi/Laks.nsf/PESIdDoc/450302B1A306EBEBC12575E80059FE39/$file/report_arpa_international_review.pdf
• Bader and Bleischwitz (2009) Comparative analysis of local GHG inventory tools.
http://www.municipio.re.it/sottositi/Laks.nsf/PESIdDoc/450302B1A306EBEBC12575E80059FE39/$file/GHG_inventories_report.pdf
• EEA (2009) EMEP/EEA air pollutant emission inventory guidebook 2009. www.eea.europa.eu/publications/emep-eea-emission-
inventory-guidebook-2009
• ICLEI (2009) International Local Government GHG Emissions Analysis Protocol. www.iclei.org/ghgprotocol
• ICLEI (2012) Global Protocol for Community-Scale GHG Emissions – GPC. www.ghgprotocol.org/city-accounting
• IPCC (2006) Guidelines for national greenhouse gas inventories. www.ipcc-nggip.iges.or.jp/public/2006gl/index.html
• ISPRA (2010) National Inventory Report 2010 - Italian GHG Inventory 1990-2008.
http://unfccc.int/files/national_reports/annex_i_ghg_inventories/national_inventories_submissions/application/zip/ita-2010-nir-22jul.zip
• JRC (2010) How to Develop a Sustainable Energy Action Plan (SEAP). www.eumayors.eu/IMG/pdf/seap_guidelines_en-2.pdf
• JRC (2009) Methodologies and tools for the development and implementation of SEAPs.
www.eumayors.eu/IMG/pdf/001_Report_I.pdf

IEE/10/380/SI2.589427 1st International Workshop – “Big changes start in small towns” - June 21st 2012 - Brussels
42Conclusions
• YOU CAN build a BEI– although at first it seems impossible …– robust methodologies and supporting tools exist– cooperation is fundamental (supporting structures, universities, public and private
agencies)• ORGANISATION is the key
– develop process and procedures– team work (different data, different persons involved)– continuous improvement
• BEI is the basis for achieving a wider planning process– SEAP and Monitoring Emission Inventory (of course)– Energy management (energy saving -> emissions reductions-> money saving)– Energy Planning, Climate Change Planning (Adaptation)

IEE/10/380/SI2.589427 1st International Workshop – “Big changes start in small towns” - June 21st 2012 - Brussels
Thank you for your attentionMichele Sansoni


