Western Australia’s trade and economic development with Asia
BANKWEST CURTIN ECONOMICS CENTRE
Focus on Western Australia Report Series, No. 5September 2015
TIGER, TIGER, BURNING BRIGHT?

About the Centre
The Bankwest Curtin Economics Centre is an independent economic and social research organisation located within the Curtin Business School at Curtin University. The centre was established in 2012 through the generous support from Bankwest (a division of the Commonwealth Bank of Australia), with a core mission to examine the key economic and social policy issues that contribute to the sustainability of Western Australia and the wellbeing of WA households.
The Bankwest Curtin Economics Centre is the first research organisation of its kind in Western Australia, and draws great strength and credibility from its partnership with Bankwest, Curtin University and the Western Australian government.
The centre brings a unique philosophy to research on the major economic issues facing the state. By bringing together experts from the research, policy and business communities at all stages of the process – from framing and conceptualising research questions, through the conduct of research, to the communication and implementation of research findings – we ensure that our research is relevant, fit for purpose, and makes a genuine difference to the lives of Australians, both in WA and nationally.
The centre is able to capitalise on Curtin University’s reputation for excellence in economic modelling, forecasting, public policy research, trade and industrial economics and spatial sciences. Centre researchers have specific expertise in economic forecasting, quantitative modelling, micro-data analysis and economic and social policy evaluation. The centre also derives great value from its close association with experts from the corporate, business, public and not-for-profit sectors.

Contents
TIGER, TIGER, BURNING BRIGHT? Western Australia’s trade and economic development with Asia
i
List of figures ii
List of tables iii
Foreword iv
Executive summary Key Findings
vv
Introduction 1
A brief history of WA trade From sheep’s back to resource boom
WA’s contribution to Australian tradeDutch disease?
4 6
11
WA’s international trade profile What do we sell?
WA trading patterns over time Who do we sell to?
17 18 21
Trade and new business opportunities A tale of two markets Established and emerging trade sectors
A focus on qualityWA as a ‘knowledge economy’ – translating innovation to exportCountry trade partnerships
26 28 32 33 34
WA trade and regional development WA regions and their diversity WA regions: Workforce and nature of businesses
WA regions and international tradeOptimising WA regional trade and economic development
40 41 47 49
WA’s trading environment – benefits and barriersEducation services in WA: Education as an attractor to international business and investment
Barriers to WA regional trade To market, to market...
52
54 55
WA trade strategy and policy What do Free Trade Agreements mean for WA?
Western Australia Pty – how are we selling the State?
58 59
Summary and conclusions 62
Glossary 66
References 70

List of figures
ii
Figure 1 Australian export shares by states/territories: 2006-07 and 2013-14 6Figure 2 Net exports as a percentage of GSP/GNP, WA and Australia: 1990 to 2014 8Figure 3 Exports by states and territories, 1990 to 2014: national share and
exports per $1bn of GSP9
Figure 4 Currency exchange rates and Trade Weighted Index for Australia: 1990 to 2015
12
Figure 5 Share of capital expenditure in Western Australia, by industry category: 1989 to 2015
12
Figure 6 Value of export sales in Western Australia by commodity group: 2006-07 to 2013-14 ($m exports per $bn of GSP)
13
Figure 7 Share of goods and services exports from Western Australia by commodity group: 2013-14
16
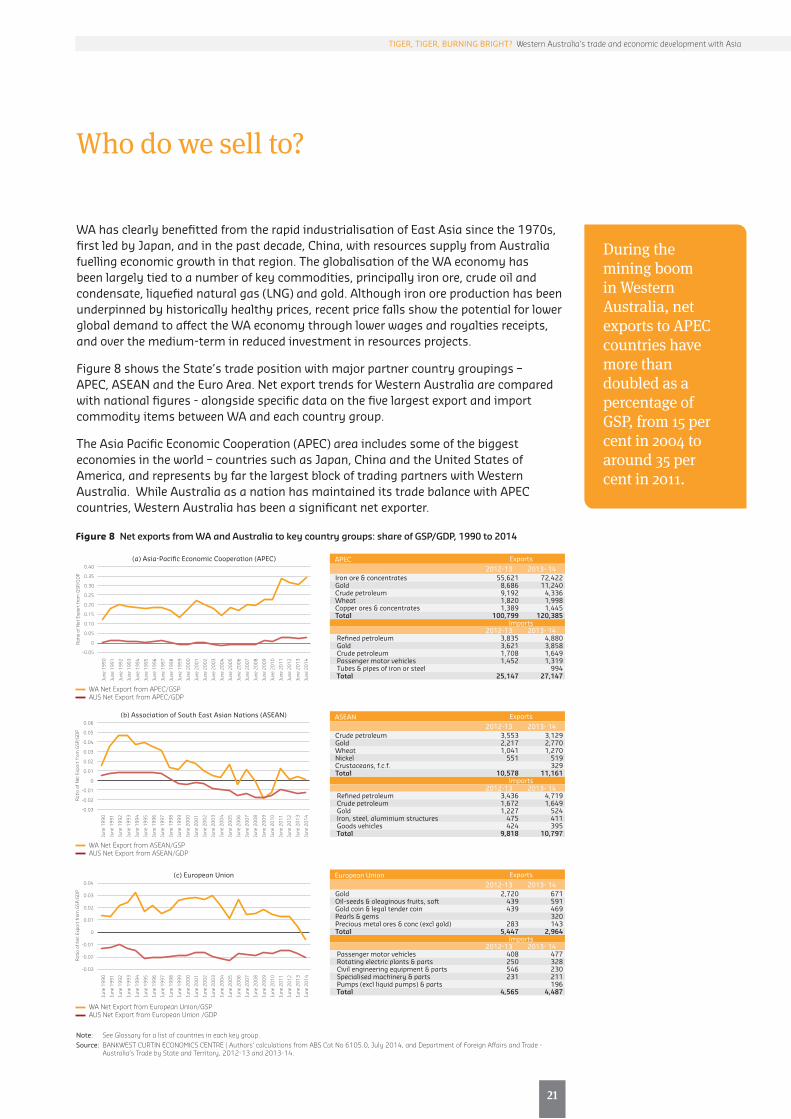
Figure 8 Net exports from WA and Australia to key country groups: share of GSP/GDP, 1990 to 2014
21
Figure 9 Total net exports from Western Australia by Asian country partner: 1999-2000
23
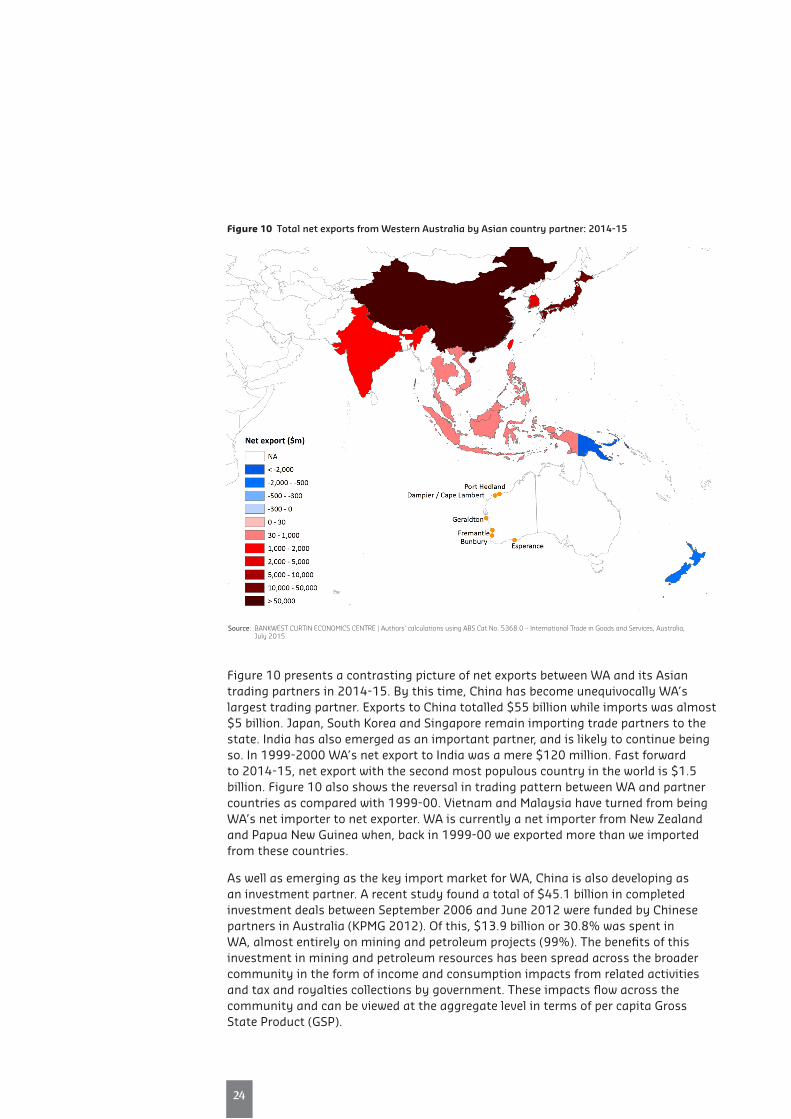
Figure 10 Total net exports from Western Australia by Asian country partner: 2014-15
24
Figure 11 Real annual GDP growth, advanced and emerging Asian economies: 2008 to 2016
27
Figure 12 Export sales for major commodity groups, by state/territory: value of exports and national share, 2006 to 2014
29
Figure 13 Exports and imports from WA to selected Asian countries: 1990 to 2015
35
Figure 14 The regions of Western Australia and principal industries 40
3
iii
TIGER, TIGER, BURNING BRIGHT? Western Australia’s trade and economic development with Asia
List of tables
Table 1 Composition of the West Australian economy, by industry sector: 1990-91 to 2013-14
5
Table 2 Value of Australian merchandise exports by states/territories: 2006-07 to 2013-14
7
Table 3 Value of exports from Western Australia, by commodity/service group: 2006-07 to 2013-14
17
Table 4 Value of imports to Western Australia, by commodity/service group: 2006-07 to 2013-14
19
Table 5 Net exports and total trade in Western Australia, by selected commodity/service group: 2006-07 and 2013-14
20
Table 6 Real GDP growth – key countries and areas: 2008 to 2014 (actual) and 2015-16 (forecast)
26
Table 7 Regional WA workforce by industry: 2011 42Table 8 Number of Australian businesses by industry in regional WA: 2014 43Table 9 Number of large Australian businesses by industry in regional WA: 2014 45Table 10 Number of small Australian businesses by industry in regional WA: 2014 46Table 11 Value of mining production in regional WA: 2006-14 47Table 12 Western Australia exports by major regional ports: 2011-12 and 2012-13 48Table 13 Western Australia trade volume by major regional ports: 2013-14 48Table 14 International students in WA by sector: 2012-2014 52Table 15 International student enrolments in higher education by top 10
nationalities: 2012-1453

Foreword
iv
Professor Alan DuncanDirector, Bankwest Curtin Economics CentreCurtin Business School, Curtin University
There is a general sense of unease with the recent slowdown in China’s economic growth. Large businesses and the State’s finances have suffered as a result. But is China the ‘be all and end all’ of the focus on Western Australia trade policies and objectives? What new trading opportunities with other Asian countries exist for WA businesses, and how well positioned are the State’s businesses to expand the scale and composition of its trade with Asian partners?
Tiger, Tiger, Burning Bright? Western Australia’s trade and economic development with Asia is the fifth report in the Bankwest Curtin Economics Centre’s Focus on Western Australia series. The report examines a number of key questions relating to the composition and direction of trade by West Australian businesses and consumers. These include issues that affect current trading patterns with Asia, and opportunities for enhanced future trade and strengthened economic relationships with China, Japan and other countries in the Asia-Pacific and Indo-Pacific regions.
International trade has a role to play in strengthening industrial sectors within the WA economy – including, but also extending beyond, the mining and resources sectors. Trade is also a critical factor in supporting a diversification of the strengths in the WA economy.
The report reminds us that as important as China is to the economic fortunes of the state, it is by no means the state’s only export destination. To focus solely on China would be myopic. There are new partnerships to forge, emerging industries to support, infrastructure bottlenecks to overcome and the WA ‘brand’ to promote.
The report also examines the question of trade and economic development from the perspective of WA’s regions. It highlights important barriers that regional businesses and residents, together with policymakers, have overcome in their pursuit of efficiency gains and growth. It also seeks to explore what strategies the regions can adopt to further promote their own trade with country partners in the Asia-Pacific region, and develop new economic opportunities to tap into global export markets.
We thank you for your interest in the work of the Bankwest Curtin Economics Centre, and hope you will find this ‘Focus on Western Australia’ report on WA’s trade and economic development with Asia informative and illuminating.
Executive summary
Key findings
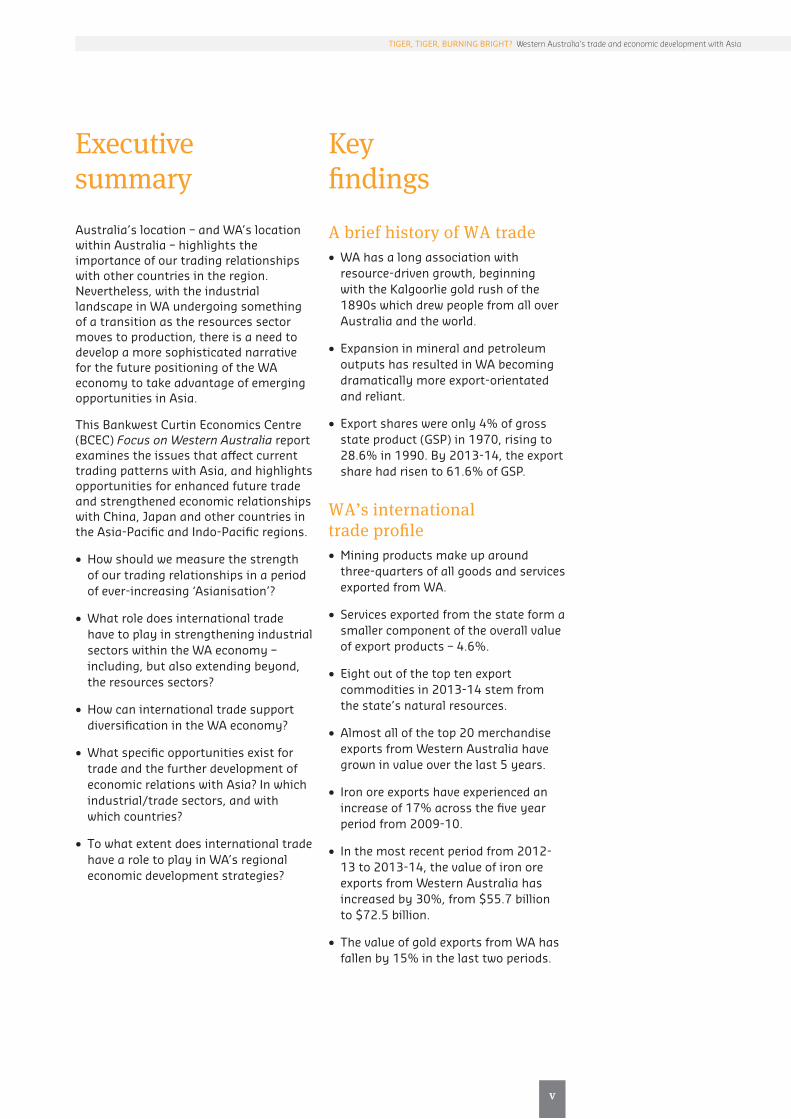
Australia’s location – and WA’s location within Australia – highlights the importance of our trading relationships with other countries in the region. Nevertheless, with the industrial landscape in WA undergoing something of a transition as the resources sector moves to production, there is a need to develop a more sophisticated narrative for the future positioning of the WA economy to take advantage of emerging opportunities in Asia.
This Bankwest Curtin Economics Centre (BCEC) Focus on Western Australia report examines the issues that affect current trading patterns with Asia, and highlights opportunities for enhanced future trade and strengthened economic relationships with China, Japan and other countries in the Asia-Pacific and Indo-Pacific regions.
• Howshouldwemeasurethestrengthof our trading relationships in a period of ever-increasing ‘Asianisation’?
• Whatroledoesinternationaltradehave to play in strengthening industrial sectors within the WA economy – including, but also extending beyond, the resources sectors?
• Howcaninternationaltradesupportdiversification in the WA economy?
• Whatspecificopportunitiesexistfortrade and the further development of economic relations with Asia? In which industrial/trade sectors, and with which countries?
• Towhatextentdoesinternationaltradehave a role to play in WA’s regional economic development strategies?
A brief history of WA trade• WAhasalongassociationwith
resource-driven growth, beginning with the Kalgoorlie gold rush of the 1890s which drew people from all over Australia and the world.
• Expansioninmineralandpetroleumoutputs has resulted in WA becoming dramatically more export-orientated and reliant.
• Exportshareswereonly4%ofgrossstate product (GSP) in 1970, rising to 28.6%in1990.By2013-14,theexportsharehadrisento61.6%ofGSP.
WA’s international trade profile• Miningproductsmakeuparound
three-quarters of all goods and services exported from WA.
• Servicesexportedfromthestateformasmaller component of the overall value ofexportproducts–4.6%.
• Eightoutofthetoptenexportcommodities in 2013-14 stem from the state’s natural resources.
• Almostallofthetop20merchandiseexports from Western Australia have grown in value over the last 5 years.
• Ironoreexportshaveexperiencedanincreaseof17%acrossthefiveyearperiod from 2009-10.
• Inthemostrecentperiodfrom2012-13 to 2013-14, the value of iron ore exports from Western Australia has increasedby30%,from$55.7billion to$72.5billion.
• ThevalueofgoldexportsfromWAhasfallenby15%inthelasttwoperiods.
5
v
TIGER, TIGER, BURNING BRIGHT? Western Australia’s trade and economic development with Asia

Key findings (continued)
• Theexportvalueofpearlsandgemsincreasedby250%betweenthelasttwo periods.
• MerchandiseandservicesimportedtoWA have grown at a faster pace than exports. Overall, merchandise imports increasedby81%acrossthefiveyearperiod to 2013-14, and service imports by 21 per cent.
• Thevalueofexportshasexceededthevalue of imports across the majority of commodities traded between WA and other countries.
• Ironoreremainsthehighestvaluetraded commodity, with two-way trade valuedat$77.5billion,increasingby17 per cent since 2009-10.
• Servicestradedrevealmoremixedresults, with export values exceeding import values for the top five services in both 2009-10 and 2013-14. However, the remaining services traded show Western Australia importing a higher value of services than what the state exports.
Who do we sell to? • DuringtheminingboominWestern
Australia, net exports to APEC countries more than doubled as a percentage of GSP, from 15 per cent in 2004 to around 35 per cent in 2011.
• WesternAustraliaissettoremainastrong net exporter to APEC countries with$120millioninexportscomparedwitharound$27millioninimportsfor2013-14.
• TradebetweenWAandASEANcountries is principally on primary goods, mostly resources and wheat.
• Australiahasshiftedfromanetexporter with ASEAN countries before the start of the millennium to a net importer now.
• NetexportsfromWAtoEuropeanUnion countries have declined as a share of gross state product since the GFC, and particularly since 2013 with a significant fall in gold exports.
Trade and new business opportunities• Intheshort-to-mediumterm,the
value and prospective increases in production volume of WA’s main export commodities depend upon the continued health of China and other emerging markets in Asia, but also the ability of WA to remain competitive as a destination for foreign direct investment both in established and new industry sectors.
• Japan’sfuturegrowthtrajectoryshould provide some support for key WA commodity products such as iron ore and LNG exports.
• China’sexpansionhasbecomeincreasingly uncertain due to changes in senior political leadership, currency pressures and rising levels of credit, particularly in housing and infrastructure, two areas which are crucial to China’s continued support for the expansion of iron ore and LNG exports.ThecurrentIMFassessmentindicates that China will see reasonably strong growth over at least the next two years, albeit at reduced levels to that seen in the middle of the last decade.
• WAhasanaturaladvantageinservicing global demand for high quality produce, being well situated in relation to time-zones and proximity to most of the Asian countries.
vi
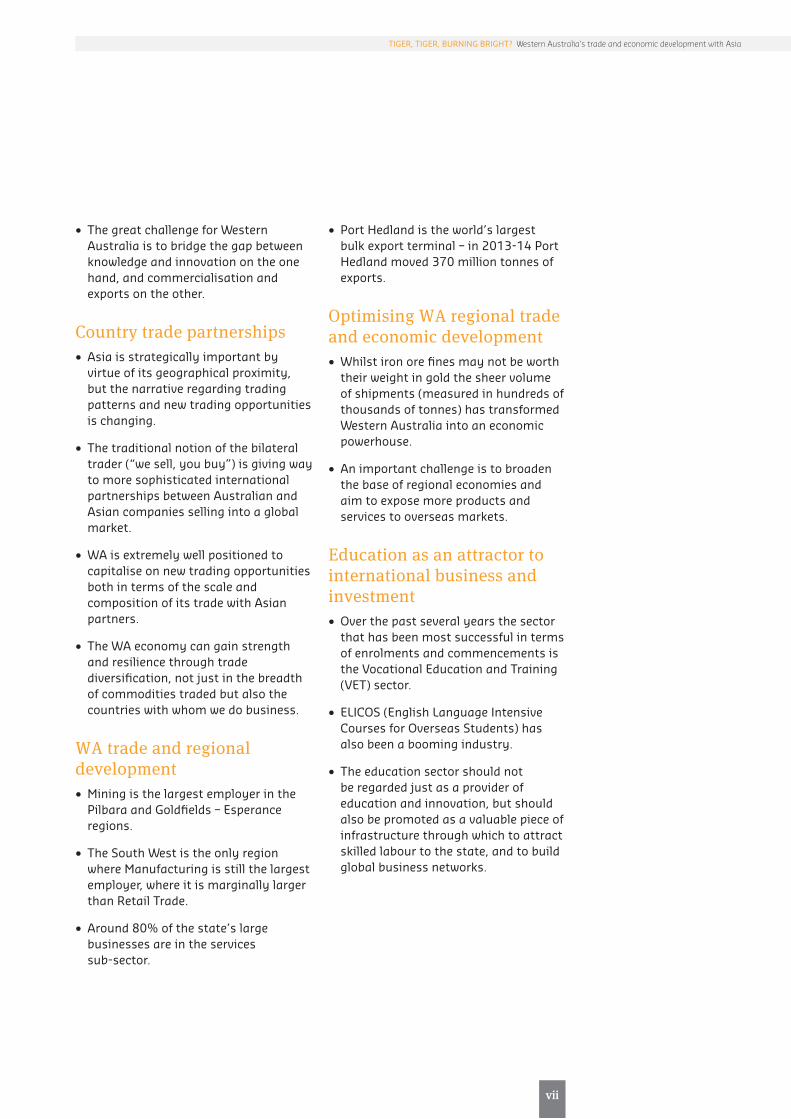
• ThegreatchallengeforWesternAustralia is to bridge the gap between knowledge and innovation on the one hand, and commercialisation and exports on the other.
Country trade partnerships• Asiaisstrategicallyimportantby
virtue of its geographical proximity, but the narrative regarding trading patterns and new trading opportunities is changing.
• Thetraditionalnotionofthebilateraltrader (“we sell, you buy”) is giving way to more sophisticated international partnerships between Australian and Asian companies selling into a global market.
• WAisextremelywellpositionedtocapitalise on new trading opportunities both in terms of the scale and composition of its trade with Asian partners.
• TheWAeconomycangainstrengthand resilience through trade diversification, not just in the breadth of commodities traded but also the countries with whom we do business.
WA trade and regional development• Miningisthelargestemployerinthe
Pilbara and Goldfields – Esperance regions.
• TheSouthWestistheonlyregionwhereManufacturingisstillthelargestemployer, where it is marginally larger than Retail Trade.
• Around80%ofthestate’slargebusinesses are in the services sub-sector.
• PortHedlandistheworld’slargestbulk export terminal – in 2013-14 Port Hedland moved 370 million tonnes of exports.
Optimising WA regional trade and economic development• Whilstironorefinesmaynotbeworth
their weight in gold the sheer volume of shipments (measured in hundreds of thousands of tonnes) has transformed Western Australia into an economic powerhouse.
• Animportantchallengeistobroadenthe base of regional economies and aim to expose more products and services to overseas markets.
Education as an attractor to international business and investment• Overthepastseveralyearsthesector
that has been most successful in terms of enrolments and commencements is the Vocational Education and Training (VET) sector.
• ELICOS(EnglishLanguageIntensiveCourses for Overseas Students) has also been a booming industry.
• Theeducationsectorshouldnotbe regarded just as a provider of education and innovation, but should also be promoted as a valuable piece of infrastructure through which to attract skilled labour to the state, and to build global business networks.
7
vii
TIGER, TIGER, BURNING BRIGHT? Western Australia’s trade and economic development with Asia

viii
WA’s trading environment – benefits and barriers• Itisachallengeforsmalleroremerging
businesses to access infrastructure, especially when the networks are stretched to capacity.
• Atamacroeconomiclevelprotectionistpolicies are barriers that can significantly limit the access of overseas markets for our regional producers.
WA trade strategy and policy• ThedealstruckbetweenChinaand
Australia through the recent Free Trade Agreement offers mixed support to WA industry.
• Someagriculturesub-sectorsinWA will benefit from phased tariff reductions, particularly producers of meat, seafood, wine and other boutique foods and horticulture.
• Therehasbeennoagreementonlowertariffs for staple crops – wheat, maize, corn, rice or canola – or for wool and cotton.
• Somenervousnessexistsregardingforeign-financed investment projects in Australia being supported by migrant workers without the requirement for local labour market testing.

9
1
TIGER, TIGER, BURNING BRIGHT? Western Australia’s trade and economic development with Asia
Introduction
There is a general sense of unease with the recent slowdown in China’s economic growth. Large businesses and the State’s finances have suffered as a result. But is China the ‘be all and end all’ of the focus on Western Australia trade policies and objectives? What new trading opportunities with other Asian countries exist for WA businesses, and how well positioned are the State’s businesses to expand the scale and composition of its trade with Asian partners?
Western Australia is a large state by area but is relatively small by population. Its capital Perth is also one of the world’s most geographically isolated city. As such, the importance of our trading relationships with other countries in the region cannot be underestimated. We have been fortunate on two counts – our vast reserves in iron ore and our proximity to Asia. Exports of mining resources have flourished over the past decade at a magnitude not seen in recent history. Indeed, it had well and truly put Western Australia on the world map.
However, while it may well be a genuine stroke of luck that WA is located where it is, year after year of record export in a resource such as iron ore cannot simply be attributed to good fortune alone. In the highly competitive industry it has taken a lot of innovation, R&D, support from stakeholders, mutually-beneficial partnerships, the implementation of novel solutions and perhaps, to a certain extent, gamble, to take the industry to where it is today.
But as China is undergoing a period of transition with lower GDP growth Western Australia must continually look to reinforce the industries that have gotten us to where we are and to also diversify the economy and seek new opportunities to engage in trade with Asia. With the industrial landscape in WA undergoing something of a transition as the resources sector moves to production, there is a need to develop a more sophisticated narrative for the future positioning of the WA economy to take advantage of emerging opportunities in Asia.
This report examines a number of key questions relating to the composition and direction of trade by West Australian businesses and consumers. These include issues that affect current trading patterns with Asia, and opportunities for enhanced future trade and strengthened economic relationships with China, Japan and other countries in the Asia-Pacific and Indo-Pacific regions.
International trade has a role to play in strengthening industrial sectors within the WA economy – including, but also extending beyond, the mining and resources sectors. Trade is also a critical factor in supporting a diversification of the strengths in the WA economy.
The report reminds us that as important as China is to the economic fortunes of the state, it is by no means the state’s only export destination. To focus solely on China would be myopic. There are new partnerships to forge, emerging industries to support, infrastructure bottlenecks to overcome and the WA ‘brand’ to promote.
The report also examines the question of trade and economic development from the perspective of WA’s regions. It highlights important barriers that regional businesses and residents, together with policymakers, have overcome in their pursuit of efficiency gains and growth. It also seeks to explore what strategies the regions can adopt to further promote their own trade with country partners in the Asia-Pacific region, and develop new economic opportunities to tap into global export markets.


A brief history of WA trade
A brief history of WA trade
4
From sheep’s back to resource boomWestern Australia (WA) has a long association with resource-driven growth, beginning with the Kalgoorlie gold rush of the 1890s which drew people from all over Australia and the world. That boom underpinned the rapid development of what was still a remote settlement and laid the foundations for the creation of the State. However, given its relative geographical isolation, by the 1950s WA was in danger of becoming in the words of former WA Premier Sir Charles Court, a ‘mendicant state’, dependent in large part on transfers through the national budget and the Commonwealth Grants Commission.
Australia “rode on the sheep’s back” from the mid-nineteenth century, with much of its early prosperity derived from producing and exporting wool. Western Australia became a major grain producer by the start of the twentieth century, with the market garden industry also building in strength up to the 1920s with the aid of Chinese workers and farming methods.
However, since the 1950s WA has witnessed a series of mining booms. The second major boom in WA history was the development of the Pilbara iron ore deposits in the 1960s, coupled with new developments in alumina and nickel and in the latter part of the decade and early 1970s. In the 1980s, the development of a liquefied natural gas (LNG) export industry and petroleum and condensate exports, together with a new boom in gold mining saw the state undergo another economic and population growth spurt. The current expansion (from 2004) represents WA’s exposure to the ‘super-cycle’ in mineral commodities – a global shift in prices and volumes in these markets due to growth in China, and to a lesser extent, countries such as India, Russia and Brazil (the so-called BRICs group).
The development of new resources in WA, commencing with the planning and construction for the iron ore boom in 1962, has resulted in the transformation of WA. In 1967, in the midst of initial exports of iron ore from the Pilbara, WA’s production ofmineralandpetroleumresourceswasequalto$134million.By1987,followingthe expansion of gold, nickel and alumina production, total output in minerals and petroleumequalled$6.3billion.By2011-12,followingtheemergenceofthe‘supercycle’,productionreached$107billion.
Over45years,WAincreaseditsmineralandpetroleumproductionfrom$2.6millionaweektoover$2billionaweek.Inthistimetheresourcessectorhasmovedfrom representing a fraction of the WA economy to dominating it. This dramatic transformation have had a profound impact on WA, transforming the second smallest Australian state in terms of population in the 1960s, into a fast growing state over the past twenty-five years in terms of both population and economic growth.
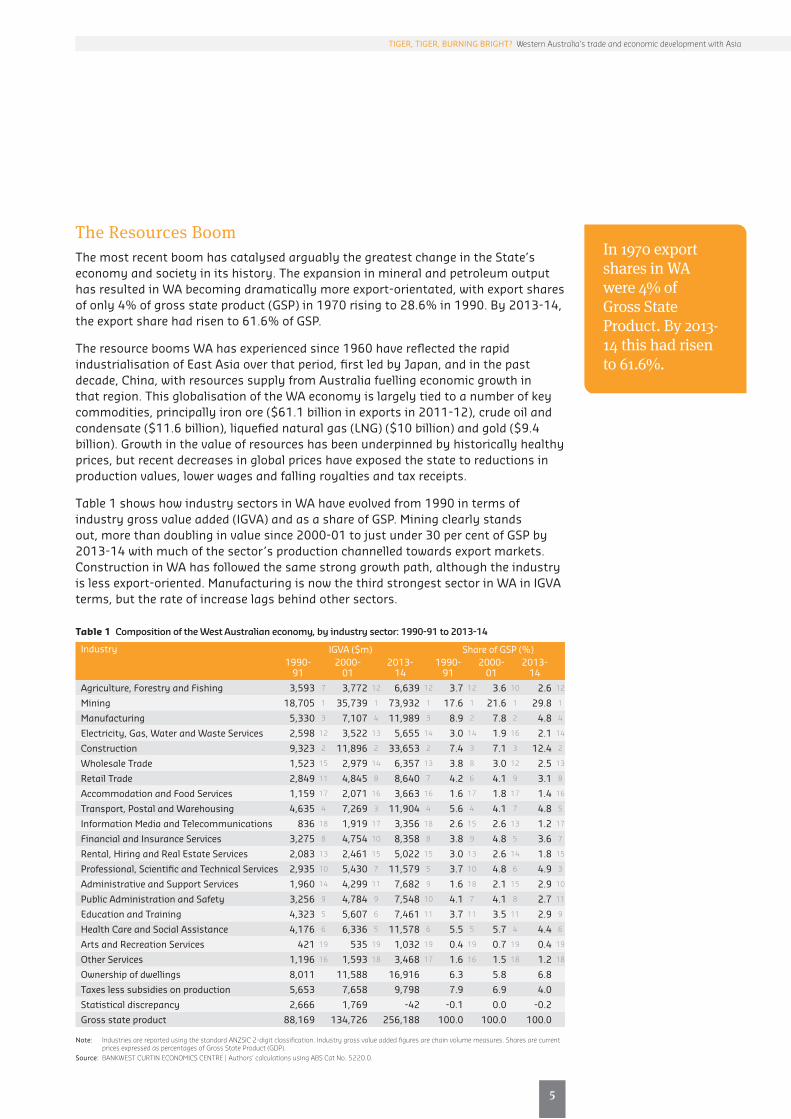
The Resources BoomThe most recent boom has catalysed arguably the greatest change in the State’s economy and society in its history. The expansion in mineral and petroleum output has resulted in WA becoming dramatically more export-orientated, with export shares ofonly4%ofgrossstateproduct(GSP)in1970risingto28.6%in1990.By2013-14,theexportsharehadrisento61.6%ofGSP.
The resource booms WA has experienced since 1960 have reflected the rapid industrialisation of East Asia over that period, first led by Japan, and in the past decade, China, with resources supply from Australia fuelling economic growth in that region. This globalisation of the WA economy is largely tied to a number of key commodities,principallyironore($61.1billioninexportsin2011-12),crudeoilandcondensate($11.6billion),liquefiednaturalgas(LNG)($10billion)andgold($9.4billion). Growth in the value of resources has been underpinned by historically healthy prices, but recent decreases in global prices have exposed the state to reductions in production values, lower wages and falling royalties and tax receipts.
Table 1 shows how industry sectors in WA have evolved from 1990 in terms of industrygrossvalueadded(IGVA)andasashareofGSP.Miningclearlystandsout, more than doubling in value since 2000-01 to just under 30 per cent of GSP by 2013-14 with much of the sector’s production channelled towards export markets. Construction in WA has followed the same strong growth path, although the industry islessexport-oriented.ManufacturingisnowthethirdstrongestsectorinWAinIGVAterms, but the rate of increase lags behind other sectors.
13
5
In 1970 export shares in WA were 4% of Gross State Product. By 2013-14 this had risen to 61.6%.
TIGER, TIGER, BURNING BRIGHT? Western Australia’s trade and economic development with Asia
Table 1 Composition of the West Australian economy, by industry sector: 1990-91 to 2013-14
Industry IGVA($m) ShareofGSP(%)1990-
91 2000-
012013-
141990-
912000-
012013-
14
Agriculture, Forestry and Fishing 3,593 7 3,772 12 6,639 12 3.7 12 3.6 10 2.6 12
Mining 18,705 1 35,739 1 73,932 1 17.6 1 21.6 1 29.8 1
Manufacturing 5,330 3 7,107 4 11,989 3 8.9 2 7.8 2 4.8 4
Electricity, Gas, Water and Waste Services 2,598 12 3,522 13 5,655 14 3.0 14 1.9 16 2.1 14
Construction 9,323 2 11,896 2 33,653 2 7.4 3 7.1 3 12.4 2
Wholesale Trade 1,523 15 2,979 14 6,357 13 3.8 8 3.0 12 2.5 13
Retail Trade 2,849 11 4,845 8 8,640 7 4.2 6 4.1 9 3.1 8
Accommodation and Food Services 1,159 17 2,071 16 3,663 16 1.6 17 1.8 17 1.4 16
Transport, Postal and Warehousing 4,635 4 7,269 3 11,904 4 5.6 4 4.1 7 4.8 5
InformationMediaandTelecommunications 836 18 1,919 17 3,356 18 2.6 15 2.6 13 1.2 17
Financial and Insurance Services 3,275 8 4,754 10 8,358 8 3.8 9 4.8 5 3.6 7
Rental, Hiring and Real Estate Services 2,083 13 2,461 15 5,022 15 3.0 13 2.6 14 1.8 15
Professional, Scientific and Technical Services 2,935 10 5,430 7 11,579 5 3.7 10 4.8 6 4.9 3
Administrative and Support Services 1,960 14 4,299 11 7,682 9 1.6 18 2.1 15 2.9 10
Public Administration and Safety 3,256 9 4,784 9 7,548 10 4.1 7 4.1 8 2.7 11
Education and Training 4,323 5 5,607 6 7,461 11 3.7 11 3.5 11 2.9 9
Health Care and Social Assistance 4,176 6 6,336 5 11,578 6 5.5 5 5.7 4 4.4 6
Arts and Recreation Services 421 19 535 19 1,032 19 0.4 19 0.7 19 0.4 19
Other Services 1,196 16 1,593 18 3,468 17 1.6 16 1.5 18 1.2 18
Ownership of dwellings 8,011 11,588 16,916 6.3 5.8 6.8
Taxes less subsidies on production 5,653 7,658 9,798 7.9 6.9 4.0
Statistical discrepancy 2,666 1,769 -42 -0.1 0.0 -0.2
Gross state product 88,169 134,726 256,188 100.0 100.0 100.0
Note: Industries are reported using the standard ANZSIC 2-digit classification. Industry gross value added figures are chain volume measures. Shares are current prices expressed as percentages of Gross State Product (GDP).
Source: BANKWEST CURTIN ECONOMICS CENTRE | Authors’ calculations using ABS Cat No. 5220.0.
WA’s contribution to Australian trade
6
Figure 1 Australian export shares by states/territories: 2006-07 and 2013-14
Note: See Glossary for explanation of State of origin of exports.Source: BANKWEST CURTIN ECONOMICS CENTRE | Authors’ calculations using ABS Cat No. 5368.0.55.006 - Characteristics of Australian Exporters, 2013-14.
TAS2.3%
2006-07
SA5.6%
NT2.5%
QLD21.9%
WA37.9%
VIC12.4%
NSW17.4%
TAS1.1%SA
4.8%
NT2.6%
QLD17.4%
WA50.6%
VIC9.3%
NSW14.2%
2013-14
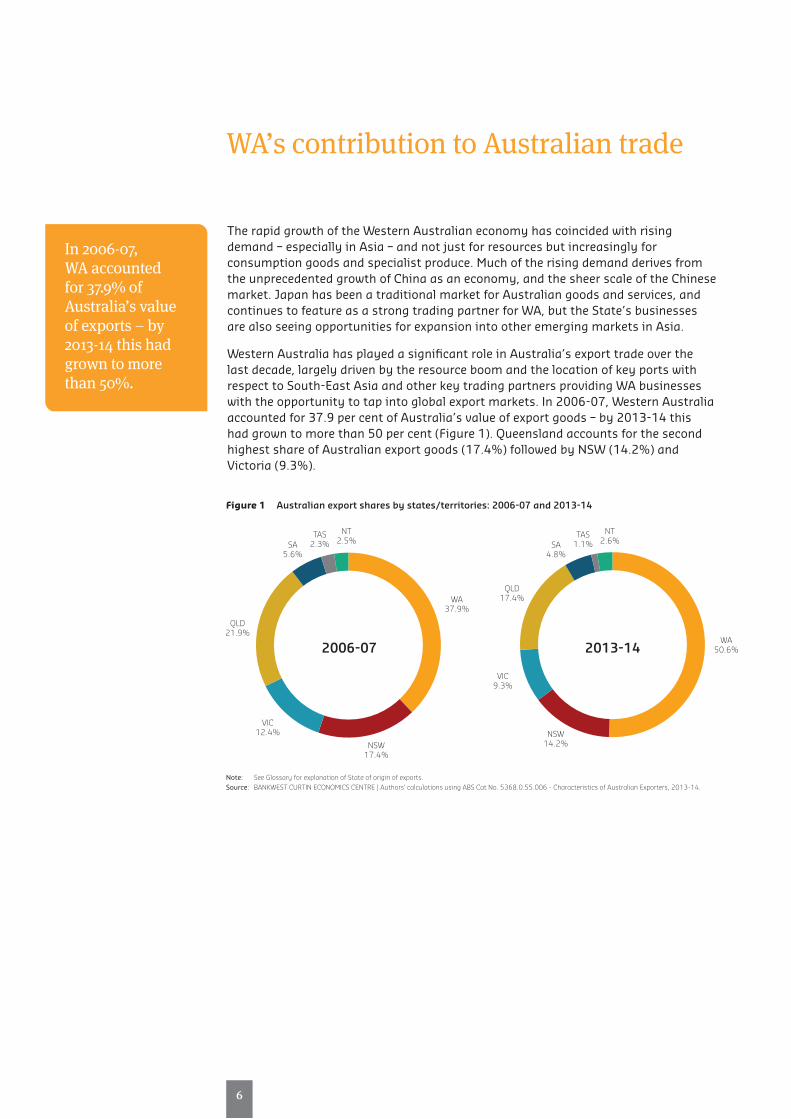
The rapid growth of the Western Australian economy has coincided with rising demand – especially in Asia – and not just for resources but increasingly for consumptiongoodsandspecialistproduce.Muchoftherisingdemandderivesfromthe unprecedented growth of China as an economy, and the sheer scale of the Chinese market. Japan has been a traditional market for Australian goods and services, and continues to feature as a strong trading partner for WA, but the State’s businesses are also seeing opportunities for expansion into other emerging markets in Asia.
Western Australia has played a significant role in Australia’s export trade over the last decade, largely driven by the resource boom and the location of key ports with respect to South-East Asia and other key trading partners providing WA businesses with the opportunity to tap into global export markets. In 2006-07, Western Australia accounted for 37.9 per cent of Australia’s value of export goods – by 2013-14 this had grown to more than 50 per cent (Figure 1). Queensland accounts for the second highestshareofAustralianexportgoods(17.4%)followedbyNSW(14.2%)andVictoria(9.3%).
In 2006-07, WA accounted for 37.9% of Australia’s value of exports – by 2013-14 this had grown to more than 50%.
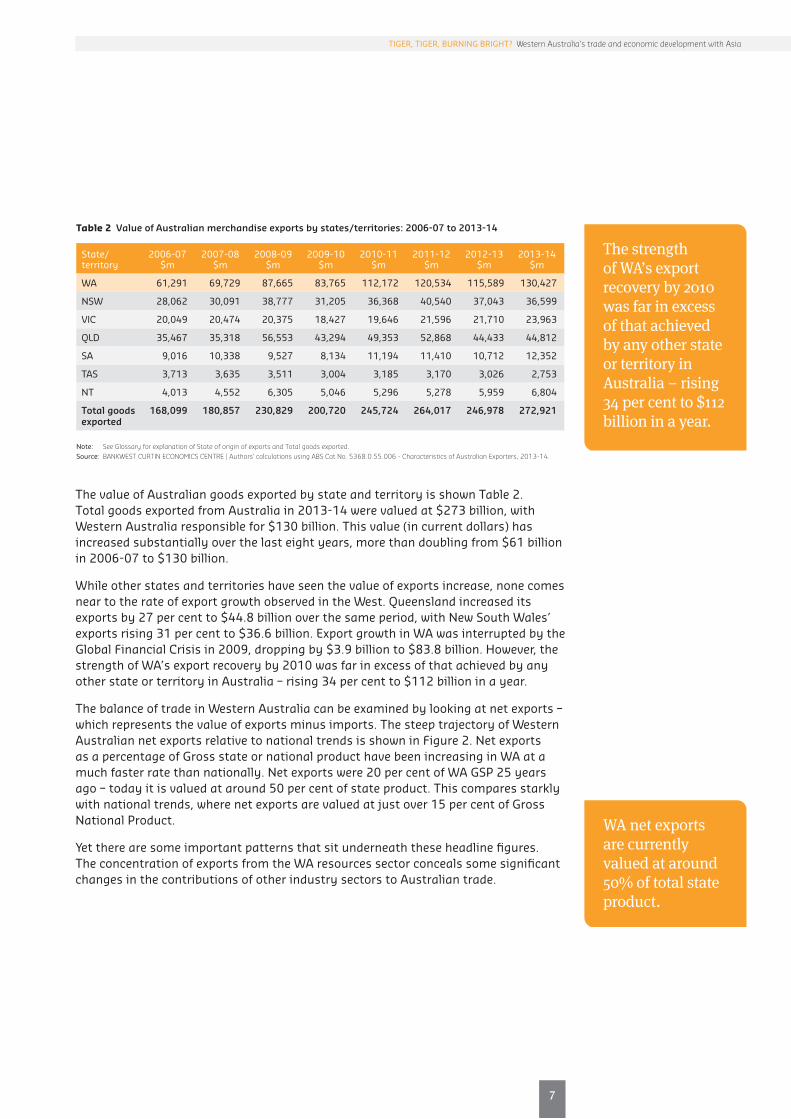
The value of Australian goods exported by state and territory is shown Table 2. TotalgoodsexportedfromAustraliain2013-14werevaluedat$273billion,withWesternAustraliaresponsiblefor$130billion.Thisvalue(incurrentdollars)hasincreasedsubstantiallyoverthelasteightyears,morethandoublingfrom$61billionin2006-07to$130billion.
While other states and territories have seen the value of exports increase, none comes near to the rate of export growth observed in the West. Queensland increased its exportsby27percentto$44.8billionoverthesameperiod,withNewSouthWales’exportsrising31percentto$36.6billion.ExportgrowthinWAwasinterruptedbytheGlobalFinancialCrisisin2009,droppingby$3.9billionto$83.8billion.However,thestrength of WA’s export recovery by 2010 was far in excess of that achieved by any otherstateorterritoryinAustralia–rising34percentto$112billioninayear.
The balance of trade in Western Australia can be examined by looking at net exports – which represents the value of exports minus imports. The steep trajectory of Western Australian net exports relative to national trends is shown in Figure 2. Net exports as a percentage of Gross state or national product have been increasing in WA at a much faster rate than nationally. Net exports were 20 per cent of WA GSP 25 years ago – today it is valued at around 50 per cent of state product. This compares starkly with national trends, where net exports are valued at just over 15 per cent of Gross National Product.
Yet there are some important patterns that sit underneath these headline figures. The concentration of exports from the WA resources sector conceals some significant changes in the contributions of other industry sectors to Australian trade.
15
7
TIGER, TIGER, BURNING BRIGHT? Western Australia’s trade and economic development with Asia
State/territory
2006-07$m
2007-08$m
2008-09$m
2009-10$m
2010-11$m
2011-12$m
2012-13$m
2013-14$m
WA 61,291 69,729 87,665 83,765 112,172 120,534 115,589 130,427
NSW 28,062 30,091 38,777 31,205 36,368 40,540 37,043 36,599
VIC 20,049 20,474 20,375 18,427 19,646 21,596 21,710 23,963
QLD 35,467 35,318 56,553 43,294 49,353 52,868 44,433 44,812
SA 9,016 10,338 9,527 8,134 11,194 11,410 10,712 12,352
TAS 3,713 3,635 3,511 3,004 3,185 3,170 3,026 2,753
NT 4,013 4,552 6,305 5,046 5,296 5,278 5,959 6,804
Total goods exported
168,099 180,857 230,829 200,720 245,724 264,017 246,978 272,921
Note: See Glossary for explanation of State of origin of exports and Total goods exported. Source: BANKWEST CURTIN ECONOMICS CENTRE | Authors’ calculations using ABS Cat No. 5368.0.55.006 - Characteristics of Australian Exporters, 2013-14.
Table 2 Value of Australian merchandise exports by states/territories: 2006-07 to 2013-14
The strength of WA’s export recovery by 2010 was far in excess of that achieved by any other state or territory in Australia – rising 34 per cent to $112 billion in a year.
WA net exports are currently valued at around 50% of total state product.

8
Figure 3 compares the national export shares and export intensity of WA exporters operating in different industry sectors with those in other states and territories. Export values are presented as a share of gross state product, as an indicative measure of export intensity. The particular ABS source for this analysis is restricted to businesses with an ABN number, but nevertheless indicate some fascinating and contrasting patterns of export intensity across sectors since the middle of the last decade.
The contribution of WA mining businesses to national exports has risen from around half the share of Australian export businesses in 2006-07 to 67 per cent by 2013-14 (Figure 3(a), left panel). In contrast, the share of national manufacturing exports from WA manufacturing businesses (those reporting an ABN) fell from a peak of 36 per cent in 2008-09 to only 14 per cent on latest figures.
TheoverallvalueofexportsinWAamountedtoaround$500millionper$1billioningrossstateproductby2013-14,risingfromaround$420millionper$1billionGSPin 2006-07. The squeeze in WA manufacturing exports is especially evident when lookingatthevalueofexportsper$1billionofgrossstateproduct(Figure3(a),rightpanel).ManufacturingexportshavedeclinedasashareofGSPinthetwolargestAustralian states of New South Wales and Victoria (Figure 3(b) and (c)) but from a higher share of national exports. Certainly, the extent of the decline in WA is more noticeable.
Later in this report we examine WA’s trade with Asia and the rest of the world in much greater detail, with a focus not just on what WA businesses sell but also to which international markets we trade. However, the next section focusses on how the manufacturing sector has fared in Western Australia over the course of the State’s resources boom compared with other states and territories.
Figure 2 Net exports as a percentage of GSP/GNP, WA and Australia: 1990 to 2014
Source: BANKWEST CURTIN ECONOMICS CENTRE | Authors’ calculations using ABS Cat No. 5368.0.55.006 - Characteristics of Australian Exporters, 2013-14.
Net
exp
orts
(per
cent
age
of G
SP/G
DP)
June
199
0
June
199
1
June
199
2
June
199
3
June
199
4
June
199
5
June
199
6
June
199
7
June
199
8
June
199
9
June
200
0
June
200
1
June
200
2
June
200
3
June
200
4
June
200
5
June
200
6
June
200
7
June
200
8
June
200
9
June
201
0
June
201
1
June
201
2
June
201
3
June
201
4
0.6
0.5
0.4
0.3
0.2
0.1
0
WA Australia

17
9
TIGER, TIGER, BURNING BRIGHT? Western Australia’s trade and economic development with Asia
Figure 3 Exports by states and territories, 1990 to 2014: national share and exports per $1bn of GSP
Agriculture, forestry and fishing Mining Manufacturing Construction Wholesale trade Retail trade Transport, postal and warehousing
Other Transport, postal and warehousing Retail trade Wholesale trade Construction Manufacturing Mining Agriculture, forestry and fishing
Note: Exports data are presented for companies reporting an ABN.Source: BANKWEST CURTIN ECONOMICS CENTRE | Authors’ calculations using ABS Cat No. 5368.0.55.006 - Characteristics of Australian Exporters, 2013-14.
(a) Western Australia
(b) New South Wales
(c) Victoria
(d) Queensland
Shar
e of
nat
iona
l exp
orts
(%)
70.0
60.0
50.0
40.0
30.0
20.0
10.0
0
2006
-07
2007
-08
2008
-09
2009
-10
2010
-11
2011
-12
2012
-13
2013
-14
Expo
rt s
ales
($m
per
$bn
GSP
)
600.0
500.0
400.0
300.0
200.0
100.0
0
2006
-07
2007
-08
2008
-09
2009
-10
2010
-11
2011
-12
2012
-13
2013
-14
Shar
e of
nat
iona
l exp
orts
(%)
70.0
60.0
50.0
40.0
30.0
20.0
10.0
0
2006
-07
2007
-08
2008
-09
2009
-10
2010
-11
2011
-12
2012
-13
2013
-14
Expo
rt s
ales
($m
per
$bn
GSP
)
90.0
80.0
70.0
60.0
50.0
40.0
30.0
20.0
10.0
0
2006
-07
2007
-08
2008
-09
2009
-10
2010
-11
2011
-12
2012
-13
2013
-14
Expo
rt s
ales
($m
per
$bn
GSP
)
120.0
100.0
80.0
60.0
40.0
20.0
0
2006
-07
2007
-08
2008
-09
2009
-10
2010
-11
2011
-12
2012
-13
2013
-14
Shar
e of
nat
iona
l exp
orts
(%)
30.0
25.0
20.0
15.0
10.0
5.0
0
2006
-07
2007
-08
2008
-09
2009
-10
2010
-11
2011
-12
2012
-13
2013
-14
Shar
e of
nat
iona
l exp
orts
(%)
60.0
50.0
40.0
30.0
20.0
10.0
0
2006
-07
2007
-08
2008
-09
2009
-10
2010
-11
2011
-12
2012
-13
2013
-14
Expo
rt s
ales
($m
per
$bn
GSP
)
250.0
200.0
150.0
100.0
50.0
0
2006
-07
2007
-08
2008
-09
2009
-10
2010
-11
2011
-12
2012
-13
2013
-14

10
Figure 3 (cont) Exports by states and territories, 1990 to 2014: national share and exports per $1bn of GSP
Agriculture, forestry and fishing Mining Manufacturing Construction Wholesale trade Retail trade Transport, postal and warehousing
Other Transport, postal and warehousing Retail trade Wholesale trade Construction Manufacturing Mining Agriculture, forestry and fishing
Note: Exports data are presented for companies reporting an ABN.Source: BANKWEST CURTIN ECONOMICS CENTRE | Authors’ calculations using ABS Cat No. 5368.0.55.006 - Characteristics of Australian Exporters, 2013-14.
(e) South Australia
(f) Tasmania
(g) Northern Territory
(h) Australia
Expo
rt s
ales
($m
per
$bn
GSP
)
60.0
50.0
40.0
30.0
20.0
10.0
0
2006
-07
2007
-08
2008
-09
2009
-10
2010
-11
2011
-12
2012
-13
2013
-14
Expo
rt s
ales
($m
per
$bn
GSP
)
250.0
200.0
150.0
100.0
50.0
0
2006
-07
2007
-08
2008
-09
2009
-10
2010
-11
2011
-12
2012
-13
2013
-14
Shar
e of
nat
iona
l exp
orts
(%)
7.0
6.0
5.0
4.0
3.0
2.0
1.0
0
2006
-07
2007
-08
2008
-09
2009
-10
2010
-11
2011
-12
2012
-13
2013
-14
Expo
rt s
ales
($m
per
$bn
GSP
)
200.0
150.0
100.0
50.0
020
06-0
7
2007
-08
2008
-09
2009
-10
2010
-11
2011
-12
2012
-13
2013
-14
Shar
e of
nat
iona
l exp
orts
(%)
7.0
6.0
5.0
4.0
3.0
2.0
1.0
0
2006
-07
2007
-08
2008
-09
2009
-10
2010
-11
2011
-12
2012
-13
2013
-14
Expo
rt s
ales
($m
per
$bn
GSP
)
400.0
350.0
300.0
250.0
200.0
150.0
100.0
50.0
0
2006
-07
2007
-08
2008
-09
2009
-10
2010
-11
2011
-12
2012
-13
2013
-14
Expo
rt s
ales
($m
per
$bn
GSP
)
200.0
150.0
100.0
50.0
0
2006
-07
2007
-08
2008
-09
2009
-10
2010
-11
2011
-12
2012
-13
2013
-14
Dutch disease?
19
11
TIGER, TIGER, BURNING BRIGHT? Western Australia’s trade and economic development with Asia
The relative decline in the strength of manufacturing as an industry in Western Australia reflects a nationwide pattern, but the rate at which manufacturing exports have diminished over the last decade from WA to overseas markets clearly exceeds the decline in other states and territories. This raises the question as to why this is the case, and particularly, whether this represents an example of the phenomenon of Dutch Disease.
Dutch Disease is the term commonly applied to a situation where a currency appreciation from rapid growth in a country’s capital intensive resources sector leads to a loss of competitiveness in labour intensive industries. The term was coined after the resource-driven boom in Holland following the natural gas discovery in 1959 caused a significant appreciation of the Dutch currency and decimated Holland’s manufacturing industry.
One causal factor for the incidence of Dutch Disease is a currency appreciation driven by rapid economic growth following a resource-led boom. Figure 4 shows the pattern of currency movements since 1990 between the Australian dollar and major competitor currencies – the US dollar, Euro, Japanese Yen – and a trade weighted index of currencies.
A general appreciation of the Australian dollar is evident against all currencies during the real heat of the resources boom from around 2003 to the point at which the GFC hit global markets in 2009. The rise in commodity prices over this period, and the consequent terms of trade effects (doubling over the first decade of the new millennium) have been the principal causes of the exchange rate rises during the 2000s. This impacted on Australian businesses as well as households, in two ways.
Firstly, higher commodity prices caused an increase in resource sector investment. This enabled mining and resources firms to expand their capacity to take advantage of the increased returns to production. The trend towards investment in mining, and the commensurate falls in manufacturing investment, are both clearly apparent in Figure 5.
Higher household disposable incomes over the same period led to increased consumption spending on mainly domestic goods, which in turn caused both labour and capital to be diverted reducing returns in other exporting industry sectors.

12
Figure 5 Share of capital expenditure in Western Australia, by industry category: 1989 to 2015
Source: BANKWEST CURTIN ECONOMICS CENTRE | Authors’ calculations using ABS Cat No. 5625.0 – Private New Capital Expenditure and Expected Expenditure, Australia, June 2015.
Shar
e of
Cap
ital
exp
endi
ture
in
WA
by In
dust
ry
June
198
9
June
199
0
June
199
1
June
199
2
June
199
3
June
199
4
June
199
5
June
199
6
June
199
7
June
199
8
June
199
9
June
200
0
June
200
1
June
200
2
June
200
3
June
200
4
June
200
5
June
200
6
June
200
7
June
200
8
June
200
9
June
201
0
June
201
1
June
201
2
June
201
3
June
201
4
June
201
5
0.900.800.700.600.500.400.300.200.10
0
Mining Manufacturing Other Selected Industries
Figure 4 Currency exchange rates and Trade Weighted Index for Australia: 1990 to 2015
Source: BANKWEST CURTIN ECONOMICS CENTRE | Authors’ calculations using ABS Cat No. 5368.0 – International Trade in Goods and Services, Australia, July 2015.
Japa
nese
Yen
/Tra
de W
eigh
ted
Inde
x
USD
, UKP
and
Eur
o
June
199
0
June
199
1
June
199
2
June
199
3
June
199
4
June
199
5
June
199
6
June
199
7
June
199
8
June
199
9
June
200
0
June
200
1
June
200
2
June
200
3
June
200
4
June
200
5
June
200
6
June
200
7
June
200
8
June
200
9
June
201
0
June
201
1
June
201
2
June
201
3
June
201
4
June
201
5
140
120
100
80
60
40
20
0
1.2
1.0
0.8
0.6
0.4
0.2
0
Trade Weighted Index United States Dollar (RHS) Euro (RHS) Japanese Yen United Kingdom (RHS)
21
13
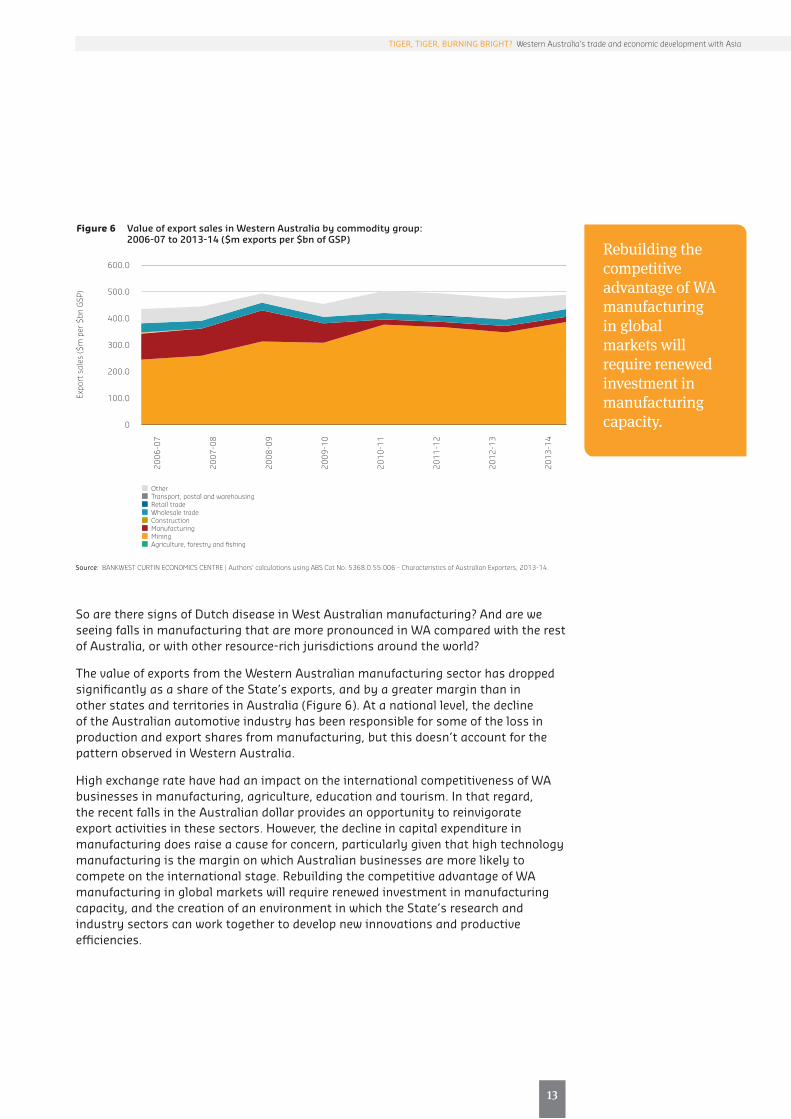
Rebuilding the competitive advantage of WA manufacturing in global markets will require renewed investment in manufacturing capacity.
TIGER, TIGER, BURNING BRIGHT? Western Australia’s trade and economic development with Asia
Figure 6 Value of export sales in Western Australia by commodity group: 2006-07 to 2013-14 ($m exports per $bn of GSP)
Source: BANKWEST CURTIN ECONOMICS CENTRE | Authors’ calculations using ABS Cat No. 5368.0.55.006 - Characteristics of Australian Exporters, 2013-14.
Expo
rt s
ales
($m
per
$bn
GSP
)
600.0
500.0
400.0
300.0
200.0
100.0
0
2006
-07
2007
-08
2008
-09
2009
-10
2010
-11
2011
-12
2012
-13
2013
-14
Other Transport, postal and warehousing Retail trade Wholesale trade Construction Manufacturing Mining Agriculture, forestry and fishing
So are there signs of Dutch disease in West Australian manufacturing? And are we seeing falls in manufacturing that are more pronounced in WA compared with the rest of Australia, or with other resource-rich jurisdictions around the world?
The value of exports from the Western Australian manufacturing sector has dropped significantly as a share of the State’s exports, and by a greater margin than in other states and territories in Australia (Figure 6). At a national level, the decline of the Australian automotive industry has been responsible for some of the loss in production and export shares from manufacturing, but this doesn’t account for the pattern observed in Western Australia.
High exchange rate have had an impact on the international competitiveness of WA businesses in manufacturing, agriculture, education and tourism. In that regard, the recent falls in the Australian dollar provides an opportunity to reinvigorate export activities in these sectors. However, the decline in capital expenditure in manufacturing does raise a cause for concern, particularly given that high technology manufacturing is the margin on which Australian businesses are more likely to compete on the international stage. Rebuilding the competitive advantage of WA manufacturing in global markets will require renewed investment in manufacturing capacity, and the creation of an environment in which the State’s research and industry sectors can work together to develop new innovations and productive efficiencies.


international trade profile
WA’s

16
Mining products make up around three-quarters of all goods and services exported from WA.
Unsurprisingly, mining exports play a major role in Western Australia’s international export trade profile, dominating the share of goods and services exported from the state in 2013-14 (Figure 7). The export of goods rather than services is more dominantinWAoverall,constitutingaround96percent($130billion)ofthevalueofallexportproducts.Miningproductsmakesuparoundthree-quartersofallgoodsandservicesexportedfromWA,followedbyothergoods(11.3%),goodsproducedwithinthewholesaletradesector(5.1%)andmanufacturing(3.7%).Exportgoodsthatstemfrom the Agriculture sector make-up a much smaller proportion of all export products – around 0.6 per cent.
Miningproductsmakesuparoundthree-quartersofallgoodsandservicesexportedfrom WA.
Services exported from the state form a smaller component of the overall value of exportproducts-4.6percentor($6.2billion).IntermsofservicesexportedfromWA,personal, business and education travel comprise the largest proportion, but are still relatively minor export products overall (Figure 7).
Figure 7 Share of goods and services exports from Western Australia by commodity group: 2013-14
Note: Other in the Goods category includes Other goods; Transport, postal and warehousing, Construction and Retail goods. Other in the Services category includes Telecommunications, computer and information services, Freight transport, Finance, insurance and recreation services, Construction, Charges for the use of intellectual property, and Maintenance and repair services.
Source: BANKWEST CURTIN ECONOMICS CENTRE | Authors’ calculations using ABS Cat No.5368.0.55.006 – Characteristics of Australian Exporters, 2013-14.
All Services4.6%
Goods exports
Manufacturing3.7%
Mining74.8%
Wholesale trade5.1%
Services exports
Other goods11.3%
Agriculture0.6%
Other business0.5%
Postal & transport0.4%
Government0.2%
Businessservices
0.6%
Passengertransport
0.2%
Other services
0.4%
Personal travel0.5%Education
0.9%

25
17
Eight out of the top ten export commodites in 2013-14 stem from the state’s natural resources.
TIGER, TIGER, BURNING BRIGHT? Western Australia’s trade and economic development with Asia
Since the 1960s the mining industry has been an industrial feature of Western Australia and it is no surprise to see that eight out of the top ten export commodites in 2013-14 stem from the state’s natural resources (Table 3). Iron ore and concentratestoptheexportcommoditylist,valuedat$72.4billion.Thisisfollowedbynaturalgasandgold,whichattracted$13billionand$12.7billioninexportvaluefor Western Australia in 2013-14. Crude petroleum, Copper ores and concentrates, Precious metal ores, Gold coin and Legal tender coin and Nickel ores and concentrates are also among the mining outputs that make the top ten export commodities. Two agricultural commodities – wheat, oil-seeds and oleaginous fruits also feature among the top ten export commodities for WA in 2013-14.
Eight out of the top ten export commodites in 2013-14 stem from the state’s natural resources.
What do we sell?
Table 3 Value of exports from Western Australia, by commodity/service group: 2006-07 to 2013-14
Export group Exports($m) Growth(%)
2009-10
2010- 11
2011-12
2012- 13
2013- 14
2012-13 to2013-
145 Year trend
Merchandise exportsIron ores & concentrates 62,098 1 57,177 1 61,217 1 55,665 1 72,469 1 +30% +17%Natural gas 11,430 3 8,014 4 9,301 4 11,165 3 13,087 2 +17% +14%Gold 13,055 2 13,398 2 15,603 2 14,908 2 12,689 3 -15% -3%Crude petroleum 9,022 4 11,056 3 11,073 3 9,309 4 9,284 4 -0% +3%Wheat 2,692 5 1,837 5 1,881 5 2,740 5 2,819 5 +3% +5%Copper ores & concentrates 1,603 6 1,597 6 1,555 6 1,723 6 1,731 6 +0% +8%Oil-seeds & oleaginous fruits, soft 878 7 418 16 587 12 757 10 1,018 7 +34% +16%Precious metal ores & conc (excl gold) 559 13 828 8 1,113 8 1,162 8 923 8 -21% +65%Gold coin & legal tender coin 757 8 642 12 817 9 923 9 842 9 -9% +11%Nickel ores & concentrates 731 9 860 7 1,130 7 1,169 7 760 10 -35% +4%Nickel 692 10 714 10 474 14 678 12 702 11 +4% +1%Other ores & concentrates (c) 678 11 670 11 627 11 614 13 698 12 +14% +3%Liquefied propane & butane 628 12 777 9 744 10 694 11 614 13 -12% -2%Inorganic chemical elements 507 14 303 17 390 17 515 14 591 14 +15% +17%Pearls & gems 441 16 na - 128 20 151 20 532 15 +252% +21%Pigments, paints & varnishes 497 15 529 13 568 13 377 16 509 16 +35% +2%Wool & other animal hair (incl tops) 405 18 493 15 415 16 408 15 425 17 +4% +5%Live animals (excl seafood) 434 17 516 14 419 15 327 17 409 18 +25% -6%Crustaceans, f.c.f. 371 20 237 18 244 18 302 18 390 19 +29% +5%Meat(exclbeef),f.c.f. 372 19 np - 206 19 251 19 378 20 +51% +2%Total merchandise exports 119,434 120,535 112,172 115,590 130,423 +13% +9%
Services exportsPersonal travel (not education related) 1,394 1 1,389 1 1,453 1 1,598 1 1,704 1 +7% +22%Education-related travel 1,201 2 1,225 2 1,172 2 1,166 2 1,284 2 +10% +7%Business travel 521 4 605 4 841 3 874 3 809 3 -7% +55%Other business services 785 3 723 3 645 4 694 4 711 4 +2% -9%Postal, courier and other transport services 475 5 453 5 537 5 529 5 595 5 +12% +25%Government goods and services n.i.e 306 6 315 6 323 6 330 6 339 6 +3% +11%Passenger transport 279 7 287 7 270 7 254 7 261 7 +3% -6%Telecommunications, computer and information services 90 9 113 9 110 9 100 10 159 8 na +77%
Freight transport 197 8 195 8 186 8 177 8 157 9 -11% -20%Finance, Insurance and Pension services 67 10 85 10 99 10 102 9 115 10 +13% +72%Personal, cultural, and recreation services 63 11 40 11 46 11 na 51 11 na -19%Construction 31 12 10 13 7 13 na 18 12 na -42%Charges for the use of intellectual property n.i.e 26 13 13 12 15 12 18 11 16 13 -11% -38%
Maintenanceandrepairservicesn.i.e. 1 14 3 14 1 14 1 12 2 14 +100% +100%Total services exports 5,436 5,456 5,705 5,915 6,221 +5% +14%TOTAL GOODS AND SERVICES EXPORTS 124,870 125,991 117,877 121,505 136,644 +12% +9%
Source: BANKWEST CURTIN ECONOMICS CENTRE | ABS Cat No. 5368.0.
18
The value of gold exports from WA has fallen by 15% in the last two periods.
WA trading patterns over time
Table 3 shows that almost all of the top 20 merchandise exports from Western Australiahavegrowninvalueoverthelast5years(+9%),aswellasmorerecentlybetween2012-13and2013-14(+15%).
Growth in some of the state’s biggest value exports – iron ore, gas, copper and other precious metals – has been positive over a five year period and between the latest two periods. Iron ore and concentrates exports have experienced an increase of 17 per cent across the five year period from 2009-10. In the most recent period from 2012-13 to 2013-14, the value of iron ore exports from Western Australia has increased by30percent,from55.7billionto$72.5billion.Naturalgashasalsoseenasimilartrend, with export values increasing by 14 per cent in the five year period to 2013-14, and by 14 per cent between the last two periods. Gold, on the other hand, has shown a significant reversal recently, falling by some 15 per cent between 2012-13 and 2013-14.
Some recent export sale increases in smaller value merchandise categories are particularly noticeable – pearls and gems increased by 250 per cent between the last two periods. A number of agricultural export products have also increased in value recently–meats(up50%),liveanimals(up25%)andcrustaceans(up29%).
The majority of Western Australian service exports have increased in value over the most recent period, with Finance, insurance and pension services; Postal, courier and other transport services increasing by 13 and 12 per cent respectively between 2012-13 and 2013-14.
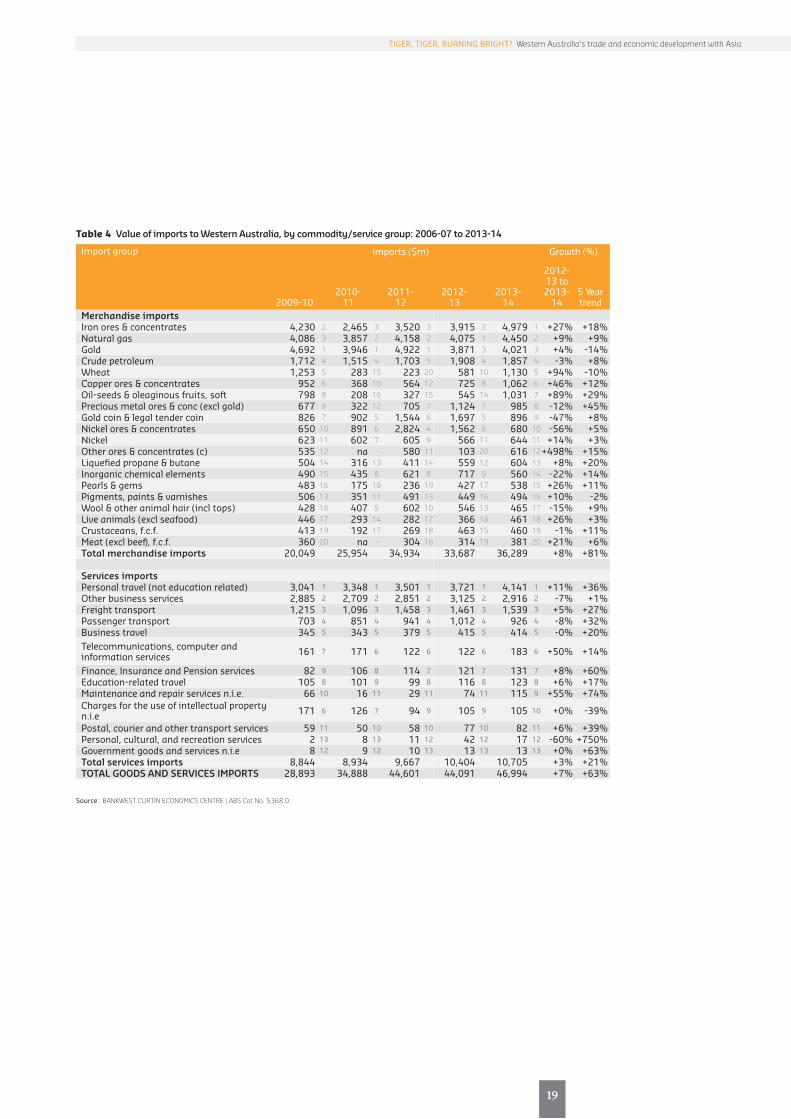
ThevalueofexportsofgoodsandservicesinWesternAustralia($137bnin2013-14)farexceedsthevalueofimports(around$47bn,fromTable4).However,itisalsothecase that merchandise and services imported to Western Australia have grown at a significantly faster pace than exports. Overall, merchandise imports have increased by 81 per cent across the five year period to 2013-14, and service imports by 21 per cent. Wheat, oil seeds and fruits, other ores and concentrates, telecommunications, computer and information and maintenance and repair services are among those items which have shown significant short term growth in important values.
Combining exports and imports, Table 5 shows both the net export value and total trade in Western Australia between 2009-10 and 2013-14. Net exports are calculated as exports minus imports, whereas total trade measure combines the value of exports and imports within a commodity/service group to reveal the overall activity.
27
19
TIGER, TIGER, BURNING BRIGHT? Western Australia’s trade and economic development with Asia
Table 4 Value of imports to Western Australia, by commodity/service group: 2006-07 to 2013-14
Import group Imports($m) Growth(%)
2009-102010-
112011-
122012-
132013-
14
2012-13 to2013-
145 Year trend
Merchandise importsIron ores & concentrates 4,230 2 2,465 3 3,520 3 3,915 2 4,979 1 +27% +18%Natural gas 4,086 3 3,857 2 4,158 2 4,075 1 4,450 2 +9% +9%Gold 4,692 1 3,946 1 4,922 1 3,871 3 4,021 3 +4% -14%Crude petroleum 1,712 4 1,515 4 1,703 5 1,908 4 1,857 4 -3% +8%Wheat 1,253 5 283 15 223 20 581 10 1,130 5 +94% -10%Copper ores & concentrates 952 6 368 10 564 12 725 8 1,062 6 +46% +12%Oil-seeds & oleaginous fruits, soft 798 8 208 16 327 15 545 14 1,031 7 +89% +29%Precious metal ores & conc (excl gold) 677 9 322 12 705 7 1,124 7 985 8 -12% +45%Gold coin & legal tender coin 826 7 902 5 1,544 6 1,697 5 896 9 -47% +8%Nickel ores & concentrates 650 10 891 6 2,824 4 1,562 6 680 10 -56% +5%Nickel 623 11 602 7 605 9 566 11 644 11 +14% +3%Other ores & concentrates (c) 535 12 na - 580 11 103 20 616 12 +498% +15%Liquefied propane & butane 504 14 316 13 411 14 559 12 604 13 +8% +20%Inorganic chemical elements 490 15 435 8 621 8 717 9 560 14 -22% +14%Pearls & gems 483 16 175 18 236 19 427 17 538 15 +26% +11%Pigments, paints & varnishes 506 13 351 11 491 13 449 16 494 16 +10% -2%Wool & other animal hair (incl tops) 428 18 407 9 602 10 546 13 465 17 -15% +9%Live animals (excl seafood) 446 17 293 14 282 17 366 18 461 18 +26% +3%Crustaceans, f.c.f. 413 19 192 17 269 18 463 15 460 19 -1% +11%Meat(exclbeef),f.c.f. 360 20 na - 304 16 314 19 381 20 +21% +6%Total merchandise imports 20,049 25,954 34,934 33,687 36,289 +8% +81%
Services importsPersonal travel (not education related) 3,041 1 3,348 1 3,501 1 3,721 1 4,141 1 +11% +36%Other business services 2,885 2 2,709 2 2,851 2 3,125 2 2,916 2 -7% +1%Freight transport 1,215 3 1,096 3 1,458 3 1,461 3 1,539 3 +5% +27%Passenger transport 703 4 851 4 941 4 1,012 4 926 4 -8% +32%Business travel 345 5 343 5 379 5 415 5 414 5 -0% +20%Telecommunications, computer and information services 161 7 171 6 122 6 122 6 183 6 +50% +14%
Finance, Insurance and Pension services 82 9 106 8 114 7 121 7 131 7 +8% +60%Education-related travel 105 8 101 9 99 8 116 8 123 8 +6% +17%Maintenanceandrepairservicesn.i.e. 66 10 16 11 29 11 74 11 115 9 +55% +74%Charges for the use of intellectual property n.i.e 171 6 126 7 94 9 105 9 105 10 +0% -39%
Postal, courier and other transport services 59 11 50 10 58 10 77 10 82 11 +6% +39%Personal, cultural, and recreation services 2 13 8 13 11 12 42 12 17 12 -60% +750%Government goods and services n.i.e 8 12 9 12 10 13 13 13 13 13 +0% +63%Total services imports 8,844 8,934 9,667 10,404 10,705 +3% +21%TOTAL GOODS AND SERVICES IMPORTS 28,893 34,888 44,601 44,091 46,994 +7% +63%
Source: BANKWEST CURTIN ECONOMICS CENTRE | ABS Cat No. 5368.0.
20
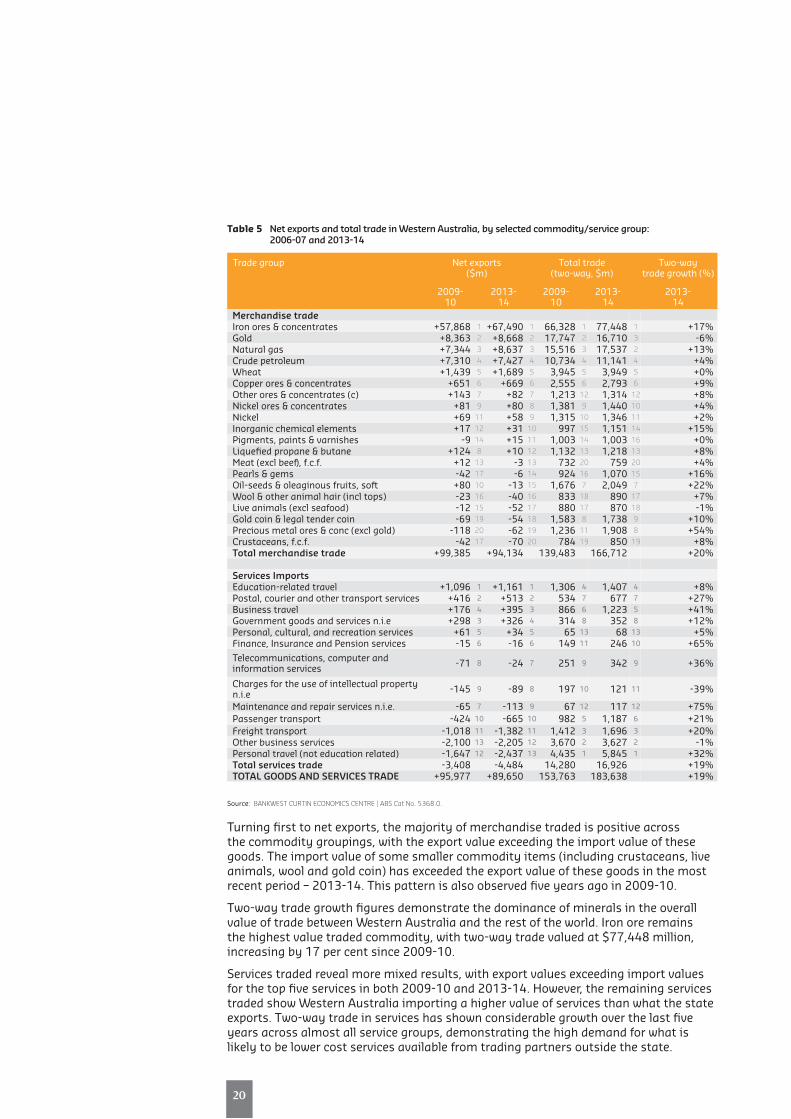
Table 5 Net exports and total trade in Western Australia, by selected commodity/service group: 2006-07 and 2013-14
Trade group Net exports ($m)
Total trade (two-way,$m)
Two-way tradegrowth(%)
2009- 10
2013- 14
2009-10
2013-14
2013- 14
Merchandise tradeIron ores & concentrates +57,868 1 +67,490 1 66,328 1 77,448 1 +17%Gold +8,363 2 +8,668 2 17,747 2 16,710 3 -6%Natural gas +7,344 3 +8,637 3 15,516 3 17,537 2 +13%Crude petroleum +7,310 4 +7,427 4 10,734 4 11,141 4 +4%Wheat +1,439 5 +1,689 5 3,945 5 3,949 5 +0%Copper ores & concentrates +651 6 +669 6 2,555 6 2,793 6 +9%Other ores & concentrates (c) +143 7 +82 7 1,213 12 1,314 12 +8%Nickel ores & concentrates +81 9 +80 8 1,381 9 1,440 10 +4%Nickel +69 11 +58 9 1,315 10 1,346 11 +2%Inorganic chemical elements +17 12 +31 10 997 15 1,151 14 +15%Pigments, paints & varnishes -9 14 +15 11 1,003 14 1,003 16 +0%Liquefied propane & butane +124 8 +10 12 1,132 13 1,218 13 +8%Meat(exclbeef),f.c.f. +12 13 -3 13 732 20 759 20 +4%Pearls & gems -42 17 -6 14 924 16 1,070 15 +16%Oil-seeds & oleaginous fruits, soft +80 10 -13 15 1,676 7 2,049 7 +22%Wool & other animal hair (incl tops) -23 16 -40 16 833 18 890 17 +7%Live animals (excl seafood) -12 15 -52 17 880 17 870 18 -1%Gold coin & legal tender coin -69 19 -54 18 1,583 8 1,738 9 +10%Precious metal ores & conc (excl gold) -118 20 -62 19 1,236 11 1,908 8 +54%Crustaceans, f.c.f. -42 17 -70 20 784 19 850 19 +8%Total merchandise trade +99,385 +94,134 139,483 166,712 +20%
Services ImportsEducation-related travel +1,096 1 +1,161 1 1,306 4 1,407 4 +8%Postal, courier and other transport services +416 2 +513 2 534 7 677 7 +27%Business travel +176 4 +395 3 866 6 1,223 5 +41%Government goods and services n.i.e +298 3 +326 4 314 8 352 8 +12%Personal, cultural, and recreation services +61 5 +34 5 65 13 68 13 +5%Finance, Insurance and Pension services -15 6 -16 6 149 11 246 10 +65%Telecommunications, computer and information services -71 8 -24 7 251 9 342 9 +36%
Charges for the use of intellectual property n.i.e -145 9 -89 8 197 10 121 11 -39%
Maintenanceandrepairservicesn.i.e. -65 7 -113 9 67 12 117 12 +75%Passenger transport -424 10 -665 10 982 5 1,187 6 +21%Freight transport -1,018 11 -1,382 11 1,412 3 1,696 3 +20%Other business services -2,100 13 -2,205 12 3,670 2 3,627 2 -1%Personal travel (not education related) -1,647 12 -2,437 13 4,435 1 5,845 1 +32%Total services trade -3,408 -4,484 14,280 16,926 +19%TOTAL GOODS AND SERVICES TRADE +95,977 +89,650 153,763 183,638 +19%
Source: BANKWEST CURTIN ECONOMICS CENTRE | ABS Cat No. 5368.0.
Turning first to net exports, the majority of merchandise traded is positive across the commodity groupings, with the export value exceeding the import value of these goods. The import value of some smaller commodity items (including crustaceans, live animals, wool and gold coin) has exceeded the export value of these goods in the most recent period – 2013-14. This pattern is also observed five years ago in 2009-10.
Two-way trade growth figures demonstrate the dominance of minerals in the overall value of trade between Western Australia and the rest of the world. Iron ore remains thehighestvaluetradedcommodity,withtwo-waytradevaluedat$77,448million,increasing by 17 per cent since 2009-10.
Services traded reveal more mixed results, with export values exceeding import values for the top five services in both 2009-10 and 2013-14. However, the remaining services traded show Western Australia importing a higher value of services than what the state exports. Two-way trade in services has shown considerable growth over the last five years across almost all service groups, demonstrating the high demand for what is likely to be lower cost services available from trading partners outside the state.
29
21
During the mining boom in Western Australia, net exports to APEC countries have more than doubled as a percentage of GSP, from 15 per cent in 2004 to around 35 per cent in 2011.
TIGER, TIGER, BURNING BRIGHT? Western Australia’s trade and economic development with Asia
Who do we sell to?
WA has clearly benefitted from the rapid industrialisation of East Asia since the 1970s, first led by Japan, and in the past decade, China, with resources supply from Australia fuelling economic growth in that region. The globalisation of the WA economy has been largely tied to a number of key commodities, principally iron ore, crude oil and condensate, liquefied natural gas (LNG) and gold. Although iron ore production has been underpinned by historically healthy prices, recent price falls show the potential for lower global demand to affect the WA economy through lower wages and royalties receipts, and over the medium-term in reduced investment in resources projects.
Figure 8 shows the State’s trade position with major partner country groupings – APEC, ASEAN and the Euro Area. Net export trends for Western Australia are compared with national figures - alongside specific data on the five largest export and import commodity items between WA and each country group.
The Asia Pacific Economic Cooperation (APEC) area includes some of the biggest economies in the world – countries such as Japan, China and the United States of America, and represents by far the largest block of trading partners with Western Australia. While Australia as a nation has maintained its trade balance with APEC countries, Western Australia has been a significant net exporter.
Figure 8 Net exports from WA and Australia to key country groups: share of GSP/GDP, 1990 to 2014
Note: See Glossary for a list of countries in each key group.Source: BANKWEST CURTIN ECONOMICS CENTRE | Authors’ calculations from ABS Cat No 6105.0, July 2014, and Department of Foreign Affairs and Trade -
Australia’s Trade by State and Territory, 2012-13 and 2013-14.
Rati
o of
Net
Exp
ort
from
GSP
/GD
P
June
199
0
June
199
1
June
199
2
June
199
3
June
199
4
June
199
5
June
199
6
June
199
7
June
199
8
June
199
9
June
200
0
June
200
1
June
200
2
June
200
3
June
200
4
June
200
5
June
200
6
June
200
7
June
200
8
June
200
9
June
201
0
June
201
1
June
201
2
June
201
3
June
201
4
0.40
0.35
0.30
0.25
0.20
0.15
0.10
0.05
0
-0.05
(a) Asia-Pacific Economic Cooperation (APEC)
Rati
o of
Net
Exp
ort
from
GSP
/GD
P
June
199
0
June
199
1
June
199
2
June
199
3
June
199
4
June
199
5
June
199
6
June
199
7
June
199
8
June
199
9
June
200
0
June
200
1
June
200
2
June
200
3
June
200
4
June
200
5
June
200
6
June
200
7
June
200
8
June
200
9
June
201
0
June
201
1
June
201
2
June
201
3
June
201
4
0.04
0.03
0.02
0.01
0
-0.01
-0.02
-0.03
(c) European Union
WA Net Export from European Union/GSP AUS Net Export from European Union /GDP
WA Net Export from APEC/GSP AUS Net Export from APEC/GDP
Rati
o of
Net
Exp
ort
from
GSP
/GD
P
June
199
0
June
199
1
June
199
2
June
199
3
June
199
4
June
199
5
June
199
6
June
199
7
June
199
8
June
199
9
June
200
0
June
200
1
June
200
2
June
200
3
June
200
4
June
200
5
June
200
6
June
200
7
June
200
8
June
200
9
June
201
0
June
201
1
June
201
2
June
201
3
June
201
4
0.06
0.05
0.04
0.03
0.02
0.01
0
-0.01
-0.02
-0.03
(b) Association of South East Asian Nations (ASEAN)
WA Net Export from ASEAN/GSP AUS Net Export from ASEAN/GDP
APEC Exports2012-13 2013- 14
Iron ore & concentrates 55,621 72,422 Gold 8,686 11,240 Crude petroleum 9,192 4,336 Wheat 1,820 1,998 Copper ores & concentrates 1,389 1,445 Total 100,799 120,385
Imports2012-13 2013- 14
Refined petroleum 3,835 4,880 Gold 3,621 3,858 Crude petroleum 1,708 1,649 Passenger motor vehicles 1,452 1,319 Tubes & pipes of iron or steel 994 Total 25,147 27,147
ASEAN Exports2012-13 2013- 14
Crude petroleum 3,553 3,129 Gold 2,217 2,770 Wheat 1,041 1,270 Nickel 551 519 Crustaceans, f.c.f. 329 Total 10,578 11,161
Imports2012-13 2013- 14
Refined petroleum 3,436 4,719 Crude petroleum 1,672 1,649 Gold 1,227 524 Iron, steel, aluminium structures 475 411 Goods vehicles 424 395 Total 9,818 10,797
European Union Exports2012-13 2013- 14
Gold 2,720 671 Oil-seeds & oleaginous fruits, soft 439 591 Gold coin & legal tender coin 439 469 Pearls & gems 320 Precious metal ores & conc (excl gold) 283 143 Total 5,447 2,964
Imports2012-13 2013- 14
Passenger motor vehicles 408 477 Rotating electric plants & parts 250 328 Civil engineering equipment & parts 546 230 Specialised machinery & parts 231 211 Pumps (excl liquid pumps) & parts 196 Total 4,565 4,487
22
Western Australia is set to remain a strong net exporter to APEC countries with $120 million in exports overall compared with around $27 million imports in 2013-14.
By far the largest share of exports to APEC countries come from the sale of iron ore and concentrates – principally to China. Gold and crude petroleum feature both as import items as well as exports according to the data presented alongside Figure 8(a), but WA remains a strong net exporter in these commodities. In value terms, passenger and motorvehicleimports(ataround$1.4billion)broadlymatchexportsofcopperoresandconcentrates($1.3billion).Overall,WesternAustraliaissettoremainastrongnetexportertoAPECcountrieswith$120millioninexportsoverallcomparedwitharound$27millionimportsin2013-14.
TheAssociationofSouthEastAsianNations(ASEAN)–includingBrunei,Myanmar,Cambodia,Indonesia,Laos,Malaysia,Philippines,Singapore,ThailandandVietnam–was established principally to maintain political stability in the region. Although the aggregate value of trade with ASEAN countries is significantly smaller than APEC, the ASEAN group of countries nevertheless represents a key developing market for Western Australian trade.
Figure 8(b) shows a declining trend in net exports from WA to ASEAN countries when expressed as a share of gross state product (GSP). Nevertheless, net exports for WA have remained consistently above national trends (when the latter is as a share of gross domestic product). Imports and exports between WA and ASEAN countries consist mostly of petroleum, with overall trade returning to balance after a period of negative net exports around the time of the GFC. Beyond petroleum, trade between Western Australia and ASEAN countries is principally on primary goods, mostly resources and wheat. In contrast, Australia has shifted from a net exporter with ASEAN countries before the start of the millennium to a net importer now.
Figure 8(c) shows that net exports from WA to European Union countries have declined as a share of gross state product since the GFC, and particularly since 2013 with a significant fall in gold exports. Australian Bureau of Statistics data show that WA became a net importer from European Union countries in 2014. Imports from the European Union have mostly been vehicles and manufactured plant and machinery. Notwithstanding the State’s declining trade balance, WA has remained consistently above Australian total net exports measured as a share of gross domestic product.

31
23
Net exports from WA to European Union countries have declined as a share of gross state product since the GFC.
TIGER, TIGER, BURNING BRIGHT? Western Australia’s trade and economic development with Asia
The value of net exports between Western Australia and Asian trade partners in 1999-2000 is mapped in Figure 9. Japan features as a key trading partner, with exports to Japan almost seven times greater in value than imports stemming from Japan into WA. In that period, total trade with Japan – that is the sum of exports and imports – amounted to $7.6 billion, which was the highest among all countries including China. After Japan, South Korea was WA’s second largest trading partner, with total export values of $2.3 billion and imports of $859 million. In 1999-2000, prior to the acceleration in China’s construction-led growth, Singapore was a more important trading partner with WA with respect to total trade. WA’s net export with China was $2.1 billion, with exports of $1.9 billion and imports of $269 million. Among the Asian trading partners, as indicated with shades of blue in Figure 9, WA was a net exporter to all except for Vietnam (net exports of -$365 million) and Malaysia (net exports of -$9 million).
Figure 9 Total net exports from Western Australia by Asian country partner: 1999-2000
Source: BANKWEST CURTIN ECONOMICS CENTRE | Authors’ calculations using ABS Cat No. 5368.0 – International Trade in Goods and Services, Australia, July 2015.
24
Figure 10 presents a contrasting picture of net exports between WA and its Asian trading partners in 2014-15. By this time, China has become unequivocally WA’s largest trading partner. Exports to China totalled $55 billion while imports was almost $5 billion. Japan, South Korea and Singapore remain importing trade partners to the state. India has also emerged as an important partner, and is likely to continue being so. In 1999-2000 WA’s net export to India was a mere $120 million. Fast forward to 2014-15, net export with the second most populous country in the world is $1.5 billion. Figure 10 also shows the reversal in trading pattern between WA and partner countries as compared with 1999-00. Vietnam and Malaysia have turned from being WA’s net importer to net exporter. WA is currently a net importer from New Zealand and Papua New Guinea when, back in 1999-00 we exported more than we imported from these countries.
As well as emerging as the key import market for WA, China is also developing as an investment partner. A recent study found a total of $45.1 billion in completed investment deals between September 2006 and June 2012 were funded by Chinese partners in Australia (KPMG 2012). Of this, $13.9 billion or 30.8% was spent in WA, almost entirely on mining and petroleum projects (99%). The benefits of this investment in mining and petroleum resources has been spread across the broader community in the form of income and consumption impacts from related activities and tax and royalties collections by government. These impacts flow across the community and can be viewed at the aggregate level in terms of per capita Gross State Product (GSP).
Figure 10 Total net exports from Western Australia by Asian country partner: 2014-15
Source: BANKWEST CURTIN ECONOMICS CENTRE | Authors’ calculations using ABS Cat No. 5368.0 – International Trade in Goods and Services, Australia, July 2015.
and new business opportunities
Trade

26
In the short-to-medium term, the value and prospective increases in production volume of WA’s main export commodities depend upon the continued health of China and other emerging markets in Asia, but also the ability of WA to remain competitive as a destination for foreign direct investment both in established and new industry sectors.
Central to these prospects is the strength and breadth of the global economic recovery after the carnage of the Global Financial Crisis (GFC). As Table 6 demonstrates, GDP in most of the advanced economies collapsed in the immediate aftermath of the GFC in 2009. In some cases, growth rates are yet to recover to pre-2008 levels. This is especially true of the Euro Area, where the overall economic situation has recovered only slowly from the overhang of the GFC. The negative real GDP growth experienced by the Euro area in 2012 and 2013 gave way to a modest positive growth of 0.9 per cent in 2014, with future growth projected by the InternationalMonetaryFund(IMF)tohit1.6percentby2016.
The economic growth path for the US is likely to be stronger than most other advancedeconomiesaccordingtoIMFforecasts,risingto3.1percentby2016.Thisis despite the country’s large private debt overhang and ongoing debate about the appropriateness of current fiscal and monetary policy settings.
A tale of two markets
2014 GDP (scaled)
Australia=1
2008 2009 2010 2011 2012 2013 2014 2015 2016
Real GDP growth rates (annual percentage change) Projection
World 105.2 3.1 0.0 5.4 4.2 3.4 3.4 3.4 3.5 3.8
Advanced Economies
United States 16.9 -0.3 -2.8 2.5 1.6 2.3 2.2 2.4 3.1 3.1
Euro Area 12.7 0.5 -4.5 2.0 1.6 -0.8 -0.5 0.9 1.5 1.6
United Kingdom 2.4 -0.3 -4.3 1.9 1.6 0.7 1.7 2.6 2.7 2.3
Canada 1.5 1.2 -2.7 3.4 3.0 1.9 2.0 2.5 2.2 2.0
Japan 4.5 -1.0 -5.5 4.7 -0.5 1.8 1.6 -0.1 1.0 1.2
Emerging and Developing Asia (selected)
China 17.5 9.6 9.2 10.4 9.3 7.8 7.8 7.4 6.8 6.3
India 7.2 3.9 8.5 10.3 6.6 5.1 6.9 7.2 7.5 7.5
Indonesia 2.6 7.4 4.7 6.4 6.2 6.0 5.6 5.0 5.2 5.5
Papua New Guinea 0.02 6.6 6.1 7.7 10.7 8.1 5.5 5.8 19.3 3.3
Philippines 0.7 4.2 1.1 7.6 3.7 6.8 7.2 6.1 6.7 6.3
Thailand 1.0 2.5 -2.3 7.8 0.1 6.5 2.9 0.7 3.7 4.0
Malaysia 0.7 4.8 -1.5 7.4 5.2 5.6 4.7 6.0 4.8 4.9
Vietnam 0.5 5.7 5.4 6.4 6.2 5.2 5.4 6.0 6.0 5.8
Note: World GDP is weighted using GDP weights at purchasing power parity (PPP). Source: BANKWEST CURTIN ECONOMICS CENTRE | IMF World Economic Outlook, April 2015, Appendix A1/A4 & the World Bank World Development Indicators.
Table 6 Real GDP growth – key countries and areas: 2008 to 2014 (actual) and 2015-16 (forecast)

35
27
TIGER, TIGER, BURNING BRIGHT? Western Australia’s trade and economic development with Asia
The third major developed economy, Japan, has endured a bumpy economic ride since the GFC. However, a recent shift towards expansive monetary and fiscal policy provides the basis for cautious optimism in Japan’s future growth trajectory – with growth forecast to hit around 1.2 per cent by 2016. This should provide some support for trade exports in some of WA’s principal commodities such as iron ore and LNG.
The story elsewhere in Asia is quite different, especially for WA’s key export markets – China and Korea. China’s expansion has become increasing uncertain due to changes in the senior political leadership of that country, currency pressures and rising levels of credit, particularly in housing and infrastructure, two areas which are crucial to China’s continued support for the expansion of iron ore and LNG exports. The current IMFassessmentindicatesthatChinawillseereasonablystronggrowthoveratleastthe next two years, albeit at reduced levels to that seen in the middle of the last decade.
Figure 11 Real annual GDP growth, advanced and emerging Asian economies: 2008 to 2016
Source: BANKWEST CURTIN ECONOMICS CENTRE | IMF World Economic Outlook, April 2015, Appendix A1/A4 & the World Bank World Development Indicators.
United States United Kingdom Euro Area Japan
(i) Advanced economies
Real
ann
ual G
DP
grow
th (%
)
12.0
10.0
8.0
6.0
4.0
2.0
0
-2.0
-4.0
-6.0
2008
2009
2010
2011
2012
2013
2014
2015
2016
China India Indonesia Philippines Thailand Malaysia Vietnam
(ii) Emerging Asian economies
Real
ann
ual G
DP
grow
th (%
)
12.0
10.0
8.0
6.0
4.0
2.0
0
-2.0
-4.0
-6.0
2008
2009
2010
2011
2012
2013
2014
2015
2016
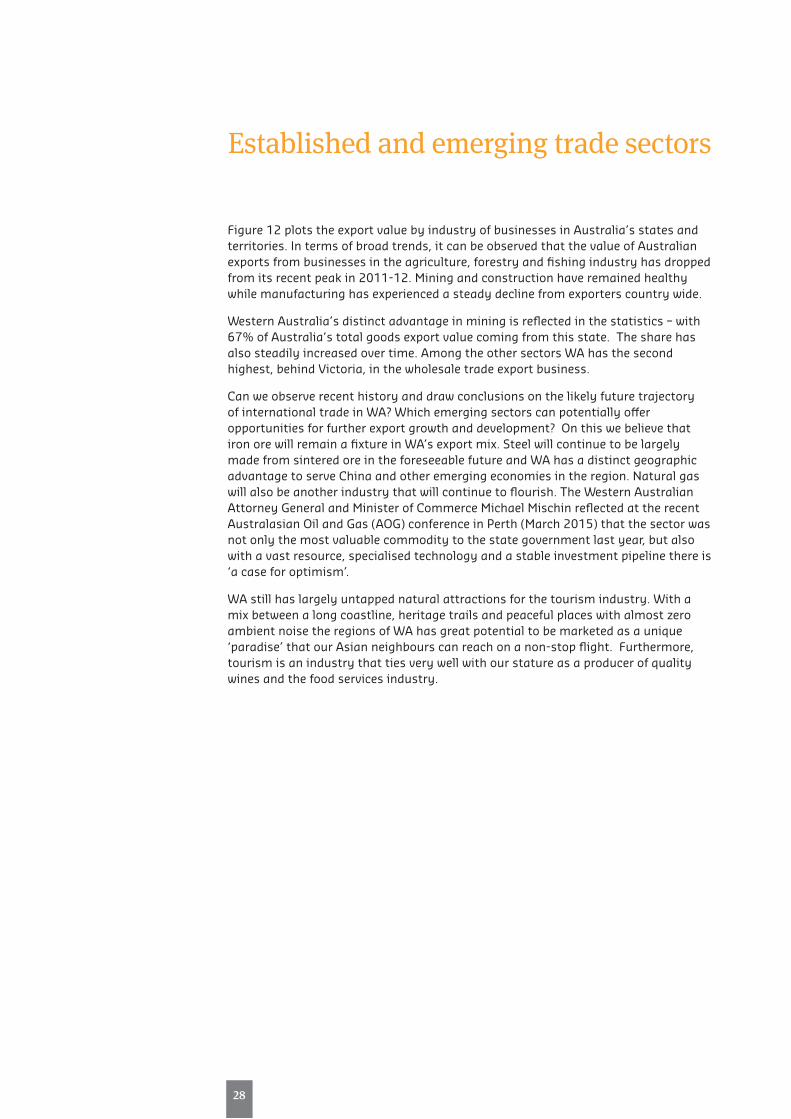
28
Figure 12 plots the export value by industry of businesses in Australia’s states and territories. In terms of broad trends, it can be observed that the value of Australian exports from businesses in the agriculture, forestry and fishing industry has dropped fromitsrecentpeakin2011-12.Miningandconstructionhaveremainedhealthywhile manufacturing has experienced a steady decline from exporters country wide.
Western Australia’s distinct advantage in mining is reflected in the statistics – with 67%ofAustralia’stotalgoodsexportvaluecomingfromthisstate.Thesharehasalso steadily increased over time. Among the other sectors WA has the second highest, behind Victoria, in the wholesale trade export business.
Can we observe recent history and draw conclusions on the likely future trajectory of international trade in WA? Which emerging sectors can potentially offer opportunities for further export growth and development? On this we believe that iron ore will remain a fixture in WA’s export mix. Steel will continue to be largely made from sintered ore in the foreseeable future and WA has a distinct geographic advantage to serve China and other emerging economies in the region. Natural gas will also be another industry that will continue to flourish. The Western Australian AttorneyGeneralandMinisterofCommerceMichaelMischinreflectedattherecentAustralasianOilandGas(AOG)conferenceinPerth(March2015)thatthesectorwasnot only the most valuable commodity to the state government last year, but also with a vast resource, specialised technology and a stable investment pipeline there is ‘a case for optimism’.
WA still has largely untapped natural attractions for the tourism industry. With a mix between a long coastline, heritage trails and peaceful places with almost zero ambient noise the regions of WA has great potential to be marketed as a unique ‘paradise’ that our Asian neighbours can reach on a non-stop flight. Furthermore, tourism is an industry that ties very well with our stature as a producer of quality wines and the food services industry.
Established and emerging trade sectors

37
29
TIGER, TIGER, BURNING BRIGHT? Western Australia’s trade and economic development with Asia
Figure 12 Export sales for major commodity groups, by state/territory: value of exports and national share, 2006 to 2014
Source: BANKWEST CURTIN ECONOMICS CENTRE | ABS Cat No. 5368.0.
WA NSW VIC QLD SA TAS NT
Valu
e of
exp
ort
sale
s ($
m) 9,000
8,0007,0006,0005,0004,0003,0002,0001,000
0
2006
-07
2007
-08
2008
-09
2009
-10
2010
-11
2011
-12
2012
-13
2013
-14
(a) Agriculture, forestry and fishing
Shar
e of
nat
iona
l exp
orts
100%90%80%70%60%50%40%30%20%10%
0%20
06-0
7
2007
-08
2008
-09
2009
-10
2010
-11
2011
-12
2012
-13
2013
-14
Valu
e of
exp
ort
sale
s ($
m) 160,000
140,000120,000100,000
80,00060,00040,00020,000
0
2006
-07
2007
-08
2008
-09
2009
-10
2010
-11
2011
-12
2012
-13
2013
-14
(b)Mining
Shar
e of
nat
iona
l exp
orts
100%90%80%70%60%50%40%30%20%10%
0%
2006
-07
2007
-08
2008
-09
2009
-10
2010
-11
2011
-12
2012
-13
2013
-14
Valu
e of
exp
ort
sale
s ($
m) 60,000
50,000
40,000
30,000
20,000
10,000
0
2006
-07
2007
-08
2008
-09
2009
-10
2010
-11
2011
-12
2012
-13
2013
-14
(c)Manufacturing
Shar
e of
nat
iona
l exp
orts
100%90%80%70%60%50%40%30%20%10%
0%
2006
-07
2007
-08
2008
-09
2009
-10
2010
-11
2011
-12
2012
-13
2013
-14
30
WA NSW VIC QLD SA TAS NT
Valu
e of
exp
ort
sale
s ($
m) 900
800700600500400300200100
0
2006
-07
2007
-08
2008
-09
2009
-10
2010
-11
2011
-12
2012
-13
2013
-14
(d) Construction
Shar
e of
nat
iona
l exp
orts
100%90%80%70%60%50%40%30%20%10%
0%
2006
-07
2007
-08
2008
-09
2009
-10
2010
-11
2011
-12
2012
-13
2013
-14
Valu
e of
exp
ort
sale
s ($
m) 35,000
30,000
25,000
20,000
15,000
10,000
5,000
0
2006
-07
2007
-08
2008
-09
2009
-10
2010
-11
2011
-12
2012
-13
2013
-14
(e) Wholesale tradeSh
are
of n
atio
nal e
xpor
ts
100%90%80%70%60%50%40%30%20%10%
0%
2006
-07
2007
-08
2008
-09
2009
-10
2010
-11
2011
-12
2012
-13
2013
-14
Valu
e of
exp
ort
sale
s ($
m) 4,000
3,500
3,000
2,500
2,000
1,500
1000
0
2006
-07
2007
-08
2008
-09
2009
-10
2010
-11
2011
-12
2012
-13
2013
-14
(f) Retail trade
Shar
e of
nat
iona
l exp
orts
100%90%80%70%60%50%40%30%20%10%
0%
2006
-07
2007
-08
2008
-09
2009
-10
2010
-11
2011
-12
2012
-13
2013
-14
Source: BANKWEST CURTIN ECONOMICS CENTRE | ABS Cat No. 5368.0.
Figure 12 (cont) Export sales for major commodity groups, by state/territory: value of exports and national share, 2006 to 2014

39
31
TIGER, TIGER, BURNING BRIGHT? Western Australia’s trade and economic development with Asia
Source: BANKWEST CURTIN ECONOMICS CENTRE | Authors’ calculations using ABS Cat No. 5368.0.
WA NSW VIC QLD SA TAS NT
Valu
e of
exp
ort
sale
s ($
m)
(g) Transport, postal and warehousing
2,500
2,000
1,500
1,000
500
0
2006
-07
2007
-08
2008
-09
2009
-10
2010
-11
2011
-12
2012
-13
2013
-14
Shar
e of
nat
iona
l exp
orts
100%90%80%70%60%50%40%30%20%10%
0%20
06-0
7
2007
-08
2008
-09
2009
-10
2010
-11
2011
-12
2012
-13
2013
-14
Valu
e of
exp
ort
sale
s ($
m)
(h) Other exports
40,00035,00030,00025,00020,00015,00010,000
5,0000
2006
-07
2007
-08
2008
-09
2009
-10
2010
-11
2011
-12
2012
-13
2013
-14
Shar
e of
nat
iona
l exp
orts
100%90%80%70%60%50%40%30%20%10%
0%
2006
-07
2007
-08
2008
-09
2009
-10
2010
-11
2011
-12
2012
-13
2013
-14
Figure 12 (cont) Export sales for major commodity groups, by state/territory: value of exports and national share, 2006 to 2014

32
How compelling is the ‘focus on quality’ narrative in setting the direction of Western Australia’s trade and industry strategies? How well positioned is WA to capitalise on new markets for hi-tech or high-end products?
The transformative effect of economic liberalisation on societies across the Asian continent presents WA with important opportunities for further growth and development. Higher discretionary incomes among the much-vaunted rising middle class in Asia’s emerging economies is creating a growing demand for premium consumption. This in turn provides WA businesses with new and expanded outlets for trade in high value resources – gold and nickel – as well as prestige and luxury commodities in the agriculture, aquaculture and food sectors. There are greater opportunities also for tourism and education exports.
By virtue of its sheer scale, China naturally offers the greatest opportunity for a further expansion of exports of such high value commodity items. However, such markets are also developing with other Asian trading partners – Indonesia, MalaysiaandparticularlyIndia.Japanhasamoreestablisheddemandforpremiumcommodities, but remains an important outlet should WA expand production in these ‘boutique’ areas.
To capitalise on this opportunity requires effective networks to build an awareness of the tastes and preferences of the growing middle class within the Asian region. The challenge in following the ‘focus on quality’ strategy is to discern which products and services they want, and which of those Western Australia can offer.
WA has a natural advantage in servicing global demand for high quality produce, being well situated in relation to time-zones and proximity to most of the Asian countries. The prospect of developing fully online businesses which can process, receive payment and dispatch product from WA to Asian countries within a tight timeframe is an important opportunity to capitalise on this advantage.
Online ordering of food into countries such as Japan and China are especially welcomed, given the high value placed on the quality of Australian produce. However, the infrastructure and supply chain requirements to service the global demand for quality in fresh or perishable produce present more challenges to regional or small businesses.Mostlargescalecompaniesareabletoinvestcapitalthemselvestomaintain or build the required infrastructure. However, the same is less likely to be true of niche industries or boutique suppliers. Developing ‘common use’ infrastructure to help WA’s trade with Asia is more difficult if it is to be Government funded, which opens up an opportunity for private partnerships, foreign direct investment and business collaborations in regard to essential infrastructure.
A focus on quality
41
33
TIGER, TIGER, BURNING BRIGHT? Western Australia’s trade and economic development with Asia
It is the case that, historically, Western Australia has been a net importer of high-tech merchandise and services. It had been the case that we have been better off, in terms of comparative advantage, to simply import ‘knowledge’ from overseas and focus on exporting items and services that are most profitable. In recent times we have been seeing notable changes. Several sectors in the WA economy are at the forefront of innovation and implementing knowledge management in their businesses. However, there is much more to do.
Given the importance of education to the State, and the excellence of the education and business sectors in research and innovation, WA is increasingly being correctly tagged as a ‘knowledge economy’. The key is to translate R&D and innovation into marketable (and exportable) product.
The great challenge for the state, and indeed for Australia, is to bridge the gap between fundamental knowledge and innovation on the one hand, and commercialisation and export on the other. Continued support to small and medium businesses with investment capital would be beneficial to their ability to build business capability in regards to product development and production. So too are there benefits from marketing and promotion, to be able to service potential markets.
WA as a ‘knowledge economy’ – translating innovation to exports
34
WA is extremely well positioned to capitalise on new trading opportunities both in terms of the scale and composition of its trade with Asian partners.
MovingfromthecountrygroupanalysisearlierinthisreporttoanexaminationofWA’s trade with specific Asian country partners provides a more nuanced profile of the State’s trade trajectory. The purpose of this section is to gain some further insight into the changing patterns of trade between Western Australia and those Asian emerging economies with which the State has formed significant trading relationships.
Asia is strategically important by virtue of its geographical proximity, of course, but the narrative regarding trading patterns and new trading opportunities is changing. Dr Andrew Crane, CEO of CBH Group, pointed to the changing landscape of trading relationships with emerging economies in Asia. He observed that the traditional notion of the bilateral trader (“we sell, you buy”) is giving way to more sophisticated international partnerships between Australian and Asian companies selling into a global market (Crane, 2015).
China remains the State’s most significant trading partner, with the unprecedented growth in net exports to China since the start of the millennium creating a dependence in WA’s economic growth and prosperity. China displaced Japan some time ago as the State’s major international customer for iron ore, and other fuel and metal resources, yet Japan remains a significant and important trading partner. Taken together, the value of WA’s exports to China and Japan amounted to some $95billionin2013-14.
Despite recent volatilities in the price of primary commodities, the trade in resources with China will continue to dominate. However, trading opportunities have also developed with other Asian countries over the last five years – and WA is extremely well positioned to capitalise on such opportunities both in terms of the scale and composition of its trade with Asian partners. The WA economy can gain strength and resilience through trade diversification, not just in the breadth of commodities traded but also the countries with whom we do business.
Country trade and partnerships
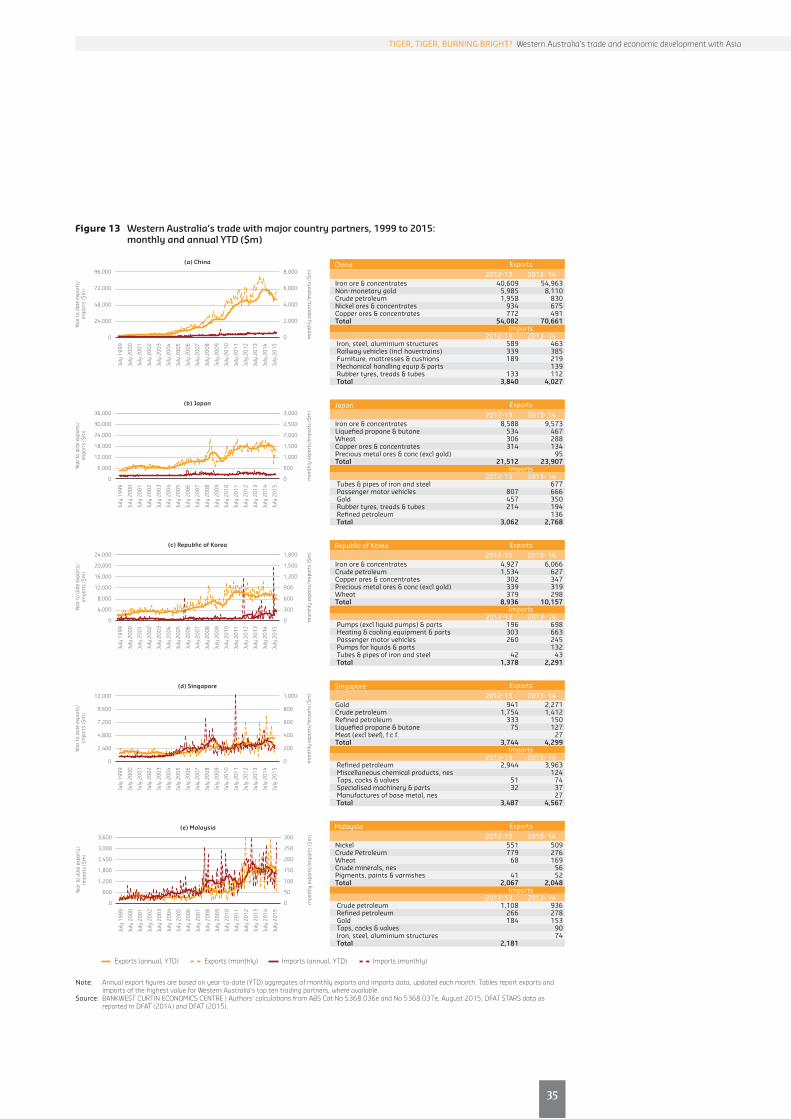
43
35
TIGER, TIGER, BURNING BRIGHT? Western Australia’s trade and economic development with Asia
(e) Malaysia
Year
to
date
exp
orts
/ im
port
s ($
m)
mon
thly
exp
orts
/im
port
s ($
m)3,600
3,000
2,400
1,800
1,200
600
0
300
250
200
150
100
50
0
July
199
9
July
200
0
July
200
1
July
200
2
July
200
3
July
200
4
July
200
5
July
200
6
July
200
7
July
200
8
July
200
9
July
201
0
July
201
1
July
201
2
July
201
3
July
201
4
July
201
5
Figure 13 Western Australia’s trade with major country partners, 1999 to 2015: monthly and annual YTD ($m)
Exports (annual, YTD) Exports (monthly) Imports (annual, YTD) Imports (monthly)
Note: Annual export figures are based on year-to-date (YTD) aggregates of monthly exports and imports data, updated each month. Tables report exports and imports of the highest value for Western Australia’s top ten trading partners, where available.
Source: BANKWEST CURTIN ECONOMICS CENTRE | Authors’ calculations from ABS Cat No 5368.036e and No 5368.037e, August 2015; DFAT STARS data as reported in DFAT (2014) and DFAT (2015).
(a) China
Year
to
date
exp
orts
/ im
port
s ($
m)
mon
thly
exp
orts
/im
port
s ($
m)96,000
72,000
48,000
24,000
0
8,000
6,000
4,000
2,000
0
July
199
9
July
200
0
July
200
1
July
200
2
July
200
3
July
200
4
July
200
5
July
200
6
July
200
7
July
200
8
July
200
9
July
201
0
July
201
1
July
201
2
July
201
3
July
201
4
July
201
5
(b) Japan
Year
to
date
exp
orts
/ im
port
s ($
m)
mon
thly
exp
orts
/im
port
s ($
m)36,000
30,000
24,000
18,000
12,000
6,000
0
3,000
2,500
2,000
1,500
1,000
500
0
July
199
9
July
200
0
July
200
1
July
200
2
July
200
3
July
200
4
July
200
5
July
200
6
July
200
7
July
200
8
July
200
9
July
201
0
July
201
1
July
201
2
July
201
3
July
201
4
July
201
5
(c) Republic of Korea
Year
to
date
exp
orts
/ im
port
s ($
m)
mon
thly
exp
orts
/im
port
s ($
m)24,000
20,000
16,000
12,000
8,000
4,000
0
1,800
1,500
1,200
900
600
300
0
July
199
9
July
200
0
July
200
1
July
200
2
July
200
3
July
200
4
July
200
5
July
200
6
July
200
7
July
200
8
July
200
9
July
201
0
July
201
1
July
201
2
July
201
3
July
201
4
July
201
5
(d) Singapore
Year
to
date
exp
orts
/ im
port
s ($
m)
mon
thly
exp
orts
/im
port
s ($
m)12,000
9,600
7,200
4,800
2,400
0
1,000
800
600
400
200
0
July
199
9
July
200
0
July
200
1
July
200
2
July
200
3
July
200
4
July
200
5
July
200
6
July
200
7
July
200
8
July
200
9
July
201
0
July
201
1
July
201
2
July
201
3
July
201
4
July
201
5China Exports
2012-13 2013- 14Iron ore & concentrates 40,609 54,963 Non-monetary gold 5,985 8,110 Crude petroleum 1,958 830 Nickel ores & concentrates 934 675 Copper ores & concentrates 772 491 Total 54,082 70,661
Imports2012-13 2013- 14
Iron, steel, aluminium structures 589 463 Railway vehicles (incl hovertrains) 339 385 Furniture, mattresses & cushions 189 219 Mechanicalhandlingequip&parts 139 Rubber tyres, treads & tubes 133 112 Total 3,840 4,027
Japan Exports2012-13 2013- 14
Iron ore & concentrates 8,588 9,573 Liquefied propane & butane 534 467 Wheat 306 288 Copper ores & concentrates 314 134 Precious metal ores & conc (excl gold) 95 Total 21,512 23,907
Imports2012-13 2013- 14
Tubes & pipes of iron and steel 677 Passenger motor vehicles 807 666 Gold 457 350 Rubber tyres, treads & tubes 214 194 Refined petroleum 136 Total 3,062 2,768
Republic of Korea Exports2012-13 2013- 14
Iron ore & concentrates 4,927 6,066 Crude petroleum 1,534 627 Copper ores & concentrates 302 347 Precious metal ores & conc (excl gold) 339 319 Wheat 379 298 Total 8,936 10,157
Imports2012-13 2013- 14
Pumps (excl liquid pumps) & parts 196 698 Heating & cooling equipment & parts 303 663 Passenger motor vehicles 260 245 Pumps for liquids & parts 132 Tubes & pipes of iron and steel 42 43 Total 1,378 2,291
Singapore Exports2012-13 2013- 14
Gold 941 2,271 Crude petroleum 1,754 1,412 Refined petroleum 333 150 Liquefied propane & butane 75 127 Meat(exclbeef),f.c.f. 27 Total 3,744 4,299
Imports2012-13 2013- 14
Refined petroleum 2,944 3,963 Miscellaneouschemicalproducts,nes 124 Taps, cocks & valves 51 74 Specialised machinery & parts 32 37 Manufacturesofbasemetal,nes 27 Total 3,487 4,567
Malaysia Exports2012-13 2013- 14
Nickel 551 509 Crude Petroleum 779 276 Wheat 68 169 Crude minerals, nes 56 Pigments, paints & varnishes 41 52 Total 2,067 2,048
Imports2012-13 2013- 14
Crude petroleum 1,108 936 Refined petroleum 266 278 Gold 184 153 Taps, cocks & valves 90 Iron, steel, aluminium structures 74 Total 2,181
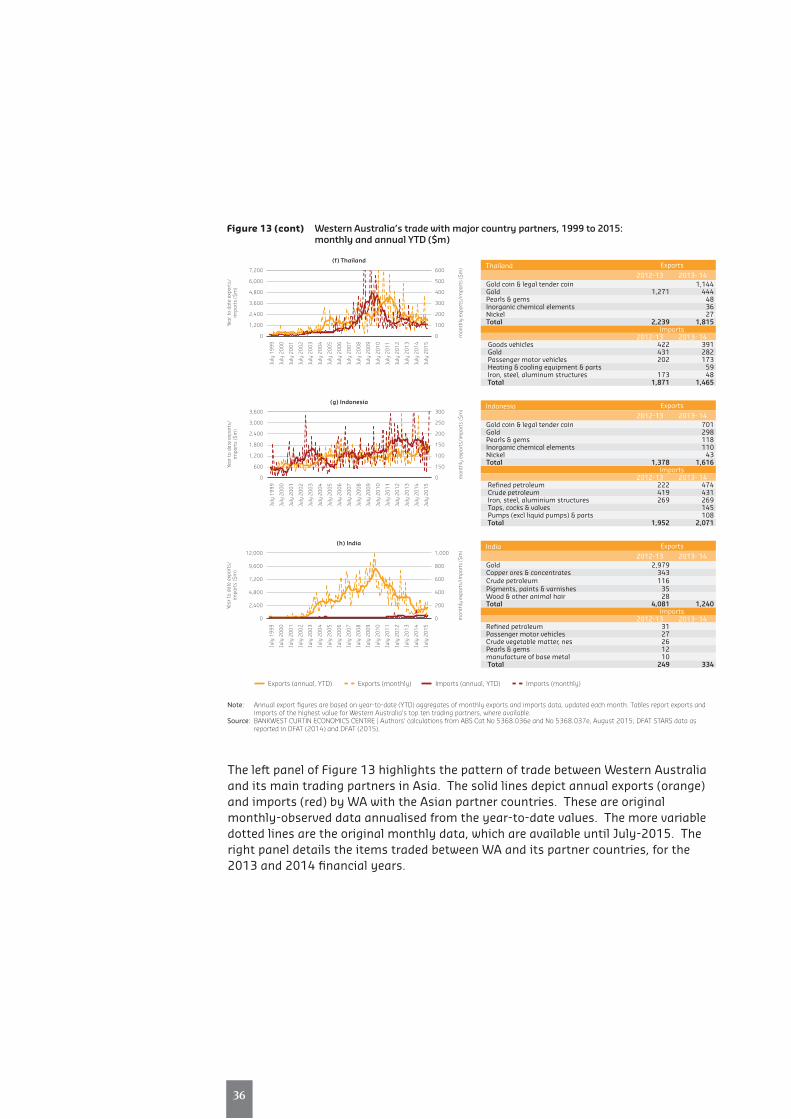
36
(h) India
Year
to
date
exp
orts
/ im
port
s ($
m)
mon
thly
exp
orts
/im
port
s ($
m)12,000
9,600
7,200
4,800
2,400
0
1,000
800
600
400
200
0
July
199
9
July
200
0
July
200
1
July
200
2
July
200
3
July
200
4
July
200
5
July
200
6
July
200
7
July
200
8
July
200
9
July
201
0
July
201
1
July
201
2
July
201
3
July
201
4
July
201
5
Figure 13 (cont) Western Australia’s trade with major country partners, 1999 to 2015: monthly and annual YTD ($m)
Exports (annual, YTD) Exports (monthly) Imports (annual, YTD) Imports (monthly)
Note: Annual export figures are based on year-to-date (YTD) aggregates of monthly exports and imports data, updated each month. Tables report exports and imports of the highest value for Western Australia’s top ten trading partners, where available.
Source: BANKWEST CURTIN ECONOMICS CENTRE | Authors’ calculations from ABS Cat No 5368.036e and No 5368.037e, August 2015; DFAT STARS data as reported in DFAT (2014) and DFAT (2015).
Thailand Exports2012-13 2013- 14
Gold coin & legal tender coin 1,144 Gold 1,271 444 Pearls & gems 48 Inorganic chemical elements 36 Nickel 27 Total 2,239 1,815
Imports2012-13 2013- 14
Goods vehicles 422 391 Gold 431 282 Passenger motor vehicles 202 173 Heating & cooling equipment & parts 59 Iron, steel, aluminum structures 173 48 Total 1,871 1,465
Indonesia Exports2012-13 2013- 14
Gold coin & legal tender coin 701 Gold 298 Pearls & gems 118 Inorganic chemical elements 110 Nickel 43 Total 1,378 1,616
Imports2012-13 2013- 14
Refined petroleum 222 474 Crude petroleum 419 431 Iron, steel, aluminium structures 269 269 Taps, cocks & valves 145 Pumps (excl liquid pumps) & parts 108 Total 1,952 2,071
India Exports2012-13 2013- 14
Gold 2,979 Copper ores & concentrates 343Crude petroleum 116Pigments, paints & varnishes 35Wood & other animal hair 28Total 4,081 1,240
Imports2012-13 2013- 14
Refined petroleum 31Passenger motor vehicles 27Crude vegetable matter, nes 26Pearls & gems 12manufacture of base metal 10 Total 249 334
(f) Thailand
Year
to
date
exp
orts
/ im
port
s ($
m)
mon
thly
exp
orts
/im
port
s ($
m)7,200
6,000
4,800
3,600
2,400
1,200
0
600
500
400
300
200
100
0
July
199
9
July
200
0
July
200
1
July
200
2
July
200
3
July
200
4
July
200
5
July
200
6
July
200
7
July
200
8
July
200
9
July
201
0
July
201
1
July
201
2
July
201
3
July
201
4
July
201
5
(g) Indonesia
Year
to
date
exp
orts
/ im
port
s ($
m)
mon
thly
exp
orts
/im
port
s ($
m)3,600
3,000
2,400
1,800
1,200
600
0
300
250
200
150
100
150
0
July
199
9
July
200
0
July
200
1
July
200
2
July
200
3
July
200
4
July
200
5
July
200
6
July
200
7
July
200
8
July
200
9
July
201
0
July
201
1
July
201
2
July
201
3
July
201
4
July
201
5
The left panel of Figure 13 highlights the pattern of trade between Western Australia and its main trading partners in Asia. The solid lines depict annual exports (orange) and imports (red) by WA with the Asian partner countries. These are original monthly-observed data annualised from the year-to-date values. The more variable dotted lines are the original monthly data, which are available until July-2015. The right panel details the items traded between WA and its partner countries, for the 2013 and 2014 financial years.
45
37
TIGER, TIGER, BURNING BRIGHT? Western Australia’s trade and economic development with Asia
Iron ore is the dominant export commodity from WA to our top three partners: China,JapanandSouthKorea.SmallereconomiessuchasSingaporeandMalaysia,where construction-driven industrialisation or industries such as ship building and automobiles are not as prevalent as they are for the East Asian countries, import other resources from WA such as gold and nickel. Overall, WA is a net exporter toChina,JapanandSouthKorea.TradewithSingaporeandMalaysiaarelargelybalanced, with imports slightly exceeding exports. In the case of the other South East Asian countries, WA is a net exporter with Thailand and a net importer with Indonesia.
The last panel in Figure 13 shows WA’s export and import with India. Gold is by far the commodity that India imports most from Western Australia, or anywhere for that matter, for there is little to no gold-mining industry in India and gold is a highly-valued commodity as a storage of wealth and as dowry for the family of brides. India’s import of West Australian gold had a trend increase from the start of the last decade until mid-2010 when import duties were hiked significantly. This reversed the trendinadramaticfashion,asthepolicyintended.Morerecentstatisticsfrom2014show that gold remains India’s top merchandise import from Western Australia. However,thevalueshavedeclinedconsiderablyfromalmost$3billionin2012-13toaround$700millionin2014.Copperoresandconcentratesandcrudepetroleumremain important export commodities to India from WA.
Overall, minerals are significant part of Western Australian exports to our partners in Asia. In terms of imports, a sizeable proportion are processed or manufactured goods. As an example, WA’s top import item from China are structures made from iron, steel and aluminium. Tubes and pipes made from iron and steel as well as passenger vehicles are the top two imported items from Japan. WA’s import from Korea include electrical products such as pumps and parts and heating and cooling equipment.


and regional development
WA trade

40
Western Australia is not only a vast state - in terms of area, it is by far the largest in Australia. It is also diverse in terms of communities, population density, climate and natural endowment. In this section, we examine trade - particularly the export of goods and services - from the perspective of the regions within WA. Doing so allows us to capture inherent nuances in the regions that might not be revealed when looking at the state as a whole.
There are nine regions in Western Australia as delineated by the Regional Development Commissions Act 1993. Figure 14 shows their boundaries and predominant industries. There is a good mix of merchandise production and service-oriented industries within the state. Duncan and Leong (2014) calculated that Pilbara and Goldfields-Esperance have economies (size as captured by Gross Regional Product) that are the most skewed, with Mining generating almost 90% of both regions’ income. By contrast, the Great Southern and South West spread their resources over a wider range of products and services - both derive around 20% of their regional product from Construction, with the remainder split relatively evenly between the other industries.
WA regions and their diversity
Figure 14 The regions of Western Australia and principal industries
Note: Principal industry identification from the Regional Development Commissions.Source: BANKWEST CURTIN ECONOMICS CENTRE | BCEC, Regional Development Commissions.

49
41
Mining is the largest employer in the Pilbara and Goldfields-Esperance.
The South West in the only region where Manufacturing is still the largest employer, where it is marginally bigger than Retail trade.
TIGER, TIGER, BURNING BRIGHT? Western Australia’s trade and economic development with Asia
The West Australian economy has been characterised by significant structural changes over the past few decades. Alongside the increase in the share of mining, presentlyat30%,therehasalsobeenanincreaseintheshareofconstructionandadecrease in manufacturing (Table 1). Reflecting, until recent times, the strong growth in house prices the ownership of dwellings component has also displayed sustained strength.
To obtain a more in-depth look at regional WA exports we begin by examining the nature of the regional labour force in Table 7. Among the 1.1 million strong workforce in2011,almost17%belongtotheMiningandassociatedConstructionindustries.10.4%areemployedintheHealthCareandSocialAssistancesector.ThereisalsoasizeableworkforceinRetailTrade(10.1%).
MiningisthelargestemployerinthePilbaraandGoldfields-Esperance,withthepercentageoftheirworkforceinmining(41%and27%,respectively)dwarfingtheirsecond largest industries, which is Construction for the Pilbara and Retail trade for theGoldfields.MiningisalsotheMidWest’slargestemployer,thoughitdoesnotdominate the workforce as it does in the Pilbara and Goldfields - Esperance The Great Southern region and the Wheatbelt have the largest workforce in Agriculture, Forestry andFishing.TheSouthWestintheonlyregionwhereManufacturingisstillthelargest employer, where it is marginally bigger than Retail trade.
Whilst the distribution of the workforce is a good indicator of the structure of the regional economies another indicator that can offer additional insight is the physical number of businesses in each industry in each region. On this Table 8 breaks down the 218,610 Australian businesses in the state into region and by industrial sectors. With a population of 59,935 persons in 2014 the Great Southern region has the most number of businesses per capita, with 11 businesses per 100 persons. In contrast, the Pilbara, with a 2014 population of 67,503, has the lowest business count per capita, at 3.6 businesses per 100 persons.
The industrial sector with the highest number of businesses in the Gascoyne, Goldfields–Esperance,GreatSouthern,MidWestandWheatbeltisAgriculture,ForestryandFishing.Miningdoesnotfeatureamongthecountofthetop10businesses in any region, which reflects the concentration of the industry into a small number of (highly profitable) large businesses.
WA regions: Workforce and nature of businesses
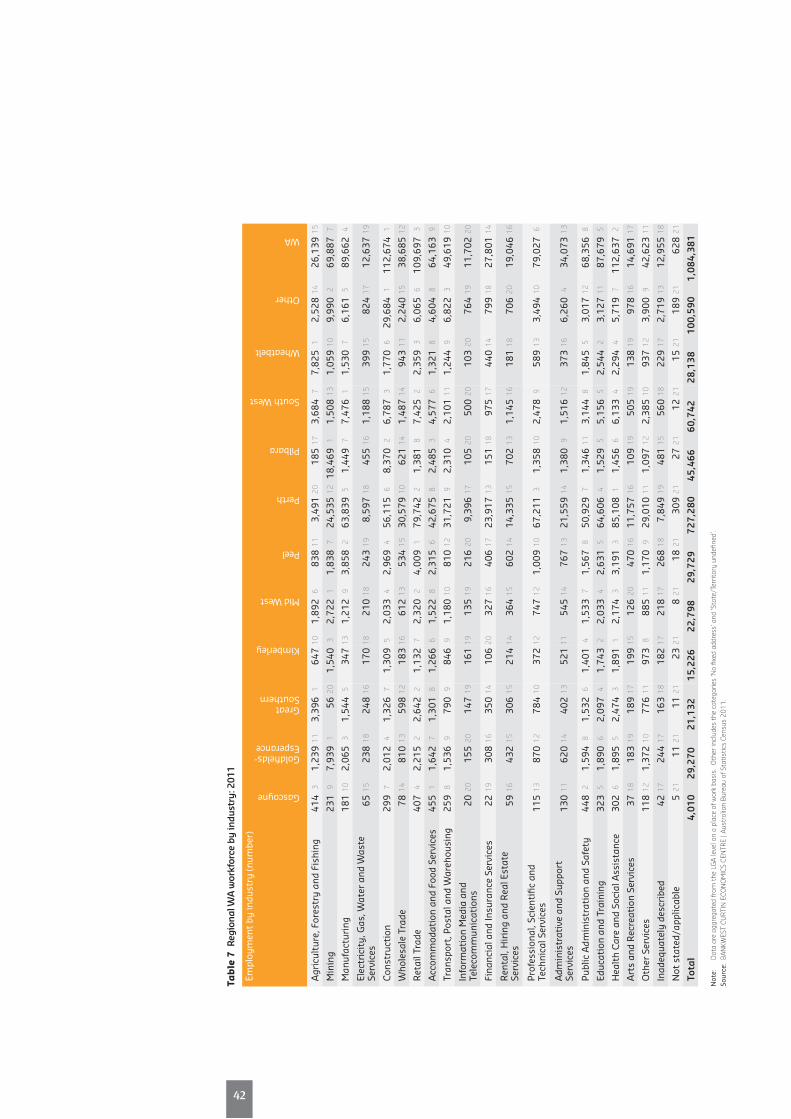
42
Tab
le 7
Reg
iona
l WA
wor
kfor
ce b
y in
dust
ry: 2
011
Empl
oym
ent
by in
dust
ry (n
umbe
r)
Gascoyne
Goldfields- Esperance
Great Southern
Kimberley
MidWest
Peel
Perth
Pilbara
South West
Wheatbelt
Other
WA
Agr
icul
ture
, For
estr
y an
d Fi
shin
g 4
14 3
1,2
39 1
1 3
,396
1 6
47 1
0 1
,892
6 8
38 1
1 3
,491
20
185
17
3,6
84 7
7,8
25 1
2,5
28 1
4 2
6,13
9 15
Min
ing
231
9 7
,939
1 5
6 20
1,5
40 3
2,7
22 1
1,8
38 7
24,
535
12 1
8,46
9 1
1,5
08 1
3 1
,059
10
9,9
90 2
69,
887
7
Man
ufac
turing
181
10
2,0
65 3
1,5
44 5
347
13
1,2
12 9
3,8
58 2
63,
839
5 1
,449
7 7
,476
1 1
,530
7 6
,161
5 8
9,66
2 4
Elec
tric
ity,
Gas
, Wat
er a
nd W
aste
Se
rvic
es 6
5 15
238
18
248
16
170
18
210
18
243
19
8,5
97 1
8 4
55 1
6 1
,188
15
399
15
824
17
12,
637
19
Con
stru
ctio
n 2
99 7
2,0
12 4
1,3
26 7
1,3
09 5
2,0
33 4
2,9
69 4
56,
115
6 8
,370
2 6
,787
3 1
,770
6 2
9,68
4 1
112
,674
1
Who
lesa
le T
rade
78
14 8
10 1
3 5
98 1
2 1
83 1
6 6
12 1
3 5
34 1
5 3
0,57
9 10
621
14
1,4
87 1
4 9
43 1
1 2
,240
15
38,
685
12
Ret
ail T
rade
407
4 2
,215
2 2
,642
2 1
,132
7 2
,320
2 4
,009
1 7
9,74
2 2
1,3
81 8
7,4
25 2
2,3
59 3
6,0
65 6
109
,697
3
Acc
omm
odat
ion
and
Food
Ser
vice
s 4
55 1
1,6
42 7
1,3
01 8
1,2
66 6
1,5
22 8
2,3
15 6
42,
675
8 2
,485
3 4
,577
6 1
,321
8 4
,604
8 6
4,16
3 9
Tran
spor
t, P
osta
l and
War
ehou
sing
259
8 1
,536
9 7
90 9
846
9 1
,180
10
810
12
31,
721
9 2
,310
4 2
,101
11
1,2
44 9
6,8
22 3
49,
619
10
Info
rmat
ion
Med
iaa
nd
Tele
com
mun
icat
ions
20
20 1
55 2
0 1
47 1
9 1
61 1
9 1
35 1
9 2
16 2
0 9
,396
17
105
20
500
20
103
20
764
19
11,
702
20
Fina
ncia
l and
Insu
ranc
e Se
rvic
es 2
2 19
308
16
350
14
106
20
327
16
406
17
23,
917
13 1
51 1
8 9
75 1
7 4
40 1
4 7
99 1
8 2
7,80
1 14
Ren
tal,
Hir
ing
and
Rea
l Est
ate
Serv
ices
59
16 4
32 1
5 3
06 1
5 2
14 1
4 3
64 1
5 6
02 1
4 1
4,33
5 15
702
13
1,1
45 1
6 1
81 1
8 7
06 2
0 1
9,04
6 16
Prof
essi
onal
, Sci
enti
fic a
nd
Tech
nica
l Ser
vice
s 1
15 1
3 8
70 1
2 7
84 1
0 3
72 1
2 7
47 1
2 1
,009
10
67,
211
3 1
,358
10
2,4
78 9
589
13
3,4
94 1
0 7
9,02
7 6
Adm
inis
trat
ive
and
Supp
ort
Serv
ices
130
11
620
14
402
13
521
11
545
14
767
13
21,
559
14 1
,380
9 1
,516
12
373
16
6,2
60 4
34,
073
13
Publ
ic A
dmin
istr
atio
n an
d Sa
fety
448
2 1
,594
8 1
,532
6 1
,401
4 1
,533
7 1
,567
8 5
0,92
9 7
1,3
46 1
1 3
,144
8 1
,845
5 3
,017
12
68,
356
8
Educ
atio
n an
d Tr
aini
ng 3
23 5
1,8
90 6
2,0
97 4
1,7
43 2
2,0
33 4
2,6
31 5
64,
606
4 1
,529
5 5
,156
5 2
,544
2 3
,127
11
87,
679
5
Hea
lth
Car
e an
d So
cial
Ass
ista
nce
302
6 1
,895
5 2
,474
3 1
,891
1 2
,174
3 3
,191
3 8
5,10
8 1
1,4
56 6
6,1
33 4
2,2
94 4
5,7
19 7
112
,637
2
Art
s an
d R
ecre
atio
n Se
rvic
es 3
7 18
183
19
189
17
199
15
126
20
470
16
11,
757
16 1
09 1
9 5
05 1
9 1
38 1
9 9
78 1
6 1
4,69
1 17
Oth
er S
ervi
ces
118
12
1,3
72 1
0 7
76 1
1 9
73 8
885
11
1,1
70 9
29,
010
11 1
,097
12
2,3
85 1
0 9
37 1
2 3
,900
9 4
2,62
3 11
Inad
equa
tely
des
crib
ed 4
2 17
244
17
163
18
182
17
218
17
268
18
7,8
49 1
9 4
81 1
5 5
60 1
8 2
29 1
7 2
,719
13
12,
955
18
Not
sta
ted/
appl
icab
le 5
21
11
21 1
1 21
23
21 8
21
18
21 3
09 2
1 2
7 21
12
21 1
5 21
189
21
628
21
Tota
l 4
,010
2
9,27
0 2
1,13
2 1
5,22
6 2
2,79
8 2
9,72
9 7
27,2
80
45,
466
60,
742
28,
138
100
,590
1
,084
,381
Not
e:
Dat
a ar
e ag
greg
ated
from
the
LG
A le
vel o
n a
plac
e of
wor
k ba
sis.
Oth
er in
clud
es t
he c
ateg
orie
s ‘N
o fix
ed a
ddre
ss’ a
nd ‘S
tate
/Ter
ritor
y un
defin
ed’.
Sour
ce:
BAN
KWES
T CU
RTIN
ECO
NO
MIC
S CE
NTR
E | A
ustr
alia
n Bu
reau
of S
tati
stic
s Ce
nsus
201
1.
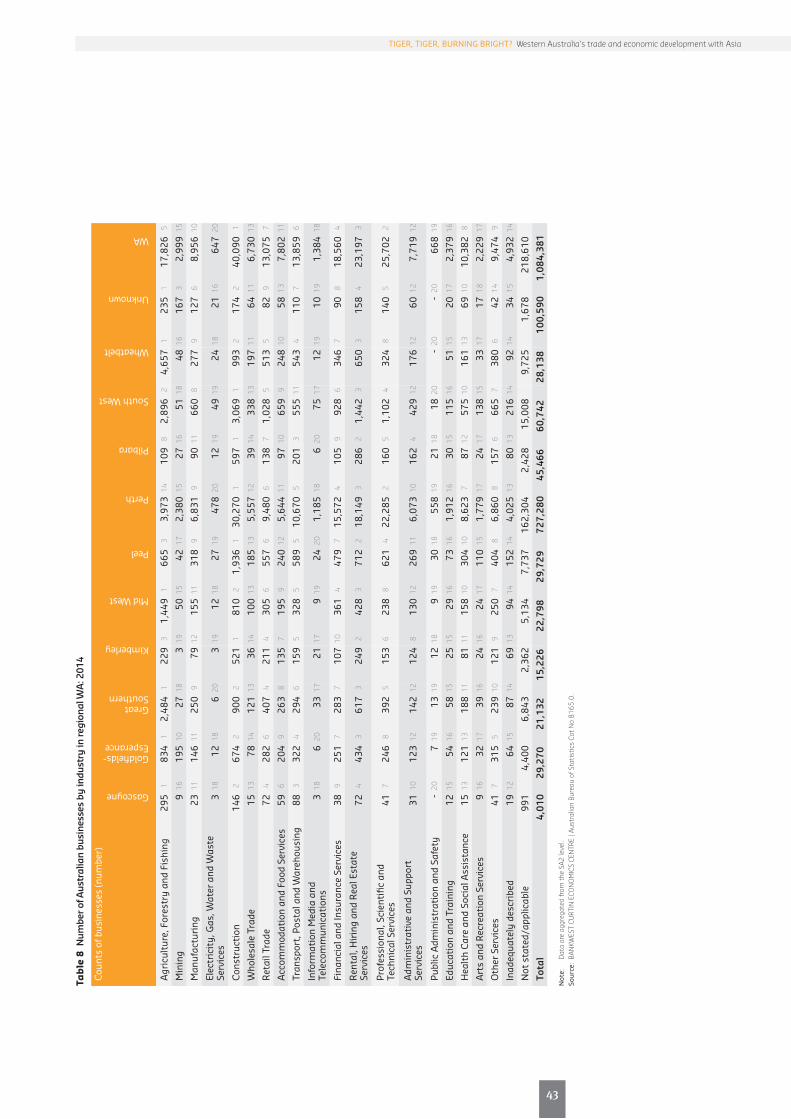
51
43
TIGER, TIGER, BURNING BRIGHT? Western Australia’s trade and economic development with Asia
Tab
le 8
Num
ber o
f Aus
tral
ian
busi
ness
es b
y in
dust
ry in
regi
onal
WA
: 201
4
Cou
nts
of b
usin
esse
s (n
umbe
r)
Gascoyne
Goldfields- Esperance
Great Southern
Kimberley
MidWest
Peel
Perth
Pilbara
South West
Wheatbelt
Unknown
WA
Agr
icul
ture
, For
estr
y an
d Fi
shin
g 2
95
1 8
34
1 2
,484
1
229
3
1,4
49
1 6
65
3 3
,973
14
109
8
2,8
96
2 4
,657
1
235
1
17,
826
5
Min
ing
9 1
6 1
95 1
0 2
7 1
8 3
19
50
15
42
17
2,3
80 1
5 2
7 1
6 5
1 1
8 4
8 1
6 1
67
3 2
,999
15
Man
ufac
turing
23
11
146
11
250
9
79
12
155
11
318
9
6,8
31
9 9
0 1
1 6
60
8 2
77
9 1
27
6 8
,956
10
Elec
tric
ity,
Gas
, Wat
er a
nd W
aste
Se
rvic
es 3
18
12
18
6 2
0 3
19
12
18
27
19
478
20
12
19
49
19
24
18
21
16
647
20
Con
stru
ctio
n 1
46
2 6
74
2 9
00
2 5
21
1 8
10
2 1
,936
1
30,
270
1
597
1
3,0
69
1 9
93
2 1
74
2 4
0,09
0 1
Who
lesa
le T
rade
15
13
78
14
121
13
36
14
100
13
185
13
5,5
57 1
2 3
9 1
4 3
38 1
3 1
97 1
1 6
4 1
1 6
,730
13
Ret
ail T
rade
72
4
282
6
407
4
211
4
305
6
557
6
9,4
80
6 1
38
7 1
,028
5
513
5
82
9
13,
075
7
Acc
omm
odat
ion
and
Food
Ser
vice
s 5
9 6
2
04
9 2
63
8 1
35
7 1
95
9 2
40 1
2 5
,644
11
97
10
659
9
248
10
58
13
7,8
02 1
1
Tran
spor
t, P
osta
l and
War
ehou
sing
88
3
322
4
294
6
159
5
328
5
589
5
10,
670
5
201
3
555
11
543
4
110
7
13,
859
6
Info
rmat
ion
Med
iaa
nd
Tele
com
mun
icat
ions
3 1
8 6
20
33
17
21
17
9 1
9 2
4 2
0 1
,185
18
6 2
0 7
5 1
7 1
2 1
9 1
0 1
9 1
,384
18
Fina
ncia
l and
Insu
ranc
e Se
rvic
es 3
8 9
2
51
7 2
83
7 1
07 1
0 3
61
4 4
79
7 1
5,57
2 4
1
05
9 9
28
6 3
46
7 9
0 8
1
8,56
0 4
Ren
tal,
Hir
ing
and
Rea
l Est
ate
Serv
ices
72
4
434
3
617
3
249
2
428
3
712
2
18,
149
3
286
2
1,4
42
3 6
50
3 1
58
4 2
3,19
7 3
Prof
essi
onal
, Sci
enti
fic a
nd
Tech
nica
l Ser
vice
s 4
1 7
2
46
8 3
92
5 1
53
6 2
38
8 6
21
4 2
2,28
5 2
1
60
5 1
,102
4
324
8
140
5
25,
702
2
Adm
inis
trat
ive
and
Supp
ort
Serv
ices
31
10
123
12
142
12
124
8
130
12
269
11
6,0
73 1
0 1
62
4 4
29 1
2 1
76 1
2 6
0 1
2 7
,719
12
Publ
ic A
dmin
istr
atio
n an
d Sa
fety
- 2
0 7
19
13
19
12
18
9 1
9 3
0 1
8 5
58 1
9 2
1 1
8 1
8 2
0 -
20
- 2
0 6
68 1
9
Educ
atio
n an
d Tr
aini
ng 1
2 1
5 5
4 1
6 5
8 1
5 2
5 1
5 2
9 1
6 7
3 1
6 1
,912
16
30
15
115
16
51
15
20
17
2,3
79 1
6
Hea
lth
Car
e an
d So
cial
Ass
ista
nce
15
13
121
13
188
11
81
11
158
10
304
10
8,6
23
7 8
7 1
2 5
75 1
0 1
61 1
3 6
9 1
0 1
0,38
2 8
Art
s an
d R
ecre
atio
n Se
rvic
es 9
16
32
17
39
16
24
16
24
17
110
15
1,7
79 1
7 2
4 1
7 1
38 1
5 3
3 1
7 1
7 1
8 2
,229
17
Oth
er S
ervi
ces
41
7
315
5
239
10
121
9
250
7
404
8
6,8
60
8 1
57
6 6
65
7 3
80
6 4
2 1
4 9
,474
9
Inad
equa
tely
des
crib
ed 1
9 1
2 6
4 1
5 8
7 1
4 6
9 1
3 9
4 1
4 1
52 1
4 4
,025
13
80
13
216
14
92
14
34
15
4,9
32 1
4
Not
sta
ted/
appl
icab
le 9
91
4,4
00
6,8
43
2,3
62
5,1
34
7,7
37
162
,304
2
,428
1
5,00
8 9
,725
1
,678
2
18,6
10
Tota
l 4
,010
2
9,27
0 2
1,13
2 1
5,22
6 2
2,79
8 2
9,72
9 7
27,2
80
45,
466
60,
742
28,
138
100
,590
1
,084
,381
Not
e:
Dat
a ar
e ag
greg
ated
from
the
SA2
leve
l. So
urce
: BA
NKW
EST
CURT
IN E
CON
OM
ICS
CEN
TRE
| Aus
tral
ian
Bure
au o
f Sta
tist
ics
Cat
No
8165
.0.
44
Around 80% of the state’s large businesses are in the services sub-sector.
Tables 9 and 10 further splits the business counts in the regions into large and small businesses, where the conventional (for tax concessions) turnover value of $2millionperannumisusedtodistinguishbetweenthebusinesssizes.Consistentwith national level data there are many more small businesses in the state than there are large businesses, to the tune of 201,761 against 16,849.
In the state as a whole, the most number of large businesses (2,842) is in the Construction sector, followed by 2,472 businesses in retail. The Wheatbelt has the largest number of large businesses, at 1.2 per 100 persons, the majority of which is in the Agriculture, Forestry and Fishing sector. Peel has the lowest per capita number of large businesses in the region, at 0.3 businesses per 100 persons. The Pilbara is second lowest, with only 0.4 businesses per 100 persons.
When it comes to small businesses, the most number of businesses is in the Construction sector (37,428), following by Professional, Scientific and Technical services (24,282). The Wheatbelt and Great Southern have the largest number of small businesses per capita, at 11.8 and 10.6 businesses per 100 persons respectively.
In the discussion of industrial sectors there is a curious definition of the ‘services sub-sector’, which has been said to annoyingly be defined as what it is not rather than what it is. In this definition, the services sub-sector is comprised of sectors that are notAgriculture,ForestryandFishing,Mining,andManufacturing.The Economist has described the services sector as providing ‘things you cannot drop on your foot’.
Ifweweretoadoptthisviewoftheservicessub-sector,around80%ofthestate’slarge businesses are in the services sub-sector. With the exception of the Wheatbelt, all regions have a higher proportion of their large businesses in the services sector. Asforsmallbusinesses,87%ofthestate’ssmallbusinessesareintheservices sub-sector. Perth and the Pilbara have the highest proportions of their small businesses in services.
It might be tempting to suggest that the services industries within the state cater more for the domestic residents than for international visitors. Whilst this may be true for sectors such as Professional, Scientific and Technical services, Health Care and Social Assistance (WA is not as yet a destination for health care tourism) and Wholesale Trade, it is easy to see that other services sector have a component which caters for our international visitors which is the highest earner in the state’s services exports.

53
45
TIGER, TIGER, BURNING BRIGHT? Western Australia’s trade and economic development with Asia
Tab
le 9
Num
ber o
f lar
ge A
ustr
alia
n bu
sine
sses
by
indu
stry
in re
gion
al W
A: 2
014
Cou
nts
of b
usin
esse
s (n
umbe
r) w
ith
annu
altur
nove
rof
$2m
and
abo
ve
Gascoyne
Goldfields- Esperance
Great Southern
Kimberley
MidWest
Peel
Perth
Pilbara
South West
Wheatbelt
Unknown
WA
Agr
icul
ture
, For
estr
y an
d Fi
shin
g 1
4 2
1
73
1 2
00
1 2
4 3
1
72
1 2
2 7
1
67 1
4 6
10
93
3
590
1
39
8
1,5
00
3
Min
ing
- 1
2 2
6 6
-
18
- 1
7 9
11
3 1
4 2
64 1
3 -
17
- 1
7 3
13
125
1
430
14
Man
ufac
turing
3
8 1
8 9
2
2 4
6
12
14
8
34
3
1,0
47
5 1
3 8
7
0 4
2
7 4
8
7 2
1
,341
6
Elec
tric
ity,
Gas
, Wat
er a
nd W
aste
Se
rvic
es 3
8
3 1
6 -
18
- 1
7 -
16
- 1
8 6
3 1
8 -
17
6 1
4 -
15
18
14
93
17
Con
stru
ctio
n 8
4
53
3
40
3
55
1
47
3
102
1
2,2
18
1 6
9 1
1
50
2 2
6 6
7
4 3
2
,842
1
Who
lesa
le T
rade
6
5 2
2 7
2
2 4
1
8 6
2
6 5
1
8 9
1
,166
4
6 1
0 5
0 7
4
3 3
4
5 7
1
,422
4
Ret
ail T
rade
22
1
59
2
84
2
53
2
64
2
98
2
1,7
13
2 3
7 2
1
96
1 1
00
2 4
7 6
2
,473
2
Acc
omm
odat
ion
and
Food
Ser
vice
s 9
3
17
10
16
7
22
4
14
8
31
5
588
7
20
5
54
6
13
8
22
13
806
8
Tran
spor
t, P
osta
l and
War
ehou
sing
6
5 3
6 4
2
1 6
1
9 5
2
7 4
1
2 1
1 4
59
8 3
2 3
3
3 8
2
7 4
5
4 5
7
26
9
Info
rmat
ion
Med
iaa
nd
Tele
com
mun
icat
ions
- 1
2 -
18
- 1
8 -
17
- 1
6 3
14
69
17
- 1
7 -
17
- 1
5 7
18
79
18
Fina
ncia
l and
Insu
ranc
e Se
rvic
es -
12
6 1
3 3
13
9
8 9
11
10
12
428
10
6 1
0 1
7 1
2 3
13
33
9
524
11
Ren
tal,
Hir
ing
and
Rea
l Est
ate
Serv
ices
6
5 2
1 8
1
3 8
7
11
22
6
32
4
970
6
24
4
56
5
18
7
28
12
1,1
97
7
Prof
essi
onal
, Sci
enti
fic a
nd
Tech
nica
l Ser
vice
s 3
8
12
11
10
9
6 1
2 2
0 7
2
0 8
1
,235
3
10
9
33
8
6 1
0 6
5 4
1,4
20
5
Adm
inis
trat
ive
and
Supp
ort
Serv
ices
3
8 4
15
5 1
2 1
4 7
5
13
9 1
3 4
32
9 1
8 6
2
4 1
0 1
2 9
3
3 9
559
10
Publ
ic A
dmin
istr
atio
n an
d Sa
fety
- 1
2 -
18
3 1
3 3
14
- 1
6 3
14
46
20
- 1
7 -
17
- 1
5 -
20
55
20
Educ
atio
n an
d Tr
aini
ng -
12
6 1
3 3
13
3 1
4 -
16
3 1
4 1
39 1
5 3
14
3 1
6 -
15
8 1
6 1
68 1
5
Hea
lth
Car
e an
d So
cial
Ass
ista
nce
- 1
2 9
12
9 1
0 8
10
4 1
4 1
6 1
0 3
94 1
1 3
14
16
13
6 1
0 3
0 11
495
12
Art
s an
d R
ecre
atio
n Se
rvic
es -
12
- 1
8 3
13
- 1
7 -
16
- 1
8 5
8 1
9 6
10
- 1
7 -
15
8 1
6 7
5 1
9
Oth
er S
ervi
ces
- 1
2 2
8 5
3
13
9
8 1
2 1
0 2
4 6
3
56 1
2 1
4 7
2
2 1
1 -
15
9 1
5 4
77 1
3
Unk
now
n -
12
3 1
6 6
11
3 1
4 3
15
- 1
8 1
34 1
6 3
14
6 1
4 6
10
3 1
9 1
67 1
6
Tota
l 8
3 4
96
463
2
59
448
4
40
11,
946
270
8
29
880
7
35
16,
849
Not
e:
Dat
a ar
e ag
greg
ated
from
the
SA2
leve
l. So
urce
: BA
NKW
EST
CURT
IN E
CON
OM
ICS
CEN
TRE
| Aus
tral
ian
Bure
au o
f Sta
tist
ics
Cat
No
8165
.0.
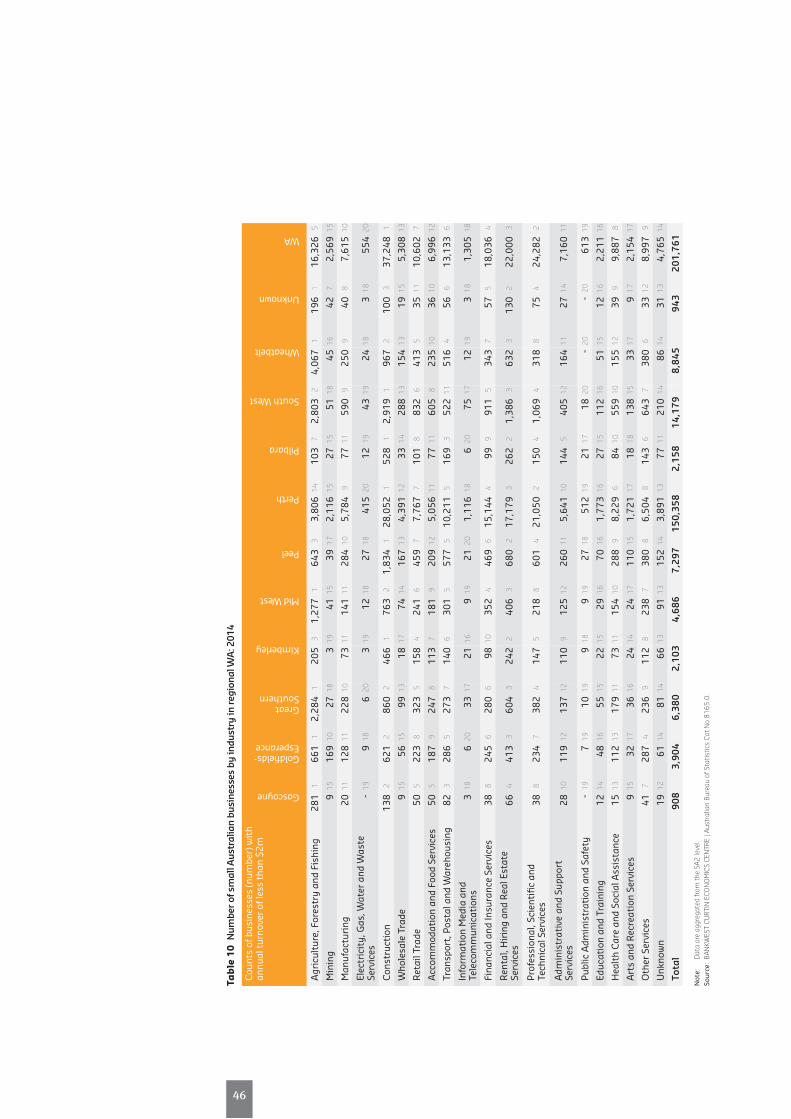
46
Tab
le 1
0 N
umbe
r of s
mal
l Aus
tral
ian
busi
ness
es b
y in
dust
ry in
regi
onal
WA
: 201
4
Cou
nts
of b
usin
esse
s (n
umbe
r) w
ith
annu
altur
nove
rof
less
tha
n$2
m
Gascoyne
Goldfields- Esperance
Great Southern
Kimberley
MidWest
Peel
Perth
Pilbara
South West
Wheatbelt
Unknown
WA
Agr
icul
ture
, For
estr
y an
d Fi
shin
g 2
81
1 6
61
1 2
,284
1
205
3
1,2
77
1 6
43
3 3
,806
14
103
7
2,8
03
2 4
,067
1
196
1
16,
326
5
Min
ing
9 1
5 1
69 1
0 2
7 1
8 3
19
41
15
39
17
2,1
16 1
5 2
7 1
5 5
1 1
8 4
5 1
6 4
2 7
2
,569
15
Man
ufac
turing
20
11
128
11
228
10
73
11
141
11
284
10
5,7
84
9 7
7 1
1 5
90
9 2
50
9 4
0 8
7
,615
10
Elec
tric
ity,
Gas
, Wat
er a
nd W
aste
Se
rvic
es -
19
9 1
8 6
20
3 1
9 1
2 1
8 2
7 1
8 4
15 2
0 1
2 1
9 4
3 1
9 2
4 1
8 3
18
554
20
Con
stru
ctio
n 1
38
2 6
21
2 8
60
2 4
66
1 7
63
2 1
,834
1
28,
052
1
528
1
2,9
19
1 9
67
2 1
00
3 3
7,24
8 1
Who
lesa
le T
rade
9 1
5 5
6 1
5 9
9 1
3 1
8 1
7 7
4 1
4 1
67 1
3 4
,391
12
33
14
288
13
154
13
19
15
5,3
08 1
3
Ret
ail T
rade
50
5
223
8
323
5
158
4
241
6
459
7
7,7
67
7 1
01
8 8
32
6 4
13
5 3
5 1
1 1
0,60
2 7
Acc
omm
odat
ion
and
Food
Ser
vice
s 5
0 5
1
87
9 2
47
8 1
13
7 1
81
9 2
09 1
2 5
,056
11
77
11
605
8
235
10
36
10
6,9
96 1
2
Tran
spor
t, P
osta
l and
War
ehou
sing
82
3
286
5
273
7
140
6
301
5
577
5
10,
211
5
169
3
522
11
516
4
56
6
13,
133
6
Info
rmat
ion
Med
iaa
nd
Tele
com
mun
icat
ions
3 1
8 6
20
33
17
21
16
9 1
9 2
1 2
0 1
,116
18
6 2
0 7
5 1
7 1
2 1
9 3
18
1,3
05 1
8
Fina
ncia
l and
Insu
ranc
e Se
rvic
es 3
8 8
2
45
6 2
80
6 9
8 1
0 3
52
4 4
69
6 1
5,14
4 4
9
9 9
9
11
5 3
43
7 5
7 5
1
8,03
6 4
Ren
tal,
Hir
ing
and
Rea
l Est
ate
Serv
ices
66
4
413
3
604
3
242
2
406
3
680
2
17,
179
3
262
2
1,3
86
3 6
32
3 1
30
2 2
2,00
0 3
Prof
essi
onal
, Sci
enti
fic a
nd
Tech
nica
l Ser
vice
s 3
8 8
2
34
7 3
82
4 1
47
5 2
18
8 6
01
4 2
1,05
0 2
1
50
4 1
,069
4
318
8
75
4
24,
282
2
Adm
inis
trat
ive
and
Supp
ort
Serv
ices
28
10
119
12
137
12
110
9
125
12
260
11
5,6
41 1
0 1
44
5 4
05 1
2 1
64 1
1 2
7 1
4 7
,160
11
Publ
ic A
dmin
istr
atio
n an
d Sa
fety
- 1
9 7
19
10
19
9 1
8 9
19
27
18
512
19
21
17
18
20
- 2
0 -
20
613
19
Educ
atio
n an
d Tr
aini
ng 1
2 1
4 4
8 1
6 5
5 1
5 2
2 1
5 2
9 1
6 7
0 1
6 1
,773
16
27
15
112
16
51
15
12
16
2,2
11 1
6
Hea
lth
Car
e an
d So
cial
Ass
ista
nce
15
13
112
13
179
11
73
11
154
10
288
9
8,2
29
6 8
4 1
0 5
59 1
0 1
55 1
2 3
9 9
9
,887
8
Art
s an
d R
ecre
atio
n Se
rvic
es 9
15
32
17
36
16
24
14
24
17
110
15
1,7
21 1
7 1
8 1
8 1
38 1
5 3
3 1
7 9
17
2,1
54 1
7
Oth
er S
ervi
ces
41
7
287
4
236
9
112
8
238
7
380
8
6,5
04
8 1
43
6 6
43
7 3
80
6 3
3 1
2 8
,997
9
Unk
now
n 1
9 1
2 6
1 1
4 8
1 1
4 6
6 1
3 9
1 1
3 1
52 1
4 3
,891
13
77
11
210
14
86
14
31
13
4,7
65 1
4
Tota
l 9
08
3,9
04
6,3
80
2,1
03
4,6
86
7,2
97
150
,358
2
,158
1
4,17
9 8
,845
9
43
201
,761
Not
e:
Dat
a ar
e ag
greg
ated
from
the
SA2
leve
l. So
urce
: BA
NKW
EST
CURT
IN E
CON
OM
ICS
CEN
TRE
| Aus
tral
ian
Bure
au o
f Sta
tist
ics
Cat
No
8165
.0.
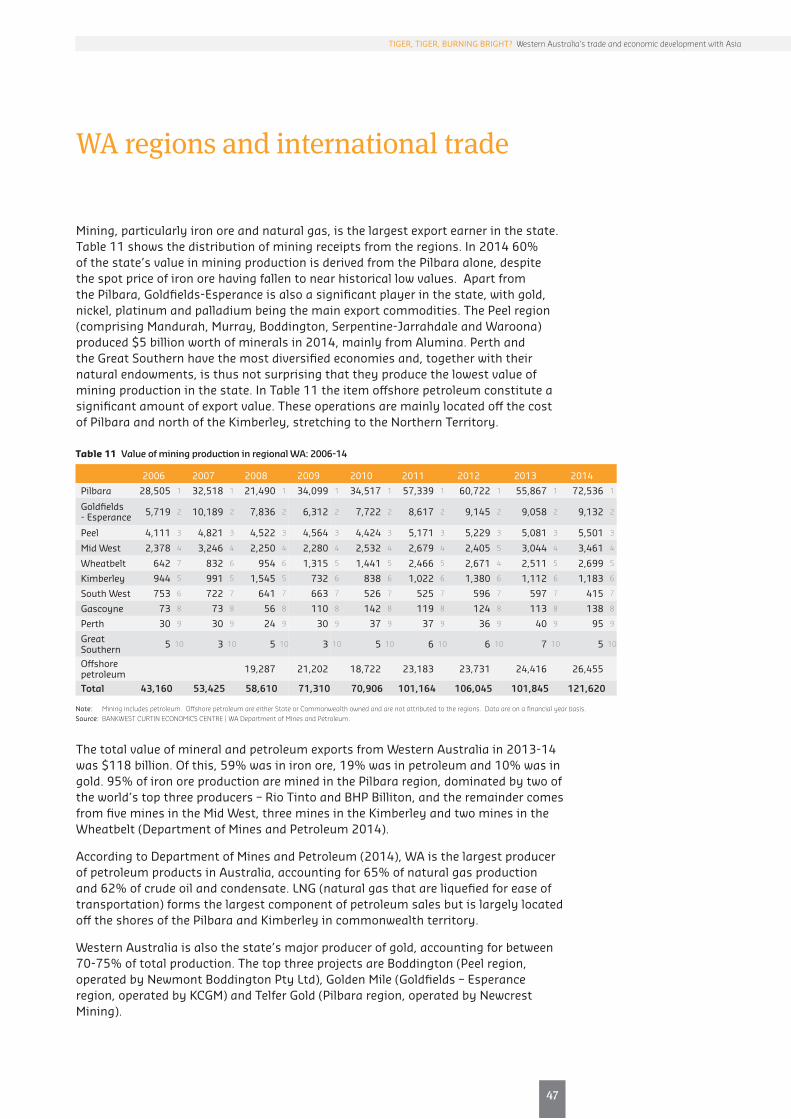
55
47
TIGER, TIGER, BURNING BRIGHT? Western Australia’s trade and economic development with Asia
Mining,particularlyironoreandnaturalgas,isthelargestexportearnerinthestate.Table11showsthedistributionofminingreceiptsfromtheregions.In201460%of the state’s value in mining production is derived from the Pilbara alone, despite the spot price of iron ore having fallen to near historical low values. Apart from the Pilbara, Goldfields-Esperance is also a significant player in the state, with gold, nickel, platinum and palladium being the main export commodities. The Peel region (comprisingMandurah,Murray,Boddington,Serpentine-JarrahdaleandWaroona)produced$5billionworthofmineralsin2014,mainlyfromAlumina.Perthandthe Great Southern have the most diversified economies and, together with their natural endowments, is thus not surprising that they produce the lowest value of mining production in the state. In Table 11 the item offshore petroleum constitute a significant amount of export value. These operations are mainly located off the cost of Pilbara and north of the Kimberley, stretching to the Northern Territory.
The total value of mineral and petroleum exports from Western Australia in 2013-14 was$118billion.Ofthis,59%wasinironore,19%wasinpetroleumand10%wasingold.95%ofironoreproductionareminedinthePilbararegion,dominatedbytwoofthe world’s top three producers – Rio Tinto and BHP Billiton, and the remainder comes fromfiveminesintheMidWest,threeminesintheKimberleyandtwominesintheWheatbelt(DepartmentofMinesandPetroleum2014).
AccordingtoDepartmentofMinesandPetroleum(2014),WAisthelargestproducerofpetroleumproductsinAustralia,accountingfor65%ofnaturalgasproductionand62%ofcrudeoilandcondensate.LNG(naturalgasthatareliquefiedforeaseoftransportation) forms the largest component of petroleum sales but is largely located off the shores of the Pilbara and Kimberley in commonwealth territory.
Western Australia is also the state’s major producer of gold, accounting for between 70-75%oftotalproduction.ThetopthreeprojectsareBoddington(Peelregion,operatedbyNewmontBoddingtonPtyLtd),GoldenMile(Goldfields–Esperanceregion,operatedbyKCGM)andTelferGold(Pilbararegion,operatedbyNewcrestMining).
WA regions and international trade
Table 11 Value of mining production in regional WA: 2006-14
2006 2007 2008 2009 2010 2011 2012 2013 2014
Pilbara 28,505 1 32,518 1 21,490 1 34,099 1 34,517 1 57,339 1 60,722 1 55,867 1 72,536 1
Goldfields - Esperance 5,719 2 10,189 2 7,836 2 6,312 2 7,722 2 8,617 2 9,145 2 9,058 2 9,132 2
Peel 4,111 3 4,821 3 4,522 3 4,564 3 4,424 3 5,171 3 5,229 3 5,081 3 5,501 3
MidWest 2,378 4 3,246 4 2,250 4 2,280 4 2,532 4 2,679 4 2,405 5 3,044 4 3,461 4
Wheatbelt 642 7 832 6 954 6 1,315 5 1,441 5 2,466 5 2,671 4 2,511 5 2,699 5
Kimberley 944 5 991 5 1,545 5 732 6 838 6 1,022 6 1,380 6 1,112 6 1,183 6
South West 753 6 722 7 641 7 663 7 526 7 525 7 596 7 597 7 415 7
Gascoyne 73 8 73 8 56 8 110 8 142 8 119 8 124 8 113 8 138 8
Perth 30 9 30 9 24 9 30 9 37 9 37 9 36 9 40 9 95 9
Great Southern 5 10 3 10 5 10 3 10 5 10 6 10 6 10 7 10 5 10
Offshore petroleum 19,287 21,202 18,722 23,183 23,731 24,416 26,455
Total 43,160 53,425 58,610 71,310 70,906 101,164 106,045 101,845 121,620
Note: Mining includes petroleum. Offshore petroleum are either State or Commonwealth owned and are not attributed to the regions. Data are on a financial year basis. Source: BANKWEST CURTIN ECONOMICS CENTRE | WA Department of Mines and Petroleum.

48
Port Hedland is the world’s largest bulk-export terminal – in 2013-14 Port Hedland moved 370 million tonnes of exports and received 2.2 million tonnes of imports.
Western Australia has world class port operations which, over the past decade has been fine-tuned to clockwork precision and efficiency by the iron ore exporting ports in the highly lucrative and competitive business. Indeed, Port Hedland is the world’s largest bulk-export terminal – in 2013-14 Port Hedland moved 370 million tonnes of exports and received 2.2 million tonnes of imports. In terms of the value of exports, the iron ore exporting ports of Dampier and Cape Lambert (Rio Tinto) and Port Hedland (BHP Billiton andFMG)contribute61%ofthestate’svalueofmerchandiseexport.
Fremantle is the state’s largest general cargo port, transporting goods in containers as well as non-containerised cargo such as motor vehicles, steel, machinery imports and livestocks (Ports Handbook Western Australia 2014). Fremantle’s Outer Harbour – to the south at Kwinana – is one of Australia’s major bulk cargo ports handling grain, petroleum, liquid petroleum gas, iron ore, minerals and other bulk commodities. Table 12 shows the value generated by exports from the state’s major ports.
In terms of volume Table 13 shows the tonnages traded by the major ports in the state. Shipments from the top two port authorities Port Hedland and Dampier are dominated by capesize vessels bound for China, with each vessel capable of carrying 180,000 tonnes of ore. The story is not all about iron ore. As mentioned above Fremantle moves general cargo. The port of Albany’s main export commodity in 2013-14 was grain, followed by woodchips. In 2013-14 the highest percentage of the Port of Bunbury’s throughputwasAlumina,at69%.Broomewastheonlyportwhereimports(petroleum,at36%)exceededexportsintermsofthroughputbycommodityin2013-14.
Table 12 Western Australia exports by major regional ports: 2011-12 and 2012-13
Majorport Region Total exports 2011-12
Total exports 2012-13
Dampier Pilbara 33,855 33,058 Port Hedland Pilbara 30,694 29,670 Fremantle Perth 9,971 10,037 Cape Lambert Pilbara 9,769 8,228 Offshore WA ports Offshore 7,013 5,224 Bunbury South West 4,245 4,720 Geraldton MidWest 2,612 3,214 Esperance Goldfields - Esperance 2,626 2,545 Total of major ports 100,785 96,696 Total state merchandise export 120,535 115,590 Balance 19,750 18,894
Note: Balance indicates goods that are not exported through ports and also accounts for exports by non-major WA ports. Source: BANKWEST CURTIN ECONOMICS CENTRE | Reproduced from the WA Department of State Development’s Western Australia Economic Profile -
October 2013 (original source: ABS Cat No 5368.0).
Table 13 Western Australia trade volume by major regional ports: 2013-14
Majorport(Portauthority) Region
Total exports 2013-14 (kilo
tonnes)
Total imports 2013-14 (kilo
tonnes)
Port Hedland Pilbara 370,061 2,240 Dampier Pilbara 176,696 831 Fremantle Perth 19,597 13,810 Geraldton MidWest 17,724 771 Esperance Goldfields - Esperance 14,110 829 Bunbury South West 13,818 1,787 Albany Great Southern 4,455 101 Broome Kimberley 267 250 Wyndham Kimberley 2,127 54
Note: Data provided by port authorities.Source: BANKWEST CURTIN ECONOMICS CENTRE | WA Ports Handbook 2014.
57
49
Whilst iron ore fines may not be worth their weight in gold the sheer volume of shipments (measured in hundreds of thousands of tonnes) has transformed Western Australia into an economic powerhouse.
An important challenge is to broaden the base of regional economies and aim to expose more products and services to overseas markets.
TIGER, TIGER, BURNING BRIGHT? Western Australia’s trade and economic development with Asia
Optimising WA regional trade and economic development
WA has been fortunate in that its main export commodity – iron ore – has been the most sought after raw ingredient in the past decade, fuelled by China’s accelerating industrialisation. Whilst iron ore fines may not be worth their weight in gold the sheer volume of shipments (measured in hundreds of thousands of tonnes) has transformed Western Australia into an economic powerhouse through the multiplier effect of profits generated by the sector. With all the benefits a natural question to ask is: Has the boom also led to complacency? With budgets in surpluses, low unemployment, high per capita income and a general pride within the community, has the recent slowdown led to a sense of foreboding amongst West Australians? This is one of the main concerns that is front of mind for state government and business leaders.
An important challenge is to broaden the base of regional economies and aim to expose more products and services to overseas markets. With this, what role do the regions play? Each of the state’s nine regions has a statutory authority from the state government in the form of a Development Commission that is tasked with promoting the economic and social development of the region. With state funding through the Royalty for Regions scheme every region has access to considerable funding over a five year period to develop major initiatives on economic, social and community development.ManyoftheseexistingandnewinitiativesarehighlightedintheRegional Investment Blueprints of each regional development commission.
By going through each region’s investment blueprint we are able to obtain an indication of the extent to which there are provisions for international trade with existingpartnersornewmarketsinthefuture.Forexample,theMarch2015Gascoyne blueprint provides for tourism expenditure to increase from its current levelof$246millionto$686millionintheir2050vision.TheGreatSouthernregionoutlined transformational projects to develop transport and industry hubs, and to leverage on and develop iconic and creative tourism. The Wheatbelt’s blueprint has a specific articulation of global drivers of growth.
To the extent that there are explicit or implied provisions for the development of trade within the blueprints by running the blueprints through a simple word cloud algorithm we are able to identify consistently repeated key words such as ‘markets’, ‘opportunities’, ‘tourism’ and ‘export’. Clearly, capturing additional market share for trade and seizing the opportunities presented by Asia’s growth is on the blueprints of most of the regions. What remains important is the translation from ideas, concepts and visions to practical policies. On this, to an extent the seeds have already be sown, with discussions on regional cities (super towns) and coordination between industrial sectors here and abroad facilitated by business leaders.

- benefits and barriers
WA’s trading environment

52
Over the past several years the sector that has been most successful in terms of enrolments and commencements is the Vocational Education and Training (VET) sector.
ELICOS (English Language Intensive Courses for Overseas Students) has also been a booming industry.
Education services in WA: Education as an attractor to international business and investmentAs indicated in Table 3, personal travel has generated the most export income at least over the past five years. An emerging sector is that of education-related travel, which isa$1.3billionindustryin2013-14.Educationservicesdonotjustincludetuitionfees, but also the travel costs and the expenses of foreign students whilst studying in Western Australia.
Table 14 shows the breakdown of international students in WA from 2012 to 2014, in terms of enrolments and commencements, by the various sectors. Over the past several years the sector that has been most successful in terms of enrolments and commencements is the Vocational Education and Training (VET) sector where students study and apply themselves in externships in not only the trades but also in business and computing studies. ELICOS (English Language Intensive Courses for Overseas Students) has also been a booming industry. ELICOS students typically proceed to other sectors of education such as VET or Higher education (universities).
Table 14 International students in WA by sector: 2012-2014
Sector 2012 2013 2014 2012 2013 2014
Enrolments Commencements
Higher education 18,737 17,888 18,024 6,769 6,885 7,173
VET 11,420 11,438 13,168 6,846 7,857 9,339
Schools 1,268 1,073 882 633 540 433
ELICOS 8,244 9,804 11,460 6,573 7,935 9,192
Non-award 1,822 2,087 2,484 1,464 1,733 2,082
Total 41,491 42,290 46,018 22,285 24,950 28,219
Source: BANKWEST CURTIN ECONOMICS CENTRE | Department of Education and Training – International student data/PRISMS database.

61
53
TIGER, TIGER, BURNING BRIGHT? Western Australia’s trade and economic development with Asia
Table 15 focuses on Higher education and reveals where the international students are from. Indeed most of the students are from neighbouring Asia (7 of the top 10), with China being the source of the majority of our international students in higher education. India has been the biggest success story, with enrolments doubling in a period of just two years.
The main universities in Western Australia have regional campuses. As examples The University of Western Australia has The Albany Centre for studies in environmental science, anthropology and sociology, and early childhood teaching, Curtin University hastheWesternAustralianSchoolofMinesinKalgoorlie,andNotreDamehasacampus in Broome offering courses in education and training. The majority of international students though choose to study in the Perth campuses, which both speaks well of the general attraction of Perth as an education destination but also present opportunities for the WA regions to perhaps do more to attract international students.
Overall the state of WA’s education export service is healthy, and as the majority of the services are provided to our immediate neighbours it speaks well of the state’s engagement with this important region of the world. The sector should not be regarded just as a provider of education and innovation, but should also be promoted as a valuable piece of infrastructure through which to attract skilled labour to the state, and to build global business networks. There is good evidence to suggest that successive cohorts of students who study in Australia bring future benefits to the state through personal contacts and connections when they establish themselves in overseas businesses either here in Australia or in other countries with whom we do business.
Table 15 International student enrolments in higher education by top 10 nationalities: 2012-14
Higher education enrolments 2012 2013 2014
Top 10 enrolments by country of origin Enrolments
China 4,858 4,451 4,175
Malaysia 2,711 2,424 2,153
India 849 1,037 1,632
Singapore 1,742 1,603 1,406
Indonesia 1,050 972 896
Hong Kong 599 673 716
Vietnam 601 537 640
Nepal 162 331 484
Saudi Arabia 556 501 482
Kenya 453 434 441
Note: Ranked in descending order of 2014 enrolments. Source: BANKWEST CURTIN ECONOMICS CENTRE | Department of Education and Training – International student data/PRISMS database.

54
It is a challenge for smaller or emerging businesses to access said infrastructure, especially when the networks are stretched to capacity.
Barriers to WA regional trade
This section discusses barriers that impede trade from regional Western Australia with its trading partners. An export transaction from a business in regional WA to its overseas customer (perhaps involving intermediaries in the metropolitan area or the customer’s subsidiary at a different location) is an involved process, most notably engaging the entire supply chain and distribution network. However, it is not difficult to identify bottlenecks such as those that have affected WA in the past and which remain present in varying degrees. In the case of the export of goods, are barriers to trade emanating from regional centres partly inevitable due to geography? We argue that where there are bottlenecks they go beyond geographic isolation.
It is true that there have been immense spending on infrastructure development in some export-oriented regions, with the Pilbara being the prime example. However, much of those spending are private investment that are largely restricted to the use of the operators. It is a challenge for smaller or emerging businesses to access said infrastructure, especially when the networks are stretched to capacity. Now, whose responsibility is it to provide for such infrastructure? On the one hand it is the direct responsibility of the exporters. On another their very success can bring about considerable benefit to the state in the form of taxes, royalties, and other flow-on effects. Hence, it is also very much the case that the state is an important stakeholder in ensuring the success of our export-oriented businesses.
63
55
At a macroeconomic level protectionist policies are barriers that can significantly limit the access of overseas markets for our regional producers.
TIGER, TIGER, BURNING BRIGHT? Western Australia’s trade and economic development with Asia
To market, to market…
At a macroeconomic level protectionist policies are barriers that can significantly limit the access of overseas markets for our regional producers. WA farmers, who rely strongly on demand from China and Indonesia in light of the relatively small domestic market, are especially vulnerable to practices that distort the market such as tariffs, domestic subsidies and import quotas. Geopolitical friction between governments canalsoaffectthefortunesofinnocentlocalsuppliers.Muchoftheabovehoweverare best resolved through negotiations in international organisations or diplomatic channels.
An efficient supply chain is important for getting products manufactured and delivered to overseas customers on a least cost basis. Industries that produce elaborately transformed manufactures can be especially challenged by supply chain issues.ThoughbynomeansthelargestsectorETMexportsbyWAin2013-14amountedtoalmost$3billion.Othersectorssuchaswheatproductionandexportcan attract considerable costs given the distances involved from farm to port.
Finally, the notion of brand recognition should not be downplayed. To the extent that cost and quality controls are important factors in generating profits a distinct advantage can be gained by promoting the state or its regions as a brand – ‘Western Australia Pty’. This is, however, not as easy an exercise as it may appear. For example, thoughtheMargaretRiverregionproducesworldclasswinesitisalsohometoavibrant tourism, food and creative industry, all of which deserves promotion and recognition. The questions becomes how can the region be successfully marketed as a coherent brand without diluting the message. Could the example set by New Zealand’s hugely successful promotional efforts be an aspirational target for this state or its region to emulate?


and policy
WA’s trade strategy
58
The deal struck between China and Australia through the recent Free Trade Agreement offers mixed support to WA industry. Some agriculture sub-sectors in WA will benefit from phased tariff reductions, particularly producers of meat, seafood, wine and other boutique foods and horticulture.
What do Free Trade Agreements mean for WA?
The deal struck between China and Australia through the recent China-Australia Free Trade Agreement (ChAFTA) offers mixed support to WA industry. Some agriculture sub-sectors in WA will benefit from phased tariff reductions, particularly producers of meat, seafood, wine and other boutique foods and horticulture. There are enhanced opportunities for joint ventures between Australian and Chinese companies, with tourism and hospitality sectors also provided with opportunities to establish outlets in China. However, there has been no agreement on lower tariffs for staple crops – wheat, maize, corn, rice or canola – or for wool and cotton.
There is some nervousness about the agreed policy for Chinese-financed investment projects in Australia being supported by migrant workers without the requirement for local labour market testing. Trade agreements shouldn’t be allowed to affect labour standards adversely, or crowd out local labour market opportunities. Notwithstanding the legitimate caution regarding these aspects of the trade deal with China, it ought to be possible for Australia to derive labour market benefits from a more open economic relationship with our major trading partner. Additional investment under the ChAFTA offers some potential for new labour market opportunities to be created for Australian workers too, provided an active defence of labour market standards remains under any new trade arrangements.
Australia has a number of existing trade agreements with other areas in the region – including the ASEAN-Australia-New Zealand Free Trade Agreement (AANZFTA), the Singapore-Australia Free Trade Agreement (SAFTA), the Korea-Australia Free Trade Agreement (KAFTA) and the Japan-Australia Economic Partnership agreement. A number of these make specific provision for enhanced economic cooperation between businesses in Australia and Asia. Taken together with other Free Trade Agreements, the China Australia Free Trade Agreement incentivises joint ventures between Australian and Chinese companies and further reinforces the environment in which international business partnerships provide as a new direction for international trading relationships.
Open trading relationships have historically delivered positive benefits to Australian businesses, workers and households, and there is no reason why FTAs shouldn’t deliver value to Western Australia - as long as the State’s economic structures, particularly the labour market, are protected and supported.

67
59
TIGER, TIGER, BURNING BRIGHT? Western Australia’s trade and economic development with Asia
Western Australia Pty – how are we selling the State?
There is a compelling need to improve the clarity of Western Australia as a ‘value proposition’ for visitors, consumers, prospective business clients and overseas markets. ‘Brand Australia’ already has a strong reputation derived from its openness, quality of life, and abundance of natural resources as well as the strength and calibre of its business activities.
The State can certainly leverage significant benefit from this awareness of the Australian brand, but it is important to develop a complementary strategy that establishes the ‘unique selling points’ of Western Australia. There is a need to create more awareness of WA products and services on international stage, and to develop ‘Western Australia Pty’ as a brand.
Victoria has been highly proactive in promoting trade with other countries, with the active involvement of business leaders in planning and participating in delegations and missions to establish new trade links. South Australia engaged in highly successful campaigns over the last five years to market its education services to the international community. There is some evidence that their investment in such initiatives has generated a good return in the form of increased international student intakes (in what is unarguably a competitive marketplace made all the more challenging given the high value of the dollar).
One important element in the marketing strategy for WA is to communicate effectively the state’s regional diversity, and to sell regional economic strengths in combination – for example, the wine industry in the South West packaged alongside high quality foods, culture and creative industries, tourism and hospitality; marine ecology and eco-tourism in the Kimberley and the north of the State alongside the developing agriculture and aquaculture sectors. There are direct benefits to be derived from the complementarities and shared values in such activities when selling the state’s regions to an international market.
It is important that Western Australia remains active in communicating the State’s unique value to prospective trading partners both in the Asia region as well as in the wider global marketplace.

68
and conclusions
Summary

62
Tiger, Tiger, Burning Bright? Western Australia’s trade and economic development with Asia is the fifth report in the Bankwest Curtin Economics Centre’s Focus on Western Australia series. The report takes stock of the current trade landscape for Western Australia in light of the recent slowdown in China’s economic growth and the pressure that this slowdown is placing on the State’s businesses and finances. Opportunities are examined for enhanced future trade and strengthened economic relationships with China, Japan and other countries in the Asia-Pacific and Indo-Pacific regions.
International trade has a role to play in supporting a diversification of the strengths in the WA economy. Iron ore will remain a core strength of WA’s export mix, with oil and natural gas likely to continue to grow over the medium term. The market for international education is also an area where the state has done particularly well in over recent years. With the recent decline in the Australian dollar and several higher education institutions in the state ranking highly in international surveys, Perth is well placed to advance this trend. With a world class wine region in the South West of the state, coupled with an emerging food tourism industry, the future is bright for these and the tourism industry in general for the state. Agriculture is another sector that is garnering a lot of attention with considerable investment in the recognition that a steady supply and agri-food security being key areas for development moving forward.
There has been a decline in manufacturing in Western Australia, and a reduction in the volume of manufacturing exports from WA to overseas markets that exceeds the rate from other states and territories. Australia is a net importer of manufactured commodities, which raises a question about whether the resources boom has negatively affected the competitiveness of other industry sectors in the state – the so-called ‘Dutch disease’.
High exchange rates have certainly affected the competitiveness of WA manufacturing, agriculture, education and tourism, although recent falls in the Australian dollar may alleviate the currency pressures for the State’s businesses going forward.
There is evidence of a decline in capital expenditure in manufacturing, which gives some cause for concern given the role that investment and technological progress has to play in maintaining manufacturing capacity. There is a clear need for new investment to support innovation, increased capacity and productive efficiencies in manufacturing in order that the sector can continue to compete effectively and grow its international market share.
China will remain a strong market for Western Australia’s primary resources, as will Japan as one of our traditional trading partners. Together, the value of WA’s exports toChinaandJapanamountedtosome$95billionin2013-14.However,tradingopportunities have also developed with other Asian countries over the last five years – and WA is extremely well positioned to capitalise on new trading opportunities both in terms of the scale and composition of its trade with Asian partners.
Summary and conclusions

71
63
TIGER, TIGER, BURNING BRIGHT? Western Australia’s trade and economic development with Asia
But the State’s trade and economic development strategies should include a ‘focus on quality’ to capitalise on opportunities to sell to new markets for hi-tech or high-end products. Economic liberalisation across the Asian continent, with higher discretionary incomes among the rising middle class in Asia’s emerging economies, has created a growing demand for prestige and luxury commodities – gold, nickel, manufactures, high quality agriculture and food – as well as tourism and education exports.
Alongside China and the traditional Japanese market as a natural outlet for the expansion of high value commodity exports, there are emerging opportunities for Western Australia to service the demand among other Asian trading partners – Indonesia,MalaysiaandIndiainparticular.WAhasacomparativeadvantageinthisregard, being well situated in relation to time-zones and proximity to a number of Asian countries in the region – and given its reputation for high quality produce.
The narrative regarding Australia’s trading patterns and new trading opportunities with Asia is changing, with the traditional notion of the bilateral trader (“we sell, you buy”) giving way to international business partnerships between Australian and Asian companies. Building on similar measures in earlier trade agreements with Japan, Korea and Singapore, the recent China-Australia Free Trade Agreement (ChAFTA) adds to this changing narrative through its explicit support for joint ventures and economic cooperation.
The WA economy can gain strength and resilience through trade diversification, not just in the breadth of commodities traded but also the countries with whom we do business.


Glossary

66
APEC
Asia-Pacific Economic Cooperation. Established in 1989, this forum is comprised of 21 members nations to leverage the growing interdependence of the Asia-Pacific region, which includes Australia and New Zealand. Its aim is to create greater prosperity for the people of the region by promoting balanced, inclusive, sustainable, innovative and secure growth and by accelerating regional economic integration.
ASEAN
Association of Southeast Asian Nations. Established in 1967, the aims of the 10 member association are to foster political, economic and social cooperation and regional stability. ASEAN approaches its activities based on the principles of consultation, consensus and cooperation.
Dutch disease
Dutch Disease is the term commonly applied to a situation where a currency appreciation from rapid growth in a country’s capital intensive resources sector leads to a loss of competitiveness in labour intensive industries. The term was coined after the resource-driven boom in Holland following the natural gas discovery in 1959 caused a significant appreciation of the Dutch currency and decimated Holland’s manufacturing industry.
Exporter
An exporter is defined as the owner of the exported good or the provider of the exported service. In accordance with balance of payments principles, if an export takes place, it must involve an Australian resident selling a good or a service to a non-resident (i.e. it involves a change of ownership). International trade in services statistics are compiled on a balance of payments basis and only cover transactions between Australian residents and non-residents.
Net export
This is a widely used economic concept that is not restricted to National Accounts. Net exports is a measure of total exports less total imports.
State of origin of exports
The State of origin of the commodity recorded on export documentation can be used to identify the State from which the exported goods were sourced. State of origin is the State in which the final stage of production or manufacture occurs. Determining a single State of origin is difficult when there may be several stages in the manufacturing process, each of which may take place in a different State. For example, fruit may be grown in one State, canned in another, and exported from another.

75
67
TIGER, TIGER, BURNING BRIGHT? Western Australia’s trade and economic development with Asia


References
70
DepartmentofMineralandPetroleum,StatisticsDigest2013-14,2014.
Department of Transport, Ports Handbook – Western Australia 2014, 2014.
Duncan, A.S. and K. Leong, ‘A Regional Framework for Analysing the West Australian Economy’, Bankwest Curtin Economics Centre Working Paper WP 14/5, 2014.
KPMG,DemystifyingChineseInvestmentinAustralia:China’sOutboundDirectInvestment in Australia, August 2012 (updated 2015).
References

79
71
TIGER, TIGER, BURNING BRIGHT? Western Australia’s trade and economic development with Asia

72

Disclaimer
While every effort has been made to ensure the accuracy of this document, the uncertain nature of economic data, forecasting and analysis means that the centre, Curtin University and/or Bankwest are unable to make any warranties in relation to the information contained herein. Any person who relies on the information contained in this document does so at their own risk. The centre, Curtin University, Bankwest, and/or their employees and agents disclaim liability for any loss or damage, which may arise as a consequence of any person relying on the information contained in this document. Except where liability under any statute cannot be excluded, the centre, Curtin University, Bankwest and/or their advisors, employees and officers do not accept any liability (whether under contract, tort or otherwise) for any resulting loss or damage suffered by the reader or by any other person.
The views in this publication are those of the authors and do not represent the views of Curtin University and/or Bankwest or any of their affiliates. This publication is provided as general information only and does not consider anyone’s specific objectives, situation or needs. Neither the authors nor the centre accept any duty of care or liability to anyone regarding this publication or any loss suffered in connection with the use of this publication or any of its content.
Authorised Use
© Bankwest Curtin Economics Centre, September 2015Bankwest Curtin Economics Centre Focus on Western Australia Report SeriesISBN: 978-1-925083-31-6
This report was written by: Alan Duncan, Ken Leong and Yashar Taverdi from the Bankwest Curtin Economics Centre at Curtin Business School.
It can be cited as: Duncan, A.S., Leong, K. and Taverdi, Y. (2015), ‘Tiger, Tiger, Burning Bright? WA’s trade and economic development with Asia’, Bankwest Curtin Economics Centre, Focus on Western Australia Series, Issue 5, September 2015.
The authors would like to thank: Christian Duplock for valuable research assistance in the preparation of this report.
This publication contains confidential and proprietary information of the Bankwest Curtin Economics Centre. All of the material in this publication is for your exclusive use and may not be otherwise used or modified for, or by, any other person or sold to or otherwise provided in whole or in part to any other person or entity without the prior written consent of the Bankwest Curtin Economics Centre.
A standard hard copy of, or electronic subscription to, this publication entitles employees of the same organisation and same physical location as the subscriber to the use of its contents for internal reporting purposes only. Multiple user licenses are available for organisations with more than one location.

business.curtin.edu.au/bcec
Bankwest Curtin Economics CentreTel: +61 8 9266 2873 Email: [email protected]
© Curtin University of Technology 2015Curtin University is a trademark of Curtin University of TechnologyCRICOS Provider Code 00301JADV081679
Contact


