
Bangladesh PaCT:
Partnership for Cleaner Textile
IN DEPTHCLEANER PRODUCTION A
Zirani Bazar, BKSP
DEVELOPMENT
819, AntrikshBhawan, 22 Kasturba Gandhi Marg, New Delhi Tel.: +91 11 4079 1100 Fax : +91 11 4079 1101;
Supported By
PaCT:
Partnership for Cleaner Textile
CLEANER PRODUCTION ASSESSMENT REPORT
Prepared for
ProbirSarkar
Executive Director
IRIS Fabrics Ltd.
BKSP, Kashimpur, Gazipur, Bangladesh
Date : June’2016
Prepared&Submitted by
EVELOPMENT ENVIRONERGY SERVICES LTD
819, AntrikshBhawan, 22 Kasturba Gandhi Marg, New Delhi -110001 Tel.: +91 11 4079 1100 Fax : +91 11 4079 1101; www.deslenergy.com
SSESSMENT REPORT
Gazipur, Bangladesh

IRIS Fabrics Ltd. PaCT IN-depth CP Assessment Report
2
About PaCT
PaCT is a partnership between textile wet processing factories in Bangladesh, international apparel
buyers, wet processing technology suppliers, the Embassy of the Kingdom of the Netherlands (Dhaka),
the International Finance Corporation (IFC), and the NGO Solidaridad.
The PaCT partners share a commitment to bring about systemic, positive environmental change for the
Bangladesh textile wet processing sector, its workers, and surrounding communities, and to contribute
to the sector’s long-term competitiveness.
To this end, the PaCT partners are collaborating to develop harmonized resource-efficiency
procurement requirements, to build factory capacity, technical knowledge, and access to finance for
Cleaner Production investments, and to create a platform for community and national dialogue on
sustainable use of water in the textile sector.
PaCT is implemented by IFC and Solidaridad, in cooperation with BGMEA. PaCT benefits from the
generous anchor sponsorship of the Embassy of the Kingdom of the Netherlands. The PaCT lead
sponsors are C&A, H&M, and Inditex. Associate sponsors are G-Star, KappAhl, Lindex, Primark, and
Tesco.
Disclaimer
IFC, a member of the World Bank Group, creates opportunity for people to escape poverty and improve
their lives. We foster sustainable economic growth in developing countries by supporting private sector
development, mobilizing private capital, and providing advisory and risk mitigation services to
businesses and governments. This report was commissioned by IFC as part of implementing the
Bangladesh Water PaCT: Partnership for Cleaner Textile.
The conclusions and judgments contained in this report should not be attributed to, and do not
necessarily represent the views of, IFC or its Board of Directors or the World Bank or its Executive
Directors, or the countries they represent. IFC and the World Bank do not guarantee the accuracy of the
data in this publication and accept no responsibility for any consequences of their use

IRIS Fabrics Ltd. PaCT IN-depth CP Assessment Report
3
ACKNOWLEDGEMENT
Development Environergy Services Limited (DESL)and Engineering Resources International (ERI)Ltd.
express their sincere gratitude to IFC’s PaCT program team for their role in guiding and steering this
prestigious assignment for “Promoting cleaner production in the washing/dyeing/finishing sector in
Bangladesh”.
The consultants are grateful toIFC-Bangladeshfor vesting its confidence in the team for carrying out this
prominent assignment for the identification of cleaner production interventions in IRIS Fabrics Ltd.
Andfor their full-fledged coordination and support throughout the study.
Consultants Team
Development Environergy Services Ltd. (DESL) (Formerly Dalkia Energy Services Ltd) is a subsidiary of
VEIC, the consulting business of the €36 Billion Veolia Environment, one of the world’s largest
environment and energy services business group. Engineering Resources International (ERI) is the local
associate consultants from Bangladesh for this project.
Particulars Details
Date of assessment 10/04/2016
Team leader and co-coordinator M. G. Dave
DESL Team members
Shridhar Manure
D.A.Shaikh
K.N. Trivedi
ERI team: Project leader Dr. Zahid Hassan
ERI Team members
Amin Al Maksud
SM Rezwanul Islam
Faisal Rahman

IRIS Fabrics Ltd. PaCT IN-depth CP Assessment Report
4
Table of Contents
Executive Summary ............................................................................................................................................ 9
1 Introduction ................................................................................................................................................. 12
1.1 Objective ................................................................................................................................................. 12
1.2 Scope of work ......................................................................................................................................... 13
1.3 Methodology .......................................................................................................................................... 13
1.4 In depth cleaner production assessment in IRIS Fabrics Ltd. ................................................................. 14
2 Energy & Utility ........................................................................................................................................... 15
2.1 Utility Mapping ....................................................................................................................................... 15
2.2 NG Consuming Equipments .................................................................................................................... 17
2.3 Thermal Energy ....................................................................................................................................... 17
2.4 Observations & Recommendations – Thermal Energy ........................................................................... 19
2.5 Electrical Energy...................................................................................................................................... 19
2.6 Compressed Air System .......................................................................................................................... 21
2.7 Action plan for CP Measures – Electrical & Thermal Utilities ................................................................. 22
2.8 Summary of CP measures in Utility area ................................................................................................ 36
3 Unit & Process details ................................................................................................................................. 38
3.1 Introduction ............................................................................................................................................ 38
3.2 Raw material and finished products ....................................................................................................... 38
3.3 Manufacturing process description – Dyeing, Washing and finishing ................................................... 38
Factory specific Baseline Key Indicators ....................................................................................................... 40
3.4 Wet Processing section CP measures action plan .................................................................................. 44
3.5 Water & Water treatment Scenario ....................................................................................................... 48
4 Effluent Treatment Plant (ETP) ................................................................................................................... 50
4.1 ETP design detail ..................................................................................................................................... 51
4.2 Inlet and outlet effluent quantity and quality test certificate records................................................... 51
4.3 Metering facility for effluent inlet and outlet ........................................................................................ 51
4.4 Metering facility at other location .......................................................................................................... 51
4.5 Segregation of effluent steam ................................................................................................................ 52
4.6 Sewage generation &treatment facility ................................................................................................. 52
4.7 Chemicals dosing practices in ETP .......................................................................................................... 52

IRIS Fabrics Ltd. PaCT IN-depth CP Assessment Report
5
4.8 Recovery of Salt and Reuse of water ...................................................................................................... 52
4.9 Disposal of sludge and hazardous chemicals .......................................................................................... 52
4.10 Critical findings and recommendations ............................................................................................ 52
4.11 Factory Specific baseline key indicators ........................................................................................... 54
4.12 Summary of CP action with proposed investment (ETP section) ..................................................... 54
4.13 Design details of ETP & Adequacy .................................................................................................... 55
5 Conclusions and Recommendations ........................................................................................................... 56
Annexure1 – Plant and Machinery Details.................................................................................................... 57
Annexure2 – Process Flow Diagrams ............................................................................................................ 59
Annexure3 – Water Balance Diagrams ......................................................................................................... 60
Annexure4 -Waste water data from ETP ...................................................................................................... 61
Annexure5 – ETP design details .................................................................................................................... 61
Annexure6 – Energy Consumption Details ................................................................................................... 63
Annexure8 – Compressed air distribution schematic ................................................................................... 64
Annexure9- Dyeing Bulk production recipe sheet ........................................................................................ 65
Annexure10 –Photographs for baseline condition ....................................................................................... 68
LIST OF TABLES
Table 1: Metering status ............................................................................................................................... 9
Table 2: Resource conservation and KPI ....................................................................................................... 9
Table 3: Saving Summary ............................................................................................................................ 10
Table 4: Utility Mapping .............................................................................................................................. 15
Table 5: Energy Content & Costing ............................................................................................................. 16
Table 6: Natural Gas Consuming Equipments ............................................................................................. 17
Table 7: Installation Details of Boilers......................................................................................................... 17
Table 8: Performance Evaluation of Boilers ................................................................................................ 18
Table 9: Diesel Engine Specification............................................................................................................ 19
Table 10: Monthly Power Generation and Fuel Consumption ................................................................... 20
Table 11: Air Compressors – Installation Details ........................................................................................ 21
Table 12: Saving & Cost benefit for heat recovery from boiler flue gas ..................................................... 23
Table 13: Saving & Cost benefit for installation of exhaust gas boiler ....................................................... 26
Table 14: Saving & Cost benefit for jacket water heat recovery system .................................................... 28
Table 15: Saving & Cost benefit by pressure reduction .............................................................................. 30
Table 16: Saving & Cost benefit for replacement of submersible pump by energy efficient pump .......... 31
Table 17: Saving & Cost benefit for oxygen tuning of boiler ...................................................................... 33
Table 18: Comparison of lamps .................................................................................................................. 34
Table 19: Saving & Cost benefit for energy efficient tube lights ................................................................ 35
Table 20: CP measures for Electrical System .............................................................................................. 36

IRIS Fabrics Ltd. PaCT IN-depth CP Assessment Report
6
Table 21: CP measures for Thermal System ............................................................................................... 36
Table 22: Industry details ............................................................................................................................ 38
Table 23: Average Monthly Production ...................................................................................................... 38
Table 24: Process Performance .................................................................................................................. 39
Table 25: Key Performance Indicators – Factory ........................................................................................ 40
Table 26: Process area recommendations for improvement ..................................................................... 40
Table 27: Saving & Cost benefit for heat recovery ..................................................................................... 44
Table 28: Benefits for water recovery from dewatering machine ............................................................. 46
Table 29: Reducing moisture before drying in mangle ............................................................................... 47
Table 30: Submersible Pump Details .......................................................................................................... 48
Table 31: WTP Plant Details ........................................................................................................................ 48
Table 32: Water Distribution Pumps........................................................................................................... 48
Table 33: Pump Performance ..................................................................................................................... 49
Table 34: ETP quantity & quality test report .............................................................................................. 51
Table 35: ETP water flow meters ................................................................................................................ 51
Table 36: Chemical Dosing in ETP ............................................................................................................... 52
Table 37: ETP Findings ................................................................................................................................ 52
Table 38: ETP effluent water characteristics .............................................................................................. 54
Table 39: Summary of CP actions in ETP ..................................................................................................... 54
Table 40: Design Adequacy ......................................................................................................................... 55
Table 41: Machines & Equipment Details ................................................................................................... 57
Table 42: Rawwater& soft water data ........................................................................................................ 61
Table 43: ETP design details ........................................................................................................................ 61
Table 44: Energy Consumption ................................................................................................................... 63
LIST OF FIGURES
Figure 1: Impact of CP measures on resources ........................................................................................... 11
Figure 2: Impact of CP measures on GHG emission .................................................................................... 11
Figure 3: Percentage Share – Energy sources ............................................................................................. 16
Figure 4: Percentage Share – Energy Cost .................................................................................................. 17
Figure 5: Steam distribution layout ............................................................................................................ 19
Figure 6: Monthly Electricity Consumption ................................................................................................ 21
Figure 7: Existing Steam & Electricity System ............................................................................................. 25
Figure 8: Proposed Steam & Electricity System .......................................................................................... 25
Figure 9: Jacket water heat recovery system (Illustrative) ......................................................................... 28
Figure 10: Schematic diagram of ETP plant ................................................................................................ 50
Figure 11: Process flow diagram of 100% cotton (dark) fabric dyeing ....................................................... 59
Figure 12: Water balance diagram of IFL .................................................................................................... 60
Figure 13: Compressed air distribution schematic ..................................................................................... 64

IRIS Fabrics Ltd. PaCT IN-depth CP Assessment Report
7
ABBREVIATIONS
APCD Air Pollution Control Device
BGMEA Bangladesh Garments Manufacturing & Exporters Association
CNG Compressed Natural Gas
CP Cleaner Production
CPA Cleaner Production Assessment
CW Cooling Water
DESL Development Environergy Services Limited
IFL IRIS Fabrics Ltd.
ECR Environment Conservation Rules
EGB Exhaust Gas Boiler
ERI Engineering Resource International (Bangladesh)
ETP Effluent treatment plant
FTL Fluorescent tube light
GHG Green House Gases
H&M Hennes&Mauritz
IFC International Finance Corporation
NG Natural Gas
KPI Key Performance Indicator
PaCT Partnership for Cleaner Textile
PHE Plate Heat Exchanger
PLC Programmable Logic Control
RFT Right First Time
SOP Standard Operating Procedure
UF Ultra Filtration
VFD Variable Frequency Drive
WHRB Waste Heat Recovery Boiler
WTA Walk Through Audit
WTP Water treatment plant
UNITS OF MEASUREMENTS
Parameters UOM
Ampere A
Bangladesh Taka BDT
Biological Oxygen Demand BOD
Calorific value CV
Cubic Feet per Minute CFM
Chemical Oxygen Demand COD
Days d
GCV Gross Calorific Value
Hours H
Horse Power HP
Hertz Hz
Kilogram kg
Kilo Volt Amperes kVA

IRIS Fabrics Ltd. PaCT IN-depth CP Assessment Report
8
Parameters UOM
Kilo Watt-hour kWh
Liters l
Cubic Meter m3
Meter m
Million tons of oil equivalent MTOE
Power Factor PF
Parts per million ppm
Revolutions Per Minute RPM
Total Dissolved Solids TDS
Tons Per Hour TPH
Total Suspended Solids TSS
US Dollar USD
Voltage V
Year(s) Green House Gas Emission
y GHG Emission
CONVERSION FACTORS
Parameters UOM Value
Emission factor natural gas kg of CO₂/m3 of natural gas 2.154
Emission factor electricity kg of CO₂/kWh 0.564
Emission factor diesel kg of CO₂/liter 2.65
BASELINE PARAMETERS
Parameters UOM Value
Electricity rate (Grid) BDT/kWh 8.18
NG fuel rate (heating) NG fuel rate (Power) CNG fuel rate GCV of NG fuel GCV of CNG fuel
BDT/Nm3
BDT/Nm3
BDT/Nm3
BDT/Nm3
BDT/Nm3 kcal/liter kcal/Nm3
6.04 5.25* 7.49
3.74* 35.0
8,930 8,930
Operating days days/year 300
Average operating hours Hours 24
Annual production kg 4,999,580
Specific energy consumption
Ground Water Liters/kg 138.3
Process Water Liters/kg 113.8
NG m3/kg 0.95
Power kWh/kg 1.54
*before sept’15

IRIS Fabrics Ltd. PaCT IN-depth CP Assessment Report
9
Executive Summary The International Finance Corporation (IFC) is implementing the Bangladesh Water PaCT (Partnership for
Cleaner Textile) program to reduce environmental and related social impacts that result from prevailing
practices in textile wet processing.
PaCT has led the successful implementation of the first two steps, and in-depth assessment in 35
factories. In order to expand the project to a larger scale DESL (Development Environergy Services
Limited) has been engaged for in depth cleaner production assessment study in 27 Washing, Dyeing and
Finishing units of textile sector in Bangladesh. In this case, DESL is working with the local consultant
team Engineering Resources International (ERI).
IRIS Fabrics Ltd. (IFL) is located in Gazipur involved in the fabric dyeing & finishing operations. It has an
annual dyeing & finishing capacity of approximately 6,000 tons of fabric. The wet processing comprises
of scouring/bleaching, peroxide killing, bio-polishing, dyeing, soaping, fixing and finishing. Unit is in
production of 3 shifts, 24 hours and 300 days per year.The factory has attached garments which run 10-
12 hours per day. The factory employs approximately 228 workers in dyeing & finishing section.
The baseline assessment for the PaCT programme was carried out by IFC engaged both local and
international consulting firms on 14 March and April 10, 2016.
Metering: The status of installed meters for IRIS Fabrics Ltd. along with recommended meters by IFC
consultants are detailed below
Table 1: Metering status
Meter Baseline Assessment Recommended Additional Required
Water 13 13 0
Electricity 4 4 0
Gas 2 3 1
Steam 0 1 1
Total 19 21 2
Tables below summarize the baseline water, waste water and energy post implementation and also the
reduction for each of the resources.
The baseline KPIs along with projected KPIs are tabulated below
Table 2: Resource conservation and KPI
Resource Unit for Resources KPI (Key Performance
Indicators)
% Reduction
Projected Annual Savings,
Resources
Projected Annual Savings,
BDT
Unit for KPI
Baseline To be
Ground Water m3 138.3 132.3 4.3 30,000 270,000 Liters/kg
Process Water m3 113.8 107.7 5.4 30,000 270,000 Liters/kg
Chemicals tons 236 236 - - - gram/kg

IRIS Fabrics Ltd. PaCT IN-depth CP Assessment Report
10
Resource Unit for Resources KPI (Key Performance
Indicators)
% Reduction
Projected Annual Savings,
Resources
Projected Annual Savings,
BDT
Unit for KPI
Baseline To be
Power kWh 1.54 1.43 7.0 541,085 1,308,105 kWh/kg
NG m3 0.95 0.50 47.8 2,265,025 12,625,884 m3/kg
Others
GHG Emission Tons of CO2 11,887 7,355 38.1 4,532
Energy Bill Million BDT/annum 56.5 42.3 25.1 14.2
Table 3: Saving Summary
Sr. No
CP Measures Investment, Million BDT
Expected Annual Saving,
Million BDT
Reference in report
Utility Area
1 Heat Recovery from Boiler Flue Gas by installing economizer 1.0 1.3 2.7.1
2 Heat Recovery from Gas Engine Flue Gas by WHRB 4.0 1.2 2.7.2
3 Heat Recovery from Gas Engine Jacket Water for Hot Water application 3.0 2.0 2.7.3
4 Pressure Reduction in Air Compressor by arresting leakages Negligible 0.097 2.7.4
5 Replacement of existing submersible pump by energy efficient pump 0.2 0.06 2.7.5
6 Oxygen tuning in boiler 0.1 1.62 2.7.6
7 Lighting Optimization 2.7 1.15 2.7.7
8 Metering Requirement 0.4
Sub-total 11.4 7.4
Process Area
9 Heat recovery from dyeing machine drained liquor at higher temperature 2.5 6.21 3.4.1
10 Recovery of water from Carino slitting machine 0.3 0.27 3.4.2
11 Reducing moisture in fabric before drying on Stenter machines 0.4 0.279 3.4.3
Sub-total 3.2 6.8
ETP Area
12 Bar screen 0.25
4.12 13 Storage tank 0.75
14 Biological treatment 0.4
15 Sludge Management 0.2
Sub-total 1.60
Total 16.2 14.2
Impact of Cleaner production measures are graphically represented hereunder

IRIS Fabrics Ltd. PaCT IN-depth CP Assessment Report
11
Figure 1: Impact of CP measures on resources
Figure 2: Impact of CP measures on GHG emission
GHG emission reduction is mainly due to process heat and water recovery, installation of heat
recovery equipments, reducing most of the thermal losses and process optimization.
76821007141015
4735210
2470185
691545 661545
0
1000000
2000000
3000000
4000000
5000000
6000000
7000000
8000000
9000000
As Is To Be
kWh/annum Natural Gas m3/annum Water m3/annnum
11887
7355
0
2000
4000
6000
8000
10000
12000
14000
As Is To Be
tCO2/annum

IRIS Fabrics Ltd. PaCT IN-depth CP Assessment Report
12
1 Introduction International Finance Corporation (IFC) is implementing the Bangladesh PaCT (partnership for cleaner
textile program to reduce environmental and related social impacts that result from prevailing practices
in textile wet processing. The Program includes a component to support factories setting up and
achieving cleaner production (CP) objectives. This component is implemented in 3 steps, viz. building
factory awareness, providing factory level advise on adoption of low cost/no-cost measures and
providing in depth CP assessments, leading to investment in technologies with significant water
sustainability benefits. The program will focus on water as the primary driver for change, but will also
address energy and chemical use (water-energy chemical nexus) for an integrated approach to resource
efficiency.
PaCT is a partnership between textile wet processing factories in Bangladesh, international apparel buyers, wet processing technology suppliers, the Embassy of the Kingdom of the Netherlands (Dhaka), the International Finance Corporation (IFC), and the NGO Solidaridad. The PaCT partners share a commitment to bring about systemic, positive environmental change for the Bangladesh textile wet processing sector, its workers, and surrounding communities, and to contribute to the sector’s long-term competitiveness. To this end, the PaCT partners are collaborating to develop harmonized resource-efficiency procurement requirements, to build factory capacity, technical knowledge, and access to finance for Cleaner Production investments, and to create a platform for community and national dialogue on sustainable use of water in the textile sector. PaCT is implemented by IFC and Solidaridad, in cooperation with BGMEA. PaCT benefits from the generous anchor sponsorship of the Embassy of the Kingdom of the Netherlands. The PaCT lead sponsors are C&A, H&M, and Inditex. Associate sponsors are G-Star, KappAhl, Lindex, Primark, and Tesco.
Development Environergy Services Ltd. New Delhi and Engineering Resources International have been
engaged by IFC to provide in-depth assessments to identified textile units.
1.1 Objective The specific objectives of this assignment are for identified factories, are to
1. Assess current usage of water, energy , chemicals,GHG emission and waste water discharge in
factory
2. Identify saving opportunities by assessing wet dyeing process i.e. Washing, Dyeing and Finishing
operations in textile units for delivering water and energy in a more efficient/less wasteful
manner
3. Identify various options and investment plan to reduce water, energy , chemical consumption
and effluent generation in the textile processing with improvement in ETP and WTP
4. Improve efficiency in resource utilization to make cleaner production at factory level and making
the factory owners and decision makers aware of advantages of investing in technologies that

IRIS Fabrics Ltd. PaCT IN-depth CP Assessment Report
13
significantly reduce consumption of resources like energy, water and chemical use as well as
reduce water effluent making the production process cleaner.
5. Identify opportunities for improving energy and water management system
6. On an ongoing system, share with IFC insights and lessons learned from the assessments, and
prepare a formal note on lessons learned midway and at the end of the assignment
1.2 Scope of work The objective shall be achieved through
1. Baseline data collection
2. Detailed technical assessment
3. Advice and demonstration of good practices in the dye house, ETP and utilities in selected 41
textile wet processing factories
4. Follow-up visits to factories for monitoring
5. Dissemination of results and awareness raising
1.3 Methodology In order to assess the cleaner production opportunity toimprove energy efficiency and water
consumption of its current operations in WDF textile factories by conducting a walk through audit (site
work) along with local consultant’s team:
Walk through audit is planned to understand the process, practices and ground condition of the
plants. The consultant’s team will identify the opportunities for potential savings by observation and
interrogation of plants personnel in Electricity and thermal energy usage, process equipments
condition, following process flow up to final product. Use of energy, water and chemical will be
critically studied to guide local team for necessary measurements during detail audit of the plant.
ETP and water treatment will be studied to understand and identify the needs to improve the
process and reduce consumption where possible.
Data collection - Measure, monitor and collect all energy (electrical and thermal) and resource
consumption data of the textile wet processing units including water, chemical usage, Effluent
treatment plants’ operation and chemical used for ETP
o To help local consultant team to create a resource map of energy and water sources and
users in the textile processing facility from the collected data analysis and make an
energy/water balance
o Historical data collection of resource consumption required for baseline establishment
o The local consultant’s team would measure different parameters such as energy
consumption, fuel consumption, water consumption, steam consumption, performance of
the boiler, compressed air consumption, thermal energy user areas and other relevant data
points to make the complete resource map (energy, water, chemical and effluent)

IRIS Fabrics Ltd. PaCT IN-depth CP Assessment Report
14
o The local consultants team will also collect the data for chemicals used in different
processes and effluent discharge quantity, quality and effluent treatment process used in
present condition
Identify measures to reduce end-use demand for energy, chemical and water, for example by
improving process system, improving equipment or system
Identify measures to improve the efficiency of utility service; for example by steam distribution
system improvements, reduction of heat loss, water consumption reduction potential, use of high-
efficiency luminaries/motors,etc.
Identify measures to enhance heat recovery or heat generation efficiency, processes, also identify
measures improvement of ETP functionality, design, up gradation, etc.
These reviews shall include all production operations and supporting utility systems such as boilers,
Thermic fluid heaters, Diesel Generator sets, waste heat recovery systems, Insulation systems, dryer
system operation, Fans and blowers, Pumps, compressed air systems, lighting systems and Effluent
treatment plants etc.
For each saving opportunity identified above,
o Estimate the annual saving (energy (kWh), water saving; chemical saving; avoided water
discharge, GHG emission (TCO2e), cost (BD Taka & USD) for the measure
o Estimate the project cost or cost of implementation
o Calculate the simple payback period.
1.4 In depth cleaner production assessment in IRIS Fabrics Ltd. IRIS Fabrics Ltd. (which will be referred to herein after as IFL) is participating in the current project as a
partner unit. It was established in the year 2007. It is an export oriented knit dyeing & finishing factory.
This report describes the result of in depth Cleaner Production Assessment (CPA) of IFL. The goal of
cleaner production is to avoid pollution by utmost utilization of resources and raw materials. This means
that a higher percentage of the raw materials are turned into valuable products instead of being wasted.
Basic CP assessment was carried out at IFLon September, 2014.
IFL then participates in level 2 of CP assessment i.e. CP assessment.
Engineering Resources International (ERI) Ltd. along with the brand sent deep dive questionnaire
prepared by previous international consultants. Further missing data was requested to provide
before the pre-assessment visit. ERI local consultant visited the factory on 14/03/2016.
Walk through audit (WTA) was conducted by DESL (Development Environergy Services Limited) in
co-ordination with ERIon 10/04/2016 to verify resources available, utilization, resources for
process, water and chemical consumption in process, water and waste water utilization and
recoveries.
DESL asked for further data which was provided by ERI.
DESL will de-brief the unit post WTA on unit specific observations, CP opportunities, measurement
& monitoring needs etc.

IRIS Fabrics Ltd. PaCT IN-depth CP Assessment Report
15
2 Energy & Utility
2.1 Utility Mapping IFL is using NG in one gas generator andone steam boiler. CNG is used in one stand by gas generator.
Factory also has a grid power connection. IFL also use diesel in backup generators. Break up of various
energy sources for different application in IFL is tabulated hereunder.
Table 4: Utility Mapping
Areas Available on
Site () Water Electricity
Gas (Direct to Machine)
Steam
Offices& Domestic 8% 5%
Water extraction and pretreatment 7.50%
Fabric Dyehouse 68% 28% 82%
Finishing 5% 7% 13% 10%
Printing 2%
Generator 2% 36%
Boiler 7% 1% 51%
Garments 8% 15% 8%
ETP 6%
Compressors 30%
Energy consumption from various sources of energy at IFL for last 12 months is tabulated and attached
as Annexure6.
Percentage share of energy content resource wise is shown in pie chart hereunder.
IRIS Fabrics Ltd. PaCT IN-depth CP Assessment Report
16
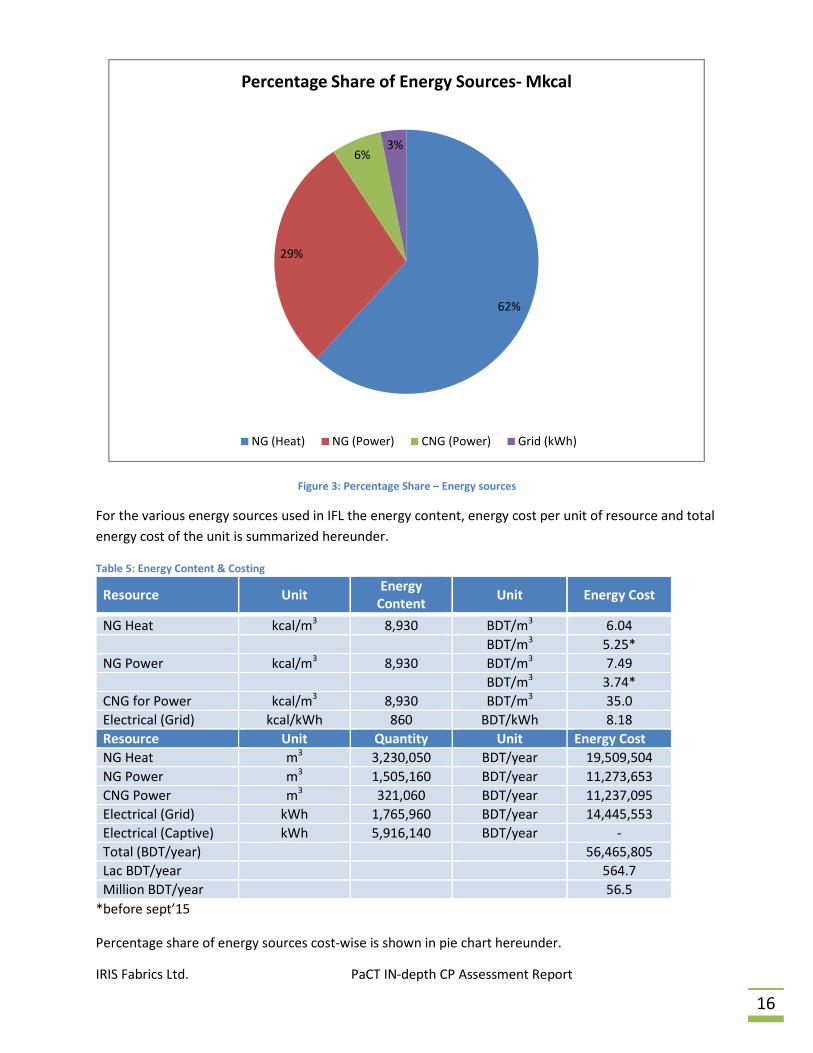
Figure 3: Percentage Share – Energy sources
For the various energy sources used in IFL the energy content, energy cost per unit of resource and total
energy cost of the unit is summarized hereunder.
Table 5: Energy Content & Costing
Resource Unit Energy
Content Unit Energy Cost
NG Heat kcal/m3 8,930 BDT/m3 6.04
BDT/m3 5.25*
NG Power kcal/m3 8,930 BDT/m3 7.49
BDT/m3 3.74*
CNG for Power kcal/m3 8,930 BDT/m3 35.0
Electrical (Grid) kcal/kWh 860 BDT/kWh 8.18
Resource Unit Quantity Unit Energy Cost
NG Heat m3 3,230,050 BDT/year 19,509,504
NG Power m3 1,505,160 BDT/year 11,273,653
CNG Power m3 321,060 BDT/year 11,237,095
Electrical (Grid) kWh 1,765,960 BDT/year 14,445,553
Electrical (Captive) kWh 5,916,140 BDT/year -
Total (BDT/year) 56,465,805
Lac BDT/year 564.7
Million BDT/year 56.5
*before sept’15
Percentage share of energy sources cost-wise is shown in pie chart hereunder.
62%
29%
6%3%
Percentage Share of Energy Sources- Mkcal
NG (Heat) NG (Power) CNG (Power) Grid (kWh)

IRIS Fabrics Ltd. PaCT IN-depth CP Assessment Report
17
Figure 4: Percentage Share – Energy Cost
2.2 NG Consuming Equipments NG as resource is mainly consumed in the following equipment:
Table 6: Natural Gas Consuming Equipments
Equipment Quantity (numbers)
Boiler 1
Stenter 1
Generator 1
2.3 Thermal Energy Thermal energy in the form of steam is generated from the only steam boiler. Steam generated is mainly
utilized in process for dyeing & finishing purposes. Installation details of boiler are tabulated hereunder.
Table 7: Installation Details of Boilers
Parameters/Boiler Tag Unit Steam Boiler
Location - Boiler Room
Make - Mechmar
Model - AS2400/150 (24000 pph)
Running Status - Running
Fuel Type - NG
Rated Output TPH 10
35%
15%
22%
28%
Percentage Shares of Energy Sources-Costwise
NG (Heat) NG (Power) CNG (Power) Grid (kWh)

IRIS Fabrics Ltd. PaCT IN-depth CP Assessment Report
18
Parameters/Boiler Tag Unit Steam Boiler
Maximum Pressure bar 10
Steam boiler is running continuously to meet the thermal demand.
Monthly steam generation and gas consumption data are attached as Annexure7.
Observations on steam generation and gas consumption are as follows:
IFL has one number 10TPH boiler installed for thermal demand.
Gas consumption is recorded by gas meter provided by utility.
Gas flow meter also records gas consumption for process equipments.
Separate gas flow meter should be installed to record gas consumption in process equipments.
Installation of gas flow meter either at boiler or at process equipments inlet line can provide
break up of gas consumption in boiler and other equipments
Performance evaluation of boiler/thermo boiler was carried out through indirect method using flue gas
analysis. Performance evaluation results are summarized along with measured parameters.
Table 8: Performance Evaluation of Boilers
Parameter Unit Thermo Oil Boiler
Calorific Value of Fuel kcal/m3 8930
O2 % in Flue gas % 12.2
Excess Air % 138.64
CO ppm 243
CO2 % 4.8
Fuel Consumption m3/hr 450.0
Ambient Temperature oC 36
Stack Temperature oC 210
Boiler Efficiency % 70.55

IRIS Fabrics Ltd. PaCT IN
Steam distribution system for IFL is shown in
finishing sections. Steam is also used for 90 steam irons in garments section.
2.4 Observations & Recommendations Following are the observations & recommendations for steam & stem distribution system
o Average steam generation is
o Oxygen tuning of boiler needs to be done, the present ox
o For gas fired boilers optimum oxygen level should be ma
o IFL has installed auto blow down system in boiler
o Condensate recovery system is very good.
o Feed water inlet temperature to boiler is more than 90
o Installation of steam flow meter can give steam generation and hence requi
hourly/daily basis..
o We recommend installing steam flow meters individually in each of the boilers.
o Steam is generated at about
o No flue gas recovery is done from boiler/thermo boilers.
o Steam to fuel ratio for gas fired boiler should be
2.5 Electrical Energy At IFL electrical energy is mainly generated using gas engines which run on NG and CNG. The factory also
has a power connection to the national grid. Power requirement is met through combination of
engines and REB (Rural Electricity Board). Gas engine run by NG is the main power source while gas
engine run by CNG is on standby. There are also three diesel generators for backup power supply.
Table 9: Diesel Engine Specification
IRIS Fabrics Ltd. PaCT IN-depth CP Assessment Report
Steam distribution system for IFL is shown in schematic hereunder. Steam is mainly used in dyeing &
finishing sections. Steam is also used for 90 steam irons in garments section.
Figure 5: Steam distribution layout
Observations & Recommendations – Thermal Energy are the observations & recommendations for steam & stem distribution system
verage steam generation is 5-6 TPH.
needs to be done, the present oxygen level in boiler is
For gas fired boilers optimum oxygen level should be maintained in the range of 2
IFL has installed auto blow down system in boiler.
system is very good.
Feed water inlet temperature to boiler is more than 90oC.
Installation of steam flow meter can give steam generation and hence requi
We recommend installing steam flow meters individually in each of the boilers.
Steam is generated at about 5.0kg/cm2.
No flue gas recovery is done from boiler/thermo boilers.
Steam to fuel ratio for gas fired boiler should be around 13-14 kg of steam/m3
At IFL electrical energy is mainly generated using gas engines which run on NG and CNG. The factory also
has a power connection to the national grid. Power requirement is met through combination of
engines and REB (Rural Electricity Board). Gas engine run by NG is the main power source while gas
engine run by CNG is on standby. There are also three diesel generators for backup power supply.
19
schematic hereunder. Steam is mainly used in dyeing &
are the observations & recommendations for steam & stem distribution system
boiler is 12.2%.
intained in the range of 2-3%.
Installation of steam flow meter can give steam generation and hence requirement on
We recommend installing steam flow meters individually in each of the boilers.
of NG fuel.
At IFL electrical energy is mainly generated using gas engines which run on NG and CNG. The factory also
has a power connection to the national grid. Power requirement is met through combination of gas
engines and REB (Rural Electricity Board). Gas engine run by NG is the main power source while gas
engine run by CNG is on standby. There are also three diesel generators for backup power supply.

IRIS Fabrics Ltd. PaCT IN-depth CP Assessment Report
20
Parameter/Diesel Engine
Unit Gas Engine-1 Gas Engine-2 Diesel
Engine-3 Diesel
Engine-4 Diesel
Engine-4
Make - CATERPILLAR CATERPILLAR VOLVO MaxEnergy KOHLER
Model - 3516 3516 GSW275V - -
Serial Number - CAT0000CZBA
00460 -
214786/007
- -
Capacity kW 1030 1030 220 200 160
Frequency Hz 50 50 50 50 50
Voltage V - - - - -
Current A - - - - -
Power Factor pf 0.95 0.95 - - -
Average monthly power generation and gas consumption is tabulated hereunder.
Table 10: Monthly Power Generation and Fuel Consumption
Month Gas Engine- 1&2 Gas Engine-1 Gas Engine-2
NG (m3) CNG (m3) kWh kWh
Jan’15 128,476 7,699 17,047 436,428
Feb’15 100,999 6,152 24,913 396,164
Mar’15 116,227 13,127 4,400 468,652
Apr’15 131,031 21,262 50,788 428,104
May’15 133,445 27,225 45,069 459,617
Jun’15 102,636 34,278 47,207 436,454
Jul’15 148,364 26,378 139,164 466,322
Aug’15 112,132 37,468 64,201 435,776
Sep’15 103,535 31,460 117,526 439,748
Oct’15 131,099 36,858 132,235 431,947
Nov’15 157,688 48,448 159,725 380,001
Dec’15 139,528 30,705 14,926 319,727
Total (year) 1,505,160 321,060 817,201 5,098,940
Observations and recommendations:
o Natural gas consumption along with power generation is recorded on daily basis.
o Natural gas consumption is recorded from utility installed gas flow meter.
o CNG is also used in one of the gas engine when there is shortage of gas or gas pressure is low.
o Contribution of CNG is about 17-18% of the total gas consumption in gas engines.
o Average specific power generation from gas engine is 3.24 kWh/m3

IRIS Fabrics Ltd. PaCT IN-depth CP Assessment Report
21
o IFL should consult OEM (Original Equipment Manufacturer) for specific power generation from
diesel engines.
o Specific power generation also depends upon loading on gas engines, hence IFL need to check
the specific norms at different load conditions
o Natural gas cost for the power generation from gas engine is 7.49 BDT/m3.
o Power generation from diesel engine is NIL.
o Contribution from REB grid is about 23% of the total power requirement.
The month-wise variation in electricity consumption is shown graphically in the figure below, red line
indicates average monthly electricity consumption:
Figure 6: Monthly Electricity Consumption
2.6 Compressed Air System Air compressors are installed to generate compressed air which are used in process area mainly for
pneumatic equipments/instruments, compressed air is also widely used in industry for cleaning purpose.
Specifications of the air compresors installed at IFL is tabulated hereunder.
Table 11: Air Compressors – Installation Details
Description Unit BOGE SANLION SANLION GARDNER DENVER
GARDNER DENVER
PARISE
Model - S-40-2 SK5008DS-B - VS55 ESM 55 PVF50/EC0
6-8
Type - Screw Screw Screw Screw Screw Screw
Quantity numbers 3 1 1 1 1 1
67
10
40
56
76
22 68
08
12
57
95
92 7
17
21
6
60
95
36 71
20
16
65
50
02
65
24
09
70
86
07
64
04
26
48
78
23
0
100000
200000
300000
400000
500000
600000
700000
800000
Jan'15 Feb'15 Mar'15 Apr'15 May'15 Jun'15 Jul'15 Aug'15 Sep'15 Oct'15 Nov'15 Dec'15
kWh
Monthly Electricity Consumption

IRIS Fabrics Ltd. PaCT IN-depth CP Assessment Report
22
Description Unit BOGE SANLION SANLION GARDNER DENVER
GARDNER DENVER
PARISE
Status - Running Running Running Running Running Running
Flow rate m3/min - - - - - -
Maximum Pressure
bar 10.0 10.0 10.0 10.0 10.0 10.0
Motor Rating kW 30 37 25 50 50 30
Air Dryer - Yes Yes Yes Yes Yes Yes
Compressed air distribution schematic is shown in Annexure8.
IFL has installed eight numbers air compressors. Air is collected in receiver, passed through air dryer to
remove moisture and then through common header air is distributed to various sections.
Observations:
Present unload pressure of air compressor is 8.0 bar.
Present load pressure is 7.0 bar.
Operating pressure of air compressor is 7.1-7.2 bar.
Header pressure after dryer is observed to be 6.3 bar.
Power consumption of air compressor is in the range of 43-45 kW.
Out of eight, 4-5 compressors are running contineously as per air demand.
Performance of compressor#7 and compressor#8 was evaluated by measuring power (kW) and
taking flow rate from compressor panel.
For compressor#7, specific power consumption is 0.181 kW/CFM.
For compressor#8, specific power consumption is 0.174 kW/CFM.
Recommendations:
o Recommend to perform regular leakage test and monitor the leakage level.
o Compressed air leakages should not be more than 15%.
o Regular pump up test can also performed to check capacity delivery.
o For any future requirement of additional air compressor unit should opt for VFD (Variable
Frequency Drive) driven compressors.
o VFD driven compressor will give better pressure control and also would lead to power saving.
o With VFD unload power consumption will be avoided.
2.7 Action plan for CP Measures – Electrical & Thermal Utilities Based on the analysis, cleaner production actions have been identified; each of which are described
below:
2.7.1 CP measure no 1: Heat recovery from boiler flue gas by installing economizer
Project
Preheat feed water by utilizing heat from flue gas of Boilers.
Study & Investigation
IRIS Fabrics Ltd. PaCT IN-depth CP Assessment Report
23
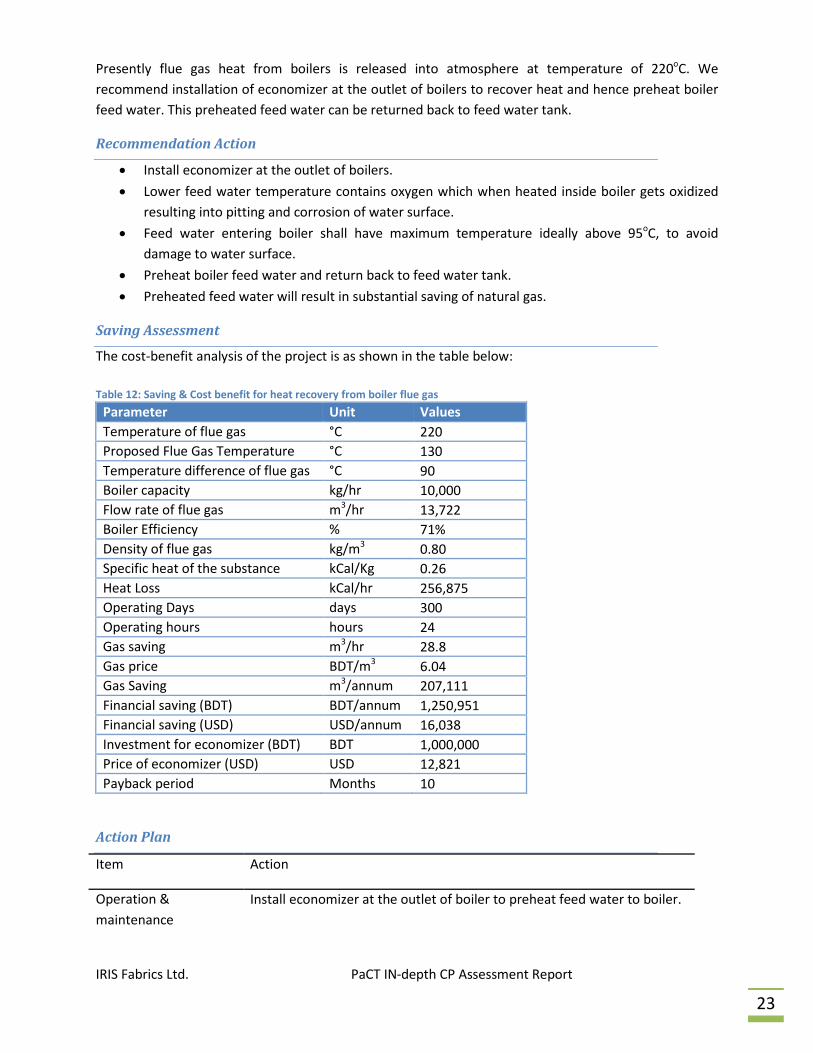
Presently flue gas heat from boilers is released into atmosphere at temperature of 220oC. We
recommend installation of economizer at the outlet of boilers to recover heat and hence preheat boiler
feed water. This preheated feed water can be returned back to feed water tank.
Recommendation Action
Install economizer at the outlet of boilers.
Lower feed water temperature contains oxygen which when heated inside boiler gets oxidized
resulting into pitting and corrosion of water surface.
Feed water entering boiler shall have maximum temperature ideally above 95oC, to avoid
damage to water surface.
Preheat boiler feed water and return back to feed water tank.
Preheated feed water will result in substantial saving of natural gas.
Saving Assessment
The cost-benefit analysis of the project is as shown in the table below:
Table 12: Saving & Cost benefit for heat recovery from boiler flue gas
Parameter Unit Values
Temperature of flue gas °C 220
Proposed Flue Gas Temperature °C 130
Temperature difference of flue gas °C 90
Boiler capacity kg/hr 10,000
Flow rate of flue gas m3/hr 13,722
Boiler Efficiency % 71%
Density of flue gas kg/m3 0.80
Specific heat of the substance kCal/Kg 0.26
Heat Loss kCal/hr 256,875
Operating Days days 300
Operating hours hours 24
Gas saving m3/hr 28.8
Gas price BDT/m3 6.04
Gas Saving m3/annum 207,111
Financial saving (BDT) BDT/annum 1,250,951
Financial saving (USD) USD/annum 16,038
Investment for economizer (BDT) BDT 1,000,000
Price of economizer (USD) USD 12,821
Payback period Months 10
Action Plan
Item Action
Operation &
maintenance
Install economizer at the outlet of boiler to preheat feed water to boiler.

IRIS Fabrics Ltd. PaCT IN-depth CP Assessment Report
24
Retrofit Install economizer, flue gas ducting, water piping, connection with feed
water tank, connection with combustion blower etc
Replacement Economizer installation, piping, insulation, automation system,
connection with feed water tank, connection with combustion blower etc
Procurement APH, Economizer, piping, valves, insulation, instrumentation etc
Construction Necessary fabrication work to install economizer with necessary piping,
flue gas ducts, instrumentation etc
Costing Estimate BDT 1,000,000
Project Specific
Baseline Parameters
Cost of natural gas 6.04 BDT/m3
Operating days – 300
Operating hours – 24
Baseline Natural gas consumption in boilers, present flue gas temperature at
outlet of boiler
Implication, If any &
precaution
None
Social Benefits Improved working conditions, reduced natural gas consumption.
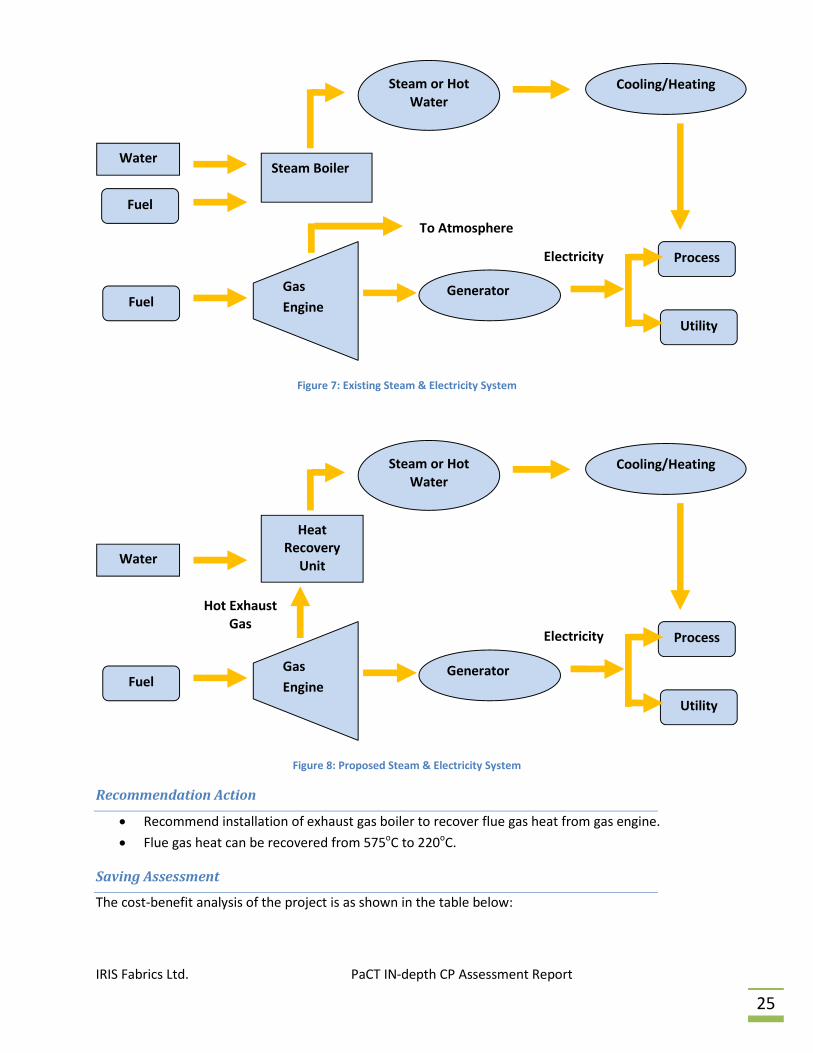
2.7.2 CP measure no 2: Installation of exhaust gas boiler (EGB)
Project
Heat recovery from flue gas of gas engine.
Study & Investigation
During the field visit it was observed that flue gas of one number gas engine (1030kW) running at IFL is
not being utilized for heat recovery option, flue gas from this engine is released into atmosphere
without any heat recovery at temperature more than 500-550oC.
IRIS Fabrics Ltd. PaCT IN-depth CP Assessment Report
25
Figure 7: Existing Steam & Electricity System
Figure 8: Proposed Steam & Electricity System
Recommendation Action
Recommend installation of exhaust gas boiler to recover flue gas heat from gas engine.
Flue gas heat can be recovered from 575oC to 220oC.
Saving Assessment
The cost-benefit analysis of the project is as shown in the table below:
Fuel Gas
Engine Generator
Water
Utility
Process
Heat Recovery
Unit
Steam or Hot Water
Cooling/Heating
Hot Exhaust Gas
Electricity
Fuel Gas
Engine Generator
Water
Utility
Process
Steam Boiler
Steam or Hot Water
Cooling/Heating
Electricity
To Atmosphere
Fuel

IRIS Fabrics Ltd. PaCT IN-depth CP Assessment Report
26
Table 13: Saving & Cost benefit for installation of exhaust gas boiler
Parameter Unit Values
Temperature of flue gas °C 575
Proposed Flue Gas Temperature °C 220
Temperature difference of flue gas °C 355
NG Consumption in Gas Engine m3/hr 200
Actual Load on Engine % 80%
Flue gas per m3 of NG m3/m3 17
Calculated Flue Gas Flow Rate m3/hr 3,400
Density of flue gas kg/m3 0.80
Specific heat of the substance kCal/Kg 0.26
Heat Loss kCal/hr 251,056
Steam Generation kg/hr 412
Operating Days days 300
Operating hours hours 24
Gas saving m3/hr 28.1
Gas price BDT/m3 6.04
Gas Saving m3/annum 202,419
Financial saving (BDT) BDT/annum 1,222,612
Financial saving (USD) USD/annum 15,675
Investment for WHRB (BDT) BDT 4,000,000
Investment for WHRB(USD) USD 51,282
Payback period Months 39
Action Plan
Item Action
Operation &
maintenance
Installation of exhaust gas boiler would require regular maintenance of
water side, flue side and air side path for efficient performance of boiler
Retrofit Install exhaust gas boiler in the flue gas path
Replacement Arrangement is to be made in the flue gas path for the installation of
exhaust gas boiler
Procurement Exhaust gas boiler, steam piping, water piping, electrical connection and
compressed air supply to commission exhaust gas boiler
Construction Necessary fabrication work to install EGB in the flue gas path.
Costing Estimate BDT 4,000,000
Project Specific
Baseline Parameters
Cost of natural gas 6.04 BDT/m3
Operating days – 300
Operating hours - 24

IRIS Fabrics Ltd. PaCT IN-depth CP Assessment Report
27
Baseline Exhaust flue gas temperature – 575oC
Steam generation from EGB – 412 kg/hr
Present fuel consumption for steam generation (412 kg/hr) – 202,419 m3
Implication, If any &
precaution
None
Social Benefits Improved working conditions, reduced natural gas consumption.
2.7.3 CP measure no 3: Heat recovery from gas engine jacket water for hot water
application
Project
Install heat recovery system to trap available heat from gas engine jacket water.
Study & Investigation
During the field visit it was observed that jacket water heat is being released through cooling tower into
the atmosphere. Substantial heat is available in jacket water which can be utilized for generating hot
water.
Recommendation Action
Install hot water recovery system in parallel with existing heat exchanger, which will tap heat
from jacket water and generate hot water.
As and when there is requirement of hot water existing system will be bypassed and new system
will generate hot water.
Whenever there is no requirement of hot water then existing system will work.

IRIS Fabrics Ltd. PaCT IN-depth CP Assessment Report
28
Figure 9: Jacket water heat recovery system (Illustrative)
Saving Assessment
The cost-benefit analysis of the project is as shown in the table below:
Table 14: Saving & Cost benefit for jacket water heat recovery system
Parameter Unit Values
Water Flow Rate in Gas Engine m3/hr 70
Jacket Water inlet temperature °C 86
Jacket Water outlet temperature °C 80
Heat Recoverable kCal/hr 336,000
Hot Water inlet temperature °C 35
Hot Water outlet temperature °C 70
Hot Water Generation m3/hr 9.6
Operating Days days 300
Operating hours hours 24
Gas price BDT/m3 6.04
Gas Saving m3/hour 47
Gas Saving m3/annum 338,634
Financial saving (BDT) BDT/annum 2,045,348
Financial saving (USD) USD/annum 26,222
Investment for Hot Water System (BDT) BDT 3,000,000
Investment for Hot Water System (USD) USD 38,462

IRIS Fabrics Ltd. PaCT IN-depth CP Assessment Report
29
Parameter Unit Values
Payback period Months 18
Action Plan
Item Action
Operation &
maintenance
Operation and maintenance of plate type heat exchanger, operation of
instrumentation and automation system.
Retrofit Some provisions are to be done for retrofitting so that both existing as
well as new system will work as per requirement.
Replacement None
Procurement New heat recovery system will include plate type heat exchanger, hot
water tanks, diverter valves , piping etc
Construction Installation of plate type heat exchanger, pumps, tanks, piping, valves,
instrumentation and piping.
Costing Estimate : BDT 3,000,000
Project Specific
Baseline Parameters
Cost of Natural gas – 6.04 BDT/m3
Operating days – 300
Operating hours - 24
Baseline Present gas consumption for steam generation through boiler, with
proposed CP measure gas consumption in boiler will reduce as presently
steam being used for hot water generation shall reduce.
Implication, If any
&precaution
None
Social Benefits Improved working conditions, reduced electricity consumption.
2.7.4 CP measure no 4: Pressure reduction in air compressors by arresting leakages
Project
Opportunity to reduce pressure in compressed air system by arresting leakages in the distribution
system.
Study & Investigation
During the field visit it was observed that supply pressure is kept in the range of 7.1-7.2bar. Unload
pressure of air compressor was kept at 8.0 bar and load pressure at 7.0 bar. Set points are kept high to

IRIS Fabrics Ltd. PaCT IN-depth CP Assessment Report
30
meet the air pressure requirement at user end. It is anticipated that there may be air leakages in the
system hence air has to be generated at higher pressure.
Recommendation Action
Leakages in the air distribution system are to be identified.
Once identified these leakages are to be plugged.
As the leakages are plugged the set point of air compressor can be reduced
It is expected that once leakages are arrested air pressure can be reduced by 0.5bar.
Leakage identification and arresting of air leakages should be taken up as routine maintenance
practices.
Saving Assessment
The cost-benefit analysis of the project is as shown in the table below:
Table 15: Saving & Cost benefit by pressure reduction
Parameter Unit Values
Present Unload Pressure kg/cm2 8.0
Present Load Pressure kg/cm2 7.0
Proposed Unload Pressure kg/cm2 7.5
Proposed Load Pressure kg/cm2 6.5
Pressure Reduction in Air Compressor kg/cm2 0.5
Saving Potential % 3.0
Present Power Consumption kW 229
Proposed Power Consumption kW 222
Saving Potential kW 6.9
Operating Days days 300
Operating hours hours 24
Saving Potential kWh/annum 49,407
Gas Saving m3/annum 13,002
Gas price BDT/m3 7.49
Gas Saving BDT/annum 97,383
Investment BDT/USD Negligible
Payback period Months Immediate
Action Plan
Item Action
Operation &
maintenance
Leakages identification and systematic plugging to be taken up as routine
maintenance practice.
Retrofit None
Replacement Damaged leakage joints like ferrules, valves, connectors etc
Procurement Connectors, ferrules, valves etc

IRIS Fabrics Ltd. PaCT IN-depth CP Assessment Report
31
Construction None.
Costing Negligible
Project Specific
Baseline Parameters
Cost of natural gas for power generation – 7.49 BDT/m3
Operating days – 300
Operating hours - 24
Baseline Present Power consumption – 229.0kW
Implication, If any &
precaution
None
Social Benefits Improved working conditions, reduced electricity consumption.
2.7.5 CP measure no 5: Replacement of existing submersible pumps by energy efficient
pump
Project
Install new energy efficient pump instead of existing submersible pumps.
Study & Investigation
During the field it was observed through measurement of flow, head and power that the efficiency of
existing submersible pumps are in the range of 45-50%. Hence it is recommended to replace existing
submersible pumps by energy efficient pump with 65% efficiency.
Recommendation Action
It is recommended to install new energy efficient pump.
Once installed flow, pressure and power to be measured for new pump.
New pumps shall have efficiency of 65%
Saving Assessment
The cost-benefit analysis of the project is as shown in the table below:
Table 16: Saving & Cost benefit for replacement of submersible pump by energy efficient pump
Parameter Unit Submersible#1 Submersible#2
Existing Water Flow m3/hr 144.0 168.0
Total Head m 24.2 24.1
Existing Pump Power kW 24.4 26.1
Pump Efficiency % 45.8 49.7
Proposed Flow m3/hr 144.0 168.0
Proposed Head m 25.0 25.0
Proposed Efficiency % 65.0 65.0
Proposed Power kW 17.2 20.0
Saving Potential kW 7.2 6.1

IRIS Fabrics Ltd. PaCT IN-depth CP Assessment Report
32
Parameter Unit Submersible#1 Submersible#2
Saving Potential kWh/annum 17,313 14,718
Saving in Natural Gas m3/annum 4556 3873
Cost of Natural Gas BDT/m3 7.49 7.49
Saving Potential BDT/annum 34,125 29,009
Investment INR 100,000 100,000
Payback Period months 35 41
Action Plan
Item Action
Operation &
maintenance
New pumps are to be maintained as per OEM suggestion for regular
maintenance practices
Retrofit Installation of energy efficient submersible pumps.
Replacement None
Procurement Submersible pumps with strainer and cables
Construction Installation & testing of new submersible pump.
Costing Estimate : BDT 200,000
Project Specific
Baseline Parameters
Cost of Natural Gas (Power) – 7.49 BDT/m3
Operating days – 300
Operating hours – 24
Baseline Present Power consumption
Submersible pump#1 – 24.4kW
Submersible pump#2 – 26.1kW
Implication, If any &
precaution
None
Social Benefits Improved working conditions, reduced electricity consumption.
2.7.6 CP measure no 3: Oxygen tuning of Boiler
Project
Optimum oxygen level in boiler to reduce natural gas consumption.
Study & Investigation
During the field visit it was observed that oxygen level in boilers is 12.2% which is high for boiler of this
capacity. We recommend maintaining oxygen level in the range of 2-3% for fuel saving and hence
improved combustion efficiency of boiler.

IRIS Fabrics Ltd. PaCT IN-depth CP Assessment Report
33
Recommendation Action
Recommend oxygen tuning in the boiler to maintain oxygen level in the range of 2-3%.
An online oxygen tuning system can also be installed which will sense set oxygen level and
continuously operate the fan damper to maintain the oxygen level.
With oxygen controller boiler combustion efficiency can be improved in between 2-6%.
Saving Assessment
The cost-benefit analysis of the project is as shown in the table below:
Table 17: Saving & Cost benefit for oxygen tuning of boiler
Parameter Unit 10.0TPH
Present Oxygen Level % 12.2
Proposed Oxygen Level % 3.0
Present Excess Air % 138.6
Proposed Excess Air % 17
Efficiency Improvement % 8.28
Present NG Consumption m3/hour 450
Proposed NG Consumption m3/hour 413
NG Saving m3/hour 37
Operating Days days 300
Operating hours hours 24
Natural Gas Saving m3/annum 268,272
Cost of Natural Gas BDT/m3 6.04
Total Cost Saving BDT/annum 1,620,363
Total Cost Saving USD/annum 20,774
Investment for Oxygen Tuning BDT 100,000
Investment for Oxygen Tuning USD 1,282
Payback Period months 1
Action Plan
Item Action
Operation &
maintenance
Maintain oxygen level in boiler by routine testing of flue gas parameters
or alternatively installation of online oxygen analyzer which shall sense
the oxygen level and give feedback to the fan damper to maintain the set
oxygen level. Oxygen analyzer calibration to be carried out at regular
interval.
Retrofit Install oxygen sensor along with controller to maintain set oxygen level
(Optional)
Replacement Arrangement is to be made in the flue gas path for the installation of
oxygen sensor with controller or access point for routine testing of flue
gas parameter

IRIS Fabrics Ltd. PaCT IN-depth CP Assessment Report
34
Procurement Arrangement to be made for testing of flue gas parameter.
Construction Necessary fabrication work to insert flue gas probe or install oxygen
sensor in the flue gas path.
Costing Estimate BDT 100,000 (Costing considered for routine testing of flue gas
parameter)
Project Specific
Baseline Parameters
Cost of natural gas 6.74 BDT/m3
Operating days – 300
Operating hours - 24
Baseline Boiler Oxygen Level – 12.2%
Present fuel consumption - 450 m3/hr
Implication, If any &
precaution
None
Social Benefits Improved working conditions, reduced natural gas consumption.
2.7.7 CP measure no 7: Energy Efficient Lighting System
Project
Install energy efficient LED lamps.
Study & Investigation
During the field visit it was observed that 36W tube-lights with conventional ballast were installed at
many locations in unit and these lamps are running 24hours. Comparisons of various lamps are shown
hereunder.
Table 18: Comparison of lamps
Type of Lamp Diameter of lamp (mm)
Lumens/Watt Typical Life (hours)
Colour Rendering (%)
T12 38 60 5,000 65
T8 26 68 8,000 72
T5 16 104 20,000 85
LED 18/22 104 50,000 80
Recommendation Action
Existing 36W tube lights with conventional ballast consume more power

IRIS Fabrics Ltd. PaCT IN-depth CP Assessment Report
35
LED lamp would consume less power.
Saving potential to the tune of 50% can be achieved.
Saving Assessment
The cost-benefit analysis of the project is as shown in the table below:
Table 19: Saving & Cost benefit for energy efficient tube lights
Parameter Unit AS IS TO BE
Type of Fixture FTL LED
Type of Choke if Applicable Electronic Electronic
Type 36W X 1 18W X 1
Number of Fixtures # 2660 2660
Rated Power of Fixture Watt/Unit 36 18
Consumption of Choke 6 0
Operating Power Watt/Unit 42 18
Operating Hour per Day Hours/Day 300 300
Operating Days per Year Days/annum 24 24
Annual Energy Consumption kWh/annum 804,384 344,736
Annual Energy Saving kWh/annum 459,648
Saving in Natural Gas m3/annum 153,216
Cost of Natural Gas BDT/m3 7.49
Annual energy cost savings BDT/annum 1,147,588
Investment BDT 2,660,000
Payback months 28
Action Plan
Item Action
Operation &
maintenance
LED lamps will have less maintenance issues compared to conventional
ballast, also the life of the lamp will be increased because of electronic
ballast.
Retrofit Retrofitting can be done in existing tube fittings
Replacement None
Procurement LED lamp
Construction Retrofitting/replacement of existing lamps with energy efficient lamps.
Costing Estimate : BDT 2,660,000
Project Specific
Baseline Parameters
Cost of natural gas (Power) – 7.49BDT/m3
Operating days – 300

IRIS Fabrics Ltd. PaCT IN-depth CP Assessment Report
36
Operating hours – 24
Baseline Present Power consumption – 42W
Implication, If any &
precaution
None
Social Benefits Improved working conditions, reduced electricity consumption.
2.8 Summary of CP measures in Utility area
2.8.1 Electrical energy consumption areas Table 20: CP measures for Electrical System
Name of Area Present Set-up Observations during field Study & measurements
Proposed Cleaner production actions
Efficient Water Pumping System (Submersible Pumps)
Pump efficiency was found to be poor
Measured flow, pressure and power of existing submersible pumps, and derived efficiency of the pump.
Energy efficient pump will lead substantial saving in energy consumption.
Lighting System 36 Watts tube-lights installed in entire factory
Mostly these tube lights are running even in day time
Recommend replacing 36W tube lights by 18W energy efficient LED lamps with electronic ballast
Compressed Air Compressor unload and load pressure set point are high
Due to air leakages in the distribution system set points may have to be kept high.
We recommend regular monitoring of compressed air network and arrest leakages on regular basis. Once the air leakages are arrested the load and unload set points can be brought down.
2.8.2 Thermal energy consumption areas Table 21: CP measures for Thermal System
Name of Area Present Set-up Observations during field Study & measurements
Proposed Cleaner production actions
Boiler Oxygen level in flue gas is high
It was observed that oxygen levels in boilers are 12.2%, which is high for natural gas.
Recommend online oxygen tuning system which will maintain optimum oxygen level of 2-3% in boiler.
Gas Engine No heat recovery from flue gas
Flue gas exit temperature from gas engine was at 550oC. This available heat can be utilized by installing appropriate heat recovery system
Recommend installing Exhaust Gas Boiler (EGB) at the exit of gas engine to generate steam. After EGB the flue gas temperature will be less than 220oC
Gas Engine No heat recovery Jacket water temperature Recommend installing jacket

IRIS Fabrics Ltd. PaCT IN-depth CP Assessment Report
37
Name of Area Present Set-up Observations during field Study & measurements
Proposed Cleaner production actions
from engine jacket water
from gas engine was 85-90oC. This available heat can be utilized by installing appropriate heat recovery system
water heat recovery system along with existing PHE (Plate heat exchanger) to generate hot water. During the period when hot water requirement is reduced existing cooling water system will take over.
Boiler There is no heat recovery from boiler flue gas
Boiler flue gas has temperature of 220oC, This heat can be utilized for feed water pre-heating or pre-heating of combustion air
Recommend installation of economizer to pre-heat feed water entering to boiler.

IRIS Fabrics Ltd. PaCT IN-depth CP Assessment Report
38
3 Unit & Process details
3.1 Introduction IFL is situated at Zirani Bazar, BKSP, Kashimpur, Gazipur, Bangladesh and is the member of Bangladesh
Garments Manufacturer and Exporter Association (BGMEA). Details of the unit are tabulated hereunder.
Table 22: Industry details
Parameters Details
Name of the industry IRIS Fabrics Ltd.
Address Zirani Bazar, BKSP, Kashimpur, District: Gazipur, Division: Dhaka
Production capacity 6,000,000 kg ( Actual -1,792,603 kg. – Jan to Mar 2016 )
Products Knit dyeing & finishing
Number of workers 228
Number of working days in a year 300
Quantity of NG used m3/year 4,735,210
Quantity of CNG used m3/year 321,060
Quantity of Electrical energy used kWh/year 7,682,100
Quantity of water used (process) m3/year 568,820
Waste water discharged m3/year 555,430
GHG emissions avoided tCO2/year 11,887
Chemical consumption tons/year 1,183*
*based on chemical KPI’2016 and dyeing & finishing production’2015
The production facility comprises the different type of machines and equipment. A list of plant machines
and equipment is given Annexure1.
3.2 Raw material and finished products IRIS Fabrics Ltd. is a textile-processing unit (dyeing & finishing) of knitted grey fabric (75% cotton, 15%
PC & 10% CVC). IFL has knit products of different varieties as per style, fashion and color of customer
requirements and order preferences. The category wise finished garments production is given below Table 23: Average Monthly Production
Product Type Average Monthly Production
Knit dyeing & finishing (kg) 597,534
3.3 Manufacturing process description – Dyeing, Washing and finishing Dyeing Process
Bulk production at IFL dyeing and finishing units are carried out by dyeing and finishing machines.
Dyeing unit is equipped with Canlar (Turkey), Fongs (China), Tong Zeng (China), Brazoli (Italy) &Startex
(China) machines. A total of 13 Canlarmachines, 3 Fongs machines, 3 Brazoli machines, 1 Tong Zeng& 2
Startex machines are installed in the current setup where 8 are sample machines. PLC control is

IRIS Fabrics Ltd. PaCT IN-depth CP Assessment Report
39
available for all dyeing machines. But only Brazoli machines are PLC operated. Water flow meters are
available in almost all dyeing machines to measure the water quantity in the machines.
The plant process flow is shown in Annexure2.
Finishing Process
The finishing process means dyeing finishing where fabric is finished to make ready for garments cutting
section. The major process includes slitting, squeezing/dewatering, drying at stenter, compacting in
tubular or open width compactor &various operations depending on the desired hand feel, shade and
quality of the fabric.
Laboratory procedures for testing and establishing the process/sample
There is in-house laboratory where regular testing on sampling basis are carried out for PH testing, tear
and tensile strength of fabric etc.
Performance results of sample to bulk production:
The record of lab sample RFT to Bulk process RFT is 80-85%.This needs to be investigated for further
improvement. Mainly, the lab process parameter and bulk process parameters like Liquor ratio, batch
cycle time, temperature, pH, specific gravity, dyes and chemical dozing as per recipes etc. should be
strictly monitored and records should be analyzed when the variations are observed. Every batch which
is reprocessed should be carefully investigated for root causes and if variations are found due to
chemicals, procedures, manual operational mistakes or fabric quality etc. should be recorded and
corrective actions to be taken for improving bulk RFT.
Tablebelow summarizes the established parameters as per data available:
Table 24: Process Performance
Process Parameters Description Figures
Lab RFT to Bulk RFT Lab to Bulk right first time % 80-85%
Bulk right first time % (except white) 95%
% Batches topped up 3%
Re-Wash % Batches re-dyed <1%
% batches completed within the set programmed time
80%
% downgrades 0%
Liquor Ratio Liquor Ratio for Bulk 1:4.5*/1:10
*only for Brazoli machines

IRIS Fabrics Ltd. PaCT IN-depth CP Assessment Report
40
Chemical dispensing methodology used for process:
Manual weighing and dispensing of chemical is used on machines. Dyers and processors use their own
experience for correction of required batch variation.
Calibration status of dyes and chemicals weighing scales
There is no systematic procedure of regular calibration of weighing scales used in dye stores.There are
no calibration procedures for the instruments on the machines for important parameters like
temperature, Specific gravity or PH. Calibration records are not maintained.
Factory specific Baseline Key Indicators
Factory specific baseline condition based on data provided by IFL is summarized hereunder.
Table 25: Key Performance Indicators – Factory
Resource Unit Value Production
(kg) KPI (Key Performance
Indicators) Unit for KPI
As Is To Be
Ground Water m3 691,545 4,999,580 138.3 132.3 liters/kg
Process Water m3 568,820 4,999,580 113.8 107.7 liters/kg
Chemicals kg 1,182,950 4,999,580 236.6 236.6 gm/kg
Power kWh 7,682,100 4,999,580 1.54 1.43 kWh/kg
NG (Heating + Power) m3 4,735,210 4,999,580 0.95 0.50 m3/kg
CNG (Power) m3 321,060 4,999,580 0.06 - liters/kg
Observations and Recommendations for improvement in wet process area
o IFL has about 70 % dark shades dyeing, 15 % medium shade, 5 % light shade and 5 % white as
per normal average production routine
o Dyeing liquor and wash liquor is drained to ETP at 80 deg C after cooling. The cooling water is
collected with reserve tank and reused for hot water requirement.
o Lab to bulk first time right percentage are good ( 80 -85 %) as per data available.
o From dyeing production, 5-10 % reprocess/correction is required which is also higher as process
performance
o The dyeing installed capacity is @ 17 TPD but since the finishing department has one Stenter
which can process 10 TPD only, the dyeing productivity is used up to only 65 % which is big
production loss.
o The finishing Stenter is a bottle neck for production as well as NG fuel availability is another
limitation, but as discussed with MD Mr. Rahim, Gas fuel supply is already approved, so Stenter
remains now only requirement to achieve increased productivity
o The table: shows below summary of observation and recommendations for improvement in
processing area.
Table 26: Process area recommendations for improvement
Sr. No.
Process area Observations Recommendations / Remarks

IRIS Fabrics Ltd. PaCT IN-depth CP Assessment Report
41
1 Dyeing department
3 Nos. Brazzoli with LR 1:4.5
3 Nos. Fongs machines- LR 1: 6, CMS make 6 Nos. + 6 sample m/c, 1 No. Tonzing machine.
Lab to Bulk RFT – 80-85 %,
Manual weighing and dozing of colour chemicals
Instruments sensors and water level are not calibrated on machine
Liquor cooling is done up to 80 deg C before draining to ETP
Cooling water from dyeing machines is collected in soft water reserve tank
Routine cleaning of dyeing machines is carried out once in 15 days
Liquor cooling can be further increased to bring down temp to 50 deg C before draining
Reprocess lots are investigated for diff reasons like finish feel, shade, visual look, GSM variation etc.
Condensate recovery is done and sent to Boiler feed tank but no meter and quantification
Heat exchanger on dyeing machines should be cleaned once in six months to save heating and cooling time
Black and dark colour batch time is 8 Hrs. due to direct scouring
Light and medium shades takes more time up to 11 Hrs
Cold soaping is tried but not successful.
2 Dye &Colour Stores Weighing scale of colour-chemicals store are found calibrated, lab scale also found calibrated
Dyes weighing scales can be frequently calibrated to avoid human errors
3 Light box of laboratory and Dyeing office
Light box of laboratory & dyeing office are calibrated
For proper judgment it is necessary.
4 Sampling Laboratory Colour and chemicals are added manually.
Soda dosing is not done in single bath but separately.
Sample checking in normal D-65 or as per buyer `s requirement.
Delta passing ratio is below 1.0
Auto Colour dispense and auto dosing systems give more accuracy and better Lab to bulk ratio
5 Finishing machines - Slitting machine-Alcan -1, turkey. - Dewatering machine – calator-1 - Dewatering machine Banks –Turkey - Dryer -1- Turkey - Open compactor- lafer-1 - Stenter -1, Bruckner –Germany - Stenter - Alkam – Turkey - Tube compactor- 1- Tubetex
- Stenter & dryer, there is no system to measure moisture content
There is no heat recovery on Stenter.
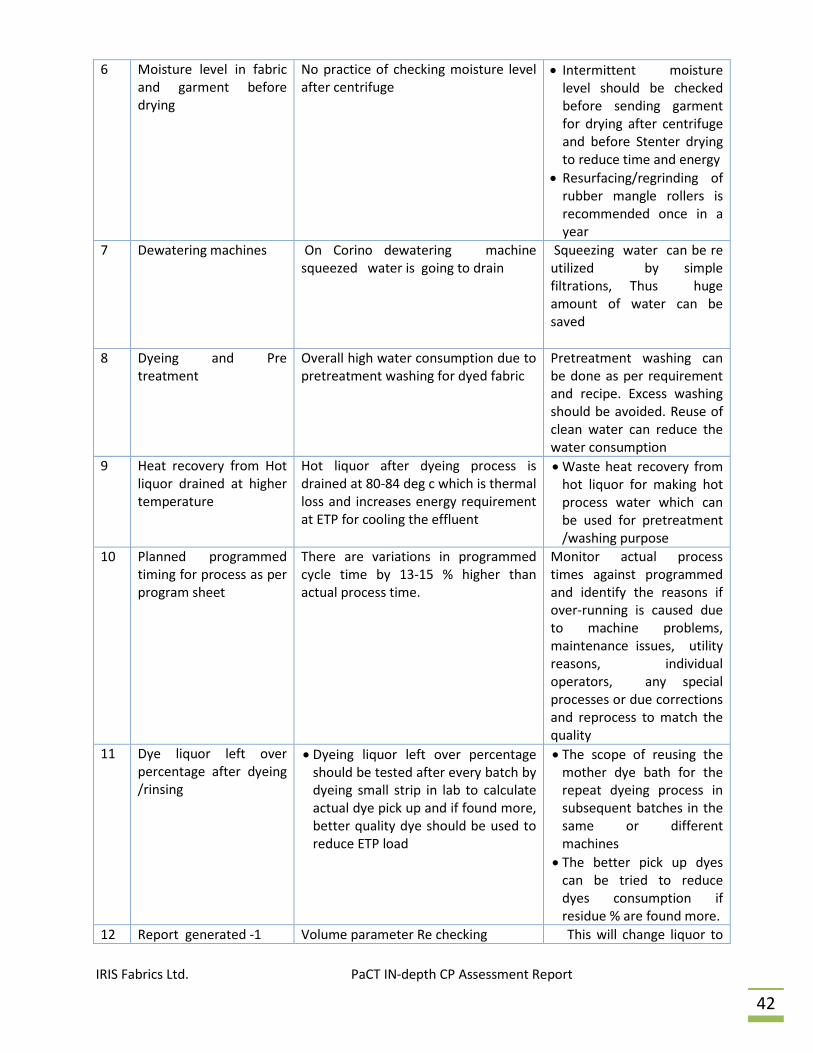
IRIS Fabrics Ltd. PaCT IN-depth CP Assessment Report
42
6 Moisture level in fabric and garment before drying
No practice of checking moisture level after centrifuge
Intermittent moisture level should be checked before sending garment for drying after centrifuge and before Stenter drying to reduce time and energy
Resurfacing/regrinding of rubber mangle rollers is recommended once in a year
7 Dewatering machines On Corino dewatering machine squeezed water is going to drain
Squeezing water can be re utilized by simple filtrations, Thus huge amount of water can be saved
8 Dyeing and Pre treatment
Overall high water consumption due to pretreatment washing for dyed fabric
Pretreatment washing can be done as per requirement and recipe. Excess washing should be avoided. Reuse of clean water can reduce the water consumption
9 Heat recovery from Hot liquor drained at higher temperature
Hot liquor after dyeing process is drained at 80-84 deg c which is thermal loss and increases energy requirement at ETP for cooling the effluent
Waste heat recovery from hot liquor for making hot process water which can be used for pretreatment /washing purpose
10 Planned programmed timing for process as per program sheet
There are variations in programmed cycle time by 13-15 % higher than actual process time.
Monitor actual process times against programmed and identify the reasons if over-running is caused due to machine problems, maintenance issues, utility reasons, individual operators, any special processes or due corrections and reprocess to match the quality
11 Dye liquor left over percentage after dyeing /rinsing
Dyeing liquor left over percentage should be tested after every batch by dyeing small strip in lab to calculate actual dye pick up and if found more, better quality dye should be used to reduce ETP load
The scope of reusing the mother dye bath for the repeat dyeing process in subsequent batches in the same or different machines
The better pick up dyes can be tried to reduce dyes consumption if residue % are found more.
12 Report generated -1 Volume parameter Re checking This will change liquor to

IRIS Fabrics Ltd. PaCT IN-depth CP Assessment Report
43
m/c no
Required volume as per sheet
Actual volume On glass Gauge pipe
remarks
16 2916 2750 166 litres more
10 2700 3100 400 litres more
19 5430 6900 1470 litres more
material ratio and lead to correction of shade. Calibration of machine parameter required
13
Report generated -2 Rechecking dyes and chemicals on weight basis.
m/c no-/chemicals
Actual Required
Actual Found
difference
10 Caustic soda
8.1 kg
12.0 kg
3900 grams more
3 dye
1200 grams
979 grams
221 grams less
This type of mistakes leads more addition of colors and chemicals, and reprocess
14 Report generated -3 Analyzed 7 machines’ work sheets of dt. 9/4/16 - Five black colors batches has taken
12.0 hrs each - For medium shade process cycle
time 10 hrs
Peroxide bleaching can be avoided In black shade which can reduce process time and chemical consumption with water saving
15 Colour -Chemical s store room
For all colors only one spoon was there in working which can create dye mixing
This will result the contamination of colors which more problematic for bright and light shades - Separate spoon is
required in all colour box
16 General Chemicals like Caustic soda are lying near the machine side which can get moisture from wet floor
If soda and salt are kept nearer to chemical room. In big plastic boxes wastage will be less and accuracy in weight will be there,

IRIS Fabrics Ltd. PaCT IN-depth CP Assessment Report
44
3.4 Wet Processing section CP measures action plan
3.4.1 CP measures no 1:
Project
Heat recovery from dyeing machine drained liquor at higher temperature.
Observation during audit
It is observed during the visit that the liquor from dyeing machines are drained at higher temperature in
the range of 80 deg C which is heat loss and creates problem at ETP treatment consuming higher
chemicals for desired results.
Recommendation Action
To reduce the liquor temperature upto 50 deg C before draining using cooling water. This cooling water
should be stored in a separate insulated hot storage water tank in the department which can be used for
hot water requirement for washing / bleaching / rinsing etc in dyeing machines
Saving Assessment
The cost-benefit analysis of the project is as shown in the table below:
Table 27: Saving & Cost benefit for heat recovery
Parameter Unit Values
Total dyeing production - Jan-Mar 2016 kg 1,792,603
Pro-rata annual production kgs/year 7,170,412
Baseline Water consumption Liters/kg 114
Assuming 60 % of total water used for hot process Liters/kg 68
Present Drained water temperature Deg C 80
Suggested drained water temperature Deg C 60
Differential temperature of heat recovery Deg C 20
Heat gained by cooling water from 30 deg C Deg C 15
Heat gained by cooling water per kg Kcal/kg 15
Total heat gained by cooling water Kcal 7,342,238,006
Equivalent saving of Gas fuel at 8930 Kcal/nm3 and 80% boiler efficiency
nm3/year 1,027,749
Annual saving of Gas fuel cost for heating @ BDT 6.04 / nm3 Million BDT 6.21
17 For Development - Value adding chemicals are just introduced in the market for sports garment and uniforms . Bio minerals chemicals, which increases the blood circulations
- For the market it is new , so better scope for introduced in marketing Sportswear, uniform garment
- To evaluate in lab for better functions

IRIS Fabrics Ltd. PaCT IN-depth CP Assessment Report
45
Parameter Unit Values
Reduced GHG emission per year T CO2e/year 2,214
Investment for heat recovery process equipment, storage tank, pipes and insulation
Million BDT 2.5
Simple Payback Months 5
Action Plan
Item Action
Initial trials Initial trail can be taken one one/two machine to reduce the drain
temperature from PLC and collecting hot water to insulated storage tank
Replacement None
Procurement From local vendors / fabricators
Construction As per vendor’s instruction
Costing To collect from local vendor
Project Specific
Baseline Parameters
Present Sp. Water consumption per kg of production as 114 Ltrs /kg and
considering 60 % of water used in high temp process which is drained at
80 Deg C, Jan-Mar 2016 Production -1,792,603 kg.
Heat gained by cold water - 15 kCal /kg
Baseline Implication, If any &
precaution
None
Social Benefits Reduced NG fuel, reduced CO2 emission, reduced effluent load and treatment cost
3.4.2 CP measures no 2: Recovery of water from Corino Slitting machines
Project
Corino slitting machines for tubular knitted fabric is using water balloon. This water can be reused and
circulated instead of draining to ETP
Observation during audit
1 No. Corino slitting machine use water balloon for tubular fabric to open
The water is drained after slitting the fabric which can be collected, filtered and reused
This can save significant amount of water without much efforts.
Recommendation Action
Drained water to be collected in a tank and filtered.
With a small circulating pump, this water can be reused for this application and
@ 5 m3/hr water can be saved on each machine
Suitable trial can be taken for one machines first and record the water consumption
Saving Assessment

IRIS Fabrics Ltd. PaCT IN-depth CP Assessment Report
46
The cost-benefit analysis of the project is as shown in the table below:
Table 28: Benefits for water recovery from dewatering machine
Parameter Unit Values
Total Number of Tubular fabric slitting machines Numbers 1
Present water Consumption per hour M3/hour 5
Average operating hours for each machine hours 20
Saving Potential with each machine m3/day 100
Total Saving Potential per day m3 100
Annual operating Days days 300
Total Water saving potential per year m3/year 30,000
Annual water cost saving potential Million BDT 0.27
Estimated investment for 3 machines Million BDT 0.3
Simple Payback period Months 13
Action Plan
Item Action
Initial trials Initial trials can be taken on machine from local vendors available in
Dhaka
Retrofit Collection tank, water filter and circulation pump
Procurement From Local vendors
Construction As per vendor’s instruction and design
Costing Estimate : 300,000 BDT for three machines
Project Specific
Baseline Parameters
No. of slitting machines -1
Operating days – 300, Average operating hours per day -20
Baseline Present water consumption per hour on each machine – 5 m3/hr
Implication, If any &
precaution
None
Social Benefits Reduced water consumption, reduced effluent load
3.4.3 CP measures no 3: Reducing moisture in fabric before drying on Stenter machines
Project
Recoating/regrinding of rubber padding mangles for reducing moisture percentage in Stenter drying
Observation during audit
- For Stenter drying process of fabric, no information of moisture content in fabric before entry to
Stenter is available; there is no measurement / metering of moisture also before and after
drying.
- Fabric seems to have higher percentage of moisture which can consume higher thermal energy

IRIS Fabrics Ltd. PaCT IN-depth CP Assessment Report
47
Recommendation Action
Recoating/regrinding of rubber mangle rollers to squeeze the fabric to reduce moisture before
the fabric enters to Stenter
Suitable moisture meter to be installed on Stenter entry
Saving Assessment
The cost-benefit analysis of the project is as shown in the table below:
Table 29: Reducing moisture before drying in mangle
Parameter Unit Values
Total Number of Stenter machines Numbers 1
Machines operational Numbers 1
Assuming moisture content before drying % 80
Estimated reduction in moisture % 60
Total production capacity of Stenter Tons /day 10
Estimated reduction in moisture Tons/day 2
Reduction in thermal energy required to evaporate the moisture
M kcal /day 1.1
Reduction in Equivalent NG fuel consumption @ 8930 Kcal and 80 % eff.
nm3/day 154
Operating Days Days 300
Savings of annual NG fuel nm3/annum 46,193
Monetary saving in fuel cost @ 6.04 BDT Million BDT/annum
0.279
Estimated Investment for replacing rubber rollers and moisture indicator
M BDT 0.4
Simple payback Months 17
Annual reduction of GHG emission Tons/annum 99.5
Action Plan
Item Action
Initial trials Initial trials can be taken on machine by checking performance of rubber
roller by regrinding/ recoating and then replacing by new
Maintenance Existing rubber mangles need annual maintenance by regrinding
Procurement From local service providers / vendors
Installation As per vendor’s instruction
Costing Estimated : 300,000 BDT for rubber rollers
Estimated: 100,000 BDT for moisture meter
Project Specific
Baseline Parameters
No of Stenter machines -1
Operating days – 300, Present production capacity of one Stenter – 10
Tons/day
Baseline

IRIS Fabrics Ltd. PaCT IN-depth CP Assessment Report
48
Implication, If any &
precaution
None
Social Benefits Reduced NG fuel consumption, reduced CO2 emission
3.5 Water & Watertreatment Scenario Water balance diagram for IFL is shown in Annexure3
3.5.1 Water and WTP (Water Treatment Plant) - Installation
Four submersible pumps are installed by IFL to meet water requirement of process, boilers and domestic
use. Installation details of submersible pumps are tabulated hereunder.
Table 30: Submersible Pump Details
Parameters Unit Submersible Pump-1
Submersible Pump-2
Submersible Pump-3
Submersible Pump-4
Make - SIGMA (India) SIGMA (India) ZAEDA (India) ZAEDA (India)
Model - - - - -
Flow Rate m3/hr 150 150 - -
Head m 21.3 21.3 21.3 21.3
Motor Rating kW 30 30 4 4
RPM rpm 2845 2845 - -
Water treatment plant details are summarized hereunder.
Table 31: WTP Plant Details
Parameters Unit WTP-1 WTP-2
Make - SIGMA (India) SIGMA (India)
Model - Mega G 65-160 Mega G 65-160
Production Capacity m3/hr 150 150
Storage Capacity m3 - -
Number of Storage Tanks Number 1
Apart from the above pumps IFL has also installed pumps for the water distribution system. Details of
the water distribution pumps are tabulated hereunder.
Table 32: Water Distribution Pumps
Parameters Unit Booster Pumps Boiler Feed Water Pumps
Generator Cooling Water Pumps
Make - SIGMA (India) Ground Foss -
Model - DPVF 65-30 - -
Flow Rate m3/hr - - -
Head m 27.6 - -
Motor Rating kW 7.5 11 15
RPM Rpm 2850 - -
Quantity number 6 2 3

IRIS Fabrics Ltd. PaCT IN-depth CP Assessment Report
49
Observations:
a. Performances of some of the pumps were evaluated by simultaneous measurement of flow,
head & power.
b. Measured parameters and the derived efficiency of the pumps are mentioned hereunder;
Table 33: Pump Performance
Parameters Unit WTP Raw Water Pumps
Submersible Pump (Garden)
Submersible Pump#1
Submersible Pump#2
Design Flow m3/hr 100 - 150 150
Design Pressure M 35 - 21.3 21.3
Motor RPM Rpm 2900 - 2845 2845
Motor kW 18.5 - 30 30
Measured Flow m3/hr 143 12 144 168
Measured Head M 53 25.1 24.2 24.1
Measured Power kW 32.9 (3 pumps) 3.0 24.4 26.1
Efficiency % 73.7 32.1 45.8 49.6
c. Efficiency of submersible pumps is poor.
d. Efficiency of WTP pumps are satisfactory.
Recommendation:
a. Replacement of existing submersible pumps by energy efficient pump.
b. New submersible pumps shall have efficiency of 65%.
3.5.2 Water generation, distribution – Consumption
Water generation data for raw water and soft water for last one year is collected and summarized in
annexure. Ground water generation data, soft water generation data and water consumption data are
shown inAnnexure4.

IRIS Fabrics Ltd. PaCT IN-depth CP Assessment Report
50
4 Effluent Treatment Plant (ETP) The treatment system is based on biological oxidation. The scheme comprises of manual screen, lifting
sump, mechanical fine screen, storage tank, neutralization, distribution chamber, oxidation tank &
secondary clarifier and sludge management in the form of sludge thickener& filter press. The design
capacity of the plant is 1600 m3/day. Considering future expansion management has planned to install
addition new ETP of capacity 2800 m3/day.
Schematic block diagram of ETP is shown hereunder for simple understanding.
Figure 10: Schematic diagram of ETP plant

IRIS Fabrics Ltd. PaCT IN-depth CP Assessment Report
51
4.1 ETP design detail Design capacity of effluent treatment plant: 1600 m3/day
Present operational load: 1440 m3/day
FIELD OBSERVATIONS:
o Overall condition of plant is good.
o Chemical dosing maintained properly.
o Proper log sheet & records has been maintained.
o It is recommended to use nutrients for better growth of microorganism in the biological
treatment system.
Design details of ETP plant is attached as Annexure5.
4.2 Inlet and outlet effluent quantity and quality test certificate records Outlet effluent quantity and quality parameters tested by IFL on different days along with standard
norms for effluent in Bangladesh –ECR (Environment Conservation Rules) 1997 mandated by
Government of People’s Republic of Bangladesh, Ministry of Environment & Forest.
Table 34: ETP quantity & quality test report
Sl. No. Parameters Inlet to ETP Treated effluent
1 PH 9.0-10.3 7.87-8.12
2 Colour Various Slightly coloured
3 Temperature ( deg. C) 35 30-33
4 Suspended solids ( mg/lit) NA 30
5 Dissolved solids ( mg/lit) 2700-2930 1500
6 COD ( mg/lit) 530-925 22-85
7 BOD ( mg/lit) 174-300 7-28
4.3 Metering facility for effluent inlet and outlet One electromagnetic flow meter is installed at neutralized effluent pumping line& another mechanical
flow meter at outlet discharge point. Metering details of ETP plant are mentioned hereunder.
Table 35: ETP water flow meters
Sl. No. Location Type
1 Inlet( neutralized effluent out) Electromagnetic flow meter
2 Outlet Mechanical flow meter
3 Any other location No flow meter
4.4 Metering facility at other location All major users of fresh water should be having water flow meter e.g. Dyeing, Washing, Boiler,
Administrative office block, toilet and wash lines etc. to have proper control of ETP operation and
chemical dosing.
It is also recommended to install the air flow meter at various locations to monitor air flow quantity to
respective units.

IRIS Fabrics Ltd. PaCT IN-depth CP Assessment Report
52
4.5 Segregation of effluent steam There is no segregation of effluent from various sections like softening plant, boiler blow down and
effluent generated from various wet process.
It is recommended to segregate the effluent with high contamination like dyeing process can be treated
biologically. Other less contaminated effluent can be treated with minimum chemicals and tertiary
treatments to reduce ETP chemical used.
4.6 Sewage generation &treatment facility There is no record of exact quantity of sewage generated. It is recommended to bring the waste water
from toilet flushing, canteen etc. at ETP and can be treated in the biological system. This will save the
addition of nutrient for biological system.
4.7 Chemicals dosing practices in ETP Various chemicals dosing in ETP along with quantity is summarized hereunder.
Table 36: Chemical Dosing in ETP
Chemicals Location Quantity (kg/day)
Acid Neutralization tank 225
De-foaming agent Oxidation tank 4.5
De-coloring agent Lamella Clarifier 100
Urea Oxidation tank Not used
DAP Oxidation tank Not used
Dewatering polyelectrolyte Sludge management Not used
Recommendations:
1. It is recommended to check day to day basis incoming effluent parameters like temperature, pH,
color, COD, BOD &DO etc to decide the required chemical dosage.
2. Dosing of Nutrient like DAP & Urea for healthy growth of microorganism.
4.8 Recovery of Salt and Reuse of water There is no salt recovery from effluent water at present. It is recommended to have a salt recovery at
source; it can reduce additional chemical consumption at ETP.
The treated effluent can be reused for certain applications like primary washing, car washing &
gardening purpose etc. It can reduce use of fresh water consumption and overall reduction of hydraulic
load on ETP.
4.9 Disposal of sludge and hazardous chemicals The ETP biological dewatered sludge is stored in storage area and disposed to nearby open land. It is
also recommended to maintain sludge generation record on day to day basis.
4.10 Critical findings and recommendations Table 37: ETP Findings
Equipment Findings Details
Bar Screen Observation Coarse type manual screen has been provided

IRIS Fabrics Ltd. PaCT IN-depth CP Assessment Report
53
Equipment Findings Details
before the lift sump & lots of floating materials are passing through bar racks.
Impact Larger particles not filtered out which creates problem in frequent choking of pumps.
Recommendations Adequate size SS fine manual bar to be installed.
Storage tank& neutralization tank
Observation a) Mixing is not proper. b) Out of two submersible mixers, one mixer is
under maintenance.
Impact Settlement of suspended solids and un-uniform quality of effluent to the downstream treatment process during maintenance period.
Recommendations Under maintenance mixer to be repaired & made operational.
Oxidation tank
Observation a) Air distribution& mixing not proper. b) DO meter installed near the entry point of
oxidation tank.
c) There is no Nutrient’s used for biological system.
Impact a) Affect the healthy growth of biomass.
Recommendations b) Working condition of air diffusers to be checked & if required new to be installed.
c) Location of the DO meter to be changed, preferably at the outlet point of oxidation tank.
d) Urea/DAP dosing system to be provided.
Sludge recirculation sump Observation Only One No. of sludge recirculation pump is provided.
Impact It can hamper the biological system due to inadequate biomass in the aeration tank if there is break down of pump.
Recommendations Standby sludge recirculation pumps to be provided.
Sludge Management
Observation Only one No. of sludge feed pump is provided.
Impact Can smoothen sludge management and handling.
Recommendations Additional standby sludge feed pump to be provided.
4.10.1 Issues discussed with client
All the operational issues of existing ETP , problematic areas, action to be taken at each stage,
importance of record keeping has been discussed in detailed with top management and supporting
staff of each section.
1. Importance of mechanical screen at the inlet point.
2. Importance of proper mixing instorage tank.
3. Importance of location of online DO monitoring system for aerobic system.

IRIS Fabrics Ltd. PaCT IN-depth CP Assessment Report
54
4. Importance & requirement of additional sludge recirculation pump for aerobic system.
5. Importance & Requirement of Nutrient dosing system for biological system.
4.11 Factory Specific baseline key indicators
Table 38: ETP effluent water characteristics
Parameters UOM Baseline Condition
Waste water parameters PH Temp Dissolved Oxygen Total Suspended Solids COD BOD
Deg C mg/L mg/L mg/L mg/L
9.0-10.3 35
2700-2930 NA
530-925 174-300
GHG reduction T/Y
Investment Facilitated M BDT/USD 1.6 (20,513)
Water & Energy Management System Not available
Production Process Mechanical Chemical dispersion
ETP functionality / Operation Can be improved with suggested measures
4.12 Summary of CP action with proposed investment (ETP section) Table 39: Summary of CP actions in ETP
Present Set-up
Observations during field Study &
measurements
Proposed Cleaner production action
Proposed Investment or Costing ( BDT)
Bar screen Manual type coarse screen at inlet.
Manual SS Fine bar screen to be provided.
250,000/-
Storage tank Submersible mixer under maintenance.
Repaired/ replacement. 750,000/-
Biological treatment
There is No nutrient used. Only one sludge recirculation pump is running. There is no standby pump.
Nutrient dosing system to be provided. Standby sludge recirculation pump to be provided.
100,000/-
300,000/-
Sludge Management
There is no standby pump.
Standby pumps to be provided. 200,000/-
Note: The above proposed investments are tentative and can be verified with PaCT TTBC.
List of venders:
1. Online pH & DO meter : Forbes Marshall/ E& H

IRIS Fabrics Ltd. PaCT IN-depth CP Assessment Report
55
2. Manual bar screen: Local
3. Metering pumps: Asia LMI/ prominent/ positive metering ( India)
4.13 Design details of ETP & Adequacy Table 40: Design Adequacy
Sr. No.
Unit/ Equipment’s Capacity/ specifications Adequacy for present load
1 Manual screen Manual coarse bar screen Not adequate
2 Lift sump 31.20 m3 Adequate
3 Raw effluent pumps 3.1 kW (2 Nos.) Adequate
4 Storage tank& Neutralization tank
1400 m3 Adequate
4 Mixers 5.9 kW (1No.), 2.5 KW (1No.)
Adequate
7 Neutralized effluent pump 3.1 KW (2 Nos.) Adequate
8 Distribution chamber Volume included in oxidation tank
-----------
8 Oxidation tank 3457 m3 Adequate
9 Air blower for oxidation tank 1090 m3/hr. ( 2w+1s) Adequate
10 Lamella clarifier 237 m3 Adequate
11 Sludge recirculation sump 33 m3 Adequate
12 Sludge recirculation pumps 3.1 kW (1 Nos.) Additional pump required.
13 Sludge thickener 78.6 m3 Adequate
14 Thickened sludge pump ------ m3/hr. (1 No.) Additional pump required.
15 Filter press 1000 x 1000 , 35 plates Adequate
16 Dewatering poly dosing system Tank Pump
2000 Lit 8.0 LPH,1 No.
Additional pump required.
17 Acid dosing system Tank Pump
3000 Lit. 1 No.
Additional pump required.
18 De-coloring dosing system Tank Pump
2000 Lit. 1 No.
Additional pump required.
19 Antifoam dosing system Tank Pump
1000 Lit. 1 No.
Additional pump required.
20 Instruments Electromagnetic flower meter PH meter DO meter
Adequate

IRIS Fabrics Ltd. PaCT IN-depth CP Assessment Report
56
5 Conclusions and Recommendations
The study has helped successfully identify these areas and cleaner production actions which when
implemented will help bring down
a. The total GHG reduction of the unit is estimated at 38.1%.
b. These measures have an estimated investment of 16.2 Million BDT and can yield a savings
of 14.2 Million BDT.
c. Energy cost reduction of 14.2 Million BDT, which is 25.1% of present energy bill.
d. Investment for metering is estimated at 0.4 Million BDT.
e. Water savings are about 4.3% of present consumption.
f. Natural gas saving is about 47.8% of present consumption.
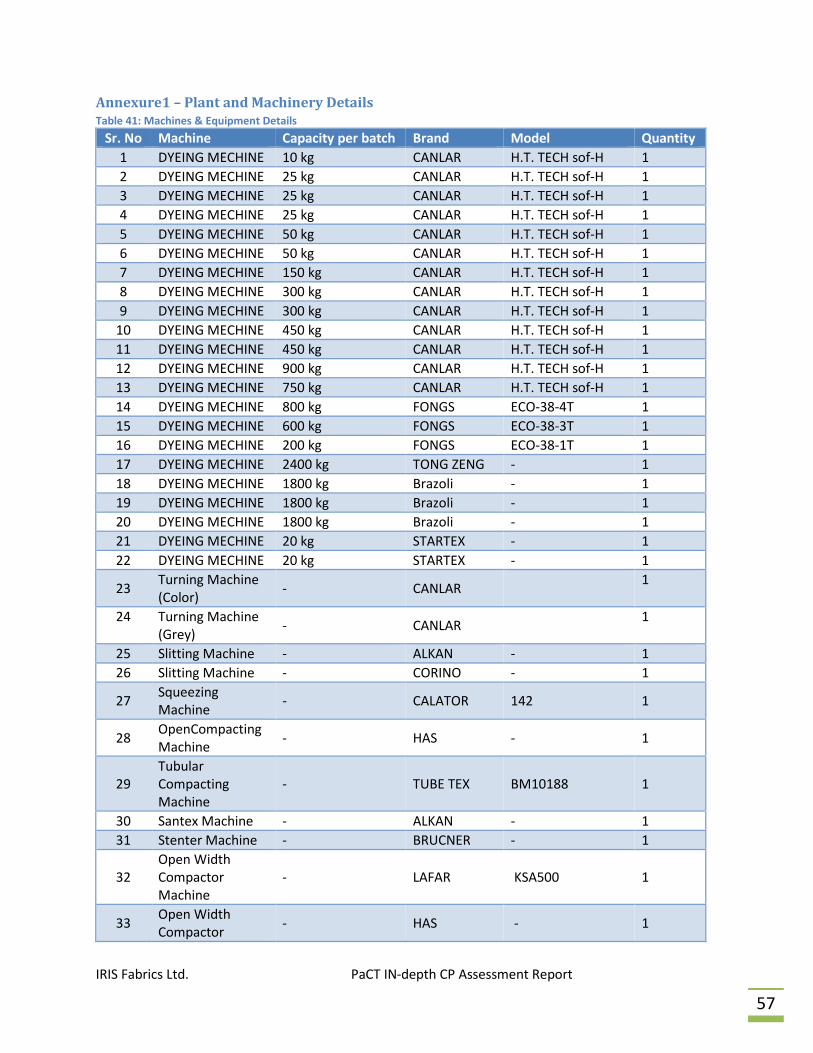
IRIS Fabrics Ltd. PaCT IN-depth CP Assessment Report
57
Annexure1 – Plant and Machinery Details Table 41: Machines & Equipment Details
Sr. No Machine Capacity per batch Brand Model Quantity
1 DYEING MECHINE 10 kg CANLAR H.T. TECH sof-H 1
2 DYEING MECHINE 25 kg CANLAR H.T. TECH sof-H 1
3 DYEING MECHINE 25 kg CANLAR H.T. TECH sof-H 1
4 DYEING MECHINE 25 kg CANLAR H.T. TECH sof-H 1
5 DYEING MECHINE 50 kg CANLAR H.T. TECH sof-H 1
6 DYEING MECHINE 50 kg CANLAR H.T. TECH sof-H 1
7 DYEING MECHINE 150 kg CANLAR H.T. TECH sof-H 1
8 DYEING MECHINE 300 kg CANLAR H.T. TECH sof-H 1
9 DYEING MECHINE 300 kg CANLAR H.T. TECH sof-H 1
10 DYEING MECHINE 450 kg CANLAR H.T. TECH sof-H 1
11 DYEING MECHINE 450 kg CANLAR H.T. TECH sof-H 1
12 DYEING MECHINE 900 kg CANLAR H.T. TECH sof-H 1
13 DYEING MECHINE 750 kg CANLAR H.T. TECH sof-H 1
14 DYEING MECHINE 800 kg FONGS ECO-38-4T 1
15 DYEING MECHINE 600 kg FONGS ECO-38-3T 1
16 DYEING MECHINE 200 kg FONGS ECO-38-1T 1
17 DYEING MECHINE 2400 kg TONG ZENG - 1
18 DYEING MECHINE 1800 kg Brazoli - 1
19 DYEING MECHINE 1800 kg Brazoli - 1
20 DYEING MECHINE 1800 kg Brazoli - 1
21 DYEING MECHINE 20 kg STARTEX - 1
22 DYEING MECHINE 20 kg STARTEX - 1
23 Turning Machine (Color)
- CANLAR 1
24 Turning Machine (Grey)
- CANLAR 1
25 Slitting Machine - ALKAN - 1
26 Slitting Machine - CORINO - 1
27 Squeezing Machine
- CALATOR 142 1
28 OpenCompacting Machine
- HAS - 1
29 Tubular Compacting Machine
- TUBE TEX BM10188 1
30 Santex Machine - ALKAN - 1
31 Stenter Machine - BRUCNER - 1
32 Open Width Compactor Machine
- LAFAR KSA500 1
33 Open Width Compactor
- HAS - 1

IRIS Fabrics Ltd. PaCT IN-depth CP Assessment Report
58
Sr. No Machine Capacity per batch Brand Model Quantity
Machine
34 Tumble Dryer - Gold Dragon - 1
35 Soft Setting Machine
- HSING CHENG
- 1
36 Sueding Machine - LAFAR CSM033-T 1
37 Boiler 10 TPH MECHMAR AS2400/150 1
38 Gas Generator 1030 kW CATERPILLAR - 2
39 Diesel Generator 220 kW VOLVO GSW275V 1
40 Gas Generator Pump
- SIGMA MEGA G 100-250 2
41 Compressor 50 kW BOGE S-40-2 3
42 Compressor 50 kW SANLION - 2
43 Compressor 50 kW PARISE - 1
44 Compressor 50 kW GARDNER DENVER
VS 55 1
45 Compressor 50 kW GARDNER DENVER
ESM 55 1
46 Submersible Pump
30 kW SIGMA - 2
47 Submersible Pump
4 kW ZAEDA - 2
48 Water Treatment Plant Pump
150 m3/hr SIGMA MEGA G 65-160 2
49 Booster Pump 7.5 kW SIGMA DPVF 65-30 6
50 Hot Water Pump - SIGMA MEGA CH 50-200 1
51 ETP Blower 37 kW ROBUSHI RBS 65/F-UNJ/A 3
52 Open Fabric Inspection Machine
- OSHIMA OST-150-100 2
53 Tubular Fabric Inspection Machine
- OZBILIM K1 2

IRIS Fabrics Ltd. PaCT IN-depth CP Assessment Report
59
Annexure2 – Process Flow Diagrams
Figure 11: Process flow diagram of 100% cotton (dark) fabric dyeing
Grey Fabric
Scouring & Bleaching
Peroxide Killing
Neutralization
Bio-Polishing
Dyeing
Neutralization
Soaping
Hot Wash
Fixing
Softening
Dyed Fabric

IRIS Fabrics Ltd. PaCT IN-depth CP Assessment Report
60
Annexure3 – Water Balance Diagrams
Figure 12: Water balance diagram of IFL

IRIS Fabrics Ltd. PaCT IN-depth CP Assessment Report
61
Annexure4 -Waste water data from ETP
Raw water, soft waterdata provided by IFL is summarized hereunder.
Table 42: Rawwater& soft water data
Month Unit Raw water Soft water
Jan’15 m3 59,583 48,911
Feb’15 m3 53,917 44,096
Mar’15 m3 59,803 48,809
Apr’15 m3 57,216 46,950
May’15 m3 59,097 48,704
Jun’15 m3 57,138 46,990
Jul’15 m3 53,789 43,976
Aug’15 m3 57,212 48,669
Sep’15 m3 57,492 47,168
Oct’15 m3 58,974 48,756
Nov’15 m3 57,730 47,068
Dec’15 m3 59,594 48,724
Total (year) m3 691,545 568,821
Annexure5 – ETP design details Table 43: ETP design details
Sr. No Particular Details Unit
1 Chemical used in the process H2SO4, Poly electrolyte, Urea, DAP,
Decolorant
2 Total Industrial water demand 2305 m3/day
3 Waste water generated from various section 1850 m3/day
3a Peak flow and duration - m3/day
3b Lean flow & duration - m3/day
3c Avg. flow 77 m3/hr
4 Domestic waste water 0 m3/day
5 Total waste water 1850 m3/day
6 Raw waste water characteristics
PH 10.29
Color -
Temperature - Deg.
Oil & Grease - mg/lit
Suspended solids - mg/lit
Dissolved solids 2700 mg/lit
COD 925 mg/lit
BOD 300 mg/lit
7 Treated waste water characteristics
PH 8.12
Color -

IRIS Fabrics Ltd. PaCT IN-depth CP Assessment Report
62
Sr. No Particular Details Unit
Temperature - Deg.
Suspended solids 22 mg/lit
Dissolved solids 1509 mg/lit
COD 22 mg/lit
BOD5 7 mg/lit
Effluent treatment plant capacity 1,600 m3/day
Sewage treatment No
8 Effluent Treatment scheme Adapted
8a Physical Separation
Screen ( Yes/No) Yes
Type Bar screen (Mechanical)
8b Equalization
Tank Capacity ( Size) - m3
Type of mixing Mechanical diffuser
Mixer 5.9+2.5 kW
Primary Treatment
Flash mixer ( Yes/No) Yes
Capacity/ Size(2000x2000x2000mm) - m3
Flocculation tank ( Yes/No) No
Capacity/ Size(3200x3200x3200mm) - m3
Primary Clarifier/ plan settling/tube settler/Lamella settler
Capacity - m3
Size -
8d Chemical used
H2SO4 240 kg/day
Decolorant 104 kg/day
Urea/DAP Not regularly
Poly Not regularly kg/day
Type of feeding ( Manual/ Pumping) Pumping
8e pH Correction facility ( yes/No) Yes
Capacity - m3
Chemical used 240 kg/day
Type of feeding ( Manual/ Pumping) Pumping
9 Biological Treatment (Yes/No.) Yes
9a Type of system
Conventional/ MBBR/ Other Bio-chemical
Feed pump Capacity - m3/hr
Size / Capacity m3
Performance of aeration system Diffused aeration
Blower capacity/Installed power 37 kW (3 units)
9b Secondary settling tank Yes
Clarifier/ plain settling/ tube settler Clarifier
Size -
Capacity - m3/hr

IRIS Fabrics Ltd. PaCT IN-depth CP Assessment Report
63
Sr. No Particular Details Unit
Recirculation Pumps - m3/hr
9c Chlorine contact tank (Yes/No) No
Capacity/Size - m3
9d sludge pit No
9e Sludge Thickener Yes
10 Tertiary system (Yes/No) No
Capacity - m3/hr
Units involved -
Capacity/size -
Utility point -
11 Sludge Management No
Type ( Sludge drying beds/Mech. De-watering system) -
Capacity/ size - m3/hr
Chemicals used for dewatering -
Chemical Consumption - kg/day
Annexure6 – Energy Consumption Details Table 44: Energy Consumption
Month NG Heat (m3) NG Power (m3) CNG Power (m3) Electrical Grid
(kWh)
Jan’15 283,040 128,476 7,699 217,565
Feb’15 232,036 100,999 6,152 146,545
Mar’15 260,681 116,227 13,127 207,760
Apr’15 276,652 131,031 21,262 100,700
May’15 281,280 133,445 27,225 212,530
Jun’15 284,186 102,636 34,278 125,875
Jul’15 312,358 148,364 26,378 106,530
Aug’15 237,531 112,132 37,468 155,025
Sep’15 233,137 103,535 31,460 95,135
Oct’15 246,217 131,099 36,858 144,425
Nov’15 306,292 157,688 48,448 100,700
Dec’15 276,639 139,528 30,705 153,170
Total (year) 3,230,050 1,505,160 321,060 1,765,960

IRIS Fabrics Ltd.
Annexure8 – Compressed air distribution schematic
PaCT IN-depth CP Assessment Report
Compressed air distribution schematic
Figure 13: Compressed air distribution schematic
64

IRIS Fabrics Ltd. PaCT IN-depth CP Assessment Report
65
Annexure9- Dyeing Bulk production recipe sheet

IRIS Fabrics Ltd. PaCT IN-depth CP Assessment Report
66

IRIS Fabrics Ltd. PaCT IN-depth CP Assessment Report
67

IRIS Fabrics Ltd. PaCT IN-depth CP Assessment Report
68
Annexure10 –Photographs for baseline condition

IRIS Fabrics Ltd. PaCT IN-depth CP Assessment Report
69


