
ARIZONA’S GUIDE TO ELECTRIC ENERGY CHOICES
BY
VALLEY FORWARD ASSOCIATION
February 2011

Page 2
Table of Contents
Welcome & Why This Guide……………………………………………………………….....page 3
Arizona Energy – Where does it come from?.............................................page 4
Renewable Energy – What is it?.................................................................page 6
Solar Energy……………………………………………………………………………………………page 8
Wind Energy…………………………………………………………………………….……………page 14
Geothermal Power………………………………………………………………….…………….page 15
Nuclear Energy…………………………………………………………………………………..…page 16
Renewable Energy Policies…………………..……………………………………………….page 21
Energy: Frequently Asked Questions…………………………………………………….page 26
References……………………………………………………………………………………………page 30 Valley Forward Membership List…………………………………………………………..page 32

~IVALLEY ...~ FORWARD
SINCE 1969
Valley Forward Association 3800 North Central Aven ue, Su ite 220 Phoenix, Arizona 85012 p: 602.240.2408 f: 602.240.2407 www.valleyforward_o rg
EXECUTIVE COMMmEE ChoIr of rhe Board Jay Hicks
ChllirEiecr HeIdi Short
Presidenl/Secrelilry Diane Brossart
Treasurer Ron Epperson
Vice Cha irs Wil liam Allison Laure l Kimball Dan lIueral Barba," Lockwood Jan Lorant
Stephen Anne rson Roger Baele Tamara Bednarik Mic heUo Do Biasi Joan Eisenl1auer Jeanne Forbis Bernie Fris! John Godee lain Hump Maria Hyatt Art Jordan Jenna Rowell Christopher Schmaltz Glenn Shearer Lo,i SlfIqleton
BOARD OF DIRECTORS Steve Barclay Dave Big os Mark Barushko
Dear Reader,
Energy is and will continue to be a hot topic around the world and right
here in Arizona as our state's economy shifts to renewable energy and
green technologies. Valley Forward Association created this guide to
provide you with objective, unbiased facts, background information and answers to frequently asked questions about alternative forms of energy.
Founded in 1969 1 Valley Forward is a business-based environmental public
interest organization and an historic advocate of civil discussion and policy
that considers all sides of an issue.
We hope our guide will help you better understand this highly complex
topic so you can make more informed decisions about our energy future .
Please also visit us online at valleyforward.org for additional resources, and
we further welcome you to contact us at (602) 240-2408 to talk with one of our technical experts.
Sincerely,
Cilns Brown Dan Cassano ~~y--JeHrey Chavez Tim Canne, Diane Brossart Susan Dn luddung PresidentGerald DaRosa Kathryn DeBoer Margaret Dunn julie Hamilton Paul HoskIn Craig Hughes John Kane Sherr Lauri tano Magall Lennox Jeff Linell Ca rohne Lobo Steve Lohide Mark McLaren Steven Olsoll Michael Park Enk Peterson Penny Pfaelzp. r Melissa Qui llard Emrly Rnnsone Russell Rea Stephen Rot Jathan Segur Brenda Shears Michole Shelor Sue Sylveste r Nick Taratsas Col,n Tetreault Crysta l Thompson Allan Yang Gary YaqwntQ Chris~ne ZiulonlUl

Page 4
Arizona’s Energy – Where does it come from? 1. What are the current sources of electrical power for Arizonans?
We use both renewable and nonrenewable energy sources to generate the electricity that we need for homes, businesses, schools and manufacturing. Energy Sources for the U.S. in 2009 are depicted in the chart below. Nonrenewable energy sources accounted for 92 percent of all energy used in the U.S. in 2009. Biomass, the largest renewable source, accounted for half of all renewable energy and 4 percent of total energy consumption.

Page 5
Arizona’s present power production includes larger percentages of nuclear and natural gas generation than the U.S. as a whole.
Arizona’s Power Production
Coal 35.5%
Gas 31.1%
Nuclear 27.4%
Hydro 5.8%
Renewable and Other 0.2%
Oil 0.1%
(Source: Energy Information Administration – EIA, June 2010) Arizona gets most of its energy from nonrenewable sources – oil, natural gas and coal. These fossil fuels were formed over millions of years by heat from the Earth's core and pressure from rock and soil on the remains (or "fossils") of dead plants and creatures. Another energy source is nuclear, where atoms are split (through a process called nuclear fission) to create heat and ultimately electricity.
(Source: http://www.eia.doe.gov/cneaf/solar.renewables/page/trends/table1.html)
2. How much does it cost to produce power from various sources of energy generation? Average Power Plant Operating Expenses for Major U.S. Investor‐Owned Electric Utilities, 2008
Total Cents per kWh Gas Turbine and Small Scale[1]
Fossil Steam 6.9933.567
Nuclear Hydroelectric[2]
2.1160.967
(1) Gas turbine, internal combustion, photovoltaic, and wind plants (2) Conventional hydro and pumped storage
(Source: http://www.eia.doe.gov/cneaf/electricity/epa/epat8p2.html)

Page 6
Renewable Energy
1. What exactly is renewable energy? Renewable energy sources include:
Solar energy from the sun, which can be turned into electricity and thermal energy (heat)
Wind power from turbine generators Geothermal energy from heat inside the earth Biomass from plants, which includes firewood from trees, ethanol from corn and
biodiesel from vegetable oil Hydropower from hydroturbines at a dam
2. Where does renewable energy come from? The Energy Information Administration lists renewable resources as biomass, hydropower, biofuel, wind, geothermal and solar. But most renewable energy resources relate directly or indirectly back to the sun. Sunlight can be used directly for lighting or heating and for solar energy from photovoltaic panels or solar thermal systems. The sun also is indirectly responsible for driving the wind and powering wind turbines. The sun evaporates water that becomes rain or snow leading to hydropower and is key to growing plants that can be used for biomass energy. (Source: U.S. Energy Information Administration, Annual Energy Review 2009)

Page 7
3. What forms of renewable energy make sense for Arizona? According to the Energy Information Administration, Arizona’s best potential is in capturing solar, wind, geothermal and fuelwood (biomass) energies.
Arizona’s Energy Resources:
(Source: http://tonto.eia.doe.gov/state/state_energy_profiles.cfm?sid=AZ)

Page 8
Solar Energy 1. What are the differences between Photovoltaic (PV), Concentrated Photovoltaic
(CPV), Concentrated Solar Power (CSP) and Solar Thermal technologies? Photovoltaic (PV) converts sunlight to electricity. Commonly known as solar cells, individual PV cells are electricity‐producing devices made of semiconductor materials. PV cells come in many sizes and shapes, from smaller than a postage stamp to several inches across. They are often connected to form PV modules that may be up to several feet long and a few feet wide.
When light shines on a PV cell, it may be reflected, absorbed or pass right through. Only the absorbed light generates electricity. The energy of the absorbed light is transferred to electrons in the atoms of the PV cell semiconductor material. With their newfound energy, these electrons escape from their normal positions in the atoms and become part of the electrical flow, or current, in an electrical circuit. Some PV cells are designed to operate with concentrated sunlight and are referred to as concentrated photovoltaic (CPV). CPV cells are built into a collector that uses a lens to focus sunlight onto the cells. Some concentrating collectors are designed to be mounted on tracking devices.
Concentrated solar power (CSP) technologies use mirrors to reflect and concentrate sunlight onto receivers that collect solar energy and convert it to heat. This thermal energy can then be used to produce electricity from a steam turbine or heat engine that drives a generator. Smaller CSP systems can be located directly where power is needed. As stated previously, a CSP system reflects the sun's rays onto a receiver to create heat used to generate electricity. If the receiver contains oil or molten salt as the heat‐transfer medium, then the thermal energy can be stored for later use.
Solar thermal energy is also used to provide hot water for a home or building. Solar water heating systems include storage tanks and solar collectors. Solar water heaters use the sun to heat either water or a heat‐transfer fluid in the collector. Most solar water heaters require a well‐insulated storage tank. The tank can be a modified standard water heater, but it is usually larger and very well insulated. Solar storage tanks have an additional outlet and inlet connected to and from the solar collector.

Page 9
Solar Water Heaters
(Source: USA Department of Energy Definitions, 2010)
2. With 320 days of sunshine per year, why isn’t Arizona the “Solar Capital” of the World? Compared to most of the world, Arizona now has inexpensive electricity. (Source: International Energy Agency). During 2008, the average retail price of electricity in Arizona was 9.11 cents/kilowatt hour (kWh) compared to a national average of 9.74 cents/kWh. Within the continental U.S., the retail price of electricity ranged from a low of 5.67 cents/kWh in Wyoming to a high of 17.79 cents/kWh in Connecticut.
(Source: http://www.eia.doe.gov/cneaf/electricity/st_profiles/e_profiles_sum.html)
In order for the solar industry to make sense, installed solar system costs will need to drop from $4–$6 per watt to $3 per watt or less. This would continue the trend of falling solar electricity costs over the last 25 years. A push to $3 per watt would bring solar energy costs from the current range of 13 to 16 cents per kWh to around 10 cents per kWh, which would allow it to compete more strongly with other renewables and capture a significant share of the electricity market. (Source: 2010 Solar Power Authority) 2010 Solar Power Authority Through economic incentives and financing options, Arizona has the potential to become a significant source of solar power generation and manufacturing, and services related to the research, development and manufacturing of solar technology. For current information related to the availability of residential and commercial solar incentives, Arizona Corporation Commission workshops and other related events on renewable energy, and each utility's progress toward meeting the RES’ Distributed Energy Requirement, visit the Arizona Goes Solar site at arizonagoessolar.org.

Page 10
3. Why aren’t solar rooftops – solar systems on houses – more affordable in Arizona? Since the installed cost of residential solar panels presently runs between $4.50 to $6 per watt, a five‐kW system (the average size installed by most residents) costs $25,000‐$30,000. Many utilities are offering incentives, with some subsidizing as much as 50 percent of the cost of the system in exchange for the Renewable Energy Standard (RES) credit. Even so, a system that generates an average of $73 of electricity per month would take a long time to pay for itself even after incentives. For example, a system that cost $13,000 would have a simple payback period of approximately 15 years.
4. Why don’t the utilities just build more solar plants in Arizona?
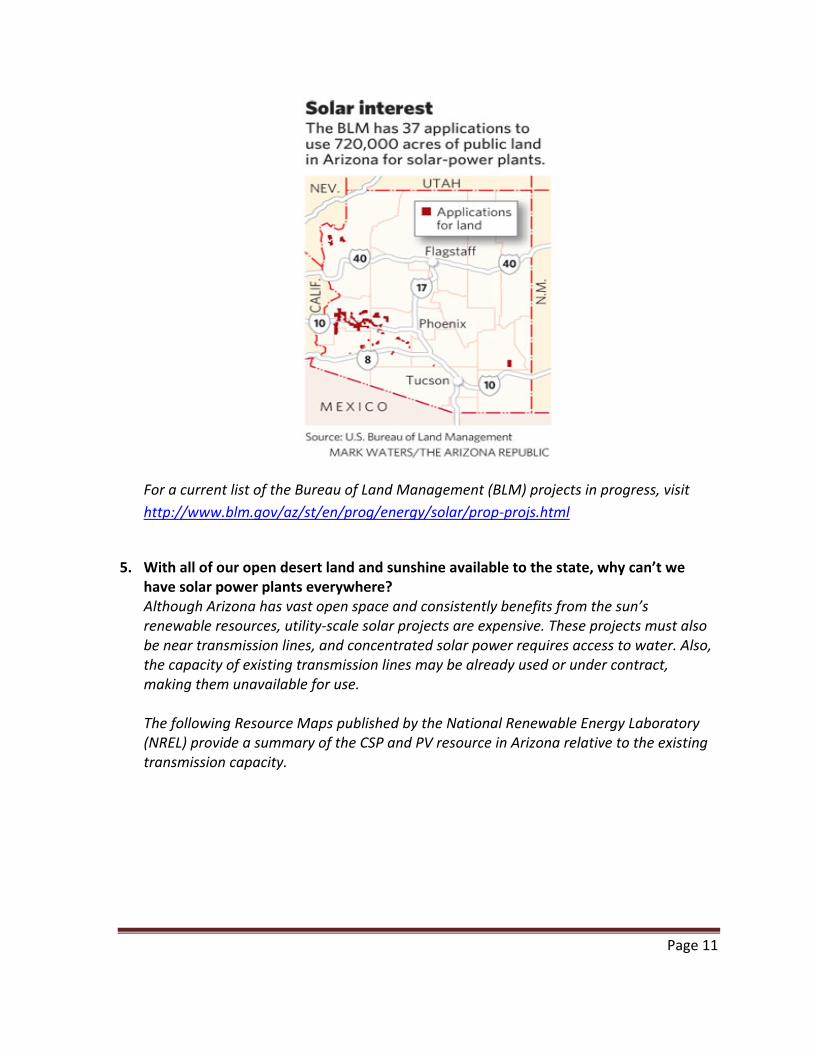
Arizona has accomplished a lot in both attracting solar manufacturers as well as solar installations with more being planned. Thousands of rooftop systems have been installed and several multi‐megawatt (MW) plants are in development/construction to be completed in 2011. For an interactive ranking of states by the cost, count and capacity of their photovoltaic installs, visit http://openpv.nrel.gov/rankings. Utility‐scale solar projects require a significant up‐front investment ranging from $50 million for smaller projects to well over a billion dollars for larger projects. First, there are the costs to build the solar facilities, and second there are costs associated with changing and improving the utility infrastructure to incorporate those solar facilities. The cost per kWh is currently higher than other types of available energy sources. Additionally, solar energy is a variable and intermittent resource which requires the use of traditional generation to balance the system needs. This integration adds additional costs for the customer. Solar needs to be a balanced part of a utility’s energy portfolio that considers overall resource allocation, available capital and rate constraints. Currently, Arizona and California are competing to become the leaders in solar generation in the U.S. More than 40 solar projects have been proposed for Arizona on both private and public lands and, if built, would cover more than 725,000 acres and provide up to 2.5 GigaWatts of “generating capacity.”
Page 11
For a current list of the Bureau of Land Management (BLM) projects in progress, visit
http://www.blm.gov/az/st/en/prog/energy/solar/prop‐projs.html
5. With all of our open desert land and sunshine available to the state, why can’t we
have solar power plants everywhere? Although Arizona has vast open space and consistently benefits from the sun’s renewable resources, utility‐scale solar projects are expensive. These projects must also be near transmission lines, and concentrated solar power requires access to water. Also, the capacity of existing transmission lines may be already used or under contract, making them unavailable for use. The following Resource Maps published by the National Renewable Energy Laboratory (NREL) provide a summary of the CSP and PV resource in Arizona relative to the existing transmission capacity.

Page 12
(Sources: http://www.azsolarcenter.org/images/articles/az/AZCSP.gif and
http://www.azsolarcenter.org/images/articles/az/AZPV.gif)
The capacity factor is a major consideration in a utility’s power resource mix. For example, Palo Verde Nuclear Generating Station is capable of producing 3.9 GW and operated with an average capacity by a factor of 85 percent, whereas solar would operate at a capacity factor of 17 to 21 percent.
6. Why are other states building more solar plants than Arizona?
Other states have higher renewable energy requirements and offer more incentives. Also, Arizona has a relatively low cost of energy whereas other states have higher costs of energy and they recover the cost of solar within their higher rates. (Source: http://www.eia.doe.gov/cneaf/electricity/epm/table5_6_b.html)
7. What does water have to do with solar power plants?
PV systems do not require water for the power generation cycle. But in a CSP, solar energy is used to create heat required to create steam that is used to spin a turbine connected to an electric generator. Water is used for steam and in the cooling cycles to condense the steam.

Page 13
8. Will there ever be a time when solar energy will not need a subsidy to be competitive? When the cost of converting sunlight to electric energy intersects with the cost of conventional sources, solar subsidies may become unnecessary. In fact, solar energy gets more cost effective every day and methods of financing solar installations are becoming more numerous through leases, low interest loans and utility incentives. These industry innovations are increasingly accelerating the adoption of solar.
Page 14
Wind Energy 1. Is wind power a viable renewable energy option for Arizona?
Wind power is emerging in Arizona as a viable, stable‐priced and local renewable electricity source. The Dry Lake Wind Project, near Snowflake, is the first utility‐scale project to be built in Arizona. The 63 MW project went on‐line in August 2010, sending power to the electric grid. The 99 MW Perrin Ranch Wind Farm, northwest of Williams is under development and several other projects are in various stages of development, from wind resource monitoring, to capital investment exploration, to permitting and environmental monitoring. Several challenges exist. Arizona has fewer good wind locations compared to other states, like California and New Mexico, and Arizona’s inexpensive coal power makes wind energy less competitive. Developers have to meet different rules in local, state and national guidelines regarding permitting, zoning and pre‐construction environmental assessment for wind systems. Arizona’s checkerboard land ownership can be complicated and the fact that tribal lands are prime wind resource areas poses additional regulatory and connectivity challenges. (Source: Arizona Wind Development Status Report 2009, NREL and Arizona Wind Working Group)
2. Why don’t we build more wind farms in Arizona? While interest in Arizona’s wind resource continues to grow there are several factors that impact development potential of wind power from land jurisdiction, permitting and transmission access to project financing and energy storage issues. From 2010 through 2012, national forecasts show annual wind capacity additions that exceed the total additions in 2008, with cumulative wind additions from 2009 through 2012 predicted to exceed 35,000 MW (nationally). There is opportunity for Arizona to capture some level of this wind power expansion if efforts are directed in a strategic, coordinated manner between the public and private sectors.

Page 15
Geothermal Energy 1. What is geothermal energy and how does it compare to other renewable energy
options? Geothermal energy is thermal energy stored in the earth.
Geothermal power is cost effective and environmentally friendly, but has historically been limited to areas near tectonic plate boundaries. Recent technological advances have dramatically expanded the range and size of viable resources, especially for applications such as home heating. Geothermal wells release greenhouse gases trapped deep within the earth, but these emissions are much lower per energy unit than those of fossil fuels.
Low temperature geothermal is defined as direct use heat obtained from the geothermal fluid in the ground at temperatures of 300°F (150° C) or less. These resources are typically used in applications, such as district heating, greenhouses, fisheries and mineral recovery. Enhanced geothermal systems are engineered reservoirs created to produce energy from geothermal resources that otherwise are not feasible due to lack of water and/or permeability. The technology is currently in research and development stages, with a projected technology readiness by 2015.
Geothermal heat pumps (GHP) use shallow ground energy to heat and cool buildings. The GHP market still faces significant challenges including high installation and capital costs, lack of consumer awareness and insufficient market delivery infrastructure. In order for heat pumps to reach their full market potential, these barriers must be addressed.
2. Is geothermal energy a viable option for Arizona? Three locations in Arizona are well known: Buckhorn Baths in Apache Junction, Castle Hot Springs in the Bradshaw Mountains and Childs on the Verde River. The water temperature at these springs ranges from 158° to 180°F. There are two higher temperature springs in the state – Clifton and Gillard, both in the Clifton‐Morenci area of southeastern Arizona. Although their temperatures may exceed 284°F, these two sites are suitable for only low grade steam. They are in highly‐developed agricultural areas and the water from these springs is more valued for irrigation of field crops, municipal water and industrial uses than for their heat. (Source: http://geothermal.nau.edu/)
Page 16
Nuclear Energy
1. How important is nuclear power to the United States? Nuclear, clean fossil fuel and renewables all likely have a place in the future generation mix. Because renewables like wind and solar are intermittent resources, they cannot meet the 24‐hour baseload demand of the utility grid system. Nuclear power fills that role. Nuclear power provided 20 percent of the electric energy within the U.S. during 2009. Dr. Steven Chu, Secretary of Energy has said, “Nuclear power…is going to be an important part of our energy mix. It is 20 percent of our electric generation today, but it is 70 percent of the carbon‐free portion of electricity. And it is baseload. So I think it is very important that we push ahead.”
2. How is a nuclear reactor used to produce electricity? In a nuclear power plant, the controlled fission of nuclear fuel produces vast amounts of heat, which is used to produce steam. The steam is used to spin turbines which are connected to an electric generator.
3. How did nuclear electric power come to be in the United States? Construction of the first reactor was lead by Enrico Fermi at a University of Chicago squash court. The first reaction took place on December 2, 1942. It demonstrated that uranium could produce a self‐sustaining fission chain reaction.
U.S. Navy Admiral Hyman Rickover understood that since combustion is not present in a nuclear reactor, a reactor would not consume air on a submarine and that with a long fuel cycle, nuclear submarines could remain submerged for an extended duration. The first nuclear powered submarine, the Nautilus, was launched in 1954.
Evolving the design used by the Navy, ground was broken for the Shippingport commercial nuclear generating station in Pennsylvania in 1954, and electricity from the plant was first delivered to the grid in 1958. There are currently 104 operating electric power reactors in the U.S. The oldest operating unit is Oyster Creek located in New Jersey, which was issued its operating license in April 1969. The newest unit is the Watts Bar 1 facility in Tennessee, which was licensed to operate in November 1995 (Source: DOE EIA). Palo Verde Nuclear Generating Station near Phoenix (in Wintersburg, Arizona) has the largest installed nuclear capacity in the country. (Source: http://www.nei.org/resourcesandstats/graphicsandcharts/licenseinformation/)

Page 17
4. What role does nuclear power play in Arizona? Nuclear energy produces 27.4 percent of electrical power generated in Arizona.
Nuclear Power in AZ (2009) 2007‐2009
Capacity (MW) Generation (MWh)
3‐year Average Capacity Factor
(%)
Palo Verde 1 Phoenix 1,311 11,589,724 88.1
Palo Verde 2 Phoenix 1,314 9,509,521 84.1
Palo Verde 3 Phoenix 1,317 9,562,606 81.4
Total 3,942 30,661,851 84.5
(Source: U.S. EIA, 2009)
5. If no new nuclear units are being built, has the amount of nuclear energy generated remained flat? The absolute energy produced by nuclear plants has increased, but the percentage of the country’s energy needs that is being met by nuclear has declined since no new plants have come online since 1996. The majority of the increase in electric load has been met with new gas‐fired generation. In 1996, the year the last domestic nuclear generator came on line, the industry produced 675 million MW hours of electric energy. In 2009, the industry generated 799 million MW hours of nuclear electric energy. The significant increase in the amount of energy produced by existing nuclear plants has been achieved by: 1) increasing the capacity of existing units; 2) leveraging improvements in knowledge and capabilities to shorten the outage times for refueling; and 3) decreasing the amount of time units are off line due to unscheduled outages.
Furthermore, operating performance of the units has been improved, which increased their average capacity factor from 76.2 percent in 1996 to 90.5 percent in 2009 (Source: Nuclear Energy Institute, NEI).
6. Would new nuclear power be economical?
Nuclear power plants have a long construction period and high capital costs, but because of low fuel cost nuclear facilities have low production cost:
Electricity Production Cost by Fuel Type (2009) Nuclear: 2.03 cents per kWh Coal: 2.97 cents per kWh Natural gas: 5.00 cents per kWh Oil: 12.37 cents per kWh
(Source: http://www.nei.org/keyissues/reliableandaffordableenergy/economicgrowth/)

Page 18
Coal plants are high emitters of CO2. Regulators and environmental groups are reticent to authorize new coal facilities, which will operate many decades in the future, without proven technology for sequestering CO2. Especially if new coal is not considered, the wide margin in production costs supports the consideration of new nuclear.
7. Don’t nuclear plants use a lot of water and are there environmental benefits to nuclear power? All steam electric units, whether fueled by coal, natural gas, oil or uranium, need to reject heat. The heat removal generally involves the use of water. Technology exists to reduce or eliminate water demands; however, these add to plant capital cost and decrease plant output and efficiency. Any new facility would need to evaluate options for the reduction of water consumption. Nuclear units do not combust fossil fuel. As a result, nuclear units do not emit the greenhouse gases and combustion product pollutants associated with fossil fueled facilities. In 2009, nuclear provided 27.4 percent of the power generated within Arizona. The other sources without air emissions are hydro at 5.8 percent and renewable energy at 0.2 percent. As a result, nuclear provided 82 percent of the power without air emissions within the state during 2009.
8. Palo Verde in Arizona was the last power plant built in the U.S. – is it still viable? Can it be expanded? Unit NRC License Date License Expiration MW Rating Palo Verde 1 12/31/1984 12/31/2024 1,311Palo Verde 2 12/9/1985 12/9/2025 1,314Palo Verde 3 3/25/1987 3/25/2027 1,317
(Source: NEI) The U.S. has several nuclear facilities that are newer than Palo Verde. The oldest unit at Palo Verde is licensed to operate through the year 2024 and the NRC could extend the license for an additional 20 years, so it is likely that Palo Verde will continue to contribute to Arizona’s electric needs for many years in the future. Studies would be needed to determine the optimum location of a new nuclear facility within Arizona; however, some nominal uprate of the Palo Verde facility may be possible and justifiable. http://www.nei.org/resourcesandstats/documentlibrary/reliableandaffordableenergy/factsheet/statefactsarizona

Page 19
9. What is involved in acquiring more nuclear power, including building another nuclear plant in Arizona? As long as electric demand grows, additional baseload generation will need to be constructed to satisfy that demand. Fossil facilities emit greenhouse gases and other gaseous byproducts. New facilities can be constructed locally, or at a distance from large load centers (the Phoenix metropolitan area is considered such a center). High voltage electric transmission is capable of moving electric power great distances, but ultimately generation must be available somewhere to satisfy the demand. California’s repeated power issues are the result of inadequate local generation coupled with inadequate electric transmission. Construction of any nuclear generating facility brings with it the economic benefits of jobs, first for the construction and later for the operation of the facility, and additional tax revenues. Palo Verde is the largest single commercial taxpayer in Arizona. (Source: APS website). It also brings with it the challenges associated with siting of generating plants, regardless of the fuel used. New nuclear has the added complexity of satisfying the requirements of the Nuclear Regulatory Commission. It is likely that a new project would have multiple owners located in several states (similar to Palo Verde with ownership: Arizona Public Service 29.1 percent; Salt River Project 17.5 percent; Southern California Edison 15.8 percent; El Paso Electric 15.8 percent; Public Service New Mexico 10.2 percent; Southern California Public Power Authority 5.9 percent; Los Angeles Department of Water and Power 5.7 percent) (Source: Public Service New Mexico ‐ PNM). This approach does, however, add the complexity of involving multiple utility commissions in multiple jurisdictions.
10. What happens to spent nuclear fuel?
Used nuclear fuel will remain stored at nuclear power plants in the near term. Eventually, the government may recycle it to reduce volume and place the unusable end product in a deep geologic repository (Source: NEI). The Secretary of Energy is establishing a Blue Ribbon Commission to conduct a comprehensive review of policies for managing the back end of the nuclear fuel cycle, including all alternatives for the storage, processing and disposal of civilian and defense used nuclear fuel, high‐level waste, and materials derived from nuclear activities. Since 1983, the industry has paid one tenth of a cent per kWh generated to the nuclear waste fund. This has amounted to $35 billion, of which $10.8 billion has been spent. These payments are included in fuel costs (Source: NEI).

Page 20
11. Why aren’t spent fuel rods being recycled? Current U.S. policy doesn’t allow it.
The principal reasons for reprocessing used fuel is to recover unused uranium and plutonium in the used fuel elements and reduce the volume of material to be disposed of as high‐level waste to about one fifth. The level of radioactivity in the waste from reprocessing is much smaller and after about 100 years falls much more rapidly than in used fuel itself.
France and several other European countries, Russia and Japan have had a policy to reprocess used nuclear fuel, although government policies in many other countries have not yet addressed the various aspects of reprocessing.
(Source: http://www.worldnuclear.org/info/inf69.html)

Page 21
Renewable Energy Policy 1. Who regulates renewable energy in Arizona?
Article 15 of the Arizona Constitution establishes the Arizona Corporation Commission (ACC), which believes that it has responsibility for renewable energy policy in Arizona for the utilities it regulates, including APS and TEP. Only seven states have constitutionally formed Commissions. Arizona is one of only 13 states with elected Commissioners. In the 37 other states, Commissioners are appointed by either the governor or the legislature. The Arizona Corporation Commission has jurisdiction over the quality of service and rates charged by public service utilities. By state law, public service utilities are regulated monopolies given the opportunity to earn a fair and reasonable return on their investments. What is fair and reasonable in any particular case has been and always will be open to debate in rate hearings before the Commission. Generally, the Commission tries to balance the customers' interest in affordable and reliable utility service with the utility's interest in earning a fair profit. (Source: http://www.azcc.gov/Divisions/Administration/about.asp)
The Salt River Project (SRP), Arizona’s second largest electric utility, is an Agricultural Improvement and Power District organized in 1937 under Arizona state law. SRP is a political subdivision of the state and, pursuant to the Arizona Constitution, it is vested with all the benefits and immunities of a municipality. Ultimately, SRP is regulated by the Arizona Legislature. The Constitution prohibits the Arizona Corporation Commission from regulating municipalities or municipal utilities, as they are governed by other publicly elected officials. SRP is governed by an elected board which establishes SRP’s rates, rules and regulations, including its renewable energy standards. However, SRP must apply to the ACC to issue revenue bonds, build a power plant generating more than 100 MW or construct power lines of 115 kilovolts or greater.
(Source: http://www.azcc.gov/divisions/utilities/electric/srp.asp)
There are conflicting opinions as to the ACC’s constitutional authority to establish Renewable Energy Standards and as a result, the courts have and will continue to clarify the intent of the constitution and legislation.
2. What is Arizona’s Renewable Energy Portfolio Standard (RES)? On February 27, 2006, the Arizona Corporation Commission introduced new renewable energy standards requiring regulated electric utilities to generate 15 percent of their energy from renewable resources by 2025.

Page 22
Sources of energy that count toward the standard include electricity produced from qualifying biogas, hydropower, fuel cells that use only renewable fuels, geothermal, hybrid wind and solar, landfill gas, solar and wind. (Sources: http://www.pewclimate.org/what_s_being_done/in_the_states/rps.cfm http://www.azcc.gov/divisions/utilities/electric/res.pdf)
3. What are the RES standards for the other states?
State Target (% of electricity sales) Specific Provisions
(% of electric sales)
AZ 15% by 2025 4.5% by 2012 from distributed
energy resources
CA 20% by 2010
CO IOUs 20% by 2020; electric
cooperatives and municipal
utilities 10% by 2020
IOUs: 0.4% solar by 2020
CT 27% by 2020 4% Energy Efficiency and CHP by
2010
DC 20% by 2020 0.4% solar by 2022
DE 20% by 2019 2.005% solar by 2019
HI 20% by 2020
IA 105 MW by 2025
IL 25% by 2025 18.75% wind by 2013
MA Class I: 4% by 2009 (+1%/year
after); Class II: 3.6% renewable,
3.5% waste energy by 2009; APS:
5% by 2020 increasing by 0.25%
each year after.
Class II: 3.6% renewable, 3.5%
waste energy by 2009

Page 23
State Target (% of electricity sales) Specific Provisions
(% of electric sales)
MD 20% by 2022 2% solar by 2022
ME 30% by 2000; 10% new by 2017
MI 10% by 2015
MN Xcel Energy (utility) 30% by 2020;
other utilities 25% by 2025
Xcel Energy: 25% wind
MO 15% by 2021 0.3% solar retail sales by 2021
MT 15% by 2015
ND* 10% by 2015
NH 23.8% by 2025 ‐ 16.3% new 0.3% solar by 2025
NJ 22.5% by 2021 2.12% from solar by 2021
NM IOUs: 20% by 2020; rural electric
cooperatives 10% by 2020
Wind: 4%; solar: 4%; biomass and
geothermal: 2%; distributed
renewables: 3% by 2020 (IOU
only)
NV 20% by 2015 1% solar by 2015
NY 24% by 2013 0.154% customer‐sited by 2013
OH 25% by 2025 (12.5% renewable
energy)
1% solar by 2025
OR Large utilities (>3% state’s total
electricity sales) 25% by 2025
Smaller utilities 5‐10% by 2025
(depending on size)
PA 18% by May 31, 2021 (8%
renewable energy)
0.5% solar by 2025
RI 16% by 2020
SD* 10% by 2015

Page 24
State Target (% of electricity sales) Specific Provisions
(% of electric sales)
TX 5,880 MW by 2015 At least 500 MW from renewables
other than wind
UT* 20% by 2025
VA* 12% of 2007 sales by 2022
VT* 20% by 2017; Total incremental
energy growth between 2005‐
2012 to be met with new
renewables (10% cap)
WA 15% by 2020
WI 10% by December 31, 2015
* States with RPS goals not mandatory requirements.
(Source: Database of State Incentives for Renewable Energy (DSIRE), accessed March
2009, www.dsireusa.org)
4. What are the pros and cons of a higher RES standard for Arizona? Renewable energy costs are currently higher than traditional energy sources, which is why a RES is needed to assure their construction. However, concern exists that the RES will not produce reasonable rates. For example, solar energy is Arizona’s greatest renewable energy asset. Today, rooftop and central station solar technologies are costly. University studies have concluded that electric prices would increase substantially if renewable cost reductions do not exceed the pace of those that have historically occurred.
(Source: http://www.azcc.gov/divisions/utilities/electric/res.pdf) 5. How does public policy in Arizona support growth of the Renewable Energy Industry?
In 2001, Arizona was one of the first states to require utilities to produce a certain amount of power from renewable resources by requiring 1.1 percent of electricity to come from solar energy. In 2006, that standard was raised to 15 percent and expanded to all renewable energy sources. In addition, the new requirement mandates that by 2025, 30 percent of renewable energy must be from distributed generation, which is installed at or near the point of consumption.

Page 25
The state’s utilities are meeting these requirements through the construction of renewable energy plants, rebates towards customer installation of distributed renewable energy systems, and other means. As a result, hundreds of megawatts of renewable energy have been installed in Arizona including thousands of rooftop solar installations on homes and businesses. State law supports renewable energy primarily through the creation of tax credits for production of solar, wind, and other renewable energies (A.R.S. §43‐1085 et al); tax credits that support the establishment of renewable energy manufacturing in the state (A.R.S. § 41‐1511; property tax exemptions on certain renewable energy systems (A.R.S. §42‐11054); and sales tax exemptions for the sale and installation of solar energy devices by contractors (A.R.S. § 42‐5061). SB 1403, signed in July of 2009, created tax incentives intended to draw renewable energy product manufacturers to Arizona. Income tax credits and property tax incentives are available for companies choosing to establish or expand their manufacturing facilities and corporate headquarters in Arizona. To be eligible, the business must meet certain minimum requirements for the quantity and quality of new jobs created. (Sources:http://www.azcc.gov/divisions/utilities/electric/environmental.asp http://www.azcommerce.com/BusAsst/Incentive http://www.dsireusa.org/incentives/index.cfm?CurrentPageID=1&State=AZ&RE=1&EE=1 http://www.dsireusa.org/incentives/incentive.cfm?Incentive_Code=AZ41F&re=1&ee=1)
6. Are there any breakthroughs in technology on the horizon that will make renewable
energy more affordable? Renewable technologies have been available and evolving for many decades. Numerous companies, including large multi‐national conglomerates are making investments. All of these companies desire greater profits and as a result are constantly evaluating their equipment offerings and attempting to make them more cost efficient and thus more competitive. They have great incentive to push technology. By comparison, consider the rapid deployment and adoption of the cell phone industry.
Page 26
Energy: Frequently Asked Questions 1. What is baseload generation and peaking generation?
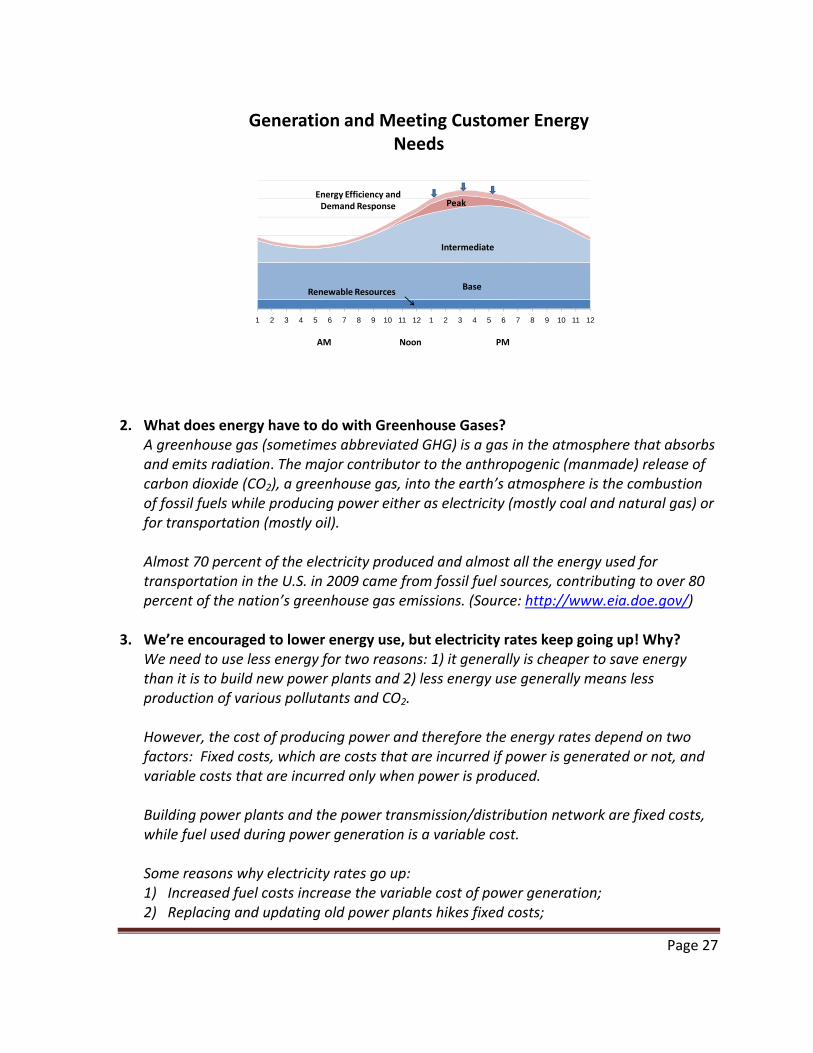
Regional power demand varies seasonally and with the time of the day. In Arizona, daily power demand is typically highest during certain daylight hours and lowest late at night. The “baseload” is the relatively constant amount of power that needs to be available to meet the lowest demand of the day, while peaking power is produced to meet the higher demand, during increased energy demand hours. Electrical power cannot be effectively stored and must be generated when needed. To meet these needs, baseload generation plants run continuously during the day, while peaking generation units are operated at various loads or only during certain hours to meet additional demand over and above the baseload. Some types of power plants like nuclear take a long time to start and stop and are not suited to be turned on and off frequently. These plants are best suited to generate baseload power. Natural gas is often the fuel for intermediate and peaking generation because plants can go online rapidly to produce different amounts of power during different times of the day. Solar energy plants with concentrated solar thermal plants and energy storage can serve as “intermediate” power plants. In Arizona, they happen to generate the most power during peak demand hours. But the timing of their power output depends mostly on environmental factors like cloud cover and time of day, and solar panels can’t always be turned on when they’re needed most. Wind power, like solar, is considered “intermittent” because its output varies greatly, depending, of course, on the wind. The economic balance between the initial capital cost of the plant and ongoing operating costs plays a key role in the choice of what is constructed for baseload and peaking facilities.
Page 27
1 2 3 4 5 6 7 8 9 10 11 12 1 2 3 4 5 6 7 8 9 10 11 12
Generation and Meeting Customer Energy Needs
NoonAM PM
Energy Efficiency and Demand Response Peak
Intermediate
BaseRenewable Resources
2. What does energy have to do with Greenhouse Gases?
A greenhouse gas (sometimes abbreviated GHG) is a gas in the atmosphere that absorbs and emits radiation. The major contributor to the anthropogenic (manmade) release of carbon dioxide (CO2), a greenhouse gas, into the earth’s atmosphere is the combustion of fossil fuels while producing power either as electricity (mostly coal and natural gas) or for transportation (mostly oil). Almost 70 percent of the electricity produced and almost all the energy used for transportation in the U.S. in 2009 came from fossil fuel sources, contributing to over 80 percent of the nation’s greenhouse gas emissions. (Source: http://www.eia.doe.gov/)
3. We’re encouraged to lower energy use, but electricity rates keep going up! Why?
We need to use less energy for two reasons: 1) it generally is cheaper to save energy than it is to build new power plants and 2) less energy use generally means less production of various pollutants and CO2. However, the cost of producing power and therefore the energy rates depend on two factors: Fixed costs, which are costs that are incurred if power is generated or not, and variable costs that are incurred only when power is produced. Building power plants and the power transmission/distribution network are fixed costs, while fuel used during power generation is a variable cost. Some reasons why electricity rates go up: 1) Increased fuel costs increase the variable cost of power generation; 2) Replacing and updating old power plants hikes fixed costs;

Page 28
3) As we use less energy, the fixed costs per energy unit generated increases because the same amount of expense now must be paid for with less use; and
4) Societal programs such as incentives to install photovoltaic panels or energy efficiency measures and that cost is added to the electricity rate.
4. What is distributed energy and utility‐scale?
Distributed energy is generated at smaller facilities and is typically designed to produce energy near the end users, often on the customer’s site. Distributed energy systems typically range from three kW to over two MW. A rooftop solar generator is a distributed energy system. Utility‐scale electrical facilities generate large amounts of electricity (typically five MW or more) and transmit the electricity from one location to multiple users.
5. What is a Smart Grid? The Smart Grid includes advanced, smarter electrical meters (AMI), demand response, grid optimization, distributed generation, energy storage, Electric Vehicles and Plug‐in Hybrid Electric Vehicles (including smart charging and Vehicle to Grid), advanced utility control systems, and smart homes/networks. (Source: GTM Research)
A Smart Grid transforms the way power is delivered, consumed and managed. Adding automated intelligence to the grid is expected to improve monitoring and communication between the customer and utility, which makes power more reliable and efficient, reduces costs and provides a platform for new applications.
A Smart Grid will also provide tools necessary to manage higher levels of renewable energy.
6. What is a Smart Meter? A Smart Meter records energy consumption and communicates directly with the utility company. Smart meters monitor and bill usage, identify outages and allow for remote turn on and disconnect. Smart meters can also improve distribution design, distribution operation and overall system efficiency.
7. What is a Net Metering?
For customers who generate their own electricity (for example with a rooftop solar unit), net metering allows electricity to flow both to and from the customer – typically through a single, bi‐directional meter. When a customer’s generation exceeds the customer’s use, electricity flows to the grid, offsetting electricity consumed by the customer at a different time during the same billing cycle. Net metering is required by law in most states, but these policies vary widely. (Source: DESIRE)

Page 29
8. What is a Feed‐in Tariff? A Feed‐in Tariff is a way to encourage the adoption of renewable energy sources. It typically includes three key provisions: 1) guaranteed access to the grid, 2) long‐term contracts for the electricity produced, and 3) purchase prices that are based on the cost of renewable energy generation. Under a feed‐in tariff, utilities must buy renewable energy from all eligible participants.
9. What is FERC and what role does it play in AZ? FERC is the Federal Energy Regulatory Commission. Within the continental U.S., high‐voltage electric transmission lines are organized in three interconnections: east of the Rocky Mountains, the Eastern Interconnection; west of the Rocky Mountains, the Western Interconnection; and Texas, the Electric Reliability Council of Texas (ERCOT). Based on the laws of physics, electricity utilizes these transmission lines. As a result, electricity generated in Arizona may be and is used in other states within the Western Interconnection. Electric power from other states also flows to Arizona. Since this is interstate commerce, the FERC takes jurisdiction (This is not true in ERCOT since it is solely within Texas). Among other things FERC:
Regulates the transmission and wholesale sales of electricity in interstate commerce;
Reviews certain mergers and acquisitions and corporate transactions by electricity companies;
Reviews the siting application for electric transmission projects under limited circumstances;
Licenses and inspects private, municipal and state hydroelectric projects;
Protects the reliability of the high‐voltage interstate transmission system through mandatory reliability standards;
Monitors and investigates energy markets; and
Oversees environmental matters related to natural gas and hydroelectricity projects and other matters.
(Source: http://www.ferc.gov/about/ferc‐does.asp)
FERC also sets electric rates related to high‐voltage electric transmission facilities. Significantly, during 1996, FERC issued Order 888 and 889.These orders have required transparency in transmission transactions and require transmission facilities be made available to non‐utility generators.

Page 30
References U.S. DOE ‐ Energy Information Administration
http://www.eia.doe.gov/energyexplained/images/charts/role_of_renewables_in_us_energy‐large.jpg
http://www.eia.doe.gov/cneaf/solar.renewables/page/trends/table1.html
http://www.eia.doe.gov/cneaf/electricity/epa/epat8p2.html
http://www.eia.doe.gov/cneaf/electricity/st_profiles/e_profiles_sum.html
http://www.aps.com/_files/various/ResourceAlt/Resource_Plan_‐_Presentation_sFinal.pdf
http://www.srpnet.com/about/resourceplan.aspx
http://www.ferc.gov/about/ferc‐does.asp
http://www.energyvortex.com/energydictionary/ferc_order_888__ferc_order_889.html
http://www.nrel.gov/analysis/
http://tonto.eia.doe.gov/state/state_energy_profiles.cfm?sid=AZ
http://www.azcc.gov/divisions/utilities/electric/environmental.asp
http://www.azcommerce.com/BusAsst/Incentive,
http://www.dsireusa.org/incentives/index.cfm?CurrentPageID=1&State=AZ&RE=1&EE=1
http://www.dsireusa.org/incentives/incentive.cfm?Incentive_Code=AZ41F&re=1&ee=1
http://www.azcc.gov/Divisions/Administration/about.asp
http://www.answers.com/topic/public‐utility
http://www.azcc.gov/divisions/utilities/electric/srp.asp
http://www.azcc.gov/divisions/utilities/electric/res.pdf
http://www.ferc.gov/about/ferc‐does.asp
http://www.energyvortex.com/energydictionary/ferc_order_888__ferc_order_889.html
http://www.azcc.gov/divisions/utilities/electric/res.pdf
http://www.pewclimate.org/what_s_being_done/in_the_states/rps.cfm

Page 31
U.S. Department of Energy, Office of Science, “Basic Research Needs for Solar Energy Utilization: Report on the Basic Energy Sciences Workshop on Solar Energy Utilization.” Washington, D.C. April 18‐21, 2005, Page 4.”
USA Department of Energy Definitions, 2010
International Energy Agency (Energy Prices and Taxes, 4th Quarter 2006) 2010 Solar Power Authority
http://www.eia.doe.gov/cneaf/electricity/epm/table5_6_b.html
http://www.openpv.nrel.gov/rankings
http://www.azsolarcenter.org/images/articles/az/AZCSP.gif
http://www.azsolarcenter.org/images/articles/az/AZPV.gif
http://www.blm.gov/az/st/en/prog/energy/solar/prop‐projs.html
http://www.arizonagoessolar.org/Home.aspx
Source Arizona Wind Development Status Report 2009: NREL and Arizona Wind Working Group
http://www.windpoweringamerica.gov/
http://www.windpoweringamerica.gov/images/windmaps/az_80m.jpg
http://geothermal.nau.edu/ U.S. Energy Information Administration (EIA) Source: U.S. Energy Information Administration (EIA), 2009 Nuclear Energy Institute (NEI) (http://www.nei.org/resourcesandstats/documentlibrary/reliableandaffordableenergy/factsheet/statefactsarizona_/)
www.worldnuclear.org
http://www.worldnuclear.org/info/inf69.html
MIT Study on the Future of Natural Gas – 2010 Massachusetts Institute of Technology [may not be necessary for natural gas projection]
Valley Forward 2011 Members AAA Association Abengoa Solar Adolfson & Peterson Construction ADOT AECOM AIA Arizona a.k.a. Green Services Air Conditioning by Jay AMEC Earth & Environmental American Council of Engineering APS ARC ARCADIS Architekton Arizona Business Magazine Arizona Capitol Times Arizona Community Tree Council Arizona Conservation Partnership Arizona Department of
Environmental Quality Arizona Foundation for
Resource Education Arizona Game & Fish Arizona Investment Council Arizona Municipal Water Users
Association Arizona Office Technologies The Arizona Republic Arizona Small Business Association ASHRAE‐Central Arizona ASU Global Institute of
Sustainability ASU School of Architecture+Landscape Architecture
ASU Stardust Center for Affordable Homes and the Family Audubon Arizona AV3 Design Studio Ayers/Saint/Gross Azofficespace.com Ballard Spahr Andrews & Ingersoll, LLP Barclay Legal, P.L.C. Beyond Green LLC Blue Cross & Blue Shield
of Arizona, Inc. Bouma Construction Brown & Caldwell Bryan Cave, L.L.P. Bureau of Land Management Canyon Communications Capital Review Group CCBG Architects, Inc. Central Arizona Project CIGNA HealthCare of Arizona City of Apache Junction City of Avondale City of Chandler City of El Mirage City of Glendale City of Goodyear City of Mesa City of Peoria City of Phoenix City of Scottsdale City of Tempe Climatec
colwell:shelor Courier Graphics Creo Architects David Evans and Associates, Inc. Desert Botanical Garden Desert Star Construction Dick & Fritsche Design Group DMB Associates Douglas Architecture and
Planning, P.C. Dunn Transportation/Ollie the Trolley Dynegy Arlington Valley, LLC DWL Architects & Planners, Inc. EcoAid Edge Industries Energy Systems Design, Inc. Entellus Inc. Environmental Fund for Arizona EPG, Inc. ERM West, Inc. Fennemore Craig, P.C. Flood Control District of
Maricopa County Frank Lloyd Wright Foundation Freeport‐McMoRan Copper & Gold, Inc. Freescale Semiconductor G and G Consulting Gabor Lorant Architects, Inc. Gallagher & Kennedy Gammage & Burnham Gannett Fleming Gavan & Barker, Inc.
Page 32

Page 33
General Dynamics Goazsolar Godec Randall & Associates, Inc. Goodwill of Central Arizona Gould Evans Associates, L.C. Greater Phoenix Chamber of
Commerce Green Ideas, Inc. Green Living AZ Gust Rosenfeld, P.L.C. HDR/S.R. Beard & Associates Herman Miller Holder Construction Company Honeywell Hoskin Ryan Consultants Hotel Valley Ho Hunt Construction Group InitiativeOne Intel Corporation Intellectual Energy, LLC JJR | Floor J2 Engineering & Environmental
Design Jennings, Strouss & Salmon John F. Long Properties, LLLP Johnson Insurance Keep Arizona Beautiful Keep Phoenix Beautiful Kimley‐Horn Kitchell Contractors Kleinfelder Klutznick Company Land Development Services LLC Lazarus & Associates, PC Lewis and Roca LLP Liberty Wildlife Rehabilitation
Foundation Lincoln Institute of Land Policy Linthicum Livability Law Local Initiatives Support Corp. Logan Simpson Design, Inc. LVA Urban Design Studio Maintenance Mart Maricopa Association of
Governments Maricopa County
Maricopa Health Foundation Michael Wilson Kelly Mountain States Employers Council National Bank of Arizona The Nature Conservancy
in Arizona Neace Lukens Olson Communications Olsson Associates The Orcutt/Winslow Partnership Otak, Inc. Papago Park Center Park&Co PBS&J Perfect Power, Inc. Perini Building Company PHX Architecture Design & Planning PfaelzerDean&Partners,
Inc. Phoenix Business Journal Phoenix Community
Alliance Phoenix‐Mesa Gateway Airport Phoenix Speakers Bureau The Phoenix Zoo Pixel Effects, LLC Premium Solutions Professional Underwriters
of Arizona, Inc. Pyramid Community
Developers, LLC Quarles & Brady LLP Dr. Theresa Ramsey Republic Services Relumination Salt River Pima Maricopa Indian Community Scutari & Cieslak Public Relations Shamrock Environmental
Technologies Shamrock Foods Company
SmithGroup Snell & Wilmer L.L.P. SolarCity Solon Solar Corporation Sonoran Institute Sonoran Studios Sonoran Sustainable Building Advisor Program Southwest Gas Corp. Southwest Public Relations
Associates, Inc. Southwest Solar Technologies Southwest Wildlife Conservation
Center SRP STMicroelectronics, Inc Sumco Phoenix Sunbelt Holdings Sundt Support Sky Harbor Coalition Ten Eyck Landscape Architects The Go Green Radio Show The Greenleaf Group, Inc. Thinking Caps Thompson + Pollari Planning Architecture Total Transit, Inc. /Discount Cab Town of Buckeye Town of Queen Creek Transcon Environmental Transystems Two Worlds Community Foundation U‐HAUL University of Phoenix/Apollo
Group Urban Land Institute URS Valley Metro Valley Metro Rail Valley Partnership Waibel & Associates Waste Management Weddle Gilmore Architects Wells Fargo Westcor Shopping Centers WestGroup Research

Valley Forward Association
3800 N. Central Avenue, Suite 220 Phoenix, AZ 85012
Ph: (602) 240‐2408 Fax: (602) 240‐2407 valleyforward.org
Valley Forward brings business and civic leaders together to convene thoughtful public dialogue on regional issues and to promote cooperative efforts
to improve the environment and sustainability of our Valley and State.


