Download - Axactor Q3-2021 Presentation

27 October 2021
Q3 2021
2
Agenda
1
2
3
4
Company introduction
Highlights
Financials
Outlook

HQ
26%;
12%2
8%
14%
7%
13%
20%
Axactor is an established European debt collection company that has grown rapidly in targeted markets
A leading European debt collector Operating in a few, stable and well developed markets
• Established in Q4 2015 with headquarters in Oslo,
Norway, and is one of Europe’s top-ten debt collectors
• Main focus on collection and acquisition of unsecured
non-performing loans (“NPL”) and third-party collection
(“3PC”)
• Operations in six countries; Finland, Germany, Italy,
Norway, Spain and Sweden, with 1,112 FTEs
• Geveran owns 46% of Oslo-listed Axactor SE
Share of revenue1
Non-
Performing
Loans (NPL)1
Real Estate
Owned
(REO)1
Third-party
collection
(3PC)1
3 1) Share of Gross revenue last twelve months Q3 2021
2) Spain excl. REO 26%; REO 12%
12%
14%
74%
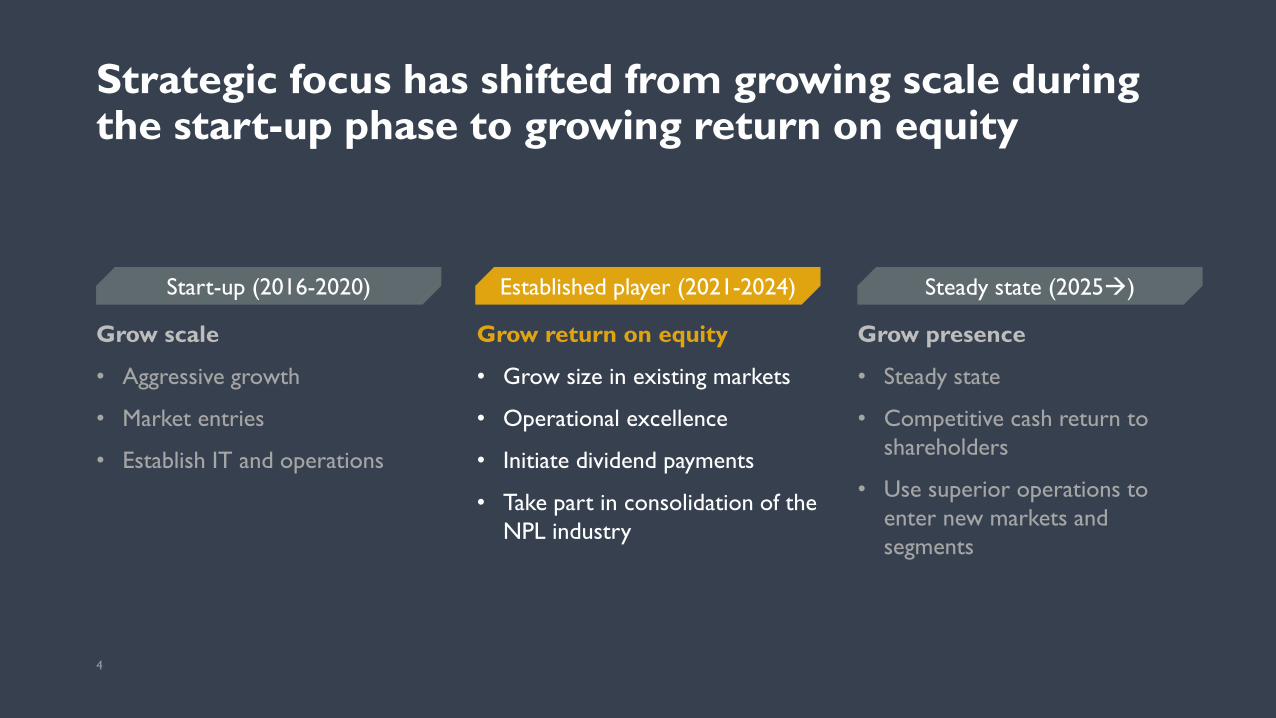
Steady state (2025→)Established player (2021-2024)
4
Grow scale
• Aggressive growth
• Market entries
• Establish IT and operations
Grow return on equity
• Grow size in existing markets
• Operational excellence
• Initiate dividend payments
• Take part in consolidation of the
NPL industry
Grow presence
• Steady state
• Competitive cash return to
shareholders
• Use superior operations to
enter new markets and
segments
Strategic focus has shifted from growing scale during the start-up phase to growing return on equity
Start-up (2016-2020)

5
• Axactor incepted to disrupt the industry on
cost-to-collect
• Continued innovation and growing economies
of scale to fuel further improvements
• Niche strategy supporting long-term
competitiveness
• Countries: Organic growth in current countries
• Products: NPL & 3PC
• Debt origination: Bank and finance
• Debt type: Fresh, unsecured, business to consumer
NPL Cost-to-Collect for selected peers in 20201
(EURm)
Axactor is pursuing a niche strategy to disrupt the industry on cost-to-collect
1) Cost is calculated as DOPEX + allocation of unallocated OPEX and Depreciation & Amortization (excluding amortization of NPL portfolios). DOPEX is used as
allocation key. Income is calculated as Total income adjusted for revaluations to show income excluding one-time effects based on changes in future expectations.
Additional adjustments made on two peers to make numbers comparable, e.g. due to reporting numbers as a bank
49%
54%
Peer 4
86%
Peer 1 Peer 2 Peer 3 Peer 5 Axactor
62%
56%
43%
43%
2017 2018 2019 2020
59%
48%45%
6
Agenda
1
2
3
4
Company introduction
Highlights
Financials
Outlook
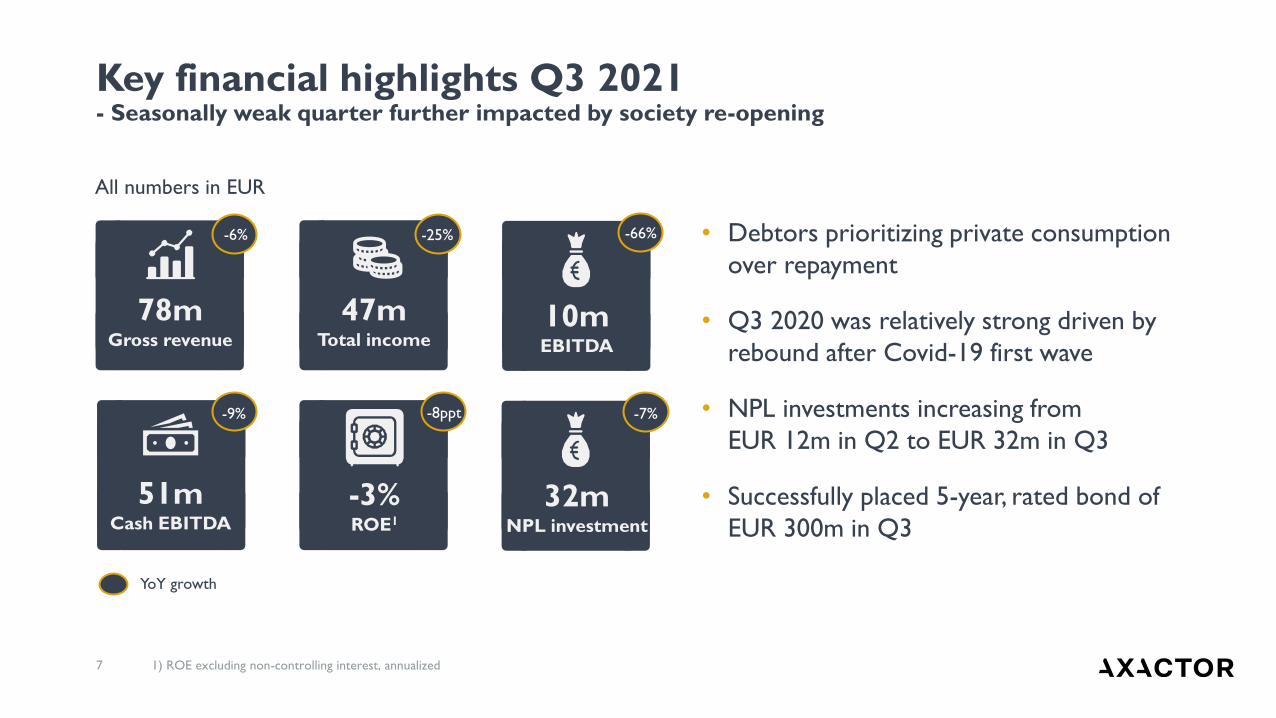
7 1) ROE excluding non-controlling interest, annualized
Key financial highlights Q3 2021- Seasonally weak quarter further impacted by society re-opening
10mEBITDA
51mCash EBITDA
78mGross revenue
-3%ROE1
All numbers in EUR
47mTotal income
32mNPL investment
YoY growth
-6% -25%
-7%-9%
-66%
-8ppt
• Debtors prioritizing private consumption
over repayment
• Q3 2020 was relatively strong driven by
rebound after Covid-19 first wave
• NPL investments increasing from
EUR 12m in Q2 to EUR 32m in Q3
• Successfully placed 5-year, rated bond of
EUR 300m in Q3
8
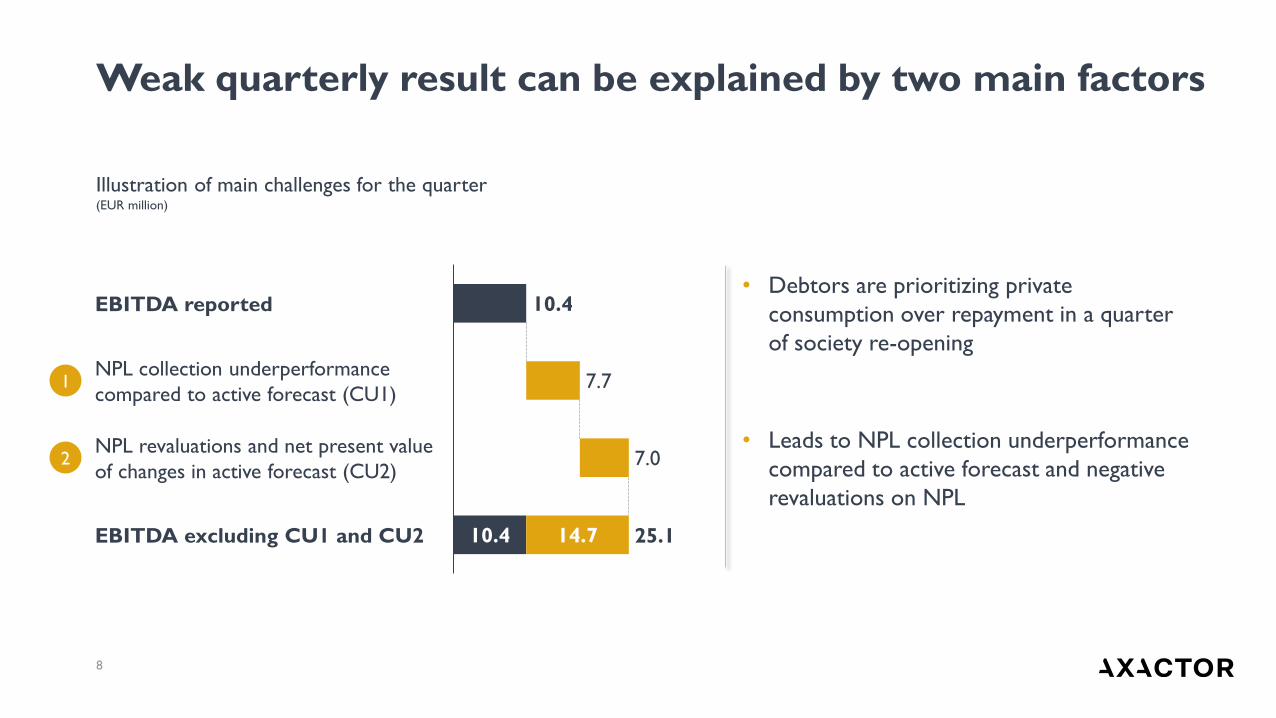
Weak quarterly result can be explained by two main factors
10.4
10.4
7.7
7.0
14.7
NPL collection underperformance
compared to active forecast (CU1)
EBITDA reported
NPL revaluations and net present value
of changes in active forecast (CU2)
EBITDA excluding CU1 and CU2 25.1
• Debtors are prioritizing private
consumption over repayment in a quarter
of society re-opening
• Leads to NPL collection underperformance
compared to active forecast and negative
revaluations on NPL
1
2
Illustration of main challenges for the quarter(EUR million)

9
Axactor strengthening the 3PC-position in Italy through the acquisition of Credit Recovery Service
• Successful bid to secure 100% of the shares in the Italian debt
collection agency Credit Recovery Service (CRS)
• Top-5 independent 3PC-player in the Italian bank and finance segment
with headquarter in Grosseto (Tuscany), contact center in Milazzo
(Sicily) and in total 155 employees
• In line with Axactor’s strategy
• Strengthening the position in an existing country, improving capabilities on 3PC and
preparing for post-pandemic volumes and new signed contracts in Italy
• CRS had a total income of EUR 6.2m in 2020, with an EBITDA of
EUR 0.9m
“The acquisition will give a fantastic
operational platform to enable future
3PC-growth” says Antonio Cataneo,
Country Manager, Axactor Italy

• New 5-year rated bond of EUR 300m at EURIBOR +
5.35% successfully placed in Q3
• Reducing interest rate by 1.65%-points compared to the
bond placement in December 2020
• Axactor is strengthening the financial position
• 32% equity ratio
• Material headroom to covenants - leverage ratio of 3.31
• EUR 249m in unutilized credit lines and EUR 39m in cash2
10
Axactor placed a new bond in Q3 and is strengthening the financial position
1) Please see supporting information/covenants for definition of covenants
2) And cash equivalents. Excluding restricted cash

11
• NPL investments in 2021 expected to be in the
region of EUR 150m, given attractive prices
• Replacement CAPEX of EUR 126m next twelve
months
• EUR 86m already committed through forward flow
agreements
• Expect to invest more than replacement CAPEX
going forward
NPL investments significantly above previous quarters and slightly above replacement CAPEX
69
149
85
9590
62
35
2216 12
32
Q1-19 Q2-21Q2-19 Q4-20Q3-19 Q1-20Q4-19 Q2-20 Q3-20 Q1-21 Q3-21
NPL investments(EUR million)
12
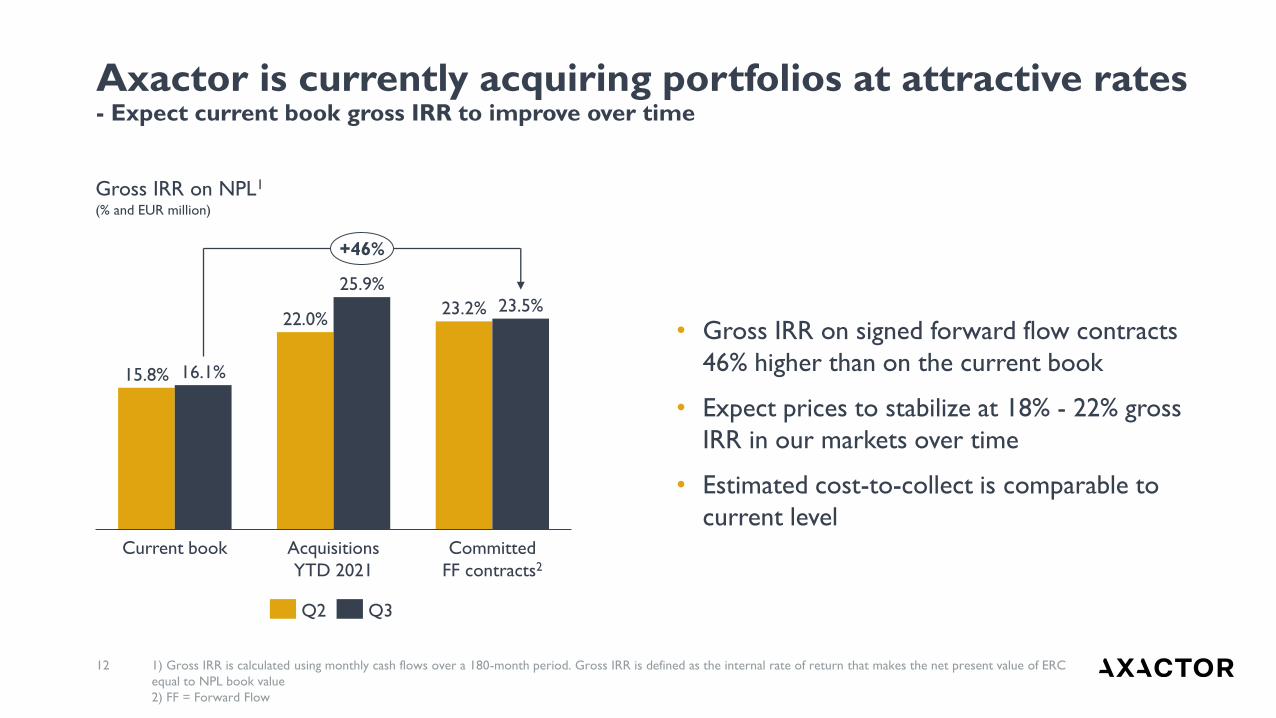
• Gross IRR on signed forward flow contracts
46% higher than on the current book
• Expect prices to stabilize at 18% - 22% gross
IRR in our markets over time
• Estimated cost-to-collect is comparable to
current level
Axactor is currently acquiring portfolios at attractive rates- Expect current book gross IRR to improve over time
Current book Committed
FF contracts2
Acquisitions
YTD 2021
15.8% 16.1%
22.0%
25.9%
23.2% 23.5%
+46%
Gross IRR on NPL1
(% and EUR million)
1) Gross IRR is calculated using monthly cash flows over a 180-month period. Gross IRR is defined as the internal rate of return that makes the net present value of ERC
equal to NPL book value
2) FF = Forward Flow
Q2 Q3

13
Expect IRR to converge to historic average- Significantly above historic IRR for Axactor
’16 ’22’21’17 ’18 ’20’19 ’23
Estimated IRR development 2016 - 2023
Historic average
• Declining IRR’s throughout 2021, but
significantly above historic IRR for Axactor
• High number of deals, but smaller volumes
due to lower 2020 and 2021 vintages
• Stronger competition on one-offs than on
forward flows – probably driven by the need
for instant new volumes among peers
• Significant price differences across markets
Comments

14
• Realized higher savings than estimated in Q3
• Site consolidation in Norway
• Higher impact of previously implemented initiatives
• Various smaller improvement initiatives
• Cost reduction program expected to reach full
P&L-effect in Q4
Cost reduction program ahead of plan
2.3
3.9
5.1
5.1
0.5
Q4 2021Q1 2021 Q2 2021 Q3 2021
5.6
1)Measured against Q4 2020, adjusted for quarter-specific cost items such as year-end adjustment of bonus accruals etc.
3.2 0.9
Cost reduction program, annualized1)
(EUR million)
0.3 0.2
Realized savings Expected savings Restructuring cost
15
Agenda
1
2
3
4
Company introduction
Highlights
Financials
Outlook
16
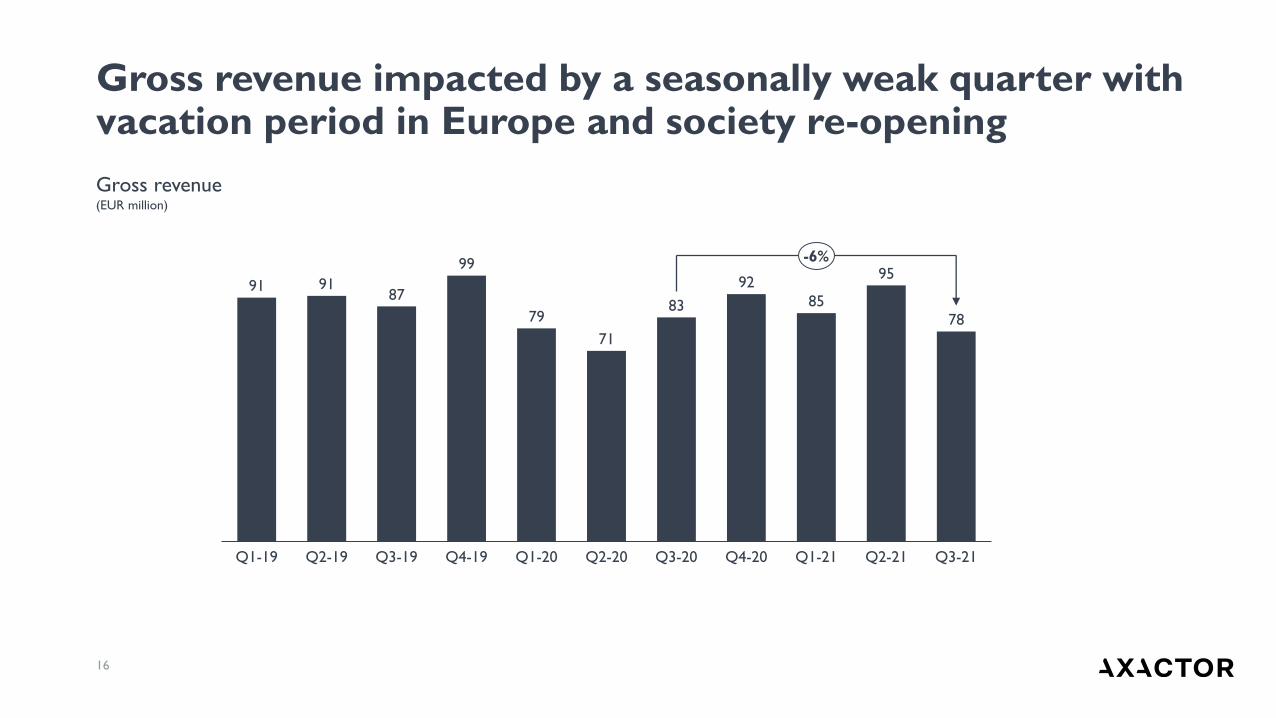
Gross revenue impacted by a seasonally weak quarter with vacation period in Europe and society re-opening
91 9187
99
79
71
83
92
85
95
78
Q4-20Q2-19Q1-19 Q3-19 Q3-20Q4-19 Q1-20 Q2-20 Q1-21 Q2-21 Q3-21
-6%
Gross revenue(EUR million)
17
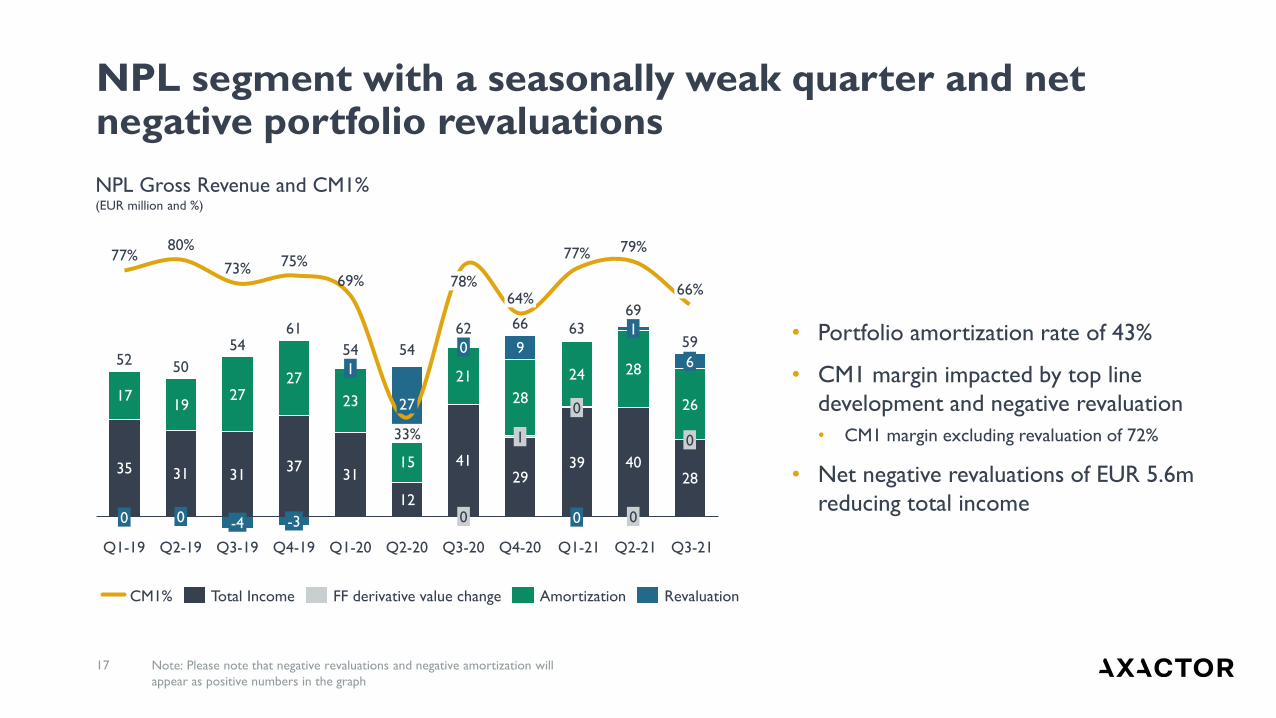
• Portfolio amortization rate of 43%
• CM1 margin impacted by top line
development and negative revaluation
• CM1 margin excluding revaluation of 72%
• Net negative revaluations of EUR 5.6m
reducing total income
Note: Please note that negative revaluations and negative amortization will
appear as positive numbers in the graph
NPL segment with a seasonally weak quarter and net negative portfolio revaluations
35 31 3137
31
12
4129
39 4028
1719
2727
23
15
21 28
28
24
26
9
80%77%
0
69%
1
Q1-19 Q2-19
54
66%
0
0
63
50
-4
73%78%
Q3-19
-3
Q4-20
75%
Q4-19 Q1-21
0
Q1-20 Q3-21
79%
0
27
33%
0
Q2-20
0
62
Q3-20
1
64%
0
77%
1
Q2-21
65254
61
54
6669
59
CM1% FF derivative value changeTotal Income RevaluationAmortization
NPL Gross Revenue and CM1%(EUR million and %)

18
• Unsecured collection
performance in Q3 2021 of 89%
• Sharp decline in debtor
willingness to repay in Q3 during
society re-opening in Europe
• Reduced short-term visibility on
collection performance
A sharp decline in debtors' willingness to pay yielded collections below active forecast in Q3
Q2
-21
Q1
-23
Q3
-20
Q4
-24
Q1
-20
Q2
-20
Q3
-22
Q1
-21
Q4
-20
Q3
-21
Q4
-21
Q1
-22
Q2
-22
Q4
-22
Q4
-25
Q2
-23
Q3
-23
Q4
-23
Q1
-24
Q2
-24
Q3
-24
Q1
-25
Q2
-25
Q3
-25
Active forecast Collection
NPL unsecured active forecast versus collection
19
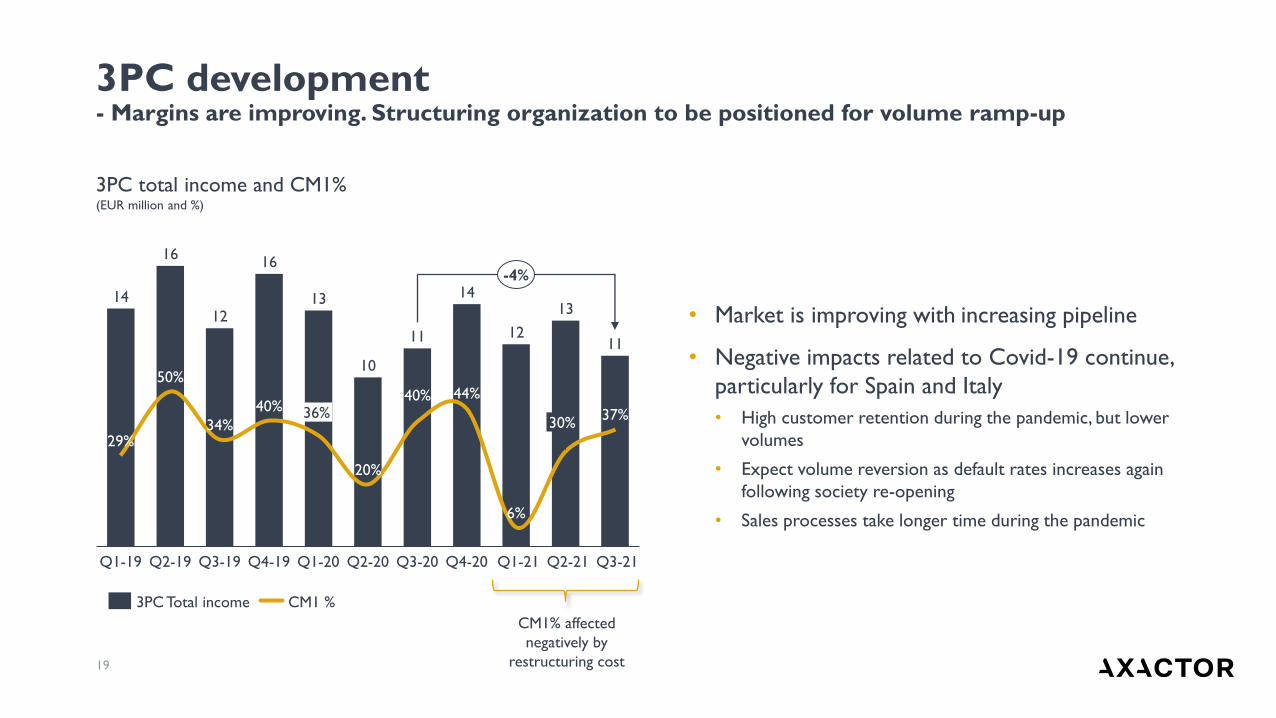
• Market is improving with increasing pipeline
• Negative impacts related to Covid-19 continue,
particularly for Spain and Italy
• High customer retention during the pandemic, but lower
volumes
• Expect volume reversion as default rates increases again
following society re-opening
• Sales processes take longer time during the pandemic
3PC development- Margins are improving. Structuring organization to be positioned for volume ramp-up
14
16
12
16
13
10
11
14
12
13
11
Q1-19
29%
50%
34%
Q3-19Q2-19 Q2-21Q4-19
40% 36%
Q1-20
20%
Q2-20
40%
Q3-20
44%
Q4-20
6%
Q1-21
30%37%
Q3-21
-4%
3PC Total income CM1 %
3PC total income and CM1%(EUR million and %)
CM1% affected
negatively by
restructuring cost
20
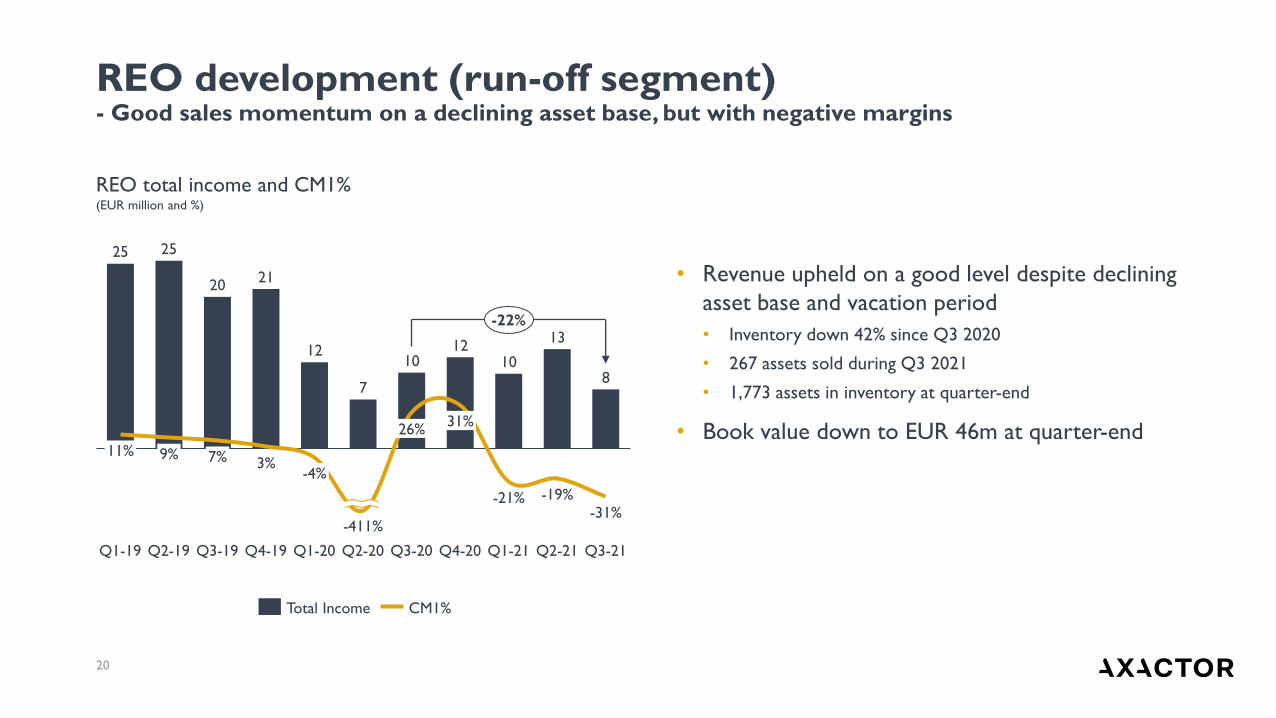
• Revenue upheld on a good level despite declining
asset base and vacation period
• Inventory down 42% since Q3 2020
• 267 assets sold during Q3 2021
• 1,773 assets in inventory at quarter-end
• Book value down to EUR 46m at quarter-end
REO development (run-off segment)- Good sales momentum on a declining asset base, but with negative margins
25 25
2021
12
7
1012
10
13
8
9%3%
Q2-19
7%
Q3-19 Q4-19
11%
Q1-20
26%
Q2-20
31%
Q4-20 Q2-21
-21%
Q1-21Q3-20
-31%
Q3-21Q1-19
-19%
-411%
-4%
-22%
Total Income CM1%
REO total income and CM1%(EUR million and %)

Summary: A soft quarter, but Cash EBITDA upheld on a reasonable level despite challenges and low NPL investments in 2021
Total Income(EUR million)
EBITDA and EBITDA-margin(EUR million and %)
Cash EBITDA (EUR million)
21
74 72
64
75
56
29
62
55
6166
47
Q3
21
Q4
19
Q3
19
Q1
19
Q2
21
Q4
20
Q2
19
Q1
20
Q2
20
Q3
20
Q1
21
-25%
59
65
60
67
4844
5661
52
66
51
Q1
19
Q3
19
Q2
19
Q4
19
Q3
21
Q3
20
Q1
20
Q2
20
Q4
20
Q1
21
Q2
21
-9%
2226
2024
14
-30
17 1822
10
32%
Q2
21
Q3
20
31%30%36%
Q1
19
Q2
19
Q2
20
Q3
19
Q4
19
25%
Q1
20
-105%
49%
32%
Q4
20
34%29%
Q1
21
22%
Q3
21
30
Positive trend on depreciations, financial cost and tax, but ending the quarter with losses after tax
D&A1, Net financials and tax(EUR million)
Net profit after tax(EUR million)
22
3 4 3 2 2
14
6
18
4
1214
11 12
6
315
3
17 12
13
2
2
3 3
3
-3
3
-4
3
22
Q4
19
Q2
19
Q3
19
Q1
19
Q3
20
Q1
20
Q2
20
Q4
20
Q3
21
2
Q1
21
Q2
21
0
18
20
16 17
11
1416
24
17 21
18
2
5 45 5
4
0
-1
7
-3
32
-1
1
-2
3
1
-2-3
-2
Q4
19
Q2
19
-18
Q1
19
Q3
19
Q1
20
Q2
20
Q1
21
Q3
20
Q4
20
-27
Q2
21
Q3
21
Depriciation and amortization
Net financial items
Tax
Non-controlling interests
Equity holders
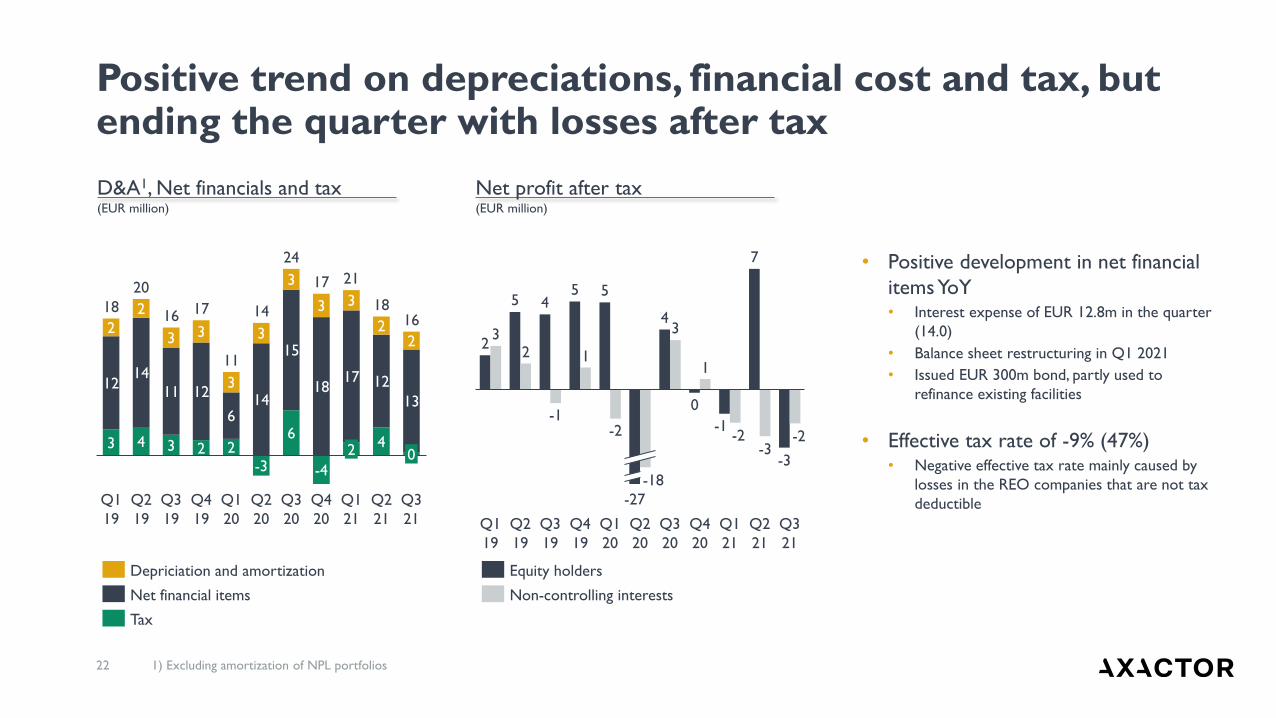
• Positive development in net financial
items YoY• Interest expense of EUR 12.8m in the quarter
(14.0)
• Balance sheet restructuring in Q1 2021
• Issued EUR 300m bond, partly used to
refinance existing facilities
• Effective tax rate of -9% (47%)• Negative effective tax rate mainly caused by
losses in the REO companies that are not tax
deductible
1) Excluding amortization of NPL portfolios

23
Volatile RoE to shareholders during the pandemic
RoE to shareholders RoE to shareholders excl. REO1
Return on Equity excl. non-controlling interest per quarter (annualized)
1) Calculated by excluding Reolux which is our investment vehicle for REO’s (certain intercompany eliminations and other consolidation effects have not been considered)
6%7% 5%
-2%-3%
7%9%
11%9%
-1%
9%
0%
10%
-20%
5%
-40%
15%
Q1-20
0%
Q3-20Q2-20Q2-19
3%
4%
Q1-19
7%
Q3-19
-2%
Q4-19 Q3-21
-36%
-21%
7%
Q4-20
0%
Q1-21 Q2-21
7%
4%
• Expect short term fluctuations in RoE
driven by seasonality, Covid-19 and
business performance
• Expect RoE to improve over time as
the underlying business improves and as
societies slowly defeat the pandemic
Covid-19

24
Agenda
1
2
3
4
Company introduction
Highlights
Financials
Outlook

25
• Reduced short-term visibility on collection
performance following a sharp decline in debtors'
willingness to pay as societies re-opened
• 3PC volume expected to return to pre-pandemic
levels over time as societies re-open and default
rates increases again
• Increasing market activity for both 3PC and NPL
• Axactor strictly prioritizes the best NPL investments• NPL investment guiding of EUR ~150m for 2021
- but highly dependent on one-offs in Q4
Outlook

Supporting information
Q3 2021
NPL portfolio

28
• Portfolio amortization rate of 43%
• CM1 margin impacted by top line
development and negative revaluation
• CM1 margin excluding revaluation of 72%
• Net negative revaluations of EUR 5.6m
reducing total income
Note: Please note that negative revaluations and negative amortization will
appear as positive numbers in the graph
NPL segment with a seasonally weak quarter and net negative portfolio revaluations
35 31 3137
31
12
4129
39 4028
1719
2727
23
15
21 28
28
24
26
9
80%77%
0
69%
1
Q1-19 Q2-19
54
66%
0
0
63
50
-4
73%78%
Q3-19
-3
Q4-20
75%
Q4-19 Q1-21
0
Q1-20 Q3-21
79%
0
27
33%
0
Q2-20
0
62
Q3-20
1
64%
0
77%
1
Q2-21
65254
61
54
6669
59
CM1% FF derivative value changeTotal Income RevaluationAmortization
NPL Gross Revenue and CM1%(EUR million and %)

29
• Q3 collection performance of 89%
• LTM collection performance of 95%
• Long term average performance expected to
fluctuate around 100%
Actual collection vs. active forecast1
(LTM, rolling)
Declining collection performance after a weak Q3
1)Active forecast reflects changes made to the ERC curves on an ongoing basis
Adjustments to portfolio values have been taken over the P&L on an ongoing basis as deviations have occurred
96%
108%
Q2
-18
Q3
-20
Q4
-19
93%
Q1
-19
100% 101%
Q3
-18
Q1
-20
112%
Q4
-18
106%
Q2
-19
98%101%
Q3
-19
Q3
-21
95%98%92%
Q2
-20
97%
Q4
-20
Q1
-21
98%
Q2
-21
30
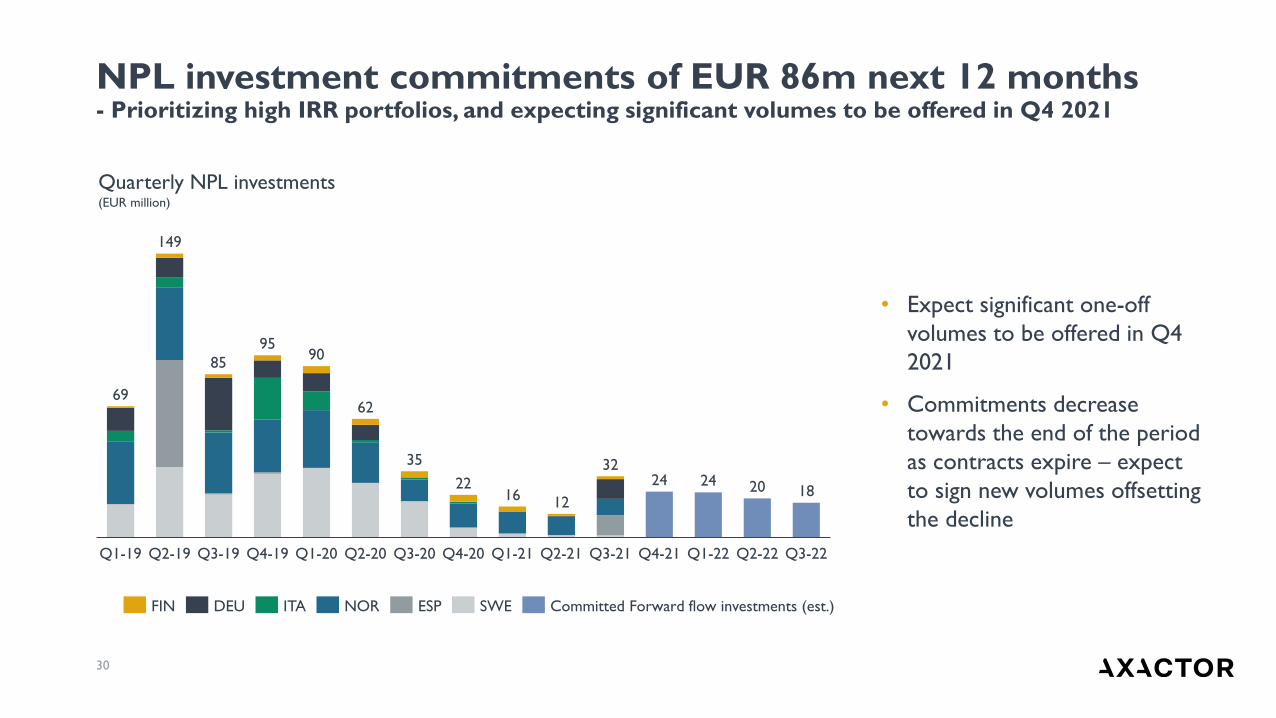
NPL investment commitments of EUR 86m next 12 months- Prioritizing high IRR portfolios, and expecting significant volumes to be offered in Q4 2021
Quarterly NPL investments(EUR million)
24 24 20 1816
Q1-19 Q1-20Q2-19
22
Q3-19 Q4-20Q4-19 Q2-20 Q3-20
12
Q1-21 Q2-21 Q3-21 Q4-21 Q1-22 Q2-22 Q3-22
69
90
149
85
95
62
35 32
ESPFIN ITADEU Committed Forward flow investments (est.)NOR SWE
• Expect significant one-off
volumes to be offered in Q4
2021
• Commitments decrease
towards the end of the period
as contracts expire – expect
to sign new volumes offsetting
the decline
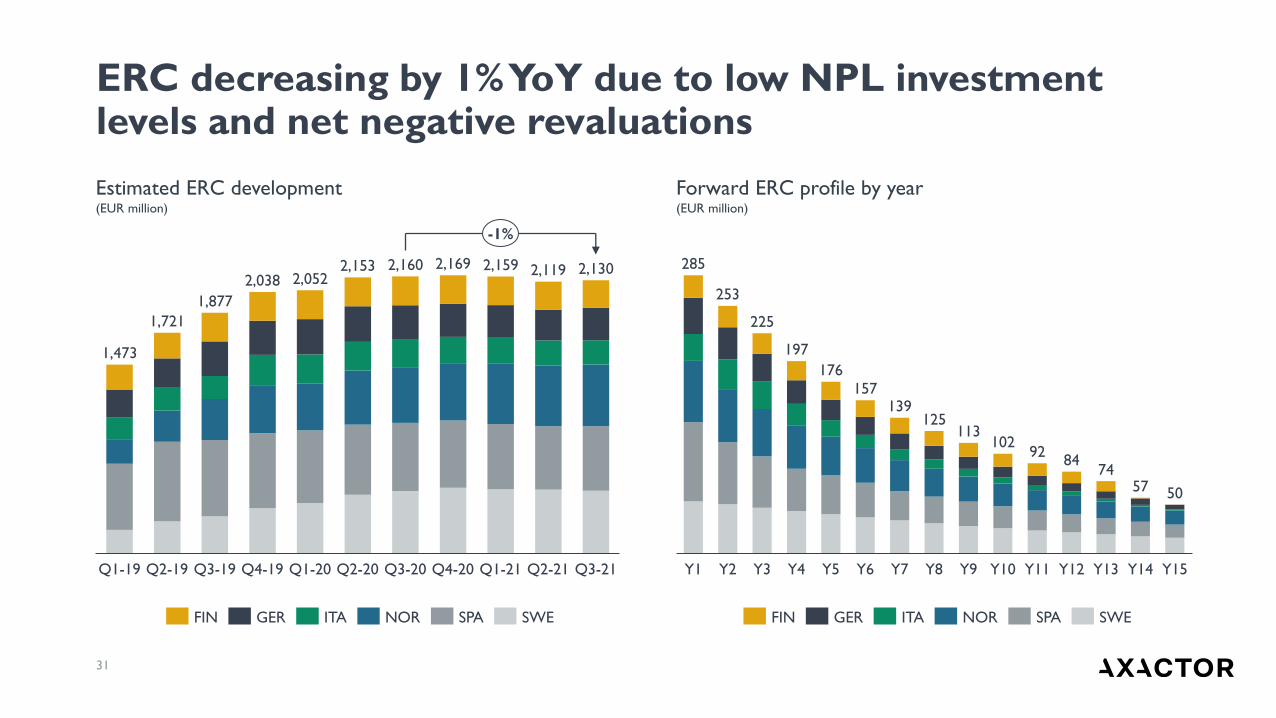
31
Estimated ERC development (EUR million)
Forward ERC profile by year(EUR million)
ERC decreasing by 1% YoY due to low NPL investment levels and net negative revaluations
Q1-20 Q4-20
2,160
Q2-20Q1-19 Q2-19 Q3-21Q3-19 Q3-20Q4-19 Q1-21 Q2-21
2,153
1,473
1,721
1,877
2,0382,169
2,0522,159 2,119 2,130
-1%
SPAFIN GER NORITA SWE
Y4
197
Y14Y3
113
Y1 Y8Y7Y5
102
Y2 Y6 Y9 Y10 Y11 Y13Y12
57
Y15
285
253
225
176
157139
125
9284
74
50
FIN GER SPAITA NOR SWE
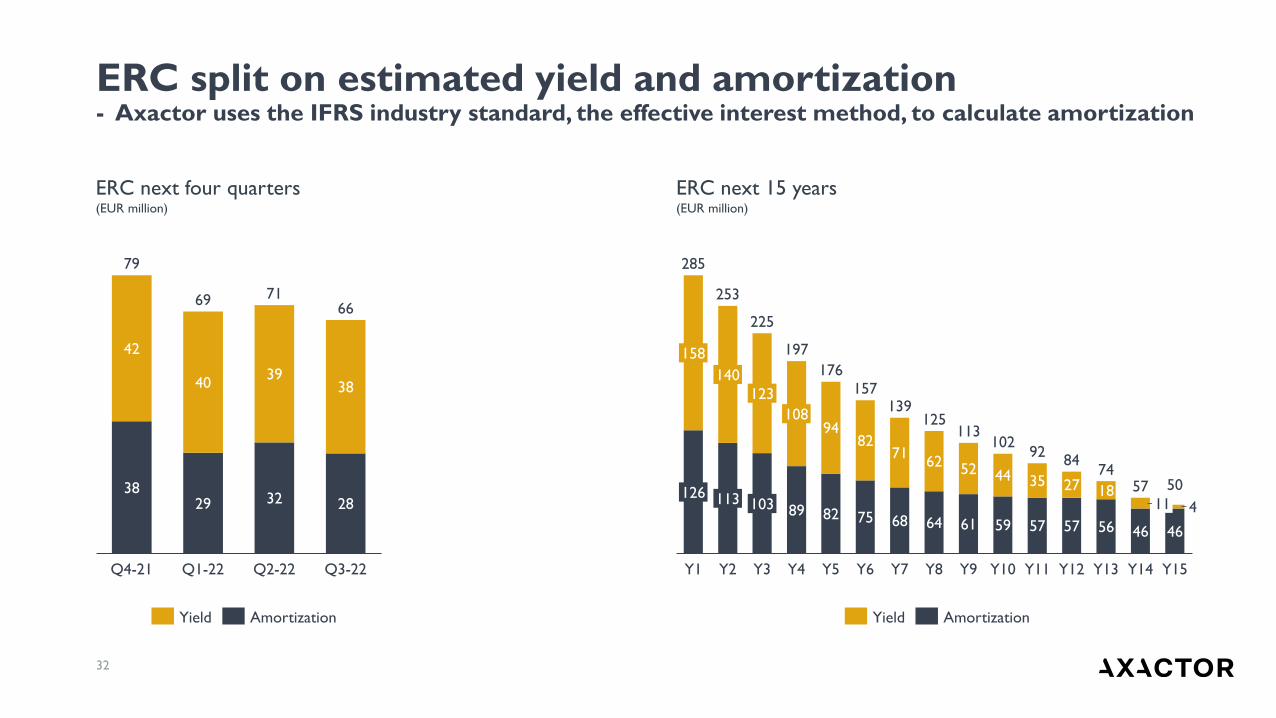
32
ERC next four quarters(EUR million)
ERC next 15 years(EUR million)
ERC split on estimated yield and amortization- Axactor uses the IFRS industry standard, the effective interest method, to calculate amortization
3829 32 28
42
4039
38
71
Q4-21 Q1-22 Q2-22
79
Q3-22
6669
Yield Amortization
89 82 75 68 64 61 59 57 57 56 46 46
9482
7162
52 44 35 27 184
Y1
92
Y10
126
113
123
Y15
140
50113
Y14Y2
103
139
Y3
108
Y4
74
197
225
Y13Y6 Y7 Y8
57
125
Y11 Y12
11
Y9
158
285
253
176
157
10284
Y5
Yield Amortization
Q3 2021
3PC

34
• Market is improving with increasing pipeline
• Negative impacts related to Covid-19 continue,
particularly for Spain and Italy
• High customer retention during the pandemic, but lower
volumes
• Expect volume reversion as default rates increases again
following society re-opening
• Sales processes take longer time during the pandemic
3PC development- Margins are improving. Structuring organization to be positioned for volume ramp-up
14
16
12
16
13
10
11
14
12
13
11
Q1-19
29%
50%
34%
Q3-19Q2-19 Q2-21Q4-19
40% 36%
Q1-20
20%
Q2-20
40%
Q3-20
44%
Q4-20
6%
Q1-21
30%37%
Q3-21
-4%
3PC Total income CM1 %
3PC total income and CM1%(EUR million and %)
CM1% affected
negatively by
restructuring cost
35
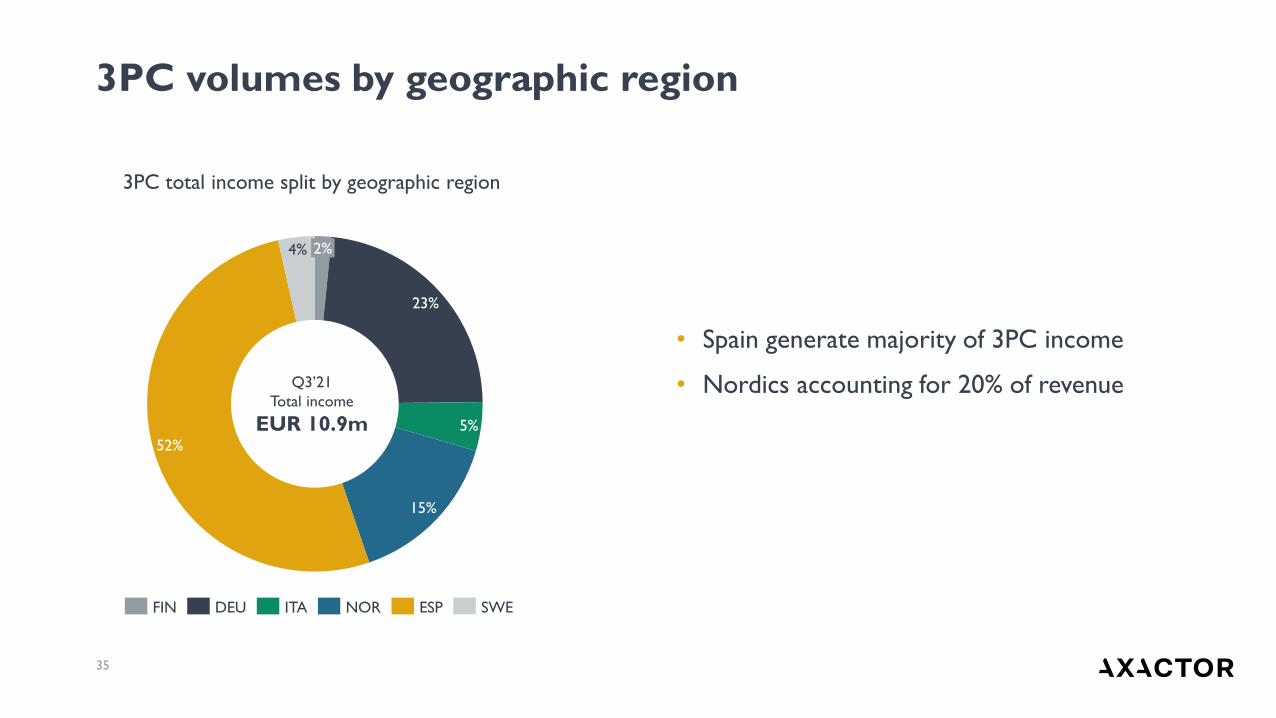
• Spain generate majority of 3PC income
• Nordics accounting for 20% of revenue
3PC volumes by geographic region
3PC total income split by geographic region
23%
5%
15%
52%
4% 2%
Q3’21
Total income
EUR 10.9m
FIN ESPDEU ITA SWENOR
Q3 2021
REO portfolio(run-off segment)

37
• Revenue upheld on a good level despite declining
asset base and vacation period
• Inventory down 42% since Q3 2020
• 267 assets sold during Q3 2021
• 1,773 assets in inventory at quarter-end
• Book value down to EUR 46m at quarter-end
REO development (run-off segment)- Good sales momentum on a declining asset base, but with negative margins
25 25
2021
12
7
1012
10
13
8
-4%
9%
Q1-19
11%
Q2-19
31%
7%
Q1-21Q3-19
3%
Q4-19 Q1-20
26%
Q3-20 Q4-20
-21% -19%
Q2-21
-31%
Q3-21Q2-20
-411%
-22%
Total Income CM1%
REO total income and CM1%(EUR million and %)

• Total portfolio investments of EUR 287m*
• Last portfolio acquisition in Q3 2018
• 79% decline in book value since peak
• A total of 8,664 assets acquired*
• 6,891 assets sold
*Adjusted for assets pending legal transfer
REO portfolio moving towards the tail
8
157
198187
223
200181
162148
129 120
89 84 7968
5546
Q1
2020
Q1
2018
Q1
2021
Q3
2017
Q3
2018
Q1
2019
Q3
2020
Q3
2019
Q3
2021
521
4,825
6,703
6,161
7,388
6,323
5,773
5,130 4,612
4,024
3,740 3,489
3,076 2,694
2,391 2,039
1,773
Q1
2021
Q3
2017
Q1
2018
Q3
2019
Q3
2018
Q1
2019
Q3
2020
Q1
2020
Q3
2021
REO # of units*REO book value*
(EUR million)
38

Originally acquired
Asset class # assets % of total Book value % of total
Housing 4,040 47 % 195.7 68 %
Parking, annex etc. 3,395 39 % 15.8 6 %
Land 357 4 % 9.4 3 %
Commercial 872 10 % 66.5 23 %
Total 8,664 100 % 287.4 100 %
Current book
Asset class # assets % of total Book value % of total
Housing 677 38 % 23.6 51 %
Parking, annex etc. 605 34 % 2.1 5 %
Land 227 13 % 3.7 8 %
Commercial 264 15 % 17.8 39 %
Eliminations 0 0 % -1.1 -2 %
Total 1,773 100 % 46.0 100 %
39
• Housing represent >50% of current book value
• Average book value per remaining asset EUR 26k
• Average book value per sold asset of EUR 32k
• Average sale price per sold asset of EUR 38k
*Adjusted for assets pending legal transfer
REO statistics*
(EUR million)

Q3 2021
Covenants
41 1) From Q4 2020 NOK and SEK part of portfolio value, cash & cash equivalents and interest-bearing debt are adjusted to the last six months average FX rates
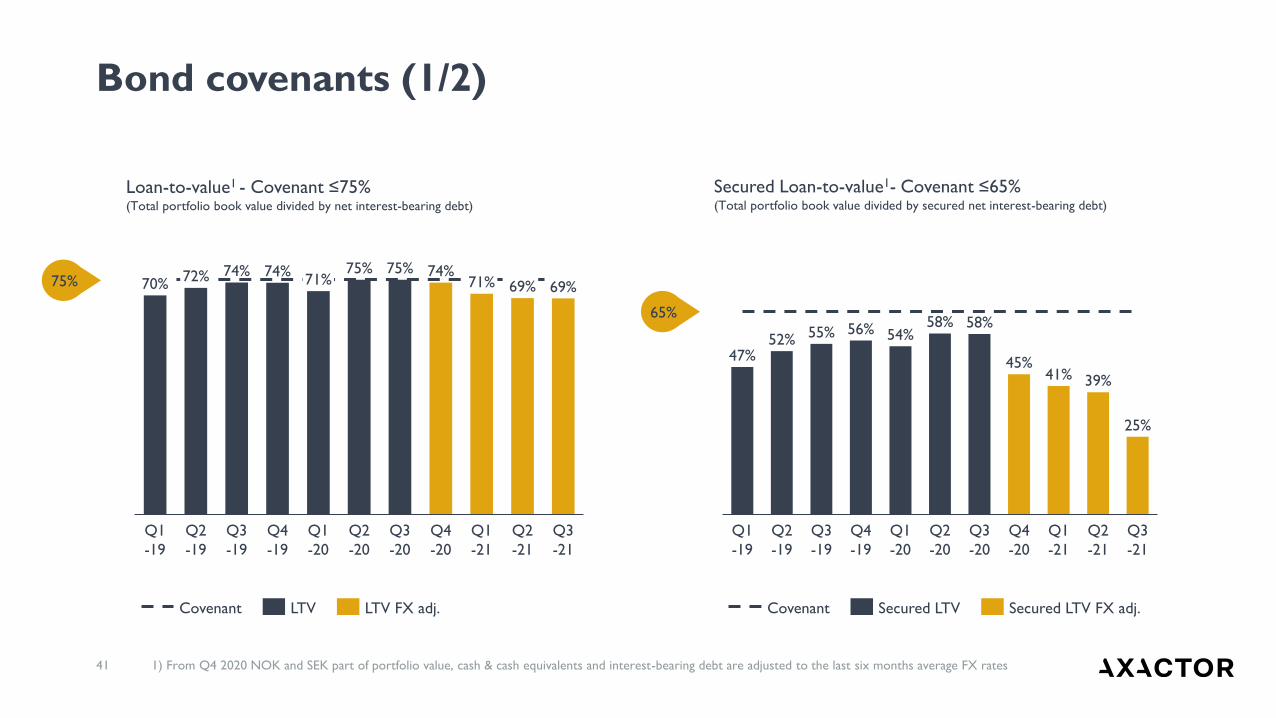
Bond covenants (1/2)
72%
Q4
-19
Q1
-19
Q3
-20
Q2
-20
Q2
-19
Q3
-19
Q1
-20
Q4
-20
Q1
-21
74%
Q2
-21
Q3
-21
70%74%
71%75% 75%
69%74%
71% 69%
Covenant LTV FX adj.LTV
Q1
-20
Q4
-19
Q3
-19
Q1
-19
Q3
-20
Q2
-19
Q2
-20
Q4
-20
Q1
-21
45%
Q2
-21
Q3
-21
47%52% 55% 56% 54%
58% 58%
41% 39%
25%
Covenant Secured LTV Secured LTV FX adj.
Secured Loan-to-value1- Covenant ≤65%(Total portfolio book value divided by secured net interest-bearing debt)
Loan-to-value1 - Covenant ≤75%(Total portfolio book value divided by net interest-bearing debt)
75%
65%

42 1) From Q4 2020 NOK and SEK part of portfolio value, cash & cash equivalents and interest-bearing debt are adjusted to the last six months average FX rates
Bond covenants (2/2)
2.9 3.0 3.1 3.1 3.1
4.0
3.3 3.3
Q2
-19
Q4
-19
Q3
-19
Q1
-19
Q3
-20
Q1
-20
Q2
-20
Q4
-20
Q1
-21
Q2
-21
Q3
-21
3.63.9 3.7
Covenant
NIBD / Pro-forma Cash EBITDA
NIBD / Pro-forma Cash EBITDA FX adjusted
7.3 7.4
6.7 6.5
5.8
5.24.9
4.7 4.75.2 5.2
Q1
-20
Q4
-20
Q1
-19
Q4
-19
Q2
-19
Q3
-19
Q2
-21
Q1
-21
Q2
-20
Q3
-20
Q3
-21
Covenant Interest coverage
Interest coverage ratio1- Covenant ≥4.0x(Pro-forma adjusted cash EBITDA divided by net interest expenses)
Leverage ratio1 - Covenant ≤4.0x(Net interest-bearing debt divided by LTM Pro-forma adjusted EBITDA
4x
4x

Appendix
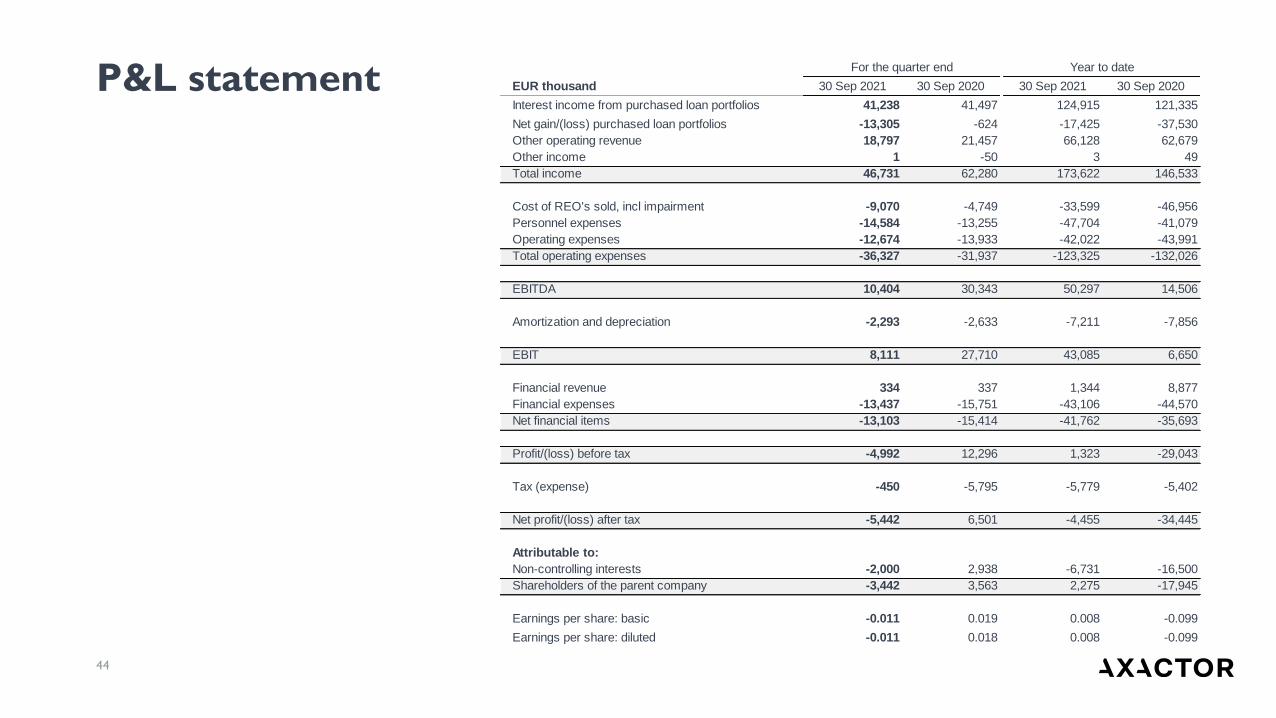
For the quarter end Year to date
EUR thousand 30 Sep 2021 30 Sep 2020 30 Sep 2021 30 Sep 2020
Interest income from purchased loan portfolios 41,238 41,497 124,915 121,335
Net gain/(loss) purchased loan portfolios -13,305 -624 -17,425 -37,530
Other operating revenue 18,797 21,457 66,128 62,679
Other income 1 -50 3 49
Total income 46,731 62,280 173,622 146,533
Cost of REO's sold, incl impairment -9,070 -4,749 -33,599 -46,956
Personnel expenses -14,584 -13,255 -47,704 -41,079
Operating expenses -12,674 -13,933 -42,022 -43,991
Total operating expenses -36,327 -31,937 -123,325 -132,026
EBITDA 10,404 30,343 50,297 14,506
Amortization and depreciation -2,293 -2,633 -7,211 -7,856
EBIT 8,111 27,710 43,085 6,650
Financial revenue 334 337 1,344 8,877
Financial expenses -13,437 -15,751 -43,106 -44,570
Net financial items -13,103 -15,414 -41,762 -35,693
Profit/(loss) before tax -4,992 12,296 1,323 -29,043
Tax (expense) -450 -5,795 -5,779 -5,402
Net profit/(loss) after tax -5,442 6,501 -4,455 -34,445
Attributable to:
Non-controlling interests -2,000 2,938 -6,731 -16,500
Shareholders of the parent company -3,442 3,563 2,275 -17,945
Earnings per share: basic -0.011 0.019 0.008 -0.099
Earnings per share: diluted -0.011 0.018 0.008 -0.099
44
P&L statement

EUR thousand 30 Sep 2021 30 Sep 2020 Full year 2020
EQUITY AND LIABILITIES
Share Capital 158,150 97,040 97,040
Other paid-in equity 269,900 236,502 236,562
Retained Earnings -5,398 -15,791 -16,036
Reserves -10,013 -27,843 -15,999
Non-controlling interests 8,702 74,958 74,113
Total Equity 421,341 364,866 375,680
Non-current Liabilities
Interest bearing debt 661,554 585,094 579,282
Deferred tax liabilities 6,331 11,142 6,436
Lease liabilities 3,044 3,056 2,804
Other non-current liabilities 1,644 1,324 1,433
Total non-current liabilities 672,574 600,616 589,955
Current Liabilities
Accounts Payable 6,885 3,099 6,147
Current portion of interest bearing debt 152,568 339,953 356,903
Taxes Payable 17,443 9,547 12,002
Lease liabilities 1,779 2,533 2,282
Other current liabilities 26,712 22,697 20,657
Total current liabilities 205,387 377,829 397,992
Total Liabilities 877,962 978,445 987,947
TOTAL EQUITY AND LIABILITIES 1,299,302 1,343,310 1,363,627
EUR thousand 30 Sep 2021 30 Sep 2020 Full year 2020
ASSETS
Intangible non-current assets
Intangible Assets 18,426 20,885 19,989
Goodwill 55,496 53,784 54,879
Deferred tax assets 7,761 5,111 7,769
Tangible non-current assets
Property, plant and equipment 2,557 2,684 2,530
Right-of-use assets 4,596 5,332 4,826
Financial non-current assets
Purchased debt portfolios 1,102,066 1,115,480 1,124,699
Other non-current receivables 365 503 458
Other non-current investments 196 193 196
Total non-current assets 1,191,462 1,203,972 1,215,346
Current assets
Stock of Secured Assets 46,043 84,163 78,786
Accounts Receivable 6,121 5,743 7,124
Other current assets 13,417 13,632 11,645
Restricted cash 3,274 2,718 2,946
Cash and Cash Equivalents 38,984 33,083 47,779
Total current assets 107,840 139,339 148,281
TOTAL ASSETS 1,299,302 1,343,310 1,363,627
45
Balance sheet statement
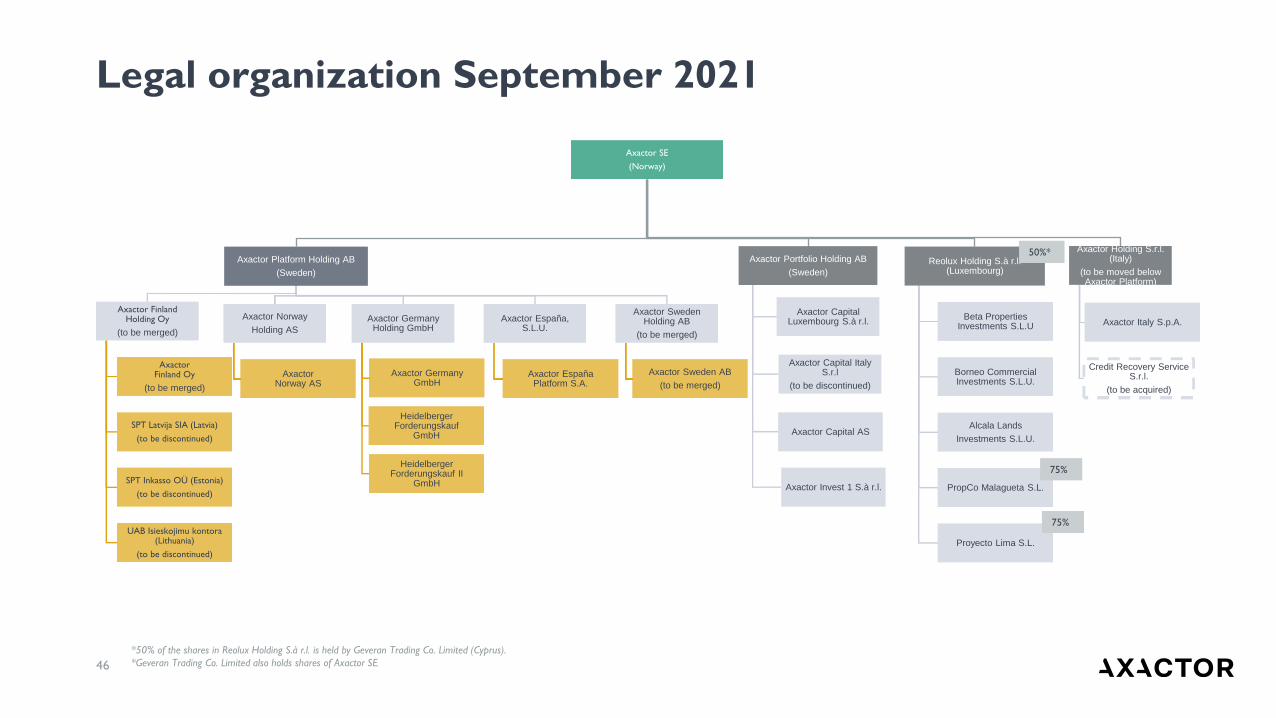
Axactor SE
(Norway)
Axactor Platform Holding AB
(Sweden)
Axactor Finland Holding Oy
(to be merged)
AxactorFinland Oy
(to be merged)
SPT Latvija SIA (Latvia)
(to be discontinued)
SPT Inkasso OÜ (Estonia)
(to be discontinued)
UAB Isieskojimu kontora(Lithuania)
(to be discontinued)
Axactor Norway
Holding AS
AxactorNorway AS
Axactor Germany Holding GmbH
Axactor Germany GmbH
Heidelberger Forderungskauf
GmbH
Heidelberger Forderungskauf II
GmbH
Axactor España, S.L.U.
Axactor EspañaPlatform S.A.
Axactor Sweden Holding AB
(to be merged)
Axactor Sweden AB
(to be merged)
Axactor Portfolio Holding AB
(Sweden)
Axactor Capital Luxembourg S.à r.l.
Axactor Capital Italy S.r.l
(to be discontinued)
Axactor Capital AS
Axactor Invest 1 S.à r.l.
Reolux Holding S.à r.l. (Luxembourg)
Beta Properties Investments S.L.U
Borneo Commercial Investments S.L.U.
Alcala Lands
Investments S.L.U.
PropCo Malagueta S.L.
Proyecto Lima S.L.
Axactor Holding S.r.l. (Italy)
(to be moved below Axactor Platform)
Axactor Italy S.p.A.
Credit Recovery Service S.r.l.
(to be acquired)
75%
75%
50%*
*50% of the shares in Reolux Holding S.à r.l. is held by Geveran Trading Co. Limited (Cyprus).
*Geveran Trading Co. Limited also holds shares of Axactor SE46
Legal organization September 2021

47
Terms and abbreviations
Terms
Active forecast Forecast of estimated remaining collection on NPL portfolios
Cash EBITDA margin Cash EBITDA as a percentage of gross revenue
Contribution margin (%) Total operating expenses (excluding SG&A, IT and corporate cost) as a percentage of total income
Collection performance Collection on own NPL portfolios in relation to active forecast
Equity ratio Total equity as a percentage of total equity and liabilities
Forward flow agreement Agreement for future aquisitions of NPLs at agreed prices and delivery
Gross IRRThe credit adjusted interest rate that makes the net present value of ERC equal to NPL book value, calculated using monthly cash flows over a 180-months period
NPL amortization rate NPL amortization divided by NPL gross revenue
One off portfolio aquisitions Aquisition of a single portfolio of NPLs
Opex Total operating expenses
Recovery rate Portion of the original debt repaid
Replacement capex Aquisitions of new NPLs to keep the same book value of NPLs from last period
SG&A, IT and corporate cost Total operating expenses for overhead functions, such as HR, finance and legal etc
Solution rateAccumulated paid principal amount for the period divided by accumulated collectable principal amount for the period. Usually expressed on a monthly basis
Yield Interest income from purchased NPL portfolios including net gain/(loss) on the NPL portfolios
Abbreviations
3PC Third-Party CollectionAPM Alternative Performance MeasuresARM Accounts Receivable ManagementB2B Business to BusinessB2C Business to ConsumerBoD Board of DirectorsBS Consolidated Statement of Financial Position (Balance Sheet)CF Consolidated Statement of Cash FlowCGU Cash Generating UnitCM1 Contribution MarginD&A Depreciation and AmortizationDopex Direct operating expensesEBIT Operating profit/Earnings before Interest and TaxEBITDA Earnings before Interest, Tax, Depreciation and AmortizationECL Expected Credit LossEPS Earnings Per ShareERC Estimated Remaining CollectionFTE Full Time EquivalentIFRS International Financial Reporting StandardsLTV Loan to valueNCI Non-Controlling InterestsNPL Non-Performing LoanOB Outstanding Balance, the total amount Axactor can collect on claims under management, including outstanding
principal, interest and feesP&L Consolidated Statement of Profit and LossPCI Purchased Credit ImpairedPPA Purchase Price AllocationsREO Real Estate OwnedROE Return on EquitySG&A Selling, General & AdministrativeSPV Special Purpose VehicleVIU Value in UseWACC Weighted Average Cost of CapitalWAEP Weighted Average Exercise Price

axactor.com