
This article appeared in a journal published by Elsevier. The attachedcopy is furnished to the author for internal non-commercial researchand education use, including for instruction at the authors institution
and sharing with colleagues.
Other uses, including reproduction and distribution, or selling orlicensing copies, or posting to personal, institutional or third party
websites are prohibited.
In most cases authors are permitted to post their version of thearticle (e.g. in Word or Tex form) to their personal website orinstitutional repository. Authors requiring further information
regarding Elsevier’s archiving and manuscript policies areencouraged to visit:
http://www.elsevier.com/copyright

Author's personal copy
Landscape and Urban Planning 100 (2011) 278–286
Contents lists available at ScienceDirect
Landscape and Urban Planning
journa l homepage: www.e lsev ier .com/ locate / landurbplan
Investigating alien plant invasion in urban riparian forests in a hot and semi-aridregion
Chan Yong Sunga,∗, Ming-Han Lib, George O. Rogersb, Astrid Volderc, Zhifang Wangb
a Texas Transportation Institute, Texas A&M University, 3135 TAMU, College Station, TX 78743-3135, USAb Department of Landscape Architecture and Urban Planning, Texas A&M University, 3137 TAMU, College Station, TX 78743-3137, USAc Department of Horticultural Sciences, Texas A&M University, 2133 TAMU, College Station, TX 77843-2133, USA
a r t i c l e i n f o
Article history:Received 30 April 2010Received in revised form 8 December 2010Accepted 14 December 2010Available online 3 February 2011
Keywords:Transfer function modelNonmetric multidimensional scalingEcosystem disturbanceDroughtUrban watershed managementEcosystem resistance
a b s t r a c t
In this paper, we examined twelve riparian forests along urban–rural gradients in Austin, TX (USA), onthe relationship among watershed urbanization and the invasion of alien woody species. We assessedthe degree of biological invasion by measuring relative alien cover (RAC) of the riparian forests. We alsomeasured environmental variables (15 in total) that characterize the study forests, including impervioussurface percentage of corresponding watersheds, stream hydrology of adjacent streams, species diversity,canopy gap percentage, and soil nutrient contents of the riparian forests. Stream hydrology was quantifiedby the transfer function model. The results indicate that impervious surface percentage was related tostream hydrology: the more the impervious surface in a watershed, the faster streamflow recedes afterthe storm, and the longer dry period the riparian forest experienced (R2 = 0.722). Impervious surfacepercentage was also related to RAC (R2 = 0.498). Nonmetric multidimensional scaling (NMDS) groupedthe 15 environmental variables into five dimensions. Multiple regression analysis of RAC on the fiveNMDS dimensions shows that RAC was related only to the dimension related to hydrological drought.Based on these results, we concluded that watershed urbanization facilitates the invasion of alien speciesin riparian forests by causing hydrologic drought, particularly in hot and semi-arid regions.
Published by Elsevier B.V.
1. Introduction
Riparian forests are prone to the invasion of alien plantspecies (Stohlgren et al., 1998; Tickner et al., 2001; Zedler andKercher, 2004; Schnitzler et al., 2007). Floods disturb riparianforests mechanically as well as by creating long inundation peri-ods (Hood and Naiman, 2000; Pettit and Froend, 2001). Oncefloods recede, the disturbed forests are readily invaded by alienspecies that can grow faster and are more tolerant to distur-bance than native competitors (Nilsson et al., 1997; Morris et al.,2002; Glenn and Nagler, 2005; Stromberg et al., 2007). Streamchannel further facilitates the dispersal of alien species by trans-porting their propagules from upstream habitats (Moggridge et al.,2009).
Urbanization aggravates this problem. Impervious surface gen-erates more stormwater runoff and reduces groundwater recharge,which alter stream hydrology with severe flood damage dur-ing storm events and drought with longer intermittent periods
∗ Corresponding author. Tel.: +1 979 575 7747.E-mail addresses: [email protected] (C.Y. Sung), [email protected]
(M.-H. Li), [email protected] (G.O. Rogers), [email protected](A. Volder), [email protected] (Z. Wang).
(Leopold, 1968; Hollis, 1975; Rose and Peters, 2001; Groffman et al.,2002, 2003; Burns et al., 2005; Walsh et al., 2005). As a consequence,urban riparian forests become more vulnerable to the invasion ofalien species that may be better able to cope with the fluctuat-ing water levels (Medina, 1990; Moffatt et al., 2004; Maskell et al.,2006).
Previous studies reported that urban riparian forests were moreinvaded by alien species in urban than rural counterparts. King andBuckney (2000) found that elevated nutrient level washed off bystormwater runoff from urban watersheds contributed to biologi-cal invasion of stream and riparian ecosystems in northern Sydney,Australia. Maskell et al. (2006) discussed that increased flood dam-age by stream channelization decreased ecosystem resistance inBirmingham, UK. Some studies attributed the higher biologicalinvasion to urban land use in surrounding areas. Moffatt et al.(2004) and Burton and Samuelson (2008) related urban develop-ment in surrounding areas to riparian invasion. Pennington et al.(2010) also showed that landscape variables, such as developmentdensity and the proximity to railway, are important predictors ofinvasion of riparian forests in Cincinnati, USA. Although these stud-ies addressed different aspects of urbanization, they commonlyidentified hydrological disturbance as an underlying cause thatresults in biological invasion of urban riparian forests. However,only few studies (e.g., Greer and Stow, 2003; Burton et al., 2009)
0169-2046/$ – see front matter. Published by Elsevier B.V.doi:10.1016/j.landurbplan.2010.12.014
Author's personal copy
C.Y. Sung et al. / Landscape and Urban Planning 100 (2011) 278–286 279
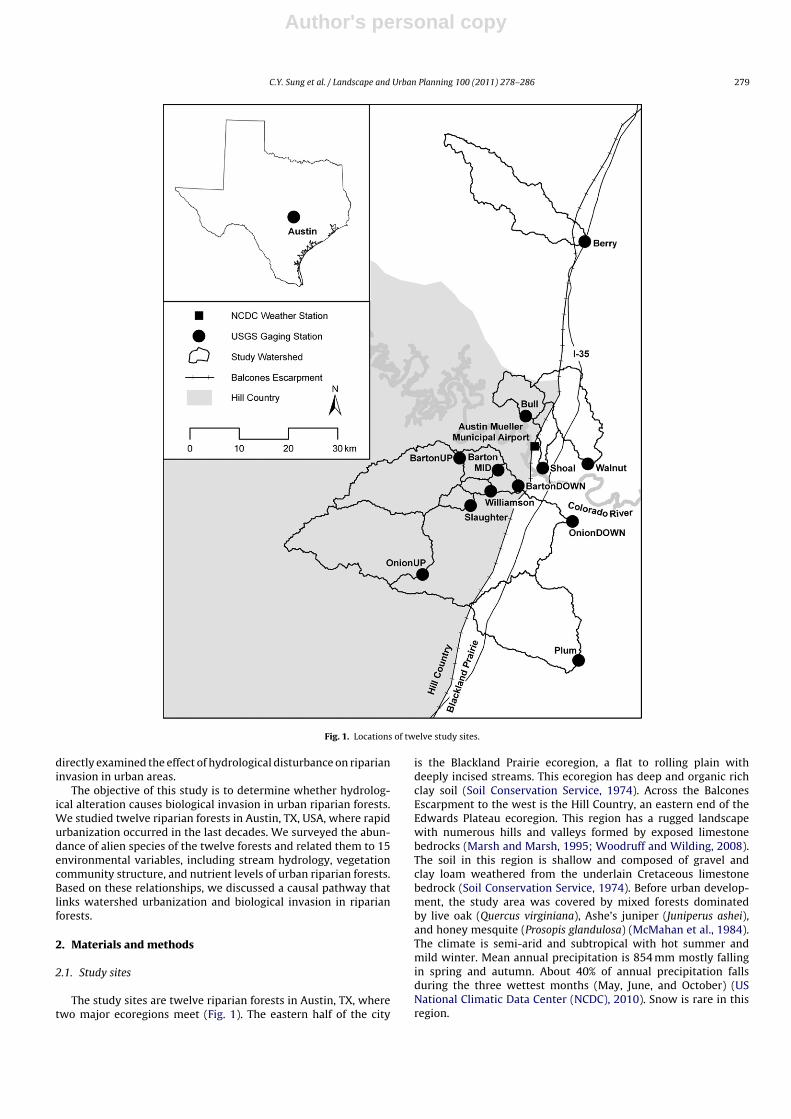
Fig. 1. Locations of twelve study sites.
directly examined the effect of hydrological disturbance on riparianinvasion in urban areas.
The objective of this study is to determine whether hydrolog-ical alteration causes biological invasion in urban riparian forests.We studied twelve riparian forests in Austin, TX, USA, where rapidurbanization occurred in the last decades. We surveyed the abun-dance of alien species of the twelve forests and related them to 15environmental variables, including stream hydrology, vegetationcommunity structure, and nutrient levels of urban riparian forests.Based on these relationships, we discussed a causal pathway thatlinks watershed urbanization and biological invasion in riparianforests.
2. Materials and methods
2.1. Study sites
The study sites are twelve riparian forests in Austin, TX, wheretwo major ecoregions meet (Fig. 1). The eastern half of the city
is the Blackland Prairie ecoregion, a flat to rolling plain withdeeply incised streams. This ecoregion has deep and organic richclay soil (Soil Conservation Service, 1974). Across the BalconesEscarpment to the west is the Hill Country, an eastern end of theEdwards Plateau ecoregion. This region has a rugged landscapewith numerous hills and valleys formed by exposed limestonebedrocks (Marsh and Marsh, 1995; Woodruff and Wilding, 2008).The soil in this region is shallow and composed of gravel andclay loam weathered from the underlain Cretaceous limestonebedrock (Soil Conservation Service, 1974). Before urban develop-ment, the study area was covered by mixed forests dominatedby live oak (Quercus virginiana), Ashe’s juniper (Juniperus ashei),and honey mesquite (Prosopis glandulosa) (McMahan et al., 1984).The climate is semi-arid and subtropical with hot summer andmild winter. Mean annual precipitation is 854 mm mostly fallingin spring and autumn. About 40% of annual precipitation fallsduring the three wettest months (May, June, and October) (USNational Climatic Data Center (NCDC), 2010). Snow is rare in thisregion.

Author's personal copy
280 C.Y. Sung et al. / Landscape and Urban Planning 100 (2011) 278–286
Fig. 2. Daily hyetograph and hydrograph for four water years (WY) of study period. Daily rainfall depth and daily mean streamflow were measured at Austin MuellerMunicipal Airport and Shoal Creek gaging station (the most urbanized stream), respectively.
Austin is one of the fast growing cities in the United States.Population increased from 466,000 in 1990 to 758,000 in 2008(US Census Bureau, 2009). Many natural areas were converted tourban land uses to serve the growing population. During the sameperiod, impervious surface expanded from 21% to 31%. The EdwardsAquifer, a shallow karst aquifer underneath Austin, experienced asignificant drop in the water level. Pumpage for municipal watersupply and reduced groundwater recharge of stormwater wereattributed to this hydrological drought. In the last decades, seri-ous declines in baseflow were observed in many streams fed by theEdwards Aquifer (Sung and Li, 2010), which raises a concern aboutbiological invasion in riparian forests. Biological invasion in riparianforests may threaten local and regional biodiversity because ripar-ian forests serve as refugees for regionally rare wetland species ina hot and semi-arid region (Aguiar and Ferreira, 2005).
The twelve riparian forests were selected to couple the vegeta-tion survey data with the daily mean streamflow data collected bythe US Geological Survey (USGS). All streams are intermittent. Bar-ton Creek and Onion Creek are monitored by multiple stations. Thetotal number of streams is seven. Five streams are tributaries of theColorado River, while Plum Creek and Berry Creek are tributariesof the Guadalupe River and the Brazos River, respectively.
2.2. Impervious surface estimation
We estimated impervious surface percentages of watershedscorresponding to the twelve study sites using a cloud free Land-sat TM image acquired on February 7, 2008 (path/row: 27/37, level1 terrain corrected). The watersheds were delineated from 1′′ USGSNational Elevation Dataset using Better Assessment Science Inte-grating Point & Non-point Sources (BASINS) (US EnvironmentalProtection Agency, 2006). Previous studies (e.g., Wu and Yuan,2007) recommended a growing season image for impervious sur-face mapping based on the finding that healthy foliage has a distinctspectral profile and can be easily separated from impervious sur-face. In this study, however, we selected the winter image because itcan detect impervious surface under canopies of deciduous trees,and some evergreen trees and shrubs maintain spectral contrastbetween vegetation and impervious surface in winter.
We used support vector machine (SVM) to classify impervi-ous surfaces from the Landsat TM image. SVM has been widelyused for land cover mapping because of its strength in classify-ing pixels mixed with more than one surface material (Burges,1998; Foody and Mathur, 2006). We classified the image into fourland cover classes (impervious surface, forest, grassland, and water-body). For each class, we selected 10 rectangular polygons (four to
ten training pixels per polygon) representing pure pixels of thatclass. The polygons were evenly distributed throughout the studysites. For impervious surface, the training pixels covered diversepavement and rooftop materials. Because these materials havevarying spectral profiles that are not linearly separable from otherland cover classes, we applied the non-linear kernel (the secondorder polynomial kernel) to improve classification accuracy. User-specific parameters of SVM were determined by trial-and-errorso that SVM had the highest classification accuracy. We assessedthe classification accuracies based on binary impervious surfacemaps, i.e., three non-impervious surface classes were combined.To assess classification accuracy, we collected 58 validation pix-els. Initially, we selected 300 pixels randomly from the Landsat TMimage and digitized impervious surfaces on-screen over the 2008aerial photographs (0.5 m in spatial resolution), but only 29 pixelshave impervious surface greater than 50% of the pixel’s instanta-neous field of view. Hence, we randomly selected 29 pixels from theremaining 271 non-impervious surface pixels. ENVI 4.5 was usedfor the image classifications (ITT VIS, 2008).
2.3. Quantifying stream hydrology
We quantified stream hydrology using TF model that describesthe dynamic relationship between rainfall and streamflow in awatershed–stream system. We estimated parameters of the TFmodels with daily rainfall and daily mean streamflow for fourwater years (WY) between October 2004 and September 2008.The daily rainfall data were obtained from the weather station atAustin Mueller Municipal Airport (NCDC COOP ID: 410428) locatedapproximately at the center of the study sites. Although there wereother weather stations near some of the stream gaging stations,we did not use the data from those stations because they did notmeasure the rainfall from midnight to midnight (e.g., the Morganweather station, the one near Plum Creek, read the rain gage at8 am every day). The mean annual precipitation during the four WYstudy period was 863 mm, which is similar to the long term average(854 mm). Fig. 2 illustrates the daily hyetograph and hydrograph forShoal Creek (the one near downtown Austin).
The TF model expresses daily mean streamflow as:
Yt = �(B)ı(B)
Xt + Nt, Nt = �(B)�(B)
et (1)
where Yt denotes the mean streamflow at day t in m3/min, Xt is therainfall depth at day t in mm, B is the backshift operator, �(B), ı(B),�(B), and �(B) are the backshift polynomials estimated by Box andJenkins’ (1976) procedure, Nt is unexplained noise at time t, and et is

Author's personal copy
C.Y. Sung et al. / Landscape and Urban Planning 100 (2011) 278–286 281
Table 1Description of variables analyzed in this study.
Variables Description
Invasibility of riparian forestRelative alien cover (RAC, %) (Sum of alien species cover/total species cover) × 100 (Magee et al., 2008)
Watershed characteristicsArea of watershed Delineated using national elevation data (NED) by BASINS (km2)Impervious surface (%) Classified from 2008 Landsat TM image by support vector machine (SVM)
Stream hydrology�0 Scale parameter from TF model (m3/min/mm)ı1 Recession parameter from TF model [(m3/min)/(m3/min)]
Community structureCanopy gap (%) (Lengths not covered by canopy of any woody species/length of transect) × 100Species richness Total number of woody plant species (Magurran, 1988)
Shannon diversity index −∑S
i=1pi ln pi where S = number of species, pi = the relative abundance of species i (Magurran, 1988)
Soil nutrient contentsa
pH –NO3–N (ppm)P (ppm)K (ppm)Ca (ppm)Mg (ppm)S (ppm)Na (ppm)
aAverage concentrations in soil samples taken at two transects.
true white noise. For simplicity, we restricted the model by settingthe orders of polynomial �(B) and ı(B) by 0 and 1, respectively. Thesimplified TF models can be written as:
Yt = �0
1 − ı1BXt + Nt (2)
where �0 is a parameter of the zero order term in the polynomial�(B), and ı1 is a parameter of the first order term in the polynomialı(B). Because daily streamflow rises during a storm event and ulti-mately returns to baseflow, rainfall–streamflow series is stationaryand ı1 must have a value between 0 and 1. Eq. (2) can be expressedas an infinite sum of weighted rainfalls on previous days:
Yt = �0
∑∞
i=0ı1Xt + Nt (3)
A set of parameters of Xt, Xt−1, Xt−2, . . ., Xt−i . . ., in Eq. (3), givenas �0, �0ı1, �0ı2
1, . . . , �0ıi1, . . ., are called the impulse response
function and can be interpreted as the impacts of unit rainfall at dayt on streamflow at day t, t − 1, t − 2, . . ., t − i, . . . Because 0 < ı1 < 1, theimpacts decay exponentially at the rate of ı1. Hence, ı1 is a reces-sion parameter indicating how fast streamflow decays after a storm.�0 is a scale parameter that represents the impact of unit rainfallon the streamflow at day 0. Higher �0 means greater streamflowduring a storm event, and higher ı1 means slower recession ofstreamflow after the storm (Sung and Li, 2010). The TF models wereestimated by the maximum likelihood method using SAS 9.1 (SASInstitute Inc., 2004).
The TF model is conceptually equivalent to physically basedhydrological models. For instance, Jakeman et al. (1990) showedthat the impulse response function has the same hydrologicalmeaning as the unit hydrograph. The TF model has an advan-tage over other hydrological analysis models because it can takeinto account antecedent rainfalls stored in reservoir, soil, andgroundwater layer. The TF models have been successful to predictstreamflow in various time intervals (e.g., Young and Beven, 1994;Mwakalila et al., 2001; Young, 2003).
2.4. Vegetation sampling
We surveyed woody vegetation communities near USGS gagingstations during October 2008 using line intercept method (Caratti,2006). We placed two 30 m line transects parallel to stream bank– the first transect along the stream bank and the second one 5 m
apart from the stream bank. Transects followed the curvature ofthe streamline. We measured lengths of canopies intersecting thetransect lines for all woody vegetation taller than 0.6 m. To ruleout the effect of gaging stations, such as physical damage dur-ing installation and regular maintenance, the transects began at10 m downstream from the station. In the case that the transects
Table 2Woody native and alien species (taller than 0.6 m) found at twelve study sites.
Scientific name Common name Number of siteobserved
Alien speciesLigustrum lucidum Glossy Privet 4Ligustrum sinense Chinese Privet 1Melia azedarach Chinaberrytree 8Triadica sebifera Chinese Tallow 3
Native speciesAcer negundo Boxelder 4Amorpha fruticosa Desert False Indigo 1Carya illinoinensis Pecan 7Celtis laevigata Sugarberry 9Celtis occidentalis Common Hackberry 2Celtis reticulata Netleaf Hackberry 8Cephalanthus occidentalis Common Buttonbush 4Cornus drummondii Roughleaf Dogwood 5Diospyros texana Texas Persimmon 1Eysenhardtia Texana Texas Kidneywood 1Fraxinus pennsylvanica Green Ash 7Fraxinus texensis Texas Ash 4Ilex decidua Possumhaw 4Ilex vomitoria Yaupon 2Juglans major Arizona Walnut 1Juglans nigra Black Walnut 3Juniperus ashei Ashe’s Juniper 1Morus rubra Red Mulberry 4Parkinsonia aculeata Jerusalem thorn 1Platanus occidentalis American Sycamore 5Populus deltoides Eastern Cottonwood 2Quercus macrocarpa Bur Oak 1Quercus shumardii Shumard’s Oak 1Rhus copallina Winged Sumac 2Robinia pseudoacacia Black Locust 2Salix nigra Black Willow 3Sideroxylon lanuginosum Gum Bully 3Taxodium distichum Bald Cypress 1Ulmus Americana American Elm 8Ulmus crassifolia Cedar Elm 8

Author's personal copy
282 C.Y. Sung et al. / Landscape and Urban Planning 100 (2011) 278–286
passed over areas highly disturbed by human activities (e.g., build-ings, trails, street trees, and lawns), we selected an alternativelocation in the following order: (1) across the stream from the gag-ing station, (2) toward the upstream direction at the same side ofthe station, (3) toward the upstream direction across the streamfrom the station. Many of the study sites were narrow linear rem-nant forests encompassed by urban land uses, and the selectedlocations were the only available bank among the four alterna-tives. Thus, we were not able to survey vegetation communitiesin both sides of stream banks and/or along wetland–upland gradi-ent. Nomenclature and native status of species followed the USDANRCS PLANTS database (http://plants.usda.gov). Soil samples weretaken at a depth of 30 cm in the middle of each transect and sent
to the Texas A&M University Soil, Water and Forage Testing Lab-oratory (http://soiltesting.tamu.edu) for analyses of pH, nitrate–N(NO3–N), phosphorus (P), potassium (K), calcium (Ca), magnesium(Mg), sulfur (S), and sodium (Na) concentrations.
2.5. Data analysis
We summarized the vegetation survey data to characterize thevegetation communities of the riparian forests. The abundance ofalien species was estimated by relative alien cover (RAC) (Mageeet al., 2008). Canopy gap percentage, species richness, and Shan-non diversity index were also calculated from the survey datato measure vegetation community structure (Magurran, 1988).
Fig. 3. Impervious surface (in halftone) detected from Landsat TM images (February, 2008) by support vector machine.

Author's personal copy
C.Y. Sung et al. / Landscape and Urban Planning 100 (2011) 278–286 283
Table 3Characteristics of watersheds for the twelve study sites.
USGS ID Site namea Ecoregion Area of watershed (km2) % impervious surface
08158600 Walnut Creek Blackland Prairie 138.4 57.408156800 Shoal Creek Blackland Prairie 33.0 74.108159000 OnionDOWN Creek Blackland Prairieb 838.0 13.108105100 Berry Creek Blackland Prairie 213.9 6.308172400 Plum Creek Blackland Prairie 287.0 7.108154700 Bull Creek Hill Country 58.7 27.608158920 Williamson Creek Hill Country 16.3 31.408158840 Slaughter Creek Hill Country 22.7 10.408155200 BartonUP Creek Hill Country 231.8 6.508155240 BartonMID Creek Hill Country 278.0 8.308155300 BartonDOWN Creek Hill Country 301.6 9.608158700 OnionUP Creek Hill Country 320.2 3.9
a The suffixes, “UP”, “MID”, and “DOWN” represent the relative locations of USGS gaging stations at Barton Creek and Onion Creek.b Watershed lying on two ecoregions.
Ultimately, we measured 15 environmental variables, includingwatershed characteristics, hydrological regimes, vegetation com-munity structures, and soil nutrient contents (Table 1). Preliminaryanalyses showed that there were no significant differences betweenthe first and second transects in RAC, two diversity indices, canopygap percentage, and soil nutrient contents (bootstrap paired com-parison at ˛ = 0.05, n = 12) (Canty and Ripley, 2009). Therefore, wepooled the data of the first and second transects for the rest of theanalyses.
Many environmental variables confound each other, and theyneed to be decorrelated for unbiased estimation of their relation-ships to RAC. We extracted the smaller number of dimensions froma 15-dimensional input space using nonmetric multidimensionalscaling (NMDS) (Everitt, 2005). The distances between the pairsof twelve sites in the input space were used to construct a dis-similarity matrix. To level out different measurement units for theenvironmental variables, they were rescaled from 0 to 1 prior toconstructing the dissimilarity matrix. The number of dimensionsto be extracted was determined based upon stress values – a mea-sure of the overall error not captured by reduced dimensions –calculated by 1-norm Minkowski distance between original andestimated dissimilarities. The varimax method was used to rotatethe dimensions (Everitt, 2005). Once NMDS extracted dimensions,we performed a regression analysis to predict RAC using the NMDSdimensions. Because the sample size is small (n = 12) and sensi-tive to the violation of the normality assumption, all statisticaltests were based upon a bootstrapping procedure (95% confidenceintervals were constructed from 999 resampled datasets). vegan(Oksanen et al., 2009) and boot (Canty and Ripley, 2009) packagesin R were used to conducted NMDS and bootstrapping regressionanalysis, respectively.
3. Results
The vegetation survey of the twelve riparian forests docu-mented thirty-four woody species (Table 2). Dominant nativespecies included Pecan (Carya illinoinensis), Sugarberry (Celtis lae-vigata), Netleaf Hackberry (Celtis reticulata), Green Ash (Fraxinuspennsylvanica), American Elm (Ulmus americana), and Cedar Elm(Ulmus crassifolia). These species were found at more than half ofthe study forests. Of the thirty-four species, four were alien species.Those species were Chinaberry (Melia azedarach), Glossy Privet(Ligustrum lucidum), Chinese Privet (Ligustrum sinense), and ChineseTallow (Triadica sebifera). Of the four alien species, M. azedarach wasthe most widespread in this region. Eight of the twelve sites wereinvaded by M. azedarach.
Fig. 3 illustrates the impervious surface map derived from theLandsat TM image by SVM classification. The classification accu-racy of the map was 79.3% (46 of 58 validation pixels). Because weselected the equal number of validation pixels for impervious andnon-impervious surfaces, classification accuracies were also 79.3%(23 of 29 validation pixels) for both classes. The Shoal Creek water-shed located near downtown Austin had the highest impervioussurface percentage at 74% (Table 3). The Walnut Creek was the sec-ond most urbanized watershed (57%). The watershed with the leastimpervious surface was the OnionUP Creek (4%), the southwestern-most watershed of the study sites. The Berry Creek watershed (6%)and the BartonUP Creek watershed (7%) also had low impervioussurface percentages.
Impervious surface percentage was significantly related to ı1(Fig. 4a). The regression analysis showed the strong negative effectof impervious surface percentage on ı1 (R2 = 0.722), indicating thatas a watershed is increasingly urbanized, streamflow more rapidly
Fig. 4. Bivariate regressions of two parameter estimates of the transfer function (TF) model (ı1 and �0) on impervious surface percentage with 95% bootstrapping confidenceinterval for regression slope (ˇ1) in parenthesis. A solid regression line indicates a statistically significant relationship, while a dotted line represent an insignificant relationshipat ˛ = 0.05.

Author's personal copy
284 C.Y. Sung et al. / Landscape and Urban Planning 100 (2011) 278–286
Table 4Pearson’s correlations between four dimensions extracted by nonmetric multidimensional scaling (NMDS) and 15 environmental variables.
Variables NMDS 1 NMDS2 NMDS3 NMDS4 NMDS5
Area of watershed −0.429 −0.813* 0.174 0.275 0.038% impervious surface 0.332 0.049 −0.832* −0.415 0.095�0 −0.389 −0.857* −0.152 0.113 −0.127ı1 −0.245 −0.015 0.925* 0.018 0.088% canopy gap 0.207 0.219 −0.583* 0.323 0.050Species richness 0.638* −0.344 0.516 −0.394 0.089Shannon diversity Index 0.597* −0.514 0.338 −0.391 −0.144pH 0.745* 0.424 0.236 0.384 0.100NO3–N −0.385 −0.677* −0.180 0.179 0.021P −0.678* −0.088 −0.074 −0.254 0.328K −0.850* 0.202 −0.050 −0.231 0.254Ca 0.829* −0.456 −0.093 0.101 −0.112Mg −0.033 0.249 0.741* 0.042 0.081S 0.041 0.176 0.214 −0.187 −0.673*
Na −0.716* 0.242 0.242 −0.425 0.018
* Significant at ˛ = 0.05.
recedes after a storm. The relationship between impervious surfacepercentage and �0 was not statistically significant (Fig. 4b).
We extracted five NMDS dimensions from the 15 environmen-tal variables (Table 4). The five-dimensional model was selectedbased on stress values that began to stabilize from five-dimensionalmodel. The first dimension (NMDS 1) indicates species diversityand soil nutrient levels of a riparian ecosystem: it was significantlyrelated to species richness, Shannon diversity index, soil pH, P, K, Ca,and Na. The second dimension (NMDS 2) generally represents flowmagnitude: it was significantly related to the area of watershed,�0, and soil N. The third dimension (NMDS 3) can be interpretedas an indicator of hydrological drought. This dimension was sig-nificantly related to ı1, impervious surface percentage, and canopygap percentage (r = −0.583). Two other dimensions did not reflectany distinct environmental characteristics.
Of the five NMDS dimensions, only NMDS 3 – the one rep-resenting hydrological drought – explained the variation of RACof the riparian forest. The result of multiple regression analysisindicates that after controlling the other environmental factors,only NMDS 3 was significantly related to RAC (Table 5). Bivariateregressions between RAC and 15 environmental variables furthershowed that RAC was significantly related to the three variablesthat were grouped into NMDS 3 (ı1, impervious surface percentage,and canopy gap percentage) (Fig. 5).
4. Discussions
We found that RAC was related to impervious surface percent-age, recession parameter ı1, and canopy gap percentage. NMDSshowed these three variables covary with each other. Canopygaps play an important role in biological invasion because oth-erwise alien species would rarely have a chance to establish in
Table 595% bootstrapping confidence intervals (CIs) of regression slopes of relative aliencover (RAC) on five dimensions extracted from nonmetric multidimensional scaling(NMDS) (R2 = 0.764).
NMDS dimensions Parameter estimates 95% CIs
Lower bound(2.5%)
Upper bound(97.5%)
Intercept 0.134 – –NMDS1 0.065 −0.383 0.209NMDS2 0.027 −0.132 0.446NMDS3a −0.221 −0.735 −0.004NMDS4 −0.020 −0.197 1.631NMDS5 0.315 −0.074 0.708
aThe regression slope statistically significant different from 0 at ˛ = 0.05
forest floor (Knapp and Canham, 2000). From these results, wecan conjecture a causal pathway from watershed urbanization tothe invasion of alien species in riparian forests: (1) urbanizationalters stream hydrology of a watershed by lengthening dry peri-ods; (2) the altered hydrologic regime disturbs riparian forests andreduces ecosystem resistance; (3) alien species replace a nativecompetitor within a same regenerating cohort; and (4) after severalgenerations, the riparian forests become dominated by the alieninvaders.
As expected, hydrologic disturbance appears to be an under-lying mechanism of the invasion of riparian forests in the studyarea, but the inferred mechanism differs from what conventionalecohydrological models assert. According to the conventional mod-els, urbanization facilitates biological invasion in riparian forests byintensifying flood damage. However, in the study sites, RAC was notrelated to �0, but to ı1. No significant relationship between RACand �0 is apparently due to the very large effect of the area of thewatershed on �0 that overwhelms other effects. For a more accu-rate analysis of the effect of urbanization on stream hydrology, weinvestigated hydrological change in the study sites during the lasttwo decades when Austin experienced rapid urbanization (Sungand Li, 2010). The result of the longitudinal comparison suggeststhat urbanization did not always increase streamflow during stormevents. Peakflow increased only in the Blackland Prairie region(on average, �0 increased 18%), but decreased in the Hill Countryregion (on average, �0 decreased 23%). Unlike peakflow, baseflowdecreased in both regions. These results indicate that urban streamsin Austin became drier with fewer floods and longer intermittentperiods as a result of watershed urbanization.
Drought in urban riparian forests has been reported in otherregions. Groffman et al. (2003) found that urban riparian forests inBaltimore, USA, had higher soil denitrification potential, or drier soilcondition, than rural ones. Burton et al. (2009) exhibited that water-shed urbanization was related negatively to baseflow in an adjacentstream and positively to flood-intolerant species in riparian forestsin Georgia, USA. Pennington et al. (2010) also reported that low-moisture-requiring species were abundant in urban than ruralriparian forests in Cincinnati, USA. Many native riparian speciesadapt to a mesic environment, and are less likely to survive ina drier condition. Therefore, drought shifted riparian vegetationcompositions to the ones invaded by drought-tolerant alien species.
The effect of drought can be much more serious in a hot andarid or semi-arid climate region where evapotranspiration quicklydepletes moistures in soil. In this region, water is often a limit-ing factor for the plant growth. Groundwater is the sole source ofwater for phreatophytic riparian species, and decline in groundwa-ter level makes a riparian forest less habitable for native riparian

Author's personal copy
C.Y. Sung et al. / Landscape and Urban Planning 100 (2011) 278–286 285
Fig. 5. Bivariate regressions of relative alien cover (RAC) on 15 environmental variables with 95% bootstrapping confidence interval for regression slope (ˇ1) in parenthesis.Y-axis represents RAC in percentage. Solid regression lines indicate statistically significant relationships, while dotted lines represent insignificant relationships at ˛ = 0.05.
species (Snyder and Williams, 2000; Horton and Clark, 2001). Theadverse effect of drought is exemplified by the invasion of Tamarixspp. that rapidly spreads along riparian forests in US southwest.Previous studies revealed that the altered hydrologic regime, par-ticularly by dams that regulate flood in riparian forests, created adrier environment that were favorable to Tamarix spp. over nativeriparian species (Glenn and Nagler, 2005; Stromberg et al., 2007).
The lack of relationship between RAC and the two species diver-sity indices suggests that Elton’s theorem – a theorem stating thatan ecosystem with higher species diversity is more resistant to bio-logical invasion (Elton, 1958) – cannot be applied to urban riparianwoody vegetation community (excluding vegetation shorter than0.6 m). Under severe disturbance regimes, the effect of disturbanceoutweighs the effect of diversity, and allogenic process governs eco-logical succession (Planty-Tabacchi et al., 1995; Stohlgren et al.,1999; von Holle, 2005; Maskell et al., 2006; but see Levine, 2000).In other words, biological invasion was primarily determined bythe disturbance regime, but not by the interspecific competitionbetween native and alien species in riparian forests.
Finally, it is worth noting potential limitations of this study. First,we only surveyed woody vegetation taller than 0.6 m. An under-story community responds more strongly to urbanization thancanopy layer and so may be an early indicator of biological invasionin an urban riparian forest (Pennington et al., 2010). Although oursurvey scheme allowed us to exclude saplings whose establishmentsuccesses were not yet determined, species composition betweensaplings would have provided a more comprehensive under-standing of biological invasion of urban riparian forest. Anotherlimitation that we did not take into account is a source of alienpropagules. All of the alien species found in the study sites wereornamental trees that were widely planted in surrounding urbanareas. Hydrochorous dispersal is the major dispersal route in ripar-ian forests, but alien species can also be dispersed anemochorouslyor vegetatively (Moggridge et al., 2009). More studies are needed
to separate the effects of urbanization on the invasion of riparianforests via different dispersal paths.
5. Conclusion
In this study, we investigated twelve riparian forests in Austin,TX, and found that watershed urbanization increased the inva-sion of alien species in riparian forests. We infer that the changein hydrologic regime with an extended intermittent period madethe riparian forests less suitable for native plants that adapt toa mesic environment and more favorable to disturbance-tolerantalien species.
Our results provide several important implications for urbanplanners and ecosystem managers. First, mechanical removal willnot eliminate alien species from urban riparian forests. An emptyspace created by the removal would be quickly refilled by fastgrowing and disturbance-tolerant alien invaders as long as severedisturbances are continued. This leads to a corollary of the firstimplication: the remedy should come from a watershed-wide man-agerial scheme. Many municipalities have adopted stormwatermanagement schemes, such as low impact development, to mit-igate hydrologic alteration by development. However, the currentmanagement schemes focus mainly on flood control but often over-look hydrologic change in an urban watershed. For instance, adetention/retention basin, the most commonly used stormwaterbest management practice designed to reduce peak discharge byretaining water during storm events, does not necessarily maintaingroundwater level unless they are carefully placed by consider-ing local infiltration capacity. Many of these basins are even linedwith impermeable materials for easy maintenance. The retainedstormwater will quickly evaporate instead of infiltrate, especiallyin hot and semi-arid regions like Austin and aggravate droughtthrough a consequent decrease in the baseflow. We recommendthat urban planners and ecosystem managers take a watershed

Author's personal copy
286 C.Y. Sung et al. / Landscape and Urban Planning 100 (2011) 278–286
scale approach that manages local water cycle to protect riparianforests from the invasion of alien species.
References
Aguiar, F.C., Ferreira, M.T., 2005. Human-disturbed landscapes: effects on composi-tion and integrity of riparian woody vegetation in the Tagus River basin, Portugal.Environ. Conserv. 32, 30–41.
Box, G.E.P., Jenkins, G.M., 1976. Time Series Analysis: Forecasting and Control.Holden-Day, Oakland, CA.
Burges, C.J.C., 1998. A tutorial on support vector machines for pattern recognition.Data Min. Knowl. Discov. 2, 121–167.
Burns, D., Vitvar, T., McDonnell, J., Hassett, J., Duncan, J., Kendall, C., 2005. Effectsof suburban development on runoff generation in the Croton River basin, NewYork, USA. J. Hydrol. 311, 266–281.
Burton, M.L., Samuelson, L.J., 2008. Influence of urbanization on riparian forest diver-sity and structure in the Georgia Piedmont, US. Plant Ecol. 195, 99–115.
Burton, M.L., Samuelson, L.J., Mackenzie, M.D., 2009. Riparian woody plant traitsacross an urban–rural land use gradient and implications for watershed functionwith urbanization. Landscape Urban Plan. 90, 42–55.
Canty, A., Ripley, B., 2009. boot (Version 1.2-41) [Computer Software]. Availablefrom: http://cran.r-project.org/web/packages/boot/boot.pdf.
Caratti, J.F., 2006. Line Intercept (LI). In: Lutes, D.C. (Ed.), FIREMON: Fire EffectsMonitoring and Inventory System. Rocky Mountain Research Station, NaturalResources Research Center, Fort Collins, CO.
Elton, C.S., 1958. The Ecology of Invasions by Animals and Plants. Methuen & Com-pany, London.
Everitt, B., 2005. An R and S-Plus Companion to Multivariate Analysis. Springer,London.
Foody, G.M., Mathur, A., 2006. The use of small training sets containing mixed pixelsfor accurate hard image classification: training on mixed spectral responses forclassification by a SVM. Remote Sens. Environ. 103, 179–189.
Glenn, E.P., Nagler, P.L., 2005. Comparative ecophysiology of Tamarix ramosissimaand native trees in western U.S. riparian zones. J. Arid Environ. 61, 419–446.
Greer, K., Stow, D., 2003. Vegetation type conversion in Los Penasquitos Lagoon, Cal-ifornia: an examination of the role of watershed urbanization. Environ. Manage.31, 489–503.
Groffman, P.M., Bain, D.J., Band, L.E., Belt, K.T., Brush, G.S., Grove, J.M., Pouyat, R.V.,Yesilonis, I.C., Zipperer, W.C., 2003. Down by the riverside: urban riparian ecol-ogy. Front. Ecol. Environ. 1, 315–321.
Groffman, P.M., Boulware, N.J., Zipperer, W.C., Pouyat, R.V., Band, L.E., Colosimo, M.F.,2002. Soil nitrogen cycle processes in urban riparian zones. Environ. Sci. Technol.36, 4547–4552.
Hollis, G.E., 1975. The effect of urbanization on floods of different recurrence interval.Water Resour. Res. 11, 431–435.
Hood, W.G., Naiman, R.J., 2000. Vulnerability of riparian zones to invasion by exoticvascular plants. Plant Ecol. 148, 105–114.
Horton, J.L., Clark, J.L., 2001. Water table decline alters growth and survival of Salixgooddingii and Tamarix chinensis seedlings. Forest Ecol. Manage. 140, 239–247.
ITT VIS, 2008. ENVI (Version 4.5) [Computer Software]. Boulder, CO.Jakeman, A.J., Littlewood, I.G., Whitehead, P.G., 1990. Computation of the instanta-
neous unit hydrograph and identifiable component flows with application totwo small upland catchments. J. Hydrol. 117, 275–300.
Knapp, L.B., Canham, C.D., 2000. Invasion of an old-growth forest in New York byAilanthus altissima: sapling growth and recruitment in canopy gaps. J. TorreyBot. Soc. 127, 307–315.
King, S.A., Buckney, R.T., 2000. Urbanization and exotic plants in northern Sydneystreams. Austral Ecol. 25, 455–461.
Leopold, L.B., 1968. Hydrology for Urban Land Planning-A Guidebook on the Hydro-logic Effects of Urban Land Use. U.S. Department of Interior, Washington, DC.
Levine, J.M., 2000. Species diversity and biological invasions: relating local processto community pattern. Science 288, 852–854.
Magee, T.K., Ringold, P.L., Bollman, M.A., 2008. Alien species importance in nativevegetation along wadeable streams, John Day River basin, Oregon, USA. PlantEcol. 195, 287–307.
Magurran, A.E., 1988. Ecological Diversity and Its Measurement. Princeton Univer-sity Press, Princeton, NJ.
Marsh, W.M., Marsh, N.L., 1995. Hydrogeomorphic considerations in developmentplanning and stormwater management, Central Texas Hill Country, USA. Envi-ron. Manage. 19, 693–702.
Maskell, L.C., Bullock, J.M., Smart, S.M., Thompson, K., Hulme, P.E., 2006. The dis-tribution and habitat associations of non-native plant species in urban riparianhabitats. J. Veg. Sci. 17, 499–508.
McMahan, C.A., Frye, R.G., Brown, K.L., 1984. The Vegetation Types of Texas IncludingCropland, Wildlife Division. Texas Parks and Wildlife Department, Austin, TX.
Medina, A.L., 1990. Possible effects of residential development on streamflow, ripar-ian plant communities, and fisheries on small mountain streams in centralArizona. Forest Ecol. Manage. 33/34, 351–361.
Moffatt, S.F., McLachlan, S.M., Kenkel, N.C., 2004. Impacts of land use on riparianforest along an urban–rural gradient in southern Manitoba. Plant Ecol. 174,119–135.
Moggridge, H.L., Gurnell, A.M., Mountford, J.O., 2009. Propagule input, transportand deposition in riparian environments: the importance of connectivity fordiversity. J. Veg. Sci. 20, 465–474.
Morris, L.L., Walck, J.L., Hidayati, S.N., 2002. Growth and reproduction of the inva-sive Ligustrum sinense and native Forestiera ligustrina (Oleaceae): implicationsfor the invasion and persistence of a nonnative shrub. Int. J. Plant Sci. 163,1001–1010.
Mwakalila, S., Campling, P., Feyen, J., Wyseure, G., Beven, K., 2001. Application of adata-based mechanistic modelling (DBM) approach for predicting runoff gener-ation in semi-arid regions. Hydrol. Process. 15, 2281–2295.
Nilsson, C., Jansson, R., Zinko, U., 1997. Long-term responses of river-margin vege-tation to water-level regulation. Science 276, 798–800.
Oksanen, J., Kindt, R., Legendre, P., O’Hara, B., Simpson, G.L., Solymos, P., Stevens,M.H.H., Wagner, H., 2009. vegan (Version 1.17-2) [Computer Software]. Avail-able from: http://cran.r-project.org/web/packages/vegan/vegan.pdf.
Pennington, D.N., Hansel, J.R., Gorchov, D.L., 2010. Urbanization and riparian forestwoody communities: diversity, composition, and structure within a metropoli-tan landscape. Biol. Conserv. 143, 182–194.
Pettit, N.E., Froend, R.H., 2001. Variability in flood disturbance and the impact onriparian tree recruitment in two contrasting river systems. Wetl. Ecol. Manage.9, 13–25.
Planty-Tabacchi, A.-M., Tabacchi, E., Naiman, R.J., Deferrari, C., Décamps, H., 1995.Invasibility of species-rich communities in riparian zones. Conserv. Biol. 10,598–607.
Rose, S., Peters, N.E., 2001. Effects of urbanization on streamflow in the Atlantaarea (Georgia, USA): a comparative hydrological approach. Hydrol. Process. 15,1441–1457.
SAS Institute Inc., 2004. SAS (Version 9.1) [Computer Software]. Cary, NC.Schnitzler, A., Hale, B.W., Alsum, E.M., 2007. Examining native and exotic species
diversity in European riparian forests. Biol. Conserv. 138, 146–156.Snyder, K.A., Williams, D.G., 2000. Water sources used by riparian trees varies
among stream types on the San Pedro River, Arizona. Agric. Forest Meteorol.105, 227–240.
Soil Conservation Service, 1974. Soil Survey of Travis County, Texas. U.S. Departmentof Agriculture, Washington, DC.
Stohlgren, T.J., Binkley, D., Chong, G.W., Kalkhan, M.A., Schell, L.D., Bull, K.A., Otsuki,Y., Newman, G., Bashkin, M., Son, Y., 1999. Exotic plant species invade hot spotsof native plant diversity. Ecol. Monogr. 69, 25–46.
Stohlgren, T.J., Bull, K.A., Otsuki, Y., Villa, C.A., Lee, M., 1998. Riparian zones as havensfor exotic plant species in the central grasslands. Plant Ecol. 138, 113–125.
Stromberg, J.C., Beauchamp, V.B., Dixon, M.D., Lite, S.J., Paradzick, C., 2007. Impor-tance of low-flow and high-flow characteristics to restoration of riparianvegetation along rivers in arid south-western United States. Freshwater Biol.52, 651–679.
Sung, C.Y., Li, M.-H., 2010. The effect of urbanization on stream hydrology in hillslopewatersheds in central Texas. Hydrol. Process. 24, 3706–3717.
Tickner, D.P., Angold, P.G., Gurnell, A.M., Mountford, J.O., 2001. Riparian plant inva-sions: hydrogeomorphological control and ecological impacts. Prog. Phys. Geog.25, 22–52.
US Census Bureau, 2009. Population Finder: Austin City, Texas.http://factfinder.census.gov (retrieved 15.07.09).
US Environmental Protection Agency, 2006. Better Assessment Science Integrat-ing point & Non-point Sources (BASINS) (Version 3.1) [Computer Software].Washington, DC.
US National Climatic Data Center, 2010. Normal Monthly Precipitation.http://lwf.ncdc.noaa.gov/oa/climate/online/ccd/nrmlprcp.html (Retrieved23.11.2010).
von Holle, B., 2005. Biotic resistance to invader establishment of a southernAppalachian plant community is determined by environmental conditions. J.Ecol. 93, 16–26.
Walsh, C.J., Roy, A.H., Feminella, J.W., Cottingham, P.D., Groffman, P.M., Morgan II,R.P., 2005. The urban stream syndrome: current knowledge and the search fora cure. J. N. Am. Benthol. Soc. 24, 706–723.
Woodruff Jr., C.M., Wilding, L.P., 2008. Bedrock, soils, and hillslope hydrology in theCentral Texas Hill Country, USA: implications on environmental managementin a carbonate-rock terrain. Environ. Geol. 55, 605–618.
Wu, C., Yuan, F., 2007. Seasonal sensitivity analysis of impervious surface estimationwith satellite imagery. Photogramm. Eng. Remote Sens. 73, 1393–1401.
Young, P., 2003. Top-down and data-based mechanistic modelling of rainfall-flowdynamics at the catchment scale. Hydrol. Process. 17, 2195–2217.
Young, P.C., Beven, K.J., 1994. Data-based mechanistic modelling and the rainfall-flow non-linearity. Environmetrics 5, 335–363.
Zedler, J.B., Kercher, S., 2004. Causes and consequences of invasive plants in wet-lands: opportunities, opportunists, and outcomes. CRC Crit. Rev. Plant Sci. 23,431–452.


