Atmospheric Organic Aerosol: More Than Primary Emissions
Brent J. Williams
Raymond R. Tucker ICARES Career-Development Assistant ProfessorWashington University in St. Louis
Department of Energy, Environmental, & Chemical Engineering
PI: Atmospheric Chemistry & Technology (ACT) Laboratory
Mumbai: December 7, 2012

2 main questions to discuss today:
1) Why do we care?
2) Where does it come from?
Organic Aerosol

Why Do We Care: Size-dependent Health Effects
[NARSTO, 2003]
Course aerosols deposit by impaction in nose and throat.
Ultrafine aerosol deposit by diffusion deeper in lungs in smaller pathways.
Fine aerosol has a minimum in deposition efficiency at approximately 0.5 micron diameter.
Many organic species in Fine PM are classified as toxins, mutagens, and carcinogens.

IPCC-Climate Change, 2007
Radiative forcing components
Why Do We Care: Climate Effects
Changes since 1750 (preindustrial)
Not accounting for many aerosol indirect effects.

IPCC-Climate Change, 2007
• Sulfate• Primary Organic Carbon from Fossil Fuels • Black Carbon from Fossil Fuels• Biomass burning• Nitrate• Mineral Dust

IPCC-Climate Change, 2007
• Sulfate• Primary Organic Carbon from Fossil Fuels • Black Carbon from Fossil Fuels• Biomass burning• Nitrate• Mineral Dust
Not Accounting for Secondary Organic Aerosol (SOA). Is there
enough SOA to make a difference?

2 main questions to discuss today:
1) Why do we care?
2) Where does it come from?
-primary vs. secondary
Organic Aerosol

Organic Aerosol is Most Abundant Fine PM Component Globally
Zhang et al., 2007organics sulfate nitrate ammonium

Organics44%
Sulfate32%
Ammonium13%
Nitrate10%
Chloride1%
• Northern Hemisphere Average (37 studies)• More Summer data than Winter • Non-Refractory Only (doesn’t include metals and elemental carbon)• Sulfate and Nitrate are formed through secondary processes• Organics previously thought of as mostly primary emissions, but that view has changed.
Major Atmospheric Species (fine PM)
Zhang et al., Geophys Res Lett, 2007

Sources of Atmospheric Aerosols
Meng et al. 1997, Science, 277, 116.
aerosol

ORIGINS OF ATMOSPHERIC AEROSOL
Soil/dust/Sea salt
Combustion

Atmospheric Organic Matter:Oxidation state and carbon numbers
oleicacid
ethane
acetaldehydephenanthrene
sucrose levoglucosan
sesquiterpene monoterpene isoprene
C5 tetrol
CH2O
glyoxalglyoxaldimer
oxalicacid
pinonic
pinic
C8triacid
butaneoctane
toluene
CH4
CO2
CO
MVK
methylglyoxal
fulvicacid
dodecane CH3OH
elementalcarbon
Ox. State ≈ 2 (O/C) – (H/C)
Kroll, Nature Chemistry, 2011.
C40

Chemical complexity of atmospheric organics
carbonyls, alcohols, acids only
Ox. State ≈ 2 (O/C) – (H/C) C40
Ambient Mass Concentrations Decrease
Kroll, Nature Chemistry, 2011.

Oxidation state of organic aerosol
Organic aerosol is an intermediate in the oxidationof most organics to CO2
CO2
CO
C40
Kroll, Nature Chemistry, 2011.
Organic Aerosol
gas
particle
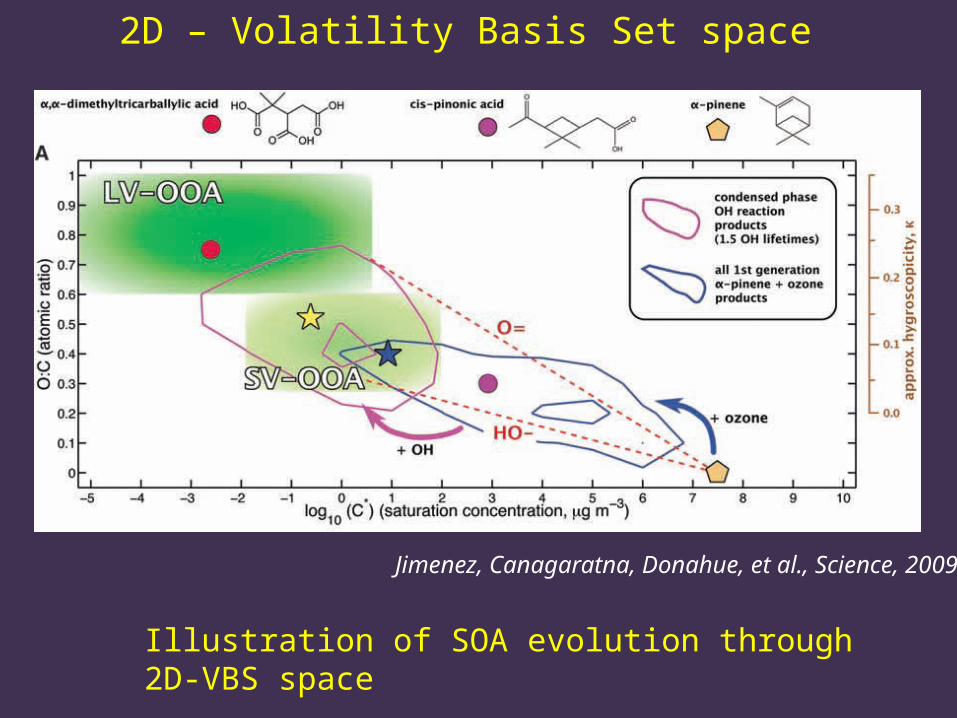
Jimenez, Canagaratna, Donahue, et al., Science, 2009
2D – Volatility Basis Set space
Illustration of SOA evolution through 2D-VBS space

Secondary Organic Aerosol (SOA) Formation: Example
- 10 days of measurements from thermal desorption aerosol gas chromatograph (TAG)- PAR = visible light
Naphthalene: C10H8 (mostly in Gas-phase)Phthalic acid: C8H6O4 (In both Gas- and Particle-phase)
Williams et al., PNAS, 2010
Fractional Time Of Day
Na
ph
tha
len
e (
ng
m-3
)
0.0
0.1
0.2
0.3
0.4
0.5
0.6
0.7
0.8
0.9
1.0
0
20
40
60
80
0.0
0.1
0.2
0.3
0.4
0.5
0.6
0.7
0.8
0.9
1.0
0
20
40
60
80
Ph
tha
lic
Ac
id (
ng
m-3
)
0
500
1000
1500
PA
R (
um
ole
s m
-2 s
-1)
Par
ticle
-Pha
se C
once
ntra
tions
Jimenez et al, Science, 2009
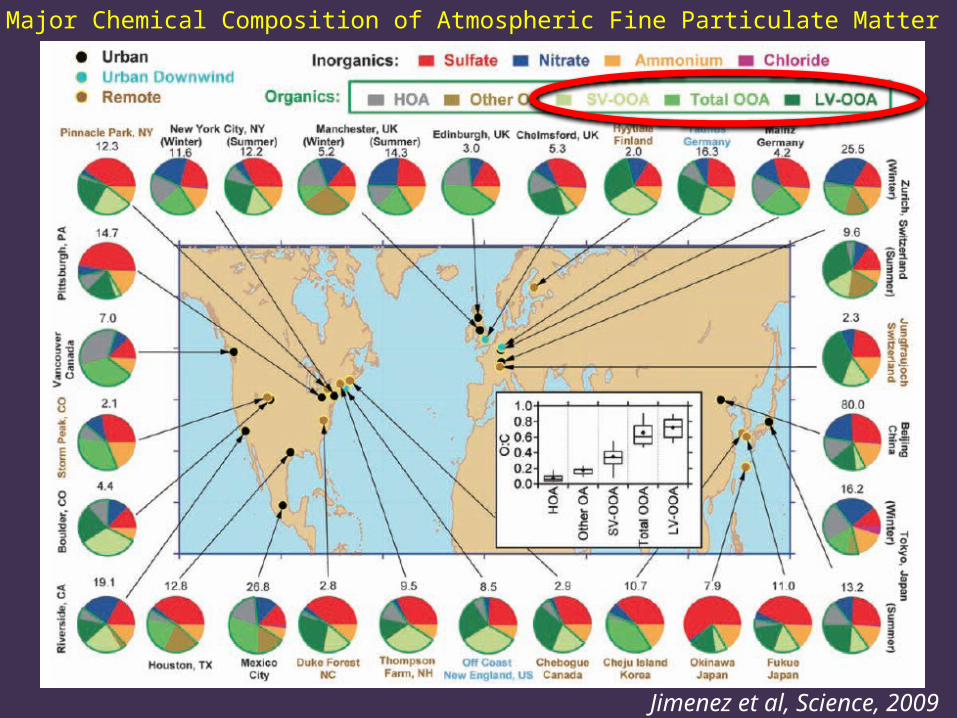
Major Chemical Composition of Atmospheric Fine Particulate Matter

Primary vs Secondary Organic Aerosol (OA)
Zhang et al., Geophys Res Lett, 2007
Effects of organic gases and organic particles can NOT be thought of as separate issues.
Secondary OA > Primary OA

Observed SOA > modeled SOALack in our fundamental knowledge of SOA formation and transformation.At least partially due to lack of measurements for semivolatile compounds.
Volkamer et al., Geophys Res Lett, 2006.
Major discrepancy between measured and modeled SOA

Organics make up 20-90% of fine particle mass and contain tens of thousands of compounds that can be used to determine sources and transformations (much is Secondary).
What we need to know about atmospheric organic matter:
-Physical Properties of Particles
-Chemical Properties-composition and concentrations (gases and particles)-composition transformations as air masses age
-Want to determine all sources and fate of atmospheric gases and particles.
-What effects do these particles and gases have on the environment?
-What can be done about it? (Policy and Management)

Organics44%
Sulfate32%
Ammonium13%
Nitrate10%
Chloride1%
• Northern Hemisphere Average (37 studies)• More Summer data than Winter • Non-Refractory Only (doesn’t include metals and elemental carbon)
General Speciation: AMS Speciation (PM1)
Zhang et al., Geophys Res Lett, 2007

Organics44%
Sulfate32%
Ammonium13%
Nitrate10%
Chloride1%
Low Volatility Oxygenated Organic Aerosol (LV-OOA)
x%
y%
z%Semivolatile OOA (SV-OOA)
Hydrocarbon-like OA (HOA)
• x, y, z% varies (x > y > z in urban locations, z > y > x in remote locations)• Can also provide estimate of Biomass OA, but some interference exists• Still lacks specifics on sources of OA • Specifics are crucial for Regulation and Modeling Efforts
More Specific: AMS Speciation (w/ PMF of OA)

TAG
Thermal Desorption Aerosol Gas Chromatograph (TAG)
An in-situ instrument used to study the Sources and Transformation of Organic Particulate Matter
Hourly measurements of organic aerosol molecular composition
Williams et al., Aerosol Sci Technol, 2006
More Specific Yet: TAG

1. Collection technique:– Inertial Impaction (300C)
2. Sample transfer:– Thermal Desorption (50-3000C)
3. Chemical separation:– Gas Chromatography
4. Compound identification and quantification:– Electron Impact Mass Spectrometry
Gas Chromatograph
MassSpectrometer
Heated valve
Aerosol Collector &
Thermal Desorption Cell
Cyclone Precut(PM2.5)
Humidifier(adhesion)
Filter (field blank)
x
1
2
34
Note: many particles will be internally mixed.
Factor Analysisto group compounds

15.00 20.00 25.00 30.00 35.00 40.00 45.000
500000
1000000
1500000
2000000
2500000
3000000
3500000
4000000
4500000
5000000
Time-->
Abundance
TIC: 33702-12.DTIC: 33702-13.D (*)
Various forms of Petroleum Combustion
Coffee
Residential Wood Combustion
Plant WaxesRela
tive
Abun
danc
e
Retention Time
Secondary Organic Aerosol
• Organic portion (20-90% of total mass) is helpful in determining and understanding:- Particle sources- Particle formation processes- Particle transformations
Williams et al., Aerosol Sci Technol, 2006

Organics44%
Sulfate32%
Ammonium13%
Nitrate10%
Chloride1%
• Example Sources• Positive Matrix Factorization of Molecular Marker Compounds• Multivariate fit of TAG PMF factors to total OA from AMS
Primary Vehicle EmissionsFood Cooking
Plant Waxes
Biomass Burning:Softwood
Biomass Burning:Hardwood
Pesticides
Pharmaceuticals
Anthropogenic Secondary Organic Aerosol (SOA)
Biogenic SOA: Isoprene SOA
Biogenic SOA: Terpene SOA
More Specific Yet: TAG Speciation(scaling to AMS OA mass)
Plasticizers
Further Aged Anthro-SOA

Los Angeles Riverside
N
80 km
San Diego
135 km
PM2.5 Gridded Emissions (short tons/ozone season day/grid cell)
Williams et al., Atmos Chem Phys Discuss, 2010
Example TAG Field Study:Study of Organic Aerosol at Riverside (SOAR)
• Use hundreds of TAG compound timelines in Positive Matrix Factorization (PMF)• Determine major OA components (sources)• Scale TAG factors to AMS OA mass
0.0
0.2
0.4
0.6
0.8
1.0
Ph
th
alic A
cid
No
rh
op
an
e
21
0
211
21
2
21
3
21
4
21
5
21
6
21
7
21
8
21
9
22
0
22
1
0.0
0.2
0.4
0.6
0.8
1.0
7/2
9/2
00
5
7/3
0/2
00
5
7/3
1/2
00
5
8/0
1/2
00
5
8/0
2/2
00
5
8/0
3/2
00
5
8/0
4/2
00
5
8/0
5/2
00
5
8/0
6/2
00
5
8/0
7/2
00
5
8/0
8/2
00
5
8/0
9/2
00
5Veh
icle
Mar
ker
SO
A M
arke
r
TAG’s 1-hour time resolution provides diurnal trends

Main methods to determine particle sources:
Chemical Mass Balance:
Factor Analysis (e.g., Positive Matrix Factorization):
cik= concentration of chemical species i in the fine particles at receptor site kaij = relative concentration of species i in the fine particle emissions from source jsjk = increment to total fine PM concentration at receptor site k originating from source jm= # of source types
Schauer and Cass, ES&T, 2000
Ulbrich et al., Atm Chem Phys, 2009
X = concentration of chemical speciesG = Factor Profile F = Factor Time SeriesE = Residualsp = Factor#s = estimated errors (uncertainty)Q = quality of fit parameter
G and F are determined by minimizing sum of least squares between residuals and errors:
302010
0
x10
-3
nona
deca
nehe
neic
osan
edo
cosa
netr
icos
ane
tetr
acos
ane
pent
acos
ane
hexa
cosa
nehe
ptac
osan
eoc
taco
sane
nona
cosa
netr
iaco
ntan
ehe
ntria
cont
ane
4-m
ethy
loct
adec
ane
2-m
ethy
loct
adec
ane
3-m
ethy
loct
adec
ane
pent
adec
ene
anth
race
neflu
oran
then
eac
ephe
nant
hryl
ene
pyre
nebe
nzo(
b)flu
oren
ebe
nz(d
,e)a
nthr
acen
ebe
nzo(
a)an
thra
cene
cycl
open
ta(c
,d)p
yren
ech
ryse
nedi
met
hyl(p
hena
nthr
enes
+an
thra
cene
s)1-
met
hylp
hena
nthr
ene
2-m
ethy
lant
hrac
ene
1-m
ethy
lpyr
ene
2-m
ethy
lpyr
ene
rete
nesi
mon
ellit
eis
opro
pyl-d
imet
hylp
hena
nthr
ene
rimue
neno
rhop
ane
hopa
nete
trad
ecyl
cycl
ohex
ane
pent
adec
ylcy
cloh
exan
ehe
xade
cylc
yclo
hexa
nehe
ptad
ecyl
cycl
ohex
ane
octa
decy
lcyc
lohe
xane
nona
decy
lcyc
lohe
xane
eico
sylc
yclo
hexa
nem
ethy
ldia
man
tane
met
hylo
xaad
aman
tane
dode
cano
ic a
cid
tetr
adec
anoi
c ac
idhe
xade
cano
ic a
cid
octa
deca
noic
aci
dol
eic
acid
phth
alic
aci
d3-
met
hylp
htha
lic a
cid
4-m
ethy
lpht
halic
aci
d1,
8-na
phth
alic
anhy
drid
ebe
nzyl
buty
lpht
hala
tebi
s(2-
ethy
lhex
yl)p
htha
late
dioc
tylp
htha
late
dino
nylp
htha
late
dihy
dro-
5-et
hyl-2
(3H
)fur
anon
edi
hydr
o-5-
decy
l-2(3
H)f
uran
one
dihy
dro-
5-un
decy
l-2(3
H)f
uran
one
dihy
dro-
5-do
decy
l-2(3
H)f
uran
one
dihy
dro-
5-tr
idec
yl-2
(3H
)fur
anon
edi
met
hylis
oben
zofu
rand
ione
naph
thof
uran
dion
em
ethy
lfura
none
nona
nal
levo
gluc
osen
one
anth
raqu
inon
e2-
hept
adec
anon
eoc
tade
cano
ned-
dode
cala
cton
ed-
tetr
adec
alac
tone
unde
cane
dion
edo
deca
nedi
one
sabi
na k
eton
epe
ntyl
cycl
ohex
anon
edi
oxas
piro
nona
nedi
one
diox
aspi
roun
deca
none
diph
enyl
-eth
aned
ione
dim
etho
xydi
phen
yl-e
than
one
xant
hone
cycl
open
ta(d
,e,f)
phen
anth
reno
neho
mom
enth
ylsa
licyl
ate
hexa
deca
noic
aci
d-m
ethy
lest
eris
opro
pylp
alm
itate
dehy
droa
biet
ic a
cid-
met
hyle
ster
hexa
nedi
oic
acid
-bis
ethy
lhex
yles
ter
oxod
ehyd
roab
ietic
aci
d-m
ethy
lest
erte
rphe
nyl
met
hylb
isph
enyl
met
hyl-b
enze
neva
nilli
nlim
onen
ep-
cym
enen
ea-
phel
land
rene
d-3-
care
neci
s-a-
bisa
bole
ned-
cadi
nene
nora
biet
atet
raen
e m
ixno
rabi
eta-
4,8,
11,1
3-te
trae
neeu
pato
rioch
rom
ene
ence
calin
hexa
deca
neni
trile
octa
deca
neni
trile
tert
-but
ylna
phth
alen
edic
arbo
nitr
iledi
met
hylb
utyl
phen
yl-b
enze
nedi
amin
edi
phen
ylam
ine
4-ni
trop
heno
lm
ethy
lnitr
ophe
nol
di-t
ert-
buty
lnitr
ophe
nol
phth
alim
ide
nitr
ophe
nylb
enze
nam
ine
peno
xalin
ein
dolo
quin
olin
em
etho
xyph
enyl
met
hyle
ne-b
enze
nam
ine
met
hoxy
pyrid
ine
pelle
tierin
ebu
tylb
enze
nesu
lfona
mid
ech
loro
thal
onil
chlo
roph
osph
atep
ropa
nol
bis-
1,3-
chlo
ropr
opyl
phos
phat
eet
hylm
ethy
lfura
nm
onop
alm
itin
mon
oste
arin
nonv
ol-5
7ox
-non
vol-4
3C
wax
2010
0
x10
-3
302010
0
x10
-3
40
20
0
x10
-3
2010
0
x10
-3
2010
0
x10
-3
4020
0
x10
-3
302010
0
x10
-3
302010
0
x10
-3
Co
ntr
ibu
tio
n t
o F
ac
tor
(ea
ch
fa
cto
r p
rofi
le s
um
s t
o 1
)
SO
A1
SO
A2
SO
A3
SO
A4
+S
VR
PA
LVF
CB
BB
io
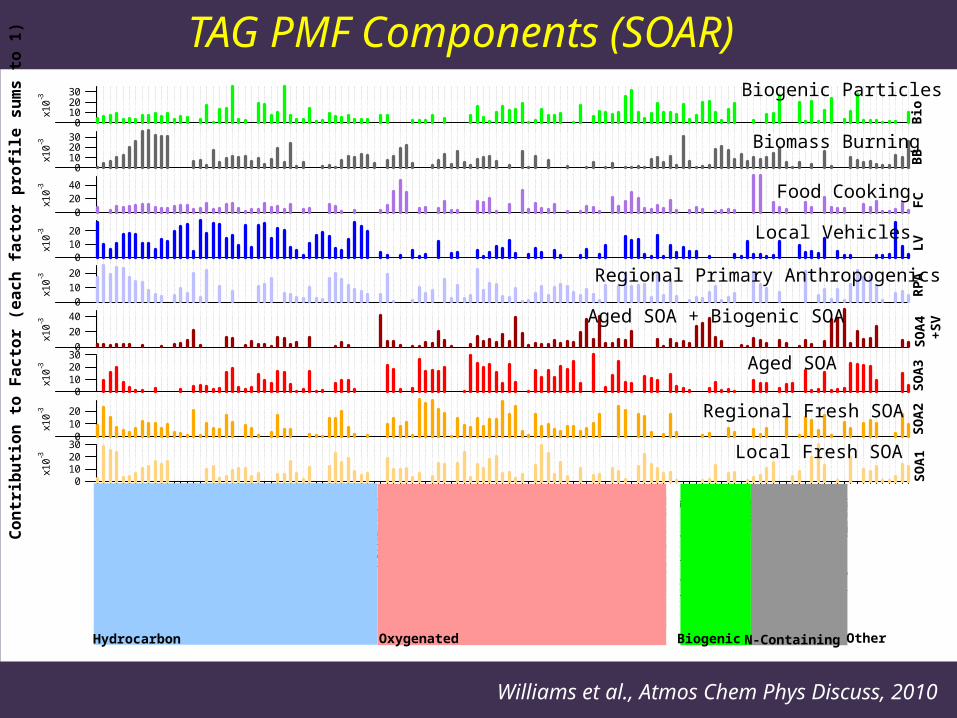
Hydrocarbon Oxygenated Biogenic N-Containing Other
Williams et al., Atmos Chem Phys Discuss, 2010
TAG PMF Components (SOAR)Biogenic Particles
Biomass Burning
Food Cooking
Local Vehicles
Regional Primary Anthropogenics
Aged SOA + Biogenic SOA
Aged SOA
Regional Fresh SOA
Local Fresh SOA

5
10
15N
S
W E
SOA
Supporting Information
Local Meteorology Backward Trajectory Modeling Correlations
RHTemp
O3
COOC/EC
gas-phase organics
AMS species
ATOFMS (single particles)
Etc.

8.0
6.8 mg m-3
8.6
10.0
13.0
11.610.7
10.1
11.7
8.0
5.3
9.5
0:002:00
4:00
6:00
8:00
10:0012:00
14:00
16:00
18:00
20:00
22:00
SOA1SOA2SOA3
SOA4+SemivolatileRegional Primary AnthropogenicLocal Vehicle
Food CookingBiomass BurningPrimary BiogenicMeasured OA
Williams et al., Atmos Chem Phys Discuss, 2010
TAG PMF Components (summer)
SOA1 = Local Fresh SOA
SOA2 = Regional Fresh SOA
SOA3 = Aged SOA
SOA4 = Aged SOA + Biogenic SOA
SOA~70% of fine OAImmediately downwind of large urban area
Previous Studies: SOA~20-50% of fine OA
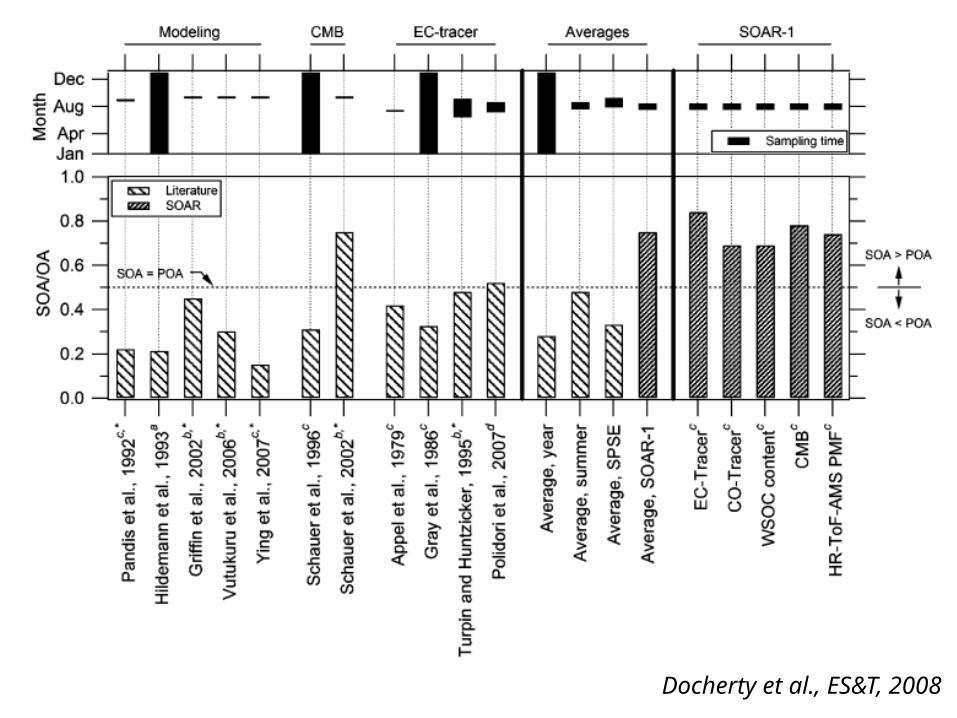
Docherty et al., ES&T, 2008

Spracklen et al., ACPD, 2011
What Models are still missing


