1 This work is licensed under a Creative Commons Attribution-ShareAlike 4.0 International License.
Atmospheric Measurements Learning Module
Temperature is a measure of the average speed of all the molecules in a substance (solid,
liquid, or a gas) 1. Air temperature is measured with a thermometer. A thermometer is a
glass tube with a narrow inner column filled with a liquid. As the temperature rises, the liquid
inside is heated and expands toward the top of the column. It stops rising when it is the same
temperature as the surrounding air that is being measured. A thermometer is read using the
scale on the outside of the column, which tells us the temperature in degrees Fahrenheit
(oF), Celsius (oC), or Kelvin (K). Watch the following videos to learn more about measuring
temperature!
Measuring Temperature (7:54)
Reading a Thermometer (1:34)
Measuring Temperature
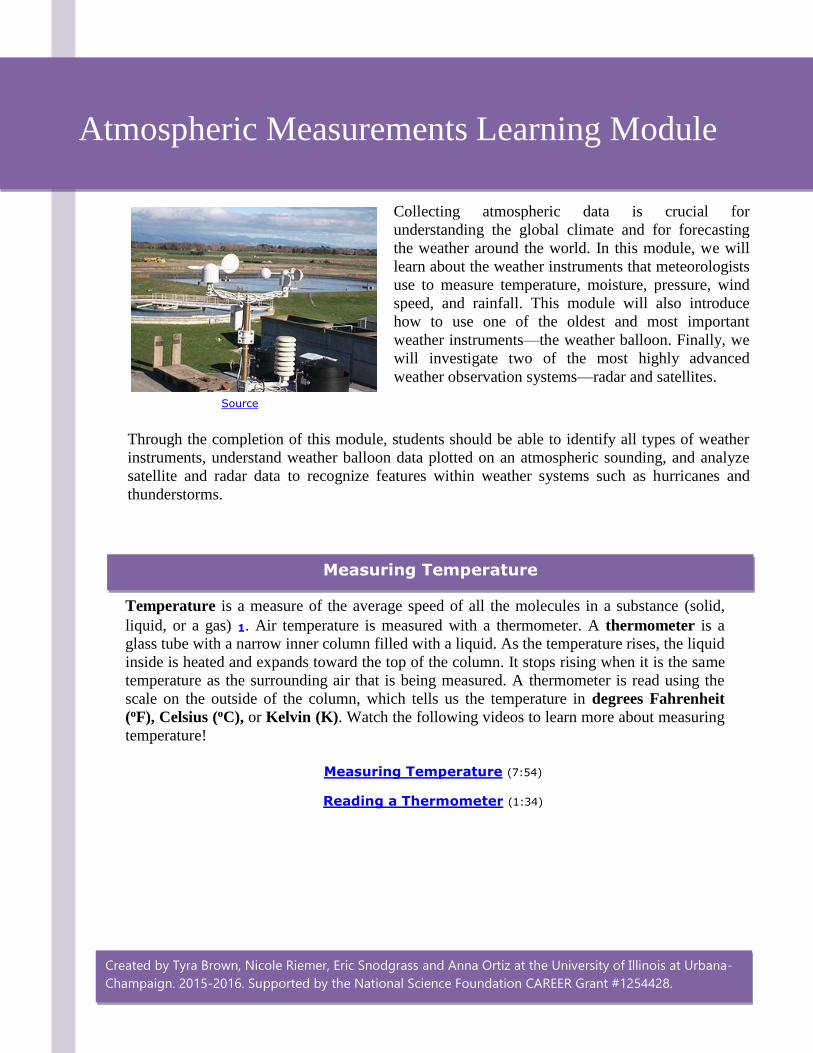
Collecting atmospheric data is crucial for
understanding the global climate and for forecasting
the weather around the world. In this module, we will
learn about the weather instruments that meteorologists
use to measure temperature, moisture, pressure, wind
speed, and rainfall. This module will also introduce
how to use one of the oldest and most important
weather instruments—the weather balloon. Finally, we
will investigate two of the most highly advanced
weather observation systems—radar and satellites.
Through the completion of this module, students should be able to identify all types of weather
instruments, understand weather balloon data plotted on an atmospheric sounding, and analyze
satellite and radar data to recognize features within weather systems such as hurricanes and
thunderstorms.
Source
Created by Tyra Brown, Nicole Riemer, Eric Snodgrass and Anna Ortiz at the University of Illinois at Urbana-
Champaign. 2015-2016. Supported by the National Science Foundation CAREER Grant #1254428.

2 This work is licensed under a Creative Commons Attribution-ShareAlike 4.0 International License.
Figure 1. Temperature Scales
Source
Measuring Moisture
Measuring water vapor and its concentration in the atmosphere is crucial for us to understand
severe weather potential. To estimate the amount of water vapor, meteorologists use an
instrument called a hygrometer. There are different types of hygrometers. The first was the hair
hygrometer which uses human hair that is stretched between two clips connected to a lever and is
connected to a marker that runs up and down on a cylinder to measure changes in relative
humidity.
Measuring Moisture using Hygrometers (0 – 3:00)
Figure 2. Hair Hygrometer
Source
3 This work is licensed under a Creative Commons Attribution-ShareAlike 4.0 International License.
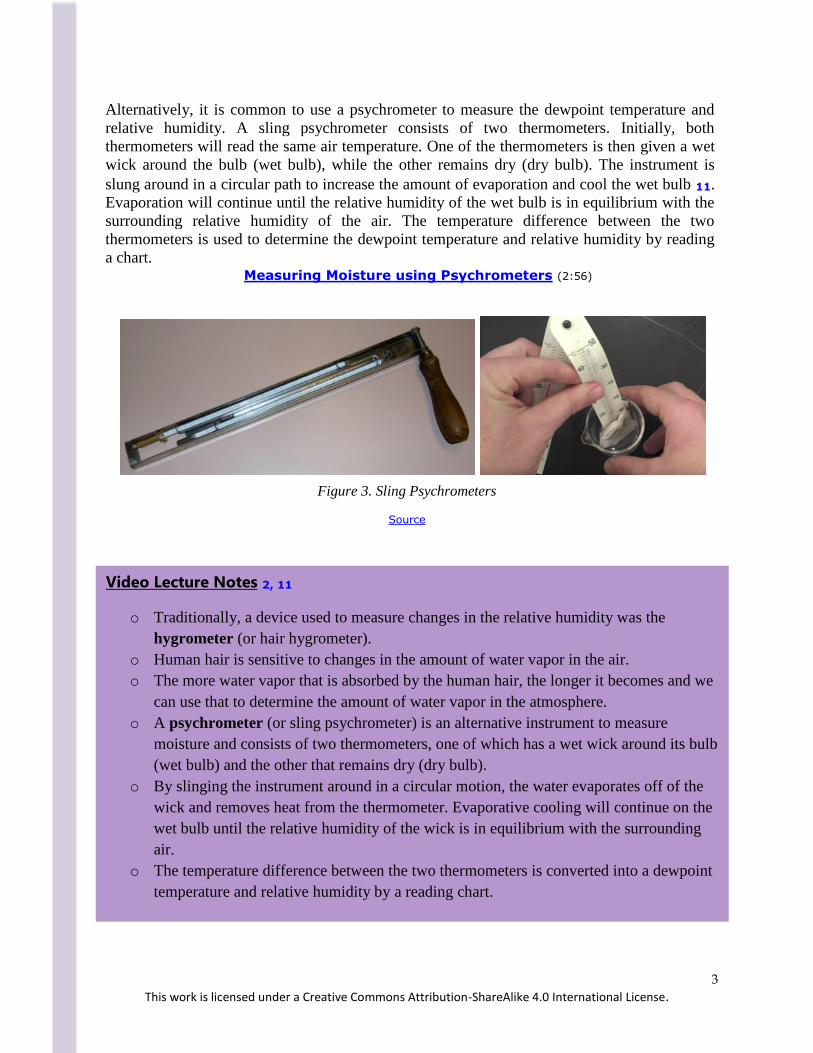
Alternatively, it is common to use a psychrometer to measure the dewpoint temperature and
relative humidity. A sling psychrometer consists of two thermometers. Initially, both
thermometers will read the same air temperature. One of the thermometers is then given a wet
wick around the bulb (wet bulb), while the other remains dry (dry bulb). The instrument is
slung around in a circular path to increase the amount of evaporation and cool the wet bulb 11.
Evaporation will continue until the relative humidity of the wet bulb is in equilibrium with the
surrounding relative humidity of the air. The temperature difference between the two
thermometers is used to determine the dewpoint temperature and relative humidity by reading
a chart. Measuring Moisture using Psychrometers (2:56)
Figure 3. Sling Psychrometers
Source
Video Lecture Notes 2, 11
o Traditionally, a device used to measure changes in the relative humidity was the
hygrometer (or hair hygrometer).
o Human hair is sensitive to changes in the amount of water vapor in the air.
o The more water vapor that is absorbed by the human hair, the longer it becomes and we
can use that to determine the amount of water vapor in the atmosphere.
o A psychrometer (or sling psychrometer) is an alternative instrument to measure
moisture and consists of two thermometers, one of which has a wet wick around its bulb
(wet bulb) and the other that remains dry (dry bulb).
o By slinging the instrument around in a circular motion, the water evaporates off of the
wick and removes heat from the thermometer. Evaporative cooling will continue on the
wet bulb until the relative humidity of the wick is in equilibrium with the surrounding
air.
o The temperature difference between the two thermometers is converted into a dewpoint
temperature and relative humidity by a reading chart.
4 This work is licensed under a Creative Commons Attribution-ShareAlike 4.0 International License.
Measuring Pressure
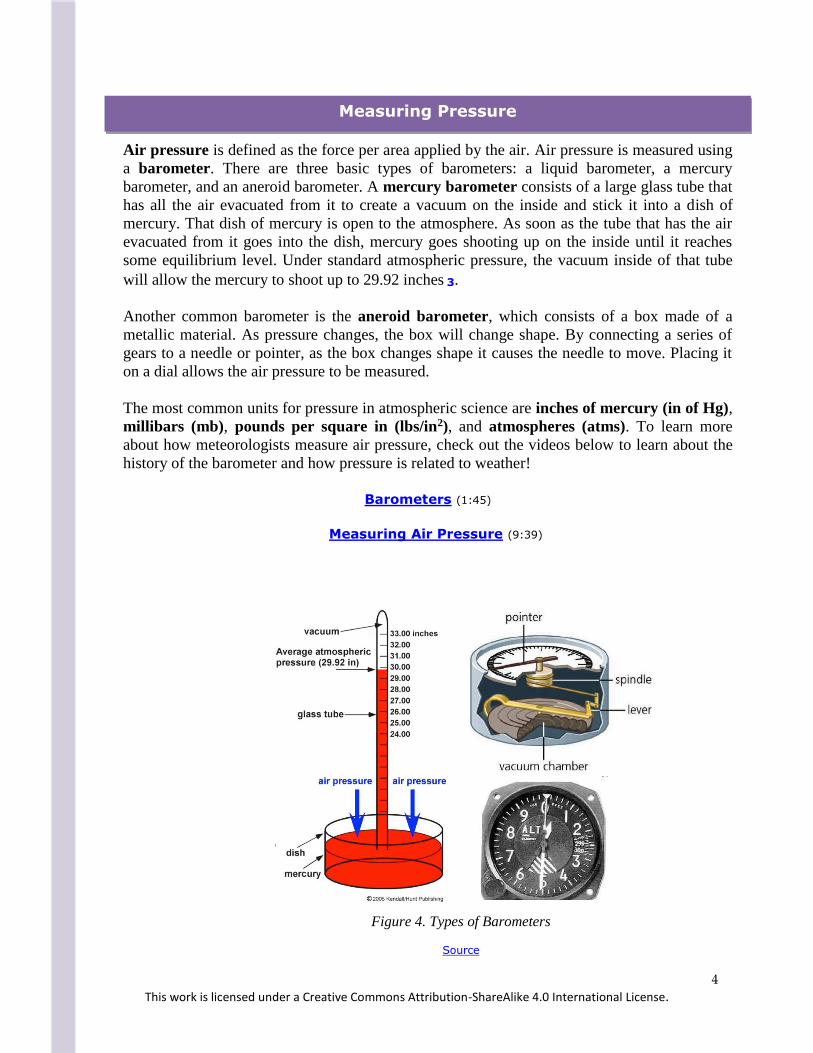
Air pressure is defined as the force per area applied by the air. Air pressure is measured using
a barometer. There are three basic types of barometers: a liquid barometer, a mercury
barometer, and an aneroid barometer. A mercury barometer consists of a large glass tube that
has all the air evacuated from it to create a vacuum on the inside and stick it into a dish of
mercury. That dish of mercury is open to the atmosphere. As soon as the tube that has the air
evacuated from it goes into the dish, mercury goes shooting up on the inside until it reaches
some equilibrium level. Under standard atmospheric pressure, the vacuum inside of that tube
will allow the mercury to shoot up to 29.92 inches 3.
Another common barometer is the aneroid barometer, which consists of a box made of a
metallic material. As pressure changes, the box will change shape. By connecting a series of
gears to a needle or pointer, as the box changes shape it causes the needle to move. Placing it
on a dial allows the air pressure to be measured.
The most common units for pressure in atmospheric science are inches of mercury (in of Hg),
millibars (mb), pounds per square in (lbs/in2), and atmospheres (atms). To learn more
about how meteorologists measure air pressure, check out the videos below to learn about the
history of the barometer and how pressure is related to weather!
Barometers (1:45)
Measuring Air Pressure (9:39)
Figure 4. Types of Barometers
Source
5 This work is licensed under a Creative Commons Attribution-ShareAlike 4.0 International License.
Measuring Wind
As we have learned in previous modules, the earth is a sphere and is unevenly heated by the sun.
The wind blows as a result of this uneven heating of the earth’s surface, which causes differences
in air temperature and pressure. Because the atmosphere aims to achieve equilibrium or to be in
balance with itself, the wind blows to restore balance of temperature and pressure across the
globe 4. The greater the temperature and pressure gradient in the atmosphere, the faster the wind
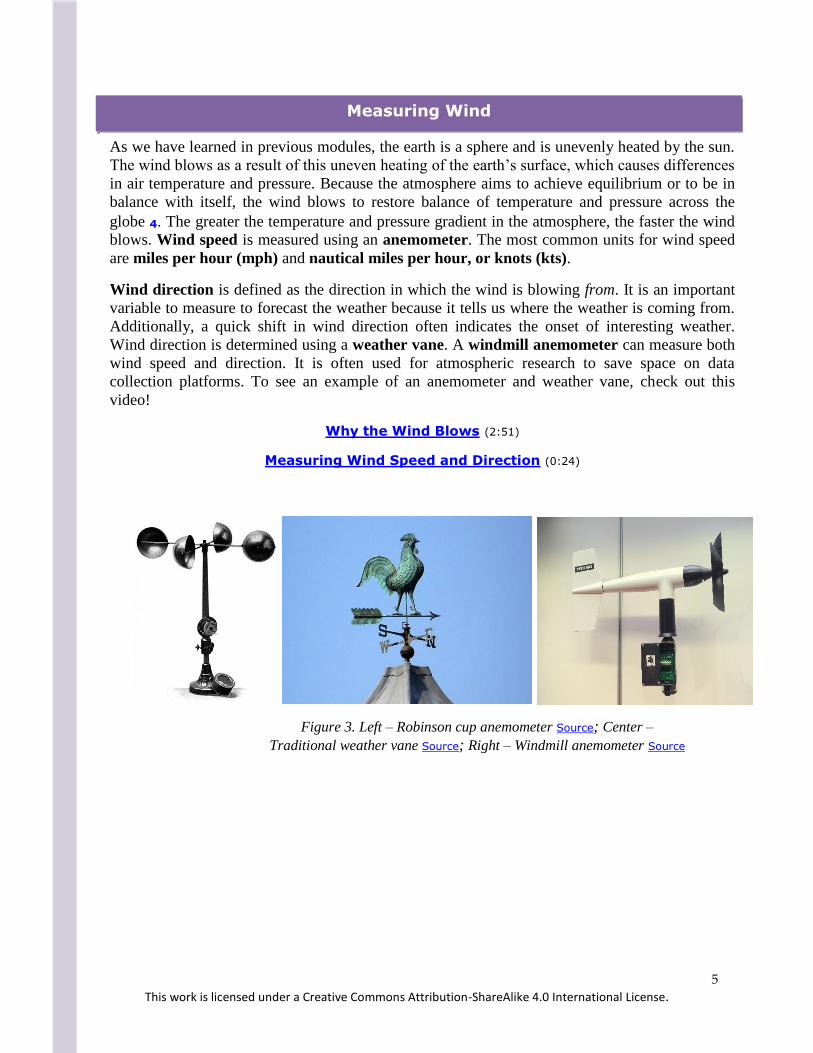
blows. Wind speed is measured using an anemometer. The most common units for wind speed
are miles per hour (mph) and nautical miles per hour, or knots (kts).
Wind direction is defined as the direction in which the wind is blowing from. It is an important
variable to measure to forecast the weather because it tells us where the weather is coming from.
Additionally, a quick shift in wind direction often indicates the onset of interesting weather.
Wind direction is determined using a weather vane. A windmill anemometer can measure both
wind speed and direction. It is often used for atmospheric research to save space on data
collection platforms. To see an example of an anemometer and weather vane, check out this
video!
Why the Wind Blows (2:51)
Measuring Wind Speed and Direction (0:24)
Figure 3. Left – Robinson cup anemometer Source; Center –
Traditional weather vane Source; Right – Windmill anemometer Source
6 This work is licensed under a Creative Commons Attribution-ShareAlike 4.0 International License.
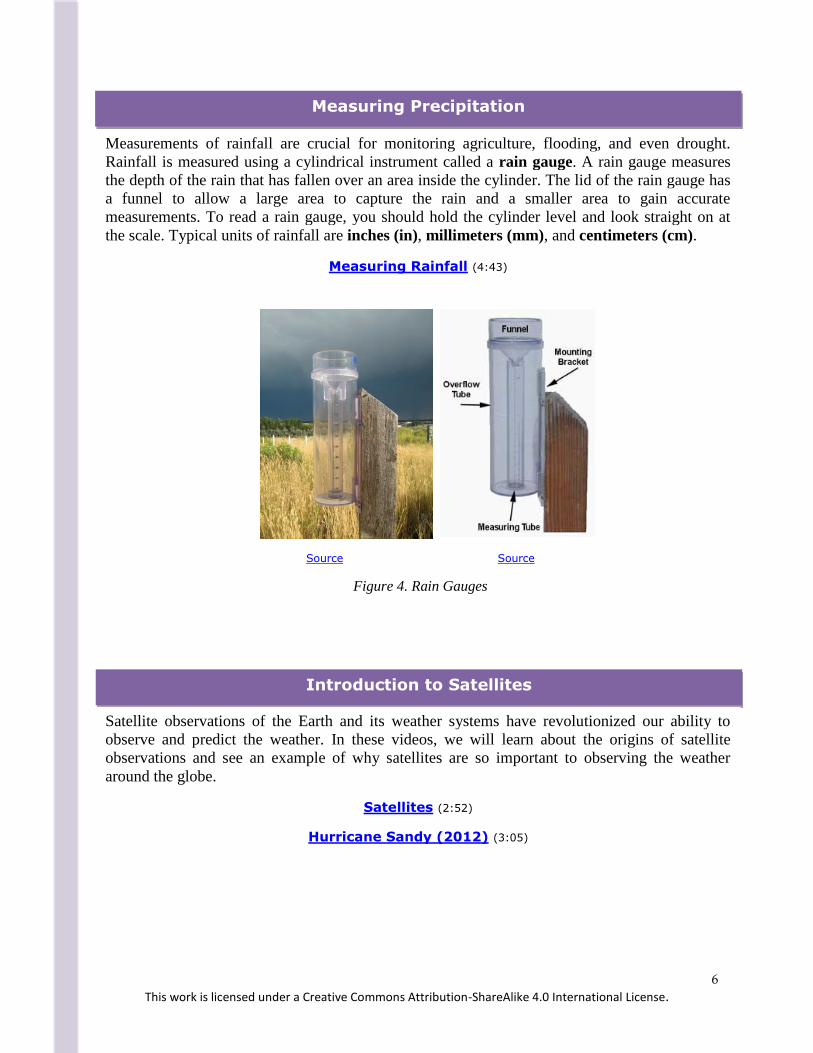
Measuring Precipitation
Measurements of rainfall are crucial for monitoring agriculture, flooding, and even drought.
Rainfall is measured using a cylindrical instrument called a rain gauge. A rain gauge measures
the depth of the rain that has fallen over an area inside the cylinder. The lid of the rain gauge has
a funnel to allow a large area to capture the rain and a smaller area to gain accurate
measurements. To read a rain gauge, you should hold the cylinder level and look straight on at
the scale. Typical units of rainfall are inches (in), millimeters (mm), and centimeters (cm).
Measuring Rainfall (4:43)
Source Source
Figure 4. Rain Gauges
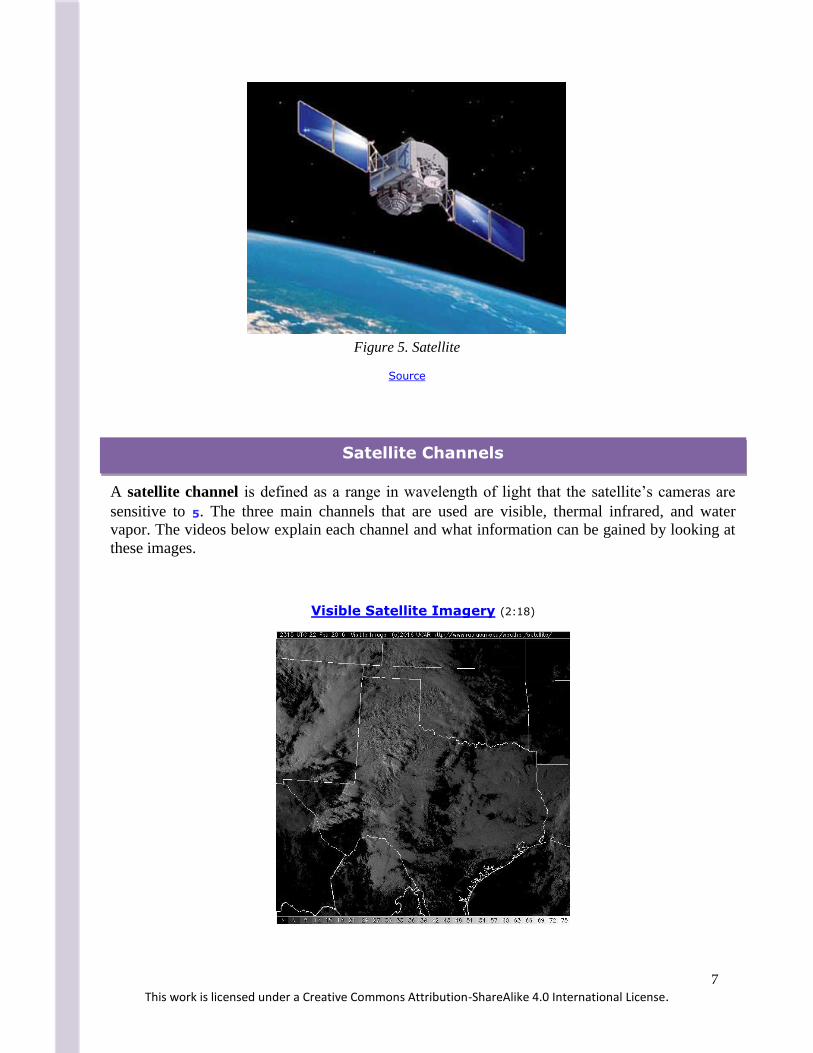
Introduction to Satellites
Satellite observations of the Earth and its weather systems have revolutionized our ability to
observe and predict the weather. In these videos, we will learn about the origins of satellite
observations and see an example of why satellites are so important to observing the weather
around the globe.
Satellites (2:52)
Hurricane Sandy (2012) (3:05)
7 This work is licensed under a Creative Commons Attribution-ShareAlike 4.0 International License.
Figure 5. Satellite
Source
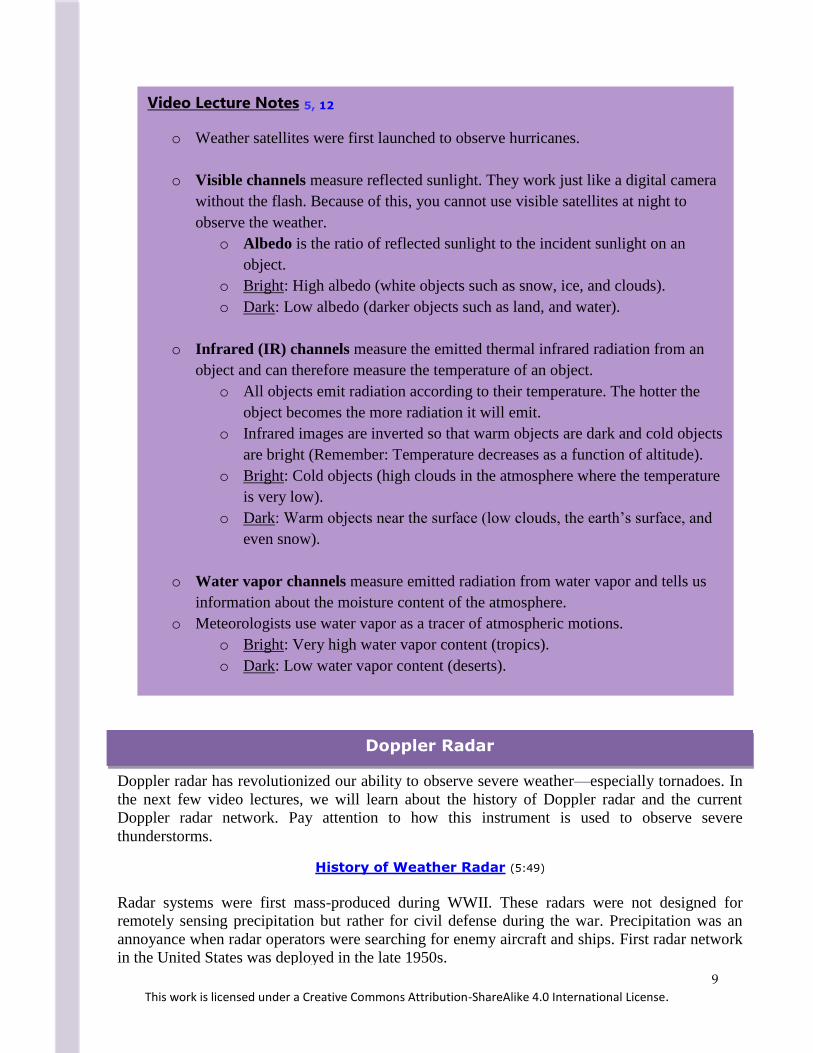
Satellite Channels
A satellite channel is defined as a range in wavelength of light that the satellite’s cameras are
sensitive to 5. The three main channels that are used are visible, thermal infrared, and water
vapor. The videos below explain each channel and what information can be gained by looking at
these images.
Visible Satellite Imagery (2:18)

8 This work is licensed under a Creative Commons Attribution-ShareAlike 4.0 International License.
Video Lecture Notes
o Weather satellites were first launched to observe hurricanes.
Infrared Satellite Imagery (9:32)
Source
Water Vapor Satellite Imagery (2:44)
Source
9 This work is licensed under a Creative Commons Attribution-ShareAlike 4.0 International License.
Doppler radar has revolutionized our ability to observe severe weather—especially tornadoes. In
the next few video lectures, we will learn about the history of Doppler radar and the current
Doppler radar network. Pay attention to how this instrument is used to observe severe
thunderstorms.
History of Weather Radar (5:49)
Radar systems were first mass-produced during WWII. These radars were not designed for
remotely sensing precipitation but rather for civil defense during the war. Precipitation was an
annoyance when radar operators were searching for enemy aircraft and ships. First radar network
in the United States was deployed in the late 1950s.
Video Lecture Notes 5, 12
o Weather satellites were first launched to observe hurricanes.
o Visible channels measure reflected sunlight. They work just like a digital camera
without the flash. Because of this, you cannot use visible satellites at night to
observe the weather.
o Albedo is the ratio of reflected sunlight to the incident sunlight on an
object.
o Bright: High albedo (white objects such as snow, ice, and clouds).
o Dark: Low albedo (darker objects such as land, and water).
o Infrared (IR) channels measure the emitted thermal infrared radiation from an
object and can therefore measure the temperature of an object.
o All objects emit radiation according to their temperature. The hotter the
object becomes the more radiation it will emit.
o Infrared images are inverted so that warm objects are dark and cold objects
are bright (Remember: Temperature decreases as a function of altitude).
o Bright: Cold objects (high clouds in the atmosphere where the temperature
is very low).
o Dark: Warm objects near the surface (low clouds, the earth’s surface, and
even snow).
o Water vapor channels measure emitted radiation from water vapor and tells us
information about the moisture content of the atmosphere.
o Meteorologists use water vapor as a tracer of atmospheric motions.
o Bright: Very high water vapor content (tropics).
o Dark: Low water vapor content (deserts).
Doppler Radar
10 This work is licensed under a Creative Commons Attribution-ShareAlike 4.0 International License.
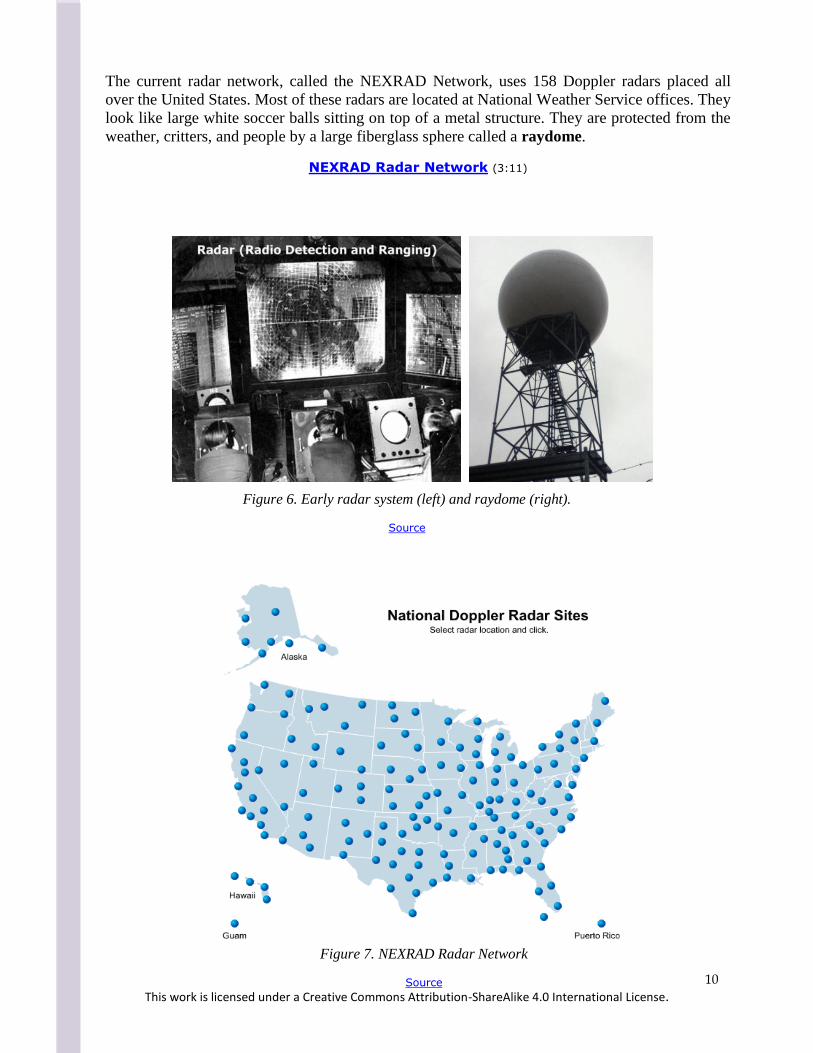
Figure 6. Early radar system (left) and raydome (right).
Source
Figure 7. NEXRAD Radar Network
Source
The current radar network, called the NEXRAD Network, uses 158 Doppler radars placed all
over the United States. Most of these radars are located at National Weather Service offices. They
look like large white soccer balls sitting on top of a metal structure. They are protected from the
weather, critters, and people by a large fiberglass sphere called a raydome.
NEXRAD Radar Network (3:11)
11 This work is licensed under a Creative Commons Attribution-ShareAlike 4.0 International License.
Doppler radar is one of the best tools meteorologists have to estimate the intensity and amount of
precipitation. Doppler radar images use color-coded maps, like those below, to show the
coverage and intensity of precipitation. The color bar assigned to each Doppler radar image can
indicate how heavy it is raining, but it can also be used to estimate how much rain will fall over a
one-hour time span.
Video Lecture Notes
o Radar systems were first mass-produced during World War II. Precipitation was
an annoyance when radar operators were searching for enemy aircraft and ships.
o The current radar network, called the NEXRAD Network, uses 158 Doppler
radars placed all over the U.S. Most of which are located at National Weather
Service offices.
o Radars are protected from the weather, critters, and people by a large fiberglass
sphere called a raydome.
Doppler radar’s ability to remotely sense precipitation makes it a crucial tool for any
meteorologist. In these next two videos, we will learn how Doppler radar works and what it is
able to measure 5.
How Radar Works (5:15)
Measuring Precipitation (5:53)
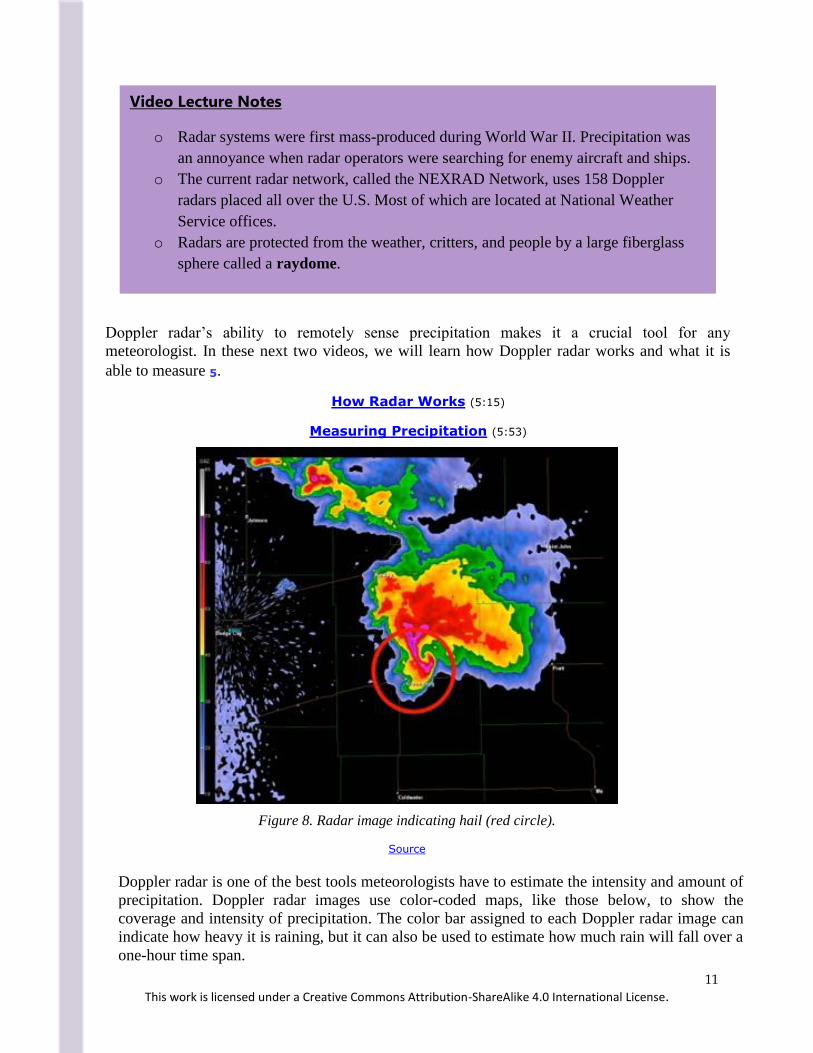
Figure 8. Radar image indicating hail (red circle).
Source

12 This work is licensed under a Creative Commons Attribution-ShareAlike 4.0 International License.
Video Lecture Notes 5
o Doppler radar systems work by measuring the reflection of a microwave pulse off
a raindrop.
o The radar sends out a powerful pulse of electromagnetic radiation that travels
away from the radar at the speed of light. When this radiation hits a raindrop, an
echo is produced as the pulse reflects off the raindrop. The echo travels back to
the radar, where it is measured.
o The strength of the return signal is proportional to two properties of precipitation:
o The number of particles
o The size of the particles
o Radar echoes are displayed as radar reflectivity, which provides us with
o Presence and coverage of the precipitation
o Location of precipitation
o Intensity of precipitation
o Amount of precipitation
o Doppler radar can measure the variables above and wind speed and direction.
o Data are viewed using color-coded maps of precipitation intensity.
o If the radar reflectivity values exceed 55 dBZ (dBZ = decibels of reflectivity),
then the radar beam has encountered hail in the storm. This will appear red, pink,
purple, or white on a radar reflectivity image.
o Radar reflectivity values can also be used to estimate how much rain will fall over
a location.
Figure 9. A chart that relates the intensity of the rainfall (measured
in dBZ) to a rainfall rate (measured in inches/hour).
13 This work is licensed under a Creative Commons Attribution-ShareAlike 4.0 International License.
First invented in the 1930s, the weather balloon allowed meteorologists to gain valuable
information about the behavior of the winds above the Earth's surface. While much has changed
in the abilities of the instrument over the years, this is still one of the primary means by which
weather information is collected globally. In this video lecture, we will learn about this
instrument and why it is such an important tool for meteorologists.
Rawinsondes (0 – 8:00)
Once the data is collected from a rawinsonde, meteorologists display this data on a graph called a
sounding.
Weather Balloon Launch (3:43)
The Sounding Diagram (0 – 4:00)
Analyzing a Sounding (0 – 1:52)
Upper-Air Measurements
The Doppler Effect
The best feature of the current Doppler radar network is its ability to measure the movement of
the precipitation. Since this movement can only be caused by the wind, radar meteorologists can
use this information to extract the wind speed and direction. It is this ability that has made
tornado detection with Doppler radar possible. Check out the videos below to learn more 5!
The Doppler Effect (9:02)
Video Lecture Notes 5
o If a raindrop is moving toward or away from the radar, the frequency and phase of
the return echo will change compared to the pulse that was sent out. Doppler radar
can measure these shifts in the frequency and phase of the echo to find the wind
speed and direction of the precipitation.
o When looking at a Doppler radar radial velocity image,
o Red colors indicate precipitation that is being blown away from the radar.
o Green colors indicate precipitation is being blown toward the radar.
This radar animation shows the recent EF-5 tornado from El Reno, OK on May 31, 2013. This
video has side-by-side images of radar radial velocity (left) and radar reflectivity (right).
El Reno EF-5 Tornado (1:23)
14 This work is licensed under a Creative Commons Attribution-ShareAlike 4.0 International License.
Video Lecture Notes
o The instrument attached to a weather balloon is called a rawinsonde.
o Rawinsondes are carried through the depth of the troposphere by a helium or
hydrogen-filled balloon. The balloon typically pops in the stratosphere and stops
collecting data there.
o They are launched twice per day from National Weather Service offices.
o They collect a vertical profile of the air temperature, air pressure, humidity, height,
wind speed and direction as they ascend at approximately 1,000 feet per minute.
o The type of data they collect is called in situ. In situ data collection is a direct
measurement.
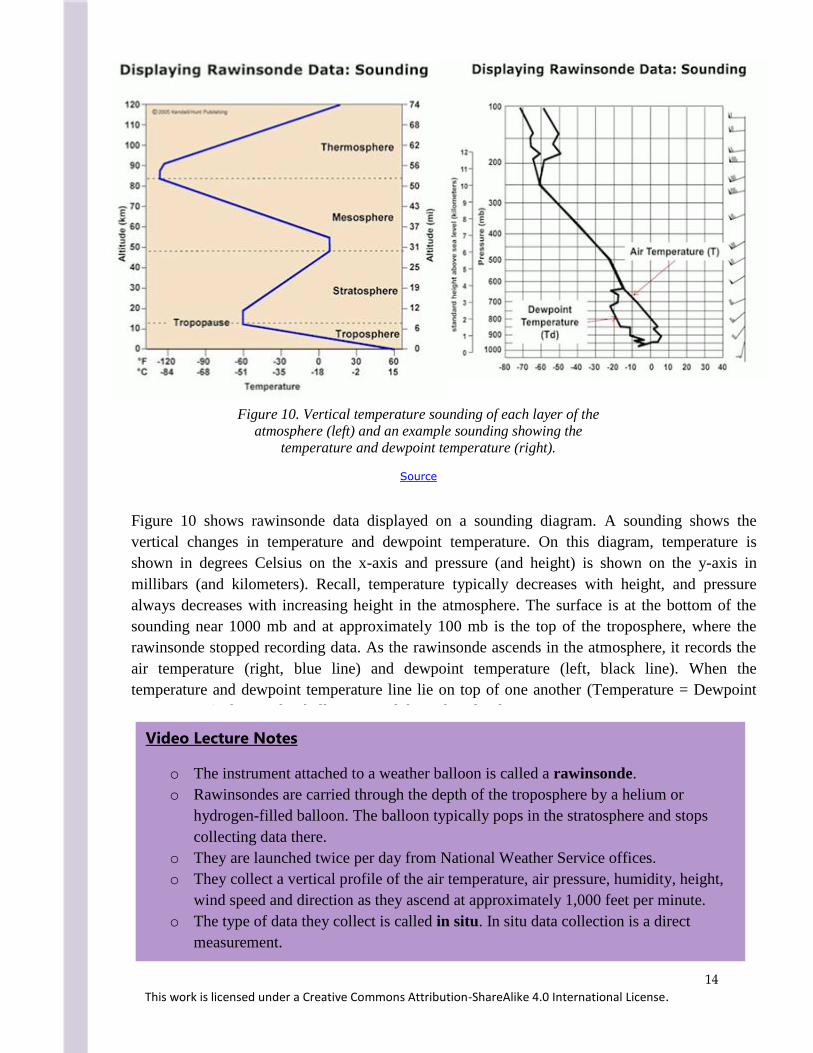
Figure 10. Vertical temperature sounding of each layer of the
atmosphere (left) and an example sounding showing the
temperature and dewpoint temperature (right).
Source
Figure 10 shows rawinsonde data displayed on a sounding diagram. A sounding shows the
vertical changes in temperature and dewpoint temperature. On this diagram, temperature is
shown in degrees Celsius on the x-axis and pressure (and height) is shown on the y-axis in
millibars (and kilometers). Recall, temperature typically decreases with height, and pressure
always decreases with increasing height in the atmosphere. The surface is at the bottom of the
sounding near 1000 mb and at approximately 100 mb is the top of the troposphere, where the
rawinsonde stopped recording data. As the rawinsonde ascends in the atmosphere, it records the
air temperature (right, blue line) and dewpoint temperature (left, black line). When the
temperature and dewpoint temperature line lie on top of one another (Temperature = Dewpoint
Temperature), the weather balloon passed through a cloud!
15 This work is licensed under a Creative Commons Attribution-ShareAlike 4.0 International License.
Pre-Class Activity 6
Instructions: Before teaching about atmospheric measurements, have the students answer the
questions below, followed by a question for in-class discussion between you and your
students.
1. Which of the following instrument is used to measure air temperature?
a. Barometer
b. Thermometer
c. Anemometer
d. Weather vane
e. Rawinsonde
2. Which of the following instrument is used to measure air pressure?
a. Barometer
b. Thermometer
c. Anemometer
d. Weather vane
e. Rawinsonde
3. Which of the following instrument is used to measure wind speed?
a. Barometer
b. Thermometer
c. Anemometer
d. Weather vane
e. Rawinsonde
4. Which of the following instrument is used to measure wind direction?
a. Barometer
b. Thermometer
c. Anemometer
d. Weather vane
e. Rawinsonde
5. Which of the following instrument is used to measure the vertical profile of the
atmosphere?
a. Barometer
b. Thermometer
c. Anemometer
d. Weather vane
e. Rawinsonde
Discussion Question: Atmospheric measurements are collected constantly all over the world.
Why do you think it is so important that we collect these data?
* If time permits, try How to Make a Bottle Thermometer
16 This work is licensed under a Creative Commons Attribution-ShareAlike 4.0 International License.
In-Class Activity 6, 9
Instructions: In this project, your group will experiment using data from various weather
instruments to analyze the atmospheric conditions. Each group member will choose one of the
following variables and complete the tasks written at the end of each section.
1. Temperature and Pressure
2. Atmospheric Moisture
3. Upper-Air Soundings
4. Rainfall Measurements
Data: Temperature and Pressure 3, 8
Task #1: Temperature Conversions
1. What is the instrument used to measure temperature?
2. What is the freezing point of water in degrees Fahrenheit?
3. What is the boiling point of water in degrees Celsius?
4. Show your work to explain why -40oF is also -40oC.
Now, click on the following link to get data on the current temperature in your area. Click here
and enter your city, state OR zip code in the ‘Local Forecast’ box on the left side of the page.
1. What is the current temperature in your area in degrees Fahrenheit?
2. Convert this temperature to degrees Celsius and Kelvin and be sure to show all of your
work and units in your answer.
3. Before closing this window, record your current air pressure in millibars and inches of
mercury, you will need this information for the second task.
Task #2: Measuring Air Pressure
1. What is the instrument used to measure air pressure?
2. What is the current air pressure in your area (see instructions from Task #1)?
3. If the standard atmospheric pressure at sea level is 29.92 inches of mercury (1013.25
millibars), what type of weather conditions would you expect in your area today?
4. Briefly explain how a mercury barometer works.
5. How would the level of the mercury change if you began to climb a mountain?
17 This work is licensed under a Creative Commons Attribution-ShareAlike 4.0 International License.
Task #3: Broadcast
As a scientist, it is important that you learn to properly convey weather information to the
general public. Your task is to create a 5-minute broadcast describing air temperature and
pressure and its importance to understanding the weather. Be sure to address the following topics
in your broadcast:
1. Define temperature and the instrument used to measure it.
2. Tell the audience what the current temperature is outside in Fahrenheit and Celsius.
3. Compare this temperature to the freezing and boiling points of water.
4. Define air pressure and the instrument used to measure it.
5. Tell the audience what the current air pressure is in your area.
6. Compare this pressure to the standard atmospheric pressure at sea level.
7. Briefly explain what type of weather is typical under these conditions.
Build this weather broadcast using presentation software (like PowerPoint) and be sure to
supplement everything you discuss with images. Be sure to be both informative and entertaining!
18 This work is licensed under a Creative Commons Attribution-ShareAlike 4.0 International License.
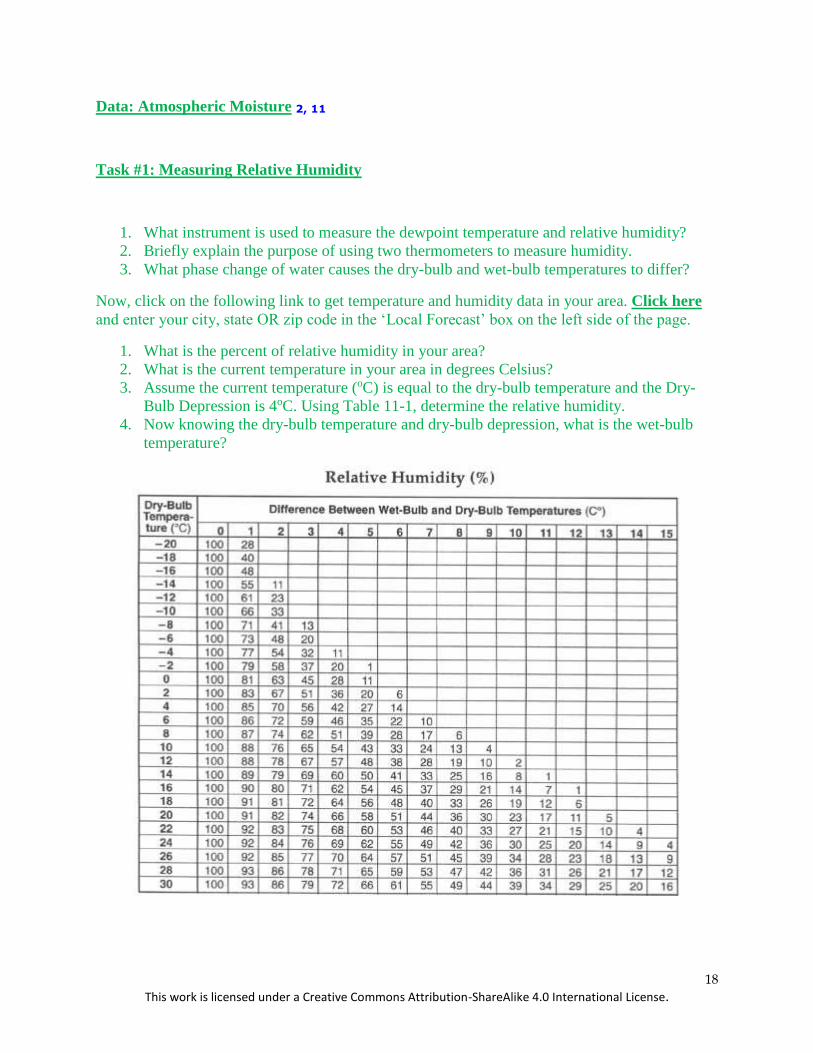
Data: Atmospheric Moisture 2, 11
Task #1: Measuring Relative Humidity
1. What instrument is used to measure the dewpoint temperature and relative humidity?
2. Briefly explain the purpose of using two thermometers to measure humidity.
3. What phase change of water causes the dry-bulb and wet-bulb temperatures to differ?
Now, click on the following link to get temperature and humidity data in your area. Click here
and enter your city, state OR zip code in the ‘Local Forecast’ box on the left side of the page.
1. What is the percent of relative humidity in your area?
2. What is the current temperature in your area in degrees Celsius?
3. Assume the current temperature (oC) is equal to the dry-bulb temperature and the Dry-
Bulb Depression is 4oC. Using Table 11-1, determine the relative humidity.
4. Now knowing the dry-bulb temperature and dry-bulb depression, what is the wet-bulb
temperature?

19 This work is licensed under a Creative Commons Attribution-ShareAlike 4.0 International License.
Task #2: Satellite Imagery
1. Which type of satellite channel is best for estimating the amount of atmospheric
moisture?
2. What does this channel measure?
3. Using the map below, determine whether Chicago, IL has a dry or moist air mass in
place.
Source
1. Click here to view the most recent satellite image loop. Looking at your area, does the
value for relative humidity that you recorded in Task #1 make sense?
Task #3: Broadcast
As a scientist, it is important that you learn to properly convey weather information to the
general public. Your task is to create a 5-minute broadcast describing moisture in the atmosphere
and its importance to understanding the weather. Be sure to address the following topics in your
broadcast:
1. Define relative humidity and the instrument used to measure it.
2. Briefly explain the technique used to measure relative humidity and dewpoint
temperature.
3. Name the satellite channel used to estimate atmospheric moisture. What do bright and
dark areas on this type of map represent?
4. Show the current satellite image and describe the type of weather is typical under
these conditions.
Build this weather broadcast using presentation software (like PowerPoint) and be sure to
supplement everything you discuss with images. Be sure to be both informative and entertaining!
20 This work is licensed under a Creative Commons Attribution-ShareAlike 4.0 International License.
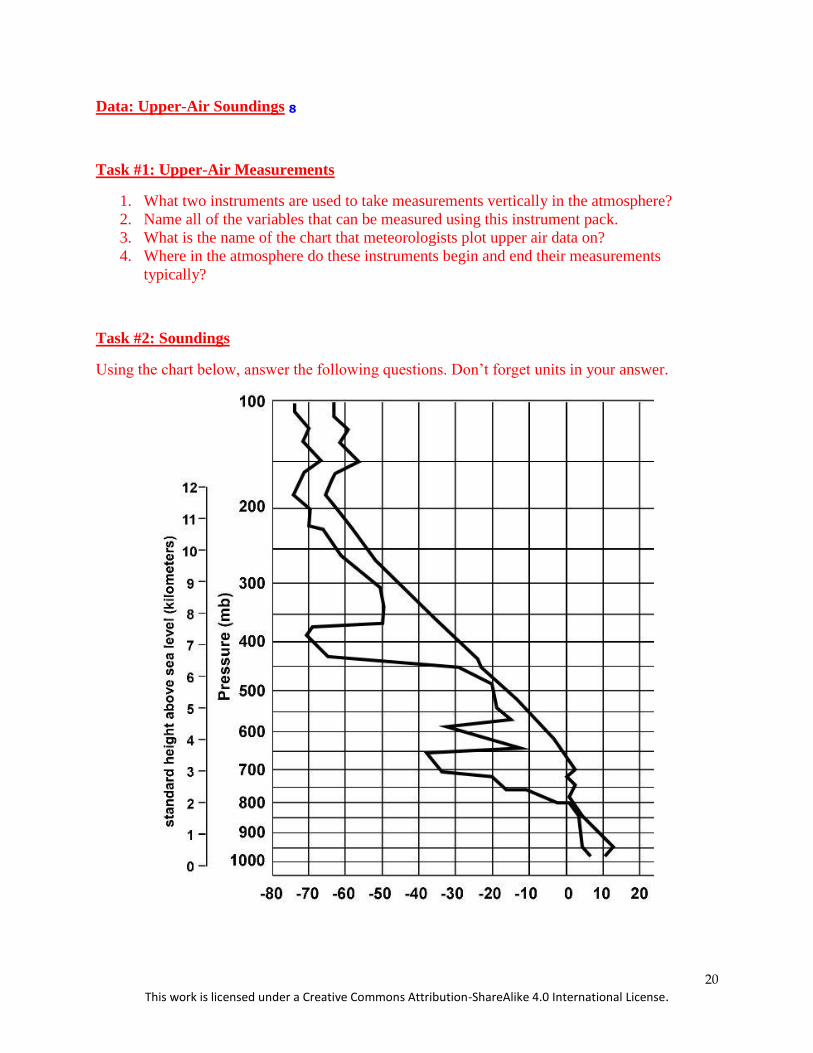
Data: Upper-Air Soundings 8
Task #1: Upper-Air Measurements
1. What two instruments are used to take measurements vertically in the atmosphere?
2. Name all of the variables that can be measured using this instrument pack.
3. What is the name of the chart that meteorologists plot upper air data on?
4. Where in the atmosphere do these instruments begin and end their measurements
typically?
Task #2: Soundings
Using the chart below, answer the following questions. Don’t forget units in your answer.
21 This work is licensed under a Creative Commons Attribution-ShareAlike 4.0 International License.
1. Label the air temperature (T) and dewpoint temperature (Td) lines.
2. What is the air temperature at the surface?
3. What is the dewpoint temperature at the surface?
4. What is the difference between the surface temperature and dewpoint temperature?
5. Is the surface temperature above or below the freezing point of water? By how many
degrees?
6. What is the surface pressure?
7. Is the surface pressure higher or lower than standard atmospheric pressure at sea level?
8. At approximately what pressure would you expect there to be clouds present?
Task #3: Broadcast
As a scientist, it is important that you learn to properly convey weather information to the
general public. Your task is to create a 5-minute broadcast describing the vertical profile of the
atmosphere and its importance to understanding the weather that occurs at the surface. Be sure to
address the following topics in your broadcast:
1. Define atmospheric sounding and the instruments used to collect upper-air data.
2. Briefly explain the technique used to collect the data.
3. Show an example of a sounding.
4. Discuss what each line represents and where you expect clouds to be present (be sure
to explain why!)
5. Tell the audience what the air temperature, dewpoint temperature, and pressure is at
the surface.
6. Answer whether the surface pressure is higher or lower than the standard atmospheric
pressure (1013.25 mb) and describe the type of weather expected under these
conditions.
7. Briefly explain the importance of these soundings to forecasting the weather.
Build this weather broadcast using presentation software (like PowerPoint) and be sure to
supplement everything you discuss with images. Be sure to be both informative and entertaining!

22 This work is licensed under a Creative Commons Attribution-ShareAlike 4.0 International License.
Data: Rainfall Measurements 5, 8
Task #1: Measuring Rainfall
1. What instrument is used to measure rainfall?
2. List two units used to describe the amount of rainfall.
3. What instrument is used to estimate precipitation location, motion, intensity, and amount?
4. What is the Doppler effect?
5. Name one reason why monitoring rainfall is important.
Task #2: Radar Imagery
Click here to access the most recent Doppler radar images and answer the following questions.
1. In which states is precipitation occurring?
2. Based on the time of year and location of the precipitation, what type of precipitation do
you expect to be occurring?
3. Which state has the highest radar reflectivity values? What is the radar reflectivity value
there (include units)?
4. Using the chart below, how many inches per hour will fall at the location from Question
3?
5. Are there any areas where you expect hail to be occurring?
23 This work is licensed under a Creative Commons Attribution-ShareAlike 4.0 International License.
Task #3: Broadcast
As a scientist, it is important that you learn to properly convey weather information to the
general public. Your task is to create a 5-minute broadcast describing techniques used to measure
rainfall and its importance to understanding the weather and beyond. Be sure to address the
following topics in your broadcast:
1. Describe the two instruments used to estimate rainfall.
2. Show a picture of each instrument and describe the techniques to measure rainfall.
3. Explain the Doppler effect and how it’s used to measure wind speed and direction.
4. Include the radar image that you retrieved for Task #2.
5. Point out any areas where precipitation is occurring and the values of radar
reflectivity.
6. Summarize your findings from Task #2.
7. Describe the importance of collecting rainfall measurements.
Build this weather broadcast using presentation software (like PowerPoint) and be sure to
supplement everything you discuss with images. Be sure to be both informative and entertaining!

24 This work is licensed under a Creative Commons Attribution-ShareAlike 4.0 International License.
Take Home Assignment 6
Part 1. Matching
Instructions: Fill in the missing instrument name, type of measurement, and units in the table
below.
Instrument Name Measurement Units
Thermometer
Pressure
Rain Gauge
Miles per hour
Sling Psychrometer
T, Td, P, Wind Speed
and Direction
-
Cloud Cover -
Part 2. Short Answer 6, 12
Instructions: Answer the following short answer questions about satellites.
1. Name the satellite channels used to monitor weather around the globe.
____________________________
____________________________
____________________________
25 This work is licensed under a Creative Commons Attribution-ShareAlike 4.0 International License.
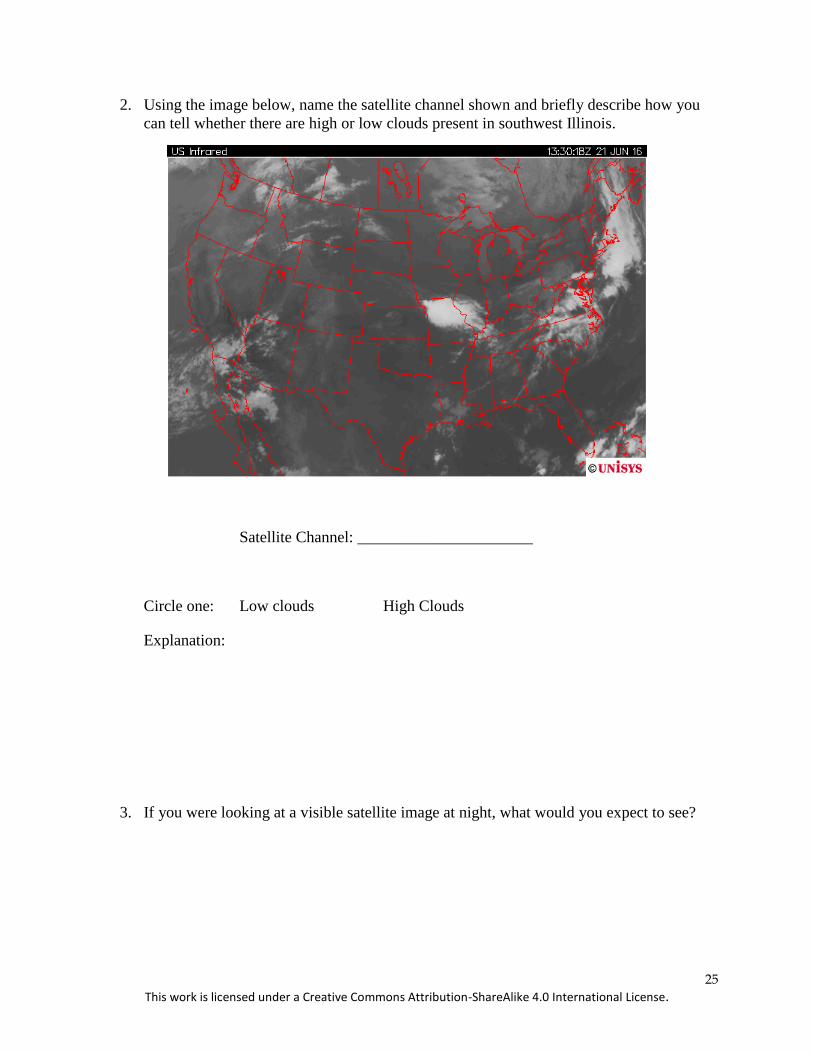
2. Using the image below, name the satellite channel shown and briefly describe how you
can tell whether there are high or low clouds present in southwest Illinois.
Satellite Channel: ______________________
Circle one: Low clouds High Clouds
Explanation:
3. If you were looking at a visible satellite image at night, what would you expect to see?
26 This work is licensed under a Creative Commons Attribution-ShareAlike 4.0 International License.
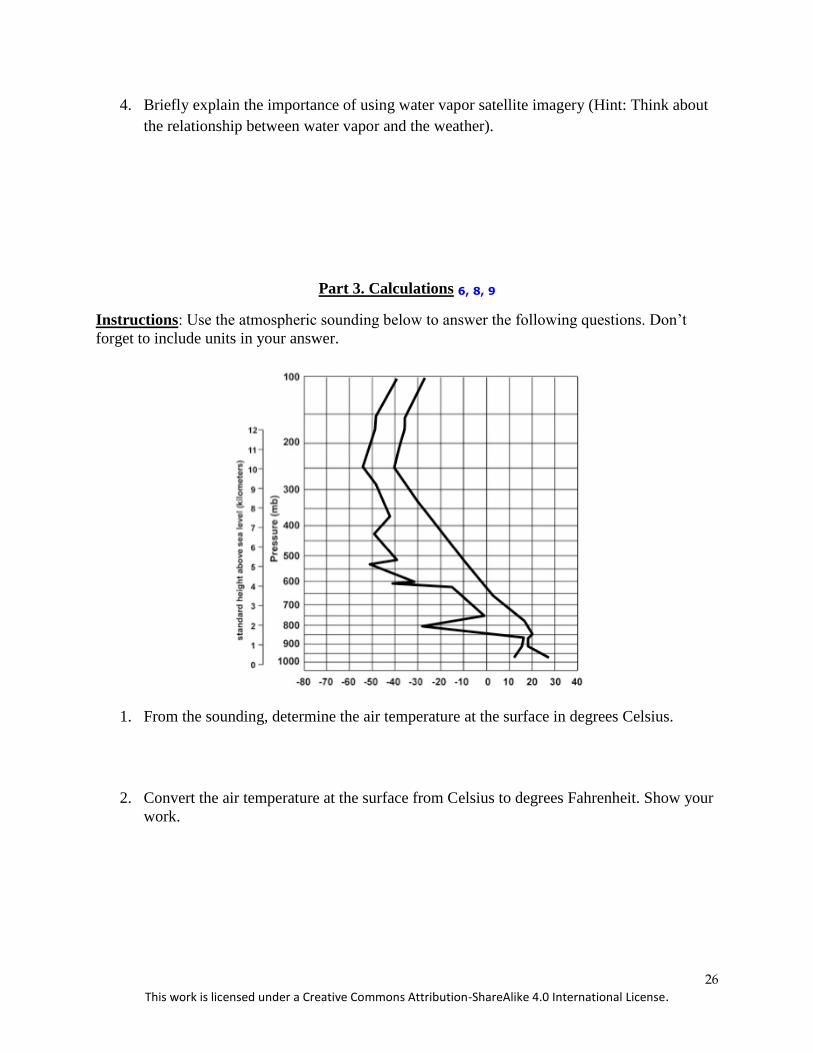
4. Briefly explain the importance of using water vapor satellite imagery (Hint: Think about
the relationship between water vapor and the weather).
Part 3. Calculations 6, 8, 9
Instructions: Use the atmospheric sounding below to answer the following questions. Don’t
forget to include units in your answer.
1. From the sounding, determine the air temperature at the surface in degrees Celsius.
2. Convert the air temperature at the surface from Celsius to degrees Fahrenheit. Show your
work.
27 This work is licensed under a Creative Commons Attribution-ShareAlike 4.0 International License.
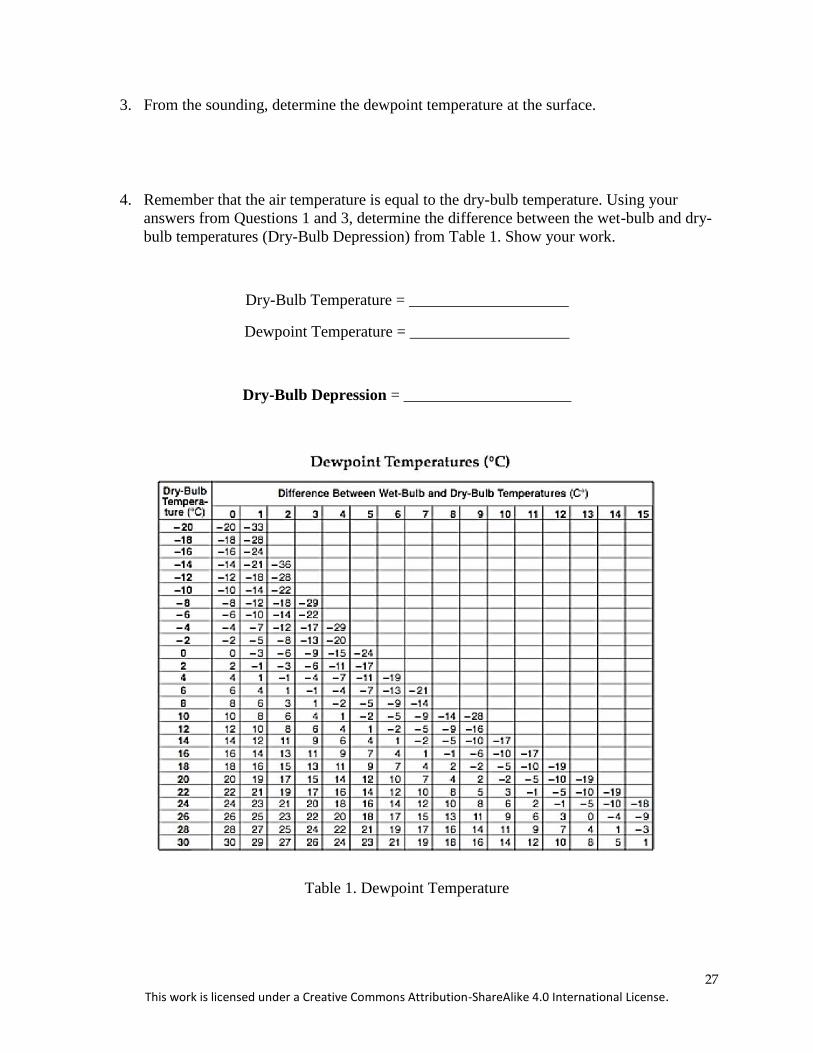
3. From the sounding, determine the dewpoint temperature at the surface.
4. Remember that the air temperature is equal to the dry-bulb temperature. Using your
answers from Questions 1 and 3, determine the difference between the wet-bulb and dry-
bulb temperatures (Dry-Bulb Depression) from Table 1. Show your work.
Dry-Bulb Temperature = ____________________
Dewpoint Temperature = ____________________
Dry-Bulb Depression = _____________________
Table 1. Dewpoint Temperature
28 This work is licensed under a Creative Commons Attribution-ShareAlike 4.0 International License.
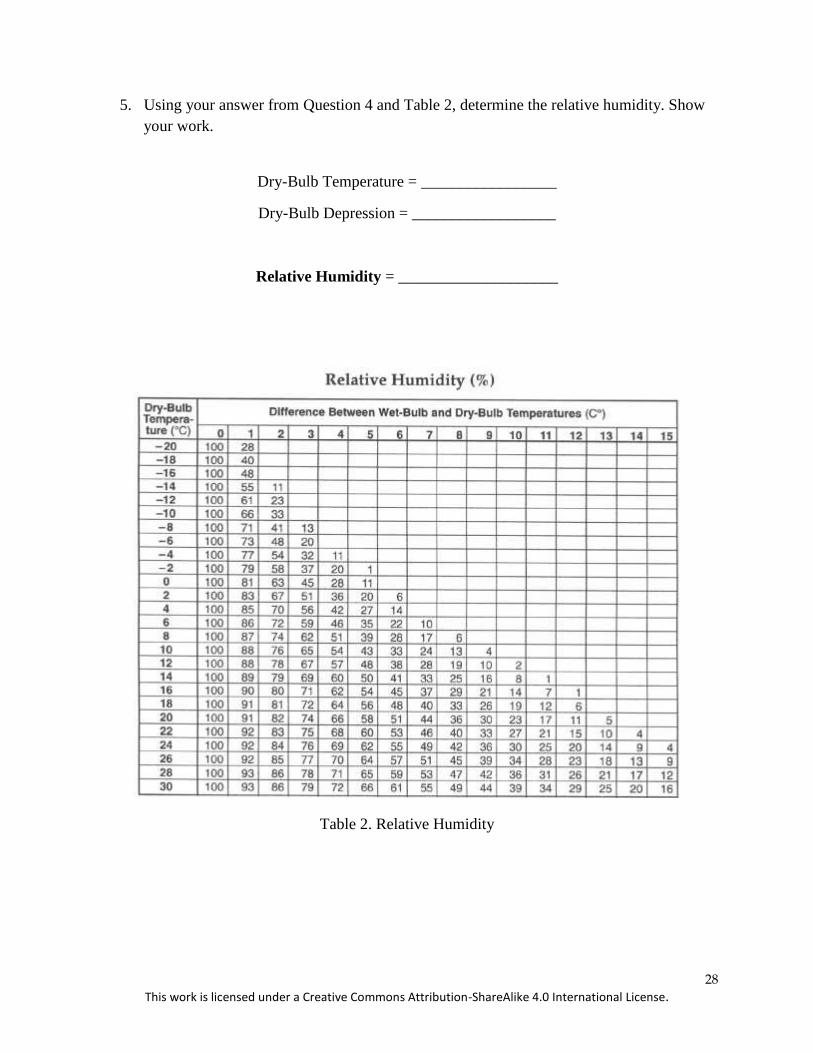
5. Using your answer from Question 4 and Table 2, determine the relative humidity. Show
your work.
Dry-Bulb Temperature = _________________
Dry-Bulb Depression = __________________
Relative Humidity = ____________________
Table 2. Relative Humidity
29 This work is licensed under a Creative Commons Attribution-ShareAlike 4.0 International License.
Student Evaluation 5, 6, 8, 10
Instructions: After completing the lesson on atmospheric measurements, please have the
students answer the following questions.
1. If you were a meteorologist trying to measure the air pressure which of the following
instruments would you use?
a. Thermometer
b. Barometer
c. Anemometer
d. Psychrometer
2. What does a rawinsonde measure?
a. Air temperature
b. Humidity
c. Wind speed
d. Pressure
e. All of the above
3. There are ________ main satellite channels used in meteorology.
a. 2
b. 3
c. 4
d. 5
e. 7
4. What is the name of the device used to loft rawinsondes into the atmosphere?
a. Weather balloon
b. Hot air balloon
c. Airplane
d. Satellite
5. A _______________ precisely measures the amount of rainfall.
a. radar
b. satellite
c. rainometer
d. rain gauge
e. none of the above
6. An anemometer determines the wind direction. T F
7. Doppler radar can be used to detect tornadoes. T F
8. Satellites were first used to study hurricanes. T F
30 This work is licensed under a Creative Commons Attribution-ShareAlike 4.0 International License.
9. Radar is an extremely useful instrument used to detect the intensity and location of
precipitation. Briefly describe how a radar detects precipitation (drawing a sketch may be
helpful).
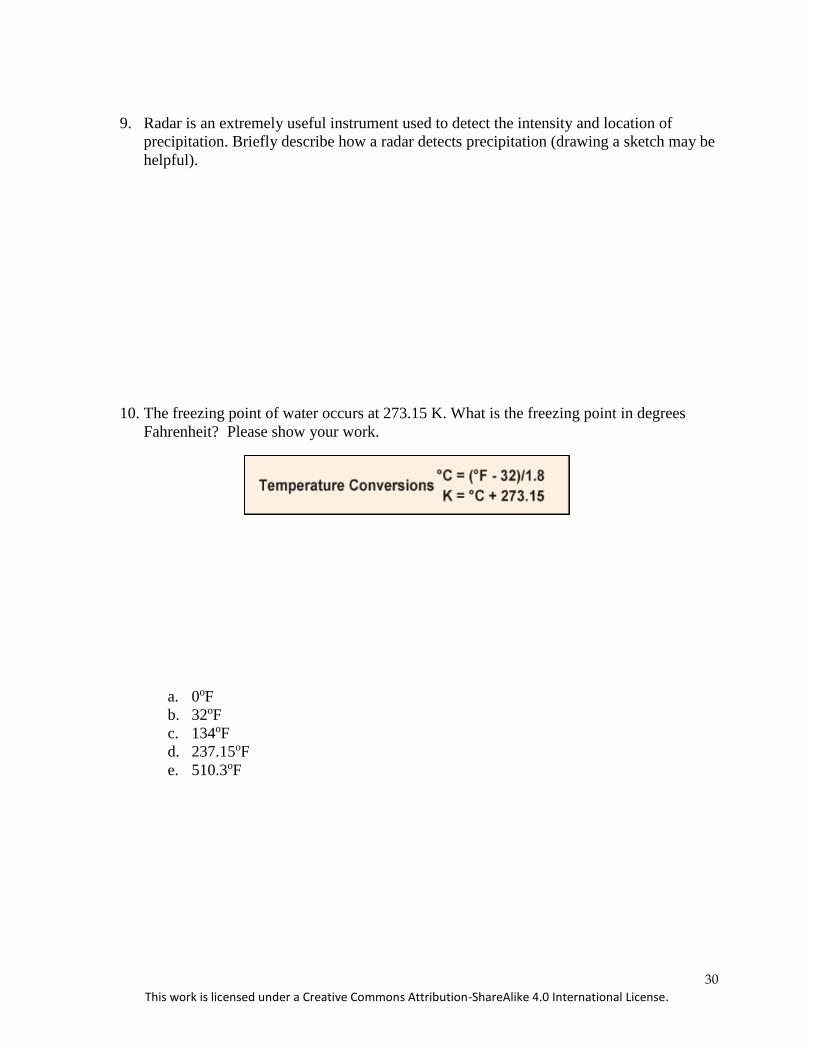
10. The freezing point of water occurs at 273.15 K. What is the freezing point in degrees
Fahrenheit? Please show your work.
a. 0oF
b. 32oF
c. 134oF
d. 237.15oF
e. 510.3oF
31 This work is licensed under a Creative Commons Attribution-ShareAlike 4.0 International License.
Common Core State Standards (CCSS) Initiative
To learn more, visit http://www.corestandards.org
Next Generation Science Standards (NGSS)
To learn more, visit http://www.nextgenscience.org
The following standards are met in this learning module:
1. NGSS.MS-PS3.A
MS-PS3.A. Definitions of Energy (Disciplinary Core Idea from MS-PS3-4)
Temperature is a measure of the average kinetic energy of particles of matter.
Lecture: Measuring Temperature
2. NGSS.MS-PS3-4
MS-PS3-4. Energy
Plan an investigation to determine the relationships among the energy
transferred, the type of matter, the mass, and the change in the average
kinetic energy of particles as measured by the temperature of the sample.
Lecture: Measuring Moisture; In-Class Activity: Atmospheric Moisture
3. NGSS.MS-ESS2.5
MS-ESS2-5. Weather and Climate
Provide evidence for air pressure systems and resulting weather conditions.
Lecture: Measuring Pressure; In-Class Activity: Temperature and Pressure
4. NGSS.MS-PS2.2
MS-PS2.2. Forces and Interactions
Emphasis on balanced and unbalanced forces in a system and an object’s
motion (F = ma). This includes a specification of units.
Lecture: Measuring Wind
32 This work is licensed under a Creative Commons Attribution-ShareAlike 4.0 International License.
5. NGSS.MS-PS4-2
MS-PS4.2. Electromagnetic Radiation (DCI PS4.B)
When light shines on an object, it is reflected, absorbed, or transmitted
through an object, depending on the object’s material and the frequency of the
light.
Lecture: Satellite Channels, Doppler Radar, The Doppler Effect; In-Class
Activity: Rainfall Measurements; Student Evaluation
6. CCSS.ELA-LITERACY.RST.6-8.4
Grade 6-8: Science and Technical Subjects
Determine the meaning of symbols, key terms, and other domain-specific
words and phrases as they are used in a specific science or technical context
relevant to grades 6-8 texts and topics.
Lectures: Bolded text; Pre-Class Activity; In-Class Activity; Take Home
Assignment; Student Evaluation
7. CCSS.ELA-LITERACY.RST.6-8.7
Grade 6-8: Science and Technical Subjects
Integrate quantitative or technical information expressed in words in a text
with a version of that information expressed visually (e.g., in a flowchart,
diagram, model, graph, or table).
Video lectures
9. CCSS.ELA-LITERACY.RST.6-8.3
Grade 6-8: Science and Technical Subjects
Follow precisely a multistep procedure when carrying out experiments, taking
measurements, or performing technical tasks.
In-Class Activity; Take Home Activity: Part 3
10. CCSS.ELA-LITERACY.RST.6-8.8
Grade 8: Science and Technical Subjects
Distinguish among facts, reasoned judgment based on research findings, and
speculation in a text.
Student Evaluation

33 This work is licensed under a Creative Commons Attribution-ShareAlike 4.0 International License.
11. NGSS.MS-PS4-2 MS-PS1-6. Chemical Reactions (Disciplinary Core Idea PS1.B)
Some chemical reactions release energy, others store energy.
Lecture: Measuring Moisture; In-Class Activity: Atmospheric Moisture
12. NGSS.MS-ESS2-5
MS-ESS2-5. Weather & Climate (DCI ESS2.C)
The complex patterns of the changes and the movement of water in the
atmosphere, determined by winds, landforms, and ocean temperatures and
currents, are major determinants of local weather patterns.
Lecture: Measuring Moisture; Take Home Assignment: Part 2


