ORIGINAL RESEARCH
Assessment of Unmet Clinical Need in Type 2 DiabeticPatients on Conventional Therapy in the UK
Hayley Bennett • Phil McEwan • Klas Bergenheim • Jason Gordon
To view enhanced content go to www.diabetestherapy-open.comReceived: May 16, 2014 / Published online: September 4, 2014� The Author(s) 2014. This article is published with open access at Springerlink.com
ABSTRACT
Introduction: Type 2 diabetes mellitus (T2DM)
is an increasing problem worldwide and a
leading risk factor for cardiovascular disease.
As beta cell function declines, the management
of T2DM typically comprises of escalations in
treatment from diet and exercise to oral
therapies and eventually insulin. Treatment
algorithms based on the attainment of blood
glucose targets may not account for changes in
other cardiovascular risk factors. The objective
of this study is to describe unmet clinical need,
defined as failure to reduce weight or meet
targets for blood pressure, total cholesterol or
glycated hemoglobin (HbA1c) levels.
Methods: Anonymized UK patient data for
those (1) initiating oral antidiabetic drug
(OAD) monotherapy, (2) escalating to dual
therapy, (3) escalating to triple therapy, and (4)
escalating to insulin therapy over the study
period (01/01/2005–31/12/2009) were obtained
from The Health Improvement Network (THIN).
Changes in risk factors were evaluated before
and after therapy escalation, and the attainment
of targets, assessed at the last recorded
measurement, as follows: HbA1c \7.5%,
systolic blood pressure (SBP) \140 mmHg, total
cholesterol (TC) \5 mmol/L, and reduction in
weight.
Results: Prior to therapy escalation, mean
HbA1c in each subgroup exceeded 7.5% and
was higher respective to the number of OADs
being used (monotherapy: 8.03%; double:
8.48%; triple: 8.71%). Insulin users displayed
the highest HbA1c prior to treatment escalation
(9.78%). Following escalation, a decline in
HbA1c was observed in all subgroups. By
contrast, mean SBP and TC levels decreased
Electronic supplementary material The onlineversion of this article (doi:10.1007/s13300-014-0079-6)contains supplementary material, which is available toauthorized users.
H. Bennett (&)Health Economics and Outcomes Research Ltd,Singleton Court Business Park, Wonastow Rd,Monmouth NP25 5JA, UKe-mail: [email protected]
P. McEwan � J. GordonHealth Economics and Outcomes Research Ltd.,Wales, UK
P. McEwanSwansea Centre for Health Economics, SwanseaUniversity, Wales, UK
K. BergenheimGlobal Health Economics and Outcomes Research,AstraZeneca, Molndal, Sweden
Diabetes Ther (2014) 5:567–578
DOI 10.1007/s13300-014-0079-6

prior to the addition of a second and third oral
therapy. Consistent improvements following
treatment escalation were not observed across
the other risk factors following therapy
escalation. Overall, the proportion of subjects
that attained all four targets ranged from 3%
(monotherapy and insulin) to 6% (dual
therapy).
Conclusion: The potential unmet clinical need
among conventionally treated T2DM patients is
significant, with respect to the control of blood
glucose and other cardiovascular risk factors:
SBP, TC, and weight. There clearly remains the
need for new therapeutic approaches to
alleviate the burden associated with T2DM.
Keywords: Routine clinical practice; Type 2
diabetes mellitus; Unmet need
INTRODUCTION
Diabetes is an increasing problem in both
developed and developing countries, and is a
leading risk factor for vascular disease [1].
Recent estimates indicate that the prevalence
of type 2 diabetes mellitus (T2DM) in the UK is
around 4.3% [2]. Rising obesity and the
demographic shift to an older population
suggest that this prevalence will increase.
The treatment of T2DM comprises a
combination of lifestyle changes and drug
therapy. Care pathways for people with T2DM
aim to address a decline in beta cell function
typically via escalation from diet and exercise
regimens to oral therapies and eventually
insulin [3]. Oral antidiabetic drugs (OADs) are
the mainstay of therapy for many T2DM
patients, but many do not achieve the optimal
reductions in weight, blood pressure or glycated
hemoglobin (HbA1c), and might benefit from
additional therapy. Consensus algorithms
advocate the addition of a second OAD or
basal insulin to metformin monotherapy,
based on their glucose-lowering properties
[4, 5]. While international organizations
recommend a range of options for second-line
therapy [5], the National Institute for Health
and Care Excellence (NICE) recommends
addition of a sulphonylurea (SU) as the
preferred second-line option [4].
Recommended treatment algorithms that are
based on the attainment of blood glucose
targets may not account for changes in other
cardiovascular risk factors in patients escalating
from first-line monotherapy. This study aims to
describe the unmet clinical need, defined as
failure to reduce weight or meet targets for
systolic blood pressure (SBP), total cholesterol
(TC) or HbA1c levels in T2DM patients taking
commonly prescribed OADs.
METHODS
A retrospective cohort study was conducted to
summarize patient characteristics (numbers on
treatment, age, sex, concomitant lipid or blood
pressure-lowering therapy) to estimate changes
in the following cardiovascular risk factors:
HbA1c, weight, SBP, and TC; and to estimate
proportions of patients achieving outcome
targets (i.e., HbA1c \7.5%) for each OAD
therapy cohort: mono, dual, triple, and insulin
therapy.
Data Source
This study used retrospective cohort data
extracted from The Health Improvement
Network (THIN) database [6]. THIN currently
contains the records of 9.1 million patients (3.4
million active patients) collected from *500
general practices across the UK. THIN is a
568 Diabetes Ther (2014) 5:567–578

suitable data source for this study, which
focuses on an unselected group of diabetic
patients from the general population, rather
than a specialist study group. This study was
granted ethical approval from the Scientific
Review Committee (SRC) (Reference 11-023,
July 04, 2011).
Study Population
The study cohort consists of men and women
with a diagnosis of T2DM recorded during the
study period: 01/01/2005–31/12/2009. The
index date was defined as the date of the first
diagnosis recorded within the study period.
Patients aged \25 years at index date and/or
with steroid-induced or gestational diabetes
were excluded. Patients were required to have
at least 365 days of follow-up pre- and post-first
OAD prescription, at least one reading of SBP,
weight and HbA1c in 365 days prior to the first
prescription date and at least two readings in
365 days following the first prescription date.
The study focused on conventional therapies of
the time and as such patients taking novel
agents (e.g., DPP-4 inhibitors) were excluded.
The population was divided into four OAD
exposure subgroups: mono, dual, triple, and
insulin. Mono included all patients with only
one OAD prescribed during 365 days after first
OAD prescription, with at least four scripts
issued. Dual included patients from the point
of addition of a second OAD, with at least
four scripts for both drugs during the 365 days
after this date. Triple included patients from
the point of addition of a third OAD, with at
least four scripts for each of the three drugs
during the 365 days after this date. Insulin
users included patients from the point of
addition of insulin therapy, with at least four
scripts for insulin during the 365 days after
this date. Patients could be included in more
than one subgroup over the course of the
study period, though not simultaneously,
provided they met the membership criteria
of each subgroup.
Study Variables and Analysis
Changes in the outcome (risk factor) variables
(HbA1c, weight, SBP and TC) were analyzed
over time in two ways. Firstly, the crude change
in each outcome was calculated as the
difference between the measurement
immediately preceding initiation
(monotherapy cohort) or prior to therapy
addition (dual, triple, and insulin therapy
cohorts), and the last recorded measurement
in the period following OAD therapy initiation/
escalation. Secondly, the gradient of change was
calculated for the pre- and post-periods as the
ratio of the change in each outcome and time
(days) between the two measurements. The
gradient provides a sense of the trajectory of
each outcome in the pre-and post-periods, and
hence the significance of OAD therapy
initiation or escalation in terms of the change
in risk factor adjusted for variation in time
between observations. Subjects were required to
have both measurement points pre- and post-
change to be included in either calculation.
Subjects in each therapy cohort were
evaluated for attainment of outcome targets at
last recorded measurement. For HbA1c, SBP,
and TC, values below 7.5%, 140 mmHg, and
5 mmol/L, respectively, indicated a favorable
risk factor profile [7]. For weight, a negative
coefficient for change indicated a favorable risk
factor profile. Levels of target attainment (each
variable alone and combination of all four) were
evaluated for each therapy cohort.
All outcomes were analyzed descriptively
using means, proportions, and standard
deviations (SD). P values were presented for all
Diabetes Ther (2014) 5:567–578 569
t tests at a 5% level of significance. All analyses
were conducted in Stata version 13 [8].
This article does not contain any new studies
with human or animal subjects performed by
any of the authors.
RESULTS
Results by Therapy Cohort
A total of 36,942 T2DM patients treated with
one or more pharmacological agent in UK
general practice were identified in the THIN
dataset, with an average age of [60. The
majority used a single OAD (monotherapy;
n = 23,626), with progressively fewer subjects
using two (dual therapy; n = 7,230) and three
OADs (triple therapy; n = 1,612). There were a
further 4,474 insulin users. There was an
apparent positive association between lipid-
lowering and blood pressure pharmacological
therapies, and progression from a single to
multiple OADs (Table 1).
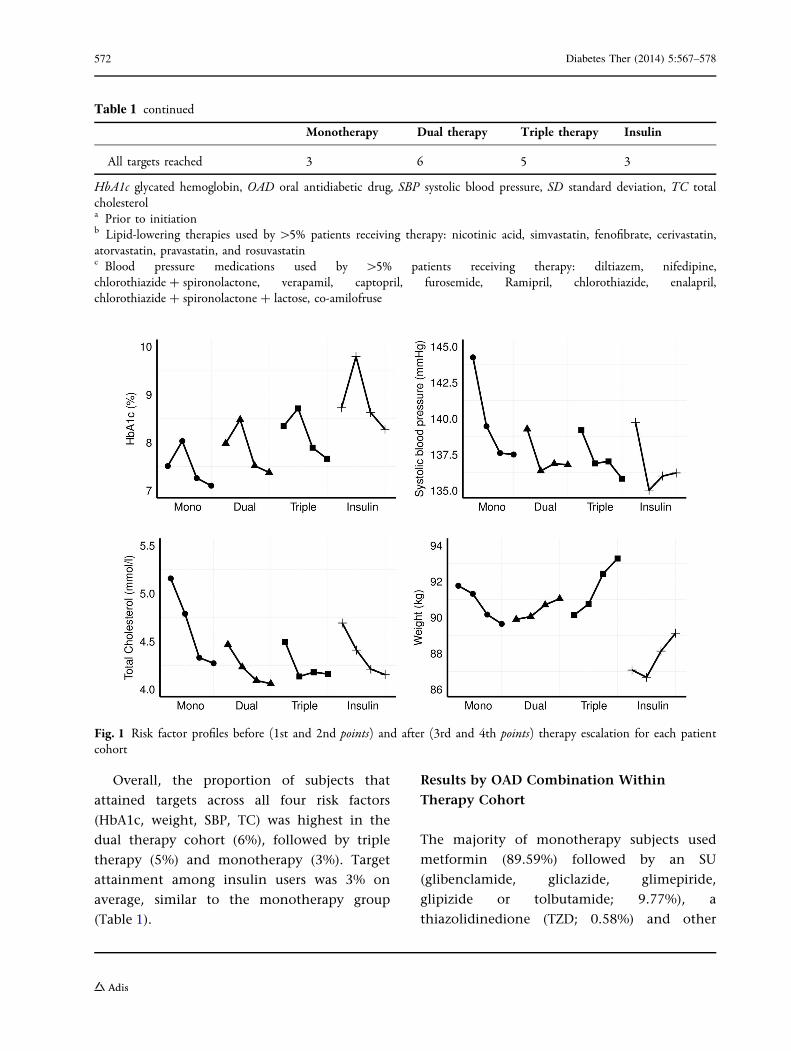
All OAD cohorts were associated with an
increase in mean HbA1c prior to OAD
initiation (monotherapy) or escalation (dual
and triple therapy), followed by an observed
decline in mean HbA1c post-initiation/
escalation (Table 1; Fig. 1). Insulin users had
the highest starting HbA1c levels
(mean ± SD: 9.78 ± 1.94). Among non-
insulin users, HbA1c levels prior to OAD
progression were highest in the triple
therapy cohort (8.71 ± 1.19), followed by
dual therapy (8.48 ± 1.28) and monotherapy
(8.03 ± 1.24). Across all therapy cohorts,
statistically significant (P\0.05) changes in
HbA1c between -0.93 and -1.47 were
observed in the period following therapy
progression.
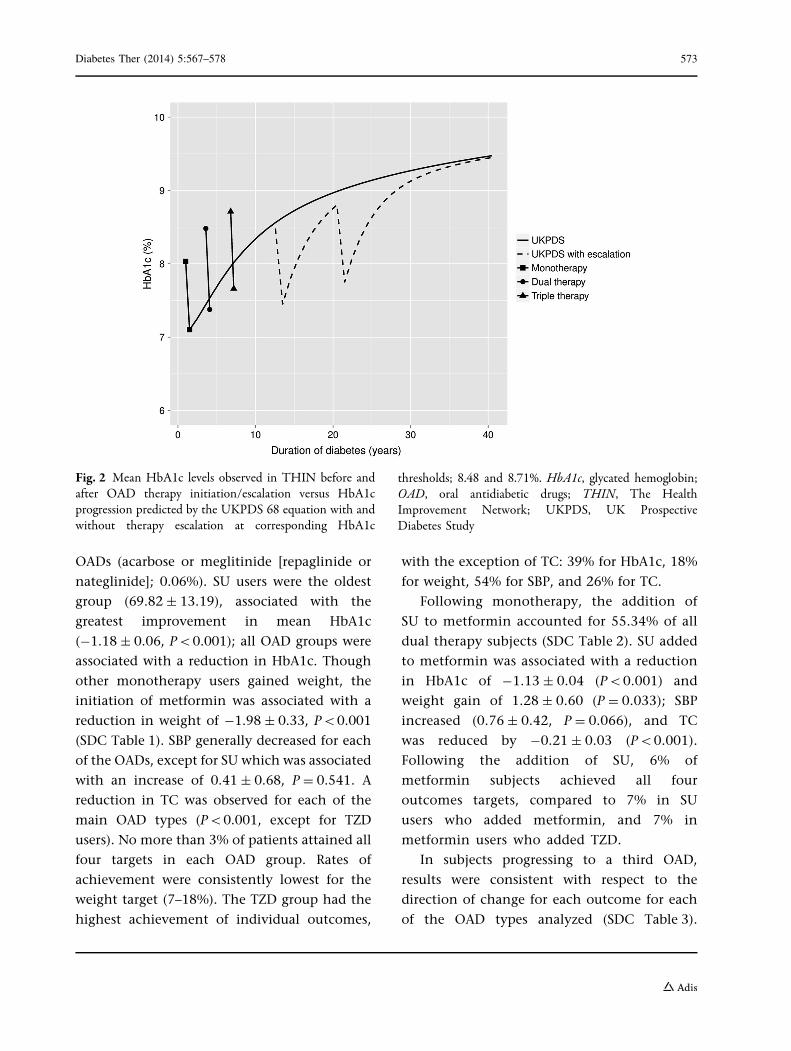
Mean HbA1c levels observed in each OAD
cohort before and after the initiation/escalation
of therapy, plotted against the HbA1c profile
predicted using results of the UK Prospective
Diabetes Study (UKPDS) can be seen in Fig. 2 [9];
the position of reductions in HbA1c plotted for
each OAD cohort reflects the mean duration of
treatment observed in each cohort prior to
therapy escalation. At initiation of
monotherapy, the mean time since diagnosis
of diabetes was 1.00 ± 1.60 years: patients
received monotherapy for 2.64 ± 2.06 years
prior to the addition of a second OAD;
patients received dual therapy for
3.15 ± 2.41 years prior to the addition of a
third OAD. The mean characteristics of the
monotherapy cohort were used to initialize the
HbA1c trajectory derived using the UKPDS 68
equation and therapy escalation thresholds
implemented at 8.48 and 8.71%,
corresponding to the dual and triple therapy
cohorts, respectively.
With regard to weight profile, the
monotherapy cohort was associated with a
decline in weight (kg) of -1.67 ± 0.32
(P\0.001). Conversely, the addition of a
second or third OAD or insulin was associated
with weight gain at therapy escalation
(P\0.05).
With regard to the risk factors SBP and
TC, the monotherapy cohort experienced
an average reduction of -1.96 ± 0.10 in
SBP (P\0.001) and -0.52 ± 0.02 in TC
(P\0.001). Dual therapy subjects and
insulin users were associated with a decrease
in TC and increase in SBP, while the
converse was observed in subjects adding a
third OAD. Attainment of SBP and TC targets
was low, despite the use of blood pressure
and lipid-lowering medications in the
majority of patients.
570 Diabetes Ther (2014) 5:567–578
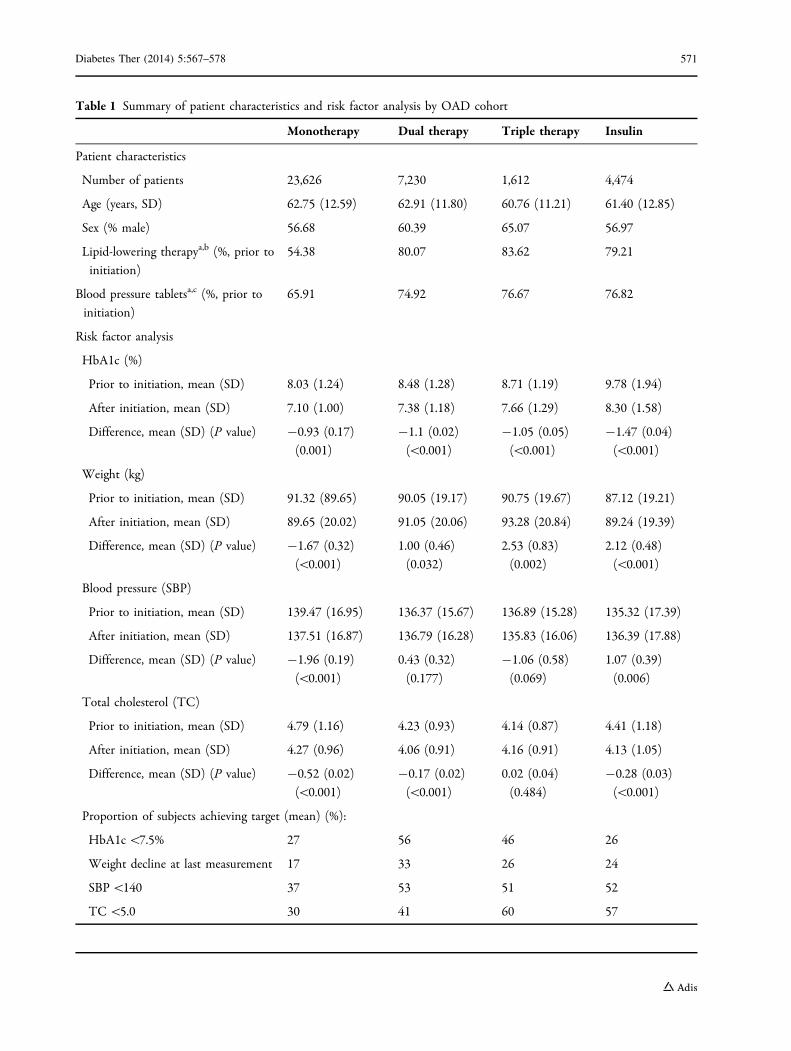
Table 1 Summary of patient characteristics and risk factor analysis by OAD cohort
Monotherapy Dual therapy Triple therapy Insulin
Patient characteristics
Number of patients 23,626 7,230 1,612 4,474
Age (years, SD) 62.75 (12.59) 62.91 (11.80) 60.76 (11.21) 61.40 (12.85)
Sex (% male) 56.68 60.39 65.07 56.97
Lipid-lowering therapya,b (%, prior to
initiation)
54.38 80.07 83.62 79.21
Blood pressure tabletsa,c (%, prior to
initiation)
65.91 74.92 76.67 76.82
Risk factor analysis
HbA1c (%)
Prior to initiation, mean (SD) 8.03 (1.24) 8.48 (1.28) 8.71 (1.19) 9.78 (1.94)
After initiation, mean (SD) 7.10 (1.00) 7.38 (1.18) 7.66 (1.29) 8.30 (1.58)
Difference, mean (SD) (P value) -0.93 (0.17)
(0.001)
-1.1 (0.02)
(\0.001)
-1.05 (0.05)
(\0.001)
-1.47 (0.04)
(\0.001)
Weight (kg)
Prior to initiation, mean (SD) 91.32 (89.65) 90.05 (19.17) 90.75 (19.67) 87.12 (19.21)
After initiation, mean (SD) 89.65 (20.02) 91.05 (20.06) 93.28 (20.84) 89.24 (19.39)
Difference, mean (SD) (P value) -1.67 (0.32)
(\0.001)
1.00 (0.46)
(0.032)
2.53 (0.83)
(0.002)
2.12 (0.48)
(\0.001)
Blood pressure (SBP)
Prior to initiation, mean (SD) 139.47 (16.95) 136.37 (15.67) 136.89 (15.28) 135.32 (17.39)
After initiation, mean (SD) 137.51 (16.87) 136.79 (16.28) 135.83 (16.06) 136.39 (17.88)
Difference, mean (SD) (P value) -1.96 (0.19)
(\0.001)
0.43 (0.32)
(0.177)
-1.06 (0.58)
(0.069)
1.07 (0.39)
(0.006)
Total cholesterol (TC)
Prior to initiation, mean (SD) 4.79 (1.16) 4.23 (0.93) 4.14 (0.87) 4.41 (1.18)
After initiation, mean (SD) 4.27 (0.96) 4.06 (0.91) 4.16 (0.91) 4.13 (1.05)
Difference, mean (SD) (P value) -0.52 (0.02)
(\0.001)
-0.17 (0.02)
(\0.001)
0.02 (0.04)
(0.484)
-0.28 (0.03)
(\0.001)
Proportion of subjects achieving target (mean) (%):
HbA1c \7.5% 27 56 46 26
Weight decline at last measurement 17 33 26 24
SBP \140 37 53 51 52
TC \5.0 30 41 60 57
Diabetes Ther (2014) 5:567–578 571
Overall, the proportion of subjects that
attained targets across all four risk factors
(HbA1c, weight, SBP, TC) was highest in the
dual therapy cohort (6%), followed by triple
therapy (5%) and monotherapy (3%). Target
attainment among insulin users was 3% on
average, similar to the monotherapy group
(Table 1).
Results by OAD Combination Within
Therapy Cohort
The majority of monotherapy subjects used
metformin (89.59%) followed by an SU
(glibenclamide, gliclazide, glimepiride,
glipizide or tolbutamide; 9.77%), a
thiazolidinedione (TZD; 0.58%) and other
Table 1 continued
Monotherapy Dual therapy Triple therapy Insulin
All targets reached 3 6 5 3
HbA1c glycated hemoglobin, OAD oral antidiabetic drug, SBP systolic blood pressure, SD standard deviation, TC totalcholesterola Prior to initiationb Lipid-lowering therapies used by [5% patients receiving therapy: nicotinic acid, simvastatin, fenofibrate, cerivastatin,atorvastatin, pravastatin, and rosuvastatinc Blood pressure medications used by [5% patients receiving therapy: diltiazem, nifedipine,chlorothiazide ? spironolactone, verapamil, captopril, furosemide, Ramipril, chlorothiazide, enalapril,chlorothiazide ? spironolactone ? lactose, co-amilofruse
Fig. 1 Risk factor profiles before (1st and 2nd points) and after (3rd and 4th points) therapy escalation for each patientcohort
572 Diabetes Ther (2014) 5:567–578
OADs (acarbose or meglitinide [repaglinide or
nateglinide]; 0.06%). SU users were the oldest
group (69.82 ± 13.19), associated with the
greatest improvement in mean HbA1c
(-1.18 ± 0.06, P\0.001); all OAD groups were
associated with a reduction in HbA1c. Though
other monotherapy users gained weight, the
initiation of metformin was associated with a
reduction in weight of -1.98 ± 0.33, P\0.001
(SDC Table 1). SBP generally decreased for each
of the OADs, except for SU which was associated
with an increase of 0.41 ± 0.68, P = 0.541. A
reduction in TC was observed for each of the
main OAD types (P\0.001, except for TZD
users). No more than 3% of patients attained all
four targets in each OAD group. Rates of
achievement were consistently lowest for the
weight target (7–18%). The TZD group had the
highest achievement of individual outcomes,
with the exception of TC: 39% for HbA1c, 18%
for weight, 54% for SBP, and 26% for TC.
Following monotherapy, the addition of
SU to metformin accounted for 55.34% of all
dual therapy subjects (SDC Table 2). SU added
to metformin was associated with a reduction
in HbA1c of -1.13 ± 0.04 (P\0.001) and
weight gain of 1.28 ± 0.60 (P = 0.033); SBP
increased (0.76 ± 0.42, P = 0.066), and TC
was reduced by -0.21 ± 0.03 (P\0.001).
Following the addition of SU, 6% of
metformin subjects achieved all four
outcomes targets, compared to 7% in SU
users who added metformin, and 7% in
metformin users who added TZD.
In subjects progressing to a third OAD,
results were consistent with respect to the
direction of change for each outcome for each
of the OAD types analyzed (SDC Table 3).
Fig. 2 Mean HbA1c levels observed in THIN before andafter OAD therapy initiation/escalation versus HbA1cprogression predicted by the UKPDS 68 equation with andwithout therapy escalation at corresponding HbA1c
thresholds; 8.48 and 8.71%. HbA1c, glycated hemoglobin;OAD, oral antidiabetic drugs; THIN, The HealthImprovement Network; UKPDS, UK ProspectiveDiabetes Study
Diabetes Ther (2014) 5:567–578 573

Reductions in HbA1c ranged from -0.90 to
-1.33 (P\0.001 in each group), increases in
weight from 2.12 to 3.63 (P\0.05 in
metformin ? SU ? TZD group only), decreases
in SBP from -0.48 to -2.35 (P\0.05 in
SU ? metformin ? TZD group only), and
increases in TC from 0.11 to 0.25 (P\0.05
in each group, with the exception of
metformin ? SU ? TZD). Proportions of
patients attaining all four targets ranged from
4% to 8% in the metformin ? SU ? TZD and
metformin ? TZD ? SU groups, respectively.
Among the 4,474 insulin users, 4,464
(99.8%) used at least one OAD, 3,730
(83.4%) used two OADs and 1,358 (30.4%)
used three OADs. Age, sex, and concomitant
lipid-lowering and blood pressure therapy
use were similar between the groups at
baseline (SDC Table 4). HbA1c and TC levels
consistently fell among insulin users
(P\0.001), while weight (P\0.05) and SBP
(P\0.01) increased in all the three OAD
groups. Similar proportions of patients
achieved target attainment in each OAD/
insulin group (1–3%).
Results by Age
Subgroup analyses of patients above and below
70 years of age did not suggest that levels of
target attainment were lower in older patients
(SDC Table 5). With the exception of SBP in
patients receiving more than one OAD,
observed attainment rates of individual and
combined targets were not lower in the higher
age group.
DISCUSSION
Unmet clinical need may be broadly defined as
a ‘‘medical need that is not addressed
adequately by an existing therapy’’ [10]. In the
context of pharmacological management of
T2DM, this definition relates to treatments
that do not improve or adequately control risk
factors. Previous studies have demonstrated
delays in treatment intensification in UK
clinical practice despite poor glycemic control
[11]. In this study, the cardiovascular risk
factors, weight, SBP, and TC, were considered
in addition to glycemic control, the
predominant measure of success of
pharmacotherapy in this setting [10].
Using routinely collected patient-level data
from UK general practice, a potential unmet
clinical need was identified, in the form of
patients requiring progression to multiple
pharmacotherapies and a significant
proportion of patients failing to achieve
reductions in the risk factors considered to be
the goals of therapy across all pathways
examined.
People with T2DM treated with a single OAD
were associated with improvements in each of
the four risk factors analyzed (HbA1c, weight,
SBP and TC), but relative to dual and triple
therapy users, fewer monotherapy subjects
attained target levels for each of these risk
factors; consequently, single OAD use was
associated with the lowest proportion of
subjects achieving a reduction in all four risk
factors. Insulin users demonstrated reductions
in HbA1c and TC, but an increase in weight and
SBP.
HbA1c levels prior to therapy initiation/
escalation were higher with the addition of
each OAD, and were higher again in insulin
users. This might reflect a decline in beta cell
function that is associated with the natural
progression of T2DM, and hence the need for
more intensive pharmacological management
[3]. A pattern of increased or decreased starting
levels from single to multiple OAD therapies
was not observed for weight. However, for both
574 Diabetes Ther (2014) 5:567–578
SBP and TC, levels prior to initiation of
monotherapy were higher than levels prior to
escalation to a second and third OAD.
Together, these findings indicate that in UK
general practice, therapy escalation in the
management of T2DM is triggered by the need
for better glycemic control (as evidenced by
higher starting levels prior to change). It may be
inferred that SBP and TC, conversely, do not
drive the timing of therapy escalation, as
evidenced by the lower starting levels for these
outcomes in the multiple OAD cohorts, though
they may influence the choice of additional
OAD at therapy escalation.
The 2012 quality outcomes framework (QoF)
results suggested that attainment levels of
HbA1c targets (B7%) in England and Wales
were approaching 70%. Attainment of blood
pressure and cholesterol targets were *71% and
82%, respectively [12, 13]. Measures such as
QoF paint a picture of successful T2DM
management with respect to the control of
cardiovascular risk factors and the satisfaction
of related targets; however, results presented
herein suggest that this is not the case for the
many patients requiring therapy escalation in
clinical practice.
Of the four targets evaluated, lowest
attainment levels were observed for weight.
Some glucose-lowering therapies are associated
with weight gain, which may contribute to
these observations. Weight change was
included in this study despite this link due to
its importance as a recognized cardiovascular
risk factor, associated with excess mortality risk
[14] and negative impact on quality of life [15].
To support economic evaluation, many
T2DM disease models utilize results from
UKPDS, including predicting the expected
trajectory of HbA1c levels [9]. However, real-
world observations suggest that the HbA1c
profiles of patients undergoing treatment
escalation do not conform to this average
predicted trajectory, and additional OADs may
be added sooner than is predicted. A possible
explanation for this may be that there exists a
group of slow progressing patients, whose
HbA1c is well controlled, bringing the average
trajectory of HbA1c down and distorting our
understanding of reality. The observed numbers
of patients in each cohort would support this
idea; with the majority of patients captured in
THIN receiving monotherapy and smaller
patient groups progressing to double, triple or
insulin therapy.
From the patients’ perspectives, suboptimal
clinical response is known to increase morbidity
and mortality, and reduce quality of life, from a
range of health-related complications. In turn,
sufferers and their families are financially
burdened, most commonly with out-of-pocket
expenses associated with disease management
and losses in earning potential [16]. The
economic implications from such unmet need
are considerable; recent research has estimated
that the true cost of managing T2DM in the UK
is in the region of £3.5 billion [17, 18]. Hence,
newer treatments for T2DM and combinations
thereof that have been shown to be clinically
effective (in absolute and comparative terms)
are required to further improve patient health
outcomes and reduce the economic burden of
T2DM.
The findings of this research are set against a
number of inherent limitations in the use of
routinely collected observational data in
characterizing patient outcomes following
treatment. These include treatment selection
bias where factors that have determined what
type(s) of pharmacotherapy an individual
receives are not accounted for in the analysis.
On this limitation, the aim of this study was to
statistically describe the observed data; as such,
statistical techniques to (potentially) address
Diabetes Ther (2014) 5:567–578 575
such bias were not employed at the data
extraction or analysis stage, though such
techniques cannot fully account for the
inherent limitations of datasets such as THIN.
It is considered, however, that the value of these
analyses outweighs this limitation [19]. In line
with the audit-style approach of the study, the
significance of missing records among routinely
collected data was not investigated.
This study was a cross-sectional analysis of
patient cohorts defined by the number of and
timing of pharmacotherapies used in the
management of T2DM. It was not possible to
map the trajectory of individual patients as they
moved from single to multiple OADs and to
insulin therapy.
Treatment goals are highly individualized in
practice. Though clinicians may take a more
cautious approach to the management of
elderly patients, results did not suggest that
target attainment was lower in patients aged
[70 years. While lower HbA1c targets of 6.5%
or 7% may be appropriate for some patients,
7.5% was evaluated as a less stringent target
relevant to the majority of patients across all
lines of therapy. Consequently, reported
attainment of HbA1c targets may be
overestimated among patients at low risk of
hypoglycemia, with short duration of diabetes
and little comorbidity. Though it was outside
the scope of this study, the incidence of
hypoglycemia and hospitalization are
important patient outcomes for consideration,
particularly following therapy initiation and
intensification.
This study focused on unmet need among
patients receiving conventional therapies. A
future evaluation could assess whether similar
levels of unmet need exist, and whether the
observed therapy escalation thresholds remain,
among patients prescribed novel therapies such
as DPP-4 inhibitors.
The explanations underlying instances of
suboptimal clinical outcomes and poor target
attainment characterizing unmet clinical need
in this population cannot be inferred with
certainty.
CONCLUSION
Patient outcomes among people with T2DM
treated in UK general practice were often
below what are considered to be milestones
of optimal clinical response, even with a
combination of pharmacotherapies. The
potential unmet clinical need among people
with T2DM is significant with respect to the
control of blood glucose and other
cardiovascular risk factors, including TC, SBP,
and weight. Conventional treatment strategies
are variably effective in managing the
condition, and thus there is a need for new
therapeutic agents, or approaches to
treatment, to alleviate the health and
economic burden associated with the T2DM.
ACKNOWLEDGMENTS
Sponsorship and article processing charges for
this study were funded by AstraZeneca plc,
Molndal, Sweden. The funding agreement
ensured the authors’ independence in
designing the study, interpreting the data,
writing, and publishing the report. Editorial
assistance for this study was provided by
Samantha Webster of Health Economics and
Outcomes Research Ltd and funded by
AstraZeneca plc, Molndal, Sweden. All named
authors meet the ICMJE criteria for authorship
for this manuscript, take responsibility for the
integrity of the work as a whole, and have
given final approval to the version to be
published.
576 Diabetes Ther (2014) 5:567–578
Conflict of interest. Klas Bergenheim is an
employee of AstraZeneca plc.
Compliance with ethics. This article does
not contain any new studies with human or
animal subjects performed by any of the
authors.
Open Access. This article is distributed
under the terms of the Creative Commons
Attribution Noncommercial License which
permits any noncommercial use, distribution,
and reproduction in any medium, provided the
original author(s) and the source are credited.
REFERENCES
1. American Diabetes Association, Lung NationalHeart, and Blood Institute, Juvenile DiabetesFoundation International, National Institute ofDiabetes and Digestive and Kidney Diseases,American Heart Association. Diabetes mellitus: amajor risk factor for cardiovascular disease.Circulation. 1999;100:1132–3.
2. Masso Gonzalez EL, Johansson S, Wallander M-A,Garcıa Rodrıguez LA. Trends in the prevalence andincidence of diabetes in the UK: 1996–2005.J Epidemiol Commun Health. 2009;63(4):332–6.
3. Festa A, Williams K, D’Agostino R Jr, WagenknechtLE, Haffner SM. The natural course of beta-cellfunction in nondiabetic and diabetic individuals:the Insulin Resistance Atherosclerosis Study.Diabetes. 2006;55(4):1114–20.
4. National Institute for Health and Care Excellence.CG87. Type 2 diabetes—newer agents. 2009.
5. Inzucchi SE, Bergenstal RM, Buse JB, Diamant M,Ferrannini E, Nauck M, et al. Management ofhyperglycemia in type 2 diabetes: a patient-centered approach: position statement of theAmerican Diabetes Association (ADA) and theEuropean Association for the Study of Diabetes(EASD). Diabetes Care. 2012;35(6):1364–79.
6. Cegedim strategic data. The Health ImprovementNetwork (THIN) database. 2014 Accessed.
7. National Institute for Health and Care Excellence.CG66. Type 2 diabetes—the management of type 2diabetes. 2008.
8. StataCorp. Stata Statistical Software: release 13.2013.
9. Clarke PM, Gray AM, Briggs A, Farmer AJ, Fenn P,Stevens RJ, et al. A model to estimate the lifetimehealth outcomes of patients with type 2 diabetes:the United Kingdom Prospective Diabetes Study(UKPDS) Outcomes Model (UKPDS no. 68).Diabetologia. 2004;47(10):1747–59.
10. Food and drug administration. SOPP 8414: fasttrack drug development programs: designation andreview programs. 2001. Available at http://www.fda.gov/biologicsbloodvaccines/guidancecomplian-ceregulatoryinformation/proceduressopps/ucm073-515.htm. Accessed August 2014.
11. Khunti K, Wolden ML, Thorsted BL, Andersen M,Davies MJ. Clinical inertia in people with type 2diabetes: a retrospective cohort study of more than80,000 people. Diabetes Care. 2013;36(11):3411–7.
12. Health and Social Care Information Centre. Qualityand outcomes framework—2011–12, England level.2012. Available at http://www.hscic.gov.uk/catalogue/PUB08661. Accessed August 2014.
13. StatsWales. Quality and outcomes framework.2013. Available at https://statswales.wales.gov.uk/Catalogue/Health-and-Social-Care/NHS-Primary-and-Community-Activity/GMS-Contract. AccessedAugust 2014.
14. Bodegard J, Sundstrom J, Svennblad B, Ostgren CJ,Nilsson PM, Johansson G. Changes in body massindex following newly diagnosed type 2 diabetesand risk of cardiovascular mortality: a cohort studyof 8486 primary-care patients. Diabetes Metab.2013;39(4):306–13.
15. Lane S, Levy AR, Mukherjee J, Sambrook J, TildesleyH. The impact on utilities of differences in bodyweight among Canadian patients with type 2diabetes. Curr Med Res Opin. 2014;30(7):1267–73.
16. Kankeu HT, Saksena P, Xu K, Evans DB. Thefinancial burden from non-communicable diseasesin low- and middle-income countries: a literaturereview. Health Res Policy Syst/BioMed Central.2013;11:31.
17. NHS Diabetes. Report number 46357 Diabetes inthe NHS, 2007. Published by the National DiabetesSupport Team on behalf a group of diabetesspecialists in England. 2007. Available at www.diabetes.nhs.uk/document.php?o=318. AccessedOctober 2011.
18. The NHS Information Centre. Prescribing fordiabetes in England: 2005/6–2010/11. 2011.Available at http://www.ic.nhs.uk/webfiles/publications/prescribing%20diabetes%20200506
Diabetes Ther (2014) 5:567–578 577

%20to%20201011/Prescribing_for_Diabetes_in_England_20056_to_201011.pdf. Accessed October2011.
19. Gordon J, Pockett RD, Tetlow AP, McEwan P, HomePD. A comparison of intermediate and long-acting
insulins in people with type 2 diabetes startinginsulin: an observational database study. Int J ClinPract. 2010;64(12):1609–18.
578 Diabetes Ther (2014) 5:567–578


