
ASSESSMENT OF THE INFRASTRUCTURE TO MANAGE ELECTRONIC
SCRAP IN ILLINOIS
Prepared for
Illinois Recycling Association P. O. Box 3717
Oak Park, Illinois 61802 (708) 358-0050
Under a Grant Provided by
Illinois Department of Commerce and Economic Opportunity Bureau of Energy and Recycling
620 East Adams Springfield, Illinois 62701
(217) 782-7887 Prepared by Engineering Solutions & Design, Inc. 9393 W. 110th Street, Suite 500 Overland Park, Kansas 66210 (800) 298-1851
October 17, 2007

Assessment of the Infrastructure To Manage Electronic Scrap In Illinois
ACKNOWLEDGEMENTS
Engineering Solutions & Design, Inc. would like to thank the following organizations
and individuals for their technical review and text preparation support. Without their
support this report could not have been completed successfully.
Illinois Department of Commerce and Economic Opportunity Bureau of Energy and Recycling Staff
David Ross
Diana DeWeese David Smith
Sam Al-Basha
Illinois Recycling Association
Rod Fletcher
Engineering Solutions & Design, Inc.
Executive Summary Page i
EXECUTIVE SUMMARY
The Illinois Recycling Association (IRA) received a grant from the Illinois Department of
Commerce and Economic Opportunity (DCEO) to determine the current and potential
electronic scrap (E-scrap) processing and/or refurbishing capacity in the State of Illinois.
This effort was divided into three distinct parts: (1) determining the number of entities
presently involved in the electronic scrap industry in Illinois; (2) identifying a reliable
estimate of the amount of electronic scrap that is presently generated and the potential
amount of electronic scrap that could be generated by 2010; and (3) providing a discussion
and geographical mapping to outlines information on the present electronic scrap industry
and its capability to manage estimated quantities of E-scrap generated in the state.
Two parallel data collection efforts were conducted as a part of this project. One
effort focused on the collection of data that could be utilized to determine the generation
rate of electronic scrap for the State of Illinois. The other effort focused on identifying
various entities within the state that comprise the Illinois electronic scrap recycling industry.
The search for electronic scrap recyclers within the State of Illinois began with a list
of 213 potential contacts within the state. From this initial list, 78 organizations and 87
locations were found that currently are involved in electronic scrap recycling in Illinois.
For the purposes of this assessment, an E-scrap recycler is the umbrella term used
for the following terms:
Processor – A business that utilizes manual dismantling processes and/or mechanical de-manufacturing to recover commodities. Refurbisher – A business that accepts non-functioning or damaged covered electronic devices (CED’s) and repairs them to a functioning state for subsequent re-use by persons other than the original owner. Broker – A business that engages in the buying, selling, or trading of CED’s without performing any processing or refurbishing processes. Collector – A business or entity that provides a permanent drop-off or collection point. Reseller – A retail business that accepts used CED’s, performs cosmetic cleanup, and resells the CED to the general public.
Engineering Solutions & Design, Inc.
Executive Summary Page ii
Many of the organizations contacted provided more than one type of E-scrap
recycling. There are:
• 10 organizations that collect and process E-scrap;
• 11 organizations that collect and resell E-scrap;
• 2 organizations that collect, process, refurbish and resell E-scrap;
• 20 organizations that collect and refurbish E-scrap;
• 8 organizations that collect, refurbish and resell E-scrap
• 3 organizations that processes and refurbishes E-scrap; and
• 2 organizations that collects, processes, and resells E-scrap.
Of the 78 organizations that were contacted and responded, a total of 41 of these
organizations were willing to complete a questionnaire. Of the 41 organizations that
provided responses to the questionnaire, 21 limited their operation to the collection of
various types of E-scrap. The remaining 20 responding organizations processed or
refurbished E-scrap and of these, 12 also collected E-scrap and 1 resold some electronic
equipment. To compliment the state list, a list of nationally-based E-scrap recyclers was
developed. Of the 142 initial contacts, 41 nationally-based organizations that recycle E-
scrap for Illinois residents were identified.
The next step in the study was to develop a per capita electronic scrap generation
rate for both rural and urban areas. The E-Scrap generation rate for Illinois is based on
waste characterization studies that provide data that best correspond to the State of Illinois.
The data from these studies was utilized to develop formulas that produced the following
generation rates.
• Rural Area Per Capita Electronic Scrap Generation Rate = 9.17 pounds/year
• Urban Area Per Capita Electronic Scrap Generation Rate = 15.27 pounds/year
Utilizing these generation rates, the urban and rural E-scrap generation rates for
Illinois in 2007 and 2010 were developed. The following table presents this information.
.

Engineering Solutions & Design, Inc.
Executive Summary Page iii
E-SCRAP GENERATION RATES FOR ILLINOIS
Electronic Scrap Generation (Tons)
Area
Population
2007 2010
Urban
11,462,549
87,517
109,396
Rural
1,369,421
6,279
7,848
Entire State
12,831,970
93,796
117,244
Although these generation rates are based on the best available information, it is
important to note that these rates are not firm, fixed numbers. They are a reflection of the
best available data and it is affected by a number of variables. These variables – including
the constant changes in electronics, purchasing decisions by consumers and businesses, and
the rate of obsolescence of electronic products – make any E-Scrap generation rate a
reasonable assumption, at best.
A potential impact on the E-Scrap system in Illinois is the pending switch from
analog to digital television signals. This situation has the strong potential to initially
overwhelm processors in the state and markets for CRT’s and monitors from Illinois.
Considering a national impact, the conversion will likely flood processors who will be unable
to keep up, drop market prices for lead glass, and regrettably landfilling will become the
primary management option.
The final step in the study was the determination of the ability of the E-scrap system
in Illinois to process the E-scrap generated in the state. Eliminating the limited impact of E-
scrap refurbishers on the system, the E-scrap processors were evaluated. Based on the E-
scrap processors’ responses to the questionnaire, the annual throughput for these
processors was calculated by a straight-forward method of multiplying the daily throughput
of each processor by 260 annual work days – a 5-day work week schedule. Based on this
calculation the current annual throughput for all of the processors is 83,720 tons.
However, the determination for potential capacity includes other variables. While
processors did supply the number of daily work shifts, many indicated that work shifts vary.
Many shifts are only 8 hours a day, but others indicated that a work shift can range higher,
from 8 up to 12 hours per day, as may be needed to accomplish their production schedules.
Processors also experience down time for unexpected situations and scheduled equipment
maintenance.

Engineering Solutions & Design, Inc.
Executive Summary Page iv
Utilizing the figure of 83,700 tons for the present annual throughput for the
processors, an analysis of the processors’ potential to increase throughput capacity was
conducted. This analysis resulted in a baseline potential capacity of 125,580 tons per year
and a maximum capacity of 175,812 tons per year, given the existing infrastructure. Some
firms may fall short of the maximum while others may exceed their individual maximum.
This then results in an operational range of existing facilities from the current throughput of
83,720 up to an estimated maximum of 175,812 tons per year. The primary concentration
of processors is in the Chicago MSA with 76% of the maximum throughput or 133,224 tons
per year. The St. Louis MSA has a capacity of 38,220 tons per year and represents 22% of
the maximum throughput. The following table indicates that the State of Illinois could have
a potential processing surplus capacity of 58,562 tons per year.
STATEWIDE GENERATION VS. CAPACITY
2010 (Tons)
Estimated E-scrap Generation
117,250
Estimated Maximum Capacity
175,812
Net Difference
58,562
While it would appear that sufficient processing capacity would exist, there is a
significant point to note. The survey was unable to ascertain what quantity of E-scrap is
originating from out-of-state sources and currently being accepted and processed in Illinois.
Survey information indicated that this was occurring now; however, it is unknown what
quantities or percentage of processing capabilities this would affect in the future.
Given the rapid development and interest of private sector entities to create and
expand the E-scrap processing business overall, it would be reasonable to expect that any
potential deficiency in processing capacity within the state would be an opportunity not to
be overlooked by in-state entities as well as regional and national processing entities. The
adoption of proposed state legislation will likely trigger a combination of in-state and out-of-
state partnerships and arrangements to adequately manage E-scrap

Engineering Solutions & Design, Inc.
Page i
TABLE OF CONTENTS
LIST OF TABLES. . . . . . . . . . . . . . . . . . . . . . . . . . . . . . . . . . . . . . . . . . . . . . . . . . . ii LIST OF FIGURES. . . . . . . . . . . . . . . . . . . . . . . . . . . . . . . . . . . . . . . . . . . . . . . . . . iii 1.0
INTRODUCTION. . . . . . . . . . . . . . . . . . . . . . . . . . . . . . . . . . . . . . . . . . . . . . 1
2.0
DATA COLLECTION. . . . . . . . . . . . . . . . . . . . . . . . . . . . . . . . . . . . . . . . . . . . 2
2.1
ELECTRONIC SCRAP RECYCLING ENTITIES. . . . . . . . . . . . . . . . . . . . . . . 2
2.1.1 Contact Procedure. . . . . . . . . . . . . . . . . . . . . . . . . . . . . . . . . . . . 2
2.1.2 Contact Issues. . . . . . . . . . . . . . . . . . . . . . . . . . . . . . . . . . . . . . . 5
2.1.3 Contact Results. . . . . . . . . . . . . . . . . . . . . . . . . . . . . . . . . . . . . . 5
2.1.4 Survey Results. . . . . . . . . . . . . . . . . . . . . . . . . . . . . . . . . . . . . . . 17
2.1.5 Nationally Based E-Scrap Recyclers. . . . . . . . . . . . . . . . . . . . . . . . 26
2.2
GENERATION RATE DATA COMPILATION. . . . . . . . . . . . . . . . . . . . . . . . . 33
2.2.1 Comparable Studies. . . . . . . . . . . . . . . . . . . . . . . . . . . . . . . . . . . 33
2.2.2 Limitations of Information. . . . . . . . . . . . . . . . . . . . . . . . . . . . . . . 33
2.2.3 Data Analysis. . . . . . . . . . . . . . . . . . . . . . . . . . . . . . . . . . . . . . . . 34
2.2.4 Analog Television Impact. . . . . . . . . . . . . . . . . . . . . . . . . . . . . . . 37
3.0
INTERACTIVE MAP. . . . . . . . . . . . . . . . . . . . . . . . . . . . . . . . . . . . . . . . . . . . 38
4.0
GENERATION RATES. . . . . . . . . . . . . . . . . . . . . . . . . . . . . . . . . . . . . . . . . . . 43
5.0
PROCESSING CAPACITY. . . . . . . . . . . . . . . . . . . . . . . . . . . . . . . . . . . . . . . . . 47
6.0
CONCLUSIONS. . . . . . . . . . . . . . . . . . . . . . . . . . . . . . . . . . . . . . . . . . . . . . . 52
7.0
REFERENCES. . . . . . . . . . . . . . . . . . . . . . . . . . . . . . . . . . . . . . . . . . . . . . . . 56

Engineering Solutions & Design, Inc.
Page ii
LIST OF TABLES
TABLE 1
SURVEY QUESTIONS. . . . . . . . . . . . . . . . . . . . . . . . . . . . . . . . . . . . . . . 3
TABLE 2
E-SCRAP RECYCLERS IN ILLINOIS. . . . . . . . . . . . . . . . . . . . . . . . . . . . . 6
TABLE 3
NUMBER OF E-SCRAP RECYCLERS WITHIN EACH CLASSIFICATION. . . . . . 11
TABLE 4
ILLINOIS COUNTIES WITH E-SCRAP RECYCLING LOCATIONS. . . . . . . . . . 15
TABLE 5
ILLINOIS ECONOMIC DEVELOPMENT REGIONS WITH E-SCRAP RECYCLING LOCATIONS . . . . . . . . . . . . . . . . . . . . . . . . . 16
TABLE 6A
OPERATIONAL INFORMATION FOR E-SCRAP COLLECTORS IN ILLINOIS. . . . . . . . . . . . . . . . . . . . . . . . . . . . . . . . . . . 20
TABLE 6B
ADDITIONAL OPERATIONAL INFORMATION FOR E-SCRAP COLLECTORS IN ILLINOIS. . . . . . . . . . . . . . . . . . . . . . . . . 21
TABLE 7A
OPERATIONAL INFORMATION FOR E-SCRAP PROCESSORS AND/OR REFURBISHERS IN ILLINOIS. . . . . . . . . . . . . . . . . 24
TABLE 7B
ADDITIONAL OPERATIONAL INFORMATION FOR E-SCRAP PROCESSORS AND/OR REFURBISHERS IN ILLINOIS. . . . . . . . . . . . . . . . . 25
TABLE 8
NATIONALLY-BASED E-SCRAP RECYCLERS. . . . . . . . . . . . . . . . . . . . . . . 27
TABLE 9
NATIONALLY-BASED ELECTRONIC COMPANIES THAT ACCEPT E-SCRAP. . . 29
TABLE 10
OPERATIONAL INFORMATION FOR NATIONAL E-SCRAP PROCESSORS AND/OR REFURBISHERS. . . . . . . . . . . . . . . . . . . 32
TABLE 11
E-SCRAP GENERATION RATES FOR ILLINOIS. . . . . . . . . . . . . . . . . . . . . 43
TABLE 12
E-SCRAP GENERATION RATES FOR ECONOMIC DEVELOPMENT REGIONS. . 44
TABLE 13
E-SCRAP GENERATION RATES FOR URBAN ILLINOIS COUNTIES. . . . . . . . 45
TABLE 14
E-SCRAP GENERATION RATES FOR RURAL ILLINOIS COUNTIES. . . . . . . . 46
TABLE 15
E-SCRAP PROCESSING CAPACITY FOR ILLINOIS . . . . . . . . . . . . . . . . . . . 48
TABLE 16
STATEWIDE GENERATION VS. CAPACITY. . . . . . . . . . . . . . . . . . . . . . . . 51

LIST OF FIGURES
FIGURE 1
ILLINOIS COUNTIES WITH E-SCRAP RECYCLERS. . . . . . . . . . . . . . . . . . . 12
FIGURE 2
ILLINOIS COUNTIES WITH E-SCRAP COLLECTORS. . . . . . . . . . . . . . . . . . 13
FIGURE 3
ILLINOIS COUNTIES WITH E-SCRAP PROCESSORS/REFURBISHERS. . . . . . 14
FIGURE 4
INTERACTIVE MAP LISTING FEATURES AND COUNTY INTERFACE. . . . . . . . 39
FIGURE 5
INTERACTIVE MAP WITH INSTRUCTIONS AND COUNTY INTERFACED. . . . . 40
FIGURE 6
INTERACTIVE MAP LISTING FEATURES AND ECONOMIC DEVELOPMENT REGION. . . . . . . . . . . . . . . . . . . . . . . . . 41
FIGURE 7
INTERACTIVE MAP ADMINISTRATION TOOL. . . . . . . . . . . . . . . . . . . . . . . 42
FIGURE 8
LOCATION OF E-SCRAP PROCESSORS WITH ESTIMATED MAXIMUM PROCESSING CAPACITY. . . . . . . . . . . . . . . . . . . . 50

Engineering Solutions & Design, Inc. Page 1
1.0 INTRODUCTION
The Illinois Recycling Association (IRA) received a grant from the Illinois Department
of Commerce and Economic Opportunity (DCEO) to determine the current and potential
electronic scrap (E-scrap) processing and/or refurbishing capacity in the State of Illinois. In
addition, the IRA desired to ascertain if the current and potential E-scrap recyclers have the
capacity to meet the expected demand and adequately manage electronic scrap in the state
should the proposed Electronic Scrap Recycling Act (SB 1583) be enacted by the General
Assembly. This legislation is proposing to create a statewide system to recycle certain
electronic devices and to ban these devices from landfills within three years of enactment.
To address this issue, Engineering Solutions & Design, Inc. (ES&D) was retained by
IRA to determine the present capabilities of the electronic scrap recycling industry in the
State of Illinois and to evaluate the capabilities of this industry. This effort was divided into
three distinct parts: (1) determine the number of entities presently involved in the
electronic scrap industry in Illinois; (2) identify a reliable estimate of the amount of
electronic scrap that is presently generated and the potential amount of electronic scrap
that could be generated by 2010; and (3) provide a discussion and geographical mapping
that outlines information on the present electronic scrap industry and its capability to
manage estimated quantities of E-scrap generated in the state.
For purposes of this study, electronic scrap (E-scrap) is defined as: a computer,
portable computer, electronic printer, computer peripheral, video display device, video
display device peripheral, facsimile machine, cellular telephone, portable calculator, PDA,
and electronic encoding/decoding audio data storage and retrieval device. This is the same
definition of a “covered electronic device (CED)” as proposed in SB 1583.
The following sections provide information on the methods utilized to gather the
information needed to complete each of the three parts of this effort. The results of the
information gathering are provided as well as conclusions. In addition to this report, an
interactive mapping system was developed that provides easy access to information on the
entities providing electronic scrap recycling services. This interactive map was developed
for use either as an integrated part of a website, or it can be distributed as a stand-alone
program.

Engineering Solutions & Design, Inc. Page 2
2.0 DATA COLLECTION
Two parallel data collection efforts were conducted as a part of this project. One
effort focused on the collection of data that could be utilized to determine the generation
rate of electronic scrap for the State of Illinois. The other effort focused on identifying
various entities within the state that comprise the State of Illinois electronic scrap recycling
industry.
2.1 ELECTRONIC SCRAP RECYCLING ENTITIES
2.1.1 Contact Procedure In order to establish contacts with various electronic scrap recyclers, ES&D first
began by attempting to contact recyclers identified as operating in Illinois as listed in the
Midwest Directory of Electronic Equipment and Computer Recyclers/Reuse Organizations.
This document, created and maintained by the DCEO’s Bureau of Energy and Recycling, was
provided to ES&D to serve as an initial point of contact for Illinois electronic scrap recyclers.
While we attempted to contact the Illinois recyclers in the Midwest Directory of
Electronic Equipment and Computer Recyclers/Reuse Organizations, we also assessed what
counties were left without any potential contacts. While 33 counties had potential contacts
in the Midwest Directory of Electronic Equipment and Computer Recyclers/Reuse
Organizations, 69 counties did not. In an attempt to contact a recycler in each of Illinois’
102 counties, we utilized Yahoo! Local (an online database of organizations arranged by
proximity to a variable location and search parameters). In order to identify potential
electronic scrap recyclers, we searched Yahoo! Local sites for electronics recyclers and
recyclers in the respective county seat of the 69 counties without potential contacts and the
entire county for the 33 counties where E-scrap recyclers supposedly existed.
ES&D then continued contacting organizations identified in the Midwest Directory of
Electronic Equipment and Computer Recyclers/Reuse Organizations as well as organizations
identified through the Yahoo! Local search. A brief list of questions was developed to use
when telephoning each identified contact. Table 1 presents the survey questions.
Organizations were asked if they still existed as an electronic scrap processor or
collector in any capacity. If the answer was positive, we continued with the interview by
asking a few basic questions about the organization. The initial questions encompassed the
date the business originated, the number of personnel employed by the organization,
whether the organization was a for-profit or non-profit entity, and we also reconfirmed that
our contact information was correct.

Engineering Solutions & Design, Inc. Page 3
TABLE 1. SURVEY QUESTIONS
Question 1
What date did the business start?
Question 2
How many personnel do you currently employ?
Question 3
Is your organization a for-profit or non-profit entity?
Question 4
How many work shifts do you have?
Question 5
How do you collect your electronic scrap (i.e. carry in, collection vehicles with set routes, drop-off locations, etc.)?
Question 6
If applicable how much scrap do you process daily or annually?
Question 7
Does your scrap originate from in state, out of state, or both?
Question 8
Is your scrap from the residential or commercial sector or both?
Question 9
What type of electronic scrap do you receive, or if better suited, what electronic scrap will you not accept?
Question 10
Is there any fee associated with your services; if so, what is it based on?
Question 11
What is your current storage capacity for electronic scrap?
Question 12
If needed, do you have the physical ability to expand your services or storage capacity?

Engineering Solutions & Design, Inc. Page 4
After basic questions about the organization were asked, more descript questions
about the organization’s involvement in E-scrap recycling were asked. ES&D queried how
they collected their scrap (through drop-off boxes, routes with regular pick ups, or other
means); how much scrap they processed, if applicable; whether their material originated in
state, out of state, or both; if the scrap was generated in the residential or commercial
sector; the types of electronic scrap received; if there was a fee associated with their
services and how it was determined; and the current storage capacity for electronic scrap
and whether there was an ability to expand. An opportunity was provided for the contact
person to include any other information they found pertinent to their electronic scrap
recycling. The aforementioned question responses led to more contacts in and around
Illinois and provided further insight into whether, in rare cases, the recycler resold,
refurbished or brokered electronic scrap.
After initial calls were made, ES&D reassessed the methodology as many potential
contacts either ignored our calls or neglected to answer after multiple attempts at reaching
them. The Internet and e-mail were utilized to continue surveying the contacts that
weren’t responding. The Midwest Directory of Electronic Equipment and Computer
Recyclers/Reuse Organizations listed Internet-based contact information including both
e-mail addresses and websites along with applicable telephone contact information. E-mails
were sent to the contacts with a survey identical to the one used in the telephone survey.
ES&D also queried out-of-state recyclers to ascertain whether they also served the
Illinois area. The Midwest Directory of Electronic Equipment and Computer Recyclers/Reuse
Organizations also listed organizations that were located in counties that bordered Illinois
and national organizations that potentially served Illinois. These firms were contacted and
were forwarded the same survey questions that were sent to the Illinois contacts.
Finally, in order to provide a more comprehensive database of electronic scrap
recyclers in the state, additional databases at both the national and regional level were
sought: the E-Cycling Central database, national recycling organizations were found in
Appendix 3B of the E-scrap Collection Project for the Metro Regional Environmental
Management of Portland, Oregon, and the Illinois Recycling Association’s website. These
three new sources were analyzed and redundant contacts were discarded and new
information gathered.

Engineering Solutions & Design, Inc. Page 5
2.1.2 Contact Issues
ES&D, while attempting to contact electronic scrap recycling organizations,
encountered a variety of problems that hampered the development of the Illinois E-scrap
recycling database. While a significant level of effort was allocated to this task, the
following comments should be noted:
1. Some organizations were not cooperative when contacted and no information was obtained.
2. Not all information requested was provided by contacts – citing proprietary
information or other concerns.
3. The E-scrap recycling business is a dynamic industry; therefore this data as presented should be viewed as a “snapshot” at this point in time. Market conditions can lead to consolidations and/or business closures.
2.1.3 Contact Results
ES&D began the search for electronic scrap recyclers in the State of Illinois with a list
of 130 potential contacts and later added 83 more potential contacts. Out of these 213
potential contacts within the state, 78 organizations and 87 locations were found that
currently are involved in electronic scrap recycling in Illinois. Table 2 provides a list of the
E-scrap recyclers, the services each provides, and locations. The table is organized by
county.
For the purposes of this assessment, an E-scrap recycler is the umbrella term used
for the following terms:
Processor – A business that utilizes manual dismantling processes and/or mechanical de-manufacturing to recover commodities. Refurbisher – A business that accepts non-functioning or damaged CED’s and repairs them to functioning state for subsequent re-use by persons other than the original owner. Broker – A business that engages in the buying, selling, or trading of CED’s without performing any processing or refurbishing processes. Collector – A business or entity that provides a permanent drop-off or collection point. Reseller – A retail business that takes in used CED’s, does cosmetic cleanup, and resells the CED to the general public.

Engineering Solutions & Design, Inc. Page 6
TABLE 2. E-SCRAP RECYCLERS IN ILLINOIS
County Name Address Phone E-Mail/Website Coll Proc Refur Brok Resell
Champaign Mack's Twin City Recycling 2808 N. Lincoln Ave., Urbana IL, 61802 (217) 328-2100 www.macksrecycling.net x x
Champaign Bench Mark Computer 126 W. Main, Urbana IL, 61801 (217) 367-9716 x x x
Clay Clay County Rehab Center P.O. Box 659, 530 W. Fourth Street, Flora IL, 62839 (618) 662-4916 www.clayrhab.com x x x
Clinton A1 Laptop Shop 1254 N. Poplar, Centralia IL, 62801 (618) 553-3355 [email protected] x x
Cook Fastpace Business Services 3815 N. Ventura Drive, Arlington Heights IL, 60004 (847) 398-5757 x x x
Cook Air Cycle Corporation 2000 S. 25th Ave., Suite C, Broadview, IL 60155 (800) 909-9709 Ext: 4 www.Aircycle.com x
Assistive Technology Exchange Network Cook A Program of United Cerebral Palsy of Greater Chicago 7550 West 183rd St., Tinley Park, IL 60477 (800) 476-2836 www.ucpnet.org x x
Cook Cartridge World- Danada 97 Danada Square East, Wheaton IL, 60187 (630) 849-4126 x
Cook Cartridge World- Lakeview 3259 N. Ashland Ave., Chicago IL, 60657 (773) 273-3455 www.chicagocartridgeworld.com x
Cook Cartridge World- Lincoln Park 2634 N. Clark Street, Chicago IL, 60614 (773) 273-3455 www.chicagocartridgeworld.com x
Chicago Coalition for Information Access Community Cook Technology Assistance Program C/O NFD 3411 W. Diversy Suite 1, Chicago, IL 60647 (773) 384-8827 [email protected] www.cpsr.cs.uchicago.edu x x
Cook City of Chicago Electronics Collection Center 1150 N. Branch, Chicago, IL 60622 (773) 583-7575* www.bluecartschicago.org x x
Cook Computer Depot 3145 S. Oak Park Ave., Berwyn IL, 60402 (708) 749-0800 [email protected] x
Warehouse: 3350 N. Kadzie Dock 2, Chicago IL 60618 Cook Computers For Schools Office: 3642 N. Springfield Ave., Chicago IL, 60618 (773) 583-7575* www.pcsforschools.org [email protected] x
Cook Digilog Electronics Warehouse 3350 N. Kedzie Dock D., Chicago IL, 60618 (773) 583-6653 www.miscomputer.com x x
Cook Digital Workforce Education Society 2800 S. Western Ave., Chicago, IL 60608 (630) 886-3808 www.digitbridge.org www.alado.net x
Cook EDCO Recycling Company 8224 S. Vincennes Ave., Chicago IL, 60620 (773) 873-1600 www.edcorecycling.com x
Cook ARC International 880 Mark Street, Elk Grove Village IL, 60007 (630) 412-8000 x
Cook Belmont Technology Remarketing 1401 Mark St., Elk Grove Village IL, 60007 (847) 750-9354 www.belmont-trading.com x x
Cook Evergreen Supply Company 9901 South Torrence, Chicago IL, 60476 (773) 734-9873 www.everlights.com x x
Cook Give a Computer 601 N. Williams Street, Thornton IL, 60476 (708) 439-4094 www.giveacomputer.org x x
Cook Give a Computer- Bellwood Drop-off 2801 Harrison Street, Bellwood IL, 60104 x
Cook Green Sweep LLC. 900 N. Franklin Ave. #102, Chicago IL, 60610 (773) 348-3668 ww.green-sweep.com x

Engineering Solutions & Design, Inc. Page 7
TABLE 2. E-SCRAP RECYCLERS IN ILLINOIS (continued)
County Name Address Phone E-Mail/Website Coll Proc Refur Brok Resell
Cook Intechra 1876 S. Elmhurst Rd., Mt. Prospect IL, 60056 (847) 472-9600 www.intechra.com x
Cook Intercon Solutions Inc. 1001-59 Washington St., Chicago Heights, IL 60411 (708) 756-9838 www.interconrecycling.com x x
Cook Maine Scrap, Inc. 1274 Rand Rd., Des Plaines IL, 60016 (847) 824-3175 x
Cook Sipi Metals Corporation 1720 N. Elston Ave., Chicago IL, 60622 (800) 621-8013 www.sipimetals.com x
Cook Tele-movers Inc. 518 Pratt Ave N., Schaumburg IL, 60193 (847) 352-1101 www.telemovers.com x x
Cook Time Dollar Program P.O. Box 436964, Chicago IL, 60643 (773) 223-4442 www.timedollartutoring.org x x
Cook Universal Scrap Metals 2500 Fulton Street, Chicago, IL, 60612 (312) 666-0011 www.universalscrap.com x x
DuPage Com2 Computers and Technology 1196 C. South Main Street, Lombard IL, 60148 (877) 977-2662 www.com2computers.com x x x
DuPage Fortune Plastic and Metal Inc. 1650 W. Quincy Ave., Naperville IL, 60540 (630) 778-7776 www.fortunegroup.net x x
DuPage Give a Computer- Orland Park Drop-off 201 Orland Park Place, Orland Park IL, 60462 x
DuPage Give a Computer- Schaumburg Drop-off 1730 W. Irving Park Road, Schaumburg IL, 60193 x
DuPage Com2 Computers and Technology 195E Kehoe Blvd., Unit 3, Carol Stream IL, 60188 (630) 670-4090 x x
DuPage Give a Computer- Warrenville Drop-off 30 W. 330 Butterfield Road, Warrenville IL, 60555 x
DuPage Give a Computer- Woodridge Drop-off 8000 S. Route 53, Woodridge IL, 60517 x
DuPage MICOMP 870 Lively Blvd., Wood Dale IL, 60191 (630) 860-4607 www.micomp.com x x
DuPage People's Computer Resource Center 201 S. Naperville Blvd., Wheaton IL, 60187 (630) 682-5402 www.peoplesrc.org x
DuPage Proton Computers, Inc. 720 S. Main Street, Lombard IL, 60148 (630) 627-7623 [email protected] x
DuPage River Shannon Recycling 13605 S. Halstead, Riverdale IL, 60827 (847) 581-2890 [email protected] x x
DuPage Supply-Chain Services, Inc. 250 W. North Ave., Lombard IL, 60148 (630) 629-9344 www.supply-chainservices.com x
DuPage Sims Recycling Solutions
(Formerly United Recycling Industries, Inc). 1600 Harvester Road, West Chicago IL, 60185 (630) 231-8220 www.simsrecyclingsolutions.com
www.unitedrecycling.com x
DuPage R3 Systems Group 284 Lies Road, Carol Stream, IL, 60188 (866)332-6864 www.r3systemsgroup.com x x x
DuPage Intergreat-Technology Solutions 800 Provincetown Dr., Carol Stream IL, 60188 (630) 653-7723 [email protected]
www.igtekno.com x x
Fulton Fulton County Health Department 700 E. Oak Street, Canton IL, 61520 (309) 647-1134 N/A x All E-scrap collected by mail

Engineering Solutions & Design, Inc. Page 8
TABLE 2. E-SCRAP RECYCLERS IN ILLINOIS (continued)
County Name Address Phone E-Mail/Website Coll Proc Refur Brok Resell
Hancock Hancock County Health Department 1006 E. Wabash P.O. Box 370, Carthage IL, 62321 (217) 357-3155 N/A x
Henry Eagle Enterprises Recycling, Inc. 510 SE Industrial Ave., Galva IL, 61434 (309) 932-2936 N/A x
Jackson Southern Recycling Center 300W. Chestnut, Carbondale IL, 63901 (618) 549-2880 N/A x
Kane HOBI International, Inc. 1202 Nagel Blvd., Batavia IL, 60510 (630) 761-0500 www.hobi.com x
Kane MRK Group, Ltd. 801 North State Street Unit C, Elgin IL, 60123 (800) 972-1003 [email protected] www.mrkgroup.com x
Kane Kane County Recycling Department 719 Batavia Avenue, Galena, IL (630) 208-3841 [email protected] x
Kendall Inter Connect, Inc. 803 Hawthorn St., Plainfield IL, 60544 (815) 436-0200 www.inter-connect-inc.com x x x
Knox Galesburg Transit Office 567 S. Farnham St., Galesburg IL, 61401 (309) 342-4242 N/A x
Lake Future-Tek 731 Sheridan Rd., Winthrop Harbor IL, 60096 (847) 731-2914 www.shopfuturetek.com x
Lake Maine Plastics, Inc. 1550 24th St., North Chicago IL, 60064 (847) 473-3553 www.maineplastics.com x x
Lake Recycle I.T. Hardware 731 Sheridan Rd., Winthrop Harbor IL, 60096 (847) 379-8444 www.recycleithardware.com x x
Livingston Advanced Technology Recycling 415 W. Howard, Suite, Pontiac IL, 81764 (815) 844-7779 www.atrecycle.com x x x x
Macoupin We Care Recycling 330 West 1st North St., Carlinville IL, 62626 (217) 854-8888 N/A x
Madison Totall Metal Recycling 2684 Missouri Ave., Granite City IL, 62040 (866) 470-5763 www.tmrusa.com x
McDonough Colchester City Hall 500E. Roberts Street, Colchester IL, 62326 (309) 776-3005 N/A x
McDonough Tricounty Regional Collection Facility 510 N. Pearl St., Macomb IL, 61455 (309) 331-4781 www.tricountyresource.org x
McHenry Computer Recycling Group, LLC 7218 Virginia Rd., Crystal Lake IL, 60014 (815) 455-6300 [email protected] www.comprecgroup.com x
McHenry Systec America, Inc. 308 Cary Point Drive, Cary IL, 60013 (800) 336-2131 www.mpsupplies.com x
McLean Town of Normal Public Works 1301 Warriner St., Normal IL, 61761 (309) 454-9571 N/A x
Mercer City Hall of Aledo 120 N. College Ave, Aledo IL, 61231 (309) 582-7241 N/A x
Mercer Sherrad Village Hall 517 3rd Street, Sherrad IL, 61281 (309) 593-2415 N/A x

Engineering Solutions & Design, Inc. Page 9
TABLE 2. E-SCRAP RECYCLERS IN ILLINOIS (continued)
County Name Address Phone E-Mail/Website Coll Proc Refur Brok Resell
Peoria Computer Recycle 2502 N Knoxville, Peoria IL, 61604 (309) 688-2667 N/A x
Peoria Recycling for Illinois 401 NE Rock Island Ave., Peoria IL, 61603 (309) 682-0675 [email protected] x
Rock Island Premier Computer Services, Inc. 3003 48th Ave., Moline, IL, 61265 (309) 764-7123 www.premiercomputer.com x x
Sangamon BLH Computers 1832 Stevenson Dr., Springfield IL, 62703 (800) 416-5292 www.blhcomputers.com [email protected] x x
Sangamon Butler Distribution 1140 West Reynolds, Springfield, IL 62702 (217) 528-9506 N/A x
Sangamon Computer Banc 1023 Washington St., Springfield, IL 62703 (217) 528-9506 www.computerbanc.com x
Schuyler Rushville Public Works Brown St., Rushville IL, 61462 (217) 322-3833 x
Schuyler Schuyler City Hall 200 West Washington, Schuyler, IL
St. Clair Action Computers 103 Frey Lane, Fairview Heights IL, 62208 (618) 628-3989 actioncomputers.biz x x
St. Clair Interco Trading 2975 Kings Highway, Fairmont City IL, 62201 (618) 482-8206 [email protected] x
St. Clair Phoenix Recycling and Shredding 2795 South Belt West, Belleville IL, 62226 (618) 235-2712 phoeinixrecyclingandshredding.com x
Stephenson Midwest Computing Services 218 West Exchange, Freeport IL, 61032 (815) 233-0002 go2mcs.com x
Warren Maple City Area Recycling Center 614 South 3rd St., Monmouth IL, 61462 (309) 734-6939 www.maplecity.com x
Warren Monmouth Transfer Station S. 11th St., Monmouth IL, 61462 (309) 735-2515 x
Will Give a Computer- Joliet Drop-off 2114 Oak Leaf Street, Joliet IL, 60436 x
Will Recycle of Chicago, Inc. 1220 Cambria Dr., Joliet IL, 60431 (877) 931-2400 x
Will Vintage Tech Recyclers 25503 W. Ruff Street Unit C, Plainfield IL, 60585 (815) 609-7013 www.vintagetechrecyclers.com x x x x
Will E-scrap Technologies 3 Northpoint Court, Bolingbrook, IL 60440 (630) 378-1300 www.e-scraptechnologies.com x x
Williamson Community Electronics Tech Interface 116 S. Division Street, Carterville, IL (618) 203-9443 www.cetiorg.org x x x
Winnebago Richardson Computer Recycling 5488 Grove St., Roscoe IL, 61703 (815) 623-2358 [email protected] x x
Coll = Collectors • Proc = Processor • Refur = Refurbisher • Brok = Broker • Resell = Reseller
* Denotes a telephone number for multiple organizations run by the same group of people.

Engineering Solutions & Design, Inc. Page 10
Of the 78 listed organizations that provide services in Illinois, 62 collect electronic
scrap, 19 process electronic scrap, 23 refurbish electronics, 3 broker and 15 resell electronic
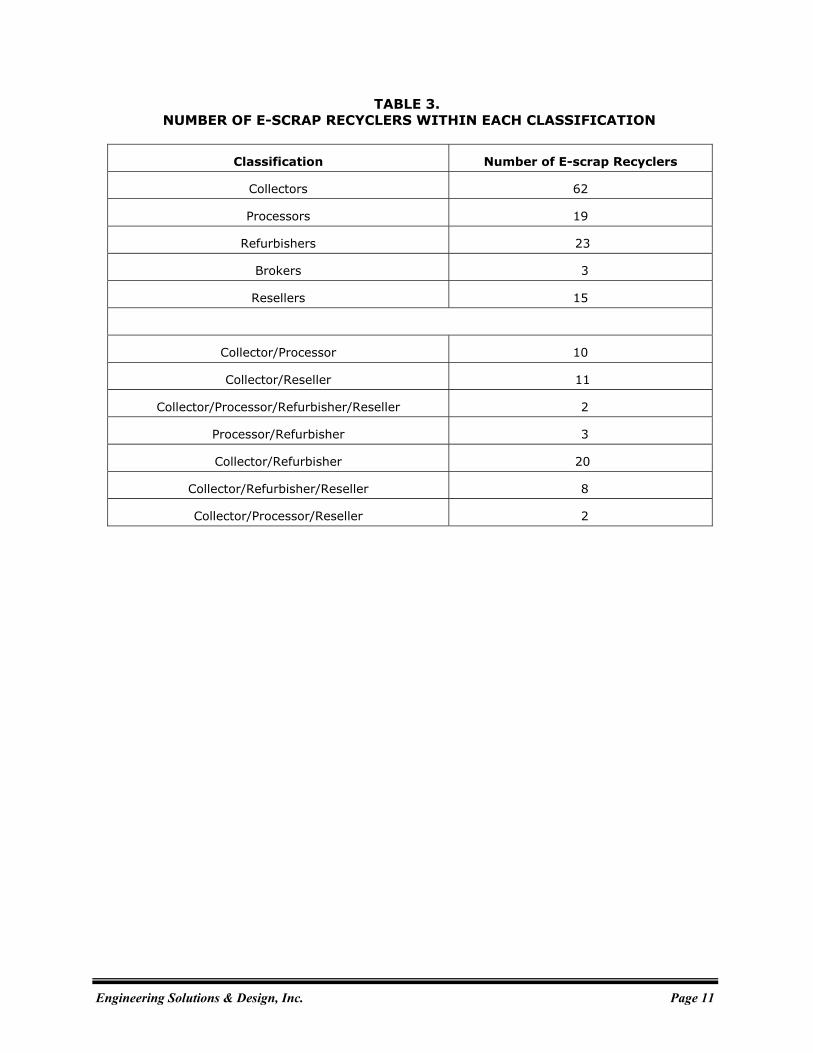
scrap. Table 3 provides the types of E-scrap recycling and the number of organizations
currently providing each specific type of recycling. Many of the organizations contacted
provide more than one type of E-scrap recycling. There are:
• 10 organizations that collect and process E-scrap;
• 11 organizations that collect and resell E-scrap;
• 2 organizations that collect, process, refurbish and resell E-scrap;
• 20 organizations that collect and refurbish E-scrap;
• 8 organizations that collect, refurbish and resell E-scrap
• 3 organizations that processes and refurbishes E-scrap; and
• 2 organizations that collects, processes, and resells E-scrap.
These 78 organizations are located throughout Illinois; however, there are electronic
scrap recyclers in only 30 of the 102 Illinois counties. Processors responding to the survey
are located in only 10 counties. Figure 1 provides a graphic representation of the Illinois
counties with E-scrap recyclers. Figure 2 provides a graphic representation of Illinois
counties where permanent E-scrap collection is provided. Figure 3 provides a graphic
representation of Illinois counties where E-scrap processing/refurbishing is provided.
Table 4 provides the number of E-scrap processors located in the 10 Illinois counties and
Table 5 provides the number of E-scrap processors located within the 10 designated Illinois
Economic Development Regions.
This E-scrap recycler’s database does not include those government or private sector
entities that provide periodic collection events and services. Dozens of one-day collection
events are held every year. In addition, not-for-profit agencies, such as Goodwill and
others, host collection events as well.
Engineering Solutions & Design, Inc. Page 11
TABLE 3. NUMBER OF E-SCRAP RECYCLERS WITHIN EACH CLASSIFICATION
Classification Number of E-scrap Recyclers
Collectors 62
Processors 19
Refurbishers 23
Brokers 3
Resellers 15
Collector/Processor 10
Collector/Reseller 11
Collector/Processor/Refurbisher/Reseller 2
Processor/Refurbisher 3
Collector/Refurbisher 20
Collector/Refurbisher/Reseller 8
Collector/Processor/Reseller 2

Engineering Solutions & Design, Inc. Page 12
FIGURE 1. ILLINOIS COUNTIES WITH E-SCRAP RECYCLERS
NOTE Those counties in green
may contain one or more e-scrap recycler.

Engineering Solutions & Design, Inc. Page 13
FIGURE 2. ILLINOIS COUNTIES WITH E-SCRAP COLLECTORS
NOTE Those counties in blue
may contain one or more e-scrap collector.

Engineering Solutions & Design, Inc. Page 14
FIGURE 3.
ILLINOIS COUNTIES WITH E-SCRAP PROCESSORS/REFURBISHERS
NOTE Those counties in red may contain one or
more e-scrap processor/refurbisher.

Engineering Solutions & Design, Inc. Page 15
TABLE 4. ILLINOIS COUNTIES WITH E-SCRAP PROCESSORS/REFURBISHERS
County Number of Processors
Number of Refurbishers
Champaign 0 1
Clay 0 1
Clinton 0 1
Cook 5 8
DuPage 5 5
Kane 1 0
Kendall 0 1
Lake 0 1
Livingston 1 1
Madison 1 0
Peoria 1 0
Rock Island 1 0
Sangamon 1 1
Saint Clair 1 1
Will 2 1
Williamson 0 1
Total 19 23

Engineering Solutions & Design, Inc. Page 16
TABLE 5. ILLINOIS ECONOMIC DEVELOPMENT REGIONS
NUMBER OF E-SCRAP PROCESSORS/REFURBISHERS
Economic Region Number of Processors
Number of Refurbishers
Central 1 1
East Central 0 1
North Central 2 1
West Central 0 0
Northeast 13 16
Northern Stateline 0 0
Northwest 1 0
Southern 0 1
Southwest 2 2
Southeast 0 1
Total 19 23

Engineering Solutions & Design, Inc. Page 17
2.1.4 Survey Results
As noted in Section 2.1.1 and 2.1.2, each of the organizations involved in E-scrap
recycling was asked to complete a questionnaire. Of the 78 organizations that were
contacted and responded, a total of 41 of these organizations were willing to complete the
questionnaire or had sufficient information to complete the questionnaire. Of these 41
organizations that provided responses to the questionnaire, 21 limited their operation to the
collection of various types of E-scrap. The remaining 20 responding organizations
processed or refurbished E-scrap and of these 12 also collected E-scrap and 1 resold some
electronic equipment. Table 6A and Table 6B provide operational information for the 23
organizations that only collect E-scrap. A brief analysis of this information is provided in the
following paragraphs.
COLLECTORS
Date Business Started: Half of the organizations started business after 1995.
Number of Personnel: The number of personnel varies from less than 5 to 25.
There is no indication of the responsibilities of these personnel. Two of the
organizations did not know how many personnel worked at their facility. Excluding
these two organizations, the average number of personnel for each organization is 8.
Operation: Ten of the organizations are for-profit entities and the remaining 13
organizations are non-profit entities. This appears to be consistent with similar
collection organizations in other states.
Receiving Capacity: The majority of the organizations that responded did not
know the amount of their operation’s receiving capacity. Of the six organizations
that did provide a capacity, the range is significant. This variation and uncertainty is
likely a reflection of how quickly the E-scrap is shipped for processing and whether
the collection of E-scrap is a mainstay of the organization or considered as an add-on
service.
Number of Shifts: Only one of the 23 organizations operates more than one shift.
Origin of Materials: All 23 organizations accept E-scrap from in-state sources and
only three accept E-scrap from out-of-state sources. The three organizations that do
accept out-of-state E-scrap are all adjacent to, or very near, an Illinois state

Engineering Solutions & Design, Inc. Page 18
boundary. In addition, two of these three organizations are for-profit entities which
likely explains the willingness to accept out-of-state E-scrap.
Scrap Generation Sector: All of the organizations (except for two) accept E-scrap
from residential generators while 13 organizations accept E-scrap from commercial
generators. The two organizations that do not accept E-scrap from residential
generators are both for-profit entities, while four of the non-profit organizations
accept commercial generated E-scrap. All but one of the for-profit organizations
accepts E-scrap from commercial generators.
Ability to Expand: Eight of the 23 organizations do not have the ability to expand.
All of the other organizations have the ability to expand, except for one organization
that was uncertain. Five of the six organizations that do not have the ability to
expand are non-profit entities. All but one of the for-profit organizations have the
ability to expand.
Storage Capacity: The majority of the organizations either had limited or unknown
storage space or less than 5,000 square feet of storage space. The limited storage
space is similar to receiving capacity in that the E-scrap received is quickly sent off
to processors or other end users.
Types of CED’s Accepted: Eleven of the 21 organizations accept the entire list of
CED’s. All of the organizations accept computers and computer peripherals. Video
display devices are accepted by all but three of the organizations. Cellular phones,
portable calculators, and PDA’s are the least accepted and they are accepted by 12
of the organizations. Of the organizations that accept all of the CED’s, seven are for-
profit entities. Further, of the 12 organizations that accept all of the CED’s, only two
of these organizations are in the northeast portion of the state. The remainder are
relatively dispersed throughout the state.
Rate Structure: There are seven organizations that do not have a rate structure.
The remaining organizations’ rate structures vary significantly. Fifteen of these
organizations charge for computer monitors with the fee ranging from $5.00 to
$25.00. Other than monitors, only five organizations have a fee for other CED’s.
Typically the charge is relatively small or the fee is for picking up the E-scrap.

Engineering Solutions & Design, Inc. Page 19
Transportation: All organizations provide for the drop off E-scrap. Only four
organizations provide a pickup service and only one organization provides a route
service. None of the organizations indicated any problems with transportation –
either receiving or shipping.

Engineering Solutions & Design, Inc. Page 20
TABLE 6A. OPERATIONAL INFORMATION FOR E-SCRAP COLLECTORS IN ILLINOIS
Operation Origin of Material Waste Generation Sector
County Name and Address
Date Business Started
Number of Personnel
For-Profit
Non- Profit
Receiving Capacity
Number of Shifts
In-State
Out-of-
State Residential Commercial Ability to Expand
Storage Capacity in Square Feet
(SF)
Clinton A1 Laptop Shop
1254 N. Poplar, Centralia IL, 62801 Nov. 2006 4 X 8 – 10 Units
per week 1 X X X Yes 3,200 SF
Cook City of Chicago Electronics Collection Center
1150 N. Branch, Chicago, IL 60622 Jan 2007 3 X Unknown 1 X X No 600 SF
DuPage Proton Computers, Inc.
720 S. Main Street, Lombard IL, 60148 2002 6 X Unknown 1 X X No None
Fulton Fulton County Health Department
700 E. Oak Street, Canton IL, 61520 Unknown 5 X Gaylords 1 X X X No 100 SF
Hancock Hancock County
1006 E. Wabash P.O. Box 370, Carthage IL, 62321 Unknown Unknown X Gaylords 1 X X No Small
Henry Eagle Enterprises Recycling, Inc.
510 SE Industrial Ave., Galva IL, 61434 1994 25 X Unknown 1 X X X Yes Limited
Jackson Southern Recycling Center
300W. Chestnut, Carbonale IL, 63901 1988 17 X Unknown 1 X X X Yes 30,000 SF
Kane MRK Group, Ltd
801 North State Street Unit C, Elgin IL, 60123 1991 15 X Unknown 1 X X X Yes 30,000 SF
Knox Galesburg Transit Office
567 S. Farnham St., Galesburg IL, 61401 1972 12 X Gaylords 1 X X No 100 SF
Lake Future-Tek
731 Sheridan Rd., Winthrop Harbor IL, 60096 2004 3 X Unknown 1 X X X Yes 1,000 SF
Macoupin We Care Recycling
330 West 1st North St., Carlinville IL, 62626 1988 4 X 5 Pallets
per Month 1 X X X Yes Unknown
McDonough Colchester City Hall
500E. Roberts Street, Colchester IL, 62326 Unknown Unknown X Gaylords 1 X X Unknown Unknown
McDonough Tricounty Regional Collection Facility 510 N. Pearl St., Macomb IL, 61455 1995 2 X 5 Tons 1 X X X X Yes 30,000 SF
McHenry Computer Recycling Group, LLC
7218 Virginia Rd., Crystal Lake IL, 60014 Apr 2003 5 X Unknown 2 X X X Yes 8,000 SF
McLean Town of Normal Public Works Garage 1301 Warriner St., Normal IL, 61761 2003 1 X
9 – 10 Tons per Month 1 X X Yes Unknown
Mercer Sherrad Village Hall
517 3rd Street, Sherrad IL, 61281 Unknown 1 X Gaylords 1 X X No Limited
Mercer Aledo City Hall
120 N. College Avenue, Aledo, IL Unknown Unknown X Gaylords 1 X X X No Limited
Peoria Computer Recycle
2502 N Knoxville, Peoria IL, 61604 1999 2 – 15 X 1 Ton per Month 1 X X X Yes 3,000 SF
Sangamon Butler Distribution
1140 West Reynolds, Springfield, IL 62702 2001 3 X Unknown 1 X X X Yes 10,000 SF
Schuyler Schuyler City Hall
200 W. Washington, Schuyler, IL Unknown Unknown X Gaylords 1 X X X No Limited
Warren Monmouth Transfer Station
S. 11th St., Monmouth IL, 61462 1983 2 X Gaylords 1 X X Yes Limited
Warren Maple City Recycling Center
614 S Third Street, Maple City, IL Unknown Unknown X Gaylords 1 X X X No Limited
Winnebago Richardson Computer Recycling
5488 Grove St., Roscoe IL, 61703 1996 2 X Unknown 1 X X X Yes 200 SF

Engineering Solutions & Design, Inc. Page 21
TABLE 6B. ADDITIONAL OPERATIONAL INFORMATION FOR E-SCRAP COLLECTORS IN ILLINOIS
Types of CED’s Transportation
County Name and Address
Com
pute
r
Port
able
C
ompu
ter
Prin
ter
Com
pute
r Pe
riphe
ral
Vide
o D
ispl
ay
Dev
ice
Vide
o D
evic
e Pe
riphe
ral
Facs
imile
M
achi
ne
Cel
lula
r Ph
one
Port
able
C
alcu
lato
r
PDA
Dat
a St
orag
e D
evic
es
Rate Structure
Dro
p-of
f
Pick
up
Rou
tes
Col
lect
ion
Even
ts
Problems
Clinton A1 Laptop Shop
1254 N. Poplar, Centralia IL, 62801 X X X X X No X
Cook City of Chicago Electronic Collection Center
1150 N. Branch, Chicago, IL 60622 X X X X X X X X No X X
DuPage Proton Computers, Inc.
720 S. Main Street, Lombard IL, 60148 X X X X X None X
Fulton Fulton County Health Department
700 E. Oak Street, Canton IL, 61520 X X TV or Monitor $25.00 X
Hancock Hancock County
1006 E. Wabash P.O. Box 370, Carthage IL, 62321 X X X X X $5.00 for Monitor X
Henry Eagle Enterprises Recycling, Inc.
510 SE Industrial Ave., Galva IL, 61434 X X X X X X X X X X X $5.00 for Monitor X
Jackson Southern Recycling Center
300W. Chestnut, Carbonale IL, 63901 X X X X X X X X X X X None X
Kane MRK Group, Ltd
801 North State Street Unit C, Elgin IL, 60123 X X X X X X X X X X X No fee up to 10 items, $5.00 for Computer X
Knox Galesburg Transit Office
567 S. Farnham St., Galesburg IL, 61401 X X X X $5.00 for Monitor X
Lake Future-Tek
731 Sheridan Rd., Winthrop Harbor IL, 60096 X X X X X X X X X X X Charge Businesses X
Macoupin We Care Recycling
330 West 1st North St., Carlinville IL, 62626 X X None X
McDonough Colchester City Hall
500E. Roberts Street, Colchester IL, 62326 X X X X X X X X X X X $5.00 for Monitor X
McDonough Tricounty Regional Collection Facility 510 N. Pearl St., Macomb IL, 61455 X X X X X X X X X X X $5.00 for Monitor X
McHenry Computer Recycling Group, LLC
7218 Virginia Rd., Crystal Lake IL, 60014 X X X X X X X X X X X $2.00 - $5.00 for Monitor $125.00 Pickup Charge X X
McLean Town of Normal Public Works Garage 1301 Warriner St., Normal IL, 61761 X X X X $5.00 for Monitor X
Mercer Sherrad Village Hall
517 3rd Street, Sherrad IL, 61281 X X X X X X X X X X X $5.00 for Monitor X
Mercer Aledo City Hall
120 N. College Avenue, Aledo, IL X X X X X X X $5.00 for Monitor X
Peoria Computer Recycle
2502 N Knoxville, Peoria IL, 61604 X X X Pickup Charge X X
Sangamon Butler Distribution
1140 West Reynolds, Springfield, IL 62702 X X X X X X X X X X X Unknown X
Schuyler Schuyler City Hall
200 W. Washington, Schuyler, IL X X X X X X X X
Warren Monmouth Transfer Station
S. 11th St., Monmouth IL, 61462 X X X X X X X $5.00 for Monitor X
Warren Maple City Recycling Center
614 S Third Street, Maple City, IL X X X X X X X $5.00 for Monitor X
Winnebago Richardson Computer Recycling
5488 Grove St., Roscoe IL, 61703 X X X X X X X X X X X None X X
Engineering Solutions & Design, Inc. Page 22
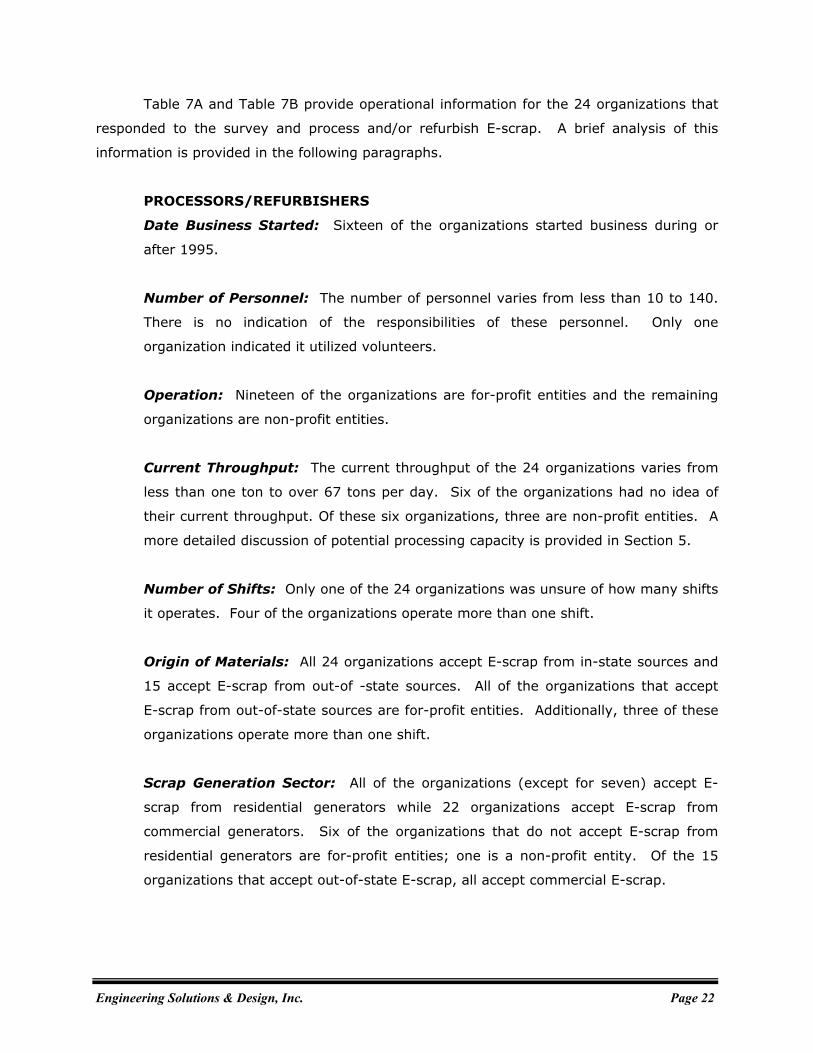
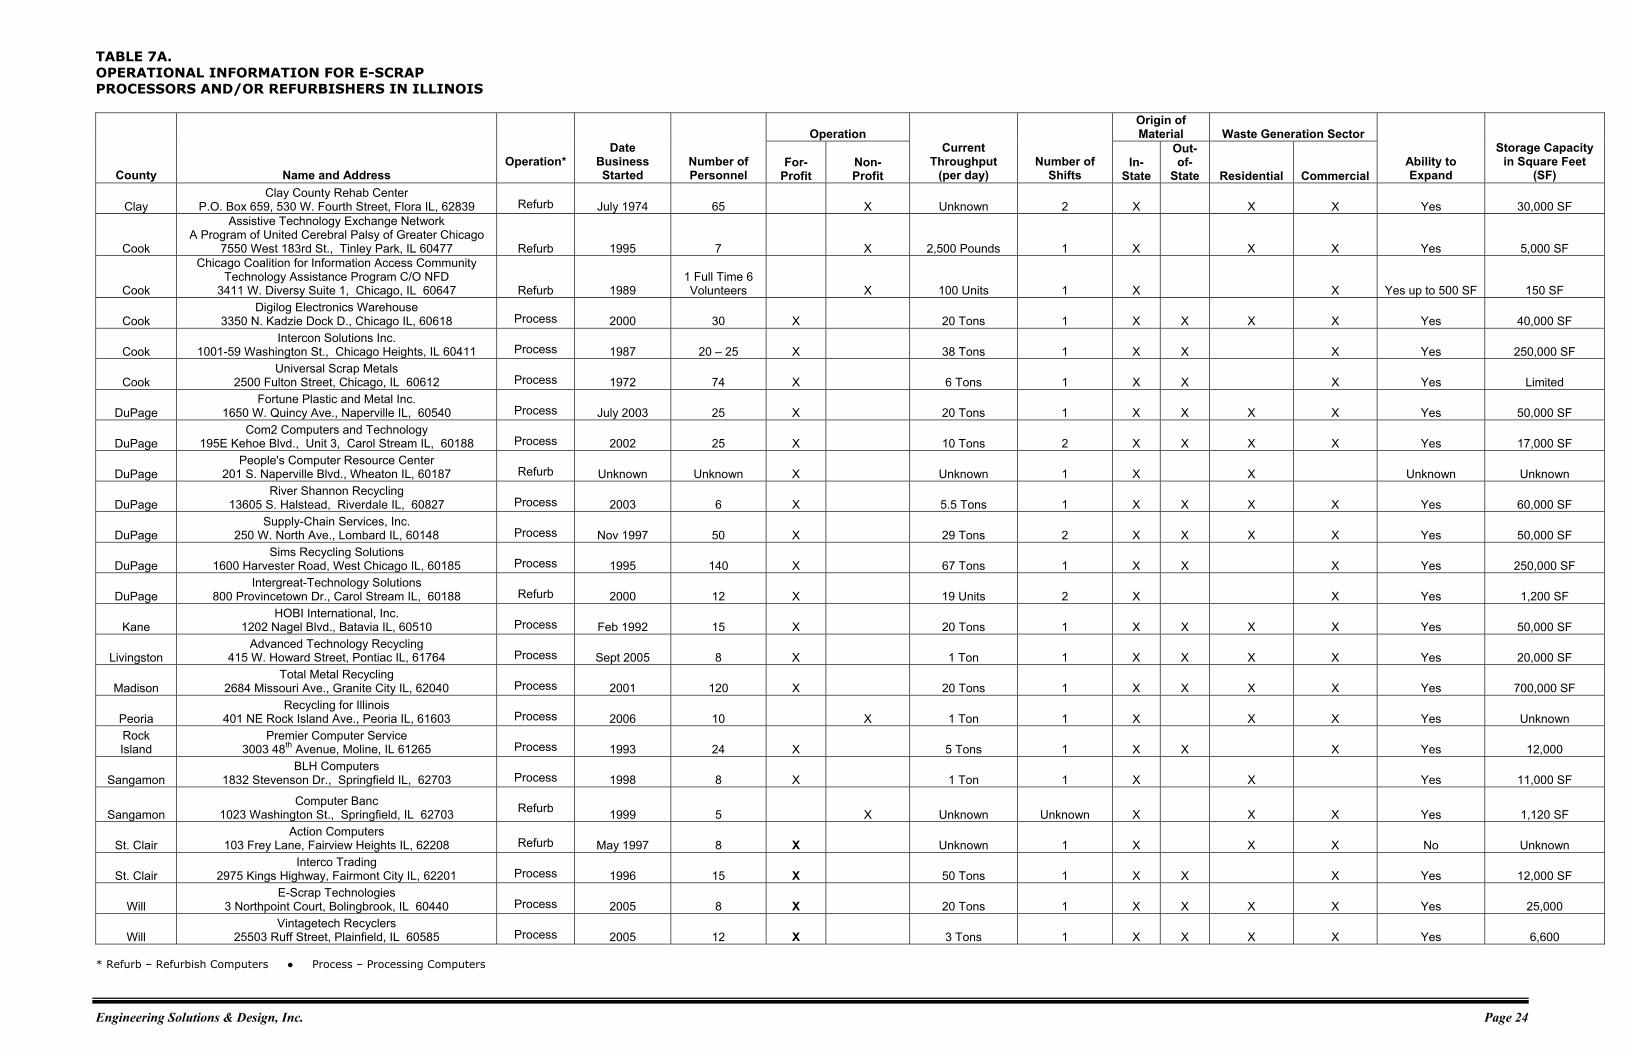
Table 7A and Table 7B provide operational information for the 24 organizations that
responded to the survey and process and/or refurbish E-scrap. A brief analysis of this
information is provided in the following paragraphs.
PROCESSORS/REFURBISHERS
Date Business Started: Sixteen of the organizations started business during or
after 1995.
Number of Personnel: The number of personnel varies from less than 10 to 140.
There is no indication of the responsibilities of these personnel. Only one
organization indicated it utilized volunteers.
Operation: Nineteen of the organizations are for-profit entities and the remaining
organizations are non-profit entities.
Current Throughput: The current throughput of the 24 organizations varies from
less than one ton to over 67 tons per day. Six of the organizations had no idea of
their current throughput. Of these six organizations, three are non-profit entities. A
more detailed discussion of potential processing capacity is provided in Section 5.
Number of Shifts: Only one of the 24 organizations was unsure of how many shifts
it operates. Four of the organizations operate more than one shift.
Origin of Materials: All 24 organizations accept E-scrap from in-state sources and
15 accept E-scrap from out-of -state sources. All of the organizations that accept
E-scrap from out-of-state sources are for-profit entities. Additionally, three of these
organizations operate more than one shift.
Scrap Generation Sector: All of the organizations (except for seven) accept E-
scrap from residential generators while 22 organizations accept E-scrap from
commercial generators. Six of the organizations that do not accept E-scrap from
residential generators are for-profit entities; one is a non-profit entity. Of the 15
organizations that accept out-of-state E-scrap, all accept commercial E-scrap.

Engineering Solutions & Design, Inc. Page 23
Ability to Expand: Only one of the organizations does not have the ability to
expand. Two other organizations have limited space to expand or the information is
unknown.
Storage Capacity: Four of the organizations were uncertain of their storage space.
Three of these organizations are for-profit businesses. Excluding these four
organizations, the remaining 20 organizations’ storage capacity is 1,591,070 square
feet. The average storage capacity is 79,554 square feet. If the three organizations
with the largest storage capacity are not considered, the average storage capacity of
the remaining 14 organizations reduces to 23,000 square feet. Of the three
organizations with the largest storage capacity, two are in the Chicago area and one
is located near St. Louis.
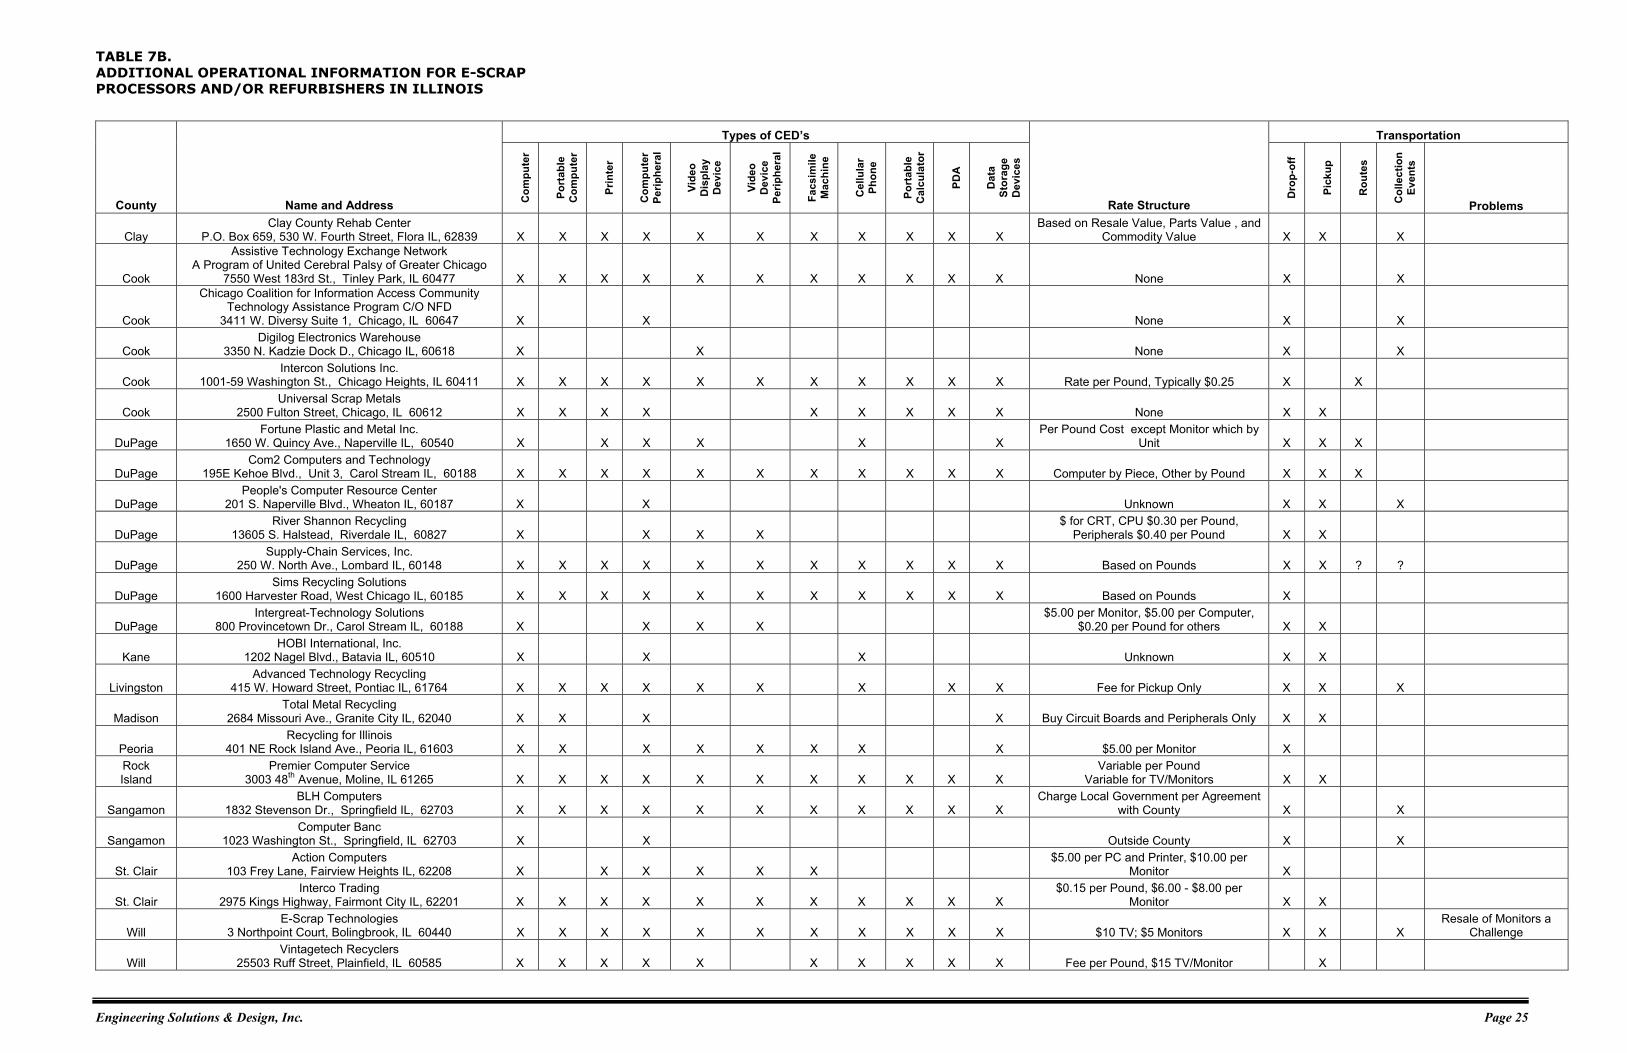
Types of CED’s Accepted: Ten of the 24 organizations accept the entire list of
CED’s. All of the organizations accept computers. Video display devices are
accepted by all but six of the organizations. Cellular phones are the least accepted
and they are accepted by 13 of the organizations. Of the ten organizations that
accept all of the CED’s, eight are for-profit entities. Further, of the ten organizations
that accept all of the CED’s, six of these organizations are in the northeast portion of
the state; one is near St. Louis; one is in Springfield; one is in the Quad Cities area;
and only one is not near a large urban area.
Rate Structure: There are six of the 24 organizations that do not have a rate
structure or it is unknown. The remaining organizations’ rate structures vary
significantly. Eight of these organizations indicate that they charge for computer
monitors with the fee ranging from $5.00 to $15.00. Other charges are based on
weight or by piece. One organization sets its fees based on the value of the E-
scrap.
Transportation: Twenty-three of the 24 organizations provide for the drop off of E-
scrap. Fifteen organizations provide a pickup service and three organizations provide
a route service. None of the organizations indicated any problems with
transportation – either receiving or shipping. Eight of the organizations utilize
collection events. Unlike the collectors, the processing and/or refurbishing
organizations are much more aggressive about capturing E-scrap.
Engineering Solutions & Design, Inc. Page 24
TABLE 7A. OPERATIONAL INFORMATION FOR E-SCRAP PROCESSORS AND/OR REFURBISHERS IN ILLINOIS
Operation Origin of Material Waste Generation Sector
County Name and Address
Operation* Date
Business Started
Number of Personnel
For-Profit
Non- Profit
Current Throughput
(per day) Number of
Shifts In-
State
Out-of-
State Residential Commercial Ability to Expand
Storage Capacity in Square Feet
(SF)
Clay Clay County Rehab Center
P.O. Box 659, 530 W. Fourth Street, Flora IL, 62839
Refurb July 1974 65 X Unknown 2 X X X Yes 30,000 SF
Cook
Assistive Technology Exchange Network A Program of United Cerebral Palsy of Greater Chicago
7550 West 183rd St., Tinley Park, IL 60477
Refurb 1995 7 X 2,500 Pounds 1 X X X Yes 5,000 SF
Cook
Chicago Coalition for Information Access Community Technology Assistance Program C/O NFD
3411 W. Diversy Suite 1, Chicago, IL 60647
Refurb 1989 1 Full Time 6 Volunteers X 100 Units 1 X X Yes up to 500 SF 150 SF
Cook Digilog Electronics Warehouse
3350 N. Kadzie Dock D., Chicago IL, 60618
Process 2000 30 X 20 Tons 1 X X X X Yes 40,000 SF
Cook Intercon Solutions Inc.
1001-59 Washington St., Chicago Heights, IL 60411
Process 1987 20 – 25 X 38 Tons 1 X X X Yes 250,000 SF
Cook Universal Scrap Metals
2500 Fulton Street, Chicago, IL 60612
Process 1972 74 X 6 Tons 1 X X X Yes Limited
DuPage Fortune Plastic and Metal Inc.
1650 W. Quincy Ave., Naperville IL, 60540
Process July 2003 25 X 20 Tons 1 X X X X Yes 50,000 SF
DuPage Com2 Computers and Technology
195E Kehoe Blvd., Unit 3, Carol Stream IL, 60188
Process 2002 25 X 10 Tons 2 X X X X Yes 17,000 SF
DuPage People's Computer Resource Center
201 S. Naperville Blvd., Wheaton IL, 60187
Refurb Unknown Unknown X Unknown 1 X X Unknown Unknown
DuPage River Shannon Recycling
13605 S. Halstead, Riverdale IL, 60827
Process 2003 6 X 5.5 Tons 1 X X X X Yes 60,000 SF
DuPage Supply-Chain Services, Inc.
250 W. North Ave., Lombard IL, 60148
Process Nov 1997 50 X 29 Tons 2 X X X X Yes 50,000 SF
DuPage Sims Recycling Solutions
1600 Harvester Road, West Chicago IL, 60185
Process 1995 140 X 67 Tons 1 X X X Yes 250,000 SF
DuPage Intergreat-Technology Solutions
800 Provincetown Dr., Carol Stream IL, 60188
Refurb 2000 12 X 19 Units 2 X X Yes 1,200 SF
Kane HOBI International, Inc.
1202 Nagel Blvd., Batavia IL, 60510
Process Feb 1992 15 X 20 Tons 1 X X X X Yes 50,000 SF
Livingston Advanced Technology Recycling
415 W. Howard Street, Pontiac IL, 61764
Process Sept 2005 8 X 1 Ton 1 X X X X Yes 20,000 SF
Madison Total Metal Recycling
2684 Missouri Ave., Granite City IL, 62040
Process 2001 120 X 20 Tons 1 X X X X Yes 700,000 SF
Peoria Recycling for Illinois
401 NE Rock Island Ave., Peoria IL, 61603
Process 2006 10 X 1 Ton 1 X X X Yes Unknown Rock Island
Premier Computer Service 3003 48th Avenue, Moline, IL 61265
Process 1993 24 X 5 Tons 1 X X X Yes 12,000
Sangamon BLH Computers
1832 Stevenson Dr., Springfield IL, 62703
Process 1998 8 X 1 Ton 1 X X Yes 11,000 SF
Sangamon Computer Banc
1023 Washington St., Springfield, IL 62703
Refurb 1999 5 X Unknown Unknown X X X Yes 1,120 SF
St. Clair Action Computers
103 Frey Lane, Fairview Heights IL, 62208
Refurb May 1997 8 X Unknown 1 X X X No Unknown
St. Clair Interco Trading
2975 Kings Highway, Fairmont City IL, 62201
Process 1996 15 X 50 Tons 1 X X X Yes 12,000 SF
Will E-Scrap Technologies
3 Northpoint Court, Bolingbrook, IL 60440
Process 2005 8 X 20 Tons 1 X X X X Yes 25,000
Will Vintagetech Recyclers
25503 Ruff Street, Plainfield, IL 60585
Process 2005 12 X 3 Tons 1 X X X X Yes 6,600 * Refurb – Refurbish Computers ● Process – Processing Computers
Engineering Solutions & Design, Inc. Page 25
TABLE 7B. ADDITIONAL OPERATIONAL INFORMATION FOR E-SCRAP PROCESSORS AND/OR REFURBISHERS IN ILLINOIS
Types of CED’s Transportation
County Name and Address Com
pute
r
Port
able
C
ompu
ter
Prin
ter
Com
pute
r Pe
riphe
ral
Vide
o D
ispl
ay
Dev
ice
Vide
o D
evic
e Pe
riphe
ral
Facs
imile
M
achi
ne
Cel
lula
r Ph
one
Port
able
C
alcu
lato
r
PDA
Dat
a St
orag
e D
evic
es
Rate Structure
Dro
p-of
f
Pick
up
Rou
tes
Col
lect
ion
Even
ts
Problems
Clay Clay County Rehab Center
P.O. Box 659, 530 W. Fourth Street, Flora IL, 62839 X X X X X X X X X X X Based on Resale Value, Parts Value , and
Commodity Value X X X
Cook
Assistive Technology Exchange Network A Program of United Cerebral Palsy of Greater Chicago
7550 West 183rd St., Tinley Park, IL 60477 X X X X X X X X X X X None X X
Cook
Chicago Coalition for Information Access Community Technology Assistance Program C/O NFD
3411 W. Diversy Suite 1, Chicago, IL 60647 X X None X X
Cook Digilog Electronics Warehouse
3350 N. Kadzie Dock D., Chicago IL, 60618 X X None X X
Cook Intercon Solutions Inc.
1001-59 Washington St., Chicago Heights, IL 60411 X X X X X X X X X X X Rate per Pound, Typically $0.25 X X
Cook Universal Scrap Metals
2500 Fulton Street, Chicago, IL 60612 X X X X X X X X X None X X
DuPage Fortune Plastic and Metal Inc.
1650 W. Quincy Ave., Naperville IL, 60540 X X X X X X Per Pound Cost except Monitor which by
Unit X X X
DuPage Com2 Computers and Technology
195E Kehoe Blvd., Unit 3, Carol Stream IL, 60188 X X X X X X X X X X X Computer by Piece, Other by Pound X X X
DuPage People's Computer Resource Center
201 S. Naperville Blvd., Wheaton IL, 60187 X X Unknown X X X
DuPage River Shannon Recycling
13605 S. Halstead, Riverdale IL, 60827 X X X X $ for CRT, CPU $0.30 per Pound,
Peripherals $0.40 per Pound X X
DuPage Supply-Chain Services, Inc.
250 W. North Ave., Lombard IL, 60148 X X X X X X X X X X X Based on Pounds X X ? ?
DuPage Sims Recycling Solutions
1600 Harvester Road, West Chicago IL, 60185 X X X X X X X X X X X Based on Pounds X
DuPage Intergreat-Technology Solutions
800 Provincetown Dr., Carol Stream IL, 60188 X X X X $5.00 per Monitor, $5.00 per Computer,
$0.20 per Pound for others X X
Kane HOBI International, Inc.
1202 Nagel Blvd., Batavia IL, 60510 X X X Unknown X X
Livingston Advanced Technology Recycling
415 W. Howard Street, Pontiac IL, 61764 X X X X X X X X X Fee for Pickup Only X X X
Madison Total Metal Recycling
2684 Missouri Ave., Granite City IL, 62040 X X X X Buy Circuit Boards and Peripherals Only X X
Peoria Recycling for Illinois
401 NE Rock Island Ave., Peoria IL, 61603 X X X X X X X X $5.00 per Monitor X Rock Island
Premier Computer Service 3003 48th Avenue, Moline, IL 61265 X X X X X X X X X X X
Variable per Pound Variable for TV/Monitors X X
Sangamon BLH Computers
1832 Stevenson Dr., Springfield IL, 62703 X X X X X X X X X X X Charge Local Government per Agreement
with County X X
Sangamon Computer Banc
1023 Washington St., Springfield, IL 62703 X X Outside County X X
St. Clair Action Computers
103 Frey Lane, Fairview Heights IL, 62208 X X X X X X $5.00 per PC and Printer, $10.00 per
Monitor X
St. Clair Interco Trading
2975 Kings Highway, Fairmont City IL, 62201 X X X X X X X X X X X $0.15 per Pound, $6.00 - $8.00 per
Monitor X X
Will E-Scrap Technologies
3 Northpoint Court, Bolingbrook, IL 60440 X X X X X X X X X X X $10 TV; $5 Monitors X X X Resale of Monitors a
Challenge
Will Vintagetech Recyclers
25503 Ruff Street, Plainfield, IL 60585 X X X X X X X X X X Fee per Pound, $15 TV/Monitor X

Engineering Solutions & Design, Inc. Page 26
2.1.5 Nationally Based E-Scrap Recyclers
ES&D also developed a list of nationally-based E-scrap recyclers. We started with a
database of 78 potential contacts and later added another 64 potential contacts. Table 8
provides a list of the nationally-based organizations that provide E-scrap recycling for
Illinois residents and the services each provides. Of the 142 potential contacts, we found 41
nationally-based organizations that recycle E-scrap for Illinois residents. Of these 41
organizations:
• 31 collect E-scrap;
• 29 process E-scrap;
• 10 refurbish E-scrap;
• 1 brokers E-scrap;
• 17 resell E-scrap;
• 11 collect and process E-scrap;
• 6 collect, process and resell E-scrap;
• 4 collect and resell E-scrap;
• 3 collect, process and refurbish E-scrap;
• 3 collect, refurbish and resell E-scrap;
• 2 process, refurbish and resell E-scrap;
• 1 collects, processes, refurbishes and resells E-scrap; and
• 1 processes and refurbishes E-scrap.
In addition, ES&D found 10 nationally-based electronics companies that accept
electronic scrap at their stores around Illinois or by having users ship their E-scrap to a
designated location outside Illinois. These companies are listed in Table 9.

Engineering Solutions & Design, Inc. Page 27
TABLE 8. NATIONALLY-BASED E-SCRAP RECYCLERS
State Name Address Phone E-Mail/Website Coll Proc Refur Brok Resell
E-SCRAP RECYCLERS LOCATED IN STATES BORDERING ILLINOIS
IA Electronic De-Manufacturing Facility (serves Rock Island) 1048 E. 59th St., Davenport, IA 52807 (563) 823-0119 www.waastecom.com x x
IN Butler-MacDonald, Inc. 5955 W. 80th Street, Indianapolis, IN 46278 (317) 872-5155 www.butlermacdonald.com x x
IN Cascade Asset Management 853 Columbia Rd., Suite 125, Plainfield, IN 46168 (888) 222-8399 www.cascade-assets.com x x x
IN Chesapeake Recycling 1600 South US 35 P.O. Box 160, Winamac, IN 46996 (866) 946-6602 www.chesapeakerecycling.com x x
IN Goldsmith Group, Inc. 2107 N. Adams St., Indianapolis, IN 46218 (800) 989-7295 www.goldsmithgroup.com x x x
IN Lighting Resources, LLC 498 Park 800 Drive, Greenwood, IN 46143 (866) 375-7340 www.lightingresourceinc.com x x
IN Mervis Industries 1600 Anne Street, Kokomo, IN 46901 (765) 457-4370 www.mervis.com x
MO The Surplus Exchange 518 Santa Fe, Kansas City, MO 64105 (816) 472-0444 www.thesurplusexchange.com x x
MO WITS 647 E. Holly, St. Louis, MO 63147 (314) 382-1650 www.witsinc.org x x x
WI 5R Processors, LTD P.O. Box 195 600West Gates Ave., Ladysmith, WI 54848 (715) 532-2057 www.5rprocessors.com x x
WI BMEX of Wisconsin 136 West Grand Ave., Suite 100, Beloit, WI 53511 (800) 364-3233 www.bmex.org x
WI CRT Processing 1227 Barberry Dr., Janesville, WI 53545 (608) 754-3400 www.crtprocessing.com x x
WI Resource Solutions Corp. 5493 Express Circle, Madison, WI 53704 (888) 922-5451 www.recyclethatstuff.com x x
WI Scientific Recycling, Inc. 659 Commerce St., Holmen, WI 54636 (800) 917-1969 www.scientificrecycling.com x x x
E-SCRAP RECYCLERS LOCATED THROUGHOUT UNITED STATES
AZ Earth Protection Services, Inc. 10 S. 48th Ave., Suite 4, Phoenix, AZ 85043 (602) 353-9282 www.earthpro.com x x x
CA HMR USA, Inc. 435 23rd St., San Francisco, CA 94107 (415) 647-6071 www.hmrusa.com x x x
CA Simply Sellular (cell phones mail in only) 7272 Saturn Drive, Suite P, Huntington Beach, CA 92647 (714) 841-8898 www.simplysellular.com x
CA The Big Green Box (mail in portable electronics only) 125 E. Commercial St., Suite A, Anaheim, CA, 92801 (714) 278-9211 www.biggreenbox.com x
CO Technology Recycling Metro Point One 4600 South Ulster St., Suite 150, Denver, CO 80237 (866) 400-8615 www.techrecycle.com x
CT Computer Recycling USA 198 Inverary Dr., Watertown, CT 06795 (877) 729-2783 www.computerrecyclingusa.com x x
FL EnviroLight & Disposal, Inc. 3200 44th Ave., North St. Petersburg, FL 33714 (800) 600-3738 www.envirodisp.com x x
FL Global Investment Recovery, Inc. 5409 East Henry Ave., Tampa, FL 33610 (800) 886-8086 www.girpreciousmetals.com x

Engineering Solutions & Design, Inc. Page 28
TABLE 8. NATIONALLY-BASED E-SCRAP RECYCLERS (continued)
State Name Address Phone E-Mail/Website Coll Proc Refur Brok Resell
GA Electrical Telecom Recycling 1737 Hillsdale Rd., La Fayette, GA 30728 (866) 638-8060 www.escrapetr.com x
KS PC Disposal 900 E. Loula, Olathe, KS 66062 (877) 244-0250 www.pcdisposal.com x x
MA ARS Computer Asset Recovery Services 125 Southbridge Rd., North Oxford, MA 01537 (877) 277-3879 www.asset-recoveryservices.com x x x
MI COMPRENEW Environmental 629 Ionia Ave., Grand Rapids, MI 49503 (616) 451-4400 www.comprenew.com x x x
MI Dcal Services 2609 Rock Hill Industrial Court, St. Louis, MO 63144 (314) 918-8833 www.dcalservices.com x x x
MI Great Lakes Electronic Recycling 12600 Greenfield Rd., Detroit, MI 48227 (313) 838-7000 www.recycleelectronics.com x x
MI TEK Systems 1610 East Highwood Drive, Pontiac, MI 48340 (248) 253-0111 www.motorcitycomputer.com x x x
MI Valley City Environmental Services, Inc. 1040 Market St. SW, Grand Rapids, MI 49503 (616) 235-1500 www.valleycityes.com x x x
MN Asset Recovery Corp. 2299 Territorial Road, Saint Paul, MN 55114 (800) 472-2081 www.assetrecoverycorp.com x x x
MN Computers for Schools Program 970 Pickett St., Bayport, MN 55003 (615) 779-2816 www.cfsrp.state.mn.us x x x
MN Enviro-Chem 21821 Industrial Blvd., Rogers, MN 55374 (763) 428-4002 www.enviro-chem.bz x x
MN Materials Processing Corporation 2805 West Service Road, Eagan, MN 55121 (866) 661-6723 www.materialsprocessing.com x
MN PartStock Computer Solutions 504 SE Malcolm Ave., Minneapolis, MN 55414 (877) 928-4800 www.partstockpc.com x x x
MN Retrofit Companies 3855 W. Hwy. 14, Owatonna, MN 55060 (800) 795-1230 www.retrofitcompanies.com x x
NJ Advance Recovery, Inc. 223 Verona Ave., Newark, NJ 07104 (973) 450-9797 www.advancedrecovery.com x
NY Amandi Services, Inc. 200 Stage Rd., Vestal, NY 13850 (607) 321-2079 www.amandi.com x x x x
OH ReUse Industries 74815 U.S. Hwy. 50, Albany, OH 45710 (local drop-offs) (740) 698-8200 www.reuseindustries.org x
OH USA Lamp & Ballast Recycling, Inc. 7806 Anthony Wayne Ave., Cincinnati, OH 45216 (800) 778-6645 www.usalamp.com x x
WA GreenDisk, Inc. 1988 18th Avenue NE, Suite B, Issaquah, WA 98029 (425) 392-8727 www.greendisk.com x x
Coll = Collectors • Proc = Processor • Refur = Refurbisher • Brok = Broker • Resell = Reseller

Engineering Solutions & Design, Inc. Page 29
TABLE 9. NATIONALLY-BASED ELECTRONIC COMPANIES THAT ACCEPT E-SCRAP
Name Address Phone E-Mail/Website
Best Buy Co., Inc.
P.O. Box 9312
Minneapolis, MN 55440 (612) 291-1000 www.bestbuy.com
Circuit City
9950 Maryland Dr.,
Richmond, VA 23233 (804) 486-4000 www.circuitcity.com
CompUSA
14951 Dallas Pkwy Dallas, TX 75254 (972) 982-4000 www.compusa.com
Dell Computers
One Dell Way
Round Rock, TX 78682 (888) 560-8324 www.dell.com
Hewlett-Packard
3000 Hanover St.
Palo Alto, CA 94304 (650) 857-5518 www.hp.com
IBM Corporation
1 New Orchard Rd. Armonk, NY 10504 (800) 426-4968 www.ibm.com
Motorola, Inc.
One Symbol Plaza
Holtsville, NY 11742 www.motorola.com
Verizon Wireless
133 Calkins Rd.
Rochester, NY 14623 (585) 321-7000 www.verizonwireles.com
Sony Electronics, Inc.
16450 West Bernando Dr.
San Diego, CA 92127 (858) 942-2729 www.sony.com
Apple Computers
1 Infinte Loop
Cupertino, CA 95014 (408) 996-1010 www.apple.com

Engineering Solutions & Design, Inc. Page 30
The survey questions utilized when interviewing E-scrap organizations in Illinois were
also distributed to a number of national E-scrap organizations. The response to the
questionnaire was limited, with only six organizations responding. Table 10 provides
operational information for the six national organizations that process and or refurbish E-
scrap. A brief analysis of this information is provided in the following paragraphs.
Date Business Started: All six organizations have been operating for at least 15
years. Based on the information provided, it appears that all six of these
organizations have been involved in some manner of recycling for some time and
added E-scrap processing within the past few years.
Number of Personnel: The number of personnel varies from less than ten to 500.
There is no indication of the responsibilities of these personnel. Only one of the
organizations indicated it operates internationally.
Operation: All of the organizations are for-profit businesses.
Throughput: The throughput of the six organizations varies from 1,400 pounds to
385,000 pounds per day. One of the six organizations appears to be regionally
focused given its smaller throughput. If this organization is not considered, the total
throughput of the remaining organizations is 698,400 pounds per day or an average
of 139,680 pounds per day. The total number of personnel working at facilities in
North America for the remaining five organizations is 949. The production rate for
these personnel is 736 pounds (0.37 tons) per day. If we assume 10% of the
personnel are not directly involved in processing the E-scrap, the production rate of
the personnel increases to 818 pounds (0.41 tons) per day.
Number of Shifts: Four of the six organizations operate one shift and will operate
two shifts, if needed. Two of the six organizations operate two shifts at the present
time. It is uncertain if the other four organizations are operating one shift or two
shifts when the questionnaire was completed. Utilizing information from the two
organizations that operate two shifts, the production rate per shift is 26,500 pounds.
The production rate per personnel at these two organizations (taking into
consideration the 10% non-process factor) is 349 pounds (0.17 tons) per day.

Engineering Solutions & Design, Inc. Page 31
Origin of Materials: All six organizations accept E-scrap from in-state and out-of-
state sources.
Scrap Generation Sector: All of the organizations (except for one) accept E-scrap
from residential generators and all six organizations accept E-scrap from commercial
generators.
Ability to Expand: All six of the organizations have the ability to expand.
Storage Capacity: The storage capacity of five of the six organizations is
2,450,000 square feet. The average storage capacity is 490,000 square feet. If the
organization with the largest storage capacity is not considered, the average storage
capacity of the remaining organizations reduces to 362,500 square feet.
Types of CED’s Accepted: Five of the six organizations accept the entire list of
CED’s. One of the organizations accepts the entire list of CED’s with the exception of
facsimile machines, cellular phones, and portable calculators.
Rate Structure: All six organizations charge a fee for their services. These fees
vary and are based on weight, volume, distance to the generator, and value of the E-
scrap. One of the organizations offers a revenue-sharing option for its customers.
Transportation: All six organizations provide for the drop off and pickup of E-
scrap. Five of the organizations provide a route service. None of the organizations
indicated any problems with transportation – either receiving or shipping. Two of the
organizations utilize collection events.

Engineering Solutions & Design, Inc. Page 32
TABLE 10. OPERATIONAL INFORMATION FOR NATIONAL E-SCRAP PROCESSORS AND/OR REFURBISHERS
Operation Origin of Material Waste Generation Sector
State Name and Address
Date Business Started
Number of Personnel
For-Profit
Non- Profit
Throughput (per day)
Number of Shifts
In-State
Out-of-
State Residential Commercial Ability to Expand
Storage Capacity in Square Feet
(SF)
MN Materials Processing Corporation 1983 35 X 31,000 pounds 2 X X X X Yes 50,000 SF
MA and CA Metech 1968 45 X 65,400 pounds 1 or 2 X X X Yes Over 1,000,000 SF
NY and AZ Amandi Services 2005* 226 X 195,000 pounds 1 or 2 X X X X Yes 400,000 SF
International SIMS Recycling Solutions 1950 3,300** X 385,000 pounds 1 or 2 X X X X Yes 800,000 SF
WI *** Veolia Environmental Services 1990 143 X 22,000 pounds 2 X X X X Yes 200,000 SF
WA Green Disk, Inc. April 1992 4 part time 2 full time **** X 1,400 pounds 1 or 2 X X X X Yes Unknown
* Amandi is a merger of Envirocycle and Nxtcycle – Envirocycle started in 1990 and Nxtcycle started in 2000.
** This is globally; nationally approximately 500
*** Wisconsin is main office. Have four sites nationally.
**** Out source a number of activities.
Types of CED’s Transportation
State Name and Address
Com
pute
r
Port
able
C
ompu
ter
Prin
ter
Com
pute
r Pe
riphe
ral
Vide
o D
ispl
ay
Dev
ice
Vide
o D
evic
e Pe
riphe
ral
Facs
imile
M
achi
ne
Cel
lula
r Ph
one
Port
able
C
alcu
lato
r
PDA
Dat
a St
orag
e D
evic
es
Rate Structure
Dro
p-of
f
Pick
up
Rou
tes
Col
lect
ion
Even
ts
Problems
MN Materials Processing Corporation X X X X X X X X X X X Based on Value or lack of value X X X
MA and CA Metech X X X X X X X X X X X Per pound basis based on material; mostly large commercial accounts X X X
NY and AZ Amandi Services X X X X X X X X X X Depends on type of equipment X X X X
International SIMS Recycling Solutions X X X X X X X X X X X Fee based on per pound and offer
revenue share to customer X X X
WI Veolia Environmental Services X X X X X X X X Fee based on volume and distance to
collection point X X X X
WA Green Disk, Inc. X X X X X X X X X X By weight and shipping cost X X
NOTE: These processors/refurbishers have received e-scrap from Illinois and aggressively seek e-scrap in Illinois.

Engineering Solutions & Design, Inc. Page 33
2.2 GENERATION RATE DATA COMPILATION
2.2.1 Comparable Studies
For the purposes of this project, data was compiled from a number of different
reports relating to electronic scrap. To find relevant reports, the Internet was used to
search for documents produced by credible and reputable sources. The search engines
Yahoo! and Google were the main starting points for the initial search; however, references
from the websites yielded by the search were then used to find additional information. The
reports that resulted from the search ranged from small municipal-level reports to
nationwide reports discussing the state of E-scrap in the United States. In addition, the
reports ranged from waste characterization studies to legislation outlines, assessments of E-
scrap collection and processing, waste management studies, E-scrap recycling pilot
programs, reports intended for consumer information, and solid waste stream studies. All
reports of possible value were then fully reviewed and assessed for relevance to this
project. Once a report was deemed appropriate, all relevant information and statistics were
isolated and included in a report summary.
2.2.2 Limitations of Information
Upon reviewing the selected third-party reports it became apparent that there were
a number of variances with the pertinent data. The most notable issue was the varying
definition of electronic scrap from report to report. All the reports’ definitions included the
same basic core that encompassed computers, computer peripherals, televisions, and
monitors. However, items such as video gaming systems, DVD players, VCR’s, printer
cartridges, cell phones, and other similar items were included in some definitions but not
others. As a result, the definition issue reduced the consistency of the data and complicated
the analysis.
Data was also limited by its origin. Data contained in reports from small
municipalities could not be used to reflect data from highly urbanized areas such as
California. Though some reports offered data via “per capita” statistics, most offered data
by unit count or by gross weight. This variance in the manner data was presented limited
the ability to compare data from two largely different demographic areas.
Engineering Solutions & Design, Inc. Page 34
Each report employed similar but different methodologies. Some reports based data
on waste characterization studies while others used consumer sales statistics to generate
data. This limitation created a variance in the data. Although this variance impacted the
data, it was not significant enough to exclude the data or its source.
The final notable limitation was the manner in which data was presented. Some
reports provided statistics using units as a measurement while others provided them using
pounds. For example, discarded cell phones were greatly outweighed by discarded
televisions; however, the pure number of discarded cell phones dwarfed the number of
discarded television units. Thus, the resulting numbers for a report that included cell
phones could be misleading when compared to the numbers of a report where cell phones
were not included. Data was also provided with time ranges from one year to 25 years.
This inconsistency in data created a problem when attempting a comparison of values for
similar statistics.
Having considered these variations, there were common statistical values found in
most of the reports. The values include: (1) the amount of E-scrap obsolete, discarded,
and recycled; (2) the percentage of E-scrap in the total solid waste steam; (3) the amount
of stockpiled equipment; and (4) the rate at which computers become obsolete. These
nationwide values ranged from report to report and the ranges are as follows:
• The amount of E-scrap considered obsolete by 2005 equaled 450 million units, with an estimation of 63 million units in 2005 alone.
• The amount of E-scrap discarded was 80 to 90%. • The amount of E-scrap recycled ranged from 10 to 20%. • The percentage of E-scrap in the solid waste stream was 0.8 to 0.9%. • The amount of stockpiled equipment totaled 180 to 500 million units. • The rate at which computers became obsolete varied from 3 to 4 years.
2.2.3 Data Analysis
There are two parts to the E-scrap generation analysis. The first part is a
determination of the amount of E-scrap generated annually and the second is the amount of
E-scrap that is being discarded into landfills. The various reviewed studies identified the
amount of E-scrap generated annually. The United States Environmental Protection Agency
(USEPA) has determined that the annual generation rate of E-scrap is approximately 1.9 to
2.2 million tons nationally.

Engineering Solutions & Design, Inc. Page 35
Based on the results of the data search, a review of reports and studies, and our
experience in conducting waste characterization studies, we determined that the most
representative electronic scrap disposal rate is derived from waste characterization studies.
These studies provide a direct glimpse into the actual waste stream in a variety of locations.
Seven waste characterization studies (State of Georgia, State of Iowa, State of Ohio,
Johnson County Kansas, State of Wisconsin, State of Kansas, and State of Minnesota) were
reviewed. These seven studies were selected utilizing the following criteria: (1) the study
was completed within the past seven years; (2) the study area encompassed similar
characteristics to the State of Illinois (based on either its size or proximity to the state); and
(3) electronic scrap was identified as a part of the study. The definition of electronic scrap
varied from study to study; however, each study’s definition included many of the same
materials as defined and used for this project.
Utilizing information from each study, we established a per capita electronic scrap
generation rate for both rural and urban areas. From the seven waste characterization
studies, the per capita generation rate in rural areas varied from 0.47 to 8.64 pounds per
person (average 4.55 pounds per person); the urban area per capita generation rate varied
from 1.56 to 9.9 pounds (average 5.73 pounds per person). These variances appear to be
due to a number of factors.
1. The service areas for the facilities could not be easily identified in some of the studies.
2. The definition of electronic scrap varied, with some of the studies considering
televisions and stereos as electronic scrap. 3. The sampling procedures for the studies typically precluded monitors and
CPUs in the direct sample because of the size and weight of these items would have severely skewed the sample results.
Considering these factors, the per capita generation rates were adjusted to reflect
the variations in definitions and sampling patterns. The adjustments included:
1. A percentage increase or factor to the pounds per person to account for the variation in the E-scrap definition and more closely mirror the definition used for this study. A percentage increase or factor based on the density of the service area as it would relate to rural and urban areas in Illinois.
2. An additional weight factor to the pound per person calculation to
accommodate the lack of monitors and CPUs in the direct sample.

Engineering Solutions & Design, Inc. Page 36
Utilizing these factors the following equations were developed:
RGR = 4.55 x DEF x DSA x CPUM
UGR = 5.73 x DEF x DSA x CPUM
where:
RGR is Rural E-Scrap Generation Rate per Person UGR is Urban E-scrap Generation Rate per Person DEF is the definition correction factor (1.08) – This factor is based on the discrepancy between the definitions of E-Scrap for this report as it compares to the waste characterization studies. For the most part the variations were relatively minor. DSA is the Density of the Service Area factor (Urban = 1.41; Rural = 1.08) – This factor is based on the characteristics of the population base and magnitude of the urban areas in each of the areas where the waste characterization study was performed as it relates to the State of Illinois. In all cases the magnitude of the urban areas in Illinois was significantly greater than in the states where the waste characterization studies were performed. The variance between rural areas was much less significant. CPUM is the CPU Monitor factor (1.75) – This factor addresses the variance in E-scrap weights generated in the waste characterization studies as it compares to this study. In the majority of the waste characterization studies the CPU and monitor were not weighed but counted.
These calculations resulted in the following annual generation rates:
• Rural Area Per Capita Electronic Scrap Generation Rate = 9.17 pounds/year
• Urban Area Per Capita Electronic Scrap Generation Rate = 15.27 pounds/year
Although these generation rates are based on the best available information, it is
important to note that these generation rates are not firm, fixed numbers. They are a
reflection of the best available data that is affected by a number of variables. These
variables, including the constant changes in electronics, purchasing decisions by consumers
and businesses, and the rate of obsolescence of electronic products that make any E-Scrap
generation rate a reasonable assumption, at best.

Engineering Solutions & Design, Inc. Page 37
2.2.4 Analog Television Impact
Congress has mandated the conversion of television broadcast signals from analog to
digital format and this is scheduled to occur across the country on February 17, 2009.
Analog televisions – that is, televisions without digital tuners – must be connected to cable
or satellite broadcast service, or outfitted with a special digital-to-analog converter box, in
order to continue displaying over-the-air broadcast signals. Without one of these options
analog televisions literally will not receive over-the-air signals and will become useless,
unless used for video games or other uses.
While it would be expected today that nearly every household would have a
television, apparently this is not the case. The 2000 Census reported there were 4.6 million
households in Illinois. However, according to the Illinois Broadcasters Association (IBA),
and as reported to Congress, the most current information indicates that there are
3,899,330 households in Illinois with televisions and 17.1% of these or 810,940 households
receive over-the-air transmission signals. The remaining households either receive cable or
satellite transmissions. Unless the households that receive over-the-air signals elect to
subscribe to cable/satellite service, purchase a converter, or purchase a new television with
digital capability their televisions will become useless on the conversion date. In addition to
this, secondary televisions found in any household that are not upgraded to receive digital
signals will also become non-functional.
The USEPA estimates there are at least 2.5 televisions in the average household in
the United States. Therefore, using IBA and USEPA data, there are at least 9,748,325
televisions in Illinois. To present a worst-case scenario, it could be assumed that one
television from the 3.9 million households would become obsolete. The broadcast
conversion will likely be the catalyst for households to discard analog televisions, so a
significant rise in the number of televisions that will become available for recycling or
disposal starting in 2008 and into 2009 should be expected.
This situation has the strong potential to overwhelm processors in the state.
Considering a national impact, the conversion will likely flood processors who will be unable
to process the vast quantities, market prices will decline especially for lead glass, and
regrettably landfill disposal will become the primary management option.

Engineering Solutions & Design, Inc. Page 38
3.0 INTERACTIVE MAP
In order to provide access to the various entities that comprise the electronic scrap
recycling industry in the State of Illinois, an interactive map was developed. This map
provides information on organizations (both public and private) that provide various
services relating to the recycling of electronic scrap.
The map is easy to use. After opening the map from a website or directly from the
program utilizing Microsoft Explorer, you can click on any county in the state and a list of
organizations within or near a specific county that provide electronic scrap recycling services
are shown. If a number of organizations are listed, the program allows you to scroll
through the list. Each organization’s name, address, and contact information are provided
along with the recycling services the organization provides.
In addition, the program itself is easy to maintain and update. A service module is
provided with the program that allows updates to any of the listings as well as the ability to
add new listings. Figure 4, Figure 5, Figure 6 and Figure 7 present a pictorial representation
of the interactive map.

Engineering Solutions & Design, Inc. Page 39
•Select county on state map by clicking with mouse
•Enlarged version of county appears at lower right, centered in window
•Scrollable list of locations appears in window above enlarged map
•Information includes: name, address, phone, fax, email, website, and services offered
•Select county on state map by clicking with mouse
•Enlarged version of county appears at lower right, centered in window
•Scrollable list of locations appears in window above enlarged map
•Information includes: name, address, phone, fax, email, website, and services offered
FIGURE 4.INTERACTIVE MAP LISTING FEATURES AND COUNTY INTERFACE

Engineering Solutions & Design, Inc. Page 40
Clickable links to email and websites where available
Clickable links to email and websites where available
Scrollable windowScrollable window
Enlarged map with selected county centered in window
Enlarged map with selected county centered in window
FIGURE 5.INTERACTIVE MAP WITH INSTRUCTIONS AND COUNTY INTERFACE

Engineering Solutions & Design, Inc. Page 41
Select any of 10 economic regions on state map by clicking with mouse
•Enlarged version of region appears at lower right, centered in window
•Scrollable list of locations within entire region appears in window above enlarged map
•Information includes: name, address, phone, fax, email, website, and services offered
Click “VIEW ECONOMIC REGIONS” toggles back and forth between County and Regional views
Click “VIEW ECONOMIC REGIONS” toggles back and forth between County and Regional views
FIGURE 6.INTERACTIVE MAP LISTING FEATURES AND ECONOMIC DEVELOPMENT REGION

Engineering Solutions & Design, Inc. Page 42
Select County to be changed Select County to be changed Select location among existing entries for new data to be added or changed
Select location among existing entries for new data to be added or changed
Save and upload to serverSave and upload to server
Enter dataEnter data
FIGURE 7.INTERACTIVE MAP ADMINISTRATION TOOL

Engineering Solutions & Design, Inc. Page 43
4.0 GENERATION RATES
Based on the data collected in Section 2.2, electronic scrap generation rates for the
State of Illinois were developed. Generation rates were developed for:
• Total aggregate quantity of E-scrap for entire state (in tons) • Total aggregate quantity of E-scrap for each of the Illinois Economic Development
Regions (in tons) • Total aggregate quantity of E-scrap for each of the Illinois counties (in tons)
The first step in determining these generation rates was to define what areas of the
state are urban and what areas are rural. The United States Census Bureau’s listing of
Metropolitan Statistical Area (MSA) was combined with counties with a population estimate
(as of July 2006) greater than 50,000. A total of 34 counties are then considered urban
with the remaining counties being considered rural.
Using the latest estimated population figures for Illinois as developed by the U.S.
Census Bureau, it was determined that 11,462,549 people reside in urban areas (34
counties) and 1,369,421 people reside in rural areas (68 counties). The generation rates
for 2007 and the predicted generation rates for 2010 were then calculated. The 2007
generation rate is based on the E-scrap per capita generation rate developed in Section
2.2.3. The predicted generation rate for 2010 was calculated by multiplying the generation
rate for 2007 by a factor of 1.25. This factor is based on studies by the USEPA and the
National Safety Council that predict E-scrap generation rates will increase by 25% over the
next three years as the end-of-life time period for electronic products is reduced by
technological advances. The urban and rural E-scrap generation rates for Illinois in 2007
and 2010 are presented in Table 11.
TABLE 11. E-SCRAP GENERATION RATES FOR ILLINOIS
Electronic Scrap Generation (Tons)
Area
Population
2007 2010
Urban 11,462,549 87,517 109,396
Rural
1,369,421
6,279 7,848
Entire State
12,831,970
93,796 117,244

Engineering Solutions & Design, Inc. Page 44
To confirm the reliability of these numbers and the per capita generation rate, these
results were compared to the latest information from USEPA regarding E-scrap generation.
The latest figures from USEPA indicate that the entire nation generated 2.2 million tons of
E-scrap. With a population of 12,831,970 the State of Illinois is 4.3% of the total
population of the United States. Assuming a relatively linear comparison of population to
waste generation, the total E-scrap generation of the State of Illinois, based on USEPA
estimates, is 94,600 tons. This compares very favorably with the calculated generation
rates.
Table 12 presents the electronic scrap generation rates for each Illinois Economic
Development Region. Table 13 presents the E-scrap generation rates for those Illinois
counties determined to be urban for purposes of this study. Table 14 presents the E-scrap
generation rates for those Illinois counties defined as rural for purposes of this study.
TABLE 12. E-SCRAP GENERATION RATES FOR ECONOMIC DEVELOPMENT REGIONS
Economic Development Region
Population
2007 Generation Rate
(Tons)
2010 Generation Rate
(Tons) Northeast
8,751,941
66,690
83,370
Northern Stateline
450,466
3,500
4,375
Northwest
503,207
2,770
3,465
East Central
329,120
2,620
3,275
North Central
639,703
4,890
6,160
West Central 226,865 1,370 1,720 Central 551,230 3,370 4,220 Southeast 303,928 1,570 1,970 Southwest 688,546 4,980 6,225 Southern 386,964 1,880 2,350 Total 12,831,970 93,796 117,244
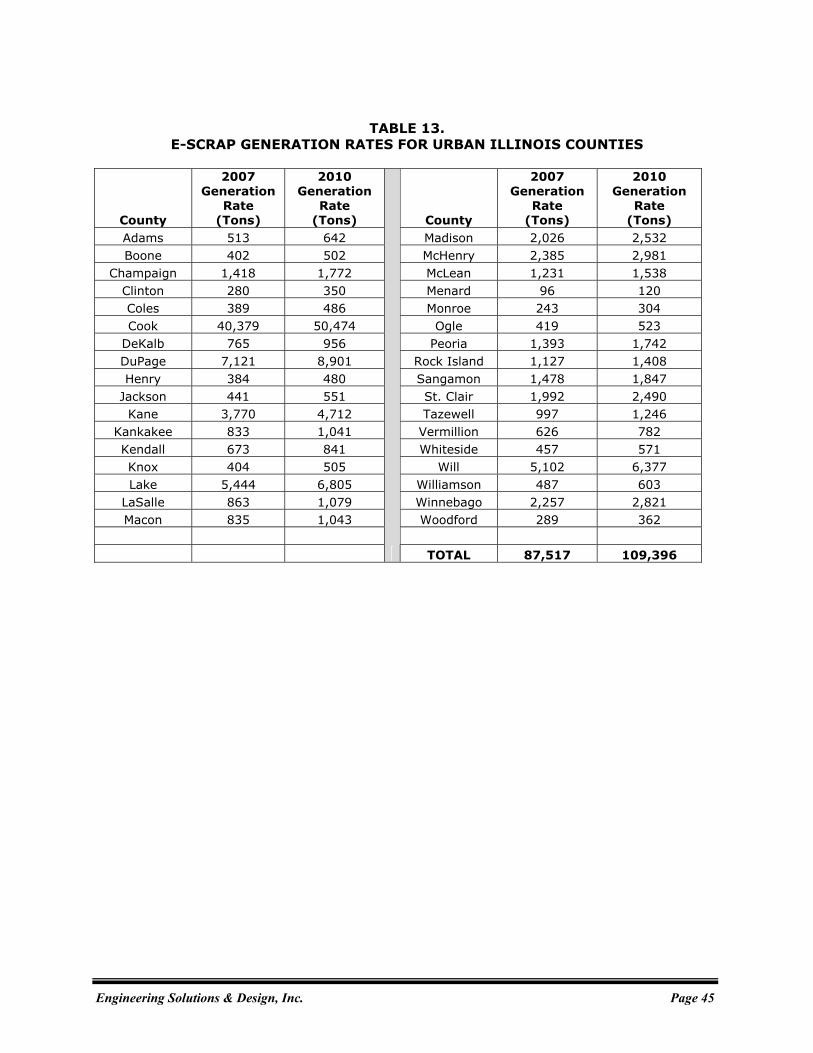
Engineering Solutions & Design, Inc. Page 45
TABLE 13. E-SCRAP GENERATION RATES FOR URBAN ILLINOIS COUNTIES
County
2007 Generation
Rate (Tons)
2010 Generation
Rate (Tons) County
2007 Generation
Rate (Tons)
2010 Generation
Rate (Tons)
Adams 513 642 Madison 2,026 2,532 Boone 402 502 McHenry 2,385 2,981
Champaign 1,418 1,772 McLean 1,231 1,538 Clinton 280 350 Menard 96 120 Coles 389 486 Monroe 243 304 Cook 40,379 50,474 Ogle 419 523
DeKalb 765 956 Peoria 1,393 1,742 DuPage 7,121 8,901 Rock Island 1,127 1,408 Henry 384 480 Sangamon 1,478 1,847
Jackson 441 551 St. Clair 1,992 2,490 Kane 3,770 4,712 Tazewell 997 1,246
Kankakee 833 1,041 Vermillion 626 782 Kendall 673 841 Whiteside 457 571 Knox 404 505 Will 5,102 6,377 Lake 5,444 6,805 Williamson 487 603
LaSalle 863 1,079 Winnebago 2,257 2,821 Macon 835 1,043 Woodford 289 362
TOTAL 87,517 109,396

Engineering Solutions & Design, Inc. Page 46
TABLE 14. E-SCRAP GENERATION RATES FOR RURAL ILLINOIS COUNTIES
County
2007 Generation
Rate (Tons)
2010 Generation
Rate (Tons) County
2007 Generation
Rate (Tons)
2010 Generation
Rate (Tons)
Alexander 40 49 Lawrence 73 91 Bond 83 103 Lee 164 205 Brown 31 38 Livingston 177 222 Bureau 162 202 Logan 139 174 Calhoun 24 30 Macoupin 224 280 Carroll 74 92 Marion 184 230 Cass 63 79 Marshall 60 75
Christian 161 201 Mason 71 89 Clark 78 97 Massac 69 87 Clay 64 80 McDonough 146 182
Crawford 91 114 Mercer 77 96 Cumberland 50 63 Montgomery 139 174
DeWitt 77 96 Morgan 164 204 Douglas 91 113 Moultrie 66 82 Edgar 88 110 Perry 105 131
Edwards 30 38 Piatt 77 96 Effingham 158 197 Pike 77 97 Fayette 100 125 Pope 19 24
Ford 65 81 Pulaski 31 39 Franklin 183 228 Putnam 28 34 Fulton 171 214 Randolph 151 189
Gallatin 28 35 Richland 72 90 Greene 65 82 Saline 119 149 Grundy 210 263 Schuyler 32 40
Hamilton 38 48 Scott 25 31 Hancock 88 109 Shelby 102 127 Hardin 21 26 Stark 29 36
Henderson 36 45 Stephenson 217 272 Iroquois 140 175 Union 84 105 Jasper 45 57 Wabash 57 71
Jefferson 186 232 Warren 80 100 Jersey 104 130 Washington 68 86
Jo Daviess 104 129 Wayne 76 95 Johnson 61 77 White 69 86
TOTAL 6,279 7,848
Engineering Solutions & Design, Inc. Page 47
5.0 PROCESSING CAPACITY
The results of survey efforts discussed in Section 2.1 identified 23 refurbishers;
however, only seven submitted additional operational information for a response rate of
30%. Even the additional information obtained from these seven refurbishers was minimal
and did not provide complete information that was sought. Refurbishers do contribute to
local E-scrap recycling, or to be more precise, the reuse of electronics, and play an
important role in job training and making electronics, usually computers, available to low-
income families, students, and others. Even though these organizations as a whole
refurbish hundreds of units a day, they are not a primary contributor to overall
management of E-scrap.
The survey identified 19 processors, and additional information was obtained from 17
of these processors, for a 90% response rate. The response information for both
refurbishers and processors is found in Table 7A and Table 7B (see page 24 and page 25,
respectively). Table 15 presents the 17 processors, the current daily throughput of E-scrap
in tons (as provided by the processors), the annual throughput tonnage, and the baseline
potential processing capacity in tons per year.
The annual throughput was calculated by a straight-forward method of multiplying
the daily throughput by 260 work days – a 5-day work week schedule. Thus, the current
annual throughput is 83,720 tons. However, the determination for potential capacity
includes other variables. While processors did supply the number of daily work shifts, many
indicated that work shifts vary. Many are only 8 hours a day, but others indicated that a
work shift can range from 8 up to 12 hours per day, as may be needed to accomplish their
production schedules. Processors also experience down time for unexpected situations and
scheduled equipment maintenance.

Engineering Solutions & Design, Inc. Page 48
TABLE 15. E-SCRAP PROCESSING CAPACITY FOR ILLINOIS
Entity
County Current
Daily Throughput
(TPD)
Current Annual
Throughput (TPY)
Estimated Maximum Capacity
Advanced Technology Recycling Livingston 1 260 546
BLH Computers Sangamon 1 260 546
Com2 Computers DuPage 10 2,600 5,460
Digilog Cook 20 5,200 10,920
E-Scrap Technologies Will 20 5,200 10,920
Fortune Plastic & Metal DuPage 20 5,200 10,920
Hobi International Kane 20 5,200 10,920
Interco Trading St. Clair 50 13,000 27,300
Intercon Solutions Cook 40 10,400 21,840
Premier Computer Services Rock Island 5 1,300 2,730
Recycling For Illinois Peoria 1 260 546
River Shannon Recycling DuPage 5 1,300 2,730
Sims Recycling Solutions DuPage 70 18,200 38,220
Supply-Chain Services DuPage 30 7,800 16,380
Totall Metal Recycling Madison 20 5,200 10,920
Universal Scrap Metals Cook 6 1,560 3,276
VintageTech Recyclers Will 3 780 1,638
TOTALS 322 83,720 175,812
Based on this information and the fact that processors could increase their capacity
using their existing facilities based upon several different variables, a range of potential
capacities was developed:
Scenario 1 (or baseline scenario) takes the daily throughput and multiplies it by the
annual work days and a work shift factor of 1.5 (or a 50% increase in current hours
in a shift):
(322 tons/day)(260 days/year)(1.5) = 125,580 tons/year (baseline)

Engineering Solutions & Design, Inc. Page 49
Scenario 2 increases the work shift factor to 1.75 (or a 75% increase in current
hours in a shift):
(322 tons/day)(260 days/year)(1.75) = 146,510 tons/year
A 17% increase over baseline
Scenario 3 increases the work days to 312 days per year (6 days per week):
(322 tons/day)(312 days/year)(1.5) = 150,696 tons/year
A 20% increase over baseline
Scenario 4 increases work days to 312 days per year and increases the work shift
factor to 1.75 (or a 75% increase in current hours in a shift):
(322 tons/day)(312 days/year)(1.75) = 175,812 tons/year
A 40% increase over baseline
The baseline potential capacity of 125,580 tons per year would be expected to be
readily attained within the existing processing infrastructure. The fourth scenario of
175,812 tons per year should be viewed as the estimated maximum capacity given the
existing infrastructure. Some firms may fall short of the maximum while others may exceed
their individual maximum as shown on Table 15. This then provides an operational range of
existing facilities from the current throughput of 83,720 up to an estimated maximum of
175,812 tons per year.
Figure 8 maps the location of the processors in the 10 counties that responded to the
survey, the number of processors in those counties and the estimated maximum processing
capacity. Figure 8 shows that the primary concentration of processors is in the Chicago
MSA with 76% of the maximum throughput or 133,224 tons per year. The St. Louis MSA
has a capacity of 38,220 tons per year and represents 22% of the maximum throughput.
The remaining capacity is 2%, with 1.5% of this found in Rock Island County and the
remainder spread between Peoria, Sangamon and Livingston counties.

Engineering Solutions & Design, Inc. Page 50
FIGURE 8. LOCATION OF E-SCRAP PROCESSORS
WITH ESTIMATED MAXIMUM PROCESSING CAPACITY

Engineering Solutions & Design, Inc. Page 51
Table 16 indicates that Illinois could have a potential processing surplus capacity of
58,562 tons per year.
TABLE 16. STATEWIDE GENERATION VS. CAPACITY
2010
(Tons)
Estimated E-scrap Generation 117,250
Estimated Maximum Capacity 175,812
Net Difference 58,562
While it would appear that sufficient processing capacity would exist, there is a
significant point to note. The survey was unable to ascertain what quantity of E-scrap is
originating from out-of-state sources and currently being accepted and processed in Illinois.
Further, the survey was not able to forecast what would continue to be managed within the
state in 2010. Survey information indicated that this was occurring now; however, it is
unknown what quantities or percentage of processing capabilities this would affect in the
future.
Given the rapid development and interest of private sector entities to create and
expand the E-scrap processing business overall, it would be reasonable to expect that any
potential deficiency in processing capacity within the state would be an opportunity not to
be overlooked by in-state entities as well as regional and national processing entities. The
adoption of proposed state legislation will likely trigger a combination of in-state and out-of-
state partnerships and arrangements to adequately manage E-scrap.

Engineering Solutions & Design, Inc. Page 52
6.0 CONCLUSIONS
This report provides an initial review of the present electronic scrap recycling
infrastructure in the State of Illinois. The study utilized a number of methods to obtain
information on the present system, its structure, organizations involved in electronic scrap,
estimates of current and future electronic scrap quantities, and potential processing
capacities in the state. The information provided in this document and the analysis provides
a “snapshot” of E-scrap generation and capabilities E-scrap recyclers in Illinois at this point
in time. A number of conclusions were developed and follow:
1. Survey information indicates that there are 62 permanent drop-off locations
in 30 counties. These counties account for 80% of the state’s population. In
addition, it is known that additional collection opportunities exist and are
made possible by local governments that hold periodic one-day collection
events. Further, non-profit entities, such as Goodwill and others, also offer
the collection of limited types of E-scrap.
2. The types of E-scrap collected are a function of the electronic devices
accepted by processors/refurbishers and their particular business focus. Of
the 24 processors/refurbishers that responded to the survey, all accept
computers and related peripherals, but only 18 accept TV’s. Sixteen firms
indicated that they accept cell phones, and 15 accept printers and TV
peripherals. Items that are least collected are portable calculators, PDA’s and
facsimile equipment.
3. The rate structure charged by both processors and refurbishers varies greatly.
Some accept items for no charge, while a majority base fees on weight.
Monitors and TV’s range in charges from $5 to $25 each.

Engineering Solutions & Design, Inc. Page 53
4. The E-scrap storage capacity in the state seems to vary based on the entity’s
structure – non-profit vs. for profit. In general, collectors have limited
storage space. However, storage space at most processing facilities is
relatively significant. This storage capacity plus the rate at which E-scrap is
being processed indicates that these entities are presently balancing the
materials received with processing production. The implementation of a
statewide program will require careful balancing of temporary storage at
collection points and storage/processing capabilities at processing locations to
avoid unwanted stockpiles of E-scrap. Use of shipping containers or trailers
to containerize E-scrap while awaiting shipment to processors will probably
become prevalent.
5. None of the organizations that responded to the survey indicated any problem
with transporting E-scrap. There were indications that both collectors and
processors/refurbishers had access to trucking services from various sources
as well as from those that had their own fleet.
6. The for-profit organizations involved in electronic scrap were hesitant to share
detailed information relating to their operation or capabilities. The non-profit
organizations appear to have a lesser grasp of their capabilities and
capacities.
7. Interaction among the organizations involved in electronic scrap appears to
be limited, or at least inconsistent. This interaction appears to be similar to a
“seller-buyer” relationship rather than a coordinated and integrated system.
Coordination among the organizations involved in electronic scrap recycling
would significantly improve the efficiency of the system.
8. The extent to which the organizations wish to capture electronic scrap
appears to be related to their capabilities, capacities, and the focus of their
organization. Based on the survey results these organizations appear to have
or can acquire the space to increase the amount of E-scrap they can accept
and/or process.

Engineering Solutions & Design, Inc. Page 54
9. Based on the study results, the following support and improvements to the
E-scrap system in Illinois would benefit the present E-scrap recyclers:
• A centralized information system that provides education, training, and coordination support.
• On-site operation audits to provide organizations with methods to
improve efficiencies.
• The identification of areas in the state that are under served and guidance to organizations to meet this need.
• A regularly updated list of all organizations involved in E-scrap.
• A survey of businesses to determine how the businesses are addressing their E-scrap issues.
• The identification of grant and loan programs that would assist existing
organizations and motivate new organizations to enter the market place.
• The development of a public education and awareness program is
critical to the successful implementation and continued operational aspects of a statewide program.
10. Based on our research, the greatest impact to be realized by processors
would come from the potentially large amount of CED’s presently stored by
both businesses and private citizens including analog televisions. These
materials could likely flood the system, creating piles of E-scrap in some
locations. Thus, a well conceived implementation plan is critical and should
include coordination of state and local government, collectors, and
processors/refurbishers in partnership development.
11. The current existing infrastructure is estimated to have a maximum
processing capacity of 176,000 tons per year. The estimated generation of E-
scrap in 2010 is estimated to be 117,000 tons, leaving “excess” capacity of
some 58,000 tons. Attaining maximum processing capacity will involve a
certain degree of internal facility “ramping up” - hiring and training of
additional employees; ascertaining markets; management and facility
certification processes; etc.
Engineering Solutions & Design, Inc. Page 55
12. While it appears that there will be adequate processing capacity, the degree
and quantity out-of-state E-scrap processing that may be taking place at the
time of implementation is unknown and can affect the projected excess
capacity. Given the rapid development and interest of private sector entities
to create and expand the E-scrap processing business overall, it would be
reasonable to expect that any potential deficiency in processing capacity
within the state would be an opportunity not to be overlooked by in-state
entities as well as regional and national processing entities. The adoption of
proposed state legislation will likely trigger a combination of in-state and out-
of-state partnerships and arrangements to adequately manage E-scrap in
Illinois.

Engineering Solutions & Design, Inc. Page 56
7.0 REFERENCES
A Legislative Framework for Electronics Recycling, prepared by Electronics Industries Alliance, May 2007 Assessment of E-scrap Collection and Processing Issues for the Metro Region, prepared by Cascadia Consulting Group, Inc. and E4 Partners, Inc., August 2002, prepared for Portland Metro Area and Metro Regional Environmental Management National Electronics Recycling Program Data Update, prepared by Northeast Recycling Council, December 2002 Electronic Scrap Management in Vermont, prepared by Agency of Natural Resources, Department of Environmental Conservation, January 2004 Iowa Electronics Scrap Characterization Study, prepared by Wuf Technologies, LLC, March 2002, prepared for Department of Natural Resources The Region 3 eCycling Pilot, prepared by United States Environmental Protection Agency, December 2002 Municipal Solid Waste in the United States 2005 Facts and Figures, prepared by United States Environmental Protection Agency and Industrial Solid Scrap Division, October 2006 Kansas Electronic Scrap Recycling Pilot Study, prepared by Kansas Department of Health and Environment, May 2005 S510: Electronic Scrap Recycling Promotion and Consumer Protection Act, prepared by Professor Steve Cohen, December 2006, prepared for The Workshop in Applied Earth Systems Management II Electronics Scrap Management in the United States: Approach 1, prepared by Eastern Research Group, Inc., April 2007, prepared for United States Environmental Protection Agency Office of Solid Scrap State of Illinois, A Report on electronic Equipment Disposal and Recycling, prepared by Computer Equipment Disposal and Recycling Commission, April 2006, prepared for Governor Rod R. Blagojevich and Doug Scott (Illinois Environmental Protection Agency) High-tech TV Means Low Tech Trash, prepared by Jim Puzzanghera, June 2007, prepared for Los Angeles Times. Market Trends in Electronic Waste Generation, prepared by United States Environmental Protection Agency, April 2007, Electronic Waste Management in the United States Preliminary Findings, prepared by United States Environmental Protection Agency, February 2007 Georgia Statewide Waste Characterization Study, prepared by R. W. Beck, June 2005, prepared for Georgia Department of Community Affairs

Engineering Solutions & Design, Inc. Page 57
Minnesota Statewide Municipal Solid Waste Composition Study, prepared by R. W. Beck, March 2000, prepared for Solid Waste Management Coordinating Board Iowa Statewide Waste Characterization Study, prepared by R. W. Beck, February 2006, prepared for Iowa Department of Natural Resources Johnson County Solid Waste Analysis, prepared by Engineering Solutions & Design, Inc., June 2007, prepared for Johnson County Kansas Environmental Health Department State of Ohio Waste Characterization Study, prepared by Engineering Solutions & Design, Inc., April 2004, prepared for Ohio Department of Natural Resources State of Kansas Waste Characterization Study, prepared by Engineering Solutions & Design, Inc., March 2003, prepared for Kansas Department of Health and Environment Wisconsin Statewide Waste Characterization Study, Cascadia Consulting Group, Inc., May 2003, Wisconsin Department of Natural Resources


