1 / 5
Assessment of measures for reducing impacts of particulate matter -
partly based on results of the German PAREST Project (PAREST = PArticle REduction
STrategies)
Rainer FriedrichUniversität Stuttgart
39 th TFIAM Meeting StockholmFeb 2011

The Impact Pathway Approach
Variables
Models
Policy interventions
Future Activities
EmissionsReleases
Concentra-tion, Level, Deposition
Emission modelling
Emis-sion factors
Exposure,Dose, Intake
Meteoro-logy
Emission reduction and control
Population, Diet, Time-activity
Exposure-response-relation-ships
Health impacts
Damage to ecosystems, materials
DALYspdfscosts
Aggregation valuation
Impact modelling
Exposure and intake modelling
Transport and transformation in air, water, soil, food
Scenariodevelop-
ment
Stack height, spatial
planning
Education, advise Medication,
prevention
Unit values
Changes in behaviour,
activity
PAREST = PArticle REduction STrategiesSupported by UBA
Partners: TNO (coordinator), Freie Universität Berlin, Universität Stuttgart, IZT Berlin, IfT Leipzig, VTI Braunschweig, IVU Freiburg
Atmospheric model used: REM-CALGRID (RCG),
European emissions according to NEC6-CP scenario: includes energy and climate package;
Not included: IED; EcoDesignDir.; revised NEC
New emission scenario for Germany R.Stern, PAREST, 10. Juni 2010

R.Stern, PAREST,
Europe:Resolution circa 32x28 km2,0.25° latitude, 0.5° longitude Germany fine:
resolution circa 8 x 7 km2,0.0625°latitude, 0.125°longitude
Calculations presents regional background, no direct „hot-spot“-assessment !

8
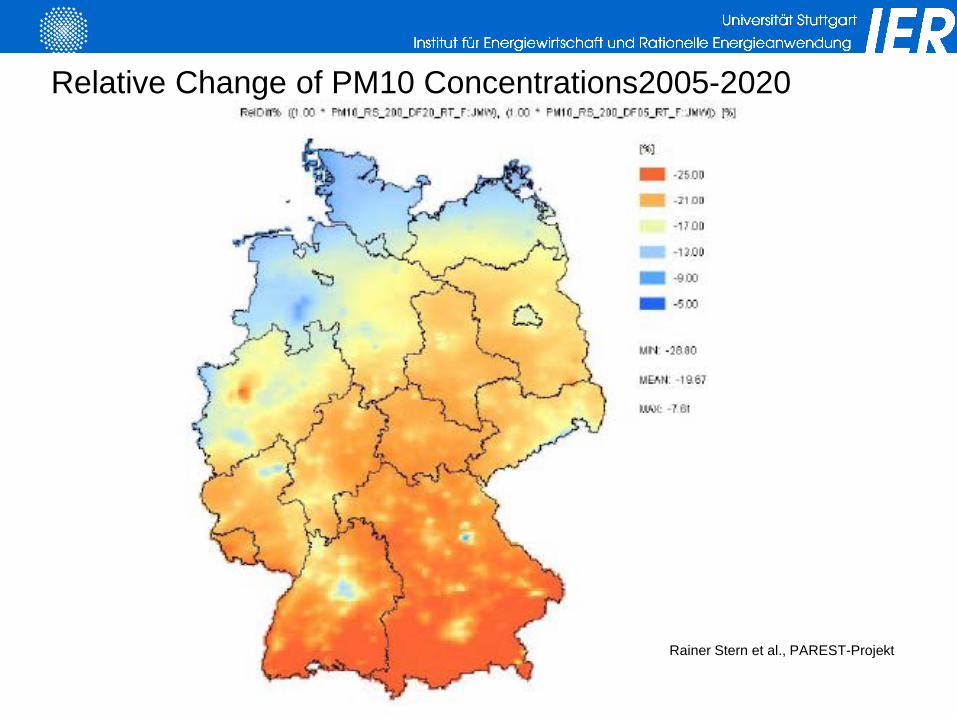
Relative Change of PM10 Concentrations2005-2020
Rainer Stern et al., PAREST-Projekt
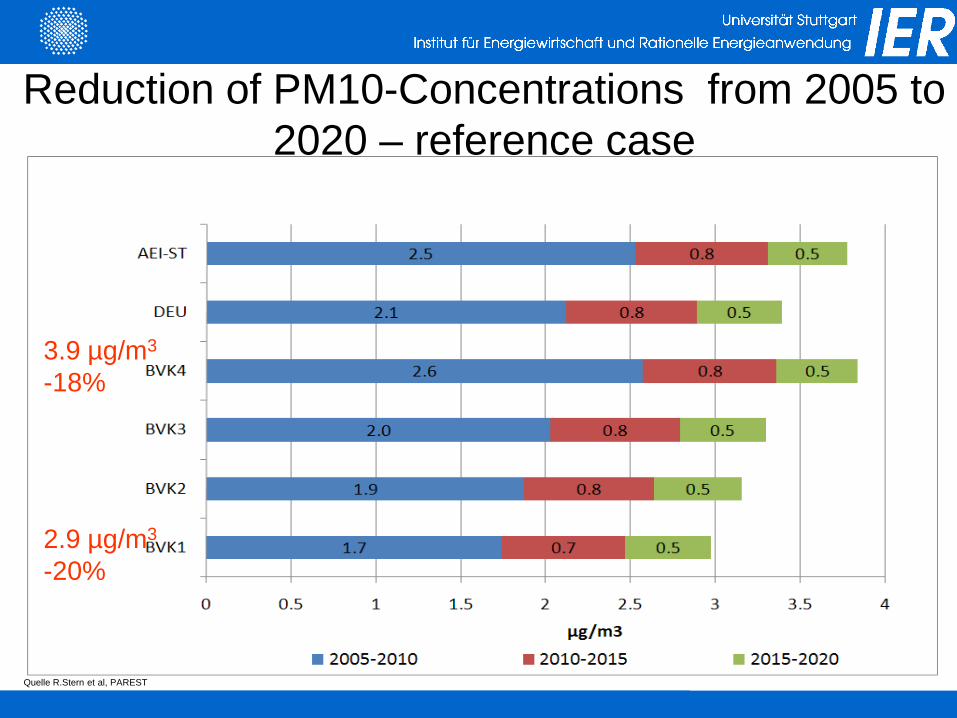
Reduction of PM10-Concentrations from 2005 to 2020 – reference case
Quelle R.Stern et al, PAREST
2.9 µg/m3
-20%
3.9 µg/m3
-18%
R.Stern, PAREST, 10. Juni 2010
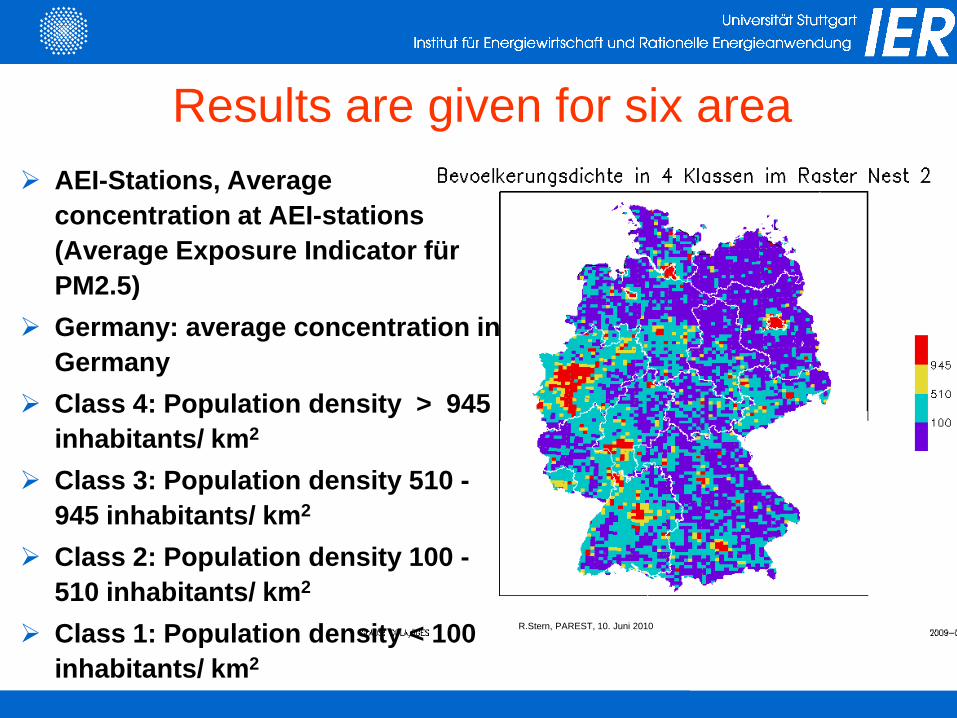
Results are given for six area AEI-Stations, Average
concentration at AEI-stations (Average Exposure Indicator für PM2.5)
Germany: average concentration in Germany
Class 4: Population density > 945 inhabitants/ km2
Class 3: Population density 510 -945 inhabitants/ km2
Class 2: Population density 100 -510 inhabitants/ km2
Class 1: Population density < 100 inhabitants/ km2

Reduction of PM10-Concentrations from 2005 to 2020 – reference case
Quelle R.Stern et al, PAREST
2.9 µg/m3
-20%
3.9 µg/m3
-18%

0
20
40
60
80
100
120
15 20 25 30 35 40 45 50
Annual Mean PM10 Concentration in µg/m3
Num
ber o
f day
s ex
ceed
ing
the
daily
lim
it va
lue
of 5
0 µg
/m3 o
f PM
10Relationship between the number of days exceeding the 50 µg/m3
threshold for PM10 and the yearly average PM10 concentration values

Days of exceedance of 50 µg/m³ for different stations in Germany 2005 and 2020, meteorology 2005
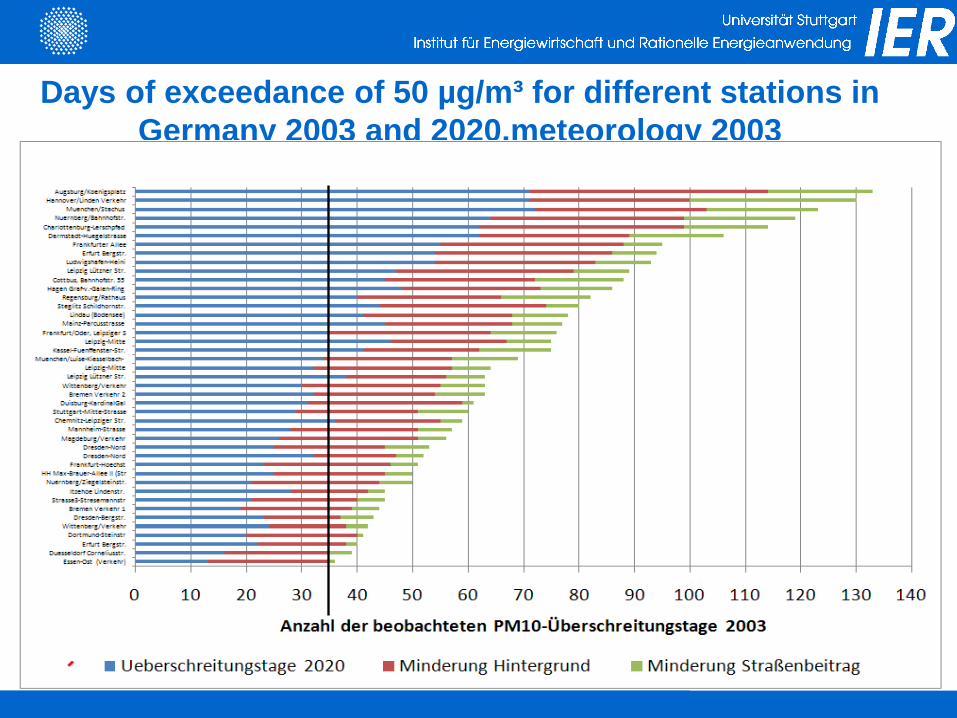
Days of exceedance of 50 µg/m³ for different stations in Germany 2003 and 2020,meteorology 2003
15
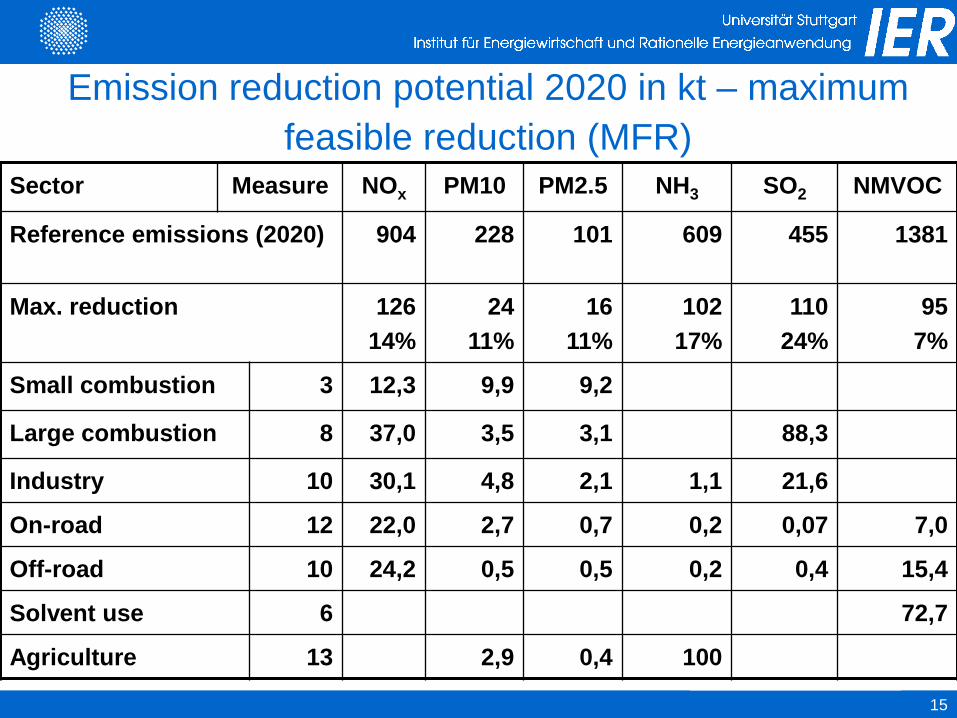
Emission reduction potential 2020 in kt – maximum feasible reduction (MFR)
Sector Measure NOx PM10 PM2.5 NH3 SO2 NMVOC
Reference emissions (2020) 904 228 101 609 455 1381
Max. reduction 126 14%
24 11%
16 11%
102 17%
110 24%
95 7%
Small combustion 3 12,3 9,9 9,2
Large combustion 8 37,0 3,5 3,1 88,3
Industry 10 30,1 4,8 2,1 1,1 21,6
On-road 12 22,0 2,7 0,7 0,2 0,07 7,0
Off-road 10 24,2 0,5 0,5 0,2 0,4 15,4
Solvent use 6 72,7
Agriculture 13 2,9 0,4 100
16
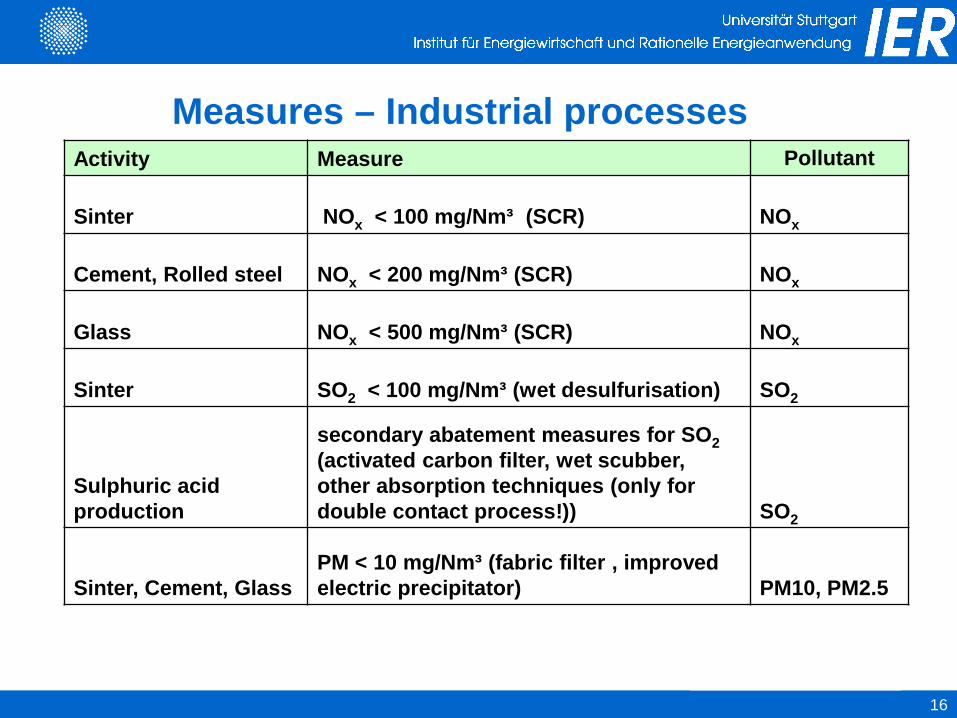
Measures – Industrial processesActivity Measure Pollutant
Sinter NOx < 100 mg/Nm³ (SCR) NOx
Cement, Rolled steel NOx < 200 mg/Nm³ (SCR) NOx
Glass NOx < 500 mg/Nm³ (SCR) NOx
Sinter SO2 < 100 mg/Nm³ (wet desulfurisation) SO2
Sulphuric acid production
secondary abatement measures for SO2(activated carbon filter, wet scubber, other absorption techniques (only for double contact process!)) SO2
Sinter, Cement, GlassPM < 10 mg/Nm³ (fabric filter , improved electric precipitator) PM10, PM2.5
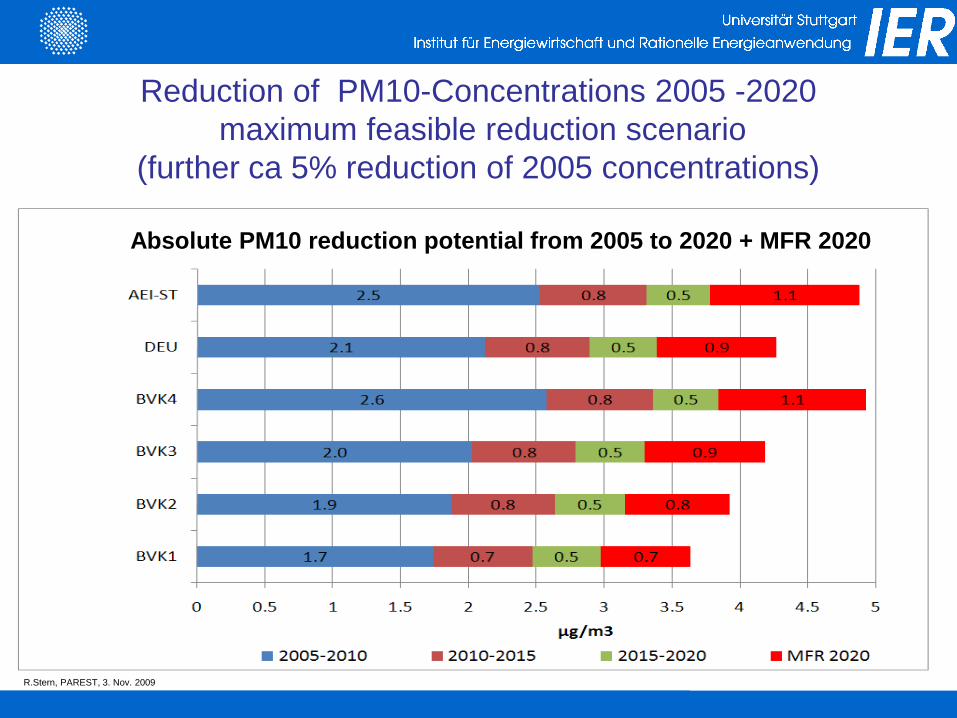
Reduction of PM10-Concentrations 2005 -2020maximum feasible reduction scenario
(further ca 5% reduction of 2005 concentrations)
R.Stern, PAREST, 3. Nov. 2009
Absolute PM10 reduction potential from 2005 to 2020 + MFR 2020

From here on:Use of the ExternE methodology and the integrated assessment
model ECOSENSE.● Includes: estimation of health impacts (health endpoints
including YOLL and DALYs)● Estimation of crop yield losses and material damage (e.g.
soiling)● Estimation of damage to ecosystems due to acidification,
eutrophication (in pdfs)● Monetising all effects using contingent valuation (willingness to
pay)However: impacts on climate due to GHG emission changes not
included, although they should be taken into account!!
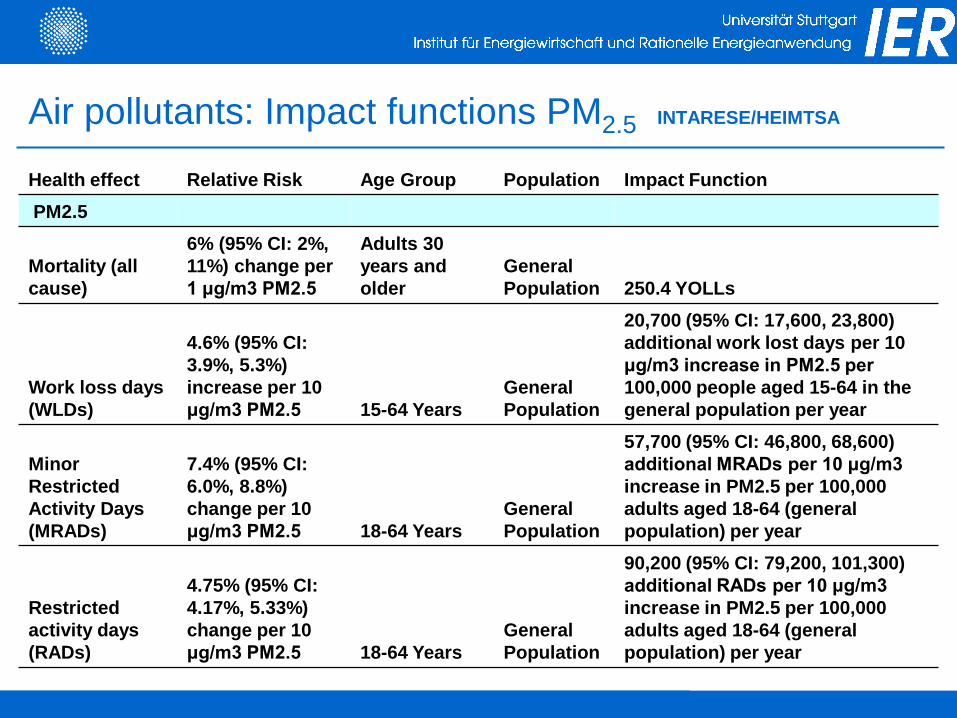
Air pollutants: Impact functions PM2.5 INTARESE/HEIMTSA
Health effect Relative Risk Age Group Population Impact FunctionPM2.5
Mortality (all cause)
6% (95% CI: 2%, 11%) change per 1 μg/m3 PM2.5
Adults 30 years and older
General Population 250.4 YOLLs
Work loss days (WLDs)
4.6% (95% CI: 3.9%, 5.3%) increase per 10 μg/m3 PM2.5 15-64 Years
General Population
20,700 (95% CI: 17,600, 23,800) additional work lost days per 10 μg/m3 increase in PM2.5 per 100,000 people aged 15-64 in the general population per year
Minor Restricted Activity Days (MRADs)
7.4% (95% CI: 6.0%, 8.8%) change per 10 μg/m3 PM2.5 18-64 Years
General Population
57,700 (95% CI: 46,800, 68,600) additional MRADs per 10 μg/m3 increase in PM2.5 per 100,000 adults aged 18-64 (general population) per year
Restricted activity days (RADs)
4.75% (95% CI: 4.17%, 5.33%) change per 10 μg/m3 PM2.5 18-64 Years
General Population
90,200 (95% CI: 79,200, 101,300) additional RADs per 10 μg/m3 increase in PM2.5 per 100,000 adults aged 18-64 (general population) per year

Air pollutants: Impact functions OzoneHealth effect Relative Risk Age Group Population Impact FunctionOzone
Mortality (all cause)
0.3% (95% CI: 0.1%, 0.4%) change per 10 μg/m3 O3 All Ages
General Population
2.8 (95% CI: 0.92, 3.7) additional deaths (or life years lost) per 10 μg/m3 increase in O3 per 100,000 population (all ages), per year
Respiratory hospital admissions (adults aged 65+)
0.5% (95% CI: -0.2%, 1.2%) change per 10 μg/m3 O3 (8-hr daily average)
Adults aged 65 years and older
General Population
12.5 (95% CI: -5.0, 30.0) additional emergency respiratory hospital admissions per 10 μg/m3 increase in O3 per year per 100,000 people aged 65+, per year
Bronchodilator usage in children (general population)
21% (95% CI: 2.9%, 39%) change per 10 ug/m3 O3 5-14 Years
General Population
24,500 (95% CI: 3,400, 45,600) additional days of bronchodilator usage per 10 μg/m3 increase in O3 per 100,000 children aged 5-14 (general population), per year
Bronchodilator use in adults (aged 20 and older) with asthma
0.6% (95% CI: -0.2%, 1.4%) change per 10 ug/m3 O3
Adults aged 20 years and older
Adults with asthma (10.2% of adults in EU27 have asthma)
70,100 (95% CI: -23,400, 164,000) additional days of bronchodilator usage per 10 ug/m3 increase in O3 per 100,000 adults aged 20 and older with persistent asthma, per year

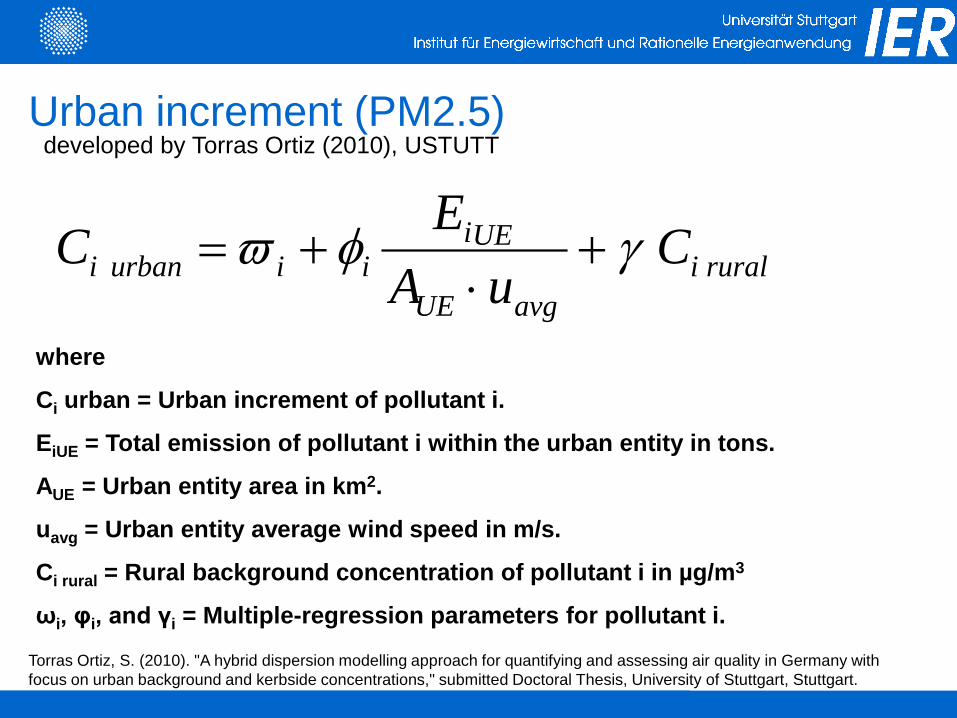
Pollutant Concentration in µg/m3
The typically higher pollutant levels in urban areas for most pollutants can be referred as urban increment, i.e., the
difference between regional and urban background pollutant concentrations
Rural background
Urban background
ruraliavgUE
UEiiiurbani C
uAE
C γφϖ +⋅
+=
where
Ci urban = Urban increment of pollutant i.
EiUE = Total emission of pollutant i within the urban entity in tons.
AUE = Urban entity area in km2.
uavg = Urban entity average wind speed in m/s.
Ci rural = Rural background concentration of pollutant i in µg/m3
ωi, φi, and γi = Multiple-regression parameters for pollutant i.
Urban increment (PM2.5)developed by Torras Ortiz (2010), USTUTT
Torras Ortiz, S. (2010). "A hybrid dispersion modelling approach for quantifying and assessing air quality in Germany with focus on urban background and kerbside concentrations," submitted Doctoral Thesis, University of Stuttgart, Stuttgart.

Are all PM10/PM2.5 species equally important?
• Weighting scheme 1 (WHO-recommendation):Same damage for all content of PM10/PM2.5.
• Weighting scheme 2 (recommendation of ExternE and HEIMTSA):
Primary PM2.5 from combustion: *1,5Nitrates: *0,5Sulfates: *0,6
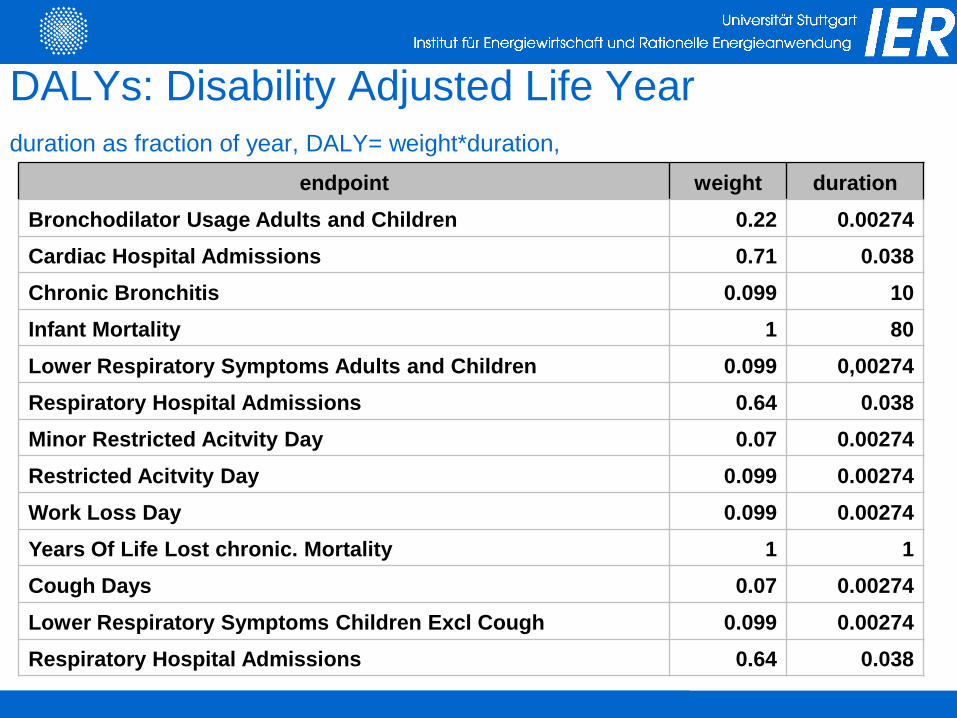
DALYs: Disability Adjusted Life Yearduration as fraction of year, DALY= weight*duration,
endpoint weight durationBronchodilator Usage Adults and Children 0.22 0.00274Cardiac Hospital Admissions 0.71 0.038Chronic Bronchitis 0.099 10Infant Mortality 1 80Lower Respiratory Symptoms Adults and Children 0.099 0,00274Respiratory Hospital Admissions 0.64 0.038Minor Restricted Acitvity Day 0.07 0.00274Restricted Acitvity Day 0.099 0.00274Work Loss Day 0.099 0.00274Years Of Life Lost chronic. Mortality 1 1Cough Days 0.07 0.00274Lower Respiratory Symptoms Children Excl Cough 0.099 0.00274Respiratory Hospital Admissions 0.64 0.038

Monetary values of health endpoints (EUR 2010) Health End-Point Low Central High per caseIncreased mortality risk -VSLacute 1,121,433 1,121,433 5,607,164 EuroLife expectancy reduction - Valueof Life Years chronic 40,500 59,810 213,820 EuroSleep disturbance 400 1,045 1,320 Euro/yearHypertension 740 800 930 Euro/yearAcute myocardial infarction 2,200 4,470 31,660 EuroLung cancer 69,080 719,212 4,187,879 EuroLeukaemia 2,045,493 3,974,358 7,114,370 EuroNeuro-development disorders 4,486 14,952 32,895 EuroSkin cancer 10,953 13,906 26,765 EuroOsteoporosis 2,990 5,682 8,074 EuroRenal dysfunction 22,788 30,406 40,977 EuroAnaemia 748 748 748 Euro

Air pollutants – monetary values (EUR 2010) Health End-Point Central per case
Increased mortality risk (infants) 4,485,731 Euro
New cases of chronic bronchitis 66,000 Euro
Increased mortality risk - Value Of Life Years 89,715 Euro
Respiratory hospital admissions 2,990 Euro
Cardiac hospital admissions 2,990 Euro
Work loss days (WLD) 441 Euro
Restricted activity days (RADs) 194 Euro
Minor restricted activity days (MRAD) 57 Euro
Lower respiratory symptoms 57 Euro
LRS excluding cough 57 Euro
Cough days 57 Euro
Medication use / bronchodilator use 80 Euro

0
50,000
100,000
150,000
200,000
250,000
300,000
350,000
400,000
450,000
500,000
2005 2020
[DA
LY]
MorbidityMortality
Health Impacts in Europe Caused by Anthropogenic Emissions in Germany (-23%)For German population ca. 1.5 DALYs/a corresponding to 3 months per lifetime
Ca 27 billion € = 1% of German GDP

Morbidity effects in Europe caused by emissions in Germany
0
10,000
20,000
30,000
40,000
50,000
60,000
70,000
80,000
90,000
2005 2020
DA
LY
Bronchodilator usage chronic bronchitis Lower resp. symptomsCardiac hosp.admissions resp. hosp. admission Work loss daysMinor RAD netRAD CoughLRSwo cough
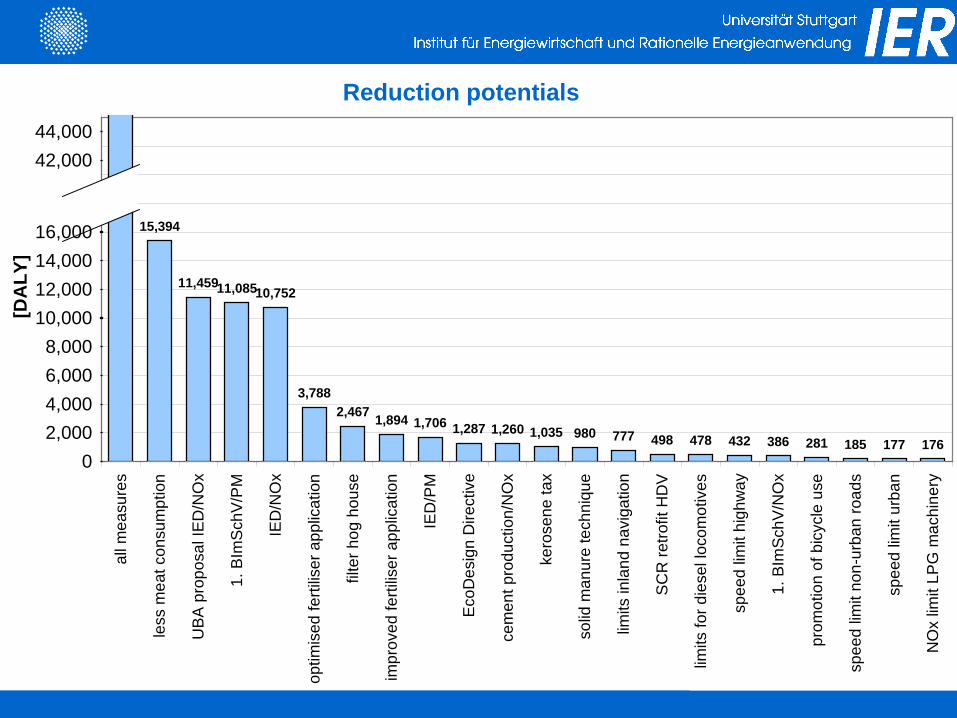
Reduction potentials
15,394
11,45911,08510,752
3,7882,467 1,894 1,706 1,287 1,260 1,035 980 777 498 478 432 386 281 185 177 176
02,0004,0006,0008,000
10,00012,00014,00016,000
42,00044,000
all m
easu
res
less
mea
t con
sum
ptio
n
UB
A p
ropo
sal I
ED
/NO
x
1. B
ImS
chV
/PM
IED
/NO
x
optim
ised
ferti
liser
app
licat
ion
filte
r hog
hou
se
impr
oved
ferti
liser
app
licat
ion
IED
/PM
Eco
Des
ign
Dire
ctiv
e
cem
ent p
rodu
ctio
n/N
Ox
kero
sene
tax
solid
man
ure
tech
niqu
e
limits
inla
nd n
avig
atio
n
SC
R re
trofit
HD
V
limits
for d
iese
l loc
omot
ives
spee
d lim
it hi
ghw
ay
1. B
ImS
chV
/NO
x
prom
otio
n of
bic
ycle
use
spee
d lim
it no
n-ur
ban
road
s
spee
d lim
it ur
ban
NO
x lim
it LP
G m
achi
nery
[DA
LY]
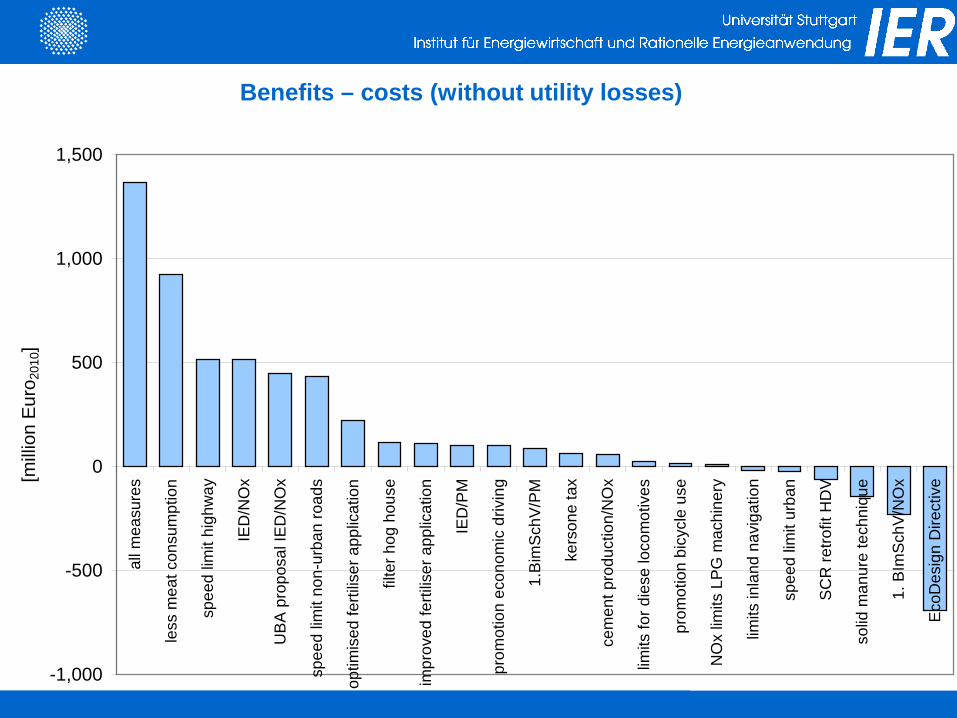
Benefits – costs (without utility losses)
-1,000
-500
0
500
1,000
1,500al
l mea
sure
s
less
mea
t con
sum
ptio
n
spee
d lim
it hi
ghw
ay
IED
/NO
x
UB
A p
ropo
sal I
ED
/NO
x
spee
d lim
it no
n-ur
ban
road
s
optim
ised
ferti
liser
app
licat
ion
filte
r hog
hou
se
impr
oved
ferti
liser
app
licat
ion
IED
/PM
prom
otio
n ec
onom
ic d
rivin
g
1.B
imS
chV
/PM
kers
one
tax
cem
ent p
rodu
ctio
n/N
Ox
limits
for d
iese
loco
mot
ives
prom
otio
n bi
cycl
e us
e
NO
x lim
its L
PG
mac
hine
ry
limits
inla
nd n
avig
atio
n
spee
d lim
it ur
ban
SC
R re
trofit
HD
V
solid
man
ure
tech
niqu
e
1. B
ImS
chV
/NO
x
Eco
Des
ign
Dire
ctiv
e[mill
ion
Eur
o 201
0]

Efficiency in costs per benefit (no utility losses)
-30
-25
-20
-15
-10
-5
0
5
10sp
eed
limit
non-
urba
n ro
ads
spee
d lim
it hi
ghw
ay
prom
otio
n ec
onom
ic d
rivin
g
prom
otio
n bi
cycl
e us
e
impr
oved
ferti
liser
app
licat
ion
less
mea
t con
sum
ptio
n
kers
one
tax
optim
ised
ferti
liser
app
licat
ion
IED
/PM
NO
x lim
its L
PG
mac
hine
ry
limits
for d
iese
loco
mot
ives
cem
ent p
rodu
ctio
n/N
Ox
IED
/NO
x
filte
r hog
hou
se
UB
A p
ropo
sal I
ED
/NO
x
1. B
ImS
chV
/NO
x
all m
easu
res
1.B
imS
chV
/PM
limits
inla
nd n
avig
atio
n
SC
R re
trofit
HD
V
spee
d lim
it ur
ban
solid
man
ure
tech
niqu
e
Eco
Des
ign
Dire
ctiv
e
cost
/ben
efit
[Eur
o 201
0/Eur
o 201
0]
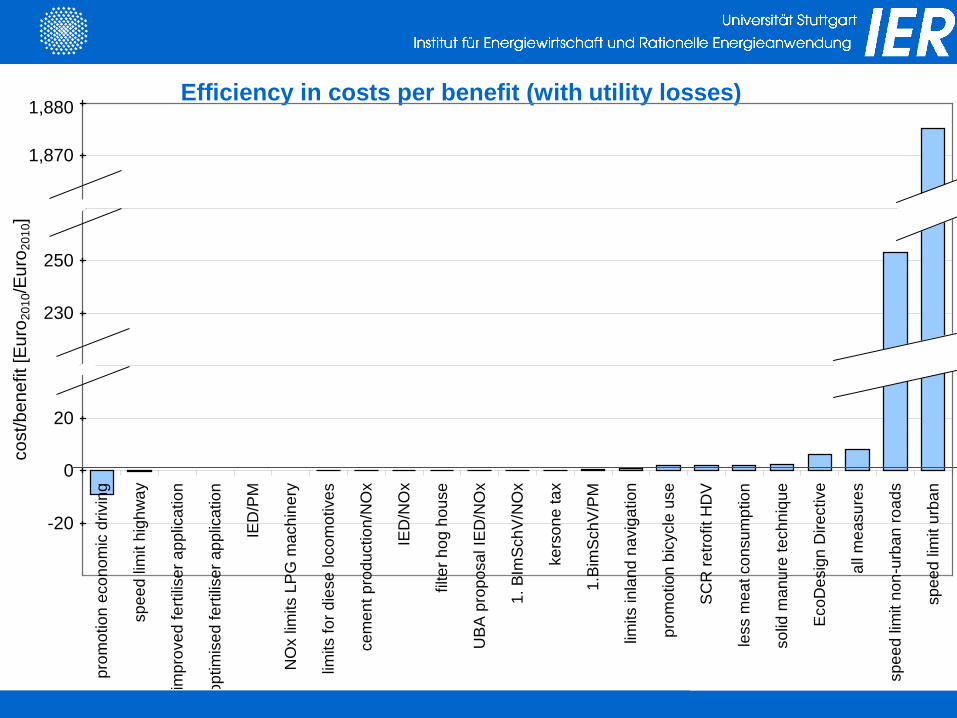
Efficiency in costs per benefit (with utility losses)
-20
0
20
230
250
1,880
1,870
prom
otio
n ec
onom
ic d
rivin
g
spee
d lim
it hi
ghw
ay
impr
oved
ferti
liser
app
licat
ion
optim
ised
ferti
liser
app
licat
ion
IED
/PM
NO
x lim
its L
PG
mac
hine
ry
limits
for d
iese
loco
mot
ives
cem
ent p
rodu
ctio
n/N
Ox
IED
/NO
x
filte
r hog
hou
se
UB
A p
ropo
sal I
ED
/NO
x
1. B
ImS
chV
/NO
x
kers
one
tax
1.B
imS
chV
/PM
limits
inla
nd n
avig
atio
n
prom
otio
n bi
cycl
e us
e
SC
R re
trofit
HD
V
less
mea
t con
sum
ptio
n
solid
man
ure
tech
niqu
e
Eco
Des
ign
Dire
ctiv
e
all m
easu
res
spee
d lim
it no
n-ur
ban
road
s
spee
d lim
it ur
ban
cost
/ben
efit
[Eur
o 201
0/Eur
o 201
0]

Conclusions● Methodologies for supporting decisions about environmental pollution control with
cost-benefit-analyses are available and are able to deliver useful results.● Further reductions of PM and PM precursor emissions are necessary to meet
thresholds and reduce impacts, especially health impacts.● The assessment of policies and measures crucially depend on assumptions about
the toxicity of PM ingredients or other measures like number.● Effective and efficient additional measures for Germany would be: Promotion of economic driving (small effect), speed limit on motorways (small) lmproved application and amount of fertilizer and manure (large), filter in hog
houses (large), Less animal protein consumption on voluntary basis (very large) Offroad: diesel locomotives (small) , gasoline/LPG mobile machinery (small),
kerosine tax (medium), inland navigation (small) Emission reduction industrial processes (cement, glas, sinter) (large) Further PM reduction large coal combustion (10 mg/m³) (medium)
www.integrated-assessment.eu ; www.externe.info


