
Asphalt Binder Quality Test (ABQT)
Binder Expert Task Group September, 2017
Infrastructure Materials Team, TFHRC
1

Why develop a Quality control Test for Asphalt Binder? - Refresher
• Need a portable, quick and easy test method for day-to-day QA of production asphalt binder during a pavement construction project – UTAH DOT
• Several methods have been tried without success! – UTAH DOT – Dynamic Shear Rheometer – quick version – Melt Indexer
• A single test method that can take you from mix-design to production

Asphalt Binder Quality Tester

Schematic of NOZZLE with Air Jet & Laser

-0.2
-0.18
-0.16
-0.14
-0.12
-0.1
-0.08
-0.06
-0.04
-0.02
00 20 40 60 80 100
De
fle
ctio
n,
mm
Time, s
AAG-1
Recovery = 3.2%
-0.45
-0.4
-0.35
-0.3
-0.25
-0.2
-0.15
-0.1
-0.05
00 20 40 60 80 100
De
fle
ctio
n,
mm
Time, s
AAD-1
Recovery = 29%
Test Results for Gel and Sol Type Asphalts
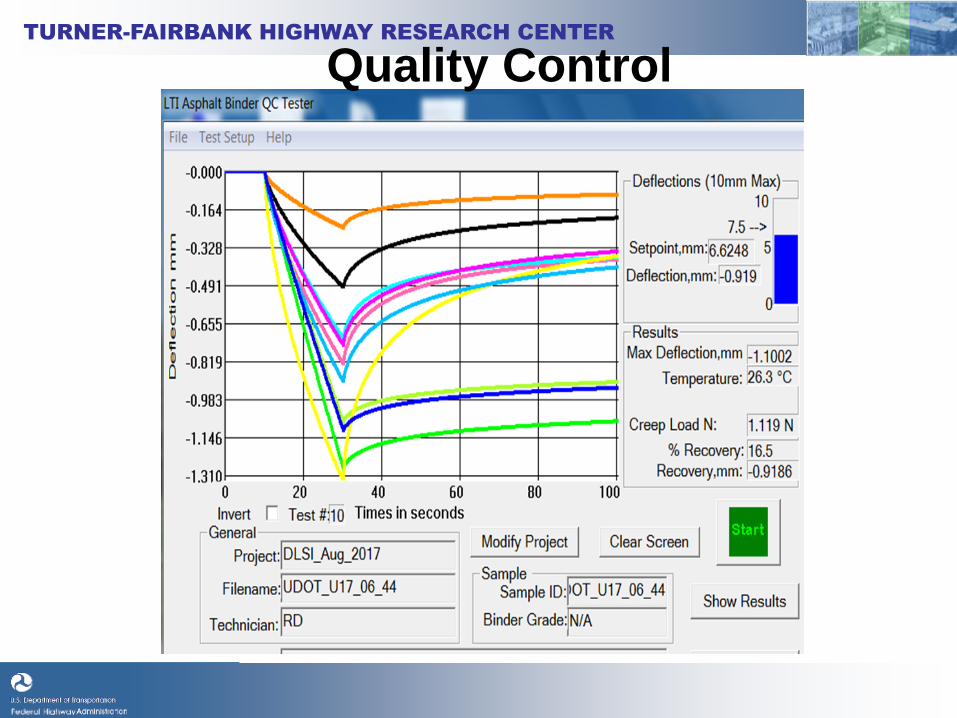
Quality Control

Average Std. Dev COV % Average Std. Dev COV %200/300 Pen 5 2.8598 0.0437 2 14.4 0.4 3#1 PG 58-28 5 0.5929 0.0370 6 20.1 1.0 5
PG 64-22 5 0.1588 0.0032 2 41.5 0.9 2PG 76-10 5 0.0092 0.0006 6 82.0 7.8 10
#2 PG 58-28 5 0.7638 0.0192 3 15.5 0.1 1PG 64-34 4 0.3383 0.0058 2 77.4 0.7 1PG 76-22 5 0.0689 0.0023 3 58.0 1.1 2PG 82-22 5 0.0533 0.0030 6 57.3 2.5 4
#1 PG 76-22 2 0.1377 0.0049 4 54.7 1.2 2#2 PG 76-22 2 0.1055 0.0028 3 57.3 1.1 2#3 PG 76-22 2 0.0908 0.0009 1 59.9 1.8 3
3 3
QCT % RecoveryBinder ID Binder Type Number of Replicates
Pooled Average
UnModified
PMA
Crumb Rubber
Modified
QCT Max. Deflection, mm
repeatability of qc data
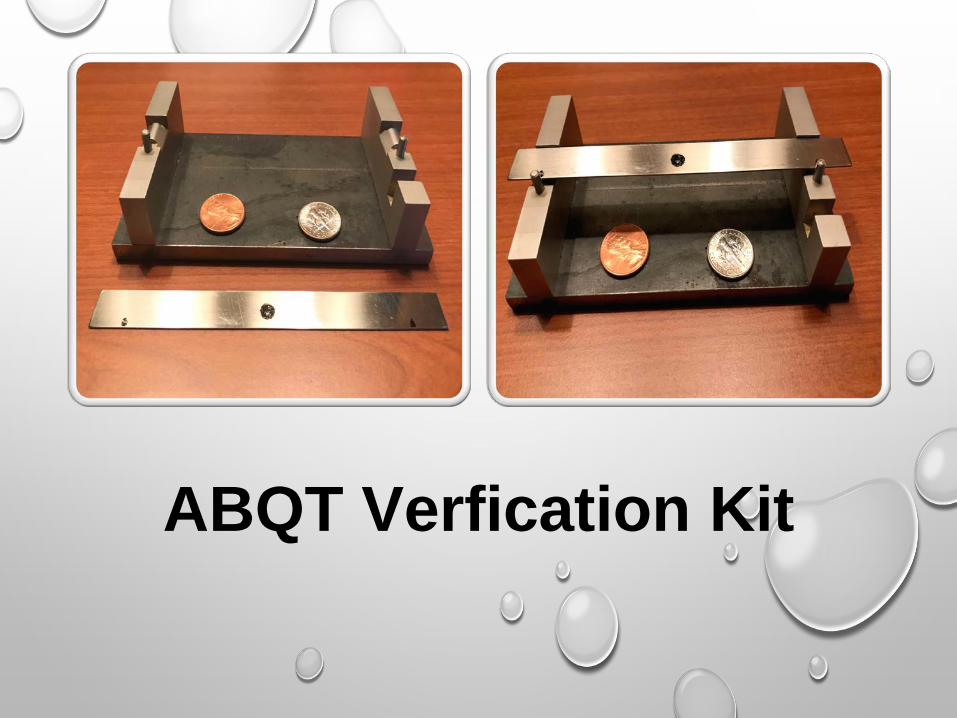
ABQT Verfication Kit
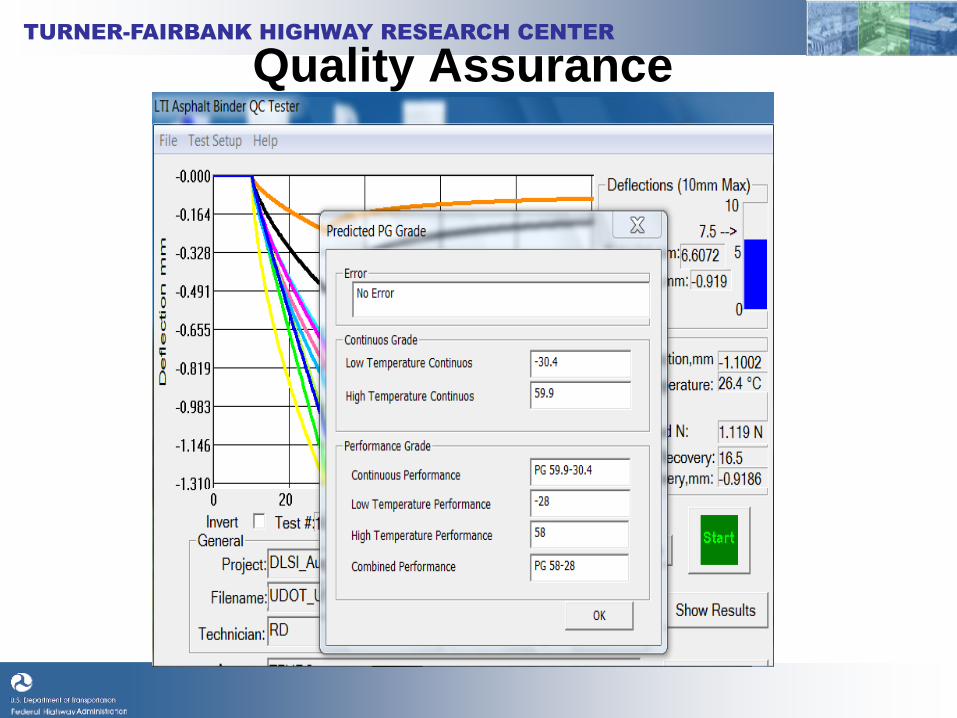
Quality Assurance

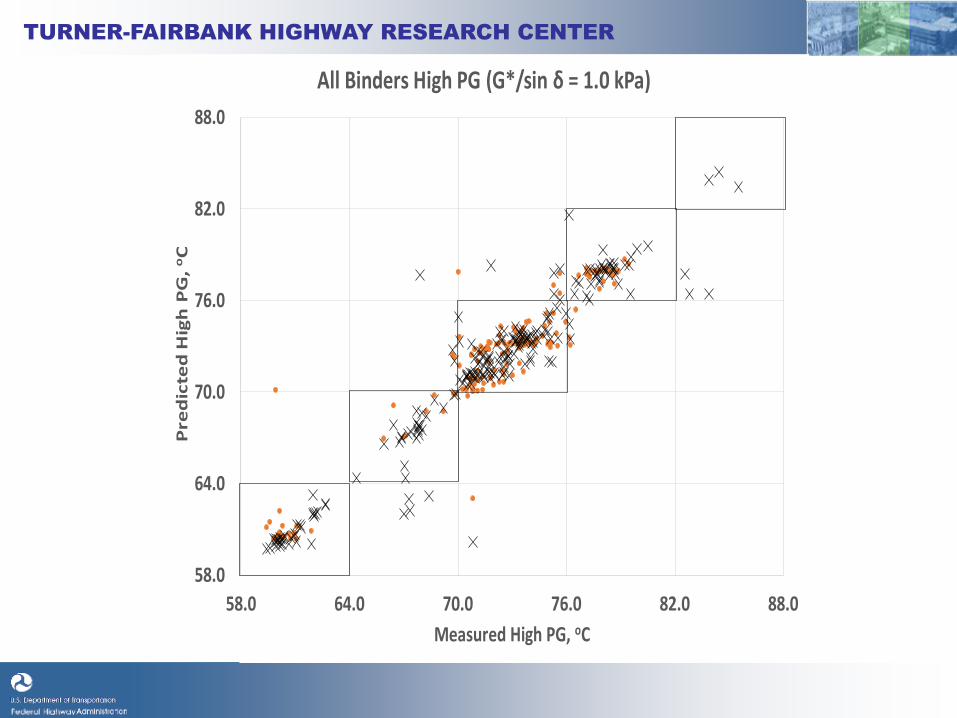
Prediction of Continuous PG Grades AASHTO M320
• Continuous PG grades are predicted using creep recovery data on unaged binder
– Standard test protocol • A proprietary Algorithm was developed to predict continuous PG
grades – Based on models that use artificial neural network learning algorithms – Training database of more than 500 asphalt binders
• Different crude sources including Europe – Greater than 95% accuracy of prediction of PG grades – Accuracy will be better as more data gets added
• Models are tailored to variation in PG specification – For example: Utah dot
• MSCR grades can also be predicted – AASHTO M332
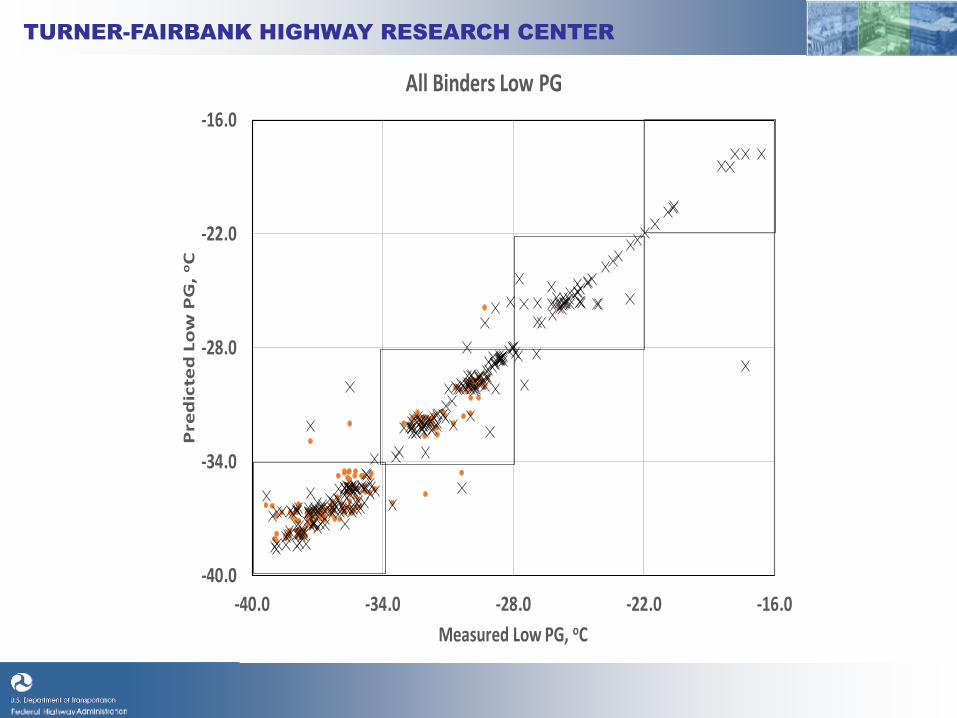
-40.0
-34.0
-28.0
-22.0
-16.0
-40.0 -34.0 -28.0 -22.0 -16.0
Pre
dic
ted
Lo
w P
G,
oC
Measured Low PG, oC
All Binders Low PG
58.0
64.0
70.0
76.0
82.0
88.0
58.0 64.0 70.0 76.0 82.0 88.0
Pre
dic
ted
Hig
h P
G, o
C
Measured High PG, oC
All Binders High PG (G*/sin δ = 1.0 kPa)
58.0
64.0
70.0
76.0
82.0
88.0
58.0 64.0 70.0 76.0 82.0 88.0
Pre
dic
ted
Hig
h P
G, o
C
Measured High PG, oC
All Binders High PG (G*/sin δ = 1.0 kPa)

y = 0.9998xR² = 0.8799
52
58
64
70
76
52 58 64 70 76
Pre
dic
ted
Hig
h T
emp
erat
ure
Co
nti
nu
ou
s P
G
Measured High Temperature Continuous PG
UDOT (1.3kPa) High PG Temp

y = 0.9893x - 0.3752R² = 0.9989
-40
-34
-28
-22
-40 -34 -28 -22
Pre
dic
ted
Lo
w T
em
pe
ratu
re C
on
tin
uo
us
PG
Measured Low Temperature Continuous PG
UDOT (1.3kPa) Low PG Temp

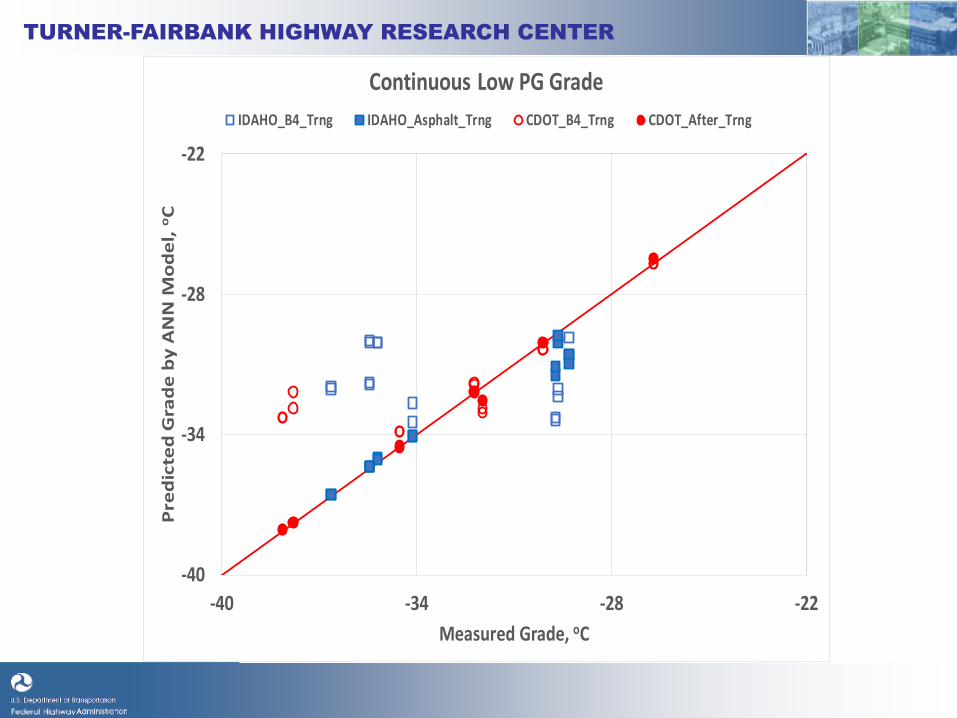
Validation of model
Effect of database size

64
70
76
82
64 70 76 82
Pre
dic
ted
Hig
h P
G, o
C
Measured High PG, oC
AMRL_Post_Trng AMRL_B4_Trng WCTG_Post_rngWCTG_B4_Trng OCTG_B4_Trng OCTG_Post_Trng

STATE AGENCY VALIDATION DATA ABQT

52
58
64
70
76
82
52 58 64 70 76 82
Pre
dic
ted
Gra
de
by
AN
N M
od
el, o
C
Measured Grade, oC
Continuous High PG GradeIDAHO_B4_Trng IDAHO_After_Trng CDOT_B4_Trng CDOT_After_Trng
-40
-34
-28
-22
-40 -34 -28 -22
Pre
dic
ted
Gra
de
by
AN
N M
od
el, o
C
Measured Grade, oC
Continuous Low PG GradeIDAHO_B4_Trng IDAHO_Asphalt_Trng CDOT_B4_Trng CDOT_After_Trng

52
58
64
70
76
82
52 58 64 70 76 82
Pred
icte
d H
igh
PG C
onti
nuou
s G
rade
, oC
Measured High PG Continuous Grade, oC
Continuous High PG GradePennDOT_B4_Trng PennDOT_After_Trng

-34
-28
-22
-34 -28 -22
Pred
icte
d Lo
w P
G C
onti
nuou
s G
rade
, oC
Measured Low PG Continuous Grade, oC
Continuous Low PG GradePennDOT_B4_Trng PennDOT_After_Trng
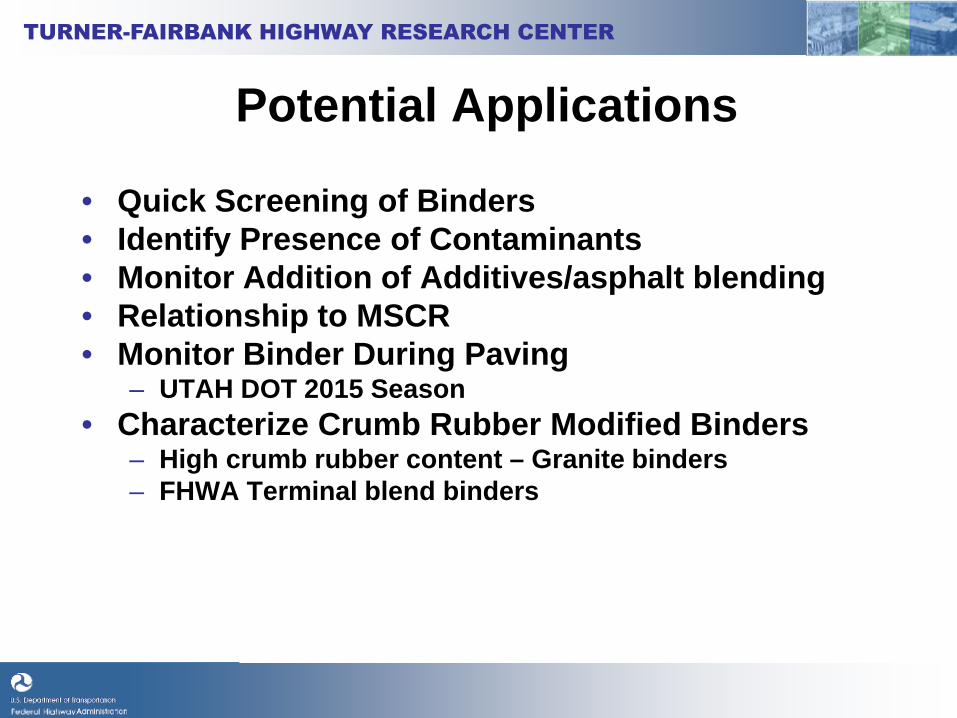
Potential Applications
• Quick Screening of Binders • Identify Presence of Contaminants • Monitor Addition of Additives/asphalt blending • Relationship to MSCR • Monitor Binder During Paving
– UTAH DOT 2015 Season • Characterize Crumb Rubber Modified Binders
– High crumb rubber content – Granite binders – FHWA Terminal blend binders
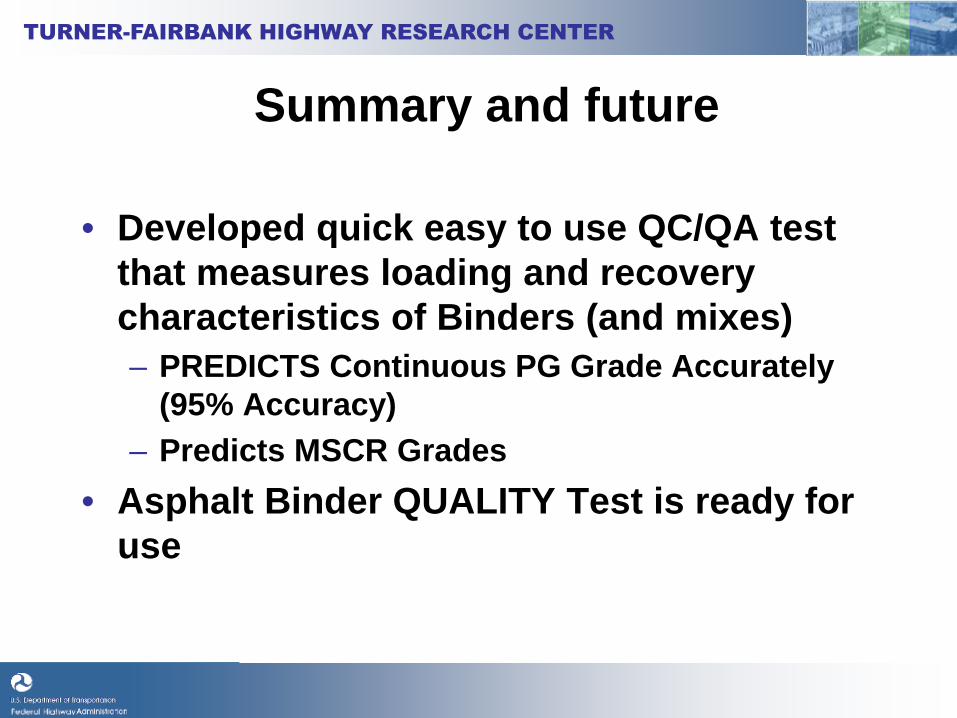
Summary and future
• Developed quick easy to use QC/QA test that measures loading and recovery characteristics of Binders (and mixes) – PREDICTS Continuous PG Grade Accurately
(95% Accuracy) – Predicts MSCR Grades
• Asphalt Binder QUALITY Test is ready for use

Delta Tc Range and Magnitude
Binder Expert Task Group September, 2017
Infrastructure Materials Team,
TFHRC
Background • SHRP Premise
– No lower limit to S(60s) value – 0 to 300 MPa allowed
– A minimum of 0.300 m-value is required as long as S is lower than or equal to 300 Mpa
– Delta Tc = Tc (S =300) – Tc (m = 0.3) was not considered
• Delta Tc = Positive indicates S – controlled binders • Delta Tc = Negative indicates m – controlled binders

FHWA’s Approach at TFHRC • Collect State DOT Low Temperature BBR
Validation Data • Calculate Delta Tc using Data Mining
Techniques – Consider performance relation where available
• Make Recommendations – Perhaps an acceptable Delta Tc – OR – Specify S where m-value is 0.3

FHWA’s Approach at TFHRC • Calculate Delta Tc using Data Mining Techniques
– Challenge – State validation data contains BBR info. at only one temperature!
– To calculate Delta Tc – Need BBR S and m-value data at two temperatures!
– Approach – Determine prediction algorithms to calculate Delta Tc.
• Delta Tc Prediction from single point BBR data – Average of all PG specific changes in S and m-value – ANN approach

-12-11-10-9-8-7-6-5-4-3-2-10123456789
10
-12-11-10 -9 -8 -7 -6 -5 -4 -3 -2 -1 0 1 2 3 4 5 6 7 8 9 10
Pred
icte
d D
elta
Tcr
(Met
hod
2), o
C
Measured Delta Tcr, oC
Method 2 Validation (177 samples) Idaho Binders CDOT Penn DOT AMRL WCTG OCTG Other
m-value CONTROL
S CONTROL
-5
-4
-3
-2
-1
0
1
2
3
4
5
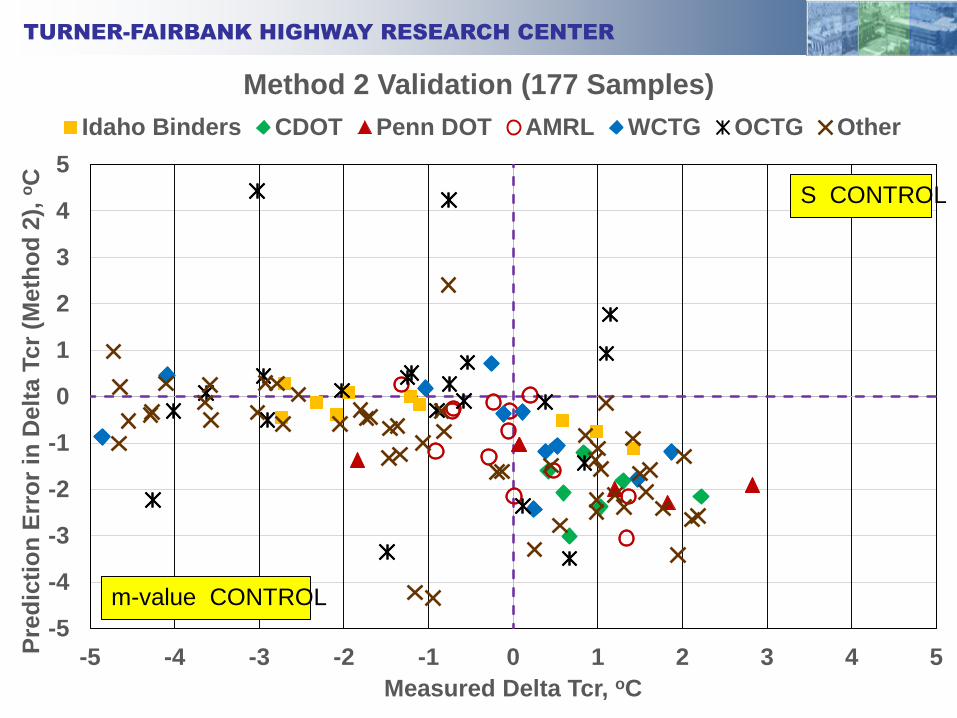
-5 -4 -3 -2 -1 0 1 2 3 4 5Pred
ictio
n Er
ror i
n D
elta
Tcr
(Met
hod
2), o
C
Measured Delta Tcr, oC
Method 2 Validation (177 Samples) Idaho Binders CDOT Penn DOT AMRL WCTG OCTG Other
m-value CONTROL
S CONTROL

-15
-10
-5
0
5
10
6-Oct-03 2-Jul-06 28-Mar-09 23-Dec-11 18-Sep-14 14-Jun-17
Delta
Tc,
deg
rees
C
Date
OklahomaPG 64-22OK PG 70-28OK PG 76-28OK
Negative Vaues indicate m-controlled Lower Grade

-10.0
-5.0
0.0
5.0
10.0
15.0De
lta T
c, o C
DELAWARE DOT - PG 64-22

-12.0
-10.0
-8.0
-6.0
-4.0
-2.0
0.0
2.0
4.0
6.0
8.0De
lta T
c, o C
DELAWARE DOT - PG 70-22
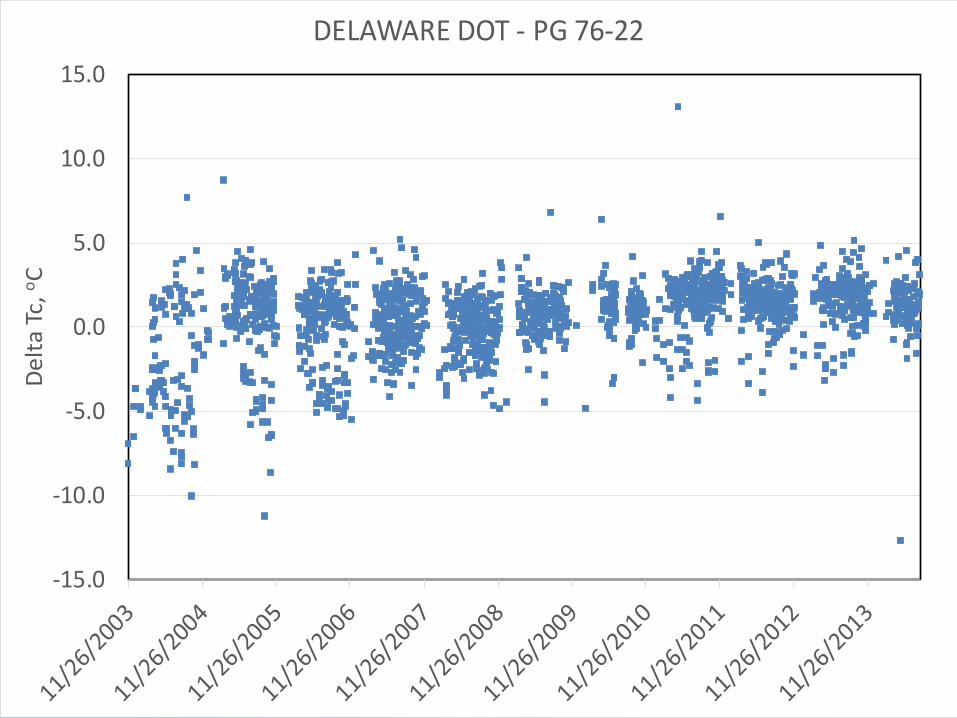
-15.0
-10.0
-5.0
0.0
5.0
10.0
15.0De
lta T
c, o C
DELAWARE DOT - PG 76-22
0
100
200
300
400
500
600PG
52-
28PG
52-
34PG
58-
22PG
58-
28PG
58-
34PG
58-
40PG
64-
16PG
64-
22PG
64-
22 O
KPG
64-
22E
PG 6
4-28
PG 6
4-34
PG 6
4E-2
8PG
67-
22PG
70-
22PG
70-
28PG
70-
28 O
KPG
70-
34PG
76-
22PG
76-
28PG
76-
28 O
KPG
82-
22
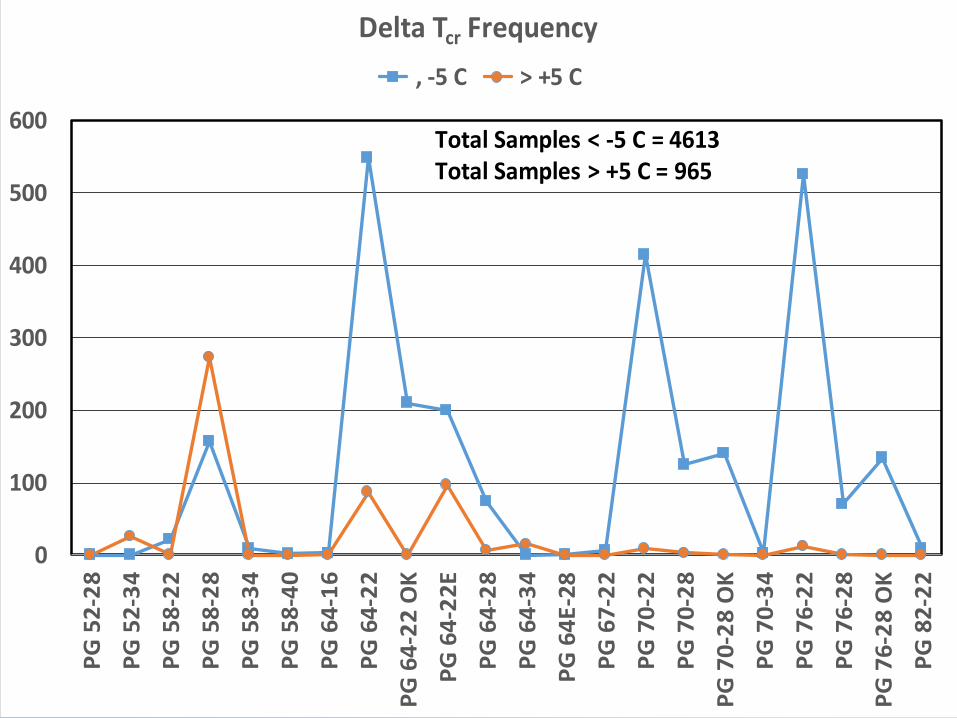
Delta Tcr Frequency , -5 C > +5 C
Total Samples < -5 C = 4613Total Samples > +5 C = 965

0
2000
4000
6000
8000
10000
12000
PG 5
2-28
PG 5
2-34
PG 5
8-22
PG 5
8-28
PG 5
8-34
PG 5
8-40
PG 6
4-16
PG 6
4-22
PG 6
4-22
OK
PG 6
4-22
EPG
64-
28PG
64-
34PG
64E
-28
PG 6
7-22
PG 7
0-22
PG 7
0-28
PG 7
0-28
OK
PG 7
0-34
PG 7
6-22
PG 7
6-28
PG 7
6-28
OK
PG 8
2-22
Delta Tcr Frequency, -5oC to +5oC
Total Samples -5 C to +5 C = 68,277

Median Minimum Maximum < -5 oC -5 to +5 oC > +5 oC3 PG 52-28 73 0.0 -4.6 5.0 0 73 02 PG 52-34 322 3 -1 7 0 296 263 PG 58-22 133 -1.8 -13.5 12.4 22 110 1
10 PG 58-28 3402 0 -12 11 157 2972 2734 PG 58-34 1438 2 -6 5 9 1429 01 PG 58-40 9 -2.8 -5.8 -1.3 2 7 01 PG 64-16 59 2.6 -11.1 6.5 3 55 1
10 PG 64-22 11403 0 -15 31 549 10767 871 PG 64-22 OK 869 -3.6 -11.6 2.7 210 659 01 PG 64-22E 4283 0.9 -5.8 4.7 200 3985 977 PG 64-28 3155 0 -11 14 74 3075 63 PG 64-34 2216 1.8 -4.9 6.1 0 2201 151 PG 64E-28 16 -0.2 -6.7 0.8 1 15 02 PG 67-22 182 -3 -6 1 6 176 05 PG 70-22 3456 -3 -13 7 415 3032 97 PG 70-28 1265 0 -14 14 125 1137 31 PG 70-28 OK 552 -3.6 -13.8 6.4 140 411 13 PG 70-34 181 1.4 -8.8 5.1 3 178 05 PG 76-22 5517 -2 -16 13 526 4979 123 PG 76-28 1013 -0.6 -9.3 5.6 71 941 11 PG 76-28 OK 542 -3.6 -9.2 3.5 134 408 01 PG 82-22 14 -6 -12 -4 9 5 0
73856 4613 68277 9656.2 92.4 1.3
TotalsPercentages
All Participating States
Number of States
PG Grade Sample SizeDelta Tc, degrees C Delta Tcr Frequency

Median Minimum Maximum < -5 oC -5 to +5 oC > -5 oCOK PG 58-28 10 -1.9 -3.8 0.5 0 10 0OK PG 64-22 OK 869 -3.6 -11.6 2.7 210 659 0OK PG 70-28 OK 552 -3.6 -13.8 6.4 140 411 1OK PG 76-28 OK 542 -3.6 -9.2 3.5 134 408 0
1973 484 1488 125 75 0
TotalsPercentages
OKLOHOMAState
IDPG Grade
Sample Size
Delta Tc, degrees C Delta Tcr Frequency

Median Minimum Maximum < -5 oC -5 to +5 oC > -5 oCUT PG 58-28 322 0.3 -3.2 4.7 0 322 0UT PG 58-34 1115 1.5 -4.3 4.5 0 1115 0UT PG 64-22 27 -0.2 -2.9 2.7 0 27 0UT PG 64-28 220 0.3 -9.5 7.3 1 218 1UT PG 64-34 928 1.0 -4.9 6.0 0 927 1UT PG 70-28 545 0.3 -3.3 4.9 0 545 0
3157 1 3154 20 100 0
TotalsPercentages
UTAHState
IDPG Grade
Sample Size
Delta Tc, degrees C Delta Tcr Frequency

Median Minimum Maximum < -5 oC -5 to +5 oC > -5 oCDE PG 58-28 593 4.1 -5.4 11 1 408 184DE PG 64-22E 4282 0.9 -5.8 4.7 200 3985 97DE PG 64-22 315 1.9 -8.6 12.7 1 314 0DE PG 70-22 949 1.3 -10 6.8 36 906 7DE PG 76-22 1961 1 -12.7 13 40 1913 8DE PG 82-22 14 -6 -12 -4 9 5 0
8114 287 7531 2963.5 92.8 3.6
Delta Tc, degrees CDELAWARE
Delta Tcr Frequency
TotalsPercentages
Sample Size
State ID
PG Grade

-12-11-10-9-8-7-6-5-4-3-2-10123456789
10
-12-11-10 -9 -8 -7 -6 -5 -4 -3 -2 -1 0 1 2 3 4 5 6 7 8 9 10
Pred
icte
d D
elta
Tcr
(AN
N),
o C
Measured Delta Tcr, oC
ANN Validation (542 Samples)
m-value CONTROL
S CONTROL
-12-11-10-9-8-7-6-5-4-3-2-10123456789
10
-12-11-10-9 -8 -7 -6 -5 -4 -3 -2 -1 0 1 2 3 4 5 6 7 8 9 10
Pred
icte
d D
elta
Tcr
(AN
N),
o C
Measured Delta Tcr, oC
ANN Validation (542 Samples)
m-value CONTROL
S CONTROL
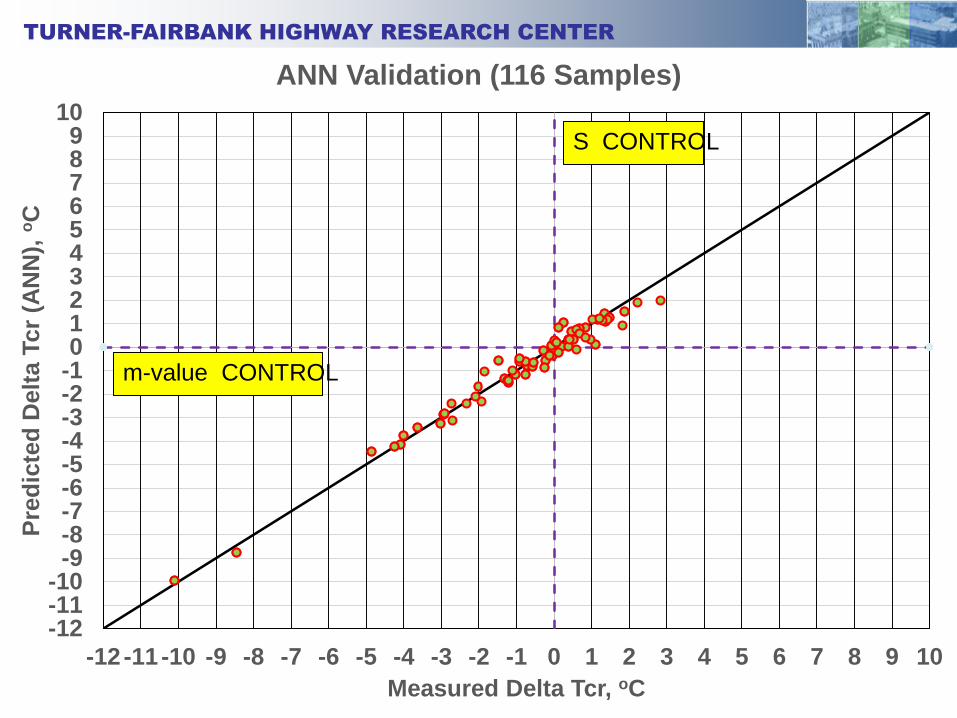
-12-11-10-9-8-7-6-5-4-3-2-10123456789
10
-12-11-10 -9 -8 -7 -6 -5 -4 -3 -2 -1 0 1 2 3 4 5 6 7 8 9 10
Pred
icte
d D
elta
Tcr
(AN
N),
o C
Measured Delta Tcr, oC
ANN Validation (116 Samples)
m-value CONTROL
S CONTROL
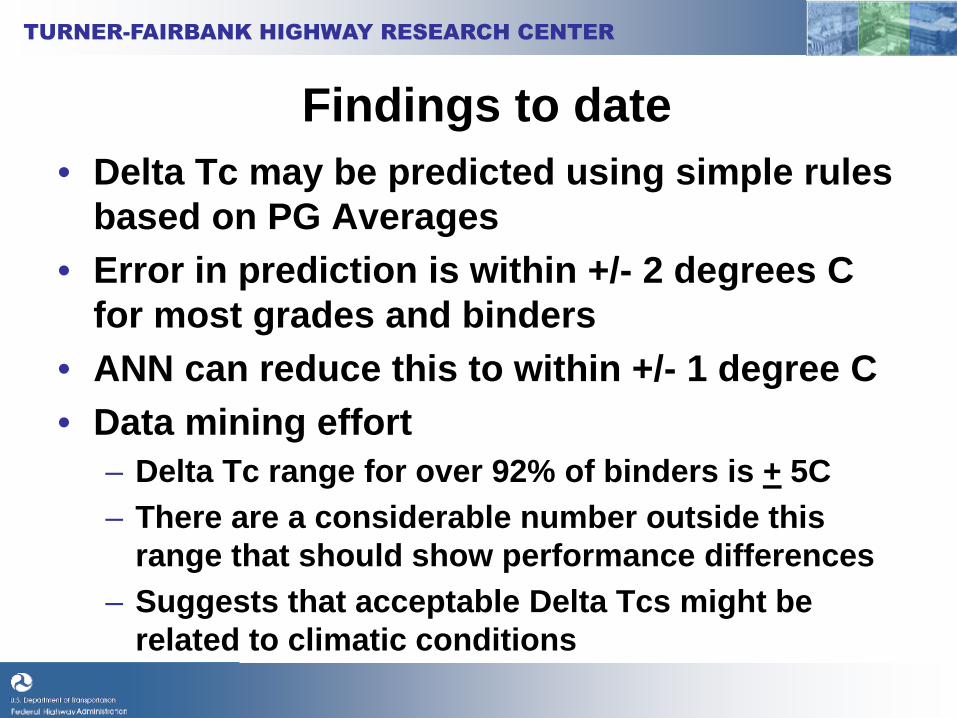
Findings to date • Delta Tc may be predicted using simple rules
based on PG Averages • Error in prediction is within +/- 2 degrees C
for most grades and binders • ANN can reduce this to within +/- 1 degree C • Data mining effort
– Delta Tc range for over 92% of binders is + 5C – There are a considerable number outside this
range that should show performance differences – Suggests that acceptable Delta Tcs might be
related to climatic conditions

ΔTc and CTOD variation for the ALF binders
Binder Expert Task Group September, 2017
Pavement Materials Team, TFHRC
50

ALF Binder Properties
Lane Binder PG V Content, level
REOB Content,
%
Delta Tc
1 and 3 64-22 A 1.7 4 64-22 C 1.5 5 64-22 B 1.5 6 64-22 C 2.4 8 58-28 A 8-10 1.2 9 64-22 A 2.9 11 58-28 D 3-4 2.4
52
-15
-10
-5
0
5
10
15
20
25
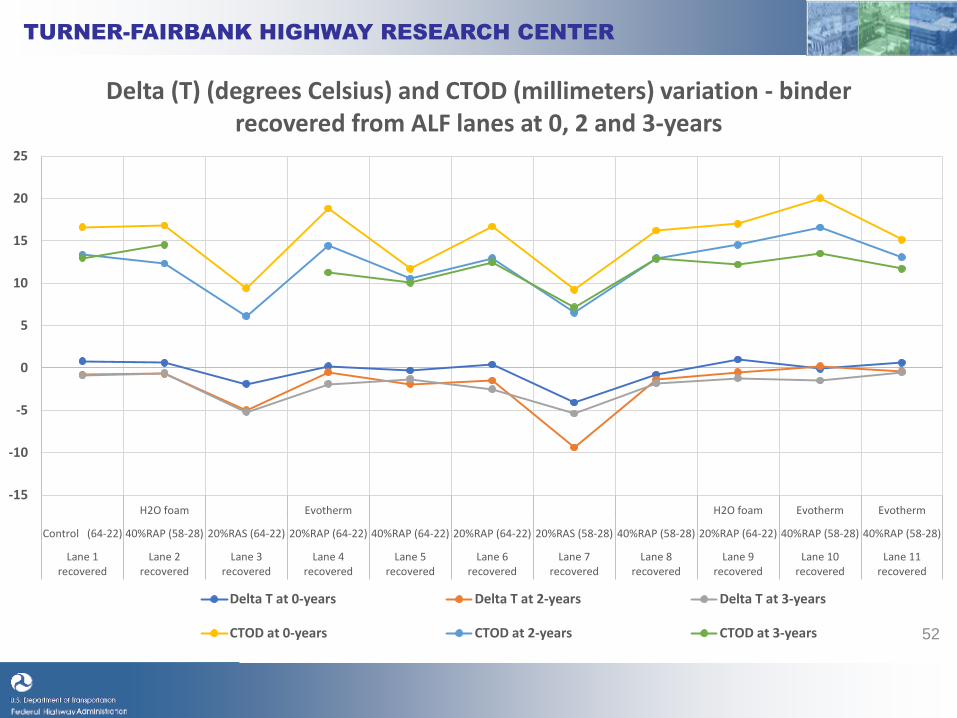
H2O foam Evotherm H2O foam Evotherm Evotherm
Control (64-22) 40%RAP (58-28) 20%RAS (64-22) 20%RAP (64-22) 40%RAP (64-22) 20%RAP (64-22) 20%RAS (58-28) 40%RAP (58-28) 20%RAP (64-22) 40%RAP (58-28) 40%RAP (58-28)
Lane 1recovered
Lane 2recovered
Lane 3recovered
Lane 4recovered
Lane 5recovered
Lane 6recovered
Lane 7recovered
Lane 8recovered
Lane 9recovered
Lane 10recovered
Lane 11recovered
Delta (T) (degrees Celsius) and CTOD (millimeters) variation - binder recovered from ALF lanes at 0, 2 and 3-years
Delta T at 0-years Delta T at 2-years Delta T at 3-years
CTOD at 0-years CTOD at 2-years CTOD at 3-years

Final Thoughts • Advantages of ANN based prediction
software – As States begin implementation, each year ANN
software gets smarter – States can further refine by adding supplier info,
performance, etc. • Need feedback from States regarding
“problem” binders
53

Base
Exploratory Blends Final Blends
+PG100-0 +REOB Source 1
+REOB Source 2
+REOB Source 3
PAV 2 X PAV PAV 2 X PAV
Hol
ly
58-
28
-2.0oC
60-30
-1.1oC
�-29
-0.8oC 0% / 20%
69-24
-10oC 20% / 20%
59-28
-14oC 20% / 20%
51-28
-5.7oC 15% / 20%
58-33
-10oC 15% / 20%
�-26
-1.6oC 0% / 30%
72-20
-13oC 25% / 30%
59-25
-5.1oC 15% / 0%
51-40
-10oC 15% / 0%
-34
-0.2oC 2.5% 59-33
-2.8oC 2.5% �-29
BP
64
-22 +0.8oC
67-27
-1.9oC
�-23
-1.7oC 10%
61-31
-4.0oC 10%
58-29
-2.2oC 6%
61-28
-2.9oC 6% �-23
BBR ∆Tcritical Spread: PG(S)tiffness – PG(m)-creep
59


WRI/ARC Field Validation Sites- update
• Five sites remain: AZ (2), MN, MB (2) • Pecking order for AZ sections maintained

Thank You.
Questions?
63


