
Arid West Water Quality Research Project
EVALUATION OF THE EPA
RECALCULATION PROCEDURE
IN THE ARID WEST
TECHNICAL REPORT
funding provided by EPA Region IX under Assistance Agreement XP-9992607
directed by Pima County Wastewater Management Department
prepared by Parametrix, Inc., Albany, Oregon
Chadwick Ecological Consultants, Littleton, Colorado URS Corporation, Albuquerque, New Mexico and
May 2006
cover photo: Santa Cruz River, near Tubac, AZ Linwood Smith, photographer

Evaluation of the EPA Recalculation Procedure Technical Report in the Arid West i May 2006
FOREWARD The Arid West Water Quality Research Project (AWWQRP or “Project”) was established in 1995 as a result of a federal appropriation (Public Law 103-327) and the establishment of an Assistance Agreement between the U.S. Environmental Protection Agency (USEPA) and Pima County Wastewater Management (PCWMD), Tucson, Arizona. The establishment of this Agreement provided a significant opportunity for western water resource stakeholders to (1) work cooperatively to conduct scientific research to recommend appropriate water quality criteria, standards and uses for effluent-dependent and ephemeral waters in the arid and semi-arid regions of the West (“arid West”), and (2) improve the scientific basis for regulating wastewater and stormwater discharges in the arid West. Effluent-dependent waters are created by the discharge of treated effluent into ephemeral streambeds or streams that in the absence of effluent discharge would have only minimal flow. With the establishment of the AWWQRP, a management infrastructure was created to support the development of peer-reviewed research products. From within the Environmental Planning Division of PCWMD, the AWWQRP Project Director, Program Manager and support staff administer the Project. A Regulatory Working Group (RWG), comprised of 15 stakeholders representing both public and private interests, works to ensure that Project research has a sound regulatory basis and that research activities focus on important regulatory concerns. The Scientific Advisory Group (SAG), comprised of scientists with experience in water quality research, makes certain that project research has a sound scientific basis and that studies are properly designed and technically sound. This report represents the fifth in a series of research reports produced by the AWWQRP, and builds upon already completed work. The first report in the series, Pre-Research Survey of Municipal NPDES Dischargers in the Arid and Semi-Arid West, resulted from an RWG recommendation that the Project survey arid West wastewater facilities to compile information about their effluent discharges and associated water quality concerns. The second report, the Habitat Characterization Study, utilized the findings of the Discharger Survey. Recognizing that an understanding of the attributes of effluent-dependent waters was critical to the development of appropriate water quality criteria and standards for these waters, the RWG recommended that the AWWQRP commission a major study to describe the physical, chemical, and biological characteristics of effluent-created habitats. The Habitat Characterization Study evaluated the physical, chemical and biological characteristics of effluent-dependent habitats at ten case study sites in the arid West: Santa Cruz River below Nogales and below Tucson, Arizona; Salt River below Phoenix, Arizona; Santa Ana River below San Bernardino, California; Fountain Creek below Colorado Springs, Colorado; South Platte River below Denver, Colorado; Las Vegas Wash below Las Vegas, Nevada; Santa Fe River below Santa Fe, New Mexico; Carrizo Creek below Carrizo Springs, Texas; and Crow Creek below Cheyenne, Wyoming (Figure F-1). The primary objectives of this effort were to (1)

Evaluation of the EPA Recalculation Procedure in the Arid West
review existing physical, chemical and biological data; (2) conduct a site reconnaissance to characterize habitats using established protocols and protocols adapted for arid West conditions; (3) identify similarities and differences among sites; (4) discuss potential approaches to protect these habitats in the context of existing regulatory programs; and (5) recommend areas for additional study. The final report may be downloaded from the AWWQRP website, www.co.pima.az.us/wwm/wqrp, or obtained from the AWWQRP Office in a CD hyperlinked format. The AWWQRP’s third report, Extant Criteria Evaluation, evaluated the applicability of national water quality criteria, as well as the methods to modify those criteria, to effluent-dependent and ephemeral waters in the arid West. This work built upon the findings presented in the Habitat Characterization Study using the expertise of national water quality criteria researchers. The AWWQRP used the findings and recommendations contained in the Extant Criteria Evaluation as the primary driver for the selection and execution of three subsequent research projects, including evaluations of 1) the Biotic Ligand Model of copper toxicity in arid west streams, 2) use of the EPA recalculation procedure in effluent-dependent streams, and 3) potential hardness-modifications to ammonia toxeffect ratio. The purpose of this fifth report, Evaluation of EPEffluent Dependent Waters, (“Recalculation ProRecalculation Procedure on selected water qualispecific arid West waters. In addition, based on for Development of Site-Specific Water Quality SStreams Using USEPA’s Recalculation Proceduwater quality standards practitioners regarding usite-specific water quality standards. The SAG provided a technical review of the findAfter the SAG comments were addressed, the readditional technical and regulatory review. Comresponse matrix, with major comments addressewere more directly related to policy and implemcontent and recommendations in the report. As received both technical and regulatory reviews, regional USEPA staff should be consulted prior
Figure F-1. Habitat Characterization Study Case Study Sites.
Technical Report ii May 2006
icity and their implications for use of the water-
A Recalculation Procedure in Arid West cedure Study”) was to evaluate use of the ty criteria with different modes of toxicity in the findings from this evaluation, a User’s Guide tandards in Arid West Effluent-dependent
re was also prepared as a practical guide for se of the Recalculation Procedure for developing
ings from the Recalculation Procedure Study. port was submitted to the RWG and USEPA for ments of a technical nature were covered in a d in the report, as necessary. Many comments entation issues, rather than to the scientific such, even though the findings of this study have it is strongly recommended that local state and to using these findings to support or propose

Evaluation of the EPA Recalculation Procedure Technical Report in the Arid West iii May 2006
regulatory change. The AWWQRP has made a significant effort to share Project results and their implications in a variety of technical, regulatory, industry and public interest forums, including publication in the primary scientific literature. This outreach effort is designed to create a broader understanding of water quality issues unique to the arid West and provide scientific and regulatory data in support of a regional approach to the development of water quality criteria, standards and uses. Heightened interest in arid West water quality issues has been fueled by the recognition that treated effluent can have a valuable role in the support and enhancement of riparian ecosystems, particularly in light of increasingly limited water resources. The AWWQRP looks forward to continuing its support of research that not only provides critical data to address unique western water quality issues, but also supports the development of innovative solutions. For additional Project information, please contact: Arid West Water Quality Research Project Pima County Wastewater Management 201 N. Stone Avenue, 8th Floor Tucson, Arizona 85701-1207 (520) 740-6977 E-mail: [email protected] Website: http://www.pima.gov/wwm/wqrp
Evaluation of the EPA Recalculation Procedure Technical Report in the Arid West iv May 2006
ACKNOWLEDGMENTS This study was conducted as part of the Arid West Water Quality Research Project (AWWQRP) under the direction of the Pima County Wastewater Management Department in Tucson, Arizona. Funding for the AWWQRP was provided by USEPA Region IX under Assistance Agreement #XP-99926701. The AWWQRP is administered by the following individuals:
• Michael Gritzuk, P.E., Director, Pima County Wastewater Management Department • Paul M. Bennett, P.E., Deputy Director, Pima County Wastewater Management
Department • Edward F. Curley, Project Director, Pima County Wastewater Management Department • Karen Ramage, Program Manager, Pima County Wastewater Management Department • Richard D. Meyerhoff, Ph.D., Research Manager, Camp Dresser & McKee • Robyn Stuber, EPA Project Officer, EPA Region IX, San Francisco, California
REGULATORY WORKING GROUP (RWG) The Regulatory working Group (RWG) was established by the AWWQRP to assist in the identification of regulatory issues needing to be addressed by scientific research. The RWG includes representatives from State and regulatory agencies, municipalities, Indian Tribes, industry, environmental organizations, consulting firms, and universities. The RWG also provided critical review of draft reports and project presentations. Currently, the RWG consists of the following individuals:
• Michael Gritzuk, P.E., Pima County Wastewater Management, Tucson, Arizona • Edward C. Anton, California State Water Resources Control Board, Sacramento,
California • Rodney W. Cruze, Riverside Regional Water Quality Control, Riverside, California • Steve Davis, P.E., Malcolm Pirnie, Inc., Tucson, Arizona • Paul D. Frohardt, Colorado Water Quality Control Commission, Denver, Colorado • Robyn Stuber, USEPA, Region IX, San Francisco, California • Andy Laurenzi, The Nature Conservancy, Marana, Arizona • Patrick J. Maley, Mining Industry Representative, Boise, Idaho • Lynn Wellman, U.S. Fish & Wildlife Service, Albuquerque, New Mexico • James F. Pendergast, USEPA, Office Science and Technology, Washington, D.C. • Sam Rector, Arizona Department of Environmental Quality, Phoenix, Arizona • Eric Rich, EPA – Navajo Nation, Tuba City, Arizona • Daniel Santantonio, Ph.D., City of Las Cruces, Utility/Water Division, Las Cruces, New
Mexico • Gary Ullinskey, City of Phoenix Water Services, Phoenix, Arizona
Evaluation of the EPA Recalculation Procedure Technical Report in the Arid West v May 2006
SCIENTIFIC ADVISORY GROUP (SAG) The Scientific Advisory Group (SAG) was established to provide technical oversight and peer review of ongoing and planned research for the AWWQRP. The SAG provided critical review for all sections of this report. SAG members include:
• Paul Adamus, Ph.D., Corvallis, Oregon (Oregon State University) • Gary Chapman, Ph.D., Paladin Water Quality Consulting, Corvallis, Oregon • Karmen King, Colorado Mountain College, Leadville, Colorado • Robert McFarlane, Ph.D., McFarlane & Associates Environmental Consultants, Houston,
Texas • Benjamin Parkhurst, Ph.D., HAF, Inc. Laramie, Wyoming
Alternates:
• Robert Gray, Ph.D., Richland, Washington • Carlton Sims White, Ph.D., University of New Mexico, Albuquerque, New Mexico
QUALITY ASSURANCE/QUALITY CONTROL (QA/QC) All AWWQRP research products were also reviewed to ensure compliance with the project QAQC plan. This review was provided by:
• Frederick A. Amalfi, Ph.D., Aquatic Consulting and Testing, Tempe, Arizona

Evaluation of the EPA Recalculation Procedure Technical Report in the Arid West i May 2006
TABLE OF CONTENTS Section Page LIST OF FIGURES ..................................................................................................................................... vi LIST OF TABLES......................................................................................................................................vii ABBREVIATIONS AND ACRONYMS ..................................................................................................... x EXECUTIVE SUMMARY .................................................................................................................... ES-1
ES.1 SUMMARY OF PROJECT OBJECTIVES ................................................................. ES-1 ES.2 OVERVIEW OF STUDY STREAM SEGMENTS, DATA SOURCES, AND
RESIDENT SPECIES LIST DEVELOPMENT........................................................... ES-2 ES.3 ALUMINUM CRITERIA REVIEW AND UPDATE.................................................. ES-3 ES.4 AMMONIA CRITERIA REVIEW AND UPDATE .................................................... ES-4 ES.5 COPPER CRITERIA REVIEW AND UPDATE ......................................................... ES-5 ES.6 DIAZINON CRITERIA REVIEW AND UPDATE..................................................... ES-6 ES.7 ZINC CRITERIA REVIEW AND UPDATE............................................................... ES-7 ES.8 AMBIENT WATER QUALITY CRITERIA RECALCULATION ARID WEST
EFFLUENT-DOMINATED STREAMS...................................................................... ES-7 ES.8.1 Overview of the EPA Recalculation Procedure............................................... ES-7 ES.8.2 Resident vs. Transient Species......................................................................... ES-8 ES.8.3 Deletion Process .............................................................................................. ES-8 ES.8.4 Minimum Data Requirements.......................................................................... ES-8 ES.8.5 Redefining the Recalculation Procedure for Arid West Streams..................... ES-9 ES.8.6 Recalculation of Ambient Water Quality Criteria ........................................... ES-9
ES.9 COMPARISONS OF SITE-SPECIFIC STANDARDS TO UPDATED NATIONAL CRITERIA ............................................................................................ ES-10 ES.9.1 Criteria-Specific Issues with the Recalculation Procedure ............................ ES-12 ES.9.1.1 Aluminum................................................................................................ ES-12 ES.9.1.2 Ammonia................................................................................................. ES-13 ES.9.1.3 Copper ..................................................................................................... ES-13 ES.9.1.4 Diazinon .................................................................................................. ES-14 ES.9.1.5 Zinc ......................................................................................................... ES-14
ES.10 FACTORS AFFECTING RECALCULATION “SUCCESS” ................................... ES-15 ES.11 LITERATURE CITED ............................................................................................... ES-16
1.0 INTRODUCTION ........................................................................................................................1-1
1.1 SUMMARY OF PROJECT OBJECTIVES ....................................................................1-1 1.2 ARID WEST/EFFLUENT DEPENDENT STREAMS SELECTED FOR
RECALCULATION ANALYSIS ...................................................................................1-2 1.3 AMBIENT WATER QUALITY-CRITERIA REVIEW SELECTION PROCESS
AND DATABASE REVIEW..........................................................................................1-3 1.3.1 Step 1 – Technical Review of Criteria Documents.............................................1-5 1.3.2 Step 2 – Update of Toxicity Databases...............................................................1-7 1.3.3 Step 3 – Update of Criteria .................................................................................1-7
1.4 LITERATURE CITED ....................................................................................................1-7 2.0 DEVELOPMENT AND ANALYSES OF RESIDENT SPECIES LIST .....................................2-1
2.1 OVERVIEW OF STUDY STREAM SEGMENTS, DATA SOURCES, AND RESIDENT SPECIES LIST DEVELOPMENT..............................................................2-1

Evaluation of the EPA Recalculation Procedure Technical Report in the Arid West ii May 2006
TABLE OF CONTENTS (Continued)
Section Page
2.2 UPDATING TAXONOMIC NOMENCLATURE..........................................................2-2 2.3 COMPARISON OF RESIDENT FISH COMMUNITIES ..............................................2-3
2.3.1 Regional Comparisons of Fish Communities .....................................................2-6 2.4 COMPARISON OF RESIDENT INVERTEBRATE COMMUNITIES.........................2-9 2.5 SUMMARY OF FINDINGS .........................................................................................2-27 2.6 LITERATURE CITED ..................................................................................................2-28
3.0 ALUMINUM CRITERIA REVIEW AND UPDATE..................................................................3-1
3.1 INTRODUCTION ...........................................................................................................3-1 3.2 BACKGROUND .............................................................................................................3-1 3.3 PHASE I- TECHNICAL REVIEW OF 1988 ALUMINUM DOCUMENT ...................3-3
3.3.1 Existing Acute Criteria for Aluminum ...............................................................3-3 3.3.2 Existing Chronic Criteria for Aluminum ............................................................3-3
3.4 PHASE II – UPDATE TO THE NATIONAL ALUMINUM CRITERIA DATABASE ....................................................................................................................3-4 3.4.1 New Aluminum Acute Toxicity Data .................................................................3-5 3.4.2 New Aluminum Chronic Toxicity Data..............................................................3-7 3.4.3 Potential Relationships Between Aluminum Toxicity and Water Quality
Parameters.........................................................................................................3-10 3.5 PHASE III - RECALCULATION OF AWQC FOR ALUMINUM..............................3-12
3.5.1 Updated Acute Database...................................................................................3-12 3.5.2 Updated Chronic Database ...............................................................................3-13 3.5.3 Updated Aluminum AWQC Derivation ...........................................................3-14
3.6 LITERATURE CITED ..................................................................................................3-16 4.0 AMMONIA CRITERIA REVIEW AND UPDATE ....................................................................4-1
4.1 PHASE I – TECHNICAL REVIEW OF 1999 AMMONIA DOCUMENT....................4-1 4.1.1 Existing Acute Criteria for Ammonia.................................................................4-1 4.1.2 Existing Chronic Criteria for Ammonia .............................................................4-2 4.1.3 Deletion of Ammonia Toxicity Data ..................................................................4-5
4.2 PHASE II - UPDATE TO THE NATIONAL AMMONIA TOXICITY DATABASES..................................................................................................................4-5 4.2.1 New Acute Ammonia Toxicity Data ..................................................................4-5 4.2.2 New Chronic Ammonia Toxicity Data .............................................................4-11
4.3 PHASE III – REVISED ACUTE AND CHRONIC AWQC FOR AMMONIA ...........4-12 4.3.1 Updated Acute Criteria for Ammonia...............................................................4-12 4.3.2 Updated Chronic Criteria for Ammonia ...........................................................4-23 4.3.3 Conclusions and Recommendations for Revised Ammonia Criteria................4-28
4.4 LITERATURE CITED ..................................................................................................4-28 5.0 COPPER CRITERIA REVIEW AND UPDATE .........................................................................5-1
5.1 BACKGROUND .............................................................................................................5-1 5.2 PHASE I - TECHNICAL REVIEW OF EPA COPPER CRITERIA
DOCUMENTS.................................................................................................................5-2 5.2.1 Existing Acute and Chronic Toxicity Databases ................................................5-2 5.2.2 Existing Toxicity Hardness-Slope Derivation for Copper..................................5-4

Evaluation of the EPA Recalculation Procedure Technical Report in the Arid West iii May 2006
TABLE OF CONTENTS (Continued) Section Page
5.3 PHASE II - UPDATE TO THE NATIONAL COPPER CRITERIA DATABASES..................................................................................................................5-4 5.3.1 New Acute Copper Toxicity Data ......................................................................5-5 5.3.2 New Chronic Copper Toxicity Data .................................................................5-18
5.4 PHASE III - RECALCULATION OF ACUTE AND CHRONIC AWQC FOR COPPER ........................................................................................................................5-19 5.4.1 Updated Acute Hardness Slope ........................................................................5-19 5.4.2 Chronic Hardness Slope....................................................................................5-23 5.4.3 Potential relationships with other water quality parameters .............................5-25 5.4.4 Updated Final Acute-Chronic Ratio .................................................................5-26
5.5 LITERATURE CITED ..................................................................................................5-28 6.0 DIAZINON CRITERIA REVIEW AND UPDATE.....................................................................6-1
6.1 BACKGROUND .............................................................................................................6-1 6.2 PHASE I - TECHNICAL REVIEW OF THE 2000 DIAZINON DRAFT......................6-3
6.2.1 Draft Acute Criterion for Diazinon.....................................................................6-3 6.2.2 Draft Chronic Criterion for Diazinon .................................................................6-4
6.3 PHASE II – UPDATE TO THE NATIONAL DIAZINON TOXICITY DATABASES..................................................................................................................6-5 6.3.1 New Acute Diazinon Toxicity Data....................................................................6-5 6.3.2 New Chronic Diazinon Toxicity Data ................................................................6-6
6.4 PHASE III - REVISED AND UPDATED AWQC FOR DIAZINON............................6-8 6.4.1 Updated Acute Database.....................................................................................6-8 6.4.2 Updated Chronic Database ...............................................................................6-10 6.4.3 Updated Criteria Derivation for Diazinon ........................................................6-11
6.5 LITERATURE CITED ..................................................................................................6-13 7.0 ZINC CRITERIA REVIEW AND UPDATE...............................................................................7-1
7.1 PHASE I - TECHNICAL REVIEW OF EPA AWQC DOCUMENTS FOR ZINC .......7-1 7.2 PHASE II - UPDATE TO THE NATIONAL ZINC TOXICITY DATABASES...........7-1
7.2.1 New Acute Zinc Toxicity Data ...........................................................................7-1 7.2.2 New Chronic Zinc Toxicity Data........................................................................7-5
7.3 PHASE III – RECALCULATION OF ACUTE AND CHRONIC AWQC FOR ZINC ................................................................................................................................7-6 7.3.1 Updating the Hardness Relationship...................................................................7-6 7.3.2 Updated Normalized Acute Database.................................................................7-8 7.3.3 Update to the Acute-to-Chronic Ratio ..............................................................7-11 7.3.4 Updated Acute and Chronic Criteria.................................................................7-12
7.4 LITERATURE CITED ..................................................................................................7-13 8.0 AMBIENT WATER QUALITY CRITERIA RECALCULATION ARID WEST
EFFLUENT-DOMINATED STREAMS......................................................................................8-1 8.1 OVERVIEW OF THE EPA RECALCULATION PROCEDURE..................................8-1 8.2 RESIDENT VS. TRANSIENT SPECIES .......................................................................8-2 8.3 DELETION PROCESS ...................................................................................................8-3
8.3.1 Refined Step-Wise Process for Deletion of Non-Resident Taxa ........................8-4 8.4 MINIMUM DATA REQUIREMENTS ..........................................................................8-6
Evaluation of the EPA Recalculation Procedure Technical Report in the Arid West iv May 2006
TABLE OF CONTENTS (Continued) Section Page
8.5 REDEFINING THE RECALCULATION PROCEDURE FOR ARID WEST STREAMS.......................................................................................................................8-6 8.5.1 Potential Revised “Eight-Family Rule” for Arid West Streams .........................8-7 8.5.2 Additional Revised Recalculation Methods........................................................8-9
8.6 RECALCULATION OF AMBIENT WATER QUALITY CRITERIA .......................8-10 8.6.1 Comparison of Resident Species Lists to Toxicity Databases ..........................8-10 8.6.2 Threatened and Endangered Species and the Use of Surrogates ......................8-11 8.6.3 Final Recalculation of Ambient Water Quality Criteria ...................................8-11
8.7 LITERATURE CITED ..................................................................................................8-13 9.0 CASE STUDIES FOR EVALUATION OF THE RECALCULATION PROCEDURE IN
ARID WEST EFFLUENT DEPENDENT STREAMS ................................................................9-1 9.1 ALUMINUM...................................................................................................................9-1
9.1.1 Santa Ana River ..................................................................................................9-1 9.1.2 Santa Cruz River.................................................................................................9-3
9.1.2.1 Santa Cruz near Nogales .................................................................9-3 9.1.2.2 Santa Cruz near Tucson...................................................................9-4
9.1.3 Salt/Gila Rivers...................................................................................................9-4 9.1.4 Fountain Creek....................................................................................................9-5 9.1.5 South Platte River ...............................................................................................9-5 9.1.6 Southwest Arid Stream Systems (CA, AZ, NV, NM) ........................................9-5 9.1.7 High Plains Arid Stream Systems (WY, CO, NM) ............................................9-6
9.2 AMMONIA .....................................................................................................................9-6 9.2.1 Santa Ana River ..................................................................................................9-7 9.2.2 Santa Cruz River.................................................................................................9-9
9.2.2.1 Santa Cruz near Nogales .................................................................9-9 9.2.2.2 Santa Cruz near Tucson.................................................................9-10
9.2.3 Salt/Gila Rivers.................................................................................................9-10 9.2.4 Fountain Creek..................................................................................................9-10 9.2.5 South Platte River .............................................................................................9-11 9.2.6 Southwest Arid Stream Systems (CA, AZ, NV, NM) ......................................9-11 9.2.7 High Plains Arid Stream Systems (WY, CO, NM) ..........................................9-12
9.3 COPPER ........................................................................................................................9-12 9.3.1 Santa Ana River ................................................................................................9-13 9.3.2 Santa Cruz River...............................................................................................9-17
9.3.2.1 Santa Cruz near Nogales ...............................................................9-17 9.3.2.2 Santa Cruz near Tucson.................................................................9-17
9.3.3 Salt/Gila Rivers.................................................................................................9-18 9.3.4 Fountain Creek..................................................................................................9-18 9.3.5 South Platte River .............................................................................................9-18 9.3.6 Southwest Arid Stream Systems (CA, AZ, NV, NM) ......................................9-19 9.3.7 High Plains Arid Stream Systems (WY, CO, NM) ..........................................9-19
9.4 DIAZINON....................................................................................................................9-19 9.4.1 Santa Ana River ................................................................................................9-20 9.4.2 Santa Cruz River...............................................................................................9-21
9.4.2.1 Santa Cruz Near Nogales ..............................................................9-21 9.4.2.2 Santa Cruz Near Tucson................................................................9-22
9.4.3 Salt/Gila Rivers.................................................................................................9-22

Evaluation of the EPA Recalculation Procedure Technical Report in the Arid West v May 2006
TABLE OF CONTENTS (Continued) Section Page
9.4.4 Fountain Creek..................................................................................................9-23 9.4.5 South Platte River .............................................................................................9-23 9.4.6 Southwest Arid Stream Systems (CA, AZ, NV, NM) ......................................9-24 9.4.7 High Plains Arid Stream Systems (WY, CO, NM) ..........................................9-24
9.5 ZINC ..............................................................................................................................9-24 9.5.1 Santa Ana River ................................................................................................9-25 9.5.2 Santa Cruz River...............................................................................................9-25
9.5.2.1 Santa Cruz near Nogales ...............................................................9-27 9.5.2.2 Santa Cruz Near Tucson................................................................9-27
9.5.3 Salt/Gila Rivers.................................................................................................9-28 9.5.4 Fountain Creek..................................................................................................9-28 9.5.5 South Platte River .............................................................................................9-28 9.5.6 Southwest Arid Stream Systems (CA, AZ, NV, NM) ......................................9-29 9.5.7 High Plains Arid Stream Systems (WY, CO, NM) ..........................................9-29
9.6 LITERATURE CITED ..................................................................................................9-30 10.0 SUMMARY OF RECALCULATION ANALYSES .................................................................10-1
10.1 COMPARISONS OF SITE-SPECIFIC STANDARDS TO UPDATED NATIONAL CRITERIA ...............................................................................................10-1 10.1.1 Santa Ana River ................................................................................................10-1 10.1.2 Santa Cruz River...............................................................................................10-1 10.1.3 Salt/Gila River ..................................................................................................10-3 10.1.4 Fountain Creek..................................................................................................10-3 10.1.5 South Platte River .............................................................................................10-3 10.1.6 Southwest Region .............................................................................................10-3 10.1.7 High Plains Region ...........................................................................................10-3 10.1.8 Conclusions on Usefulness of Recalculation Procedure for Arid West
Effluent Dominated Streams.............................................................................10-4 10.2 CRITERIA-SPECIFIC ISSUES WITH THE RECALCULATION PROCEDURE .....10-4
10.2.1 Aluminum .......................................................................................................10-5 10.2.2 Ammonia .......................................................................................................10-7 10.2.3 Copper .......................................................................................................10-9 10.2.4 Diazinon .....................................................................................................10-10 10.2.5 Zinc .....................................................................................................10-11
10.3 LITERATURE CITED ................................................................................................10-13 11.0 RECOMMENDATIONS............................................................................................................11-1
11.1 CONCLUSIONS ...........................................................................................................11-1 11.1.1 Factors Affecting Recalculation “Success” ......................................................11-1 11.1.2 Data Needs and Effort Involved in Recalculation ............................................11-2 11.1.3 Is it Worth the Effort?.......................................................................................11-2
11.2 RECOMMENDATIONS...............................................................................................11-2 APPENDICES 1 DATA COLLECTION USED FOR DEVELOPING RESIDENT SPECIES LIST..................A1-1 2 UPDATED TOXICITY DATABASES FOR CRITERIA DEVELOPMENT..........................A2-1 3 RECALCULATION WORKSHEETS ......................................................................................A3-1

Evaluation of the EPA Recalculation Procedure Technical Report in the Arid West vi May 2006
LIST OF FIGURES Figure Page ES-1 Comparison of Site-Specific Chronic Aluminum Criteria to the Updated National Criteria
at Varying Hardness................................................................................................................. ES-12 ES-2 Site-Specific Chronic Ammonia Criteria as a Function of pH (Note: Acute Criteria
Distribution is Similar to Chronic) .......................................................................................... ES-13 ES-3 Comparison of Site-Specific Chronic Copper Criteria to the Updated National Chronic
Copper Criteria at Varying Hardness Values........................................................................... ES-14 2-1 Dendogram Grouping of Arid West Effluent-Dependent Streams Based on Fish Species
Presence/Absence .........................................................................................................................2-7 2-2 Dendogram Grouping Arid West Effluent-Dependent Streams Based On Native Fish
Species Presence-Absence ............................................................................................................2-8 2-3 Dendogram Grouping Arid West Effluent-Dependent Streams Based on Invertebrate
Family Presence-Absence...........................................................................................................2-25 2-4 Dendogram Grouping Arid West Effluent-Dependent Streams Based on Genera
Collected at Each Site in the Class Insecta .................................................................................2-26 3-1 Scatter Plot of Al Toxicity and Water Hardness Values used to Derive the Al Hardness
Slope ...........................................................................................................................................3-11 4-1 pH Dependency of Acute Ammonia Toxicity Models ...............................................................4-13 4-2 Comparison of EPA 1999 and Criterion Maximum Concentrations for TA-N given a
range of pH values from 7.0 to 9.0 .............................................................................................4-21 4-3 Comparison of the EPA and updated Criterion Continuous Concentration Functions over
a pH Range of 7.0-9.0 .................................................................................................................4-26 5-1 Relationship Between Acute Copper Toxicity and Water Hardness using the Revised and
Updated Acute Database.............................................................................................................5-20 5-2 The Relationship Between Chronic Copper Toxicity and Water Hardness using the
Revised and Updated Chronic Toxicity Database ......................................................................5-24 7-1 Relationship Between Acute Zinc Toxicity and Water Hardness using the Updated Acute
Database........................................................................................................................................7-8 9-1 Comparison of Site-Specific Chronic Aluminum Criteria to the Updated National Criteria
at Varying Hardness......................................................................................................................9-3 9-2 Site-Specific Chronic Ammonia Criteria as a Function of pH .....................................................9-9 9-3 Regional Chronic Ammonia Criteria as a Function of pH Compared to the Updated
Warm Water Criteria (Acute Criteria Distribution is Similar to Chronic.).................................9-12 9-4 Comparison of Site-Specific Acute Copper Criteria to the Updated National Acute
Copper Criteria at Varying Hardness Values..............................................................................9-16 9-5 Comparison of Site-Specific Chronic Copper Criteria to the Updated National Chronic
Copper Criteria at Varying Hardness Values..............................................................................9-16 9-6 Comparison of Site-Specific Chronic Zinc Criteria to the Updated National Chronic Zinc
Criteria at Various Hardness Concentrations..............................................................................9-27 9-7 Comparison of the Region (Southwest and High Plains) Specific Chronic Zinc Criteria to
the Updated National Chronic Zinc Criteria at Various Hardness Concentrations.....................9-30

Evaluation of the EPA Recalculation Procedure Technical Report in the Arid West vii May 2006
LIST OF FIGURES (Continued) Figure Page 10-1 Range of Aluminum Criterion Maximum Concentrations (CMC) Resulting from a
Change in Database Size, While Holding the Four Most Sensitive Species Constant (N = Number of Genera in the Updated National Acute Toxicity Database for Aluminum [N=18]) .......................................................................................................................................10-6
LIST OF TABLES Table Page ES-1 Updated and Revised Acute and Chronic Al Criteria Values (µg Total Aluminum/L)
Across Selected Hardness Values .............................................................................................. ES-3 ES-2 Summary of Existing (EPA 1996) and Revised Copper Criteria (as µg dissolved Cu/L) at
Varying Hardness Levels ........................................................................................................... ES-6 ES-3 Summary of Existing and Revised Zinc Criteria (as µg dissolved Zn/L) at Varying
Hardness Levels ......................................................................................................................... ES-7 ES-4 Site-Specific Acute Criterion Concentrations using Mean Hardness and pH when
Necessary ................................................................................................................................. ES-10 ES-5 Site-Specific Chronic Criterion Concentrations using Mean Hardness and pH when
Necessary ................................................................................................................................. ES-11 ES-6 Calculation Findings Decision Matrix ..................................................................................... ES-11 2-1 Fish Taxa Reported from Studies of Effluent-Dependent Segments of the Santa Ana
River (including Chino Creek), Salt River/Gila River, Santa Cruz River, Fountain Creek, and the South Platte River.............................................................................................................2-4
2-2 Invertebrate Taxa Reported from Studies of Effluent-Dependent Segments of the Santa Ana River, Chino Creek, San Timoteo Wash, Salt River, Gila River, Santa Cruz River, Fountain Creek, and the South Platte River................................................................................2-10
3-1 Summary of Reviewed Publications with Reported Acute Aluminum Data that were
Deemed Acceptable According to 1985 Guidelines (Stephen et al. 1985) for Addition to the Updated Aluminum Acute Database.......................................................................................3-6
3-2 Summary of Chronic Aluminum Data that were Deemed Acceptable for Criteria Derivation and Added to the Updated Aluminum Chronic Database...........................................3-8
3-3 Derivation of Acute Al Hardness Slope......................................................................................3-10 3-4 Proposed Final Aluminum Acute Database, with Species Mean Acute Values (SMAV),
Normalized to Hardness = 50 mg/L, and Ranked by Genus Mean Acute Value (GMAV)........3-13 3-5 Proposed Final Aluminum Chronic Values (SMCV), with Hardness Normalized (50
µg/L), and Ranked by Genus Mean Chronic Values (GMCV)...................................................3-13 3-6 Preliminary Updated Aluminum Final Acute-Chronic Ratio (FAVR) .......................................3-14 3-7 Recalculation of the Final Acute Values for Aluminum using the Revised Hardness
Adjusted (50 mg/L CaCO3) Acute Database..............................................................................3-15 3-8 Updated and Revised Acute and Chronic Al Criterion Value Across Selected Hardness
Values .........................................................................................................................................3-16

Evaluation of the EPA Recalculation Procedure Technical Report in the Arid West viii May 2006
LIST OF TABLES (Continued) Table Page 4-1 Deletions of Inappropriate Data Presented in the EPA 1999 AWQC Ammonia Document ........4-5 4-2 Summary of Acute Data Deemed Acceptable for use and Added to the Updated Acute
Ammonia Toxicity Database ........................................................................................................4-6 4-3 New Chronic Ammonia Toxicity Data Added to the EPA (1999) Database..............................4-12 4-4 Recalculated Species Mean Acute Values (SMAV) using the Revised and Updated Acute
Toxicity Database and Ranked Genus Mean Acute Values (GMAV)........................................4-15 4-5 Recalculation of the Cold-Water Criterion Maximum Concentration for Ammonia using
the Updated Acute Database.......................................................................................................4-18 4-6 Recalculation of the Warm-Water with Unionidae CMC for Ammonia using the Updated
Acute Database ...........................................................................................................................4-19 4-7 Recalculation of the Warm-Water Without Unionidae CMC for Ammonia using the
Updated Acute Database.............................................................................................................4-20 4-8 Comparative TA-N Concentrations Given pH for EPA (1999) Acute Criteria and
Proposed Updated Acute Criteria ...............................................................................................4-22 4-9 Species and Genus Mean Acute-Chronic Ratios (SMACRs and GMACRs, Respectively)
for Paired Species Mean Acute Values (SMAV) and Genus Mean Acute V(GMAV) used in the Derivation of CCC Limits.................................................................................................4-25
4-10 Comparative TA-N Concentrations Given pH for EPA (1999) Chronic Criteria and Updated Chronic Criteria............................................................................................................4-27
5-1 Corrections and Deletions of Data used by the EPA in the 1984 AWQC Copper
Document......................................................................................................................................5-3 5-2 Acute Copper Toxicity Data Added to the Revised Acute Database............................................5-6 5-3 Chronic Copper Toxicity Data Added to the Revised Chronic Database ...................................5-18 5-4 Updated Acute Copper Hardness Slope......................................................................................5-20 5-5 Recalculated Species Mean Acute Values (SMAVs) using Revised and Updated Acute
Database and Ranked by Genus Mean Acute Values (GMAV) .................................................5-21 5-6 New Chronic Copper Hardness Slope Derived from the Revised and Updated Chronic
Database......................................................................................................................................5-24 5-7 Recalculated Species Mean Chronic Values (SMCV) using the Revised and Updated
Chronic Toxicity Database and Ranked by Genus Mean Chronic Values (GMCV)..................5-25 5-8 Derivation of Revised Species Mean Acute-to-Chronic Ratios (ACRs) and the Final
Acute-to-Chronic (FACR) for Copper........................................................................................5-26 5-9 Recalculation of the Final Acute and Chronic Values for Copper using the Updated Acute
Database, Updated Acute and Chronic Hardness Slope, and Updated (FACR) .........................5-27 5-10 Summary of Existing (EPA 1996) and Revised Copper Criteria (as µg dissolved Cu/L) at
Varying Hardness Levels using the Updated Toxicity Databases, Revised Acute and Chronic Pooled-Hardness Slopes, and Updated Final Acute-Chronic Ratios ............................5-28
6-1 Summary of Acute Data from the 2000 Diazinon Draft Deemed Unsuitable for Criteria
Derivation and Deleted from the Revised Acute Database...........................................................6-3 6-2 Summary of Acute Data that were Deemed Acceptable for use and Added to the Updated
Diazinon Acute Database..............................................................................................................6-5 6-3 Summary of Chronic Data that were Deemed Acceptable for use and Added to the
Updated Diazinon Chronic Database............................................................................................6-7 6-4 Updated Diazinon Species Mean Acute Values (SMAV) Calculated from the Revised and
Updated Acute Database and Ranked by Genus Mean Acute Values (GMAV) ..........................6-9

Evaluation of the EPA Recalculation Procedure Technical Report in the Arid West ix May 2006
LIST OF TABLES (Continued) Table Page 6-5 Recalculated Species Mean Chronic Values (SMCV) using the Updated and Revised
Chronic Database and Ranked Genus Mean Chronic Values (GMAV) .....................................6-11 6-6 Updated Diazinon Species Mean Acute-to-Chronic Ratios (SMACR) and Species Mean
Acute Values (SMAV)................................................................................................................6-11 6-7 Recalculation of the Final Acute and Chronic Values for Diazinon using the Revised
Acute and Chronic Databases .....................................................................................................6-12 7-1 New Acute Zinc Data Added to the National Database................................................................7-2 7-2 Updated Chronic Zinc Database ...................................................................................................7-5 7-3 Updated Acute Zinc Hardness Slope ............................................................................................7-7 7-4 Revised and Updated Acute Zinc Genus Mean Acute Values (GMAV) and Species Mean
Acute Value (SMAV) Ranked from Least Sensitive to Most Sensitive Genus (all modified by revised acute hardness slope = 0.8537) ....................................................................7-8
7-5 Updated Derivation of Revised Species Mean Acute-Chronic Ratios (ACRs) and the Final Acute-Chronic Ratio (FACR) for Zinc..............................................................................7-11
7-6 Recalculation of the Final Acute Values for Zinc using the Updated Acute Database ..............7-12 7-7 Summary of Existing and Revised Zinc Criteria (as µg dissolved Zn/L) at Varying
Hardness Levels using Updated Toxicity Database, Revised Pooled-Hardness Slope, and Updated Final Acute-Chronic Ratio ...........................................................................................7-13
8-1 Generic Equations Used to Derive Updated National and Site-Specific Criteria for Each
Parameter ....................................................................................................................................8-13 9-1 Site-Specific Aluminum Acute Toxicity Database, with Ranked Species Mean Acute
Values (SMAV) Specific to Each Study Stream ..........................................................................9-2 9-2 Site-Specific Preliminary Updated Ammonia Acute Toxicity Database Ranked Species
Mean Acute Values (SMAV)........................................................................................................9-7 9-3 Site-Specific Acute Toxicity Databases for Copper, Ranked Species Mean Acute Values
(SMAV) ......................................................................................................................................9-13 9-4 Site-Specific Diazinon Acute Toxicity Databases, with Ranked Species Mean Acute
Values (SMAV) for Each Site ....................................................................................................9-20 9-5 Site-Specific Acute Zinc Toxicity Databases Ranked by Species Mean Acute Values
(SMAV) ......................................................................................................................................9-25 10-1 Site-Specific Acute Criterion Concentrations for Each Chemical Using Mean Hardness
and pH When Necessary.............................................................................................................10-2 10-2 Site-Specific Chronic Criterion Concentrations for Each Chemical Using Mean Hardness
and pH when Necessary..............................................................................................................10-2 10-3 Recalculation Findings Decision Matrix.....................................................................................10-4

Evaluation of the EPA Recalculation Procedure Technical Report in the Arid West x May 2006
ABBREVIATIONS AND ACRONYMS
µg/L microgram(s) per liter ACR acute-to-chronic ratio ADEQ Arizona Department of Environmental Quality AGFD Arizona Game and Fish Department Al aluminum AVt,8 acute value, normalized to pH 8 AW-MDRs arid West minimum data requirements AWQC ambient water quality criteria AWWQRP Arid West Water Quality Research Project BLM biotic ligand model Ca calcium CCC criterion continuous concentration CDOW Colorado Division of Wildlife CEC Chadwick Ecological Consultants, Inc. CF conversion factor for the dissolved metal fraction CMC criterion maximum concentration Cu copper CVt,8 chronic value, normalized to pH 8 DOC dissolved organic carbon DQOs data quality objectives EC20 effect concentration, point estimate for specified effect in 20% of organisms ECE extant criteria evaluation EDW effluent-dependent waters ELS sensitive early life EPA U.S. Environmental Protection Agency FACR final acute-to-chronic ratio FAV final acute value FCV final chronic value GMAV genus mean acute value GMCV genus mean chronic value HCS habitat characterization study ITIS Integrated Taxonomic Information System LC50 lethal concentration – point estimate for 50% mortality LOEC lowest-observed-effect concentration MDR minimum data requirement Mg magnesium mg/L milligram per liter

Evaluation of the EPA Recalculation Procedure Technical Report in the Arid West xi May 2006
ABBREVIATIONS AND ACRONYMS (Continued) N nitrogen NCSS Number Cruncher Statistical System NH3 ammonia NH4
+ ammonium ion NOEC no-observed-effect concentration OP organo-phosphate PCWMD Pima County Wastewater Management Department PCWWM Pima County Wastewater Management SARDA Santa Ana River Dischargers Association SMACR species mean acute-to-chronic ratio SMAS species mean acute slope SMAV species mean acute value SMCV species mean chronic value TA-N total ammonia as nitrogen T&E threatened or endangered TMDL total maximum daily load USFWS U.S. Fish and Wildlife Service USGS U.S. Geological Survey WET whole effluent toxicity WWTP wastewater treatment plant Zn zinc
Evaluation of the EPA Recalculation Procedure Technical Report in the Arid West ES-1 May 2006
EXECUTIVE SUMMARY
ES.1 SUMMARY OF PROJECT OBJECTIVES
Although AWQC are intended to protect many aquatic species nation-wide, they may not always represent
the contaminant sensitivity of species resident to a particular site. At present, the EPA has provided guidance
for the development of site-specific criteria using three primary methods (EPA 1994):
The recalculation method,
Water-effect ratios, and
The resident species procedure.
This study applies and further develops tools for modifying AWQC on a site-specific basis for arid West
effluent-dependent waters (EDWs) through an evaluation of the EPA recalculation procedure.
Evaluation of the recalculation procedure has focused on AWQC that represent different modes of toxicity,
robustness of toxicological databases, and other recalculation issues. The criteria chosen for evaluation
include three initially addressed in the Extant Criteria Evaluation, or ECE (PCWWM 2003) - ammonia,
copper, diazinon - as well as two common metals, zinc and aluminum. The selection of AWQC follows the
conclusions of both the ECE and the Habitat Characterization Study, or HCS (PCWWM 2002) that the
recalculation procedure in the arid West should be based on taxa more representative of communities found in
either natural or effluent-dependent, non-perennial streams in the arid West.
In the present study, AWQC have been recalculated to better reflect the resident species observed in a number
of effluent-dependent study streams in the arid West. Streams chosen for this study include four of the nine
streams addressed in the HCS;
Santa Ana River, California
Salt/Gila Rivers Arizona,
Santa Cruz River, Arizona,
Fountain Creek, Colorado
South Platte River, Colorado

Evaluation of the EPA Recalculation Procedure Technical Report in the Arid West ES-2 May 2006
Waters from most of these sites were also used for water-effect ratio testing for copper and ammonia in two
other AWWQRP studies (PCWWM 2005a, 2005b). Resident species lists were developed for these streams
for comparison to the toxicity databases as a required step in the recalculation procedure.
Prior to recalculation, we also updated each criteria through: 1) review of the criteria documents for technical
accuracy; 2) literature review to update the criteria toxicity databases; and 3) development of revised, updated
national criteria. These updated AWQC (Chapters 3 through 7) were subsequently used as the basis for
evaluating the recalculation procedure (EPA 1994) in each of our case study EDWs (Chapter 9).
ES.2 OVERVIEW OF STUDY STREAM SEGMENTS, DATA SOURCES, AND RESIDENT SPECIES LIST DEVELOPMENT
Fish and invertebrate taxa lists were compiled from a literature review to determine what taxa currently occur
or could potentially occur at the effluent-dependent streams in this analysis. All stream segments were
located downstream of wastewater treatment plants (WWTP) that discharge treated effluent into streams that
would otherwise have low or no flow during most of the year (i.e., effluent-dependent stream segments).
According to the EPA (1994), the phrase “occur at the site” includes fish or invertebrates that are usually
present at the site, either as year-round residents or as seasonal or intermittent residents, or if not currently
present, they are expected to reside within the streams when conditions improve (EPA 1994). For our
analysis, “occur at this site” is further separated on the basis of whether these organisms are resident
(organisms that use the stream reproduction, feeding, and/or refuge) or transient taxa (organisms that are
moving through the site, either actively or passively, and do not use the stream for the above functions).
The effluent-dependent stream sites chosen for this study produced a composite fish species list containing a
total of 75 taxa (Chapter 2). The number of taxa collected at each stream segment varied from only three
non-native fish taxa collected from sites on the Santa Cruz River near Tucson to 40 fish taxa collected from
sites on the Salt/Gila Rivers. The native fish species found at each stream grouped by geographic location, as
expected due to historic/biogeographical barriers (PCWMD 2002).
The effluent-dependent streams chosen for this study produced a composite invertebrate species list
containing a total of 561 taxa (Chapter 2). The total number of taxa collected over the period of record used
in this analysis for each stream varied from 41 taxa collected from the Santa Cruz River near Tucson to
282 taxa collected from the Santa Ana River. As with the fish cluster analysis using all fish taxa, the grouping
of the invertebrate communities in these streams seems to be highly influenced by the number of studies, the
Evaluation of the EPA Recalculation Procedure Technical Report in the Arid West ES-3 May 2006
number of years studied, and methods used in those studies. Regardless, the fish and invertebrate taxa lists
developed provide a list of resident taxa for the recalculation effort described later in this document.
ES.3 ALUMINUM CRITERIA REVIEW AND UPDATE
The 1988 report entitled Ambient Water Quality Criteria for Aluminum (EPA 1988) underwent a technical
review and update as the initial step for inclusion in the Arid West Water Quality Research Project AWQC
Recalculation Project. The speciation and/or complexation of aluminum (Al) is highly dependent on ambient
water quality characteristics and ultimately determines the mechanism of toxicity. Concentration of calcium
in the water was shown to decrease toxic effects to fish.
A comprehensive literature review resulted in the addition of 36 acute data points from 15 studies to the
updated aluminum acute database (Chapter 3). Additionally, 11 chronic data points from nine studies were
added to the updated aluminum chronic database. The updated acute database revealed a statistically
significant inverse Al toxicity and hardness relationship with a slope of 0.8327. This was not reported in the
1988 Aluminum AWQC.
The updated acute database contains values for 17 genera, while the updated Al chronic toxicity database
presents data for six genera of freshwater organisms. Since the revised chronic database did not satisfy the
“eight-family rule,” the FACR was used to derive a FCV for Al from the acute database. New acute and
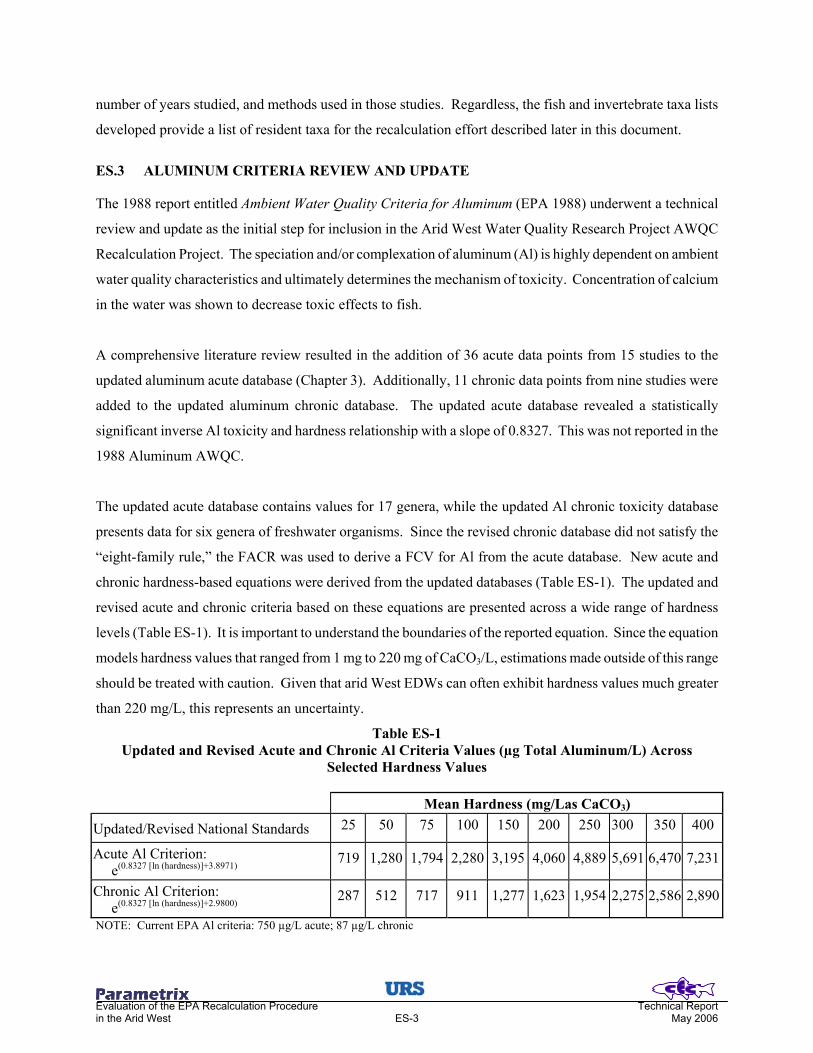
chronic hardness-based equations were derived from the updated databases (Table ES-1). The updated and
revised acute and chronic criteria based on these equations are presented across a wide range of hardness
levels (Table ES-1). It is important to understand the boundaries of the reported equation. Since the equation
models hardness values that ranged from 1 mg to 220 mg of CaCO3/L, estimations made outside of this range
should be treated with caution. Given that arid West EDWs can often exhibit hardness values much greater
than 220 mg/L, this represents an uncertainty.
Table ES-1 Updated and Revised Acute and Chronic Al Criteria Values (µg Total Aluminum/L) Across
Selected Hardness Values Mean Hardness (mg/Las CaCO3)
Updated/Revised National Standards 25 50 75 100 150 200 250 300 350 400
Acute Al Criterion: e(0.8327 [ln (hardness)]+3.8971)
719 1,280 1,794 2,280 3,195 4,060 4,889 5,691 6,470 7,231
Chronic Al Criterion: e(0.8327 [ln (hardness)]+2.9800)
287 512 717 911 1,277 1,623 1,954 2,275 2,586 2,890
NOTE: Current EPA Al criteria: 750 µg/L acute; 87 µg/L chronic

Evaluation of the EPA Recalculation Procedure Technical Report in the Arid West ES-4 May 2006
ES.4 AMMONIA CRITERIA REVIEW AND UPDATE
The “1999 Update of Ambient Water Quality Criteria for Ammonia” (EPA 1999) provides current national
recommended ammonia criteria and was reviewed and updated in this effort. An extensive review of
published and unpublished literature added 23 genera, representing 28 species, to the current national
acute/chronic database (Chapter 4). The most noteworthy additions to the database were eight species of
freshwater mussels in the Family Unionidae, which appear to be extremely sensitive to ammonia. The
updated database also includes four endangered fish species found in the arid West. Additionally, 20 chronic
ammonia studies were determined to be useable, which provided toxicity data for 14 species representing 12
genera. The updated chronic database still does not meet the “eight family rule” for the 5th percentile
approach for development of national AWQC (Stephan et al. 1985).
Our analysis of the exisiting criteria led us to not include a temperature component in the acute ammonia
relationship. However, uncertainties in the use of “large” rainbow trout data led us to an alternative approach
of re-categorizing the updated database into two databases as either cold-water or warm-water species
(Chapter 4). The four most sensitive warmwater genera were all mussels from the Unionidae family. Given
the uncertainty of the unionid distribution within the arid West (Chapter 2), we also analyzed the warm-water
database minus the Unionidae family. Acute equations were then derived for each database (i.e., cold-water,
warm-water, warm-water minus Unionidae):
Updated Cold-water Ammonia Acute Criterion:
7.204-pHpH-7.204Cold 1013.53
1010.375CMC
++
+=
Updated Warm-water Ammonia Acute Criterion:
7.204pHpH7.204Warm 1015.11
101081.0CMC −− +
++
=
Updated Warm-water without Unionidae Ammonia Acute Criterion:
7.204-pHpH-7.204nionidae without UWarm 1013.55
1010.388CMC
++
+=
The EPA’s development of the chronic equations based on temperature and pH was problematic because: 1)
the chronic database does not meet EPA’s “eight family rule”; 2) the temperature-dependent chronic
equations are based on a single acute toxicity study in which the authors explicitly state no relationship
between ammonia toxicity and temperature; 3) the amphipod Hyalella azteca was used to develop a
Evaluation of the EPA Recalculation Procedure Technical Report in the Arid West ES-5 May 2006
temperature-based function to protect early life stage fish; and 4) this H. azteca test had significant control
mortality.
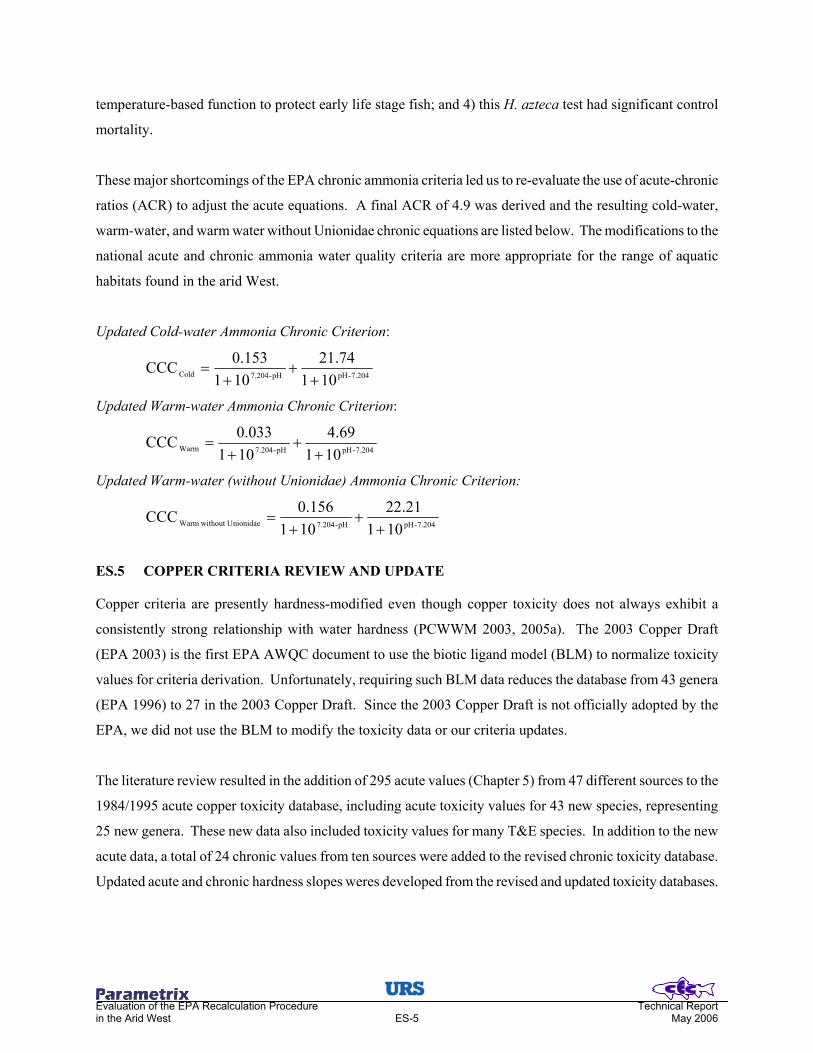
These major shortcomings of the EPA chronic ammonia criteria led us to re-evaluate the use of acute-chronic
ratios (ACR) to adjust the acute equations. A final ACR of 4.9 was derived and the resulting cold-water,
warm-water, and warm water without Unionidae chronic equations are listed below. The modifications to the
national acute and chronic ammonia water quality criteria are more appropriate for the range of aquatic
habitats found in the arid West.
Updated Cold-water Ammonia Chronic Criterion:
7.204-pHpH-7.204Cold 10174.21
1010.153CCC
++
+=
Updated Warm-water Ammonia Chronic Criterion:
7.204-pHpH-7.204Warm 10169.4
1010.033CCC
++
+=
Updated Warm-water (without Unionidae) Ammonia Chronic Criterion:
7.204-pHpH-7.204nionidae without UWarm 10121.22
1010.156CCC
++
+=
ES.5 COPPER CRITERIA REVIEW AND UPDATE
Copper criteria are presently hardness-modified even though copper toxicity does not always exhibit a
consistently strong relationship with water hardness (PCWWM 2003, 2005a). The 2003 Copper Draft
(EPA 2003) is the first EPA AWQC document to use the biotic ligand model (BLM) to normalize toxicity
values for criteria derivation. Unfortunately, requiring such BLM data reduces the database from 43 genera
(EPA 1996) to 27 in the 2003 Copper Draft. Since the 2003 Copper Draft is not officially adopted by the
EPA, we did not use the BLM to modify the toxicity data or our criteria updates.
The literature review resulted in the addition of 295 acute values (Chapter 5) from 47 different sources to the
1984/1995 acute copper toxicity database, including acute toxicity values for 43 new species, representing
25 new genera. These new data also included toxicity values for many T&E species. In addition to the new
acute data, a total of 24 chronic values from ten sources were added to the revised chronic toxicity database.
Updated acute and chronic hardness slopes weres developed from the revised and updated toxicity databases.

Evaluation of the EPA Recalculation Procedure Technical Report in the Arid West ES-6 May 2006
The revised and updated final acute and chronic dissolved copper equations and a summary of criteria at
varying hardness levels are presented below (Table ES-2). Precautionary Note: One study in particular,
Koivisto et al. (1992), highly influenced the updated final acute value, as it provides the only data for the
three most sensitive species in the database - with all values unmeasured. It would not be appropriate to
remove these unmeasured values without removing all unmeasured values. However, criteria calculated
without acute values from Koivisto et al. (1992) may be more appropriate for revised national criteria.
Table ES-2 Summary of Existing (EPA 1996) and Revised Copper Criteria
(as µg dissolved Cu/L) at Varying Hardness Levels
Mean Hardness in mg/L CaCO3 Equations 25 50 75 100 150 200 250 300 350 400
Current EPA Criteria Acute = 0.96 (e0.9422 [ln (hardness)]-1.7000 3.640 7.286 10.675 13.999 20.512 26.899 33.192 39.413 45.574 51.684
Chronic = 0.96 (e0.8545 [ln (hardness)]-1.7020 2.739 4.953 7.004 8.956 12.664 16.193 19.595 22.898 26.122 29.279
Updated Criteria (all data) Acute = 0.96 (e0.9801 [ln (hardness)]-2.2608 2.380 4.709 7.018 9.316 13.886 18.431 22.969 27.472 31.974 36.466
Chronic = 0.96 (e0.5897 [ln (hardness)]-1.1054 2.121 3.192 4.054 4.804 6.102 7.230 8.246 9.182 10.056 10.880
Updated Criteria (w/o Koivisto et al. 1992) Acute = 0.96 (e0.9801[ln(hardness)]-2.2835 4.082 8.077 12.039 15.980 23.818 31.615 39.382 47.124 54.846 62.551
Chronic = 0.96 (e 0.5897[(ln(hardness)-1.1281 3.638 5.476 6.955 8.240 10.466 12.401 14.145 15.751 17.250 18.663
ES.6 DIAZINON CRITERIA REVIEW AND UPDATE
The EPA has not established national aquatic life criteria for diazinon, but has produced a Draft Ambient
Aquatic Life Water Quality Criteria Diazinon (EPA 2000. Environmental conditions, such as site-specific
channel characteristics and water quality parameters of arid West streams, may differentially affect diazinon
degradation and, therefore, exposure to aquatic organisms.
The literature review contributed 25 new acute data points from 19 studies to the revised acute. Ten new
freshwater chronic data points from eight studies were added to the revised chronic database. The revised and
updated diazinon acute toxicity database contains data for 22 genera, satisfing the “eight-family rule” as
specified in the 1985 Guidelines. The revised and updated diazinon chronic toxicity database presents data
for nine genera of freshwater organisms.

Evaluation of the EPA Recalculation Procedure Technical Report in the Arid West ES-7 May 2006
The resulting updated acute criterion for diazinon is 0.11 µg/L. The updated chronic criterion is also 0.11
µg/L - equal to the acute criterion, since the FACR and acute criterion division factor that estimates an
LC-low for full protection of the most sensitive species are both equal to 2. Due to diazinon behavior,
mechanisms of toxicity, organism’s excretion, and exposure patterns in aquatic environments, these results
are not surprising and should be appropriate for the protection of aquatic life.
ES.7 ZINC CRITERIA REVIEW AND UPDATE
Over 120 data points from 35 sources were added to an updated acute zinc database. In addition to the new
acute data, a total of 23 data points from 12 sources were added to the chronic database, resulting in addition
of 12 new genera and 11 new species. An updated acute hardness slope was used to normalize acute values to
a hardness of 50 mg/L and to develop a hardness-based final acute equation. The new acute database contains
61 genera and 78 species (previously 36 genera and 44 species). An updated final acute-chronic ratio (FACR)
was also determined for chronic criteria derivation. Table ES-3 presents a summary of these revised and
updated acute and chronic zinc criteria at varying hardness levels.
Table ES-3 Summary of Existing and Revised Zinc Criteria
(as µg dissolved Zn/L) at Varying Hardness Levels
Mean Hardness in mg/L CaCO3 Equations 25 50 75 100 150 200 250 300 350 400
Current EPA Criteria Acute = 0.978 (e0.8473 [ln (hardness)]+0.8840 36.20 65.13 91.83 117.18 165.22 210.82 254.70 297.25 338.72 379.30
Chronic = 0.986 (e0.8473 [ln(hardness)]+0.8840 36.50 65.66 92.58 118.14 166.57 212.55 256.78 299.68 341.49 382.40
Updated Criteria Acute = 0.978 (e0.8537 [ln (hardness)]+1.1182 46.71 74.41 119.32 152.53 215.62 275.65 333.49 389.66 444.47 498.13
Chronic = 0.986 (e0.8537 [ln (hardness)]+0.9473 39.69 71.73 101.40 129.62 183.24 234.25 283.40 331.13 377.71 423.31
ES.8 AMBIENT WATER QUALITY CRITERIA RECALCULATION ARID WEST EFFLUENT-DOMINATED STREAMS
ES.8.1 Overview of the EPA Recalculation Procedure
National ambient water quality criteria (AWQC) are to be derived from the most up-to-date toxicity
databases for species resident to North America. Established methods for data selection and national
criteria derivation are published in Stephan et al. (1985), as well as “Appendix B: The Recalculation

Evaluation of the EPA Recalculation Procedure Technical Report in the Arid West ES-8 May 2006
Procedure” in EPA (1994). The basic steps involved with EPA’s recalculation procedure include
(EPA 1994):
a) Corrections to the national database (Chapters 3-7);
b) Updating the national database (Chapters 3-7);
c) Deletions of taxa that do not occur at the site (Chapter 9 and Appendix 3);
d) If new database does not meet MDRs, generating the data necessary to meet MDRs;
e) Recalculating new acute and chronic criteria based on the revised and updated databases (Chapters 9 and 10); and
f) Presenting results in a report (present study).
ES.8.2 Resident vs. Transient Species
A key component of the recalculation procedure, specifically with regard to deletion of non-resident taxa
from the database, is the definition of the phrase “occur at the site.” For this analysis, we have taken this
occur at site phrase a step further by delineating the organisms that occur at the site into “resident” and
“transient” species. A resident species is an organism using the habitat located at the site for reproduction,
foraging, and/or refuge, which can include migratory species. A transient species, on the other hand, is a
species that may occur at the site, but does not utilize the habitat for these functions, and is only passively
moving through the site.
ES.8.3 Deletion Process
Resident species lists generated in Chapter 2 were used to screen the corrected and updated national toxicity
databases for each criterion. When reviewing the EPA (1994) deletion process, we identified a possible
conflict between 1) the stepwise process they describe, 2) their accompanying figure that shows an example
of the deletion process using three Phyla, and 3) the stated goal of deriving a site-specific database that
contains the most closely related taxa to taxa found at the site. To resolve these conflicts, we refined the EPA
step-wise process with the goal of generating a site-specific toxicity dataset more representative of the species
that occur at the site than what would be derived using the standard process (Chapter 8).
ES.8.4 Minimum Data Requirements
Direct calculation of a criterion requires a toxicity database contain data for eight diverse Families (Stephen
et al. 1985), commonly referred to as the “eight-family rule”, or minimum data requirements (MDRs).
National AWQC derived from a database that meets the MDRs are calculated from a series of formulas using
the geometric mean toxicity values of the four most sensitive genera, and the total number of genera

Evaluation of the EPA Recalculation Procedure Technical Report in the Arid West ES-9 May 2006
represented in the database. The resulting criteria concentrations are expected to protect at least 95% of all
aquatic organisms and aquatic habitats (lotic, lentic, cold-water, and warm-water habitats).
ES.8.5 Redefining the Recalculation Procedure for Arid West Streams
The EPA guidelines and MDRs are the foundation for the arid West effluent-dependent stream AWQC
recalculations. However, we believe slight modifications of the MDRs and EPA guidelines may be warranted
given the habitats present and organisms expected to occur in these habitats.
First, taking into consideration the non-resident taxa in the EPA MDRs and the relative importance of other
taxa not included in the EPA MDRs, we propose a revised eight-family rule specific for arid West effluent-
dependent streams. These revised arid West MDRs (AW-MDRs) are intended for the protection of warm
water aquatic communities residing in arid West effluent-dependent stream habitats, not in lakes and/or
ponds.
Arid West Stream Eight-Family Rule [AWS-MDRs]
1) An organism in the Family Centrachidae (replacing Family Salmonidae), 2) An organism in the Family Cyprinidae (replacing Family in Class Osteichthyes), 3) A Family in the Phylum Chordata, 4) An aquatic insect, 5) A second aquatic insect in a different Order (replacing Planktonic Crustacean), 6) A benthic crustacean, 7) A Family in a Phylum other than Arthropoda or Chordata, and 8) A Family in any Order of insect or any Phylum not already represented.
Second, for the analysis presented herein, we are proposing that criteria derived during the recalculation
process be calculated from the geometric mean of species mean acute and chronic values (SMAVs and
SMCVs) rather than genus mean acute and chronic values (GMAVs and GMCVs) since 1) the deletion
process itself is conducted on a species level rather than a genus level; 2) toxicity of a contaminant to different
species within the same genus is not always equivalent; and 3) the minimal overlap between arid West
resident species lists and species within the various toxicity databases can artificially lower the criterion if
derived at the GMAV level (Great Lakes Environmental Center 2005). Calculating criteria at the species
level rather than genus can help increase the database sample size to help resolve potential sample size effects,
without affecting the protectiveness of the resulting criteria through inclusion of SMAVs for sensitive species.
ES.8.6 Recalculation of Ambient Water Quality Criteria
The step-wise deletion process was conducted using the revised and updated national toxicity databases and
resident species list for each river. Regional databases (Southwest and High Plains) were created by

Evaluation of the EPA Recalculation Procedure Technical Report in the Arid West ES-10 May 2006
compliling the species lists for rivers in each respective region. Once the site-specific databases were created,
checking of AWS-MDRs, the ranking process, and final site-specific criteria derivation was performed.
The first step after completion of the site-specific databases was to check for acceptance of the AWS-MDRs.
In addition to compliance with the AWS-MDR, we identified threatened, endangered, and/or recreationally
economically important species that reside at a site. If the AWS-MDRs were not met for a particular criterion
at a particular site, then the regional site-specific criterion could provide an alternative AWQC
recommendation.
ES.9 COMPARISONS OF SITE-SPECIFIC STANDARDS TO UPDATED NATIONAL CRITERIA
For comparisons of actual recalculated site-specific standards to national criteria, the equations or CMC and
CCC values for each contaminant and each site were solved for mean hardness and pH of each site, as
appropriate. Historical ambient water quality data for the study streams were derived using water quality data
presented in the arid West HCS (PCWWM 2002) and from the BLM validation study (PCWWM 2005).
Results for the Santa Ana River, both segments of the Santa Cruz River, the Salt/Gila Rivers, Fountain Creek,
and the South Platte River, as well as regional recalculated criteria are summarized in Tables ES-4 and ES-5.
Table ES-4 Site-Specific Acute Criterion Concentrations using Mean Hardness and pH when Necessary
Site-Specific CMC Regional CMC
Santa Cruz River Santa Ana
River Near
Nogales Near
Tucson
Salt/ Gila
River
Fountain Creek
South Platte River
Southwest Region
High Plains Region
Hardness (mg/L) 188 170 150 388 218 280 208 247
pH 7.2 7.5 7.2 7.4 7.4 7.4 7.3 7.4 Aluminum (µg total Al/L)
3463 (3856)
4527 (3546)
NA (3195)
7683 (7050)
3609 (4362)
4826 (5373) 3768
(1506) 4005
(4840) Ammonia (mg TA-N/L)
28.35 (27.52)
18.53 (18.53)
28.47 (27.52)
21.16 (21.40)
22.05 (21.40)
21.62 (21.40) 24.94
(24.42) 21.77
(21.40) Copper (µg dissolved Cu/L)
29.93 (16.96)
27.84 (15.36)
21.32 (13.59)
63.36 (34.49)
35.18 (19.57)
45.68 (25.05) 36.42
(18.69) 40.56
(22.14)
Diazinon (µg total diazinon/L)
8.56 (0.11)
9.12 (0.11)
12.50 (0.11)
12.72 (0.11)
9.32 (0.11)
9.32 (0.11) 9.32
(0.11) 9.32
(0.11)
Zinc (µg dissolved Zn/L)
470.2 (261.5)
329.9 (239.9)
301.4 (215.6)
565.0 (485.3)
364.2 (296.2)
464.0 (367.4) 308.2
(284.6) 439.4
(329.9)
NOTES: NA = Data were not available to derive criteria for that site – see Chapter 9 for discussion. Values in () = updated national acute criterion, given site hardness or pH, for comparison.

Evaluation of the EPA Recalculation Procedure Technical Report in the Arid West ES-11 May 2006
Table ES-5 Site-Specific Chronic Criterion Concentrations using Mean Hardness and pH when Necessary
Site-Specific CCC Regional CCC
Santa Cruz River Santa Ana
River Near
Nogales Near
Tucson
Salt/Gila Rivers
Fountain Creek
South Platte River
Southwest Region
High Plains Region
Hardness (mg/L) 188 170 150 388 218 280 208 247 pH 7.2 7.5 7.2 7.4 7.4 7.4 7.3 7.4 Aluminum (µg total Al/L)
1384 (1541)
1809 (1417)
NA (1277)
3071 (2818)
1443 (1744)
1929 (2148) 1506
(1677) 1601
(1935) Ammonia (mg TA-N/L)
11.57 (11.23)
7.56 (7.56)
11.62 (11.23)
8.64 (8.74)
9.00 (8.74)
8.83 (8.74) 10.18
(9.97) 8.89
(8.74) Copper (µg dissolved Cu/L)
12.31 (6.97)
11.90 (6.57)
9.57 (6.10)
19.63 (10.69)
13.65 (7.61)
16.08 (8.82) 14.39
(7.40) 14.99 (8.19)
Diazinon µg total diazinon/L)
8.56 (0.11)
9.12 (0.11)
12.50 (0.11)
12.72 (0.11)
9.32 (0.11)
9.32 (0.11) 9.32
(0.11) 9.32
(0.11)
Zinc (µg dissolved Zn/L)
399.6 (222.2)
280.4 (203.9)
256.1 (183.2)
480.2 (412.4)
310.1 (252.1)
394.3 (312.2) 262.3
(242.2) 373.6
(280.5)
NOTES: NA = data was not available to derive criteria for that site – see Chapter 9 for discussion Values in () = updated national chronic criterion, given site hardness or pH, for comparison.
To quantify the relative numeric implication of applying the arid West recalculation procedure for particular
contaminant/site combinations, we compared these site-specific standards with their respective updated
national criteria (Table ES-6). A net change of 10% in the site-specific standard vs. national criteria was used
to indicate differences that were likely to be substantially different from the national criteria. Results suggest
that the recalculation procedure for development of site-specific standards would generally derive
substantially different criteria concentrations for all of the case-study streams. The one exception to this is
ammonia, which shows no noteworthy change when compared to the updated national criteria following
recalculation.
Table ES-6 Calculation Findings Decision Matrix
Santa Ana
River
Santa Cruz near
Nogales
Santa Cruz Near
Tucson
Salt/Gila Rivers
Fountain Creek
South Platte River
Southwest Region
High Plains Region
Aluminum - + NA = - - - - Ammonia = = = = = = = =
Copper + + + + + + + + Diazinon + + + + + + + +
Zinc + + + + + + = + NOTES: “+” = Recalculated criteria are less restrictive than national updated criteria. “-” = Recalculated criteria are more restrictive than national updated criteria. “=” = Less than 10% change in recalculated criteria from national updated criteria. NA = Data were not available to conduct the analysis.

Evaluation of the EPA Recalculation Procedure Technical Report in the Arid West ES-12 May 2006
ES.9.1 Criteria-Specific Issues with the Recalculation Procedure
The following discussion provides a summary of the issues that arose during the recalculation evaluation for
each criterion, with comments on the mechanics of updating the national criteria, creating site-specific
databases, and deriving final site-specific criteria.
ES.9.1.1 Aluminum
Compared to the updated national aluminum criteria, site-specific aluminum criteria were more restrictive or
equal to the national criteria, except for the Santa Cruz near Nogales site (Figure ES-1). These counter-
intuitive findings resulted from two basic factors.
First, all site-specific databases contained greater variability in the four lowest SMAVs, resulting in less
statistically confident FAV calculations and, hence, more restrictive criteria. Second, the site-specific
databases resulted in fewer taxa than the updated national databases. Reduction in number of species (N)
within the site-specific toxicity databases decreased the degrees of freedom afforded to the four lowest ranked
SMAVs.
0 100 200 300 400 500
Hardness (mg/L as CaCO 3)
0
500
1000
1500
2000
2500
3000
3500
4000
4500
Chr
onic
Alu
min
um C
riter
ia(µ
g to
tal A
l/L)
Updated Chronic CriteriaSanta Ana River, South Platte River, Southwest regionSanta Cruz near NogalesSalt/Gila riversFountain Creek, High Plains region
Figure ES-1
Comparison of Site-Specific Chronic Aluminum Criteria to the Updated National Criteria at Varying Hardness

Evaluation of the EPA Recalculation Procedure Technical Report in the Arid West ES-13 May 2006
In other words, the lower aluminum criteria resulting from site-specific recalculations relfect a reduction in
the size of an already limited toxicity database and are not related to the species richness of the study sites.
As such, we would recommend adoption of the updated aluminum AWQC presented in the national review
and update (Chapter 3) and continue further investigation into site-specific recalculations when a more robust
database becomes available.
ES.9.1.2 Ammonia
With regard to ammonia, there is little variability in site-specific criteria between any of the sites or regions
(Figure ES-2). However, regional criteria are less restrictive than all but one site-specific criterion. This is
directly associated with using the larger regional toxicity databases when compared to the site-specific
databases. The similarity in results for all sites and regions with the updated national criterion suggest that
site-specific recalculations for ammonia might not be necessary, as the breakdown of warm and cold water
habitats proposed in our national updated ammonia criteria may already account for site-specific differences
in arid-west streams, making further species-based recalculation efforts unnecessary.
7 7.5 8 8.5 9
pH
0
2
4
6
8
10
12
14
16
Chr
onic
Am
mon
ia C
riter
ia(m
g TA
-N/L
)
Updated Warm Water CriteriaSalt & Gila riversSanta Cruz River - NogalesSanta Cruz River - TucsonSanta Ana RiverFountain CreekSouth Platte River
Figure ES-2
Site-Specific Chronic Ammonia Criteria as a Function of pH (Note: Acute Criteria Distribution is Similar to Chronic)
ES.9.1.3 Copper
The recalculation procedure for copper provided substantial site-specific differences in criteria concentrations
in arid West study streams compared to national criteria. Unlike ammonia, we found a substantial increase in
all site-specific criteria (i.e., were less restrictive) compared to national or updated national AWQC
(Figure ES-3). This was primarily a result of deletion of non-resident cladocerans.

Evaluation of the EPA Recalculation Procedure Technical Report in the Arid West ES-14 May 2006
0 100 200 300 400 500
Hardness (mg/L as CaCO3)
0
5
10
15
20
25
30
Chr
onic
Cop
per C
riter
ia(µ
g di
ssol
ved
Cu/
L)
Updated National ChronicSanta Ana RiverSanta Cruz near NogalesSanta Cruz near TucsonSalt/Gila rivers
Fountain CreekSouth Platte RiverSouthwest regionHigh Plains region
Figure ES-3
Comparison of Site-Specific Chronic Copper Criteria to the Updated National Chronic Copper Criteria at Varying Hardness Values
ES.9.1.4 Diazinon
Resulting site-specific diazinon criteria were substantially greater (i.e., less restrictive) than the updated
national criteria. The site-specific databases are half as variable as the national update, which increases
confidence in respective estimates and results in greater values. Furthermore, site-specific criteria for diazinon
were more variable between sites than other criteria in this analysis. Although the most sensitive organisms
are similar between most sites, the variability in database size between sites was substantially different. The
significant increase of the recalculated criterion and the variability of criterion between sites provide some
evidence that moderately sized databases are uniquely sensitive to the arid West recalculation procedure.
ES.9.1.5 Zinc
In general, the arid West recalculation procedure applied to the updated national zinc database successfully
generates site-specific criteria that reflect the relative sensitivity of organisms at the site, rather than criteria
that are driven by database size. The species composition of the site-specific databases and ranking were
variable among sites, which greatly influenced the numeric outcome of the recalculated criteria (Figure ES-4).
Initiating the deletion process with the robust updated database makes it more likely that the site-specific
databases will reflect the unique species composition for each arid West site.
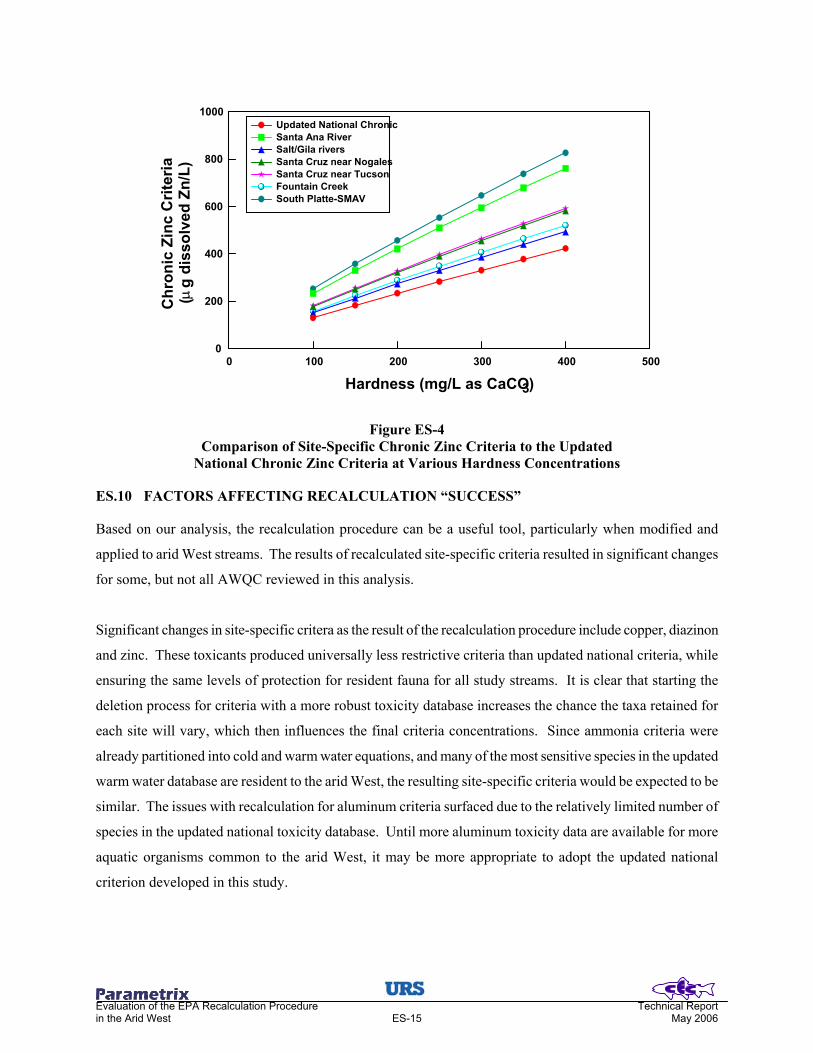
Evaluation of the EPA Recalculation Procedure Technical Report in the Arid West ES-15 May 2006
0 100 200 300 400 500
Hardness (mg/L as CaCO3)
0
200
400
600
800
1000
Chr
onic
Zin
c C
riter
ia(µ
g di
ssol
ved
Zn/L
)
Updated National ChronicSanta Ana RiverSalt/Gila riversSanta Cruz near NogalesSanta Cruz near TucsonFountain CreekSouth Platte-SMAV
Figure ES-4 Comparison of Site-Specific Chronic Zinc Criteria to the Updated
National Chronic Zinc Criteria at Various Hardness Concentrations
ES.10 FACTORS AFFECTING RECALCULATION “SUCCESS”
Based on our analysis, the recalculation procedure can be a useful tool, particularly when modified and
applied to arid West streams. The results of recalculated site-specific criteria resulted in significant changes
for some, but not all AWQC reviewed in this analysis.
Significant changes in site-specific critera as the result of the recalculation procedure include copper, diazinon
and zinc. These toxicants produced universally less restrictive criteria than updated national criteria, while
ensuring the same levels of protection for resident fauna for all study streams. It is clear that starting the
deletion process for criteria with a more robust toxicity database increases the chance the taxa retained for
each site will vary, which then influences the final criteria concentrations. Since ammonia criteria were
already partitioned into cold and warm water equations, and many of the most sensitive species in the updated
warm water database are resident to the arid West, the resulting site-specific criteria would be expected to be
similar. The issues with recalculation for aluminum criteria surfaced due to the relatively limited number of
species in the updated national toxicity database. Until more aluminum toxicity data are available for more
aquatic organisms common to the arid West, it may be more appropriate to adopt the updated national
criterion developed in this study.

Evaluation of the EPA Recalculation Procedure Technical Report in the Arid West ES-16 May 2006
Although results from the recalculation procedure could be used to derive scientifically defensible
site-specific criteria, the tasks involved require considerable effort. However, the updated toxicity databases
developed for this study can be used as a starting point for future updates to these five criteria. Furthermore,
relevant invertebrate and fish population data are required for the development of resident species lists.
Invertebrate and fish population monitoring plans should be initiated and maintained in the reach of interest.
Lastly, there needs to be continued support for more toxicity testing for all AWQC, especially with species
resident to arid West streams.
ES.11 LITERATURE CITED
Great Lakes Environmental Center. 2005. Draft Compilation of Existing Guidance for the Development of Site-Specific Water Quality Objectives in the State of California. Report prepared for State of California and U.S. Environmental Protection Agency.
Koivisto, S., M. Ketola, and M. Walls. 1992. Comparison of five cladoceran species in short- and long-term
copper exposure. Hydrobiol. 248(2):125-136. Pima County Wastewater Management. 2002. Habitat Characterization Study: Final Report. Prepared in
support of the Arid West Water Quality Research Project by Camp Dresser & McKee, in association with URS, Chadwick Ecological Consultants, Inc., EPG (Environmental Planning Group), and Risk Sciences.
Pima County Wastewater Management. 2003. Extant Criteria Evaluation: Final Report. Prepared in support
of the Arid West Water Quality Research Project by Paramtrix. Inc. and ENSR International, in collaboration with HydroQual, Inc. and EcoTox.
Pima County Wastewater Management Department. 2005a. Evaluation of the Reliability of Biotic Ligand
Model Predictions for Copper Toxicity in Waters Characteristic of the Arid West: Draft Final Report. Prepared in support of the Arid West Water Quality Research Project by Paramtrix. Inc., in collaboration with HydroQual, Inc.
Pima County Wastewater Management Department. 2005b. Hardness-dependent Ammonia Toxicity to
Aquatic Organisms and the Potential Use of the Water-effect Ratio: Draft Final Report. Prepared in support of the Arid West Water Quality Research Project by Paramtrix. Inc. and Chadwick Ecological Consultants, Inc.
Stephan, C.E., D.I. Mount, D.J. Hansen, J.H. Gentile, G.A. Chapman, and W.A. Brungs. 1985. Guidelines
for Deriving Numerical National Water Quality Criteria for the Protection ofAquatic Organisms and Their Uses. PB-85-227049. U.S. Environmental Protection Agency, Office of Research and Development, Duluth, Minnesota.
U.S. Environmental Protection Agency. 1988. Ambient Water Quality Criteria for Aluminum - 1988. EPA
440/5-86-008. Office of Water, Washington, DC. U.S. Environmental Protection Agency. 1994. EPA Interim Guidance on Determination and Use of Water-
Effect Ratios for Metals. EPA-823-B-94-001. Office of Water, Washington, DC. U.S. Environmental Protection Agency. 1996. 1995 Updates: Water Quality Criteria Documents for the
Protection of Aquatic Life in Ambient Water. EPA-820-B-96-001. Office of Water, Washington, DC.

Evaluation of the EPA Recalculation Procedure Technical Report in the Arid West ES-17 May 2006
U.S. Environmental Protection Agency. 1999. 1999 Update of Ambient Water Quality Criteria for Ammonia. EPA-822-R-99-014. Office of Water, Washington, DC.
U.S. Environmental Protection Agency. 2000. Draft Ambient Aquatic Life Water Quality Criteria Diazinon.
CAS Registry No. 333-41-5. Office of Water, Washington, DC. U.S. Environmental Protection Agency. 2003. 2003 Update of Ambient Water Quality Criteria for Copper.
CAS Registry No. 7440-50-8. Office of Water, Washington, DC.

Evaluation of the EPA Recalculation Procedure Technical Report in the Arid West 1-1 May 2006
1.0 INTRODUCTION
1.1 SUMMARY OF PROJECT OBJECTIVES
During the 1997 initiating symposium of the Arid West Water Quality Research Project (AWWQRP) the
following question was posed as critical to Western dischargers and regulators: given the hydrologic and
climatic characteristics of Arid West1 effluent-dependent waters (EDW), are national ambient water quality
criteria (AWQC) appropriate for protection of Western aquatic life and their habitats?
In response, the Habitat Characterization Study (HCS) studied nine stream systems in the arid West and
determined there is a fundamental difference in the environmental conditions of effluent-dependent waters
compared to perennial waters, particularly those in more mesic regions, suggesting that the first assumption
might be valid (PCWWM 2002). The Extant Criteria Evaluation (ECE) (PCWWM 2003) completed the basis
for the question, with an examination of the technical issues required to adapt AWQC to local ecological
conditions of the arid West.
National AWQC are primarily derived from toxicity tests conducted with laboratory reared organisms that act
as surrogates for all untested and untestable spieces (Stephan et al. 1985). Although the resulting criteria
adequately protect many species nation-wide, these laboratory species may not always be the best
representatives for species resident to the arid West. Frequently tested surrogates are most similar to those
encountered in perennial streams in mesic environments (e.g., the eastern U.S., and trout species of the Pacific
Northwest, and the intermountain Rocky Mountains). A much smaller body of toxicological knowledge
exists for stream biota characteristic of the arid West, adapted to intermittent perennial streams. The response
of species adapted to EDWs and the regulated chemical components of treated wastewater is even less
complete.
These remaining open issues suggested to the AWWQRP Regulatory Working Group that development of
site-specific criteria for arid West EDWs may be an appropriate solution. At present, the EPA has provided
guidance for the development of site-specific criteria using three primary methods (EPA 1994):
the recalculation method,
water-effect ratios, and
the resident species procedure.
1 As has been the case in previous AWWQRP reports, “arid West” includes the arid and semiarid parts of the U.S. West of the 110th meridian in which mean annual rainfall is 20 inches (~500 mm) or less.
Evaluation of the EPA Recalculation Procedure Technical Report in the Arid West 1-2 May 2006
While the ECE examined potential modifications to each of these procedures in general terms, the current
study, the EPA Recalculation Study, applies and further develops tools for modifying AWQC on a
site-specific basis for arid West EDWs through an evaluation of the EPA recalculation procedure.
Evaluation of the recalculation procedure has focused on AWQC that represent different modes of toxicity,
robustness of toxicological databases, and other recalculation issues. The criteria chosen for evaluation
include three initially addressed in the ECE (ammonia, copper, diazinon), as well as two common metals, zinc
and aluminum. The selection of example AWQC follows the conclusions of both the ECE and HCS that the
recalculation procedure in the arid West should be based on taxa other than salmonids and cladocerans. The
ECE demonstrated that the low sensitivity of other resident families to various naturally occurring elements in
Western streams may result in over protection by the AWQC. The HCS also concluded that some of the
sensitive species are simply not found in either natural or effluent-dependent, non-perennial streams in the
arid West.
AWQC have been recalculated to reflect the resident species data from a number of effluent-dependent study
streams in the arid West. Streams chosen for this study include five of the nine streams addressed in the HCS;
Santa Ana River, California;
Salt/Gila Rivers, Arizona;
Santa Cruz River, Arizona;
Fountain Creek, Colorado; and
South Platte River, Colorado.
Waters from most of these sites were also used for water-effect ratio testing for copper and ammonia in two
other AWWQRP studies (PCWWM 2005a,b).
1.2 ARID WEST/EFFLUENT DEPENDENT STREAMS SELECTED FOR RECALCULATION ANALYSIS
The HCS investigated nine “case study” streams (two on the Santa Cruz River) across the West (PCWWM
2002). The Recalculation Study focused on five of the selected HCS study sites to illustrate the range of
possible recalculation outcomes and/or alternatives derived from relevant examples of effluent-dependent
waters for which adequate resident species lists are known to exist. Based on available data from both the
HCS and existing monitoring programs (see Chapter 2), the following streams were chosen, according to the
accompanying rationale:

Evaluation of the EPA Recalculation Procedure Technical Report in the Arid West 1-3 May 2006
Santa Ana River, California – As noted in the HCS, this effluent-dependent stream was extensively studied
as part of a use-attainability analysis in the 1990s. This study included seasonal sampling of fish and
invertebrates at numerous sites, which provides appropriate resident species lists for comparison to each
AWQC. In addition, the Santa Ana River Dischargers Association (SARDA) and the USGS have conducted
monitoring of benthic invertebrates and occasional sampling of fish populations through 2004.
Santa Cruz River, Arizona – The Santa Cruz River has been the site of extensive bioassessment, as
indicated by the HCS. A site-specific water quality criteria investigation was developed in 1986 and
numerous bioassessments have been conducted over the years. In 1998 the USGS began an investigation of
the impact of wastewater on invertebrate communities. Currently, the U.S. Army Corps of Engineers is
anticipating restoration of several reaches and baseline biological data is being collected. Two reaches of the
Santa Cruz are evaluated in this study – downstream of Nogales and downstream of Tucson.
Salt/Gila Rivers, Arizona – The Gila River below its confluence with the Salt River downstream of Phoenix
was also studied. The controversial listing for impairment due to pesticides in fish tissues, possibly leading to
a future TMDL, has kept attention focused on the biological health of this effluent-dependent stream. In
addition, the State species list for effluent-dependent waters is heavily indebted to early ecological work on
the river and includes some dubious “resident” species, such as largemouth bass. Ongoing river restoration
work by the Corps of Engineers and City of Phoenix provides additional sources of data.
Fountain Creek, Colorado – An HCS effluent-dominated stream, Fountain Creek has a long-term biological
monitoring program in place through Colorado Springs Utilities and the USGS. This program includes
benthic invertebrates at multiple sites from 1989 through 2004, and fish population data periodically through
the same period.
South Platte River, Colorado – This HCS effluent-dependent stream has an abundance of aquatic biological
monitoring data conducted by the Metro Wastewater Reclamation District. This monitoring program includes
fish population and invertebrate communities from 1989 through the present, making it one of the most
extensive aquatic biological databases available in the arid West.
1.3 AMBIENT WATER QUALITY-CRITERIA REVIEW SELECTION PROCESS AND DATABASE REVIEW
A total of five criteria were chosen for this evaluation, representing a range of robustness, modes of toxicity,
and general criteria derivation issues. The criteria, along with a description of selection reasons, are:

Evaluation of the EPA Recalculation Procedure Technical Report in the Arid West 1-4 May 2006
Aluminum – Aluminum (EPA 1988) is an example of a criterion based on a very limited toxicity database,
one that just barely meets the “eight-family rule” (described below). As such, it presents unique problems for
the recalculation procedure. In addition, aluminum can be a metal of concern in streams throughout the arid
West, given its ubiquitous presence in the clay soils common to this region. Many Western streams are listed
as impaired due to aluminum, despite bioassessment evidence to the contrary.
Ammonia – This criterion (EPA 1999) was chosen for the project for a number of reasons. Firstly, it was one
of the criteria evaluated in the ECE as a potential candidate for recalculation. Secondly, the mode of toxicity
for ammonia is different than that for metals. Thirdly, this criterion has recently come under scrutiny by EPA
as a result of newly published toxicity data, specifically on unionid clams. Lastly, EPA’s final derivation of
acute and chronic ammonia criteria were not directly based on standard EPA criteria calculations of final
acute and final chronic values (Stephan et al. 1985). Ammonia would allow an analysis of how recalculation
procedures work for irregularly derived criteria.
Copper – As with ammonia, copper (EPA 1985, 1996) was a criterion evaluated for the ECE. In addition,
EPA recently produced a draft update to the copper criteria (EPA 2003), which incorporates the biotic ligand
model (BLM) as a replacement to the hardness equation for derivation of site-specific copper standards. The
validity of BLM predictions in very hard waters common to the arid West is also being evaluated as part of a
separate AWWQRP project (PCWWM 2005a). The copper evaluation would thus facilitate analysis of the
recalculation procedure for a BLM-adjusted toxicity database and build on the study currently being
conducted for AWWQRP.
Diazinon - Analysis of diazinon, an organophosphate insecticide, provides an opportunity to aid in the
development of AWQC that is presently in draft form (EPA 2000). Diazinon has been steadily gaining
environmental significance in arid Western states due to its increasing presence in urban wastewater, where it
has been suspect in numerous whole effluent toxicity (WET) testing failures. An analysis of diazinon
provides an example of a contaminant with a modest sized database that presents toxicity values for many
aquatic organisms with a wide range of sensitivities.
Zinc – Zinc is a common metal found throughout the West owing to the presence of mineralized soils in
many locations. This metal also has a rather extensive toxicity database, so zinc represents the evaluation of
the recalculation procedure for a criterion with a robust database.
Evaluation of the EPA Recalculation Procedure Technical Report in the Arid West 1-5 May 2006
Evaluating the recalculation procedure for these criteria began with a review of the criteria documents for
technical accuracy and potential inclusion of new data. We reviewed five EPA AWQC documents, drafts,
and updates to national toxicity database. Documents reviewed in this process include:
• Ambient Water Quality Criteria for Aluminum (EPA 1988),
• 1999 Update of Ambient Water Quality Criteria for Ammonia (EPA 1999),
• Ambient Water Quality Criteria for Copper-1984 (EPA 1985),
• 2003 Draft Update of Ambient Water Quality Criteria for Copper (EPA 2003),
• Draft Ambient Aquatic Life Water Quality Criteria Diazinon (EPA 2000),
• Ambient Water Quality Criteria for Zinc -1987 (EPA 1987), and
• 1995 Updates: Water Quality Criteria Documents for the Protection of Aquatic Life in Ambient Water (EPA 1996).
Our evaluation of these criteria was conducted in three phases – 1) review of the criteria documents for
technical accuracy, 2) literature review to update the criteria toxicity databases, and 3) develop revised,
updated national criteria. These three phases are outlined below and the results are summarized for each
criterion under review in Chapters 3 through 7.
1.3.1 Step 1 – Technical Review of Criteria Documents
The first step of this process was a technical review of the most up-to-date EPA AWQC documents to
determine if 1) suitable and correct data were included in national toxicity databases, and 2) EPA criteria
development methods were followed for deriving AWQC. The EPA’s Guidelines for Deriving Numerical
Water Quality Criteria for the Protection of Aquatic Organisms and Their Uses (Stephan et al. 1985);
hereafter referred to as the 1985 Guidelines, provided details on the acceptable data and criteria derivation
methods. Some general principles presented in the 1985 Guidelines include:
(1) Acute toxicity data must be available for species from a minimum of eight diverse and
specific families. This minimum data requirement (MDR) is often referred to as the “eight-
family rule,” and includes
• the family Salmonidae,
• a second family in the class Osteichthyes,
• a third family in the phylum Chordata,
• a planktonic crustacean,

Evaluation of the EPA Recalculation Procedure Technical Report in the Arid West 1-6 May 2006
• a benthic crustacean,
• an insect,
• a family in a phylum other than Arthropoda or Chordata, and
• a family in any order of insect or any phylum not already represented.
(2) Precedence is given to measured toxicity values derived from flow-through tests when
calculating species mean acute values (SMAVs), to the exclusion of test results with
unmeasured values and/or from static tests. Geometric means of all SMAVs within a given
genus are then calculated as genus mean acute values (GMAVs).
(3) If sensitivity to a contaminant is influenced by life stage, only the most sensitive life stage
should be used in the SMAV or GMAV calculation.
(4) The FAV is the statistical estimation of the LC50 concentration for the theoretical 5th
percentile most sensitive genus. The FAV is derived from the four GMAVs that have
cumulative probabilities closest to 0.05, which is always the four most sensitive GMAVs
when there are less than 59 genera in the database, and the total number of genera in the
database. The FAV is divided by two to estimate an LC-low and obtain the criterion
maximum concentration (CMC) (i.e., acute criterion, protective of nearly all species in the
database).
(5) Chronic toxicity data must be available for at least three taxa. The chronic criterion is most
often set by determining an appropriate acute-to-chronic ratio (ACR), which is the ratio of
acutely toxic concentrations to the chronically toxic concentrations for the same species and
then dividing the FAV by that ratio. However, if sufficient chronic data are available to meet
the “eight-family rule,” then the chronic value can be derived using the same statistical
procedure as used for FAV derivation.
(6) When necessary, the acute and/or chronic criterion may be lowered to protect recreationally
or commercially important species.
Any deviations from these general principals are clearly explained in the introduction of each individual
chapter for each criterion.
Evaluation of the EPA Recalculation Procedure Technical Report in the Arid West 1-7 May 2006
1.3.2 Step 2 – Update of Toxicity Databases
The purpose of this step was to update the existing acute and chronic databases with scientific studies relevant
to the derivation of AWQC for each chemical. Emphasis was placed on obtaining literature available since
the most recently published database. However, literature published prior to these documents, but not cited
by EPA, was reviewed as well to establish criteria based on the most complete and up-to-date database
available.
1.3.3 Step 3 – Update of Criteria
Following the compilation of literature and development of the revised database, each acute and chronic
AWQC was re-calculated using methods as described by the 1985 Guidelines. This process involves the
calculation of SMAVs (the geometric mean of individual toxicity values) and genus mean acute values
(GMAVs; the geometric mean of SMAVs when two or more species represent a genus), and ranking the
GMAVs according to sensitivity. The database was reviewed for compliance with MDRs (i.e., the “eight
family rule”) and the criteria updated. These updated AWQC (Chapters 3-7) were subsequently used as the
basis for evaluating the recalculation procedure (EPA 1994) in each of our case study EDWs (Chapter 9).
1.4 LITERATURE CITED
Pima County Wastewater Management. 2002. Habitat Characterization Study: Final Report. Prepared in support of the Arid West Water Quality Research Project by Camp Dresser & McKee, in association with URS, Chadwick Ecological Consultants, Inc., EPG (Environmental Planning Group), and Risk Sciences.
Pima County Wastewater Management. 2003. Extant Criteria Evaluation: Final Report. Prepared in support
of the Arid West Water Quality Research Project by Paramtrix. Inc. and ENSR International, in collaboration with HydroQual, Inc. and EcoTox.
Pima County Wastewater Management Department. 2005a. Evaluation of the Reliability of Biotic Ligand
Model Predictions for Copper Toxicity in Waters Characteristic of the Arid West: Draft Final Report. Prepared in support of the Arid West Water Quality Research Project by Paramtrix. Inc., in collaboration with HydroQual, Inc.
Pima County Wastewater Management Department. 2005b. Hardness-dependent Ammonia Toxicity to
Aquatic Organisms and the Potential Use of the Water-effect Ratio: Draft Final Report. Prepared in support of the Arid West Water Quality Research Project by Paramtrix. Inc. and Chadwick Ecological Consultants, Inc.
Stephan, C.E., D.I. Mount, D.J. Hansen, J.H. Gentile, G.A. Chapman, and W.A. Brungs. 1985. Guidelines for Deriving Numerical National Water Quality Criteria for the Protection of Aquatic Organisms and Their Uses. PB-85-227049. U.S. Environmental Protection Agency, Office of Research and Development, Duluth, MN.
U.S. Environmental Protection Agency. 1985. Ambient Water Quality Criteria for Copper - 1984. EPA
449.5-84-031. Office of Water, Washington, DC.

Evaluation of the EPA Recalculation Procedure Technical Report in the Arid West 1-8 May 2006
U.S. Environmental Protection Agency. 1987. Ambient Water Quality Criteria for Zinc - 1987. EPA-440/5-87-003. Office of Water, Washington, DC.
U.S. Environmental Protection Agency. 1988. Ambient Water Quality Criteria for Aluminum - 1988. EPA
440/5-86-008. Office of Water, Washington, DC. U.S. Environmental Protection Agency. 1994. EPA Interim Guidance on Determination and Use of Water-
Effect Ratios for Metals. EPA-823-B-94-001. Office of Water, Washington, DC. U.S. Environmental Protection Agency. 1996. 1995 Updates: Water Quality Criteria Documents for the
Protection of Aquatic Life in Ambient Water. EPA-820-B-96-001. Office of Water, Washington, DC. U.S. Environmental Protection Agency. 1999. 1999 Update of Ambient Water Quality Criteria for Ammonia.
EPA-822-R-99-014. Office of Water, Washington, DC. U.S. Environmental Protection Agency. 2000. Draft Ambient Aquatic Life Water Quality Criteria Diazinon.
CAS Registry No. 333-41-5. Office of Water, Washington, DC. U.S. Environmental Protection Agency. 2003. 2003 Update of Ambient Water Quality Criteria for Copper.
CAS Registry No. 7440-50-8. Office of Water, Washington, DC.
Evaluation of the EPA Recalculation Procedure Technical Report in the Arid West 2-1 May 2006
2.0 DEVELOPMENT AND ANALYSES OF RESIDENT SPECIES LIST
2.1 OVERVIEW OF STUDY STREAM SEGMENTS, DATA SOURCES, AND RESIDENT SPECIES LIST DEVELOPMENT
Fish and invertebrate taxa lists were compiled from a literature review of the arid West effluent-dependent
stream segments chosen for analysis in this study as outlined in Chapter 2. All stream segments included in
the species list compilation were located downstream of wastewater treatment plants (WWTP) that discharge
treated effluent into streams that would otherwise have low or no flow during most of the year (i.e., effluent-
dependent stream segments).
Sites on the effluent-dependent portion of the Santa Ana River near San Bernardino, California, were used for
the species list compilation, as well as sites on two effluent-dependent Santa Ana River tributaries, Chino
Creek and San Timoteo Wash to provide additional information on effluent-dependent reaches in that river
drainage. Three additional stream segments were located in southern Arizona, and included sites on the Santa
Cruz River downstream of the Nogales International WWTP near Nogales, and sites on the Santa Cruz River
downstream of the Roger Road WWTP near Tucson, as well as sites on the Salt River/Gila River downstream
of the 91st Avenue WWTP near Phoenix. The final two stream segments used to represent effluent-dependent
streams in the arid West were located in Colorado, and included the section of Fountain Creek downstream of
the Las Vegas Avenue WWTP in Colorado Springs as well as the section of the South Platte River
downstream of the Metro Wastewater Reclamation District discharge in Denver.
The data sources used to derive these taxa lists range in date from 1961 through 2005 - but the majority of the
studies were conducted from the mid-80s through 2004. The sources of the data differ for each stream, but
include studies conducted by federal and state agencies such as the USGS, EPA, U.S. Fish and Wildlife
Service (USFWS), ADEQ, Arizona Game and Fish Department (AGFD), and Colorado Division of Wildlife
(CDOW). The majority of the remaining sources for these taxa lists were studies conducted by private
consulting companies or by personnel from the WWTP responsible for providing effluent to the streams.
Brief descriptions of the sources of the biological data and timeline of collections used for each stream
segment are presented in Appendix 1.
These fish and invertebrate taxa lists were compiled to determine what taxa currently occur or could
potentially occur at the site for these effluent-dependent streams by incorporating both current monitoring and
historical data - a necessary step in the recalculation process. If the site-specific list is sufficiently different
from that in the database used to derive national WER, then water quality standards specific for the protection

Evaluation of the EPA Recalculation Procedure Technical Report in the Arid West 2-2 May 2006
of the biota found in these stream segments could be developed. These taxonomic lists also provide the
opportunity to detect any similarities or differences in fish and invertebrate species composition in effluent-
dependent streams throughout the arid West.
According to the EPA’s (1994) definition of the phrase “occur at this site,” organisms considered to inhabit
these streams include fish or invertebrates that are usually present at the site, either as year-round residents or
as seasonal or intermittent residents. Their definition also extends to taxa not currently present in the selected
stream if they were either present in the past at these sites, or are currently present in nearby bodies of water,
and if they are expected to reside within the streams when conditions improve (EPA 1994).
Those taxa fitting the above description of what is considered to “occur at this site” can be further separated
on the basis of whether these organisms are “resident” or “transient” species. Resident taxa would include
organisms that use the stream habitat for functions such as reproduction, feeding, and/or refuge, which could
include migratory species. Transient taxa, on the other hand, would include organisms that are passively
moving through the site and do not use the stream habitat for above functions. A more detailed discussion on
the importance of differentiating between transient and resident taxa for the purpose of determining site-
specific water quality standards using the recalculation process is presented in Chapter 8. The species lists
presented here generally focus on resident species rather than transient species that occur at these sites.
2.2 UPDATING TAXONOMIC NOMENCLATURE
As the fish and invertebrate taxa lists were being compiled, some nomenclature changes to the original data
were necessary in order to keep the taxonomy of these groups current and to avoid inadvertent duplication of
taxa within the lists. Fish genus names in parentheses in the table below indicate those for which a taxonomic
change documented by the American Fisheries Society (Nelson et al. 2004) has occurred since the original
data were reported in their respective AWQC documents. These scientific name changes occurred to the
following fish species: the desert sucker (Catostomus clarkii – previously Pantosteus clarkii), red shiner
(Luxilus cornutus – previously Notropis cornutus), loach dace (Tiaroga cobitis – previously Rhinichthys
cobitis), blue tilapia (Oreochromis aurea – previously Tilapia aurea), Mossambique tilapia (Oreochromis
mossambicus – previously Tilapia mossambicus), walleye (Sander vitreus – previously Stizostedion vitreus),
and rainbow trout (Oncorhynchus mykiss – previously Salmo gairdneri).

Evaluation of the EPA Recalculation Procedure Technical Report in the Arid West 2-3 May 2006
As with the fish taxa list, some of the invertebrate taxa documented in the original studies required changes in
nomenclature to ensure that the taxa list reflected current taxonomy. In several cases, the genus names were
simply changed as new research revealed different taxonomic relationships within certain groups. The
following genus names were altered from how they were recorded in the original AWQC to maintain current
nomenclature (the previous names are in parenthesis): Girardia sp. (Dugesia sp., Smith 2001), Gloiobdella
elongata (Helobdella elongata), Ephemerella infrequens (E. dorothea, Jacobus and McCafferty 2003),
Libellula subornata (Plathemis subornata), Stictotarsus spp. (Deronectes spp.), Laccophilus maculosus
(L. decipiens), Hybomitrus minusculus (Tabanus minusculus), Caecidotea intermedius (Asellus intermedius),
Ceratopysche cockerelli (Hydropsyche cockerelli), Ceratopsyche oslari (Hydropsyche oslari), and
Paralauterborniella sp. (Apedilum sp.). In all cases that are not noted otherwise, these name changes were
verified via ITIS (2005).
Three other changes were made to the original invertebrate data to offset differences in identification levels
between the studies. For example, only one species of beetle belonging to the Hydroscaphidae family occurs
in North America - Hydroscapha natans (ITIS 2005). Therefore, data from studies that identified these
beetles at the family level were modified to reflect the species name as well. Similar changes to the original
data were also made to reflect that the Asian clam Corbicula fluminea and the amphipod Gammarus lacustris
are the single species within these genera that occur in these types of habitats in the arid West.
A few other minor changes were made to invertebrate nomenclature. The amphipod Hyalella azteca was
alternately identified as H. azteca and H. azteca cx. in various studies. All Hyalella were designated as
H. azteca in this effort to prevent any artificial inflation in taxa richness that would occur if a single species
were listed twice. Also, two taxa were listed as a combination of genera due to the difficulty in accurately
differentiating between the two: the gastropod Physa/Physella sp. and the dipteran Limnophora/Lispoides sp.
These data were simplified to reflect only the first genus name. Additionally, some changes were necessary
in the classification of taxa at the class, order, and family levels to maintain current taxonomic groupings.
2.3 COMPARISON OF RESIDENT FISH COMMUNITIES
A review of the literature available for the effluent-dependent stream sites chosen for this study produced a
composite fish species list containing a total of 75 taxa (Table 2-1). While fish sampling has been performed
on multiple occasions in San Timoteo Wash—which is a tributary to the Santa Ana River (see Appendix 1)—
no fish were collected. Hence, to simplify the presentation, it is not included in Table 2-1.

Evaluation of the EPA Recalculation Procedure Technical Report in the Arid West 2-4 May 2006
Table 2-1 Fish Taxa Reported from Studies of Effluent-Dependent Segments of the
Santa Ana River (including Chino Creek), Salt River/Gila River, Santa Cruz River, Fountain Creek, and the South Platte River
Santa Cruz River
Family Genus Species Common Name Santa Ana River
Chino Creek (Santa Ana
Basin)
Salt/Gila Rivers Near
Nogales Near
Tucson
Fountain Creek
South Platte River
Atherinopsidae Menidia beryllina Inland silverside X Clupeidae Dorosoma cepedianum Gizzard shad X petenense Threadfin shad X Catostomidae Carpiodes carpio River carpsucker X Catostomus catostomus Longnose sucker X X (Pantosteus) clarkii Desert sucker X X commersonii White sucker X X fumeiventris Owens sucker X insignis Sonora sucker X X
latipinnis Flannelmouth sucker X
santaanae* Santa Ana sucker X Xyrauchen texanus* Razorback sucker X Cyprinidae Agosia chrysogaster Longfin dace X X Campostoma anomalum Stoneroller X X Carassius auratus Goldfish X X X X Cyprinella lutrensis Red shiner X X X Cyprinus carpio Common carp X X X X X Gila elegans* Bonytail chub X intermedia Gila chub X orcuttii Arroya chub X robusta Roundtail chub X X Hybognathus hankinsoni Brassy minnow X placitus Plains minnow X
Luxilus (Notropis) cornutus Common shiner X
Meda fulgida Spike dace X Notropis dorsalis Bigmouth shiner X hudsonia Spottail shiner X stramineus Sand shiner X X Notemigonus crysoleucus Golden shiner X
Phenacobius mirabilis Suckermouth minnow X
Phoxinus eos Northern redbelly dace X
Pimephales promelas Fathead minnow X X X X X Plagopterus argentissimus Wound fin X Platygobio gracilis Flathead chub X
Ptychocheilus lucius Colorado pikeminnow X
Rhinichthys cataractae Longnose dace X X
Tiaroga (Rhinichthys) cobitis* Loach dace X
osculus Speckled dace X

Evaluation of the EPA Recalculation Procedure Technical Report in the Arid West 2-5 May 2006
Table 2-1 (Continued) Fish Taxa Reported from Studies of Effluent-Dependent Segments of the
Santa Ana River (including Chino Creek), Salt River/Gila River, Santa Cruz River, Fountain Creek, and the South Platte River
Santa Cruz River
Family Genus Species Common Name Santa Ana River
Chino Creek (Santa Ana
Basin)
Salt/Gila Rivers Near
Nogales Near
Tucson
Fountain Creek
South Platte River
Semotilus atromaculatus Creek chub X X Cyprinodontidae Cyprinodon macularius* Desert pupfish X
Fundulidae Fundulus sciadicus Plains topminnow X
zebrinus Plains killifish X X Poeciliidae Gambusia affinis Mosquitofish X X X X X X Poecilia sp. Mollies X latipinna Sailfin molly X X mexicana Shortfin molly X Poeciliopsis occidentalis* Gila topminnow X X Xiphophorus variatus Variable platyfish X
Gasterosteidae Culaea inconstans Brook stickleback X X
Centrarchidae Lepomis cyanellus Green sunfish X X X X X X X gibbosus Pumpkinseed X
humilis Orangespotted sunfish X
macrochirus Bluegill X X X X microlophus Rehear sunfish X Micropterus dolomieu Smallmouth bass X X salmoides Largemouth bass X X X X Pomoxis annularis White crappie X nigromaculatus Black crappie X X Cichlidae aurea Blue tilapia X
Oreochromis
(Tilapia) mossambicus Mozambique tilapia X X
Tilapia sp. Tilapia X X zillii Redbelly tilapia X Moronidae Morone mississippienisi Yellow bass X Percidae Etheostoma cragini Arkansas darter X exile Iowa darter X nigrum Johnny darter X Perca flavescens Yellow perch X
Sander (Stizostedion) vitreus Walleye X
Salmonidae Salmo trutta Brown trout X Cottidae Cottus asper Prickly sculpin X
Ictaluridae Ameiurus melas Black bullhead X X X X X X natalis Yellow bullhead X X X nebulosus Brown bullhead X Ictalurus punctatus Channel catfish X X X X Pylodictis olivaris Flathead catfish X
Number of Taxa 18 8 40 7 3 19 38 Number of Native Taxa 2 0 14 5 0 12 26
* = Threatened or endangered species.
Evaluation of the EPA Recalculation Procedure Technical Report in the Arid West 2-6 May 2006
Over 97% of the fish taxa have been identified to the species level, with the remaining taxa identified at the
genus level. The species list includes fish from a total of 15 families. The number of taxa collected at each
stream segment varied from only three fish taxa (all non-native) collected from sites on the Santa Cruz River
near Tucson to 40 fish taxa (14 native) historically collected from sites on the Salt/Gila Rivers. Note that of
these native species, only one, the razorback sucker, has been reported from this site since 1985 (Appendix 1),
presumably as a result of substantial habitat modifications over the years from Salt River Project dams and
flow modifications. The tables in Appendix 1 document the fish species native to each stream.
The only fish species collected historically at all seven locations (including the Chino Creek tributary of the
Santa Ana River) was the green sunfish, Lepomis cyanellus. This species may be native to some of the stream
segments (e.g., the Colorado streams), but is non-native in most of the arid West. Two other fish species were
collected at six of the seven sites: the introduced western mosquitofish, Gambusia affinis, which was
collected at all sites, except Fountain Creek, and the black bullhead, Ameiurus melas, which was collected at
all sites, except the Santa Cruz River below the Nogales WWTP. The common carp, Cyprinus carpio, and
the fathead minnow, Pimephales promelas, were collected at five of the seven sites, but were not collected in
the Santa Cruz River.
The remaining fish species included in Table 2-1 were more rare with respect to their distribution in these
streams, with 46 taxa (61% of the total number of taxa) collected at only one of the six stream locations. An
additional 18 taxa were collected at two locations only. Three locations had only two taxa.
Based on the differing geographic locations, native fish distributions, and pattern of fish introductions, species
composition could be expected to differ somewhat between sites. Therefore, fish community composition
was also compared at the genus level. The results were very similar to those seen at the species level of
identification. Out of 45 total genera collected, Lepomis was again the only genus of fish found at all sites,
with Ameiurus and Gambusia found at six of the seven locations. Five of the locations all had Cyprinus,
Micropterus, Catastomus, and Pimphales collected, and four of the sites had Ictalurus and Carassius
collected. As with the fish species, the majority of the genera (44%) were also unique to a single location.
2.3.1 Regional Comparisons of Fish Communities
Hierarchical cluster analysis, based on presence-absence fish data was conducted using the Number Cruncher
Statistical System (NCSS) statistical software package (Hintze 2004). Cluster analysis was used to compare
the species composition of the effluent-dependent streams to determine similarity in terms of the composition
of their fish populations. All native and introduced fish species collected at each site were used in this
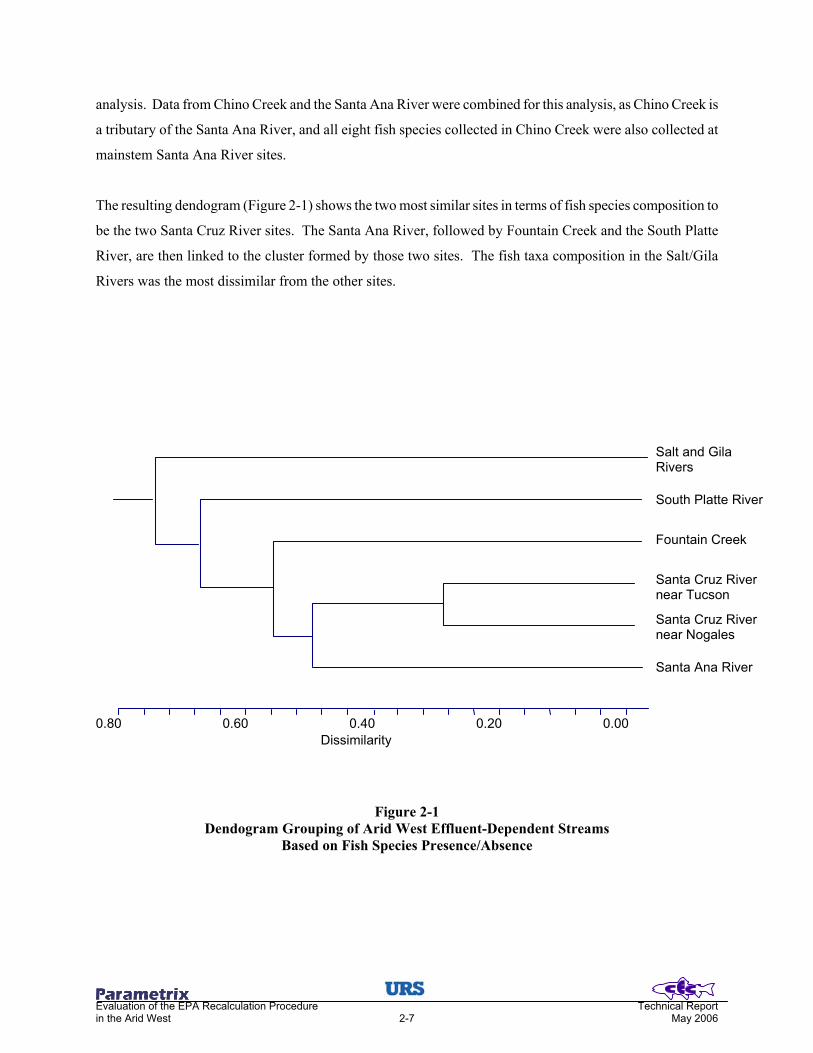
Evaluation of the EPA Recalculation Procedure Technical Report in the Arid West 2-7 May 2006
analysis. Data from Chino Creek and the Santa Ana River were combined for this analysis, as Chino Creek is
a tributary of the Santa Ana River, and all eight fish species collected in Chino Creek were also collected at
mainstem Santa Ana River sites.
The resulting dendogram (Figure 2-1) shows the two most similar sites in terms of fish species composition to
be the two Santa Cruz River sites. The Santa Ana River, followed by Fountain Creek and the South Platte
River, are then linked to the cluster formed by those two sites. The fish taxa composition in the Salt/Gila
Rivers was the most dissimilar from the other sites.
Figure 2-1 Dendogram Grouping of Arid West Effluent-Dependent Streams
Based on Fish Species Presence/Absence
0.80 0.60 0.40 0.20 0.00 Dissimilarity
Santa Ana River
Santa Cruz Rivernear Nogales
Santa Cruz Rivernear Tucson
Fountain Creek
South Platte River
Salt and GilaRivers
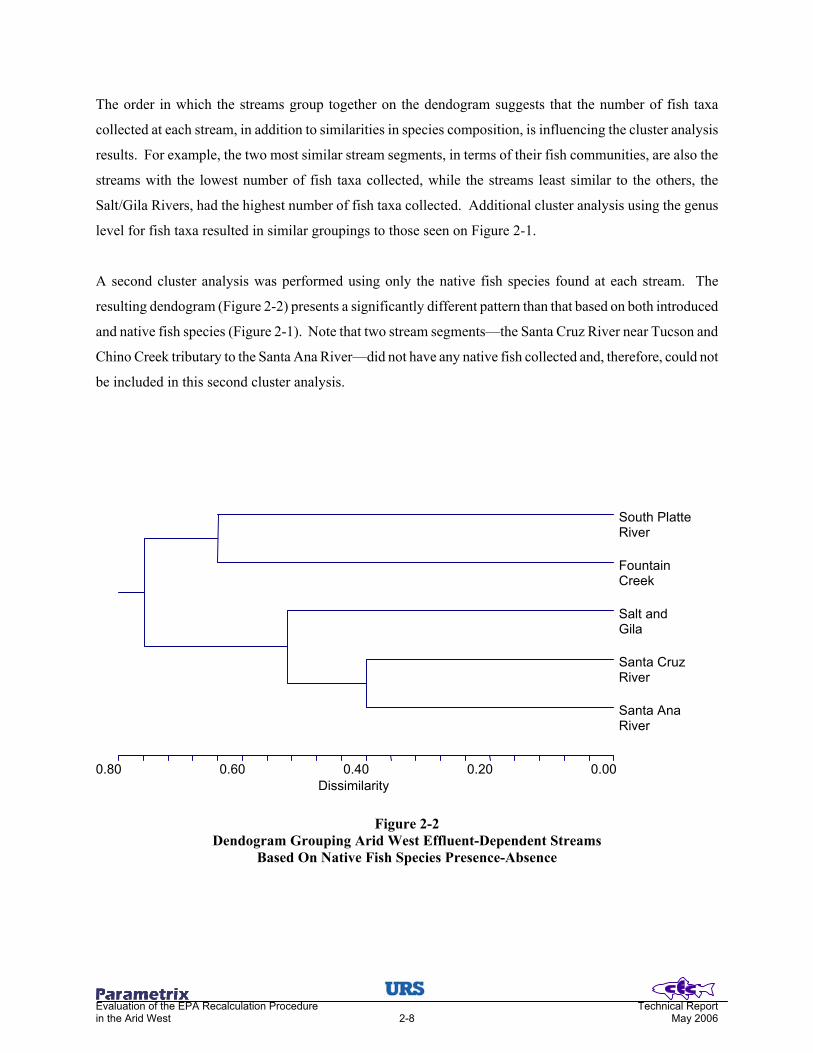
Evaluation of the EPA Recalculation Procedure Technical Report in the Arid West 2-8 May 2006
The order in which the streams group together on the dendogram suggests that the number of fish taxa
collected at each stream, in addition to similarities in species composition, is influencing the cluster analysis
results. For example, the two most similar stream segments, in terms of their fish communities, are also the
streams with the lowest number of fish taxa collected, while the streams least similar to the others, the
Salt/Gila Rivers, had the highest number of fish taxa collected. Additional cluster analysis using the genus
level for fish taxa resulted in similar groupings to those seen on Figure 2-1.
A second cluster analysis was performed using only the native fish species found at each stream. The
resulting dendogram (Figure 2-2) presents a significantly different pattern than that based on both introduced
and native fish species (Figure 2-1). Note that two stream segments—the Santa Cruz River near Tucson and
Chino Creek tributary to the Santa Ana River—did not have any native fish collected and, therefore, could not
be included in this second cluster analysis.
Figure 2-2
Dendogram Grouping Arid West Effluent-Dependent Streams Based On Native Fish Species Presence-Absence
0.80 0.60 0.40 0.20 0.00
Dissimilarity
Santa Ana River
Santa Cruz River
Salt and Gila
Fountain Creek
South Platte River

Evaluation of the EPA Recalculation Procedure Technical Report in the Arid West 2-9 May 2006
For the remainder of the streams, the two that were most similar in terms of native fish species composition
were the Santa Cruz River near Nogales and the Santa Ana River. The Salt/Gila Rivers then grouped with
that cluster – basically representing the southwestern streams in the study. The South Platte River and
Fountain Creek formed a separate cluster, indicating that the native fish communities found at those two sites
were relatively dissimilar to communities at the other three sites. These groupings were less influenced by
fish taxa richness and more influenced by geographic location, as expected due to historic/biogeographical
barriers (PCWMD 2002), representing the southwestern U.S. sites and the sites on the high plains.
2.4 COMPARISON OF RESIDENT INVERTEBRATE COMMUNITIES
A review of the available literature for the effluent-dependent streams chosen for this study produced a
composite invertebrate species list containing a total of 561 taxa (Table 2-2). Invertebrates were identified at
varying taxonomic levels in these studies, somewhat complicating comparisons between studies and between
sites. Of the taxa on the list, 31% were identified to the species level, 53% identified to the genus level, and
the the remaining 16% identified to the family level or higher.
Taxa belonging to 119 families from 31 orders were collected at one or more of the locations. The total
number of taxa collected over the period of record used in this analysis for each stream varied from 41 taxa
collected from the Santa Cruz River near Tucson to 282 taxa collected from the Santa Ana River.
As Chino Creek and San Timoteo Wash are both tributaries of the Santa Ana River, the data from these
creeks were included in the development of the list of resident species in the Santa Ana River. We believe this
is valid since the invertebrate community composition was highly similar between the tributaries and the
mainstem Santa Ana River - 80% and 88% of the taxa collected in Chino Creek and San Timoteo Wash,
respectively, were also collected in the Santa Ana River. Therefore, combining the tributary data with the
mainstem data led to little loss of information (in fact, potentially increased the list of potentially resident
species) and simplified results of subsequent analyses.
The only invertebrate identified at the species level that was found at all sites was the midge, Cricotopus
bicinctus. Additionally, the midge genus Chironomus was found at all sites, as well as several families or
classes of invertebrates, including the worms, Oligochaeta, Naididae, and Tubificidae, and the aquatic insects,
Baetidae, Coenagrionidae, Corixidae, Elmidae, Hydrophilidae, Diptera, Chironomidae, Psychodidae, and
Simuliidae.

Evaluation of the EPA Recalculation Procedure Technical Report in the Arid West 2-10 May 2006
Other invertebrate genera found in all stream locations, except the Santa Cruz River near Tucson, include the
snail Physa and a number of aquatic insects, Callibaetis, Argia, Rheotanytarsus, Cricotopus/Orthocladius,
and Culex. With few exceptions, the families common to most study streams were generally collected from
all locations, except the Santa Cruz River near Tucson or the Gila and Salt Rivers. The great majority of
invertebrates, 312 taxa (56% of the total number of taxa), were only collected at a single site. Additional 108
and 74 taxa were found at two and three of the sites, respectively.
Table 2-2 Invertebrate Taxa Reported from Studies of Effluent-Dependent
Segments of the Santa Ana River, Chino Creek, San Timoteo Wash, Salt River, Gila River, Santa Cruz River, Fountain Creek, and the South Platte River
Santa Ana Basin
Santa Cruz River
Phylum/Class Order/Family Genus Species
SantaAna
River Chino Creek
San Timoteo
Wash Salt/Gila Rivers
Near Nogales
Near Tucson
Fountain Creek
South Platte River
Bryozoa X Cnidaria
Hydrozoa Hydroida
X
Hydridae Hydra americana X Nematoda X X X X
Adenophorea Dorylaimida
Dorylaimidae Dorylaimus sp. X
Mermithida Mermithidae X
Nematomorpha X Nemertea X X X
Enopla Hoplonemertea
Tetrastemmatidae Prostoma sp. X X
Platyhelminthes Turbellaria X X X X X
Tricladida Planariidae sp. X X X X
Girardia (Dugesia)
dorotocephala X tigrina X X Polycelis coronata X
Macrostomida Macrostomidae Macrostomum sp. X
Annelida Clitellata (Subclass Hirudinae)
X X X X
Arhynchobdellidae Erpobdellidae X X
Dina dubia X Erpobdella punctata X X X X Mooreobdella fervida X microstoma X X X X
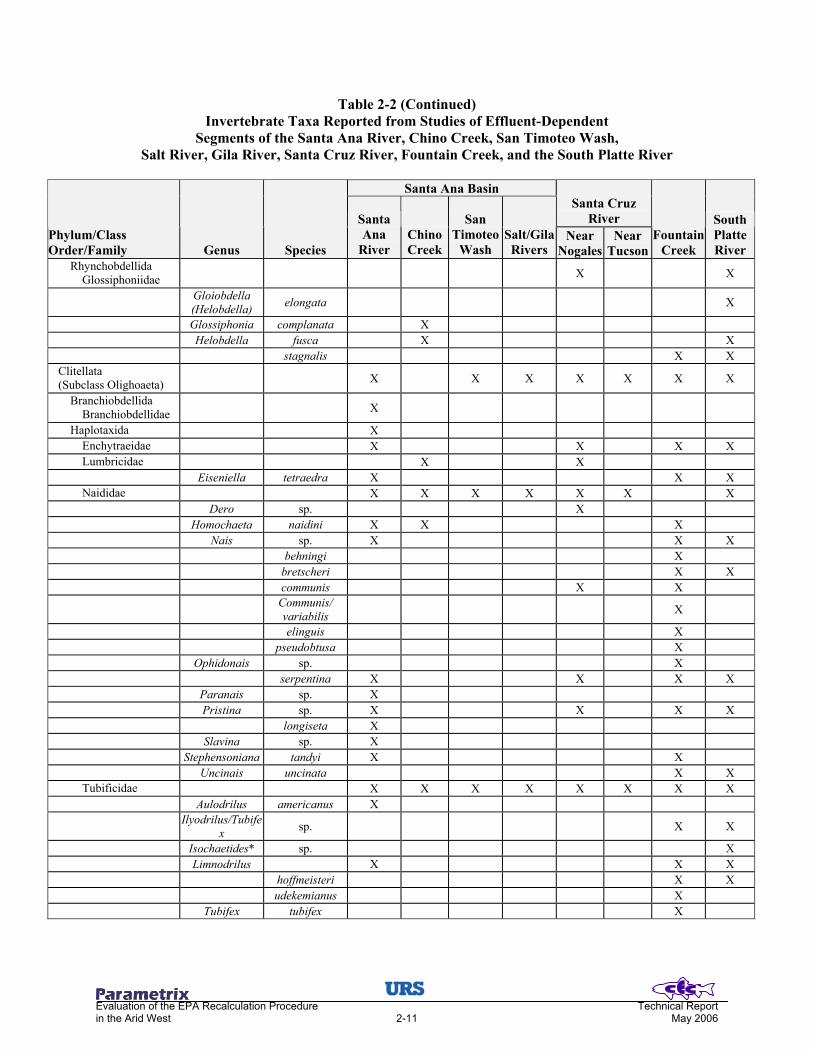
Evaluation of the EPA Recalculation Procedure Technical Report in the Arid West 2-11 May 2006
Table 2-2 (Continued) Invertebrate Taxa Reported from Studies of Effluent-Dependent
Segments of the Santa Ana River, Chino Creek, San Timoteo Wash, Salt River, Gila River, Santa Cruz River, Fountain Creek, and the South Platte River
Santa Ana Basin
Santa Cruz River
Phylum/Class Order/Family Genus Species
SantaAna
River Chino Creek
San Timoteo
Wash Salt/Gila Rivers
Near Nogales
Near Tucson
Fountain Creek
South Platte River
Rhynchobdellida Glossiphoniidae X X
Gloiobdella (Helobdella) elongata X
Glossiphonia complanata X Helobdella fusca X X stagnalis X X
Clitellata (Subclass Olighoaeta) X X X X X X X
Branchiobdellida Branchiobdellidae X
Haplotaxida X Enchytraeidae X X X X Lumbricidae X X
Eiseniella tetraedra X X X Naididae X X X X X X X
Dero sp. X Homochaeta naidini X X X Nais sp. X X X behningi X bretscheri X X communis X X
Communis/ variabilis X
elinguis X pseudobtusa X Ophidonais sp. X serpentina X X X X Paranais sp. X Pristina sp. X X X X longiseta X Slavina sp. X Stephensoniana tandyi X X Uncinais uncinata X X
Tubificidae X X X X X X X X Aulodrilus americanus X
Ilyodrilus/Tubifex sp. X X
Isochaetides* sp. X Limnodrilus X X X hoffmeisteri X X udekemianus X Tubifex tubifex X

Evaluation of the EPA Recalculation Procedure Technical Report in the Arid West 2-12 May 2006
Table 2-2 (Continued) Invertebrate Taxa Reported from Studies of Effluent-Dependent
Segments of the Santa Ana River, Chino Creek, San Timoteo Wash, Salt River, Gila River, Santa Cruz River, Fountain Creek, and the South Platte River
Santa Ana Basin
Santa Cruz River
Phylum/Class Order/Family Genus Species
SantaAna
River Chino Creek
San Timoteo
Wash Salt/Gila Rivers
Near Nogales
Near Tucson
Fountain Creek
South Platte River
Lumbriculida Lumbriculidae X X X
Eclipidrilus/ Rhynchelmis sp. X
Lumbriculus variegatus X X X Rhynchelmis sp. X
Polychaeta Aeolosomatida
Aeolosomatidae Aeolosoma sp. X
Mollusca Gastropoda X X X X X
Basommatophora Ancylidae Ferrissia sp. X X X
rivularis X Lymnaeidae X
Fossaria sp. X X Stagnicola sp. X
Physidae X X Physa sp. X X X X X X X Physella sp. X X X X
Planorbidae Gyraulus sp. X X X Menetus sp. X
Bivalvia X Veneroida
Corbidulidae X
Corbicula fluminea X X Pisidiidae Sphaerium sp. X
Arthropoda Arachnida
Acari X X X X
Eylaidae Eylais sp. X Hygrobatidae Atractides sp. X X Lebertiidae Lebertia sp. X Limnesiidae Limnesia sp. X
Tyrrellia sp. X X Sperchontidae Sperchon sp. X X
Sperchon/ Sperchonopsis sp. X X X
Unionicolidae Neumania sp. X Branchiopoda
Diplostraca** X X X X
Bosminidae Bosmina sp. X Chydoridae Alona costata X
Chydorus sphaericus X Kurzia latissima X

Evaluation of the EPA Recalculation Procedure Technical Report in the Arid West 2-13 May 2006
Table 2-2 (Continued) Invertebrate Taxa Reported from Studies of Effluent-Dependent
Segments of the Santa Ana River, Chino Creek, San Timoteo Wash, Salt River, Gila River, Santa Cruz River, Fountain Creek, and the South Platte River
Santa Ana Basin
Santa Cruz River
Phylum/Class Order/Family Genus Species
SantaAna
River Chino Creek
San Timoteo
Wash Salt/Gila Rivers
Near Nogales
Near Tucson
Fountain Creek
South Platte River
Daphnidae Ceriodaphnia sp. X Daphnia sp. X X X
Macrothricidae Macrothrix rosea X Moinidae Moina sp. X X X
micrurus X Malacostraca
Amphipoda X X
Gammaridae Gammarus lacustris X X X Hyalellidae Hyalella azteca X X X X
Decapoda Astacidae Pacifastacus leniusculus X X
Cambaridae X Orconectes sp. X Procambarus clarkii X X
Isopoda X X Asellidae Asellus sp. X X
Caecidotea sp. X X X communis X (Asellus) intermedius X Insecta
ollembola X X X X X
Entomobryidae Willowsia sp. X Hypogastruridae Hypogastrura sp. X X
Odontella sp. X Isotomidae Isotomurus sp. X
palustris X X tricolor X
Ephemeroptera X X Ameletidae Ameletus sp. X Baetidae X X X X X
Acentrella insignificans X X Apobaetis indeprensus X Baetis sp. X X X X sp. B X bicaudatus X X X X X magnus X tricaudatus X X X X X Callibaetis sp. X X X X X californicus X pictus X

Evaluation of the EPA Recalculation Procedure Technical Report in the Arid West 2-14 May 2006
Table 2-2 (Continued) Invertebrate Taxa Reported from Studies of Effluent-Dependent
Segments of the Santa Ana River, Chino Creek, San Timoteo Wash, Salt River, Gila River, Santa Cruz River, Fountain Creek, and the South Platte River
Santa Ana Basin
Santa Cruz River
Phylum/Class Order/Family Genus Species
SantaAna
River Chino Creek
San Timoteo
Wash Salt/Gila Rivers
Near Nogales
Near Tucson
Fountain Creek
South Platte River
Camelobaetidius sp. X similis X warreni X X Cloeodes macrolamellus X Fallceon quilleri X X X X X Labiobaetis sp. X X X Paracloeodes sp. X X X
Caenidae X Caenis sp. X X amica X
Ephemerellidae Ephemerella inermis X
dorothea (infrequens) X
Heptageniidae X X X Cinygmula sp. X Epeorus sp. X Heptagenia sp. X X
Leptophlebiidae X X
Paraleptophlebia sp. X X
Siphlonuridae Siphlonurus sp. X Tricorythidae Leptohyphes sp. X
Tricorythodes sp. X X X X X minutus X X X
Odonata (Anisoptera) X
Aeshnidae Aeshna sp. X Anax junius X
Corduliidae Neurocordulia sp. X Gomphidae X X X
Erpetogomphus sp. X Ophiogomphus sp. X X X severus X X Progomphus sp. X X borealis X X
Libellulidae X Brechmorhoga mendax X X X
Libellula (Plathemis) subornata X
Paltothemis sp. X lineatipes X X Pantala hymenaea X

Evaluation of the EPA Recalculation Procedure Technical Report in the Arid West 2-15 May 2006
Table 2-2 (Continued) Invertebrate Taxa Reported from Studies of Effluent-Dependent
Segments of the Santa Ana River, Chino Creek, San Timoteo Wash, Salt River, Gila River, Santa Cruz River, Fountain Creek, and the South Platte River
Santa Ana Basin
Santa Cruz River
Phylum/Class Order/Family Genus Species
SantaAna
River Chino Creek
San Timoteo
Wash Salt/Gila
Rivers Near
Nogales Near
Tucson Fountain
Creek
South Platte River
Odonata (Zygoptera) X X
Calopterygidae X X X Calopteryx sp. X Hetaerina sp. X X X americana X X
Coenagrionidae X X X X X X Amphiagrion sp. X Argia sp. X X X X X X X alberta X sedula X vivida X X Coenagrion sp. X resolutum X X
Coenagrion/ Enallagma sp. X X X X
Enallagma sp. X X X X Hesperagrion sp. X heterodoxum X Ischnura sp. X X X X Zoniagrion sp. X X
Lestidae Archilestes sp. X Plecoptera X
Capniidae X Chloroperlidae X
Alloperla sp. X Sweltsa sp. X X X Triznaka sp. X
Nemouridae X Amphinemura sp. X Zapada cinctipes X
Perlodidae X Isoperla sp. X fulva X
Pteronarcyidae Pteronarcella badia X Taeniopterygidae X
Taenionema sp. X Hemiptera X X X
Belostomatidae X X Abedus X X sp. 2 X herberti X Belostoma X X X flumineum X X
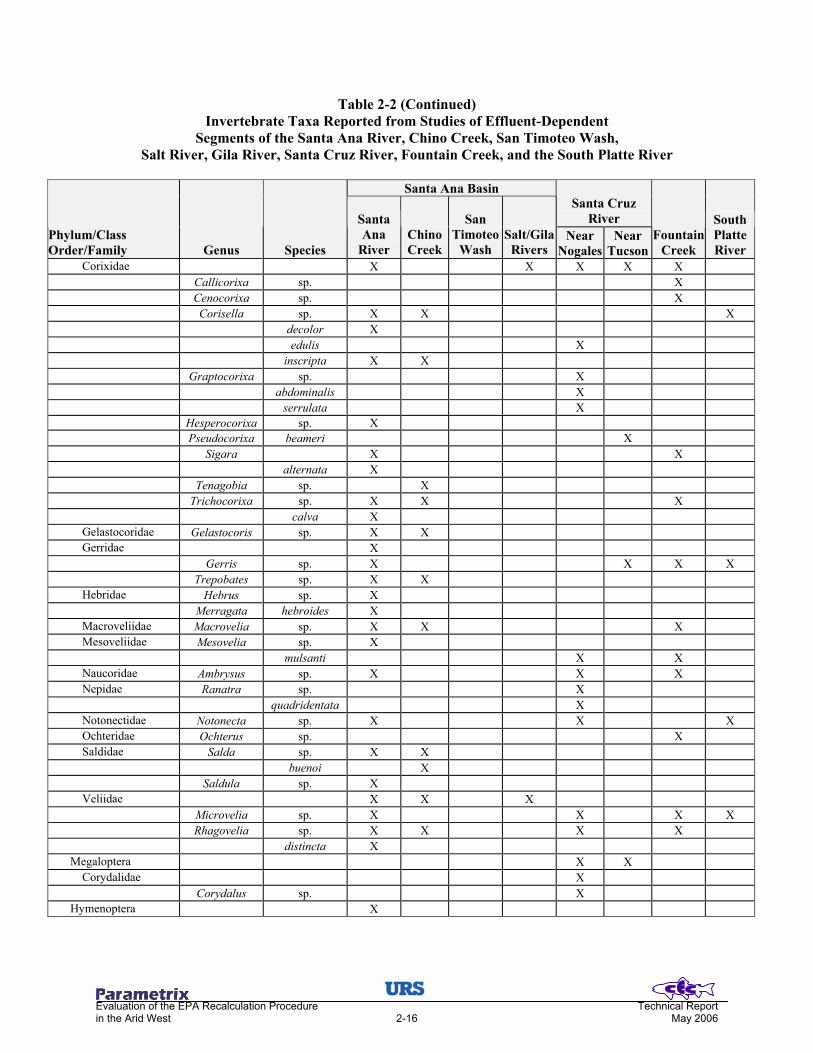
Evaluation of the EPA Recalculation Procedure Technical Report in the Arid West 2-16 May 2006
Table 2-2 (Continued) Invertebrate Taxa Reported from Studies of Effluent-Dependent
Segments of the Santa Ana River, Chino Creek, San Timoteo Wash, Salt River, Gila River, Santa Cruz River, Fountain Creek, and the South Platte River
Santa Ana Basin
Santa Cruz River
Phylum/Class Order/Family Genus Species
SantaAna
River Chino Creek
San Timoteo
Wash Salt/Gila
Rivers Near
Nogales Near
Tucson Fountain
Creek
South Platte River
Corixidae X X X X X Callicorixa sp. X Cenocorixa sp. X Corisella sp. X X X decolor X edulis X inscripta X X Graptocorixa sp. X abdominalis X serrulata X Hesperocorixa sp. X Pseudocorixa beameri X Sigara X X alternata X Tenagobia sp. X Trichocorixa sp. X X X calva X
Gelastocoridae Gelastocoris sp. X X Gerridae X
Gerris sp. X X X X Trepobates sp. X X
Hebridae Hebrus sp. X Merragata hebroides X
Macroveliidae Macrovelia sp. X X X Mesoveliidae Mesovelia sp. X
mulsanti X X Naucoridae Ambrysus sp. X X X Nepidae Ranatra sp. X
quadridentata X Notonectidae Notonecta sp. X X X Ochteridae Ochterus sp. X Saldidae Salda sp. X X
buenoi X Saldula sp. X
Veliidae X X X Microvelia sp. X X X X Rhagovelia sp. X X X X distincta X
Megaloptera X X Corydalidae X
Corydalus sp. X Hymenoptera X

Evaluation of the EPA Recalculation Procedure Technical Report in the Arid West 2-17 May 2006
Table 2-2 (Continued) Invertebrate Taxa Reported from Studies of Effluent-Dependent
Segments of the Santa Ana River, Chino Creek, San Timoteo Wash, Salt River, Gila River, Santa Cruz River, Fountain Creek, and the South Platte River
Santa Ana Basin
Santa Cruz River
Phylum/Class Order/Family Genus Species
SantaAna
River Chino Creek
San Timoteo
Wash Salt/Gila
Rivers Near
Nogales Near
Tucson Fountain
Creek
South Platte River
Coleoptera X Carabidae X Chrysomelidae Donacia sp. X Curculionidae X X X
Lixus sp. X Dryopidae X X
Helichus sp. X X suturalis X X Postelichus sp. X X X confluentus X immsi X X productus X
Dytiscidae X Agabus sp. X X X semivittatus X Agabinus sp. X Copelatus chevrolati X Desmopachria mexicana X Dytiscus sp. X X Hydaticus sp. X Hydroporus sp. X occidentalis X Hydrovatus sp. X Ilybius sp. X Laccophilus sp. X X X X fasciatus X
maculosus (decipiens) X X X
mexicanus X pictus X salvini X Liodessus sp. X affinis cx. X
Liodessus/ Neoclypeodytes sp. X
Oreodytes sp. X Rhantus sp. X X gutticollis X X sp. X
Stictotarsus (Deronectes) aequinoctialis X
corpulentus X funereus X X roffi X
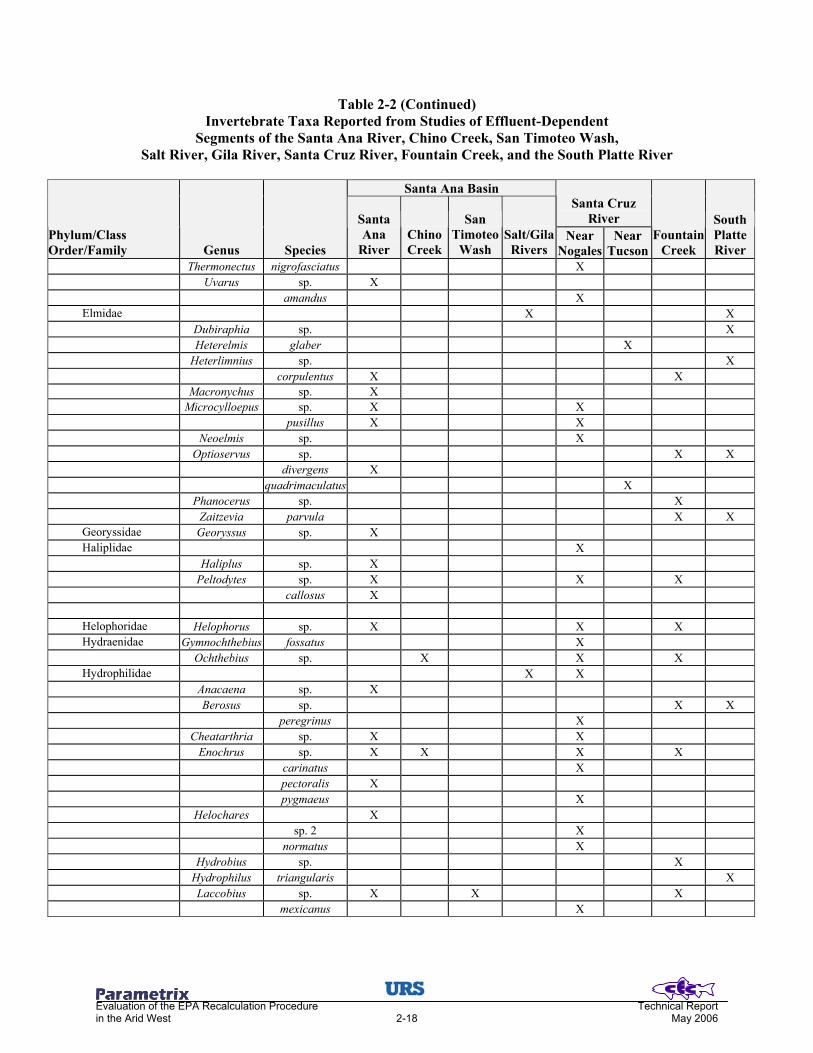
Evaluation of the EPA Recalculation Procedure Technical Report in the Arid West 2-18 May 2006
Table 2-2 (Continued) Invertebrate Taxa Reported from Studies of Effluent-Dependent
Segments of the Santa Ana River, Chino Creek, San Timoteo Wash, Salt River, Gila River, Santa Cruz River, Fountain Creek, and the South Platte River
Santa Ana Basin
Santa Cruz River
Phylum/Class Order/Family Genus Species
SantaAna
River Chino Creek
San Timoteo
Wash Salt/Gila
Rivers Near
Nogales Near
Tucson Fountain
Creek
South Platte River
Thermonectus nigrofasciatus X Uvarus sp. X amandus X
Elmidae X X Dubiraphia sp. X Heterelmis glaber X Heterlimnius sp. X corpulentus X X Macronychus sp. X Microcylloepus sp. X X pusillus X X Neoelmis sp. X Optioservus sp. X X divergens X quadrimaculatus X Phanocerus sp. X Zaitzevia parvula X X
Georyssidae Georyssus sp. X Haliplidae X
Haliplus sp. X Peltodytes sp. X X X callosus X
Helophoridae Helophorus sp. X X X Hydraenidae Gymnochthebius fossatus X
Ochthebius sp. X X X Hydrophilidae X X
Anacaena sp. X Berosus sp. X X peregrinus X Cheatarthria sp. X X Enochrus sp. X X X X carinatus X pectoralis X pygmaeus X Helochares X sp. 2 X normatus X Hydrobius sp. X Hydrophilus triangularis X Laccobius sp. X X X mexicanus X

Evaluation of the EPA Recalculation Procedure Technical Report in the Arid West 2-19 May 2006
Table 2-2 (Continued) Invertebrate Taxa Reported from Studies of Effluent-Dependent
Segments of the Santa Ana River, Chino Creek, San Timoteo Wash, Salt River, Gila River, Santa Cruz River, Fountain Creek, and the South Platte River
Santa Ana Basin
Santa Cruz River
Phylum/Class Order/Family Genus Species
SantaAna
River Chino Creek
San Timoteo
Wash Salt/Gila
Rivers Near
Nogales Near
Tucson Fountain
Creek
South Platte River
Paracymus sp. X X Tropisternus sp. X X X X X sp. 3 X ellipticus X X lateralis X X
Hydroscaphidae Hydroscapha natans X X Lampyridae X Noteridae Pronoterus sp. X Staphylinidae X
Stenus sp. X X Lepidoptera
Noctuidae Bellura sp. X
Pyralidae X X Crambus sp. X Parapoynx sp. X Petrophila sp. X X X
Trichoptera X Brachycentridae X
Brachycentrus americanus X occidentalis X
Glossosomatidae X Helicopsychidae Helicopsyche sp. X X
borealis X Hydropsychidae X X X
bronta X
Ceratopsyche (Hydropsyche) cockerelli X
oslari X slossonae X Cheumatopsyche sp. X X X Hydropsyche sp. X X X X X californica X X occidentalis X X
Hydroptilidae X X X Agraylea sp. X X Hydroptila sp. X X X X X icona X pecos X Leucotrichia sp. X X pictipes X Ochrotrichia sp. X X Orthotrichia sp. X Oxyethira sp. X
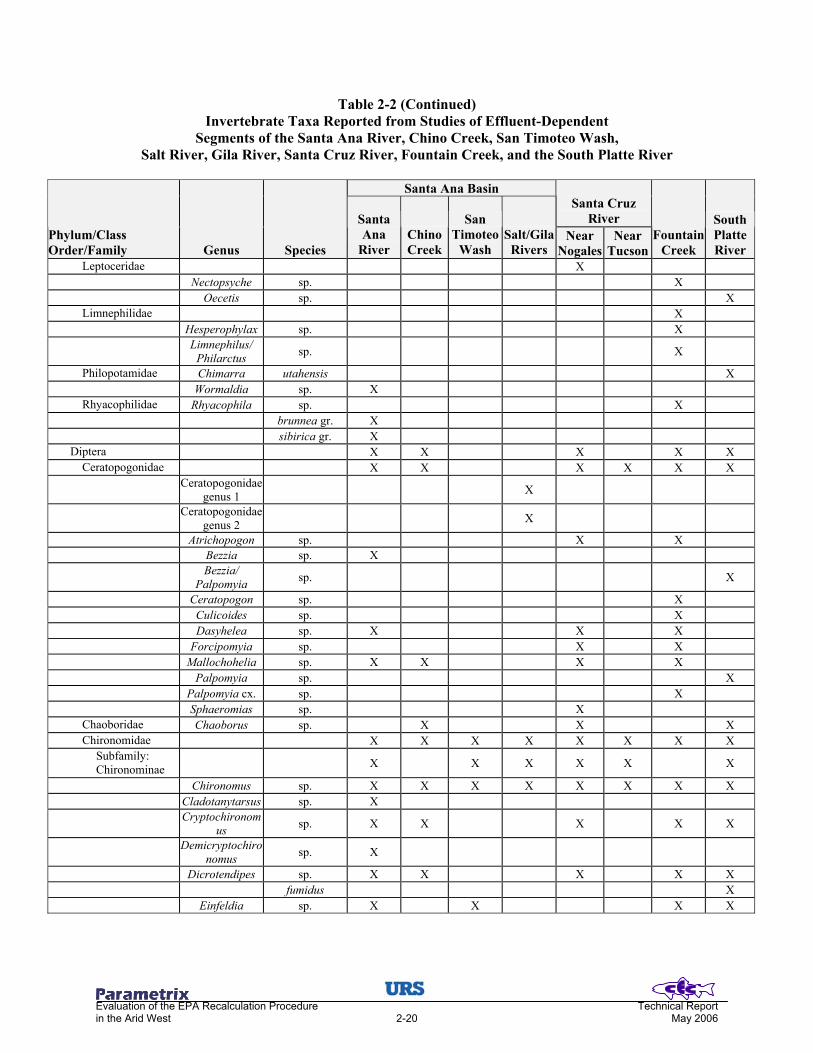
Evaluation of the EPA Recalculation Procedure Technical Report in the Arid West 2-20 May 2006
Table 2-2 (Continued) Invertebrate Taxa Reported from Studies of Effluent-Dependent
Segments of the Santa Ana River, Chino Creek, San Timoteo Wash, Salt River, Gila River, Santa Cruz River, Fountain Creek, and the South Platte River
Santa Ana Basin
Santa Cruz River
Phylum/Class Order/Family Genus Species
SantaAna
River Chino Creek
San Timoteo
Wash Salt/Gila
Rivers Near
Nogales Near
Tucson Fountain
Creek
South Platte River
Leptoceridae X Nectopsyche sp. X Oecetis sp. X
Limnephilidae X Hesperophylax sp. X
Limnephilus/ Philarctus sp. X
Philopotamidae Chimarra utahensis X Wormaldia sp. X
Rhyacophilidae Rhyacophila sp. X brunnea gr. X sibirica gr. X
Diptera X X X X X Ceratopogonidae X X X X X X
Ceratopogonidae genus 1 X
Ceratopogonidae genus 2 X
Atrichopogon sp. X X Bezzia sp. X
Bezzia/ Palpomyia sp. X
Ceratopogon sp. X Culicoides sp. X Dasyhelea sp. X X X Forcipomyia sp. X X Mallochohelia sp. X X X X Palpomyia sp. X Palpomyia cx. sp. X Sphaeromias sp. X
Chaoboridae Chaoborus sp. X X X Chironomidae X X X X X X X X
Subfamily: Chironominae X X X X X X
Chironomus sp. X X X X X X X X Cladotanytarsus sp. X
Cryptochironomus sp. X X X X X
Demicryptochironomus sp. X
Dicrotendipes sp. X X X X X fumidus X Einfeldia sp. X X X X

Evaluation of the EPA Recalculation Procedure Technical Report in the Arid West 2-21 May 2006
Table 2-2 (Continued) Invertebrate Taxa Reported from Studies of Effluent-Dependent
Segments of the Santa Ana River, Chino Creek, San Timoteo Wash, Salt River, Gila River, Santa Cruz River, Fountain Creek, and the South Platte River
Santa Ana Basin
Santa Cruz River
Phylum/Class Order/Family Genus Species
SantaAna
River Chino Creek
San Timoteo
Wash Salt/Gila
Rivers Near
Nogales Near
Tucson Fountain
Creek
South Platte River
Endochironomus sp. X X X Glyptotendipes sp. X X X X amplus X
Goeldichironomus sp. X
Lauterborniella sp. X X
Microchironomus sp. X
Micropsectra sp. X X X
Micropsectra/ Tanytarsus sp. X
Microtendipes sp. X X X X X Nilothauma sp. X Parachironomus sp. X X X X Paracladopelma sp. X X
Paralauterborni
ella (Apedilum)
sp. X X
Paratanytarsus sp. X X X X Paratendipes sp. X Phaenopsectra sp. X X X X Polypedilum sp. X X X X X convictum gr. X fallax gr. X illinoense gr. X
Pseudochironomus sp. X X X X
Rheotanytarsus sp. X X X X X X Saetheria sp. X X X X X Stempellinella sp. X
Stictochironomus sp. X X X
Tanytarsus sp. X X X X X X Tribelos sp. X
Subfamily: Diamesinae Diamesa sp. X X X
Pagastia sp. X Potthastia sp. X
Subfamily: Orthocladinae X X X X X X
Brillia sp. X X X Cardiocladius sp. X X X X Chaetocladius sp. X X Corynoneura sp. X X X X

Evaluation of the EPA Recalculation Procedure Technical Report in the Arid West 2-22 May 2006
Table 2-2 (Continued) Invertebrate Taxa Reported from Studies of Effluent-Dependent
Segments of the Santa Ana River, Chino Creek, San Timoteo Wash, Salt River, Gila River, Santa Cruz River, Fountain Creek, and the South Platte River
Santa Ana Basin
Santa Cruz River
Phylum/Class Order/Family Genus Species
SantaAna
River Chino Creek
San Timoteo
Wash Salt/Gila
Rivers Near
Nogales Near
Tucson Fountain
Creek
South Platte River
Cricotopus sp. X X X X X X bicinctus gr. X X X X X X X cylindraceus X festivellus X X fuscus X nostocicola X X X tremulus X X X X trifascia X X X
Cricotopus (Isocladius) sp. X
sylvestris X X X
Cricotopus/ Orthocladius sp. X X X X X X X
Doncricotopus sp. X X Endotribelos sp. X X hesperium X Eukiefferiella sp. X X X X brehmi gr. X
Claripennis gr. sp. A X
devonica X gracei gr. X pseudomontana X Euryhapsis sp. X Heleniella sp. X X Heterotrissocladius sp. X X Hydrobaenus sp. X X X X Limnophyes sp. X X X Mesosmittia sp. X Nanocladius sp. X X X X Orthocladius sp. X X X X X
Orthocladius (Euorthocladius) sp. X X X
Paracricotopus sp. X Parakiefferiella sp. X X Parametriocnemus sp. X X X X Parorthocladius sp. X Paraphaenocladius sp. X X X X Pseudosmittia sp. X X Rheocricotopus sp. X X X X X Rheosmittia sp. X Smittia sp. X

Evaluation of the EPA Recalculation Procedure Technical Report in the Arid West 2-23 May 2006
Table 2-2 (Continued) Invertebrate Taxa Reported from Studies of Effluent-Dependent
Segments of the Santa Ana River, Chino Creek, San Timoteo Wash, Salt River, Gila River, Santa Cruz River, Fountain Creek, and the South Platte River
Santa Ana Basin
Santa Cruz River
Phylum/Class Order/Family Genus Species
SantaAna
River Chino Creek
San Timoteo
Wash Salt/Gila Rivers
Near Nogales
Near Tucson
Fountain Creek
South Platte River
Synorthocladius sp. X Thienemanniella sp. X X X X X Tvetenia sp. X X X
Subfamily: Prodiamesinae Odontomesa sp. X
Prodiamesa sp. X Subfamily: Tanypodinae X X X
Ablabesmyia sp. X X X X Alotanypus sp. X Apsectrotanypus* sp. X Brundiniella sp. X X
Conchapelopia/ Thienemannmyia
gr. sp. X X
Labrundinia sp. X X Larsia sp. X X X X Natarsia sp. X Paramerina sp. X X X Pentaneura sp. X X X X X Procladius sp. X X X Radotanypus sp. X Tanypus sp. X
Thienemannimyia gr. sp. X X X X X X
Zavrelimyia sp. X X Culicidae X
Aedes sp. X X Anopheles sp. X Culex sp. X X X X X X
Dixidae Dixella sp. X X Dolichopodidae X X X X X
Hydrophorus agalma X Empididae X
Chelifera sp. X X Clinocera sp. X Hemerodromia sp. X X X X X Neoplasta sp. X Oreogeton sp. X Rhamphomyia sp. X
Ephydridae X X X X X Ephydra sp. X X Hydrellia sp. X Scatella sp. X

Evaluation of the EPA Recalculation Procedure Technical Report in the Arid West 2-24 May 2006
Table 2-2 (Continued) Invertebrate Taxa Reported from Studies of Effluent-Dependent
Segments of the Santa Ana River, Chino Creek, San Timoteo Wash, Salt River, Gila River, Santa Cruz River, Fountain Creek, and the South Platte River
Santa Ana Basin
Santa Cruz River
Phylum/Class Order/Family Genus Species
SantaAna
River Chino Creek
San Timoteo
Wash Salt/Gila
Rivers Near
Nogales Near
Tucson Fountain
Creek
South Platte River
Muscidae X X X X X Limnophora sp. X X X X X
Psychodidae X X X X X X Maruina sp. X Pericoma sp. X X X X X X
Pericoma/ Telmatoscopus sp. X
Psychoda sp. X X X X Ptychopteridae Bittacomorphella sp. X Sarcophagidae X Simuliidae X X X X X X X
Prosimulium sp. X X Simulium sp. X X X X X X arcticum X vittatum cx. X X X
Stratiomyidae X X Allognosta sp. X Caloparyphus sp. X X X X X Euparyphus sp. X X X X Nemotelus sp. X X Odontomyia sp. X X X Stratiomys sp. X
Syrphidae X Tabanidae X
Hybomitrus (Tabanus) minusculus X
Tabanus sp. X X X punctifer X
Tanyderidae X Protanyderus sp. X margarita X
Tipulidae X X X Antocha sp. X X Dicranota sp. X Erioptera sp. X X X Gonomyia sp. X X X Hexatoma sp. X Limonia sp. X X X Ormosia sp. X X Rhabdomastix sp. X Tipula sp. X X X X
Total Number of Invertebrate Taxa 282 101 42 44 211 41 253 192 NOTES: *Identification was uncertain in the original documentation. **Diplostracans (cladocerans) are generally considered to be transient organisms in lotic systems.

Evaluation of the EPA Recalculation Procedure Technical Report in the Arid West 2-25 May 2006
0.80 0.60 0.40 0.20 0.00 Dissimilarity
Santa Ana River
Santa Cruz River near Nogales
Fountain Creek
South Platte River
Salt and Gila Rivers
Santa Cruz River near Tucson
We should note that we did include cladocerans in this listing, since they were collected from some of the
stream sites. Cladocerans are generally considered to be transient organisms in lotic systems (Hynes 2001)
and were likely present in these effluent-dependent sites as a result of outflows from wastewater treatment
ponds/lagoons (a phenomenon we have observed in stream systems throughout the west).
As with the fish data, hierarchical cluster analysis was used to compare the invertebrate community at the arid
West effluent-dependent study sites. Figure 2-3 shows the dendogram resulting from the cluster analysis of
all invertebrate taxa at these sites as identified to the family level or higher. Based on this dendogram, taxa
composition of sites on the Salt/Gila Rivers and the Santa Cruz River near Tucson are the most similar in taxa
composition and are clustered by themselves. The Santa Cruz River near Nogales and Fountain Creek form
the base of the second cluster, with the South Platte River and the Santa Ana River also grouped with these
two sites.
Figure 2-3
Dendogram Grouping Arid West Effluent-Dependent Streams Based on Invertebrate Family Presence-Absence
As with the fish cluster analysis using all fish taxa, the grouping of the invertebrate communities in these
streams seems to be highly influenced by the number of invertebrate families collected at each location and
the similarity in the families found at the sites. The two most similar streams, the Santa Cruz River near
Tucson and the Gila and Salt Rivers, both had 33 invertebrate taxa identified at the family level or higher,
while the remaining streams forming the second cluster had between 67 and 98 invertebrate taxa identified at
the family level or higher.

Evaluation of the EPA Recalculation Procedure Technical Report in the Arid West 2-26 May 2006
Various other cluster analyses were attempted using the invertebrate data, including analyses at the genus and
species level of identification. The dendogram on Figure 2-4 resulted from a cluster analysis using
invertebrate genus level data only from the most taxonomically rich class, Insecta (81% of all taxa listed in
Table 2-2 are in the class Insecta). In this dendogram (Figure 2-4), the Salt/Gila Rivers and the Santa Cruz
River near Tucson were again the most similar streams with respect to their invertebrate community
composition, as well as being the streams with the lowest number of insect taxa collected (25 and 32 taxa,
respectively, when identified at the genus level). However, the rest of the streams did not form a separate
cluster as they did on Figure 2-3.
Instead, the South Platte River was then grouped with the cluster formed by the Salt/Gila Rivers and the Santa
Cruz River near Tucson, followed in order by the grouping of the Santa Cruz River near Nogales, and
Fountain Creek, with the Santa Ana River the last to join the cluster. As was seen previously, the number of
taxa still seems to have strongly influenced the arrangement of the streams on the dendogram, with the stream
most dissimilar to the others (the Santa Ana River) also having the highest number of taxa collected in the
class Insecta. Notably, the regional clusters observed with native fish were not consistent with those observed
with invertebrates.
Figure 2-4 Dendogram Grouping Arid West Effluent-Dependent Streams
Based on Genera Collected at Each Site in the Class Insecta
0.80
0.60 0.40 0.20 0.00 Dissimilarity
Santa Ana River
Salt and Gila Rivers
Santa Cruz River near Tucson
South Platte River
Santa Cruz River near Nogales
Fountain Creek
Evaluation of the EPA Recalculation Procedure Technical Report in the Arid West 2-27 May 2006
2.5 SUMMARY OF FINDINGS
The species composition lists for the streams chosen to represent effluent-dependent streams in the arid West
show that the majority of the fish and invertebrate taxa listed were only collected at a single site. Few fish or
invertebrate taxa were common to all or most of these sites, which is a finding that is not necessarily
unexpected given the broad geographic range of the study streams. However, those taxa that are common to
these streams could potentially represent resident taxa in arid West effluent-dependent streams in any future
toxicity testing conducted specifically for the purpose of adding data to the current toxicity databases.
The cluster analysis results for both fish and invertebrate communities seem to be strongly influenced by taxa
richness at a site. With only presence/absence data used (and the only data available in some cases),
eliminating this influence would be difficult. Additionally, differences in the number of studies, the number
of years studied, and methods used in those studies is probably affecting the number of taxa collected at each
site—particularly with the invertebrate data—and hence, the clustering observed. For example, when all
studies were combined, the Gila and Salt Rivers had the highest number of fish species of the seven sites, yet
the invertebrate list includes a disproportionately low number of taxa (Tables 2-1 and 2-2). The invertebrate
data compiled for the Gila and Salt rivers came mainly from studies that sampled only over brief periods of
time at one or a few sites, in comparison to other locations such as the South Platte River, Fountain Creek,
and the Santa Ana River, which have data compiled from studies that sampled consistently at more than one
stream site over several years (Appendix 1). Also, the protocol for many of the invertebrate studies for the
Salt/Gila Rivers only required identification of invertebrates to the family level or above. Both of these
factors could be responsible for limiting the number of taxa listed for the Salt/Gila Rivers.
The species lists for other locations, particularly the Santa Cruz River near Tucson, indicates that the fish and
invertebrate populations at these sites are impoverished and have been so historically. The Santa Cruz River
near Tucson had only 8% of the number of fish taxa and 21% of the number of invertebrate taxa collected as
were found in the South Platte River. As the Santa Cruz River had been completely dry through this area for
several years until the WWTP restored it to perennial flow in 1977 (Harding Lawson & Associates 1986), the
biological populations would naturally not be expected to be as diverse as those found at some of the other
sites with long-term perennial (even if effluent-dependent) flow.
In contrast, sites such as the South Platte River and Fountain Creek have fish and invertebrate communities
that seem somewhat similar based on species composition, as might be expected due to their close geographic
locations. While these similarities were not particularly highlighted in all cluster analyses, examining the
species lists for both sites indicates that the two streams are relatively similar in terms of their fish and

Evaluation of the EPA Recalculation Procedure Technical Report in the Arid West 2-28 May 2006
invertebrate community composition. When taxa lists for the two streams were combined, 39% of the fish
taxa and 32% of the invertebrate taxa were found at both sites. This was the highest percent similarity seen
between any of the study sites, with the exception of the similarity between the Santa Ana River and its
tributary, Chino Creek. Water quality standards applicable to both effluent-dependent stream sections would
be more likely in such scenarios.
Finally, the fish and invertebrate taxa lists provided in Tables 2-1 and 2-2, respectively, provide a list of
resident taxa for the recalculation effort described later in this document.
2.6 LITERATURE CITED
Harding Lawson & Associates. 1986. Site-Specific Water Quality Criteria Study for the Santa Cruz River, Pima County, Arizona. Report prepared for the Pima County Wastewater Management Department.
Hintze, J. 2004. NCSS and PASS - Number Cruncher Statistical System, Kaysville Utah. Hynes, H.B.N. 2001. The Ecology of Running Waters. Reprint of First Edition (1970). The Blackburn
Press, Caldwell, New Jersey. Integrated Taxonomic Information System. 2005. ITIS On-Line Database. http://www.itis.usda.gov.
Accessed September 12, 2005. Jacobus, L.M., and W.P. McCafferty. 2003. “Revisionary Contributions to North American Ephemerella
and Serratella (Ephemeroptera: Ephemerellidae).” Journal of New York Entomological Society 111(4):174-193.
Nelson, J.S., E.J. Crossman, H. Espinosa-Perez, L.T. Findley, C.R. Gilbert, R.N. Lea, and J.D. Williams.
2004. Common and Scientific Names of Fishes from the United States, Canada, and Mexico. Special Publication 29. American Fisheries Society, Bethesda, MD.
Pima County Wastewater Management Department. 2002. Habitat Characterization Study: Final Report.
Prepared in support of the Arid West Water Quality Research Project by Camp Dresser & McKee, in association with URS, Chadwick Ecological Consultants, Inc., EPG (Environmental Planning Group), and Risk Sciences.
Smith, D.G. 2001. Pennak’s Freshwater Invertebrates of the United States. Fourth Edition. John Wiley &
Sons, Inc., NY. U.S. Environmental Protection Agency. 1994. Interim Guidance on Determination and Use of Water-Effect
Ratios for Metals. EPA-823-B-94-001. Office of Water, Washington, DC.
Evaluation of the EPA Recalculation Procedure Technical Report in the Arid West 3-1 May 2006
3.0 ALUMINUM CRITERIA REVIEW AND UPDATE
3.1 INTRODUCTION
The EPA established national aquatic life criteria for aluminum in a 1988 report entitled Ambient Water
Quality Criteria for Aluminum (EPA 1988), hereafter referred to as the 1988 Aluminum Document. This
document established a working toxicity database with recommended ambient water quality criteria (AWQC)
to protect freshwater organisms. Since publication of this report information on the environmental
significance of freshwater organism aluminum exposure and available toxicity studies has increased. This
section summarizes the status of the technical review of the freshwater aluminum AWQC as the initial step
for inclusion in the Arid West Water Quality Research Project AWQC Recalculation Project.
3.2 BACKGROUND
Aluminum (Al) is the most abundant metal and the third most abundant element in the earth’s crust. Acid
rain deposition has dramatically increased the amount of Al appearing in many biological systems, increasing
exposure of soluble Al to aquatic species. Other anthropogenic sources include wastewater effluent (from
pharmaceuticals, cooking practices, water supplies, and Al sulfate (alum) flocking of drinking water supplies
or phosphorus removal in effluent), burning of coal and hydrocarbons, and suspension of fine dusts during
agricultural practices.
Aluminum water solubility is a function of pH. In the neutral pH range, the thermodynamic stability of Al
hydroxide, or gibbsite (Al(OH)3), controls solubility with little monomeric Al3+ in solution. Monomeric Al3+
becomes more available relative to gibbsite at pH <4.7 and pH >9. At circumneutral pH range, total Al is
usually much greater than monomeric species (Gensemer and Playle 1999). Al solubility is also dependent on
organic compounds in solution. At circumneutral pH ranges, dissolved organic matter, and especially weak
organic acids (e.g., fulvic, citric, and humic acids), increase Al solubility while decreasing aquatic organism
toxicity. This is an important transport mechanism in Al cycling (Schlesinger 1997).
These complex speciation and complexation kinetics raise issues of how to measure Al in natural water and/or
toxicity test media. Filtration and ion exchange resins are used to separate monomeric dissolved Al from
particulate and polymeric forms (Van Benschoten and Edzwald 1990). Rapid speciation of Al in test
solutions can be a potential problem when determining solid and dissolved species. Analytical and technical
issues when characterizing dissolved from total Al in complex solutions are limited using kenetic modeling.
Many authors use theoretical calculations such as REDEQL (Morel and Morgan 1972) and later replaced by
MINEQL (Environmental Research Software, Hullowell, ME) that model speciation in relation to water

Evaluation of the EPA Recalculation Procedure Technical Report in the Arid West 3-2 May 2006
quality parameters and total Al measurements (Lamb and Bailey 1981, Cleveland et al 1989, and Lacroix et
al. 1993). Given these physical and methodological issues, it is recommended that these toxicity values for Al
be regarded as total Al (EPA 1988).
The speciation and/or complexation of Al is highly dependent on ambient water quality characteristics and
ultimately determine the mechanism of toxicity. Wilkinson and Campbell (1993) demonstrated the difficulty
of determining Al speciation in complex solutions—such as natural waters with abundant DOC and silicic
acid—when determining mechanisms of toxicity in fish. The primary target of Al toxicity is damage to
respiratory organs, such as fish gills (Lacroix et al. 1993). The chemical conditions at the gill surface are
thought to modify Al speciation and sorption. Water passing over the gills can become more basic due to
nutrilization of acidic water by NH3, This can lead to precipitation and polymerization of Al, resulting in Al
deposition on the gill surface. Accumulation of Al on the gill surface epithelium and/or mucous layer has
been shown to enhance rates of sloughing and hyperplasia of lamellae (Leivestad 1982). The ionoregulatory
vs. respiratory effects of Al on fish are pH-dependent, with the former predominating at relatively acidic pH
(Gensemer and Playle 1999). Additionally, concentration of calcium in the water was shown to decrease
toxic effects to fish (Muniz and Leivestad 1980). Calcium reduces Al toxicity by competing with monomeric
Al binding to negitivly charged fish gills and by keeping tight junctions between epithelial cells intact
(Gensemer and Playle 1999).
The number of toxicity tests addressing Al toxicity in aquatic invertebrates is considerably less when
compared to fish, but, in general, results indicate invertebrates are less sensitive than fish (Sparling 1996).
Mechanisms of toxicity are confounded by H+ toxicity when testing at low pH, but published evidence
supports ionoregulatory effects of Al exposure. Different H+ exchange mechanisms in different invertebrates
can have different impacts on their pH-dependent Al toxicity (Gensemer and Playle 1999). Havens (1990)
identified significant accumulation of particulate Al on ionoregulatory and respiratory surfaces in cladocerans.
Additionally, increased membrane permeability with subsequent ion loss has been reported in acid sensitive
invertebrate species (Locke 1991). In mayflies, Al accumulation on respiratory surfaces reduced oxygen
consumption due to physical blockage of gill chambers (Rockwood et al. 1990).
From our understanding of Al toxicity, we can identify two distinctly different mechanisms of toxicity. The
first mechanism is a physical suffocation or irritation caused by particulate Al exposure, or from precipitation
in the gill microenvironment (see Gensemer and Playle 1999), leading to hypoxia-related toxic effects that
often become manifest during acute exposure senerios. The second mechanism is driven by dissolved
monomeric Al species that disrupt ionic regulation, an effect expected with a chronic exposure regimen

Evaluation of the EPA Recalculation Procedure Technical Report in the Arid West 3-3 May 2006
(although acute effects could also be observed at acidic pH). Given Al speciation and behavior in complex
solutions, the mechanism responsible for toxicity will probably be dependent on pH and calcium
concentration of a given solution. Therefore, understanding Al speciation chemistry and its influence on the
mechanisms of toxicity to fish and invertebrates are important to interpreting the toxicological studies which
form the basis of AWQC development.
3.3 PHASE I- TECHNICAL REVIEW OF 1988 ALUMINUM DOCUMENT
Phase I of the evaluation of the 1988 Aluminum Document consisted of a thorough investigation of the data
used to calculate the most recent Al criteria. This document was critically reviewed for relevance of the
toxicological data and adherence to EPA methodology (Stephan et al. 1985).
3.3.1 Existing Acute Criteria for Aluminum
The 1988 Aluminum Document (EPA 1988) presents acute data for 14 genera, including seven species of
invertebrates and seven species of fish. These 14 species in 11 families satisfy the “eight-family rule” as
specified in the 1985 Guidelines. The 1988 Aluminum Document reports a FAV of 1,496 µg/L with a CMC
= FAV/2 of 750 µg/L. When referencing reported values used in criteria development, Chadwick Ecological
Consultants (CEC) identified an apparent discrepancy regarding the SMAV for Girardia (= Dugesia) tigrina.
The authors of the toxicity test reported that the greatest Al exposure concentration of for this species was
16,000 µg/L (Brooke 1985) with the ambient acute value of >16,800 µg/L. However, the 1988 Aluminum
Document reports >23,000 µg/L for the same species and reference. The implications of this discrepancy
could be significant and would result in a Girardia GMAV rank change from 6th to 4th. Charles Stephen
(pers. comm. to David Moon, December 13, 2004) has since noted that no G. tigrina died at 16,000 µg/L, so
it was reasonable to assume that the LC50 was potentially two times the concentration that caused a low level
of acute mortality. The geometric mean of 16,000 µg/L and 32,000 µg/L was reported for Girardia to
account for the undefined test value. Nonetheless, the undefined value (>16,000 µg/L) is probably more
appropriate, when compared to more recent evidence reported by Calevro et al. (1998) that tested Al toxicity
in G. etrusca. The authors’ results showed that this species showed lethality, abnormal mucus production,
and decreased regeneration at concentrations near 16,000 µg/L. Therefore, we replaced the existing >23,000
value with the originally reported value of >16,000 µg/L.
3.3.2 Existing Chronic Criteria for Aluminum
The 1988 Aluminum Document presents chronic data for three genera of freshwater organisms, including two
species of invertebrates and one fish species. These three species do not satisfy the “eight-family rule” as

Evaluation of the EPA Recalculation Procedure Technical Report in the Arid West 3-4 May 2006
specified in the 1985 Guidelines. The chronic database assemblage did, however, satisfy the minimal
requirements for calculation of an ACR in that one of the invertebrates is an acutely sensitive species.
After calculation of three valid ACRs for the three species, it was evident that the most acutely sensitive
species had lower ACRs. Given this relationship, a final ACR (FACR) was calculated using acutely sensitive
Ceriodaphnia dubia, which resulted in a FACR that was less than 2, which then defaults to 2 according to
USEPA guidance (Stephan et al. 1985). A FACR of 2 would result in a chronic criterion equal to the acute.
However, additional information on Al toxicity for Salvelinus fontinalis and Morone saxatilis (Cleveland et
al. manuscript and Buckler et al. manuscript) were used by the EPA to modify the FCV to protect these two
species (EPA 1988). These two studies were deemed inappropriate for the Al chronic database (i.e., they are
listed in Table 5-6, “Other Data on Effects of Aluminum on Aquatic Organisms”), but were still used to
reduce the FCV from ~750 to 87 µg/L. Therefore, the 1988 Aluminum Document recommended a Criteria
Chronic Concentration (CCC) of 87 µg/L at which no M. saxatilis died after a seven-day exposure (Buckler et
al. manuscript). In the same toxicity test, 174.4 µg/L killed 58% of the fish. Current practice would be to
calculate the chronic value as the geometric mean of these two numbers, or 122 µg/L.
3.4 PHASE II – UPDATE TO THE NATIONAL ALUMINUM CRITERIA DATABASE
A comprehensive literature review was conducted of Al aquatic toxicity related documents used and not used
in the 1988 Aluminum Document. This included a review of documents published since the 1988 Aluminum
Document, as well as those published prior to 1988 that were not used in criterion derivation. Available Al
documents were obtained and reviewed for relevance of toxicological data and adherence to EPA criteria
development methodology (Stephen et al. 1985).
A pH range of 6.5 to 9.0 was established as a limit for data used in the update of the Al toxicity databases,
because the EPA has established this as an acceptable range for pH in ambient freshwater (EPA 1976). This
circumneutral pH gradient was the same range used to derive current criteria in the 1988 Aluminum
Document. From the discussion on Al speciation above, we would thus expect that toxic effects of Al in test
media of circumneutral pH could be attributed to exposure to non-monomeric Al species. Additionally,
reported total Al measurements should be substantially greater than dissolved measurements owing to the
poor solubility of Al under these pH conditions. Approximately 120 papers were reviewed, including
documents cited in the 1988 Aluminum Document.
Much of the research into Al toxicity in aquatic organisms has been concerned with toxicity of Al in acidic
solutions – specifically in research investigating effects of acid rain – with very few studies addressing toxic

Evaluation of the EPA Recalculation Procedure Technical Report in the Arid West 3-5 May 2006
effects at circumneutral pH. Published reports that tested aquatic organism toxicity at circumneutral pH
solutions often did so as part of tests over a wider range of acidic pH values. For example, a common
experimental design in published Al toxicity studies was limiting the number of treatments and replicates at
higher pH values to focus on lower pH values where Al is soluble and hence, more toxic. This experimental
design resulted in very few data points with usable LC50s or EC50s (based from a narrow dose response). In
addition, given that most available research was conducted to test toxicity over a pH range, rather than over
an Al concentration gradient, reportable end points were often “greater than” values. Undefined values were
added to the toxicity database judiciously, if they could be corroborated by additional sources of published
evidence, and after careful consideration of author’s qualitative effect descriptions. This aided in development
of an updated Al AWQC database that did not ignore potentially important toxicity data.
3.4.1 New Aluminum Acute Toxicity Data
Following review of available studies, 36 acute data points from 15 studies (Table 3-1) were deemed suitable
for addition to the revised acute database. Of the 15 studies added to the database, five were published prior
to the 1988 Aluminum Document. All five of these studies published prior to the 1988 Aluminum Document
were not cited in either Table 1, Acute Toxicity of Aluminum to Aquatic Animals, or Table 6, Other Data on
Effects of Aluminum on Aquatic Organisms of the 1988 Aluminum Document and apparently represent data
that were unknown to the EPA.
Of the 15 studies examined and accepted for database revision, three studies provided data for three species
that are within the top four most sensitive genera in the revised database (Salmo salar, Miropterus dolomieu,
and Asellus aquaticus). Hamilton and Haines (1995) tested Al toxicity in S. salar alevins using 96-hr static
renewal exposures in reconstituted very soft water (hardness 6.8 mg/L CaCO2) at a pH of 6.5. Test organisms
were not fed, and total Al measurements were used to determine a 96-hr LC50. Martin and Holdich (1986)
performed acute toxicity tests with A. aquaticus to a variety of heavy metals, including Al. Static renewal test
exposures were conducted in soft water (hardness 50 mg/L CaCO2) at a pH of 6.75. Reported results included
96-hr LC50s for both species. Kane and Rabeni (1987) provided an undefined acute value for M. dolomieu.
At the reported toxicity value, Al-treated larva showed heavy mucous accumulations and were not active.
These observations were deemed appropriate for accepting this species in the acute database.

Evaluation of the EPA Recalculation Procedure Technical Report in the Arid West 3-6 May 2006
Table 3-1 Summary of Reviewed Publications with Reported Acute Aluminum Data
that were Deemed Acceptable According to 1985 Guidelines (Stephen et al. 1985) for Addition to the Updated Aluminum Acute Database
Species Method
Hardness (mg/L
CaCO3) pH LC50
(µg/L) Reference Ictalurus punctatus F, M 23.1 6.5 >400 Palmer et al. 1988 Ictalurus punctatus F, M 23.1 7.5 >400 Palmer et al. 1988 Oncorhynchus mykiss S, U 1 7 3,800 Thomsen et al. 1988 Oncorhynchus mykiss S, U 150 7 71,000 Thomsen et al. 1988 Oncorhynchus mykiss F, M 25 7.6 <8,000 Gundersen et al. 1994 Oncorhynchus mykiss F, M 45 7.6 <8,000 Gundersen et al. 1994 Oncorhynchus mykiss F, M 85 7.6 <8,000 Gundersen et al. 1994 Oncorhynchus mykiss F, M 125 7.6 <8,000 Gundersen et al. 1994 Oncorhynchus mykiss F, M 23.2 8.25 6,170 Gundersen et al. 1994 Oncorhynchus mykiss F, M 35 8.25 6,170 Gundersen et al. 1994 Oncorhynchus mykiss F, M 83.6 8.29 7,670 Gundersen et al. 1994 Oncorhynchus mykiss F, M 115.8 8.29 6,930 Gundersen et al. 1994 Pimephales promelas F, M 21.6 6.5 >400 Palmer et al. 1989 Pimephales promelas F, M 21.6 7.5 >400 Palmer et al. 1989 Pimephales promelas F, M 21.6 6.5 >400 Palmer et al. 1989 Pimephales promelas F, M 21.6 7.5 >400 Palmer et al. 1989 Pimephales promelas F, M 23.1 6.5 >400 Palmer et al. 1988 Pimephales promelas F, M 23.1 7.5 >400 Palmer et al. 1988 Pimephales promelas S, M 26 7.8 1,160 ENSR 1992b Pimephales promelas S, M 46 7.6 8,180 ENSR 1992b Pimephales promelas S, M 96 8.1 20,300 ENSR 1992b Pimephales promelas S, M 194 8.1 44,800 ENSR 1992b Crangonyx pseudogracilis S, U 50 6.75 9,190 Martin and Holdich 1986 Asellus aquaticus S, U 50 6.75 4,370 Martin and Holdich 1986 Gammarus pulex S, U -- 6.9 >2,698 Storey et al. 1992 Ceriodaphnia dubia S, M 26 7.5 720 ENSR 1992a Ceriodaphnia dubia S, M 46 7.6 1,880 ENSR 1992a

Evaluation of the EPA Recalculation Procedure Technical Report in the Arid West 3-7 May 2006
Table 3-1 (Continued) Summary of Reviewed Publications with Reported Acute Aluminum Data
that were Deemed Acceptable According to 1985 Guidelines (Stephen et al. 1985) for Addition to the Updated Aluminum Acute Database
Species Method
Hardness (mg/L
CaCO3) pH LC50
(µg/L) Reference Ceriodaphnia dubia S, M 96 7.8 2,450 ENSR 1992a Ceriodaphnia dubia S, M 194 8.1 >99,600 ENSR 1992a Ceriodaphnia dubia S, M 98.5 7.6 2,880 Soucek et al. 2001 Ceriodaphnia sp. S, M 47.4 7.36 2,300 Call 1984 Cyclops viridis S, U -- 6.9 >2,698 Storey et al. 1992 Micropterus dolomieu S, M 12.45 7.5 >1,000 Kane and Rabeni 1987 Salmo salar S, M 6.8 6.5 599 Hamilton and Haines 1995Salvelinus fontinalis F, M -- 6.5 3,600 Decker and Menendez 1974Hybognathus amarus S, M 140 8.1 >59,100 Buhl 2002 NOTES: S = static renewal test exposures F = flow through test exposure M = test media aluminum concentration was measured U = test media aluminum concentration was not measured
Water quality parameters in toxicity tests were added to the updated Al database in addition to test results.
Test solution pH and hardness values were needed to determine inclusion of data within the specified
circumneutral pH range and to investigate a possible hardness-toxicity relationship. Most of the added studies
reported hardness values of test media or reported calcium and magnesium concentrations that were used to
calculate water hardness. Of the 35 new acute data points, three provided insufficient information on water
quality parameters to determine test media hardness. Unfortunately, each was for a unique species (Salvelinus
fontinalis, Cyclops viridis, and Gammarus pulex) found in the updated database that was subsequently
removed during FAV derivation (see discussion below).
3.4.2 New Aluminum Chronic Toxicity Data
Following review of these studies, 11 chronic data points from nine studies (Table 3-2) were added to the
revised chronic database. Of the nine studies added to the database, seven were published prior to the 1988
Aluminum Document. Three studies published prior to the 1988 Aluminum Document were not cited in
either Table 1 (“Chronic Toxicity of Aluminum to Aquatic Animals”) or Table 6 (“Other Data on Effects of
Aluminum on Aquatic Organisms”) of the 1988 Aluminum Document and apparently represent data that were
unknown to the EPA at the time.
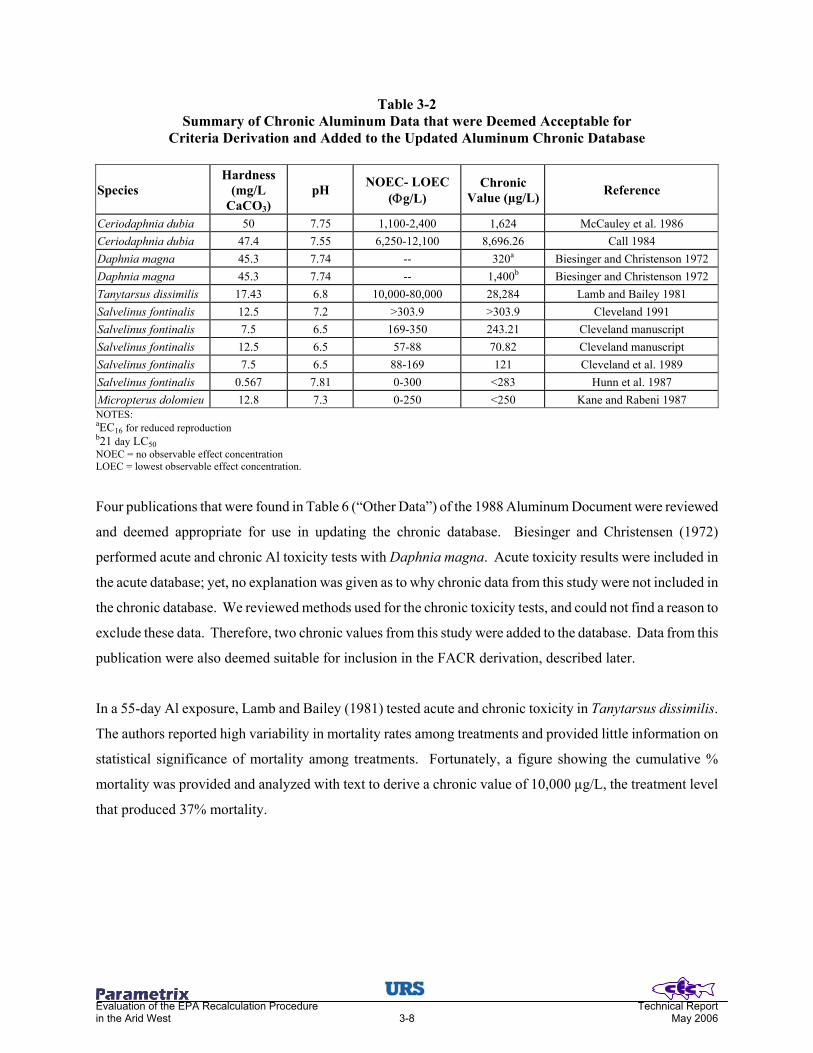
Evaluation of the EPA Recalculation Procedure Technical Report in the Arid West 3-8 May 2006
Table 3-2 Summary of Chronic Aluminum Data that were Deemed Acceptable for
Criteria Derivation and Added to the Updated Aluminum Chronic Database
Species Hardness
(mg/L CaCO3)
pH NOEC- LOEC(Φg/L)
Chronic Value (µg/L) Reference
Ceriodaphnia dubia 50 7.75 1,100-2,400 1,624 McCauley et al. 1986 Ceriodaphnia dubia 47.4 7.55 6,250-12,100 8,696.26 Call 1984 Daphnia magna 45.3 7.74 -- 320a Biesinger and Christenson 1972 Daphnia magna 45.3 7.74 -- 1,400b Biesinger and Christenson 1972 Tanytarsus dissimilis 17.43 6.8 10,000-80,000 28,284 Lamb and Bailey 1981 Salvelinus fontinalis 12.5 7.2 >303.9 >303.9 Cleveland 1991 Salvelinus fontinalis 7.5 6.5 169-350 243.21 Cleveland manuscript Salvelinus fontinalis 12.5 6.5 57-88 70.82 Cleveland manuscript Salvelinus fontinalis 7.5 6.5 88-169 121 Cleveland et al. 1989 Salvelinus fontinalis 0.567 7.81 0-300 <283 Hunn et al. 1987 Micropterus dolomieu 12.8 7.3 0-250 <250 Kane and Rabeni 1987 NOTES: aEC16 for reduced reproduction b21 day LC50 NOEC = no observable effect concentration LOEC = lowest observable effect concentration.
Four publications that were found in Table 6 (“Other Data”) of the 1988 Aluminum Document were reviewed
and deemed appropriate for use in updating the chronic database. Biesinger and Christensen (1972)
performed acute and chronic Al toxicity tests with Daphnia magna. Acute toxicity results were included in
the acute database; yet, no explanation was given as to why chronic data from this study were not included in
the chronic database. We reviewed methods used for the chronic toxicity tests, and could not find a reason to
exclude these data. Therefore, two chronic values from this study were added to the database. Data from this
publication were also deemed suitable for inclusion in the FACR derivation, described later.
In a 55-day Al exposure, Lamb and Bailey (1981) tested acute and chronic toxicity in Tanytarsus dissimilis.
The authors reported high variability in mortality rates among treatments and provided little information on
statistical significance of mortality among treatments. Fortunately, a figure showing the cumulative %
mortality was provided and analyzed with text to derive a chronic value of 10,000 µg/L, the treatment level
that produced 37% mortality.
Evaluation of the EPA Recalculation Procedure Technical Report in the Arid West 3-9 May 2006
The Cleveland manuscript, used to lower the 1988 Aluminum Document FCV, contained additional data for
Salvelinus fontinalis that were not reported in the EPA chronic databases. CEC added these additional
chronic values into the revised chronic database. S. fontinalis were exposed to Al in soft water with a pH of
6.5, the lowest pH in the acceptable circumneutral range. The chronic value was determined for a statistical
difference in length (growth) and mortality. The growth value was more sensitive than mortality (243 µg/L)
and resulted in a chronic value of 70 µg/L. Hunn et al. (1987) investigated influence of pH and Al on early
life stages of developing S. fontinalis. Only two treatments, the control and 283 µg/L, were used in a 60-day
larvae toxicity test using flow through exposure with very soft water. The authors reported a statistical
decrease in growth (p<0.001) between treatment and control using a least squares deviation linear model with
interaction terms representing treatment effects. Since a geometric mean could not be determined, a chronic
value of <283 µg/L was added to the revised chronic database.
Five additional studies with appropriate toxicity tests were found that were not listed in the 1988 Aluminum
Document. Three of these publications were published after the 1988 Aluminum Document. Cleveland et al.
(1991) performed a 56-day Al exposure in S. fontinalis to examine effects on bioaccumulation, growth, and
mortality. The authors reported 1% mortality in the 7.2 pH treatment at the end of the exposure period at a
measured mean Al concentration of 303.88 µg/L, which resulted in an undefined chronic value of
>303.88 µg/L. Although test duration was four days short of the recommended 60 days for a chronic test with
this species, we decided that test methods were acceptable and suitable for use. In a chapter of a book on
environmental chemistry and toxicology of Al, Cleveland (1989) reported another chronic value for
S. fontinalis. The authors used similar methods as in prior toxicity tests with this species and Al. After a
60-day exposure at a mean pH of 6.5, statistical differences in growth were observed. The result of this
partial life cycle test, that started exposures with embryos, was the lowest chronic value added to the chronic
database.
The remaining three studies entered into the updated chronic database were published prior to the 1988, but
were not cited in the 1988 Aluminum Document. McCauley et al. (1986) performed two acute and chronic
toxicity tests using C. dubia with different pH exposure media. The 1988 document used only one of the
chronic values from a test with a pH of 7.15, but did not report the second test that was conducted at a pH of
7.61. The chronic value that was added to the updated database was from this second test. Extensive acute
data were provided by Call (1984) from the University of Wisconsin Center for Lake Superior Environmental
Studies laboratory, with addition of a chronic toxicity test using Ceriodaphnia sp. After an eight-day Al
exposure, statistical differences in survival and reproduction were observed in the 12,100 µg/L treatment
(lowest-observed-effect concentration [LOEC]). The updated chronic database value was derived by taking
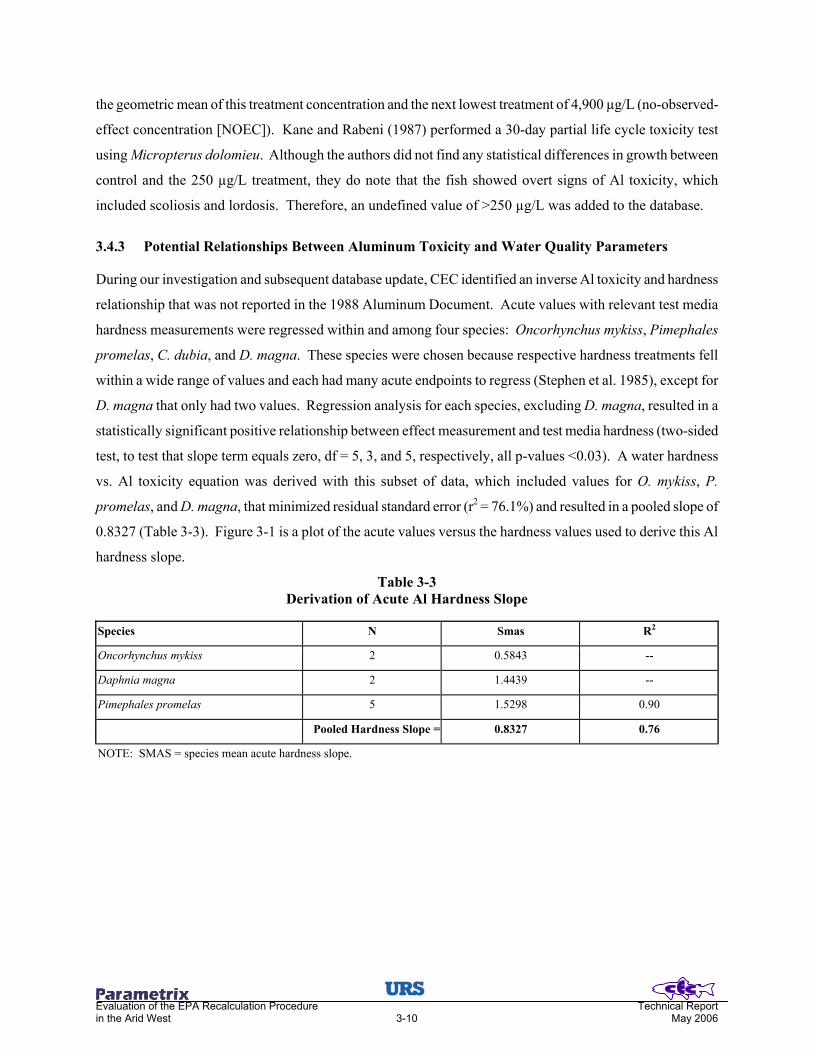
Evaluation of the EPA Recalculation Procedure Technical Report in the Arid West 3-10 May 2006
the geometric mean of this treatment concentration and the next lowest treatment of 4,900 µg/L (no-observed-
effect concentration [NOEC]). Kane and Rabeni (1987) performed a 30-day partial life cycle toxicity test
using Micropterus dolomieu. Although the authors did not find any statistical differences in growth between
control and the 250 µg/L treatment, they do note that the fish showed overt signs of Al toxicity, which
included scoliosis and lordosis. Therefore, an undefined value of >250 µg/L was added to the database.
3.4.3 Potential Relationships Between Aluminum Toxicity and Water Quality Parameters
During our investigation and subsequent database update, CEC identified an inverse Al toxicity and hardness
relationship that was not reported in the 1988 Aluminum Document. Acute values with relevant test media
hardness measurements were regressed within and among four species: Oncorhynchus mykiss, Pimephales
promelas, C. dubia, and D. magna. These species were chosen because respective hardness treatments fell
within a wide range of values and each had many acute endpoints to regress (Stephen et al. 1985), except for
D. magna that only had two values. Regression analysis for each species, excluding D. magna, resulted in a
statistically significant positive relationship between effect measurement and test media hardness (two-sided
test, to test that slope term equals zero, df = 5, 3, and 5, respectively, all p-values <0.03). A water hardness
vs. Al toxicity equation was derived with this subset of data, which included values for O. mykiss, P.
promelas, and D. magna, that minimized residual standard error (r2 = 76.1%) and resulted in a pooled slope of
0.8327 (Table 3-3). Figure 3-1 is a plot of the acute values versus the hardness values used to derive this Al
hardness slope.
Table 3-3 Derivation of Acute Al Hardness Slope
Species N Smas R2
Oncorhynchus mykiss 2 0.5843 --
Daphnia magna 2 1.4439 --
Pimephales promelas 5 1.5298 0.90
Pooled Hardness Slope = 0.8327 0.76
NOTE: SMAS = species mean acute hardness slope.

Evaluation of the EPA Recalculation Procedure Technical Report in the Arid West 3-11 May 2006
-2.5 -2 -1.5 -1 -0.5 0.5 1 1.5
-3
-2
-1
1
2
3
In (n
orm
aliz
ed a
cute
val
ue)
In (normalized hardness) Figure 3-1
Scatter Plot of Al Toxicity and Water Hardness Values used to Derive the Al Hardness Slope
Based on this relationship, the Al toxicity data were subsequently normalized to hardness 50 mg/L using this
slope, and an acute AWQC equation was developed to incorporate the protective effect of hardness, a proxy
for calcium.
Additional water quality parameters such as pH also affect aquatic organism Al toxicity. The pH of a solution
is a major driver of Al speciation. Over the range of EPA acceptable circumneutral pH values, we could
expect that the fraction of monomeric Al in solution will change, most notably at lower (~6.5) and greater pH
values (~9). Freeman and Everhart (1989) demonstrated an increase of Al toxicity in rainbow trout from a pH
of 7 to 9 using the same concentration and experimental methods. They reported that test organisms showed
immediate shock and heavy mortalities within the first 48 hours at a test solution pH of 9.0, effectively
terminating the 45-day test after 113 hours. Although there was an apparent pH relationship within the EPA
range, we could not develop a significant toxicity relationship with pH. Attempts to develop such an equation
were hindered by limited studies conducted for any species at a range of pH values. In fact, the greatest pH
value in the database is 8.29, at which no increased toxicity was apparent. Available data points at lower pH
values ~6.5 for some taxa indicate that increased toxicity occurs at the lower end of the EPA recommended
range. This trend provided qualitative evidence of a water quality toxicity relationship in some organisms.
However, this relationship is not significant within, or consistent between, an acceptable sample of organisms
in the updated database.

Evaluation of the EPA Recalculation Procedure Technical Report in the Arid West 3-12 May 2006
3.5 PHASE III - RECALCULATION OF AWQC FOR ALUMINUM
Data discovered and screened during phase II of this project were used to update and revise the Al acute and
chronic database. The revised database was then used to derive a potentially updated acute and chronic
AWQC for Al to protect freshwater aquatic organisms.
3.5.1 Updated Acute Database
Not all of the new acute data added to the database contained enough water quality information to use in
derivation of the recommended updated Al AWQC. Effects data without reported hardness water quality
parameters of test water were not used to generate a revised FAV since data values could not be normalized to
hardness of 50 mg/L. Table 3-4 summarizes data used for calculation of the recommended updated acute Al
AWQC. The updated acute database contains values for 17 genera, including 10 species of invertebrates, and
nine species of fish, increased from 14 genera in the existing criteria document. These 19 species in 14
families satisfy the “eight-family rule” as specified in the 1985 Guidelines.
Addition of new species data and normalization of acute values changed three of the four most sensitive
genera when compared to the 1988 Aluminum Document. The rank of the most sensitive genus
(Ceriodaphnia) in the updated database is unchanged and its reported acute value changed very little after
hardness correction. The 1988 Aluminum Document database ranked Salvelinus as the second ranked genus.
This value was based on one study in which hardness was not measured (Decker and Menendenz 1974).
Since the effect endpoint could not be normalized for hardness, this value was not included in the updated
database. As a result, Salmo replaced Salvelinus as the second ranked genus in the updated database. The
normalized value for Salmo was very similar to Salvelinus, so this deletion and addition process was not
particularly influential in updating the FAV. The updated 3rd and 4th ranked genera, Micropterus and Asellus,
replaced Oncorhynchus and Gammarus of the 1988 Aluminum Document. These updated values were lower
with a range closer to the first two genera, resulting in reduced variability between the four most sensitive
genera.

Evaluation of the EPA Recalculation Procedure Technical Report in the Arid West 3-13 May 2006
Table 3-4 Proposed Final Aluminum Acute Database, with Species Mean Acute Values (SMAV),
Normalized to Hardness = 50 mg/L, and Ranked by Genus Mean Acute Value (GMAV)
Rank Species Common Name Method GMAV (µg/L) SMAV (µg/L)
18 Tanytarsus dissimilis Midge S, U 192,155 192,155 17 Lepomis cyanellus Green sunfish S, M 52,274 52,274 16 Perca flavescens Yellow perch S, M 52,064 52,064 15 Ictalurus punctatus Channel catfish S, M 50,078 50,078 14 Physa sp. Snail S, M 32,907 32,907 Oncorhynchus mykiss Rainbow trout F, M 10,835
13 Oncorhynchus tschawytscha Chinook salmon S, M 26,502 64,825 12 Hybognathus amarus Minnow S, M 25,075 25,075 11 Acroneuria sp. Stonefly S, M 23,628 23,628 10 Gammarus pseudolimnaeus Amphipod S, M 23,000 23,000 9 Girardia tigrina Flatworm S, M 17,355 17,355 8 Pimephales promelas Fathead minnow S, M 13,461 13,461 7 Tubifex tubifex Worm S, U 13,373 13,373 6 Daphnia magna Cladoceran S, U 10,890 10,890 5 Crangonyx pseudogracilis Amphipod S, U 9,190 9,190 4 Asellus aquaticus Isopod S, U 4,370 4,370 3 Micropterus dolomieu Smallmouth bass S, M 3,183 3,183 2 Salmo salar Atlantic salmon S, M 3,154 3,154 Ceriodaphnia dubia Cladoceran S, M 2,466
1 Ceriodaphnia sp. Cladoceran S, M 2,741 3,046 NOTES: S = static renewal test exposures. F = flow through test exposure. M = test media aluminum concentration was measured. U = test media aluminum concentration was not measured.
3.5.2 Updated Chronic Database
The revised and updated Al chronic toxicity database presents data for six genera of freshwater organisms,
including three species of invertebrates and three species of fish (Table 3-5). These six species found in five
families do not satisfy the “eight-family rule” as specified in the 1985 Guidelines. The chronic database
assemblage does, however, satisfy the minimal requirements for calculation of a FACR.
Table 3-5 Proposed Final Aluminum Chronic Values (SMCV), with Hardness
Normalized (50 µg/L), and Ranked by Genus Mean Chronic Values (GMCV)
Rank Species Common Name SMCV (µg/L) GMCV (µg/L) 6 Tanytarsus dissimilis Midge 68,021 68,021 5 Ceriodaphnia dubia Cladoceran 4,165 4,165 4 Pimephales promelas Fathead minnow 957 957 3 Micropterus dolomieu Smallmouth bass 777 777 2 Salvelinus fontinalis Brook trout 624* 624* 1 Daphnia magna Cladoceran 274 274
*GMCV was calculated without the undefined chronic value reported by Hunn et al. (1987)

Evaluation of the EPA Recalculation Procedure Technical Report in the Arid West 3-14 May 2006
The revised FACR was derived from three SMACRs, using in the revised and updated chronic toxicity
databases. Each ACR was determined from paired acute and chronic values within the same study using
similar dilution water (Table 3-6). The respective SMACR used to derive the FACR were 0.98 (C. dubia),
10.65 (P. promelas), and 12.04 (D. magna). Including the Biesinger and Christensen (1972) data in the D.
magna SMACR calculation (two values tested at hardness = 45.3) resulted in a substantially lower SMACR
for this species than reported in the 1988 Aluminum Document (50.47). Although one chronic value
measured a less sensitive endpoint that was not used in the SMCV calculation (Table 3-5), both values were
retained in the FACR calculation to provide a better estimate SMACR for D. magna. These data resolved the
previous problem noted in the 1988 Aluminum Document associated with taking a geometric mean from a
wide range of results. In general, the inclusion of more chronic data resulted in a better sample of ACRs, in
which values ranged roughly within a factor of 10 from one another. Because the EPA was lacking data to
legitimately generate a FACR using multiple SMACRs, the FACR was set to the lowest organism then
defaulted to 2.0. We feel that using a multiple SMACR approach is an improvement over the EPA’s FACR
estimate, which was not used to derive the final chronic criteria because it was not protective of organisms
within the chronic database. The revised FCV derived from the revised FACRis expected to be protective to
every organism in the chronic database, when corrected for hardness.
Table 3-6 Preliminary Updated Aluminum Final Acute-Chronic Ratio (FAVR)
Species Hardness
(CaCO3 mg/L) Chronic Value
(µg/L) Acute Value
(µg/L) ACR SMACR Daphnia magna 220 742.2 38,200 51.486 Daphnia magna 45.3 1,400a 3,900 2.7857 Daphnia magna 45.3 320b 3,900 12.1875 12.0448 Pimephales promelas 220 3,288 35,000 10.6448 10.6448 Ceriodaphnia dubia 50 1,908 1,900 0.9958 Ceriodaphnia dubia 1,624 1,500 0.9590 0.9772
FACR = 5.0039NOTES: a21 day LC50 b16% decrease in reproduction SMACR = species mean acute-chronic ratio.
3.5.3 Updated Aluminum AWQC Derivation
An updated final acute value (FAV) was derived from the four most sensitive genera in updated and revised
acute toxicity database (Ceriodaphnia, Salmo, Micropterus, and Asellus), the total number of genera in the
updated acute database, and newly derived acute toxicity hardness slope (Table 3-7). The resulting FAV
(2,560 µg/L) is over 1,000 µg/L greater than the 1988 FAV of 1,496 µg/L, and was used to derive the
hardness modified Al criteria equation.

Evaluation of the EPA Recalculation Procedure Technical Report in the Arid West 3-15 May 2006
Since the revised chronic database did not satisfy the “eight-family rule,” the FACR was used to derive a FCV
for Al from the acute database. Following the 1985 Guidelines, the acute hardness toxicity relationship was
assumed to be similar for chronic toxicity. Therefore, a chronic Al criterion equation was also calculated
using this pooled acute-hardness slope (Table 3-7). Use of the acute-hardness slope in the chronic equation
should be applied cautiously given the limited chronic toxicity data do not support this assumption. However,
the lack of support may be an artifact of difficulties associated with conducting chronic toxicity tests with a
poorly soluble compound, rather than a true lack of relationship.
Table 3-7 Recalculation of the Final Acute Values for Aluminum using the Revised Hardness Adjusted (50 mg/L CaCO3) Acute Database
Rank Genus GMAV (µg/L) ln GMAV (ln GMAV)^2 P = R/(N+1) %P
4 Asellus 4,370 8.383 70.267 0.211 0.459 3 Micropterus 3,183 8.066 65.002 0.158 0.397 2 Salmo 3,154 8.057 64.909 0.118 0.343 1 Ceriodaphnia 2,741 7.916 62.663 0.059 0.243 sum 32.421 262.421 0.526 1.410
NOTES: N = 18 genera, R = sensitivity rank in database, P = rank / N+1) Calculations: Acute Criterion
S2 =∋ (lnGMAV)2 - (∋lnGMAV)2/4 = 262.421 - (32.421)2/4 = 3.9871 S = 1.997 ΣΡ- (Σ√Ρ)2/4 0.526 – (1.410)2/4
L = [∋lnGMAV - S(∋%P)]/4 = [32.421 - 1.997 (1.410)]&4 = 7.401 A = S (√0.05) + L = (1997)(0.2236) + 7.401 = 7.848
Final Acute Value = FAV = e A = 2,559.98 µg/L CMC = ½ FAV = 1,279.99 µg/L Pooled Slope = 0.8327 ln (Criterion Maximum Intercept) = lnCMC - [pooled slope Η ln (standardized hardness level)] = ln (1,279.99) - [0.8327 Η ln (50)] = 3.8971 Acute Aluminum Criterion = e(0.8327 [ln (hardness)] + 3.8971) --------------------------------------------------------------------------------------------------------------------- Chronic Criterion Chronic Slope = 0.8327 Final Acute-Chronic ratio (FACR) = 5.0039 (recalculated) Final Chronic Value (FCV) = FAV / ACR = 2,559.98 ) 5.0039 = 511.60 µg/L ln (Final Chronic Intercept) = ln FCV - [chronic slope Η ln(standardized hardness level)] = ln (511.60) - [0.8327 Η ln (50)] = 2.9800 Chronic Aluminum Criterion = e(0.8327 [ln (hardness)] + 2.9800

Evaluation of the EPA Recalculation Procedure Technical Report in the Arid West 3-16 May 2006
Reported updated and revised values based on these equations are presented across a wide range of hardness
levels (Table 3-8). It is important to understand the boundaries of the reported equation. Since the equation
models hardness values that ranged from 1 mg to 220 mg of CaCO3/L, estimations made beyond outside of
this range should be treated with caution.
Table 3-8 Updated and Revised Acute and Chronic Al Criterion Value Across Selected Hardness Values
Mean Hardness (mg/Las CaCO3)
Equations 25 50 75 100 150 200 250 300 350 400
Updated/Revised National Standards
Acute Al Criterion e(0.8327 [ln (hardness)]+3.8971)
719 1,280 1,794 2,280 3,195 4,060 4,889 5,691 6,470 7,231
Chronic Al Criterion e(0.8327 [ln (hardness)]+2.9800
287 512 717 911 1,277 1,623 1,954 2,275 2,586 2,890
NOTE: All values are as µg Total Aluminum/L.
3.6 LITERATURE CITED
Biesinger, K.E., and G.M. Christensen. 1972. Effects of various metals on survival, growth, reproduction, and metabolism of Daphnia magna. Journal of the Fisheries Research Board of Canada 29:1691-1700.
Brooke, L. 1985. Memorandum to C. Stephan, U.S. Environmental Protection Agency, Duluth, MN, dated
July 15, 1985. University of Wisconsin-Superior, WI. Buckler, D.R., P.M. Merle, L. Cleveland, and F.J. Dwyer. Manuscript. Influence of pH on the Toxicity of
Aluminum and Other Inorganic Contaminants to East Coast Striped Bass. Columbia National Fisheries Research Laboratory, Columbia, Missouri.
Buhl, K.J. 2002. The Relative Toxicity of Waterborne Inorganic Contaminants to the Rio Grande Silvery
Minnow (Hybognathus amarus) and Fathead Minnow (Pimephales promelas) in a Water Quality Simulating that in the Rio Grande, New Mexico, Study No. 2F33-9620003. Final Report to U.S. Fish and Wildlife Service, Albuquerque, New Mexico.
Call, D.J. 1984. Memorandum to C. Stephan, U.S. Environmental Protection Agency, Duluth, MN, dated
November 27, 1984. University of Wisconsin-Superior, Wisconsin. Calvero, F., C. Philippi, P. Deri, C. Albertosi, and R. Batistoni. 1998. Toxic effects of aluminum, chromium
and cadmium in intact and regenerating freshwater planarian. Chemosphere 37(4):651-659. Cleveland, L., E.E. Little, R.H. Wiedmeyer, and D.R. Buckler. Manuscript. Chronic No-Observed-Effect
Concentrations of Aluminum for Brook Trout Exposed in Dilute Acid Water. National Fisheries Contaminant Research Center, Columbia, Missouri.
Cleveland, L., E.E. Little, R.H. Wiedmeyer, and D.R. Buckler. 1989. Chapter 13: Chronic no-observed-
effect concentrations of aluminum for brook trout exposed in low-calcium, dilute acidic water. Pages 229-245. IN: Lewis, T.E. (ed.). Environmental Chemistry and Toxicology of Aluminum. Lewis Publ., Inc., Chelsea, Michigan.
Evaluation of the EPA Recalculation Procedure Technical Report in the Arid West 3-17 May 2006
Cleveland, L., D.R. Buckler, and W.G. Brumbaugh. 1991. Residue dynamics and effects of aluminum on growth and mortality in brook trout. Environmental Toxicology and Chemistry 10:243-248.
Decker, C., and R. Menendez. 1974. Acute toxicity of iron and aluminum to brook trout. Proceedings of the
West Virginia Academy of Science 46:159-167. ENSR Consulting and Engineering. 1992a. Acute Toxicity of Aluminum to Ceriodaphnia dubia Under Static
Renewal Test Conditions at Four Levels of Water Hardness, 8505-092-047. Report prepared for Climax Metals Company, Golden, Colorado.
ENSR Consulting and Engineering. 1992b. Acute Toxicity of Aluminum to Pimephales promelas Under
Static Renewal Test Conditions at Four Levels of Water Hardness, 8505-092-047. Report prepared for Climax Metals Company, Golden, Colorado.
Gensemer, R.W., and R.C. Playle. The bioavailability and toxicity of aluminum in aquatic environments.
Critical Reviews in Environmental Science and Technology 29(4):315-450. Gundersen, D.T., S. Bustaman, W.K. Seim, and L.R. Curtis. 1994. pH, hardness, and humic acid influence
aluminum toxicity to rainbow trout (Oncorhynchus mykiss) in weakly alkaline waters. Canadian Journal of Fisheries and Aquatic Sciences 51:1345-1355.
Hamilton, S.J., and T.A. Haines. 1995. Influence of fluoride on aluminum toxicity to Atlantic salmon (Salmo
salar). Canadian Journal of Fisheries and Aquatic Sciences 52:2432-2444. Havens, K.E. 1990. Aluminum binding to ion exchange sites in acid-sensitive versus acid-tolerant
cladocerans. Environmental Pollution 64:133-141. Hunn, J.B., L. Cleveland, and E.E. Little. 1987. Influence of pH and aluminum on developing brook trout in
a low calcium water. Environmental Pollution 43:63-73. Kane, D.A., and C.F. Rabeni. 1987. Effects of aluminum and pH on the early life stages of smallmouth bass
(Micropterus dolomieu). Water Resources 21(6):633-639. Kimball, G. Manuscript. The Effects of Lesser Known Metals and One Organic to Fathead Minnows
(Pimephales promelas) and Daphnia magna. University of Minnesota, St. Paul, Minnesota. Lacroix, G.L., R.H. Peterson, C.S. Belfry, and D.J. Martin-Robichaud. 1993. Aluminum dynamics on gills
of Atlantic salmon fry in the presence of citrate and effects on integrity of gill structures. Aquatic Toxicology 27:373-402.
Lamb, D.S., and G.C. Bailey. 1981. Acute and chronic effects of alum to midge larva (Diptera:
Chironomidae). Bulletin of Environmental Contamination and Toxicology 27:59-67. Leivestad, H. 1982. Physiological effects of acid stress on fish. Pages 157-164. IN: Johnson, R.E. (ed.).
Acid Rain/Fisheries. American Fisheries Society, Bethesda, Maryland. Locke, A. 1991. Zooplankton responses to acidification: a review of laboratory bioassays. Water, Air and
Soil Pollution 60:135-148.

Evaluation of the EPA Recalculation Procedure Technical Report in the Arid West 3-18 May 2006
Martin, T.R., and D.M. Holdich. 1986. The acute lethal toxicity of heavy metals to peracarid crustaceans (with particular reference to fresh-water Asellids and Gammarids). Water Resources 20(9):1137-1147.
McCauley, D.J., L.T. Brooke, D.J. Call, and C.A. Lindbergh. 1988. Acute and Chronic Toxicity of Aluminum
to Ceriodaphnia dubia at Various pHs. University of Wisconsin-Superior, Superior, Wisconsin. Morel, F.M.M. and J.J. Morgan. 1972. A numerical method for computing equilibria in aqueous chemical
systems. Environmental Science and Technology. 6:58. Muniz, I.P., and H. Leivestad. 1980. Acidification - effects on freshwater fish. Pages 84-92. IN: Drablos,
D., and A. Tollan, (eds.). Ecological Impact of Acid Precipitation: Proceedings of an International Conference, March 11-14, 1980, Sandfjord, Norway. SNSF Project, Oslo, Norway.
Palmer, R.E., R.J. Klauda, and T.E. Lewis. 1988. Comparative sensitivities of bluegill, channel catfish, and
fathead minnow to pH and aluminum. Environmental Toxicology and Chemistry 7:505-516. Palmer, R.E., R.J. Klauda, M.A. Epson, and E.S. Perry. 1989. Acute sensitivity of early life stages of fathead
minnow (Pimephales promelas) to acid and aluminum. Water Resources 23(8):1039-1047. Rockwood, J.P., D.S. Jones, and R.A. Coler. 1990. The effect of aluminum in soft water at low pH on
oxygen consumption by the dragonfly Libellula julia Uhler. Hydrobiologia 190:55-59. Schlesinger, W.H. 1997. Biochemistry, An Analysis of Global Change, 2nd Edition. Academic Press,
Amsterdam. Soucek, D.J., D.S. Cherry, and C.E. Zipper. 2001. Aluminum-dominated acute toxicity to the cladoceran
Ceriodaphnia dubia in neutral waters downstream of an acid mine drainage discharge. Sparling, D.W., and T.P. Lowe. 1996. Environmental Hazards of Aluminum to Plants, Invertebrates, Fish,
and Wildlife. Springer-Veriag, New York, Inc. Stephan, C.E., D.I. Mount, D.J. Hansen, J.H. Gentile, G.A. Chapman, and W.A. Brungs. 1985. Guidelines
for Deriving Numerical National Water Quality Criteria for the Protection ofAquatic Organisms and Their Uses. PB-85-227049. U.S. Environmental Protection Agency, Office of Research and Development, Duluth, Minnesota.
Storey, D.M., F.B. Pyatt, and L.E. Broadley. 1992. An appraisal of some effects of simulated acid rain and
aluminum ions on Cyclops viridis (Crustacea, Copepoda) and Gammarus pulex (Crustacea, Amphipoda). International Journal of Environmental Studies 42:159-176.
Thomsen, A., B. Korsgaard, and J. Joensen. 1988. Effect of aluminium and calcium ions on survival and
physiology of rainbow trout Salmo gairdneri (Richardson) eggs and larvae exposed to acid stress. Aquatic Toxicology 12:291-300.
U.S. Environmental Protection Agency. 1976. Quality Criteria for Water. EPA 440/9-76-023. National
Technical Information Service, Springfield, Virginia. U.S. Environmental Protection Agency. 1988. Ambient Water Quality Criteria for Aluminum - 1988. EPA
440/5-86-008. Office of Water, Washington, DC.

Evaluation of the EPA Recalculation Procedure Technical Report in the Arid West 3-19 May 2006
Van Benschoten, J.E., and J.K. Edzwald. 1990. Measuring aluminum during water treatment. Methodology and application. Journal of the American Water Works Association. 82(5):71-78.
Wilkinson, K.J., and P.G.C. Campbell. 1993. Aluminum bioconcentration at the gill surface of juvenile
Atlantic salmon in acidic media. Environmental Toxicology and Chemistry 12:2083-2095.

Evaluation of the EPA Recalculation Procedure Technical Report in the Arid West 4-1 May 2006
4.0 AMMONIA CRITERIA REVIEW AND UPDATE
4.1 PHASE I – TECHNICAL REVIEW OF 1999 AMMONIA DOCUMENT
Phase I of this evaluation was the technical review of the 1999 report entitled “1999 Update of Ambient
Water Quality Criteria for Ammonia” (EPA 1999). This document was critically reviewed for relevance of
the toxicity data and adherence to EPA methodology (Stephan et al. 1985).
4.1.1 Existing Acute Criteria for Ammonia
To explain the relationship between acute ammonia toxicity (LC50TA) and pH, the EPA derived an empirical
“S-shaped” model (Eq. 1), using the disassociation characteristics of total ammonia (TA).
++
+×
++
+
=TATA
TATA
pH-pHpH-pH
pH-88-pH
TA,850TA50 101
1 101
R
1011
101R
LC LC Eq. 1
where R is the slope of the disassociation curve, pHTA is the inflection point at low pH values, and LC50t,8 is
the acute toxicity value adjusted to a pH = 8. Both R and pHTA are parameterized values based on the
nonlinear relationship between LC50TA and pH for a pooled group of organisms. The pooled dataset consisted
of four studies that evaluated ammonia toxicity over a broad range of pH (6.5-9) for various freshwater
species. After a thorough analysis, the EPA determined that a temperature component should not be included
in the acute equations.
Substitution of the parameterized values, R (0.00704) and pHTA (7.204), into Eq. 1 results in the formulation
of the EPA’s Acute Value model (AVt) describing pH dependence of acute ammonia toxicity. By rearranging
the equation one can convert LC50’s to an equivalent value at pH = 8 (AVt,8) – i.e., normalize all data to pH 8
(Eq. 2). Note that LC50TA and AVTA are synonymous.
++
+×= 7.204-pHpH-7.204TA,8TA 101
6.95 1010.0489 AV AV Eq. 2

Evaluation of the EPA Recalculation Procedure Technical Report in the Arid West 4-2 May 2006
Using this normalized value (AVt,8) for each species, the geometric mean acute values were calculated by the
EPA for each species (SMAV) and Genus (GMAV) following guidelines described in Stephan et al. (1985),
hereinafter referred to as the “1985 Guidelines.” The GMAVs were ranked by sensitivity from 1 to n, with
number 1 being the most sensitive genus. The GMAVs contained within the 5th percentile were used to
calculate the FAV, which is ultimately used in the development of the CMC for TA given pH. The CMC is
expressed in terms of nitrogen equivalence of total ammonia (TA-N). One additional step taken by the EPA
was to calculate a modified SMAV for “large” rainbow trout, Oncorhynchus mykiss, (11.23 mg N/L) based on
a single study by Thurston and Russo (1983). Because this modified SMAV was less than the original FAV
derived using the 5th percentile genera, it became the basis for the “salmonids present” acute criterion (Eq. 3).
To derive the “salmonids absent” criterion, all salmonid data was removed from the ranked database, and the
FAV was recalculated, becoming the basis of Eq. 4.
EPA Salmonids present
CMC = 0.275
1+1039.0
1+107.204-pH pH-7.204+ Eq. 3
EPA Salmonids absent
CMC = 0.411
1+1058.4
1+107.204-pH pH-7.204+ Eq. 4
4.1.2 Existing Chronic Criteria for Ammonia
Because the national chronic ammonia toxicity database contains a variety of toxicological responses for fish
(i.e., mortality, embryo production, embryo hatchability, biomass) and is not solely based upon survival, the
EPA believed an effect due to seasonality could or should be included in model development. Ideally, using
this assumption, the seasonal component would protect a range of physiological responses of various age-
class organisms to chronic ammonia toxicity. Therefore, a temperature component was included in the model
development as a surrogate for seasonality and life stage development.
The paucity of chronic data prohibits the direct development of chronic criteria using the 5th percentile
approach, since the chronic database does not meet the MDRs – specifically, the eight family rule. However,
the EPA still used the 5th percentile GMCVs in their chronic model development rather than using a FACR.
The GMCVs were based on EC20 total ammonia (mg/L TA-N) results for each genera that had been
normalized to pH 8 using a similar approach as in the acute database, but in addition, normalized to
25°C(CVt,8).
Evaluation of the EPA Recalculation Procedure Technical Report in the Arid West 4-3 May 2006
Note that unlike the acute analysis, EPA determined that temperature should be included in the chronic
criteria. Interestingly enough, linear regression analysis of acute toxicity data presented by Arthur et al.
(1987) for five fish and nine invertebrates was used to derive these temperature dependent chronic ammonia
toxicity equations. It is particularly important to note that the Arthur et al. (1987) study was not specifically
designed to examine temperature effects – rather it was an ammonia toxicity study conducted in outdoor
streams during four seasons (winter, spring, summer, and fall), with no controls on light or temperature.
Furthermore, Arthur et al. (1987) reported, “our results do not clearly demonstrate a relationship between
ammonia toxicity and temperature” - a finding that supported the exclusion of temperature in the acute
ammonia equations.
Nonetheless, the EPA used the Arthur et al. (1987) acute ammonia toxicity study to develop a temperature
dependent chronic ammonia toxicity model. Regression analysis of the log10 LC50 and temperature values for
a subset of Arthur et al. (1987) data that included Physa, Crangonyx, and Musculium resulted in an
invertebrate slope of -0.044. The slope for the Arthur et al. (1987) pooled fish dataset was not significantly
different from zero, thus no temperature dependent relationship was observed for fish. Because the EPA
found no significant temperature response for fish, they assumed that the difference between acute and
chronic slopes would be the same for fish and invertebrates. Therefore, they modified the acute invertebrate
slope (-0.044) by subtracting a fish acute to chronic ratio slope (-0.016), resulting in the adjusted invertebrate
slope of -0.028.
The EPA used the adjusted temperature slope (-0.028) for the three invertebrate LC50 response values to
normalize CVt,8 of both fish and invertebrates to 25°C for comparative baseline purposes. The reason for
choosing 25°C was because the only chronic value for the most sensitive species (Hyalella azteca) was
experimentally determined at 25°C. In addition, other “acceptable” chronic ammonia toxicity studies were
performed at temperatures within 3 degrees of 25°C. The EPA chose not to include the available chronic
studies of Oncorhynchus species because the data are extremely variable and presented as either greater than,
less than, or a range of EC20 values.
The four most sensitive genera in the limited chronic database in order of decreasing sensitivity were Hyalella
(1.45 mg N/L), Musculium (2.26 mg N/L), Lepomis (2.52 mg N/L), and Pimephales (3.03 mg N/L). Of the 28
chronic EC20 values presented in Table 5 of the EPA (1999) document, 21 were not normalized to 25°C. This
slightly affects the EPA model output because their empirical model was based on the GMCV at pH8 (2.85
mg N/L) for Lepomis early life stages instead of the temperature adjusted (25°C) value of 2.52 mg N/L.

Evaluation of the EPA Recalculation Procedure Technical Report in the Arid West 4-4 May 2006
(Note: Also, the Hyalella and Musculium chronic data are suspect due to poor control organism performance
in both studies and should not be used for criteria development.)
Regardless of the limited chronic data, the EPA developed their final CCC model around only two genera
(Lepomis and Hyalella), which were the most sensitive early life (ELS) stage fish and invertebrate to chronic
toxicity, respectively. To account for the various life stages of fish, the EPA derived two functions: one for
early life stage present and another for early life stage absent. Although the “early life stage present or
absent” is specific to fish, fish ammonia toxicity data did not show a temperature dependency. Therefore, the
model developed by EPA follows the invertebrate response to temperature - although it cannot exceed 85.4%
of the lowest fish GMCV.
When early life stage fish are present (Eq. 5) the CCC incorporates the following temperature based function:
( )T)--0.028(25present stage lifeEarly 101.45 2.85,MIN0.854 CCC ××= Eq. 5
where 2.85 is the GMCV value for Lepomis early life stage, 1.45 is the GMCV value for Hyalella, -0.028 is
the invertebrate slope for temperature dependency and T is temperature.
When early life stage fish are absent (Eq. 6) the temperature function is:
MAX(T,7)-0.028(25
absent stage lifeEarly 1045.10.854 CCC −××= Eq. 6
which is solely based on Hyalella. It is important to note that neither equation is based on that organism’s
response to temperature. These functions were then substituted into the pH dependency equations that
convert chronic effect concentrations from pH 8 to any other pH resulting in the final EPA CCC equations
(Eq. 7 and Eq. 8):
EPA’s Early Life Stage Fish Present Equation
( )T)-0.028(25-7.688pHpH-7.688present stage lifeEarly 101.45 2.85,MIN
1012.487
1010.0577 CCC ××
++
+= − Eq. 7
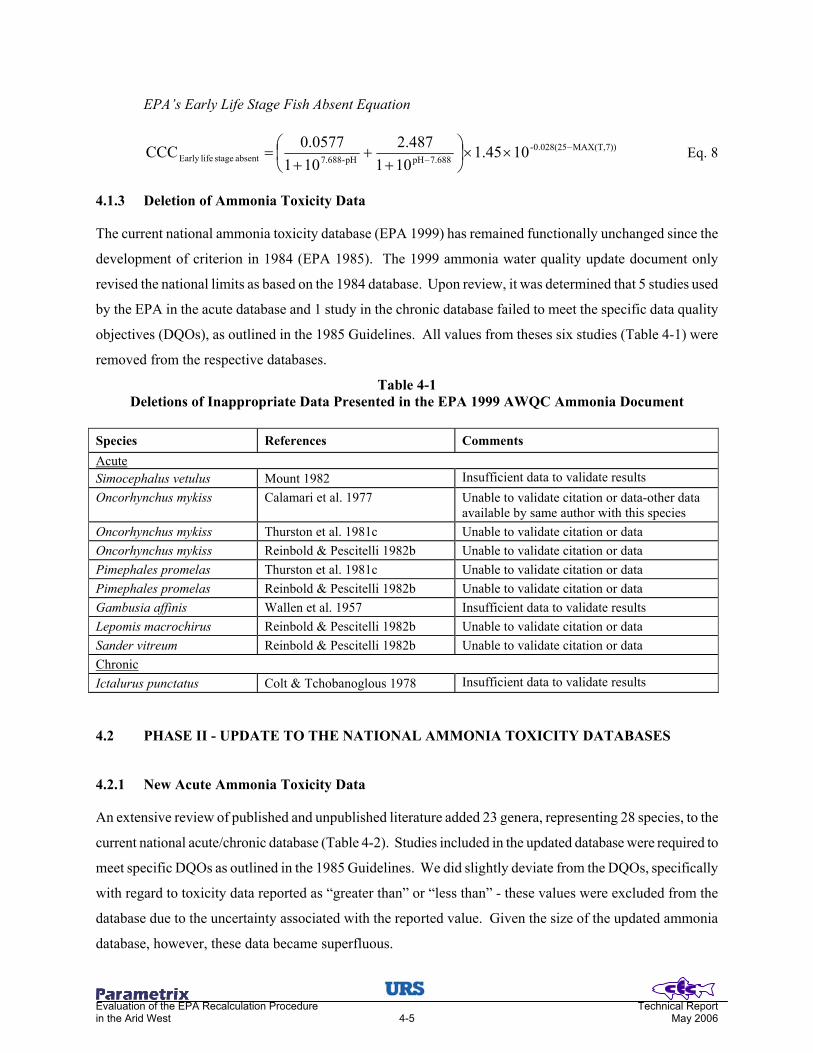
Evaluation of the EPA Recalculation Procedure Technical Report in the Arid West 4-5 May 2006
EPA’s Early Life Stage Fish Absent Equation
MAX(T,7))0.028(25-7.688pHpH-7.688absent stage lifeEarly 1045.1
1012.487
1010.0577 CCC −
− ××
++
+= Eq. 8
4.1.3 Deletion of Ammonia Toxicity Data
The current national ammonia toxicity database (EPA 1999) has remained functionally unchanged since the
development of criterion in 1984 (EPA 1985). The 1999 ammonia water quality update document only
revised the national limits as based on the 1984 database. Upon review, it was determined that 5 studies used
by the EPA in the acute database and 1 study in the chronic database failed to meet the specific data quality
objectives (DQOs), as outlined in the 1985 Guidelines. All values from theses six studies (Table 4-1) were
removed from the respective databases.
Table 4-1 Deletions of Inappropriate Data Presented in the EPA 1999 AWQC Ammonia Document
Species References Comments Acute Simocephalus vetulus Mount 1982 Insufficient data to validate results Oncorhynchus mykiss Calamari et al. 1977 Unable to validate citation or data-other data
available by same author with this species Oncorhynchus mykiss Thurston et al. 1981c Unable to validate citation or data Oncorhynchus mykiss Reinbold & Pescitelli 1982b Unable to validate citation or data Pimephales promelas Thurston et al. 1981c Unable to validate citation or data Pimephales promelas Reinbold & Pescitelli 1982b Unable to validate citation or data Gambusia affinis Wallen et al. 1957 Insufficient data to validate results Lepomis macrochirus Reinbold & Pescitelli 1982b Unable to validate citation or data Sander vitreum Reinbold & Pescitelli 1982b Unable to validate citation or data Chronic Ictalurus punctatus Colt & Tchobanoglous 1978 Insufficient data to validate results
4.2 PHASE II - UPDATE TO THE NATIONAL AMMONIA TOXICITY DATABASES
4.2.1 New Acute Ammonia Toxicity Data
An extensive review of published and unpublished literature added 23 genera, representing 28 species, to the
current national acute/chronic database (Table 4-2). Studies included in the updated database were required to
meet specific DQOs as outlined in the 1985 Guidelines. We did slightly deviate from the DQOs, specifically
with regard to toxicity data reported as “greater than” or “less than” - these values were excluded from the
database due to the uncertainty associated with the reported value. Given the size of the updated ammonia
database, however, these data became superfluous.

Evaluation of the EPA Recalculation Procedure Technical Report in the Arid West 4-6 May 2006
The most noteworthy additions to the database were eight species of freshwater mussels in the Family
Unionidae, which appear to be extremely sensitive to ammonia. In fact, they are the most sensitive organisms
in the acute database and could potentially decrease national criteria by approximately 80%. However, the
EPA is currently reluctant to include these benthic organisms in the ambient water quality criteria until
uncertainties in test procedures are resolved (Federal Register 2004).
The updated database also includes four endangered fish species Acipenser brevirostrum, Chasmistes
brevirostris, Deltistes luxatus, and Hybognathus amarus that have very limited ranges. Of these fish,
D.luxatus is the most influential species in criterion development, because it is the third most sensitive fish in
the database. C.brevirostris and H.amarus also exhibit similar sensitivity to ammonia toxicity, and were the
5th and 6th most sensitive fish in the database. These fish may have a limited role in developing national water
quality criteria; however, in an arid West regional or site-specific criteria development, these organisms
provide key information. Presently, the updated CEC ammonia database represents organisms from 5 phyla,
10 classes, 22 orders, 32 families, 57 genera, and 76 species (Appendix 2).
Table 4-2 Summary of Acute Data Deemed Acceptable for use and
Added to the Updated Acute Ammonia Toxicity Database
Species Common Name NH3-N (mg/L)
TA-N (mg/L)
TA-N pH8
(mg/L) Reference
Baetis rhodani Mayfly 8.20 208.52 277.70 Khatami et al. 1998 Baetis rhodani Mayfly 8.20 208.52 277.70 Khatami et al. 1998 Baetis rhodani Mayfly 0.32 8.14 10.84 Khatami et al. 1998 Caecidotea racovitzai Sowbug 5.09 148.83 103.02 Arthur et al. 1987 Callibaetis skokianus Mayfly 3.15 263.55 153.36 Arthur et al. 1987 Ceriodaphnia dubia Water Flea 1.54 23.55 23.54 Bailey et al. 2001 Ceriodaphnia dubia Water Flea 1.36 20.80 20.79 Bailey et al. 2001 Ceriodaphnia dubia Water Flea 1.22 18.66 18.65 Bailey et al. 2001 Ceriodaphnia dubia Water Flea 1.01 15.45 15.44 Bailey et al. 2001 Ceriodaphnia dubia Water Flea 1.54 23.55 23.54 Bailey et al. 2001 Ceriodaphnia dubia Water Flea 1.22 18.66 18.65 Bailey et al. 2001

Evaluation of the EPA Recalculation Procedure Technical Report in the Arid West 4-7 May 2006
Table 4-2 (Continued) Summary of Acute Data Deemed Acceptable for use and
Added to the Updated Acute Ammonia Toxicity Database
Species Common Name NH3-N (mg/L)
TA-N (mg/L)
TA-N pH8
(mg/L) Reference
Ceriodaphnia dubia Water Flea 1.36 20.80 20.79 Bailey et al. 2001 Ceriodaphnia dubia Water Flea 1.01 15.45 15.44 Bailey et al. 2001 Ceriodaphnia dubia Water Flea 1.56 46.21 34.98 Sarda 1994 Ceriodaphnia dubia Water Flea 1.84 54.50 41.26 Sarda 1994 Crangonyx
pseudogracillis Amphipod 0.36 52.65 22.24 Prenter et al. 2004
Crangonyx sp. Amphipod 2.05 163.71 92.10 Diamond et al. 1993 Daphnia magna Water Flea 1.17 53.24 29.95 Diamond et al. 1993 Erythromma najas Damselfly 10.42 463.98 202.02 Beketov 2002 Erythromma najas Damselfly 37.80 140.28 534.71 Beketov 2002 Erythromma najas Damselfly 22.14 41.44 323.90 Beketov 2002 Erythromma najas Damselfly 12.45 679.66 259.28 Beketov 2002 Gammarus pulex Amphipod 1.54 225.82 95.40 Prenter et al. 2004 Helisoma trivolvis Snail 2.04 47.73 39.58 Arthur et al. 1987 Hyalella azteca Amphipod 2.08 61.61 46.64 Sarda 1994 Hyalella azteca Amphipod 2.52 74.64 56.51 Sarda 1994 Lestes sponsa Dragonfly 7.30 310.69 139.48 Beketov 2002 Orconectes immunis Calico crayfish 14.72 488.07 404.82 Arthur et al. 1987 Philarctus quaeris Caddisfly 10.07 296.51 205.25 Arthur et al. 1987 Physa gyrina Snail 2.49 76.29 92.27 Arthur et al. 1987 Procambarus clarkii Red swamp
crayfish 1.21 53.41 30.05 Diamond et al. 1993
Simocephalus vetulus Water flea 1.27 21.36 25.83 Arthur et al. 1987 Sympetrum flaveolum Dragonfly 1.72 274.34 61.73 Beketov 2002 Sympetrum flaveolum Dragonfly 3.41 181.98 70.42 Beketov 2002 Sympetrum flaveolum Dragonfly 6.11 58.31 88.95 Beketov 2002 Sympetrum flaveolum Dragonfly 12.56 701.39 263.82 Beketov 2002 Actinonaias pectorosa Pheasantshell
mussel 0.25 3.76 3.76 Augspurger et al. 2003
Actinonaias pectorosa Pheasantshell mussel
0.92 14.06 14.05 Augspurger et al. 2003
Actinonaias pectorosa Pheasantshell mussel
0.74 17.06 14.15 Keller et al. 2000 (unpublished)
Actinonaias sp. Mussel 0.83 17.09 15.55 Keller et al. 2000 (unpublished)
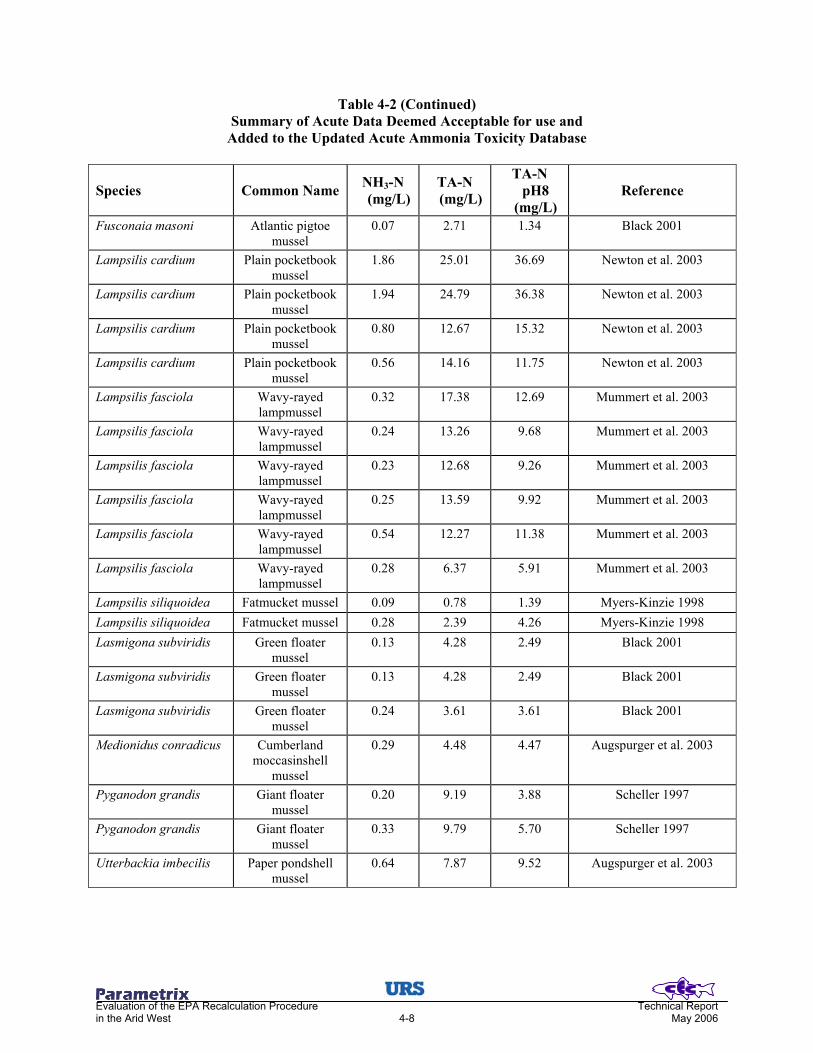
Evaluation of the EPA Recalculation Procedure Technical Report in the Arid West 4-8 May 2006
Table 4-2 (Continued) Summary of Acute Data Deemed Acceptable for use and
Added to the Updated Acute Ammonia Toxicity Database
Species Common Name NH3-N (mg/L)
TA-N (mg/L)
TA-N pH8
(mg/L) Reference
Fusconaia masoni Atlantic pigtoe mussel
0.07 2.71 1.34 Black 2001
Lampsilis cardium Plain pocketbook mussel
1.86 25.01 36.69 Newton et al. 2003
Lampsilis cardium Plain pocketbook mussel
1.94 24.79 36.38 Newton et al. 2003
Lampsilis cardium Plain pocketbook mussel
0.80 12.67 15.32 Newton et al. 2003
Lampsilis cardium Plain pocketbook mussel
0.56 14.16 11.75 Newton et al. 2003
Lampsilis fasciola Wavy-rayed lampmussel
0.32 17.38 12.69 Mummert et al. 2003
Lampsilis fasciola Wavy-rayed lampmussel
0.24 13.26 9.68 Mummert et al. 2003
Lampsilis fasciola Wavy-rayed lampmussel
0.23 12.68 9.26 Mummert et al. 2003
Lampsilis fasciola Wavy-rayed lampmussel
0.25 13.59 9.92 Mummert et al. 2003
Lampsilis fasciola Wavy-rayed lampmussel
0.54 12.27 11.38 Mummert et al. 2003
Lampsilis fasciola Wavy-rayed lampmussel
0.28 6.37 5.91 Mummert et al. 2003
Lampsilis siliquoidea Fatmucket mussel 0.09 0.78 1.39 Myers-Kinzie 1998 Lampsilis siliquoidea Fatmucket mussel 0.28 2.39 4.26 Myers-Kinzie 1998 Lasmigona subviridis Green floater
mussel 0.13 4.28 2.49 Black 2001
Lasmigona subviridis Green floater mussel
0.13 4.28 2.49 Black 2001
Lasmigona subviridis Green floater mussel
0.24 3.61 3.61 Black 2001
Medionidus conradicus Cumberland moccasinshell
mussel
0.29 4.48 4.47 Augspurger et al. 2003
Pyganodon grandis Giant floater mussel
0.20 9.19 3.88 Scheller 1997
Pyganodon grandis Giant floater mussel
0.33 9.79 5.70 Scheller 1997
Utterbackia imbecilis Paper pondshell mussel
0.64 7.87 9.52 Augspurger et al. 2003
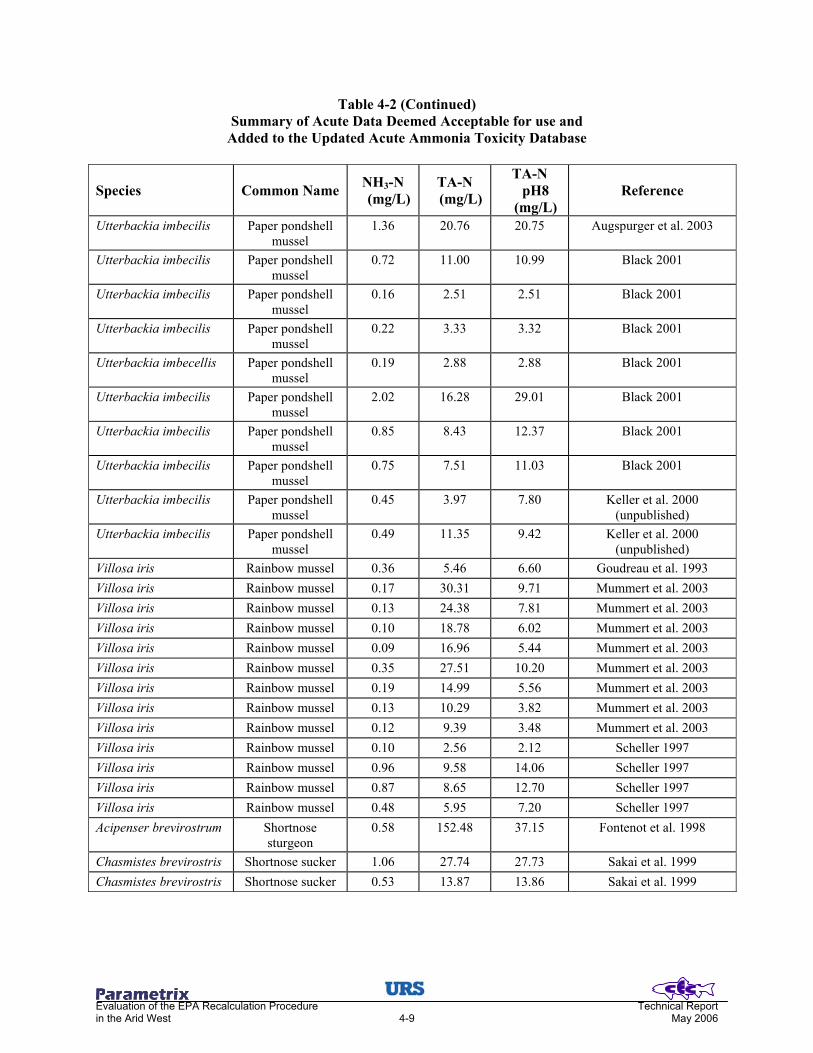
Evaluation of the EPA Recalculation Procedure Technical Report in the Arid West 4-9 May 2006
Table 4-2 (Continued) Summary of Acute Data Deemed Acceptable for use and
Added to the Updated Acute Ammonia Toxicity Database
Species Common Name NH3-N (mg/L)
TA-N (mg/L)
TA-N pH8
(mg/L) Reference
Utterbackia imbecilis Paper pondshell mussel
1.36 20.76 20.75 Augspurger et al. 2003
Utterbackia imbecilis Paper pondshell mussel
0.72 11.00 10.99 Black 2001
Utterbackia imbecilis Paper pondshell mussel
0.16 2.51 2.51 Black 2001
Utterbackia imbecilis Paper pondshell mussel
0.22 3.33 3.32 Black 2001
Utterbackia imbecellis Paper pondshell mussel
0.19 2.88 2.88 Black 2001
Utterbackia imbecilis Paper pondshell mussel
2.02 16.28 29.01 Black 2001
Utterbackia imbecilis Paper pondshell mussel
0.85 8.43 12.37 Black 2001
Utterbackia imbecilis Paper pondshell mussel
0.75 7.51 11.03 Black 2001
Utterbackia imbecilis Paper pondshell mussel
0.45 3.97 7.80 Keller et al. 2000 (unpublished)
Utterbackia imbecilis Paper pondshell mussel
0.49 11.35 9.42 Keller et al. 2000 (unpublished)
Villosa iris Rainbow mussel 0.36 5.46 6.60 Goudreau et al. 1993 Villosa iris Rainbow mussel 0.17 30.31 9.71 Mummert et al. 2003 Villosa iris Rainbow mussel 0.13 24.38 7.81 Mummert et al. 2003 Villosa iris Rainbow mussel 0.10 18.78 6.02 Mummert et al. 2003 Villosa iris Rainbow mussel 0.09 16.96 5.44 Mummert et al. 2003 Villosa iris Rainbow mussel 0.35 27.51 10.20 Mummert et al. 2003 Villosa iris Rainbow mussel 0.19 14.99 5.56 Mummert et al. 2003 Villosa iris Rainbow mussel 0.13 10.29 3.82 Mummert et al. 2003 Villosa iris Rainbow mussel 0.12 9.39 3.48 Mummert et al. 2003 Villosa iris Rainbow mussel 0.10 2.56 2.12 Scheller 1997 Villosa iris Rainbow mussel 0.96 9.58 14.06 Scheller 1997 Villosa iris Rainbow mussel 0.87 8.65 12.70 Scheller 1997 Villosa iris Rainbow mussel 0.48 5.95 7.20 Scheller 1997 Acipenser brevirostrum Shortnose
sturgeon 0.58 152.48 37.15 Fontenot et al. 1998
Chasmistes brevirostris Shortnose sucker 1.06 27.74 27.73 Sakai et al. 1999 Chasmistes brevirostris Shortnose sucker 0.53 13.87 13.86 Sakai et al. 1999
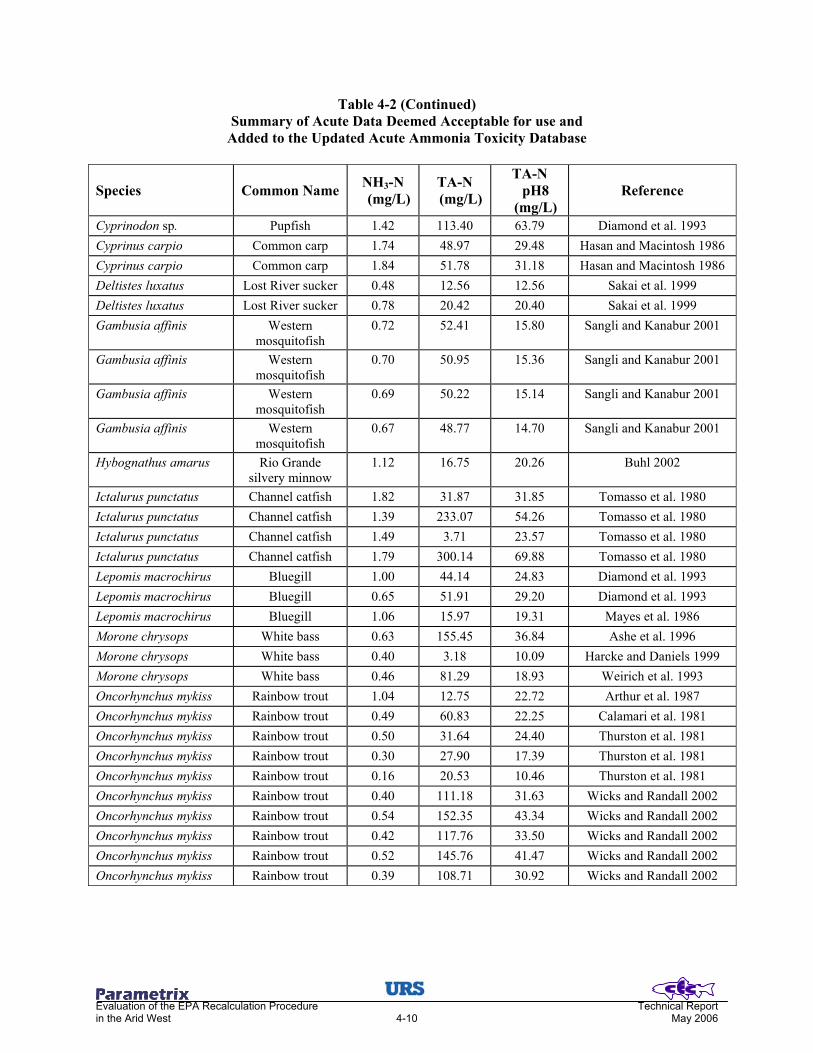
Evaluation of the EPA Recalculation Procedure Technical Report in the Arid West 4-10 May 2006
Table 4-2 (Continued) Summary of Acute Data Deemed Acceptable for use and
Added to the Updated Acute Ammonia Toxicity Database
Species Common Name NH3-N (mg/L)
TA-N (mg/L)
TA-N pH8
(mg/L) Reference
Cyprinodon sp. Pupfish 1.42 113.40 63.79 Diamond et al. 1993 Cyprinus carpio Common carp 1.74 48.97 29.48 Hasan and Macintosh 1986 Cyprinus carpio Common carp 1.84 51.78 31.18 Hasan and Macintosh 1986 Deltistes luxatus Lost River sucker 0.48 12.56 12.56 Sakai et al. 1999 Deltistes luxatus Lost River sucker 0.78 20.42 20.40 Sakai et al. 1999 Gambusia affinis Western
mosquitofish 0.72 52.41 15.80 Sangli and Kanabur 2001
Gambusia affinis Western mosquitofish
0.70 50.95 15.36 Sangli and Kanabur 2001
Gambusia affinis Western mosquitofish
0.69 50.22 15.14 Sangli and Kanabur 2001
Gambusia affinis Western mosquitofish
0.67 48.77 14.70 Sangli and Kanabur 2001
Hybognathus amarus Rio Grande silvery minnow
1.12 16.75 20.26 Buhl 2002
Ictalurus punctatus Channel catfish 1.82 31.87 31.85 Tomasso et al. 1980 Ictalurus punctatus Channel catfish 1.39 233.07 54.26 Tomasso et al. 1980 Ictalurus punctatus Channel catfish 1.49 3.71 23.57 Tomasso et al. 1980 Ictalurus punctatus Channel catfish 1.79 300.14 69.88 Tomasso et al. 1980 Lepomis macrochirus Bluegill 1.00 44.14 24.83 Diamond et al. 1993 Lepomis macrochirus Bluegill 0.65 51.91 29.20 Diamond et al. 1993 Lepomis macrochirus Bluegill 1.06 15.97 19.31 Mayes et al. 1986 Morone chrysops White bass 0.63 155.45 36.84 Ashe et al. 1996 Morone chrysops White bass 0.40 3.18 10.09 Harcke and Daniels 1999 Morone chrysops White bass 0.46 81.29 18.93 Weirich et al. 1993 Oncorhynchus mykiss Rainbow trout 1.04 12.75 22.72 Arthur et al. 1987 Oncorhynchus mykiss Rainbow trout 0.49 60.83 22.25 Calamari et al. 1981 Oncorhynchus mykiss Rainbow trout 0.50 31.64 24.40 Thurston et al. 1981 Oncorhynchus mykiss Rainbow trout 0.30 27.90 17.39 Thurston et al. 1981 Oncorhynchus mykiss Rainbow trout 0.16 20.53 10.46 Thurston et al. 1981 Oncorhynchus mykiss Rainbow trout 0.40 111.18 31.63 Wicks and Randall 2002 Oncorhynchus mykiss Rainbow trout 0.54 152.35 43.34 Wicks and Randall 2002 Oncorhynchus mykiss Rainbow trout 0.42 117.76 33.50 Wicks and Randall 2002 Oncorhynchus mykiss Rainbow trout 0.52 145.76 41.47 Wicks and Randall 2002 Oncorhynchus mykiss Rainbow trout 0.39 108.71 30.92 Wicks and Randall 2002

Evaluation of the EPA Recalculation Procedure Technical Report in the Arid West 4-11 May 2006
Table 4-2 (Continued) Summary of Acute Data Deemed Acceptable for use and
Added to the Updated Acute Ammonia Toxicity Database
Species Common Name NH3-N (mg/L)
TA-N (mg/L)
TA-N pH8
(mg/L) Reference
Oncorhynchus mykiss Rainbow trout 0.41 114.47 32.56 Wicks and Randall 2002 Oncorhynchus mykiss Rainbow trout 0.41 113.65 32.33 Wicks and Randall 2002 Oncorhynchus mykiss Rainbow trout 0.42 116.12 33.03 Wicks and Randall 2002 Oncorhynchus mykiss Rainbow trout 0.51 143.29 40.76 Wicks and Randall 2002 Oncorhynchus mykiss Rainbow trout 0.72 207.00 46.97 Wicks et al. 2002 Oncorhynchus mykiss Rainbow trout 0.11 32.38 7.35 Wicks et al. 2002 Pimephales promelas Fathead minnow 0.25 11.36 6.39 Diamond et al. 1993 Pimephales promelas Fathead minnow 1.50 22.60 27.33 Mayes et al. 1986 Pimephales promelas Fathead minnow 1.01 14.47 18.19 Buhl 2002 Sander vitreum Walleye 1.04 16.21 19.61 Mayes et al. 1986 Rana pipiens Northern leopard
frog 1.44 63.56 35.76 Diamond et al. 1993
Rana pipiens Northern leopard frog
0.42 33.54 18.87 Diamond et al. 1993
NOTE: Acute values (LC50) have been adjusted to pH 8 and are reported as acute values in nitrogen equivalence of total ammonia.
4.2.2 New Chronic Ammonia Toxicity Data
Owing to the paucity of chronic ammonia studies and stringent experimental protocols (i.e., duration,
dissolved oxygen, and life stage), only 15 studies (representing 9 genera) were considered acceptable by the
EPA for the development of chronic ammonia criteria. Our review of the literature increased the size of the
chronic database somewhat for a total of 20 studies that evaluated a variety of chronic endpoints, from egg
hatching success to early life stage biomass, providing chronic ammonia toxicity data for 14 species
representing 12 genera. Three new species were added to the chronic database, which include Salvelinus
namayacush, Lasmigona subviridis and Esox lucius (Table 4-3).
The updated chronic database is considerably less robust than the updated acute database, and still does not
meet the “eight family rule” for the development of national water quality criteria (Stephan et al. 1985).
Specifically, two of the eight required families are not represented - a family in the class Insecta, and a second
family from Insecta or a non-represented phylum. This shortcoming of the chronic database precluded the
EPA’s use of the 5th percentile approach to set the CCC in the 1999 document, but EPA still developed a
chronic criterion using this method.

Evaluation of the EPA Recalculation Procedure Technical Report in the Arid West 4-12 May 2006
Table 4-3 New Chronic Ammonia Toxicity Data Added to the EPA (1999) Database
Species Common name Temp pH
EC20 TA-N @ test pH & Temp (mg/L)
EC20 TA-N @ pH=8 (mg/L)
EC20 TA-N @ pH=8 & 25°C (mg/L)
SMCV @ pH8 25°C
(mg/L) Reference
Salvelinus namayacush
Lake trout 11.60 8.02 9.13 9.40 3.96 3.96
Beamish and Tandler 1990
Lasmigona subviridis
Green floater mussel 22.00 8.00 0.56 0.56 0.46 0.46 Black 2001
Esox lucius 9.00 7.60 43.20 26.47 9.43 4.39 Harrahy et al. 2004 Esox lucius 9.00 7.60 20.56 12.60 4.49 Harrahy et al. 2004 Esox lucius 9.00 7.60 13.21 8.25 2.94 Harrahy et al. 2004 Esox lucius
Northern pike
9.00 7.60 13.44 8.40 2.99 Harrahy et al. 2004
4.3 PHASE III – REVISED ACUTE AND CHRONIC AWQC FOR AMMONIA
4.3.1 Updated Acute Criteria for Ammonia
Even though the acute database doubled in terms of total species, there were only a few studies that evaluated
ammonia toxicity within the range of pH (6.5 to 9) suitable to develop water quality criteria. In addition,
there was a concern of developing criteria based on studies that had relatively small sample sizes. Therefore,
a decision was made to again use a selected group of studies for “curve-fitting” purposes, similar to the
approach used by EPA. However, the EPA never stated which four datasets they specifically used to model
the inflection point of their model (i.e., 7.204) or other parameters in the equations, making the model
validation and parameterization difficult. Therefore, we could only speculate on the four datasets that met the
need of toxicity data obtained over a wide range of pH. For our analysis, we used data from Broderius et al.
1985 (n = 70), DeGraeve et al. 1987 (n = 80), Reinbold and Pescitelli 1982 (n = 32), and Thurston et al. 1986
(n = 40) to evaluate the fit of simple linear and multiple regression models to individual and pooled datasets.
We believe these may be the four datasets used by EPA, but we could never exactly duplicate their inflection
point.
We first re-analyzed the TA vs pH relationship and found we could not specifically fit EPA’s model to the
available toxicity data. Linear models were able to account for 63% of the variation observed between
log10TA and pH in the Broderius et al. (1985) data. Similarly, 28 to 51% of the variation observed in the
remaining datasets could be accounted for using linear models. It was clear that linear models showed very
weak relationships between log10TA and temperature for the selected data, again supporting the decision to
not include a temperature component in the acute ammonia relationship.

Evaluation of the EPA Recalculation Procedure Technical Report in the Arid West 4-13 May 2006
Although pH relationships were more robust than the temperature relationships, the linear model approach
still has shortcomings when trying to set CMC values. For example, at lower pH’s (6 to 6.5), the residual error
of the linear models increased, exhibiting a poorer fit to potential ammonia toxicity (and EPA’s curves) within
this pH range (Figure 4-1). Theoretically, within this lower pH range, ammonia toxicity might be expected to
reach an asymptotic level based on the chemical speciation of ammonia (NH3) and ammonium ion (NH4+) –
and this is the basis for EPA’s “S-shaped” curves.
0
50
100
150
200
6.5 7.0 7.5 8.0 8.5 9.0
pH
TA-N
(mg/
L)
invertebratesfishunionid musselsU.S. EPA salmonids presentU.S. EPA salmonids absentBest Fit Regression
NOTES: The red line is the EPA CMC with salmonids present; green line is EPA CMC with salmonids absent; blue line is the best fit regression model representing the 5th percentile of data. Note the divergence between the EPA and best fit models at pH <7.
Figure 4-1
pH Dependency of Acute Ammonia Toxicity Models
Given the shortcomings of the linear model approach for developing ammonia toxicity criteria and the
potential problems with developing such a different curve from the EPA versions, our review simply updated
the “salmonids present” and “salmonids absent” curves using the same inflection points developed by the
EPA (1999) with our updated database.

Evaluation of the EPA Recalculation Procedure Technical Report in the Arid West 4-14 May 2006
However, before adjusting the “salmonids present or absent” curves with the new data, it was necessary to
address outstanding issues in the EPA acute equations. Specifically, there was a concern with EPA’s use of a
modified SMAV based on “large” Oncorhynchus mykiss in the development of their “salmonids present”
equation. Thurston and Russo (1983) examined the response of various age-class rainbow trout (<1d to 4yr
old) to acute toxicity and found that the tolerance to ammonia toxicity increased through larval development
stages, peaking at the juvenile-yearling stage and decreasing in older fish. One caveat of their study is that
age-class conclusions were based on regression results from fish that were <1d to 302 days old from the same
egg lot, but then applied to fish that were 4 years old from a different egg lot.
Based on Thurston and Russo’s (1983) conclusions, the EPA lowered the SMAV for O. mykiss from 21.95
mg N/L to 11.23 mg N/L. In our review of the Thurston and Russo (1983) data we were unable to duplicate
the geometric mean of LC50 values of 11.23 mg N/L for “large” rainbow trout that the EPA determined and
used to develop the “salmonids present” acute equation.
Because this size class relationship to acute ammonia has not been observed in other studies of rainbow trout
(e.g., Calamari et al.1981, Arthur et al. 1987, Wicks and Randall 2002), and the fact that the EPA did not
clearly define “large” rainbow trout (i.e., simply > 1 kg), led us to an alternative and perhaps more defensible
approach to accounting for potential different sensitivities of warm and cold-water biota to ammonia. It was
decided to re-categorize the updated database into two databases as either cold-water or warm-water species.
This method alleviates the preferential treatment given to one age-class of a single species when setting
national, or even regional, criteria. This does not mean that sensitive age-classes of a species should not be
protected, rather that this aspect of the ammonia criteria should be based on a more robust scientific approach
than is currently the case. This is potentially an area where further age-class studies are needed to support
such hypotheses that there is a size class relationship to acute ammonia toxicity.
Due to the various data reporting methods, LC50 results for ammonia toxicity were converted to TA-N and
normalized to pH 8, as described earlier. Toxicity values that were published as “greater than” or “less than”
values were not used. No temperature adjustment was made, consistent with the EPA document. The
geometric mean of the normalized pH 8 acute values (AV), were computed for each species (SMAV).
Similarly, the GMAV were computed for each genera (GMAV = geometric mean of SMAV).
The database was then split into two lists of species, cold and warm water species (Table 4-4). Placement of
each species was determined from their preferred habitat type. Species commonly found in both habitat types
or representative of species found in one or the other habitat type were included in both data subsets. These

Evaluation of the EPA Recalculation Procedure Technical Report in the Arid West 4-15 May 2006
species included all invertebrates, except the freshwater mussels. Once divided, each database still met the
requirements for data inclusion in criteria development (i.e., the “eight family rule”), with the understandable
exception that the warm-water database did not specifically include a representative from the Salmonidae
family. For each habitat category, the GMAVs were ranked from the highest (n) to lowest (1) value with a
cumulative probability assigned to each value (Stephan et al. 1985). The four lowest GMAVs were used to
calculate the FAV for each data subset.
Table 4-4 Recalculated Species Mean Acute Values (SMAV) using the Revised and
Updated Acute Toxicity Database and Ranked Genus Mean Acute Values (GMAV)
Rank Species Common Name GMAV (mg TA-N/L)
SMAV (mg TA-N/L)
Habitat Typeb
56 Erythromma najas Damselfly 308.62 308.62 1, 2 55 Philarctus quaeris Crayfish 282.09 282.09 1, 2 54 Drunella grandis Mayfly 189.16 189.16 1, 2 53 Orconectes immunis Crayfish 178.31 770.46 1, 2 Orconectes naias Crayfish 41.27 1, 2
52 Caecidotea racovitzai Isopod 165.94 165.94 1, 2 51 Lestes sponsa Dragonfly 139.48 139.48 1, 2 50 Stenelmis sexlineata Beetle 113.17 113.17 1, 2 49 Callibaetis skokianus Mayfly 111.62 164.08 1, 2 Callibaetis sp. Mayfly 75.93 1, 2
48 Sympetrum flaveolum Dragonfly 100.50 100.50 1, 2 47 Tubifex tubifex Tubificid worm 97.82 97.82 1, 2 46 Gammarus pulex Amphipod 95.40 95.40 1, 2 45 Baetis rhodani Mayfly 94.19 94.19 1, 2 44 Crangonyx pseudogracilis Amphipod 87.53 83.19 1, 2 Crangonyx sp. Amphipod 92.10 1, 2
43 Skwala americana Stonefly 77.10 77.10 1, 2 42 Physa gyrina Snail 74.48 74.48 1, 2 41 Cyprinodon sp. Minnow 63.79 63.79 2 40 Helisoma trivolvis Snail 60.84 60.84 1, 2 39 Cottus bairdii Mottled Sculpin 51.73 51.73 1 38 Hyalella azteca Amphipod 51.34 51.34 1, 2 37 Pimephales promelas Fathead minnow 41.89 41.89 2 36 Simocephalus vetulus Cladoceran 38.13 38.13 1, 2 35 Catostomus commersonii White sucker 38.12 45.82 1, 2 Catostomus platyrynchus Mountain sucker 31.71 1, 2
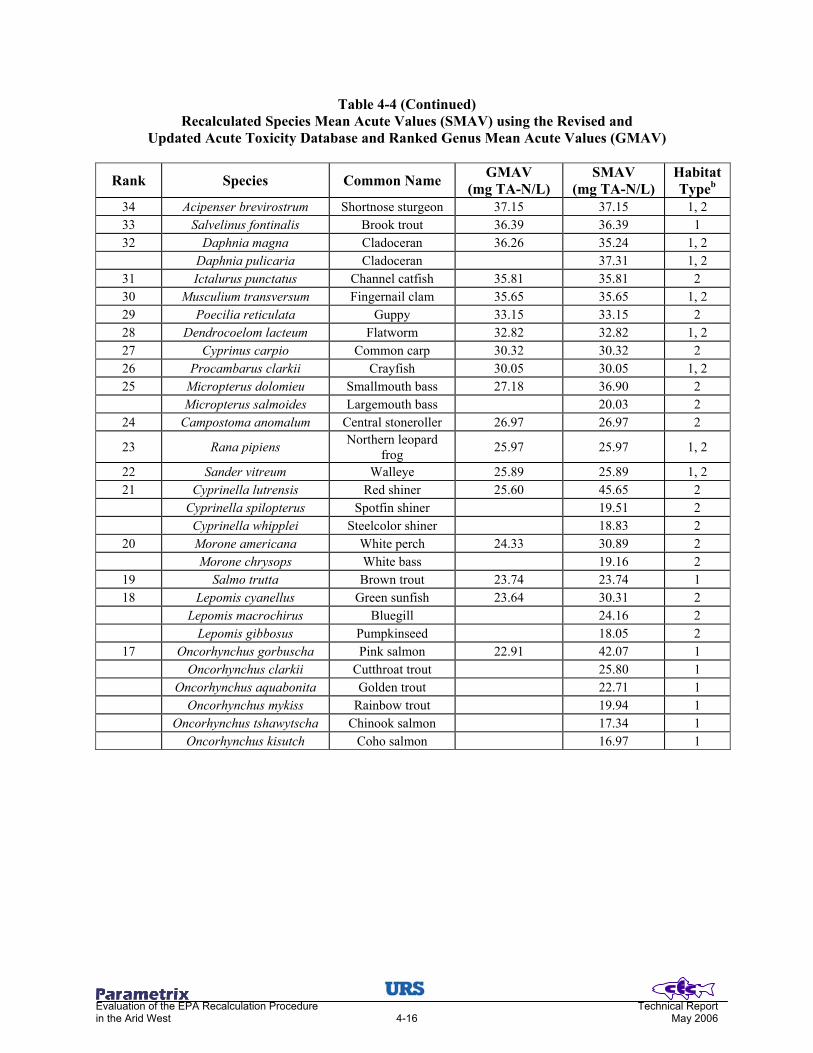
Evaluation of the EPA Recalculation Procedure Technical Report in the Arid West 4-16 May 2006
Table 4-4 (Continued) Recalculated Species Mean Acute Values (SMAV) using the Revised and
Updated Acute Toxicity Database and Ranked Genus Mean Acute Values (GMAV)
Rank Species Common Name GMAV (mg TA-N/L)
SMAV (mg TA-N/L)
Habitat Typeb
34 Acipenser brevirostrum Shortnose sturgeon 37.15 37.15 1, 2 33 Salvelinus fontinalis Brook trout 36.39 36.39 1 32 Daphnia magna Cladoceran 36.26 35.24 1, 2 Daphnia pulicaria Cladoceran 37.31 1, 2
31 Ictalurus punctatus Channel catfish 35.81 35.81 2 30 Musculium transversum Fingernail clam 35.65 35.65 1, 2 29 Poecilia reticulata Guppy 33.15 33.15 2 28 Dendrocoelom lacteum Flatworm 32.82 32.82 1, 2 27 Cyprinus carpio Common carp 30.32 30.32 2 26 Procambarus clarkii Crayfish 30.05 30.05 1, 2 25 Micropterus dolomieu Smallmouth bass 27.18 36.90 2 Micropterus salmoides Largemouth bass 20.03 2
24 Campostoma anomalum Central stoneroller 26.97 26.97 2
23 Rana pipiens Northern leopard frog 25.97 25.97 1, 2
22 Sander vitreum Walleye 25.89 25.89 1, 2 21 Cyprinella lutrensis Red shiner 25.60 45.65 2 Cyprinella spilopterus Spotfin shiner 19.51 2 Cyprinella whipplei Steelcolor shiner 18.83 2
20 Morone americana White perch 24.33 30.89 2 Morone chrysops White bass 19.16 2
19 Salmo trutta Brown trout 23.74 23.74 1 18 Lepomis cyanellus Green sunfish 23.64 30.31 2 Lepomis macrochirus Bluegill 24.16 2 Lepomis gibbosus Pumpkinseed 18.05 2
17 Oncorhynchus gorbuscha Pink salmon 22.91 42.07 1 Oncorhynchus clarkii Cutthroat trout 25.80 1 Oncorhynchus aquabonita Golden trout 22.71 1 Oncorhynchus mykiss Rainbow trout 19.94 1 Oncorhynchus tshawytscha Chinook salmon 17.34 1 Oncorhynchus kisutch Coho salmon 16.97 1

Evaluation of the EPA Recalculation Procedure Technical Report in the Arid West 4-17 May 2006
Table 4-4 (Continued) Recalculated Species Mean Acute Values (SMAV) using the Revised and
Updated Acute Toxicity Database and Ranked Genus Mean Acute Values (GMAV)
Rank Species Common Name GMAV (mg TA-N/L)
SMAV (mg TA-N/L)
Habitat Typeb
16 Hybognathus amarus Rio grande silvery minnow 20.26 20.26 2 15 Chasmistes brevirostris Shortnose sucker 19.61 19.61 2 14 Etheostoma spectabile Orangethroat darter 18.14 18.14 2 13 Ceriodaphnia dubia Cladoceran 17.42 22.17 1, 2
Ceriodaphnia acanthina Cladoceran 13.68 1, 2 12 Deltistes luxatus Lost river sucker 16.01 16.01 2 11 Gambusia affinis Mosquitofish 15.25 15.25 2 10 Notemigonus chrysoleucas Golden shiner 14.67 14.67 2 9 Prosopium williamsoni Mountain whitefish 12.11 12.11 1 8 Actinonaias pectorosa Pheasantshell mussel 10.38 10.38 2c 7 Utterbackia imbecilis Paper pondshell mussel 8.43 8.43 2c 6 Lampsilis cardium Plain pocketbook mussel 8.01 22.14 2c Lampsilis fasciola Wavy-rayed lampmussel 9.55 2c Lampsilis siliquoidea Fatmucket mussel 2.43 2c 5 Villosa iris Rainbow mussel 6.45 6.45 2c 4 Pyganodon grandis Giant floater mussel 4.70 4.70 2c
3 Medionidus conradicus Cumberland moccasinshell mussel 4.47 4.47 2c
2 Lasmigona subviridis Green floater mussel 2.82 2.82 2c 1 Fusconaia masoni Atlantic pigtoe mussel 1.34 1.34 2c
aGMAV and SMAV are reported as total ammonia nitrogen at pH = 8, mg N/L b1 = cold water, 2 = warm water cUnionidae
Within the cold-water species database (32 genera), the four most sensitive genera were the Salmo (23.7 mg
TA-N/L), Oncorhynchus (22.9 mg TA-N/L), Ceriodaphnia (17.4 mg TA-N/L), and Prosopium (12.1 mg TA-
N/L). Using these data, the FAV was 15.3 mg TA-N/L for cold-water species; a value slightly higher than the
11.23 mg TA-N/L EPA used for “salmonids present” (Table 4-5).
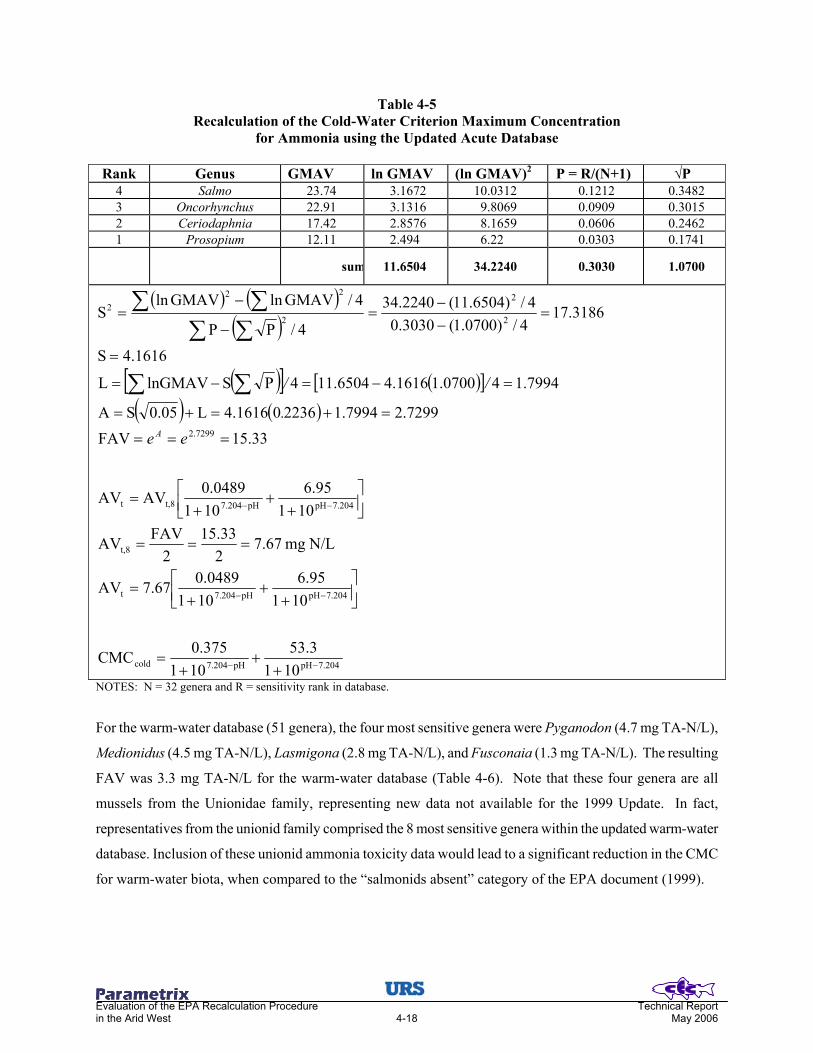
Evaluation of the EPA Recalculation Procedure Technical Report in the Arid West 4-18 May 2006
Table 4-5 Recalculation of the Cold-Water Criterion Maximum Concentration
for Ammonia using the Updated Acute Database Rank Genus GMAV ln GMAV (ln GMAV)2 P = R/(N+1) √P
4 Salmo 23.74 3.1672 10.0312 0.1212 0.3482 3 Oncorhynchus 22.91 3.1316 9.8069 0.0909 0.3015 2 Ceriodaphnia 17.42 2.8576 8.1659 0.0606 0.2462 1 Prosopium 12.11 2.494 6.22 0.0303 0.1741
sum 11.6504 34.2240 0.3030 1.0700
( ) ( )( )
( )[ ] ( )[ ]( ) ( )
7.204pHpH7.204cold
7.204pHpH7.204t
t,8
7.204pHpH7.204t,8t
2.7299
2
2
2
222
10153.3
1010.375CMC
1016.95
1010.048967.7AV
N/L mg 67.72
15.332
FAVAV
1016.95
1010.0489AVAV
33.51FAV7299.27994.1223601616.4L0.05SA
7994.141.07001616.46504.114PSlnGMAVL
1616.4S
3186.714/)0700.1(3030.04/)6504.11(2240.34
4/PP
4/GMAVlnGMAVlnS
−−
−−
−−
++
+=
++
+=
===
++
+=
===
=+=+=
=−=−=
=
=−−
=−
−=
∑ ∑
∑ ∑∑ ∑
ee.
//
A
NOTES: N = 32 genera and R = sensitivity rank in database.
For the warm-water database (51 genera), the four most sensitive genera were Pyganodon (4.7 mg TA-N/L),
Medionidus (4.5 mg TA-N/L), Lasmigona (2.8 mg TA-N/L), and Fusconaia (1.3 mg TA-N/L). The resulting
FAV was 3.3 mg TA-N/L for the warm-water database (Table 4-6). Note that these four genera are all
mussels from the Unionidae family, representing new data not available for the 1999 Update. In fact,
representatives from the unionid family comprised the 8 most sensitive genera within the updated warm-water
database. Inclusion of these unionid ammonia toxicity data would lead to a significant reduction in the CMC
for warm-water biota, when compared to the “salmonids absent” category of the EPA document (1999).

Evaluation of the EPA Recalculation Procedure Technical Report in the Arid West 4-19 May 2006
Table 4-6 Recalculation of the Warm-Water with Unionidae CMC
for Ammonia using the Updated Acute Database
Rank Genus GMAV ln GMAV (ln GMAV)2 P = R/(N+1) √P 4 Pyganodon 4.70 1.5476 2.3951 0.0769 0.2774 3 Medionidus 4.47 1.4974 2.2422 0.0577 0.2402 2 Lasmigona 2.82 1.0367 1.0747 0.0385 0.1961 1 Fusconaia 1.34 0.2927 0.0857 0.0192 0.1387 sum 4.3744 5.7977 0.1923 0.8524
( ) ( )( )
( )[ ] ( )[ ]( ) ( )
7.204pHpH7.204warm
7.204pHpH7.204t
t,8
7.204pHpH7.204t,8t
196.1
2
2
2
222
10111.5
1010.081CMC
1016.95
1010.048966.1AV
N/L mg 66.12
3.312
FAVAV
1016.95
1010.0489AVAV
31.3FAV1961.19845.02236.07518.9L0.05SA
9845.04/8524.07518.93744.44/PSlnGMAVL
7518.9S
0973.954/)8524.0(1923.04/)3744.4(7977.5
/4PP
/4lnGMAVlnGMAVS
−−
−−
−−
++
+=
++
+=
===
++
+=
===
=−=+=
−=−=−=
=
=−−
=−
−=
∑ ∑
∑ ∑∑ ∑
ee A
NOTES: N = 51 genera and R = sensitivity rank in database.
While widespread throughout the Midwest and eastern U.S., there is uncertainty for unionid distribution
within the arid West (e.g., Wu and Brandauer 1978). In addition, there is apparent potential for further EPA
technical review of these studies (Federal Register 2004). As such, we also analyzed the warm-water
database minus the Unionidae family (although other freshwater clams were retained).
This modified warm-water database still contained 43 genera, with Ceriodaphnia (17.4 mg TA-N/L),
Deltistes (16.0 mg TA-N/L), Gambusia (15.3 mg TA-N/L), and Notemigonus (14.7 mg TA-N/L) being the
four most sensitive genera. The FAV for this warm-water database minus unionid clams was 15.9 mg TA-
N/L (Table 4-7).
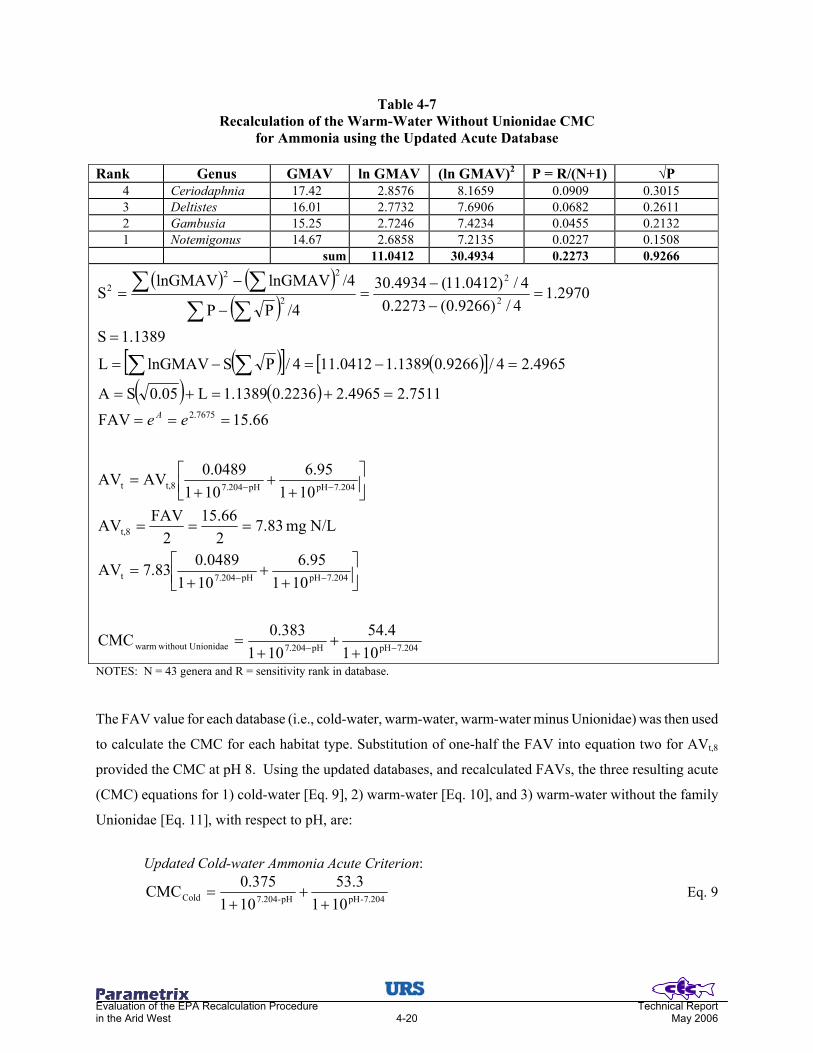
Evaluation of the EPA Recalculation Procedure Technical Report in the Arid West 4-20 May 2006
Table 4-7 Recalculation of the Warm-Water Without Unionidae CMC
for Ammonia using the Updated Acute Database Rank Genus GMAV ln GMAV (ln GMAV)2 P = R/(N+1) √P
4 Ceriodaphnia 17.42 2.8576 8.1659 0.0909 0.3015 3 Deltistes 16.01 2.7732 7.6906 0.0682 0.2611 2 Gambusia 15.25 2.7246 7.4234 0.0455 0.2132 1 Notemigonus 14.67 2.6858 7.2135 0.0227 0.1508
sum 11.0412 30.4934 0.2273 0.9266
( ) ( )( )
( )[ ] ( )[ ]( ) ( )
7.204pHpH7.204nionidae without Uwarm
7.204pHpH7.204t
t,8
7.204pHpH7.204t,8t
2.7675
2
2
2
222
10154.4
1010.383CMC
1016.95
1010.048983.7AV
N/L mg 83.72
15.662
FAVAV
1016.95
1010.0489AVAV
66.15FAV7511.24965.22236.01389.1L0.05SA
4965.24/9266.01389.10412.114/PSlnGMAVL
1389.1S
2970.14/)9266.0(2273.04/)0412.11(4934.30
/4PP
/4lnGMAVlnGMAVS
−−
−−
−−
++
+=
++
+=
===
++
+=
===
=+=+=
=−=−=
=
=−−
=−
−=
∑ ∑
∑ ∑∑ ∑
ee A
NOTES: N = 43 genera and R = sensitivity rank in database.
The FAV value for each database (i.e., cold-water, warm-water, warm-water minus Unionidae) was then used
to calculate the CMC for each habitat type. Substitution of one-half the FAV into equation two for AVt,8
provided the CMC at pH 8. Using the updated databases, and recalculated FAVs, the three resulting acute
(CMC) equations for 1) cold-water [Eq. 9], 2) warm-water [Eq. 10], and 3) warm-water without the family
Unionidae [Eq. 11], with respect to pH, are:
Updated Cold-water Ammonia Acute Criterion:
7.204-pHpH-7.204Cold 1013.53
1010.375CMC
++
+= Eq. 9

Evaluation of the EPA Recalculation Procedure Technical Report in the Arid West 4-21 May 2006
Updated Warm-water Ammonia Acute Criterion:
7.204pHpH7.204Warm 1015.11
101081.0CMC −− +
++
= Eq. 10
Updated Warm-water without Unionidae Ammonia Acute Criterion:
7.204-pHpH-7.204nionidae without UWarm 1013.55
1010.388CMC
++
+= Eq. 11
Each equation was solved for an acute criterion given a range of pH values (6.5-9), producing an ammonia
concentration that protects all but the most sensitive 5% of organisms in the revised toxicity databases (see
Table 4-8). These values were then compared to the existing “salmonids present” and “salmonids absent”
acute ammonia equations in the EPA 1999 AWQC (Figure 4-2).
0
10
20
30
40
50
7.0 7.5 8.0 8.5 9.0
pH
TA-N
(mgN
/L)
US EPA Salmonids presentUS EPA Salmonids absentUpdated Cold waterUpdated Warm waterUpdated Warm water without Unionidae
Figure 4-2 Comparison of EPA 1999 and Criterion Maximum Concentrations
for TA-N given a range of pH values from 7.0 to 9.0

Evaluation of the EPA Recalculation Procedure Technical Report in the Arid West 4-22 May 2006
Table 4-8 Comparative TA-N Concentrations Given pH for
EPA (1999) Acute Criteria and Proposed Updated Acute Criteria
EPA 1999 Acute Criteria Revised and Updated Acute Criteria
CMC (Salmonids
present)
CMC (Salmonids
absent)
Cold-water Biota
Warm Water Biota with Unionids
Warm Water Biota without
Unionids
pH
(TA-N mg/L) (TA-N mg/L) (TA-N mg/L) (TA-N mg/L) (TA-N mg/L)
6.5 32.61 48.83 44.56 9.62 45.48 6.6 31.28 46.84 42.75 9.22 43.64 6.7 29.76 44.57 40.67 8.78 41.51 6.8 28.05 42.00 38.33 8.27 39.12 6.9 26.15 39.16 35.74 7.71 36.48 7.0 24.10 36.09 32.94 7.11 33.62 7.1 21.94 32.86 29.99 6.47 30.61 7.2 19.73 29.54 26.96 5.82 27.52 7.3 17.51 26.21 23.92 5.16 24.42 7.4 15.34 22.97 20.97 4.52 21.40 7.5 13.28 19.89 18.15 3.92 18.53 7.6 11.37 17.03 15.54 3.35 15.87 7.7 9.64 14.44 13.18 2.84 13.45 7.8 8.11 12.14 11.08 2.39 11.31 7.9 6.77 10.13 9.25 2.00 9.44 8.0 5.62 8.41 7.67 1.66 7.83 8.1 4.64 6.95 6.34 1.37 6.47 8.2 3.83 5.73 5.23 1.13 5.33 8.3 3.15 4.71 4.30 0.93 4.39 8.4 2.59 3.88 3.54 0.76 3.62 8.5 2.14 3.20 2.92 0.63 2.98 8.6 1.77 2.65 2.42 0.52 2.47 8.7 1.47 2.20 2.01 0.43 2.05 8.8 1.23 1.84 1.68 0.36 1.72 8.9 1.04 1.56 1.42 0.31 1.45 9.0 0.88 1.32
1.21 0.26 1.23 The notable differences between the EPA acute equations and our revised and updated equations are the
upward shift for the new “cold-water” acute values as compared to the “salmonids present” acute values in the
EPA document and the 5-fold decrease in the new “warm-water with unionids” acute values as compared to
the “salmonids absent” acute values from EPA. This substantial decrease is solely due to the inclusion of data
for warm-water mussels in the family Unionidae. When these organisms are removed from the database, the
resulting “warm-water without Unionidae” curve is comparable to the EPA “salmonids absent” curve, with

Evaluation of the EPA Recalculation Procedure Technical Report in the Arid West 4-23 May 2006
only a slight downward shift in the CMC (i.e., the revised warm-water curve is more restrictive than the EPA
“salmonids absent” curve).
Although verification of the EPA’s acute value model (AVTA) remains somewhat questionable (i.e., lack of
specifics regarding empirical data), we generally accepted their formulation of acute equations with a few
notable exceptions. The EPA’s use of a modified O. mykiss SMAV combined with the decision not to include
the most current data available resulted in the development of outdated and potentially biased ammonia
criteria. Therefore, we believe an alternate and scientifically sound approach to developing acute ammonia
criteria would be to amend the EPA database by excluding questionable data and including the most current
data available, and further excluding the preferential age-class SMAV for O. mykiss.
The “new” database is then split based on habitat types (i.e., cold, warm, and warm-water without Unionidae),
with “new” FAVs being calculated for each habitat type. These values are the basis for the updated cold,
warm, and warm-water without Unionidae acute equations using the EPA’s pH-dependent relationship.
4.3.2 Updated Chronic Criteria for Ammonia
The EPA’s development of the chronic equations based on temperature and pH creates a variety of concerns.
1. Firstly, the existing chronic database (EPA 1999) does not meet the EPA guidelines for deriving
numerical national ambient water quality criteria (Stephan et al. 1985). The database does not
contain representatives from the family Salmonidae, class Insecta, or another phylum not already
present in the database. This should have precluded development of chronic criteria directly
from that database. Another approach, such as use of an ACR, should have been used.
2. The temperature-dependent chronic toxicity model developed by EPA is based on a single acute
toxicity study in which the authors themselves explicitly state that no relationships were observed
between acute ammonia toxicity and temperature.
3. The most sensitive organism in the limited chronic database, the amphipod Hyalella azteca (EC50
<1.45 mg N/L), was used to develop a temperature-based function to protect early life stage fish.
Obviously, it is difficult to understand how an amphipod can be used as a substitution for an
early life stage fish.
Evaluation of the EPA Recalculation Procedure Technical Report in the Arid West 4-24 May 2006
4. Lastly, this H.azteca test (Borgmann 1994) is questionable for use in criteria development since
there was significant control mortality (only 66% control survival), which is much higher than
should be allowed for use in development of reliable toxicity data. The EPA chronic toxicity
guidelines require >80% survival in the control treatment, as partial fulfillment of MDRs before
data may be included in criteria development (EPA 2002).
In addition, the use of only two genera (Lepomis and Hyalella) as the basis for the chronic equation precludes
the use of the recalculation procedure to modify chronic criteria on a site-specific basis. These major
shortcomings of the EPA chronic ammonia criteria led us to re-evaluate the use of acute-chronic ratios (ACR)
to adjust the acute equations and simply develop chronic ammonia criteria for cold and warm-water habitats
and warm-water habitats without Unionidae.
To derive ACRs, we used the SMAV and GMAV values from the updated acute database and the pH-8
corrected SMCV and GMCV values from the updated chronic database (Table 4-9) for matching species.
Species mean final ACR (SM FACR, 4.7) and genus mean final ACR (GM FACR, 4.9) were calculated for
all species/genera with both acute and chronic data. We did not limit our ACR calculations to studies that
computed both LC50 and EC20 values for a single species given the same experimental conditions, which is a
slight deviation from the 1985 Guidelines. Strict application of the 1985 Guidelines was deemed too
restrictive for ammonia, given the paucity of “acceptable” chronic data - especially acceptable chronic data
with concurrent acute toxicity data. Rather, we used the summary statistics for each genus or species
(S/GMAVs and S/GMCVs) from the available database. Using this approach, the reported species and genus
mean values may differ (e.g. D. magna; Table 4-9) if toxicity data are available for more than one species
within a generus (Table 4.4), yet not all species have paired acute and chronic values.
The resulting GM FACR (4.9) represents a somewhat more realistic relationship between acute and chronic
toxicity than the SM FACR since all ACRs included in the calculation are greater than 1 (see Table 4-9).
Therefore, the GM FACR was used in the updated chronic criteria derivation.
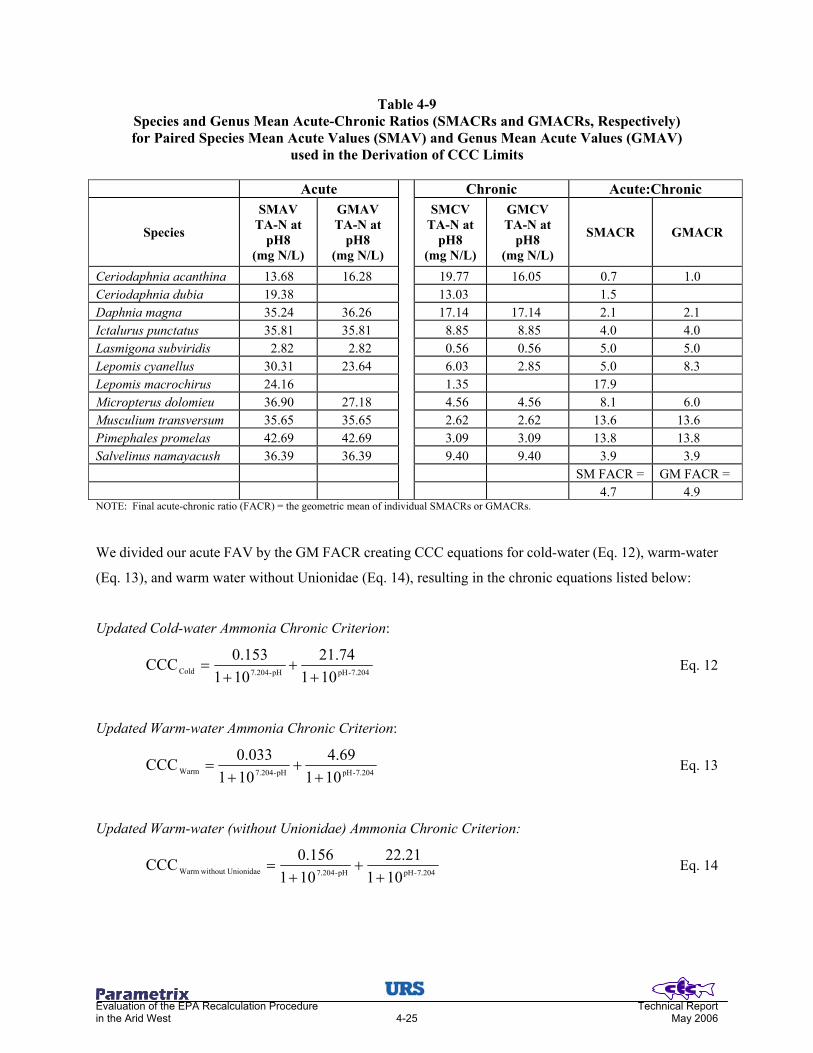
Evaluation of the EPA Recalculation Procedure Technical Report in the Arid West 4-25 May 2006
Table 4-9 Species and Genus Mean Acute-Chronic Ratios (SMACRs and GMACRs, Respectively) for Paired Species Mean Acute Values (SMAV) and Genus Mean Acute Values (GMAV)
used in the Derivation of CCC Limits
Acute Chronic Acute:Chronic
Species
SMAV TA-N at
pH8 (mg N/L)
GMAV TA-N at
pH8 (mg N/L)
SMCV TA-N at
pH8 (mg N/L)
GMCV TA-N at
pH8 (mg N/L)
SMACR GMACR
Ceriodaphnia acanthina 13.68 16.28 19.77 16.05 0.7 1.0 Ceriodaphnia dubia 19.38 13.03 1.5 Daphnia magna 35.24 36.26 17.14 17.14 2.1 2.1 Ictalurus punctatus 35.81 35.81 8.85 8.85 4.0 4.0 Lasmigona subviridis 2.82 2.82 0.56 0.56 5.0 5.0 Lepomis cyanellus 30.31 23.64 6.03 2.85 5.0 8.3 Lepomis macrochirus 24.16 1.35 17.9 Micropterus dolomieu 36.90 27.18 4.56 4.56 8.1 6.0 Musculium transversum 35.65 35.65 2.62 2.62 13.6 13.6 Pimephales promelas 42.69 42.69 3.09 3.09 13.8 13.8 Salvelinus namayacush 36.39 36.39 9.40 9.40 3.9 3.9 SM FACR = GM FACR =
4.7 4.9 NOTE: Final acute-chronic ratio (FACR) = the geometric mean of individual SMACRs or GMACRs.
We divided our acute FAV by the GM FACR creating CCC equations for cold-water (Eq. 12), warm-water
(Eq. 13), and warm water without Unionidae (Eq. 14), resulting in the chronic equations listed below:
Updated Cold-water Ammonia Chronic Criterion:
7.204-pHpH-7.204Cold 10174.21
1010.153CCC
++
+= Eq. 12
Updated Warm-water Ammonia Chronic Criterion:
7.204-pHpH-7.204Warm 10169.4
1010.033CCC
++
+= Eq. 13
Updated Warm-water (without Unionidae) Ammonia Chronic Criterion:
7.204-pHpH-7.204nionidae without UWarm 10121.22
1010.156CCC
++
+= Eq. 14

Evaluation of the EPA Recalculation Procedure Technical Report in the Arid West 4-26 May 2006
For comparative purposes, we present resulting criteria based on the original EPA chronic equations and our
revised chronic equations (see Figure 4-3 and Table 4-10). For this comparison, we set the temperature
values in the EPA early life stage present/absent equations to 25°C and 12°C, with the assumption that these
two temperatures values would most closely match our warm water, cold-water scenario. At temperatures
>14.5 °C, the EPA CCC relationship for early life stage fish present or absent are the same, because the
Hyalella temperature-based function is controlling the CCC (Figure 4-3). At temperatures <14.5°C, these two
relationships begin to diverge.
0
2
4
6
8
10
12
14
16
18
20
7.0 7.5 8.0 8.5 9.0
pH
TA-N
(mgN
/L)
US EPA-CCC Fish ELS Present @ 25°CUS EPA-CCC Fish ELS Absent @ 25°CUS EPA-CCC Fish ELS Present @ 12°CUS EPA-CCC Fish ELS Absent @ 12°CUpdated CCC cold waterUpdated CCC warm waterUpdated CCC warm water without Unionidae
NOTE: For comparative purposes, the EPA functions were set at 25°C and 12°C to closely approximate the updated cold-water, warm water scenario.
Figure 4-3 Comparison of the EPA and updated Criterion Continuous
Concentration Functions over a pH Range of 7.0-9.0

Evaluation of the EPA Recalculation Procedure Technical Report in the Arid West 4-27 May 2006
Table 4-10 Comparative TA-N Concentrations Given pH for EPA (1999)
Chronic Criteria and Updated Chronic Criteria
EPA Chronic Relationship Updated Chronic Relationship CCC Fish
ELS Present @ 12°C
CCC Fish ELS Absent
@ 12°C
CCC Fish ELS Present
@ 25°C
CCC Fish ELS Absent
@ 25°C
CCC Cold Water
CCC Warm Water w/ Unionids
CCC Warm Water w/o Unionids
pH
(TA-N mg/L) (TA-N mg/L) (TA-N mg/L) (TA-N mg/L) (TA-N mg/L) (TA-N mg/L) (TA-N mg/L) 6.5 6.67 7.84 3.39 3.39 18.18 3.92 18.57 6.6 6.56 7.72 3.34 3.34 17.44 3.76 17.81 6.7 6.44 7.58 3.28 3.28 16.59 3.58 16.95 6.8 6.29 7.40 3.20 3.20 15.63 3.37 15.97 6.9 6.12 7.20 3.11 3.11 14.58 3.14 14.89 7.0 5.91 6.95 3.01 3.01 13.44 2.90 13.73 7.1 5.67 6.67 2.88 2.88 12.23 2.64 12.50 7.2 5.39 6.34 2.74 2.74 11.00 2.37 11.23 7.3 5.08 5.97 2.58 2.58 9.76 2.11 9.97 7.4 4.73 5.57 2.41 2.41 8.55 1.84 8.74 7.5 4.36 5.13 2.22 2.22 7.40 1.60 7.56 7.6 3.98 4.68 2.02 2.02 6.34 1.37 6.48 7.7 3.58 4.21 1.82 1.82 5.38 1.16 5.49 7.8 3.18 3.74 1.62 1.62 4.52 0.97 4.62 7.9 2.80 3.29 1.42 1.42 3.77 0.81 3.85 8.0 2.43 2.86 1.24 1.24 3.13 0.68 3.20 8.1 2.10 2.47 1.07 1.07 2.59 0.56 2.64 8.2 1.79 2.11 0.91 0.91 2.13 0.46 2.18 8.3 1.52 1.79 0.78 0.78 1.76 0.38 1.79 8.4 1.29 1.52 0.66 0.66 1.45 0.31 1.48 8.5 1.09 1.28 0.55 0.55 1.19 0.26 1.22 8.6 0.92 1.08 0.47 0.47 0.99 0.21 1.01 8.7 0.78 0.92 0.40 0.40 0.82 0.18 0.84 8.8 0.66 0.78 0.34 0.34 0.69 0.15 0.70 8.9 0.56 0.66 0.29 0.29 0.58 0.12 0.59 9.0 0.49 0.57 0.25 0.25
0.49 0.11 0.50
This warm-water with Unionids CCC is slightly more restrictive than the EPA’s CCC between a range of pH
from 7.0 to 9.0. The cold-water CCC is considerably less restrictive than the EPA early life stage present at
low pH, although it becomes very similar at pH levels >8.0. Similarly, the updated cold-water criteria is less
restrictive at low pH values than the EPA early life stage absent function adjusted to 12 °C, and approximates
the national limits at pH levels >8.0. It is important to note that if unionids are not present in warm-water
habitats the updated warm water without unionids CCC is very similar to the updated cold-water criteria, and
considerably less restrictive than the existing EPA early life stage CCC functions adjusted to 25°C.

Evaluation of the EPA Recalculation Procedure Technical Report in the Arid West 4-28 May 2006
Owing to the lack of chronic ammonia data (not meeting the “8 family rule”), the EPA’s current derivation of
chronic ammonia criteria is questionable. Additional data, as yet developed, are required to support the
EPA’s assumption that early life stage fish are more sensitive than juveniles or adults to chronic ammonia
toxicity, and that there is a statistically significant temperature dependence chronic toxicity response for biota.
As such, we strongly recommend using an FACR modified acute pH-only relationship to set chronic
ammonia criteria.
4.3.3 Conclusions and Recommendations for Revised Ammonia Criteria
The modifications to the national acute and chronic ammonia water quality criteria above are more
appropriate for the range of aquatic habitats found in the arid West. First, the revised acute ammonia criteria
were based on the most current data available for cold-water (32 genera) and warm-water (51 genera) biota.
Initially, dividing data between the warm-water/cold-water databases appeared to circumvent concerns
associated with “salmonids” present/absent criteria. However, recent toxicological studies using freshwater
mussels (Unionidae) have provided insight about a highly sensitive group, one that ultimately dominated the
derivation of our warm-water acute ammonia criteria. Given the lack of Unionidae in the arid West (see
Chapter 2), we created a sub-category within the warm-water database excluding Unionidae. As presented,
our acute equations, which are based on three distinct habitat types (cold, warm, warm water without
Unionidae) should protect species along the elevation gradient from high mountain ecosystems to desert
ecosystems. We believe criteria based on habitat categories are scientifically more sound and practical,
because they are based on organisms typically found within each habitat type and exclude species not
pertinent to any particular the ecosystem.
Unfortunately, the paucity of chronic ammonia data created many procedural inadequacies in the derivation of
chronic ammonia criteria. Foremost, even the updated chronic database does not meet national criteria
guidelines for deriving numerical water quality criteria via derivation of a 5th percentile-based final chronic
value. Therefore, we opted to derive chronic criteria equations using acute-to-chronic ratios for matched
species data. We applied the FACR to our acute equations for each habitat type, creating chronic equations
for cold-water, warm-water and warm-water without Unionidae.
4.4 LITERATURE CITED
Anderson, K.B., R.E. Sparks, and A.A. Paparo. 1978. Rapid Assessment of Water Quality, Using the Fingernail Clam, Musculium transversum. WRC Research Report No. 133. University of Illinois, Water Resources Center, Urbana, IL.
Evaluation of the EPA Recalculation Procedure Technical Report in the Arid West 4-29 May 2006
Arthur, J.W., C.W. West, K.N. Allen, and S.F. Hedtke. 1987. Seasonal toxicity of ammonia to five fish and nine invertebrate species. Bulletin of Environmental Contamination and Toxicology 38:324-331.
Ashe, D., J.R. Tomasso, and A.G. Eversole. Toxicity of ammonia to fingerling white bass: Effect of selected
environments on uptake dynamics. The Progressive Fish Culturist 58:277-280. Augspurger, T., A.E. Keller, M.C. Black, W.C. Cope, and F.J. Dwyer. 2003. Water quality guidance for
protection of freshwater mussels (Unionidae) from ammonia exposure. Environmental Toxicology and Chemistry 22:2569-2575.
Bailey, H. C., J. R. Elphick, R. Krassoi, and A. Lovell. 2001. Joint acute toxicity of Diazinon and ammonia to
Ceriodaphnia dubia. Environmental Toxicology and Chemistry 20:2877-2882. Beamish, F.W.H., and A. Tandler. 1990. Ambient ammonia, diet and growth in lake trout. Aquatic
Toxicology 17:155-166. Beketov, M. A. 2002. Ammonia toxicity to larvae of Erythromma najas (Hansemann), Lestes sponsa
(Hansemann) and Sympetrum flaveolum (Linnaeus) (Zygoptera: Coenagrionidae, Lestidae; Anisoptera: Libellulidae). Odonatologica 31:297-304.
Black, M.C. 2001. Water Quality Standards for North Carolina’s Endangered Mussels. Final Report.
Department of Health Science University of Georgia, Athens, GA. Borgmann, U. 1994. Chronic toxicity of ammonia to the amphipod Hyalella azteca; importance of
ammonium ion and water hardness. Environmental Pollution 95:325-331. Broderius, S.J., and L.L. Smith. 1979. Lethal and sublethal effects of binary mixtures of cyanide and
hexavalent chromium, zinc, or ammonia to the fathead minnow (Pimphales promelas) and rainbow trout (Salmo gairdneri). Journal of the Fisheries Research Board Canada 36:164-172.
Broderius, S., R. Drummond, J. Fiandt, and C. Russom. 1985. Toxicity of ammonia to early life stages of the
smallmouth bass at four pH values. Environmental Toxicology and Chemistry 4:87-96. Buhl, K.J. 2002. The Relative Toxicity of Waterborne Inorganic Contaminants in the Rio Grande Silvery
Minnow (Hybognathus amarus) and Fathead Minnow (Pimephales promelas) in a Water Quality Simulating that in the Rio Grande, New Mexico. Final report to the U.S. Fish and Wildlife Service, Study No. 2F33-9620003, U.S. Geological Survey, Columbia Environmental Research Center, Yankton Field Research Station, South Dakota.
Burkhalter, D.E., and C.M. Kaya. 1977. Effects of prolonged exposure to ammonia on fertilized eggs and
sac fry of rainbow trout (Salmo gairdneri). Transactions of the American Fisheries Society 106:470-475. Calamari, D., R. Marchetti, and G. Vailati. 1977. Effects of prolonged treatments with ammonia on stages of
development of Salmo gairdneri. (English Translation) Nuovi Annali d’Igiene e Microbiologia. 28:333-345.
Calamari, D., R. Marchetti, and G. Vailati. 1981. Effects of long-term exposure to ammonia on fertilized
eggs and sac fry of rainbow trout (Salmo gairdneri Richardson). Rapport de P.-V. Réunion du Conseil International pour l’Exploration de la Mer. 178:81-86.

Evaluation of the EPA Recalculation Procedure Technical Report in the Arid West 4-30 May 2006
Colt, J.E., and G. Tchobanoglous. 1976. Evaluation of the short-term toxicity of nitrogenous compounds to channel catfish, Ictalurus punctatus. Aquaculture 8:209-224.
Colt, J.E., and G. Tchobanoglous. 1978. Chronic exposure of channel catfish, Ictalurus punctatus, to
ammonia: effects on growth and survival. Aquaculture 15:353-372. DeGraeve, G.M., R.L. Overcast, and H.L. Bergman. 1980. Toxicity of underground coal gasification
condenser water and selected constituents to aquatic biota. Archives for Environmental Contamination and Toxicology 9:543-555.
DeGraeve, G.M., W.D. Palmer, E.L. Moore, J.J. Coyle, and P.L. Markham. 1987. The Effect of Temperature
on the Acute and Chronic Toxicity of Un-ionized Ammonia to Fathead Minnows and Channel Catfish. Final Report to EPA by Battelle, Columbus, Ohio.
Diamond, J.M., D.G. Mackler, W.J. Rasnake, and D. Gruber. 1993. Derivation of site-specific ammonia
criteria for an effluent-dominated headwater stream. Environmental Toxicology and Chemistry 12:649-658.
Emerson, K., R.C. Russo, R.E. Lund, and R.V. Thurston. 1975. Aqueous ammonia equilibrium calculations:
effect of pH and temperature. Journal of the Fisheries Research Board of Canada 32:2379-2383. Emery, R.M., and E.B. Welch. 1969. The Toxicity of Alkaline Solutions of Ammonia to Juvenile Bluegill
Sunfish (Lepomis macrochirus RAF). Water Quality Branch, Tennessee Valley Authority, Chattanooga, TN.
Federal Registry. 2004. Notice of Intent to Re-evaluate the Aquatic Life Ambient Water Quality Criteria for
Ammonia. Environmental Protection Agency, Notices FLR-7783-8, Federal Registry Vol. 69, No. 130. Thursday July 8, 2004, pages 41262-41264.
Fontenot, Q.C., J.J. Isely, and J.R. Tomasso. 1998. Acute toxicity of ammonia and nitrite to shortnose
sturgeon fingerlings. The Progressive Fish Culturist 60:315-318. Gersich, F.M., D.L. Hopkins, S.L., Applegath, C.G. Mendoza, and D.P. Milazzo. 1985. The sensitivity of
endpoints used in Daphnia magna Straus life-cycle tests. In Bahner, R.C., and D.J. Hansen (eds.) Aquatic Toxicology and Hazard Assessment: Eighth Symposium. pp. 245-252. ASTM STP 891. American Society for Testing and Materials, Philadelphia, Pennsylvania.
Harcke, J.E. and H.V. Daniels. 1999. Acute toxicity of ammonia and nitrite to reciprocal cross hybrid striped
bass Morone chrysops × M. saxatilis eggs and larvae. Journal of the World Aquaculture Society, 30:496-500.
Harrahy, E.A., M. Barman, S. Geis, J. Hemming, D. Karner, and A. Mager. 2004. Effects of ammonia on the
early life stages of northern pike (Esox lucius). Bulletin of Environmental Contamination and Toxicology 72:1290-1296.
Hasan, M.R. and D.J. Macintosh. 1986. Acute toxicity of ammonia to common carp fry. Aquaculture 54:97-
107. Hazel, C.R. W. Thomsen, and S.J. Meith. 1971. Sensitivity of striped bass and stickleback to ammonia in
relation to temperature and salinity. California Fish and Game 57:138-153.

Evaluation of the EPA Recalculation Procedure Technical Report in the Arid West 4-31 May 2006
Holt, J.D. and S.A. Malcom. 1979. Evaluation of fish loading rates in regulatory static bioassays. Technical Report, Fisheries and Marine Services of Canada pp. 146-160.
Jude, D.J. 1973. Sublethal Effect of Ammonia and Cadmium on Growth of Green Sunfish. Ph.D. Thesis.
Michigan State University, East Lansing, Michigan. Keller, A.E. 2000 (unpublished). Water quality and toxicity data for unpublished unionid mussel tests.
U.S. Environmental Protection Agency, Science and Ecosystem Support Division, Athens, Georgia. Khatami, S. H., D. Pascoe, M. A. Learner. 1998. The acute toxicity of phenol and unionized ammonia,
separately and together, to the ephemeropteran Baetis rhodani (Pictet). Environmental Pollution 99:379-387.
Mayes, M.A., H.C. Alexander, D.L. Hopkins, and P.B. Latvaitis. 1986. Acute and chronic toxicity of
ammonia to freshwater fish: A site-specific study. Environmental Toxicology and Chemistry 5:437-442. McCormick, J.H., S.J. Broderius, and J.T. Fiandt. 1984. Toxicity of ammonia to early life stages of the green
sunfish, Lepomis cyanellus. Environmental Pollution 36:147-163. Mount, D.I. 1982. Ammonia toxicity tests with Ceriodaphnia acanthine and Simocephalus vetulus.
Memorandum to Dr. R.C. Russo, ESEPA, August 6, 1982. Mummert, A.K., R.J. Neves, T.J. Newcomb, and D.S. Cherry. 2003. Sensitivity of juvenile freshwater
mussels (Lampsilis fasciola, Villosa iris) to total and unionized ammonia. Environmental Toxicology and Chemistry 22:2545-2553.
Myers-Kinzie, M. L. 1998. Factors Affecting Survival and Recruitment of Unionid Mussels in Small
Midwestern Streams. Ph.D. Dissertation. Purdue University, West Lafayette, Indiana. Nimmo, D.W.R., D. Link, L.P. Parrish, G.J. Rodriquez, W. Wuerthele, and P.H. Davies. 1989. Comparison
of on-site and laboratory toxicity tests: Derivation of site-specific criteria for un-ionized ammonia in a Colorado transitional stream. Environmental Toxicology and Chemistry 8:1177-1189.
Newton, T.J., J.W. Allran, J.A. O’Donnell, M.R. Bartsch, and W.B. Richardson. 2003. Effects of ammonia
on juvenile unionid mussels (Lampsilis cardium) in laboratory sediment toxicity tests. Environmental Toxicology and Chemistry 22:2554-2560.
Prenter, J., C. MacNeil, J.T.A. Dick, G.E. Riddell, and A.M. Dunn. 2004. Lethal and sublethal toxicity of
ammonia to native, invasive, and parasitized freshwater amphipods. Water Research 38:2847-2850. Rankin, D.P. 1979. The Influence of Un-ionized Ammonia on the Long-term Survival of Sockeye Salmon
Eggs. Technical Report No. 912. Fisheries and Marine Service, Nanaimo, British Columbia, Canada. Reinbold, K.A., and S.M. Pescitelli. 1982a. Effects of exposure to ammonia on sensitive life stages of aquatic
organisms. Aquatic Ecology Technical Report Contract 68-01-5832/A, Final Report to EPA. Center for Aquatic Ecology, Illinois Natural History Survey, Champaign, Illinois.
Reinbold, K.A., and S.M. Pescitelli. 1982b. Acute Toxicity of Ammonia to the White Sucker. Final Report to
EPA. Center for Aquatic Ecology, Illinois Natural History Survey, Champaign, Illinois.

Evaluation of the EPA Recalculation Procedure Technical Report in the Arid West 4-32 May 2006
Reinbold, K.A., and S.M. Pescitelli. 1982c. Acute Toxicity of Ammonia to Channel Catfish. Final Report to EPA. Center for Aquatic Ecology, Illinois Natural History Survey, Champaign, Illinois.
Reinbold, K.A., and S.M. Pescitelli. 1982d. Effects of Exposure to Ammonia on Sensitive Life Stages of
Aquatic Organisms. Report to U.S. EPA by Illinois natural History Survey, Champaign, Illinois. Rice, S.D., and J.E. Bailey. 1980. Survival, size, and emergence of pink salmon, Oncorhynchus gorbuscha,
alevins after short- and long-term exposures to ammonia. Fisheries Bulletin 78:641-648. Robinson-Wilson, E.F., and W.K. Seim. 1975. The lethal and sublethal effects of zirconium process effluent
on juvenile salmonids. Water Research Bulletin 11:975-986. Rosage, T.F., R.M. Schutsky, and K.M. Rapp. 1979. Toxicity of unionized ammonia to the spotfin shiner
(Notropis spilopterus). Proceedings of the Pennsylvania Academy of Science 53:39-42. Roseboom, D.P., and D.L. Richey. 1977. Acute Toxicity of Residual Chlorine and Ammonia to Some Native
Illinois fishes. Report of Investigation 85, Illinois State Water Survey, Urbana, Illinois. Rubin, A.J. and M.A. Elmaraghy. 1976. Studies on the Toxicity of Ammonia, Nitrate and their Mixtures to the
Common Guppy. Office of Water Research and Technology Project A-033-OHIO. Water Resource Center, Ohio State University.
Rubin, A.J., and M.A. Elmaraghy. 1977. Studies on the toxicity of ammonia, nitrate and their mixtures to
guppy fry. Water Research 11:927-935. Russo, R.C., D.J. Randall, and R.V. Thurston. 1988. Ammonia toxicity and metabolism in fishes. In R.C.
Ryans, ed. Protection of River Basins, Lakes, and Estuaries. pp. 159-173. American Fisheries Society, Bethesda, Maryland.
Sakai, M.K., D.P. Monda, and B.L. Bellerud. 1999. Lethal levels of selected water quality variables to larval
and juvenile lost river and shortnose suckers. Environmental Pollution 105:37-44. Sangli, A. B. and V. V. Kanabur. 2001. Toxicity of ammonia to a freshwater fish, Gambusia affinis and its
effect on oxygen consumption. Geobios 28:56-58. Sarda, N. 1994. Spatial and Temporal Heterogeneity in Sediments with Respect to Pore Water Ammonia and
Toxicity of Ammonia to Ceriodaphnia dubia and Hyalella azteca. Masters Thesis. Wright State University, Dayton, Ohio.
Scheller, J. L. 1997. The Effect of Die Offs on Asian Clams (Corbicula fluminea) on Native Freshwater
Mussels (Unionidae). M.S. Thesis. Virginia Polytechnic Institute and State University, Blacksburg, Virginia.
Smith, W.E., T.H. Roush, and T.J. Fiandt. 1984. Toxicity of Ammonia to Early Life Stages of Bluegill
(Lepomis macrochirus). EPA-600/X-84-175. Environmental Research Laboratory, Duluth, Minnesota. Solbé, J.F. de L.G., and D.G. Shurben. 1989. Toxicity of ammonia to early life stages of rainbow trout
(Salmo gairdneri). Water Research 23:127-129.

Evaluation of the EPA Recalculation Procedure Technical Report in the Arid West 4-33 May 2006
Sparks, R.E. and M.J. Sandusky. 1981. Identification of Factors Responsible for Decreased Production of Fish Food Organisms in the Illinois and Mississippi Rivers. Final Report for Project No. 3-291-R, Illinois Natural History Survey, River Research Laboratory, Havana, Illinois.
Stephan, C.E., D.I. Mount, D.J. Hansen, J.H. Gentile, G.A. Chapman, W.A. Brungs. 1985. Guidelines for
Deriving Numerical National Water Quality Criteria for the Protection of Aquatic Organisms and their Uses. Accession No. PB-85-227049. National Technical Information Service, Springfield, Virginia.
Stammer, H.A. 1953. The effect of hydrogen sulfide and ammonia on characteristic animal forms in the
saprobic systems. Vom Wasser 20:34-71. Swigert, J.P., and A. Spacie. 1983. Survival and Growth of Warmwater Fishes Exposed to Ammonia Under
Low Flow Conditions. Technical Report 157. Water Resources Research Center, Purdue University, West Lafayette, Indiana.
Thurston, R.V., R.C. Russo, and C.E. Smith. 1978. Acute toxicity of ammonia and nitrite to cutthroat trout
fry. Transactions of American Fisheries Society 107:361-368. Thurston, R.V. and R.C. Russo. 1981. Acute Toxicity of Ammonia to Golden Trout (Salmo aquabonita) and
Mottled Sculpin (Cottus bairdi). Technical Report 81-1. Fisheries Bioassay Laboratory, Montana State University, Bozeman, Montana.
Thurston, R.V., and R.C. Russo. 1983. Acute toxicity of ammonia to rainbow trout. Transactions of the
American Fisheries Society 112:696-704. Thurston, R.V., C. Chakoumakos, and R.C. Russo. 1981. Effect of fluctuating exposures on the acute toxicity
of ammonia to rainbow trout (Salmo gairdneri) and cutthroat trout (S. clarki). Water Research 15:911-917.
Thurston, R.V., R.C. Russo, and G.R. Phillips. 1983. Acute toxicity of ammonia to fathead minnows.
Transactions of American Fisheries Society 112:705-711. Thurston, R.V., R.J. Luedtke, and R.C. Russo. 1984. Toxicity of Ammonia to Freshwater Insects of Three
Families. Technical report No. 84-2. Fisheries Bioassay Laboratory, Montana State University, Bozeman, Montana.
Thurston, R.V., and E.L. Meyn. 1984. Acute Toxicity of Ammonia to Five Fish Species from the Northwest
United States. Technical Report No. 84-4. Fisheries Bioassay Laboratory, Montana State University, Bozeman, Montana.
Thurston, R.V., R.C. Russo, R.J. Luedtke, C.E. Smith, E.L. Meyn, C. Chakoumakos, K.C. Wang, and C.J.
Brown. 1984. Chronic toxicity of ammonia to rainbow trout. Transactions of the American Fisheries Society 113:56-73.
Thurston, RV., R.C. Russo, E.L. Meyn, and R.K. Zajdel. 1986. Chronic toxicity of ammonia to fathead
minnows. Transactions of the American Fisheries Society 115:196-207. Tomasso, J.R., C.A. Goudie, B.A. Simco, and K.B. Davis. 1980. Effects of environmental pH and calcium on
ammonia toxicity in channel catfish. Transactions of the American Fisheries Society 109:229-234.

Evaluation of the EPA Recalculation Procedure Technical Report in the Arid West 4-34 May 2006
U.S. Environmental Protection Agency. 1999. 1999 Update of Ambient Water Quality Criteria for Ammonia. EPA-822-R-99-014. Office of Water, Washington, DC.
U.S. Environmental Protection Agency. 2002. Short-term Methods for Estimating the Chronic Toxicity of
Effluents and Receiving Waters to Freshwater Organisms. EPA-81-R-02-013. Office of Water, Washington DC.
Weirich, C.R., J.R. Tomasso, and T.I.J. Smith. 1993. Toxicity of ammonia and nitrite to sunshine bass in
selected environments. Journal of Aquatic Animal Health 5:64-72. Wicks, B.J., and D.J. Randall. 2002. The effect of feeding and fasting on ammonia toxicity in juvenile
rainbow trout, Oncorhynchus mykiss. Aquatic Toxicology 59: 71-82. Wicks, B.J., R. Joensen, Q. Tang and D.J. Randall. 2002. Swimming and ammonia toxicity in salmonids: the
effect of sub-lethal ammonia exposure on the swimming performance of coho salmon and the acute toxicity of ammonia in swimming and resting rainbow trout. Aquatic Toxicology 59: 55-69.
Willingham, T. 1987. Acute and Short-term Chronic Ammonia Toxicity to Fathead Minnows (Pimephales
promelas) and Ceriodaphnia dubia Using Laboratory Dilution Water and Lake Mead Dilution Water. EPA, Denver, Colorado.
Wu, S., and N. Brandauer. 1978. Natural history inventory of Colorado: The Bivalvia and Unionidae of
Colorado. University of Colorado Museum, Boulder, Colorado.

Evaluation of the EPA Recalculation Procedure Technical Report in the Arid West 5-1 May 2006
5.0 COPPER CRITERIA REVIEW AND UPDATE
5.1 BACKGROUND
Present EPA AWQC for copper are published in the “1995 Updates” (EPA 1996), which updated the original
1984 document (EPA 1984) with more recent acute and chronic toxicity data. The acute database meets the
“eight family” rule and contains acute toxicity data for 43 genera representing 56 species. Both acute and
chronic criteria are modified with a water hardness slope. The final chronic value was derived via an ACR
rather than a direct calculation due to chronic toxicity database limitations.
Since the 1995 Updates, the EPA released a draft document entitled 2003 Update of Ambient Water Quality
Criteria for Copper (EPA 2003). This draft document will presumably replace existing copper water quality
criteria (EPA 1995) once the peer review process is complete and the final document is accepted for
publication.
Prior to the EPA 2003 copper AWQC draft document, hereafter referred to as the 2003 Copper Draft, AWQC
updates have primarily constituted adding and removing toxicity data from the acute and chronic database.
The updated databases may change the number of genera, toxicity-hardness relationships, and/or change the
relative sensitivity of already present species. Yet, generally, the same methods of criteria derivation are
followed in successive publications for a particular toxicant. Additionally, most criteria are currently
modified by a single water quality parameter (e.g., water hardness, pH). Copper criteria are presently
hardness-modified; yet, copper toxicity does not exhibit as consistently strong of a relationship with water
hardness as other do other metals, such as zinc. Multiple studies have demonstrated other water quality
characteristics, such as pH (Schubauer-Berigan et al. 11993, Long et al. 2004), humic acid (Winner 1985),
alkalinity (Gensemer et al. 2002), and dissolved organic carbon (Playle and Dixon 1993; Hollis et al. 1996)
have an equal or even greater effect on copper toxicity than water hardness alone. Many of these other water
quality charateristic effects on copper toxicity have been incorporated into a BLM, which predicts the
ameliorating effect of these parameters on copper toxicity at the gill surface (Santore et al. 2001; Di Toro
et al. 2001).
The 2003 Copper Draft is a pioneer document, in that it is the first EPA AWQC document to use the BLM to
normalize toxicity values for criteria derivation. The BLM uses multiple water quality characteristics
(temperature, pH, DOC, % humic acid, and the concentrations of the following ions: Ca, Mg, Na, K, SO4, Cl,
HCO3, and S) to derive predicted toxicity values, as opposed to one or two water quality characteristics
generally used to modify other metal toxicity. In the 2003 Draft, acute toxicity data are first BLM-normalized

Evaluation of the EPA Recalculation Procedure Technical Report in the Arid West 5-2 May 2006
and ranked on the basis of a “standard” set of water quality characteristics (i.e., a process equivalent to
normalizing to a standard hardness of 50 mg/L). Then, a criterion would be calculated using the BLM based
on the water quality characteristic at a given site. The resulting criteria is unique in the sense that no values
are reported, and states: “freshwater aquatic organisms and their uses should not be affected unacceptably if
the 4-day average concentration of dissolved copper does not exceed the BLM-derived site-water LC50 (i.e.,
FAV) divided by the FACR more than once every 3 years on the average (i.e., the CCC) and if the 24-hr
average dissolved copper concentration does not exceed the BLM-derived site LC50 (or FAV) divided by two,
more than one every 3 years on the average (i.e., the CMC)” (EPA 2003).
Although BLM normalization is ultimately a commendable goal for copper criteria derivation, this approach
greatly reduces the number of studies available for criteria derivation. All test water quality parameters
necessary to run the BLM need to be measured, or have the ability to be estimated, for each study with copper
toxicity data. Such data are not reported in many of the available studies. As a result of requiring such BLM
data, the total number of genera in the acute toxicity database was reduced from 43 (EPA 1996) to 27 in the
2003 Copper Draft. This could ultimately result in more conservative criteria values as a result of the “sample
size” effect in criteria derivation. Probably of more importance is the loss of “robustness” in the toxicity
database, especially when considering the updated database has 69 genera (see Section 5.4).
Since 1) the 2003 Copper Draft is not officially adopted by the EPA; 2) existing criteria are available for
review and updating using conventional methods, and 3) the toxicity test BLM data requirements deviate
from the 1985 Guidelines (e.g., the BLM requirements will accept values from tests conducted in water with
DOC > 5.0 mg/L, which are not used in the 1985 guidelines), we mostly used this 2003 Draft Copper
document as a source of potentially new data rather than the basis of our review and numeric updates to
criteria calculations (i.e., we did not use the BLM to modify the toxicity data or criteria updates). Our review
primarily consists of a critical evaluation of the 1984 and sequential 1995 Updates copper criteria, collectively
referred to as the 1984/1995 Copper criteria. However, we do address the pros and cons of using the BLM in
the criteria derivation process and compare criteria derived via the BLM to standard criteria derivation
methods.
5.2 PHASE I - TECHNICAL REVIEW OF EPA COPPER CRITERIA DOCUMENTS
5.2.1 Existing Acute and Chronic Toxicity Databases
Phase 1 of the review consisted of an evaluation of studies used the 1984/1995 national acute and chronic
toxicity copper databases. Two acute values were corrected and two acute values were deleted from the
revised acute toxicity database. Additionally, three chronic values were corrected and three chronic values

Evaluation of the EPA Recalculation Procedure Technical Report in the Arid West 5-3 May 2006
were deleted from the revised chronic toxicity database. A summary of these deletions and corrections is
found in Table 5-1 and brief explanations are found below.
Table 5-1 Corrections and Deletions of Data used by the EPA in the 1984 AWQC Copper Document
Species Existing (µg/L)
Corrected (µg/L) Reference Comments
Acute Gammarus pulex 183 104.0 Stephenson 1983 Replaced 48-hr LC50 with 96-hr LC50 Gammarus pulex 41 249.0 Stephenson 1983 Replaced 48-hr LC50 with 96-hr LC50 Poecilia reticulata 2,500 -- Khangarot et al. 1981 Deleted value since test duration was <96 hr
Lepomis macrochirus 1,100 -- Benoit et al. 1975 Deleted value due to insufficient description of acute test methods
Chronic
Pimephales promelas 27.7 29.8 Pickering et al. 1977 Replaced estimated LOEC (32) with actual (measured) LOEC (37) in the chronic value calculation, NOEC = 24
Oncorhynchus tshawytscha <7.4 2.98 Chapman 1975, 1982 7.4 = LOEC, the chronic values geometric mean of the LOEC and NOEC (1.2)
Onchorhynchus mykiss 27.77 22.27 Seim et al. 1984 Corrected value (LOEC = 16, NOEC = 31)
Lepomis macrochirus 28.98 -- Benoit et al. 1975 Deleted value due to unacceptable control survival (36-42%)
Physa integra 10.88 -- Arthur and Leonard 1970
Deleted value due to unacceptable control survival (30-60%)
Gammarus psudolimnaeus 6.066 -- Arthur and Leonard 1970
Deleted value due to unacceptable control survival (50-90%)
The acute toxicity values for the amphipod, Gammarus pulex, from Stephenson (1983) are the 48-hr test
results. The1985 Guidelines state 96-hr tests should be used for amphipods. Because both 48-hr and 96-hr
test results were presented, we replaced the 48-hr acute values with the 96-hr acute values (Table 5-1).
Benoit (1975) determined acute and chronic toxicity of copper in bluegills (Lepomis macrochirus). Very few
details were reported concerning methods used to conduct the acute tests; in fact, so few details were given,
there is no way of knowing if the 1985 Guidelines were followed. Additionally, survival of the chronic
control was unacceptably low (36-42%), which suggests other factors may have contributed to fish mortality.
Both acute and chronic values from this study, and consequently the acute-chronic ratio (ACR), derived from
this study were removed from the revised acute and chronic databases.
It appears three chronic values for Pimphales promelas (Pickering et al. 1977) and Oncorhynchus tshawytscha
(Chapman 1975; 1982) were either entered incorrectly or reported data were interpreted incorrectly. We
replaced the existing chronic values with the recalculated geometric mean of the no observable effect

Evaluation of the EPA Recalculation Procedure Technical Report in the Arid West 5-4 May 2006
concentration (NOEC) and lowest observable effect concentration (LOEC) reported by each study, per 1985
guidelines.
Arthur and Leonard (1970) determined acute and chronic toxicity of copper for Campeloma decisum, Physa
integra, and Gammarus pseudolimnaeus. All chronic results were included in the national chronic database;
however, only the chronic values for C. decisum are suitable for use due to unacceptably high control
mortality in the P. integra and G. pseudolimnaeus tests. Chronic values for P. integra and G. pseudolimnaeus
from this study were removed from the revised chronic database, which were the only chronic toxicity values
for these species in the database.
5.2.2 Existing Toxicity Hardness-Slope Derivation for Copper
If a water quality parameter significantly affects the toxicity of a contaminant, this numeric relationship
should be used for criterion derivation. The most common water quality modifier of AWQC for metals is
water hardness. The toxicity hardness slope is generally derived from species-specific acute toxicity data that
meet the minimum data requirements of the highest hardness tested being three times the lowest hardness
tested, and 100 mg/L greater than the lowest (Stephan et al. 1985). The acute hardness slope is generally
applied to both acute and chronic criteria equations when it seems reasonable that hardness influences chronic
toxicity; and the chronic toxicity database is too limited to quantify this relationship.
The EPA derived an acute hardness slope from the 1984 acute toxicity database. No significant trends were
observed with the chronic toxicity data and hardness; therefore, the acute hardness slope was used in the
chronic criteria derivation. The direct application of the acute slope resulted in chronic values that appeared
too high, so the slope was artificially lowered to produce lower chronic values at high hardness. Although
decreasing the chronic slope for further protection is acceptable, a chronic hardness slope calculated from
actual chronic toxicity data would be preferred and a better representation of the true relationship between
chronic toxicity of copper and water hardness.
5.3 PHASE II - UPDATE TO THE NATIONAL COPPER CRITERIA DATABASES
Approximately 150 papers containing at least some copper toxicity information were located and reviewed as
potential sources of data to be added to the updated copper databases. Many of the reviewed papers were
cited in the 2003 Copper Draft and/or a copper update included in an ecological risk assessment for the Clark
Fork River, Montana (Chapman 1999). However, not all toxicity values deemed acceptable for use in these
publications were determined acceptable for use in the present review. For example, toxicity tests conducted
in site water with DOC concentrations >5.0 mg/L were included in the national database in the 2003 Copper
Draft. Including these toxicity values is acceptable for this analysis since the BLM was used to normalize test
Evaluation of the EPA Recalculation Procedure Technical Report in the Arid West 5-5 May 2006
results, which takes into account the effect of high DOC on copper toxicity. However, they are not acceptable
for a database, which is not BLM adjusted. Additionally, some of the acute values used by Chapman (1999)
do not comply with test duration requirements (e.g., Jacobson et al. 1997) and/or test water restrictions
(Belanger et al. 1988) and, therefore, were not included in the updated databases.
Much of the recent copper toxicity literature has evaluated the influence of site-specific water quality
characteristics on copper toxicity by either using site or spring water as the test water, or using reconstituted
laboratory water designed to mimic the major ion composition at a particular site. Results from such studies
are not universally acceptable for use in criteria derivation due to restrictions set forth in the 1985 Guidelines.
However, to avoid a loss of the valuable toxicity data generated from these studies, we carefully evaluated
each study to determine the acceptability of test results. Toxicity tests conducted with filtered uncontami-
nated site/spring water were generally determined acceptable for use in criteria derivation, if an initial water
quality analysis was documented and DOC concentrations were less than 5.0 mg/L. Most, but not all, of the
tests conducted with atypical reconstituted laboratory water were determined acceptable for use. This
included results from tests in which other water quality parameters varied within acceptable range (e.g., pH,
alkalinity, and humic acid), while hardness was held constant. Use of such data creates a more robust
database that encompasses acute copper toxicity for a variety of environmental conditions.
5.3.1 New Acute Copper Toxicity Data
The literature review resulted in the addition of 295 acute values (Table 5-2) from 47 different sources to the
1984/1995 acute copper toxicity database, including acute toxicity values for 43 new species, representing 25
new genera. These included a number of values from studies conducted prior to the 1995 Updates and
apparently represent data unknown to EPA at the time. Five of the top ten most sensitive species in the
updated acute database are new species added as a result of this literature search (note that much of this new
data would not be available if restricted to studies with the full set of BLM parameters). Given the large
volume of new toxicity data added to the database, we will only comment on papers that added information to
the four most sensitive genera in the revised acute database (Daphnia, Ceriodaphnia, Chydorus, and
Bosmina) and new acute copper toxicity values for threatened or endangered species.

Evaluation of the EPA Recalculation Procedure Technical Report in the Arid West 5-6 May 2006
Table 5-2 Acute Copper Toxicity Data Added to the Revised Acute Database
Species Methoda Chemical Hardness (mg/L as CaCO3)
LC50 (µg/L) Reference
Pimphales promelas F,T,M CuSO4 31 75.00 Mount and Stephan 1969 Pimphales promelas F,T,M CuSO4 202.0 460.00 Pickering et al. 1977 Pimphales promelas F,T,M CuSO4 202.0 490.00 Pickering et al. 1977 Daphnia pulex S,M,T CuSO4 57.5 (no HA) 23.00 Winner 1985 Daphnia pulex S,M,T CuSO4 57.5 (no HA) 28.80 Winner 1985 Daphnia pulex S,M,T CuSO4 57.5 (0.75 HA) 39.30 Winner 1985 Daphnia pulex S,M,T CuSO4 57.5 (0.75 HA) 40.30 Winner 1985 Daphnia pulex S,M,T CuSO4 57.5 (1.5 HA) 63.40 Winner 1985 Daphnia pulex S,M,T CuSO4 57.5 (1.5 HA) 71.20 Winner 1985 Daphnia pulex S,M,T CuSO4 115 (no HA) 23.30 Winner 1985 Daphnia pulex S,M,T CuSO4 115 (no HA) 32.70 Winner 1985 Daphnia pulex S,M,T CuSO4 115 (0.75 HA) 45.00 Winner 1985 Daphnia pulex S,M,T CuSO4 115 (0.75 HA) 27.20 Winner 1985 Daphnia pulex S,M,T CuSO4 115 (1.5 HA) 50.30 Winner 1985 Daphnia pulex S,M,T CuSO4 115 (1.5 HA) 52.80 Winner 1985 Daphnia pulex S,M,T CuSO4 230 (no HA) 10.00 Winner 1985 Daphnia pulex S,M,T CuSO4 230 (no HA) 17.10 Winner 1985 Daphnia pulex S,M,T CuSO4 230 (0.15 HA) 26.40 Winner 1985 Daphnia pulex S,M,T CuSO4 230 (0.15 HA) 31.40 Winner 1985 Daphnia pulex S,M,T CuSO4 230 (0.75 HA) 30.50 Winner 1985 Daphnia pulex S,M,T CuSO4 230 (0.75 HA) 45.60 Winner 1985 Daphnia pulex S,M,T CuSO4 230 (1.5 HA) 64.00 Winner 1985 Daphnia pulex S,M,T CuSO4 230 (1.5 HA) 66.20 Winner 1985 Daphnia magna S,M,T CuSO4 7.9 2.00 Long et al. 2004 Daphnia magna S,M,T CuSO4 11.1 2.00 Long et al. 2004 Daphnia magna S,M,T CuSO4 22.2 10.00 Long et al. 2004 Daphnia magna S,M,T CuSO4 50.7 11.10 Long et al. 2004 Daphnia magna S,M,T CuSO4 7.1 2.00 Long et al. 2004 Daphnia magna S,M,T CuSO4 7.1 2.80 Long et al. 2004 Daphnia magna S,M,T CuSO4 7.1 4.80 Long et al. 2004 Daphnia magna S,M,T CuSO4 20.6 2.00 Long et al. 2004 Daphnia magna S,M,T CuSO4 20.6 7.40 Long et al. 2004 Daphnia magna S,M,T CuSO4 20.6 6.50 Long et al. 2004 Ceriodaphnia dubia S,M,T CuNO3 175.0 12.00 Banks et al. 2003 Daphnia magna S,M,T -- 170.0 31 Lazorchak and Waller 1993 (160-180) Daphnia magna S,M,T -- 170.0 38 Lazorchak and Waller 1993 (160-180) Daphnia magna S,M,T -- 170.0 35 Lazorchak and Waller 1993 (160-180) Daphnia magna S,M,T -- 170.0 58 Lazorchak and Waller 1993 (160-180)

Evaluation of the EPA Recalculation Procedure Technical Report in the Arid West 5-7 May 2006
Table 5-2 (Continued) Acute Copper Toxicity Data Added to the Revised Acute Database
Species Methoda Chemical Hardness (mg/L as CaCO3)
LC50 (µg/L) Reference
Daphnia magna S,M,T -- 170.0 37 Lazorchak and Waller 1993 (160-180) Daphnia magna S,M,T -- 170.0 51 Lazorchak and Waller 1993 (160-180) Daphnia magna S,M,T -- 170.0 39 Lazorchak and Waller 1993 (160-180) Daphnia magna S,M,T -- 170.0 50 Lazorchak and Waller 1993 (160-180) Daphnia magna S,M,T -- 170.0 52 Lazorchak and Waller 1993 (160-180) Daphnia magna S,M,T -- 170.0 31 Lazorchak and Waller 1993 (160-180) Daphnia magna S,M,T -- 170.0 30 Lazorchak and Waller 1993 (160-180) Daphnia magna S,M,T -- 170.0 46 Lazorchak and Waller 1993 (160-180) Daphnia magna S,M,T -- 170.0 63 Lazorchak and Waller 1993 (160-180) Daphnia magna S,M,T CuSO4 80.0 11.3 Suedel et al. 1996 Ceriodaphnia dubia S,M,T CuCl2 36.0 20.00 Carlson et al. 1986 Pimphales promelas S,M,T CuCl2 36.0 180.00 Carlson et al. 1986 Ceriodaphnia dubia S,M,T CuCl2 52.0 19 Carlson et al. 1986 Pimephales promelas S,M,T CuCl2 52.0 55 Carlson et al. 1986 Scapholeberis spp. S,M,T CuCl2 52.0 18 Carlson et al. 1986 Pimephales promelas S,M,T Cu(NO3)2 290.0 15 Schubauer-Berigan et al. 1993 (280-300) (pH=6-6.5) Pimephales promelas S,M,T Cu(NO3)2 290.0 44 Schubauer-Berigan et al. 1993 (280-300) (pH=7-7.5) Pimephales promelas S,M,T Cu(NO3)2 290.0 200 Schubauer-Berigan et al. 1993 (280-300) (pH=8-8.5) Lumbriculus variegatus S,M,T Cu(NO3)2 290.0 130 Schubauer-Berigan et al. 1993 (280-300) (pH=6-6.5) Lumbriculus variegatus S,M,T Cu(NO3)2 290.0 270 Schubauer-Berigan et al. 1993 (280-300) (pH=7-7.5) Lumbriculus variegatus S,M,T Cu(NO3)2 290.0 500 Schubauer-Berigan et al. 1993 (280-300) (pH=8-8.5) Hyalella azteca S,M,T Cu(NO3)2 290.0 17 Schubauer-Berigan et al. 1993 (280-300) (pH=6-6.5) Hyalella azteca S,M,T Cu(NO3)2 290.0 24 Schubauer-Berigan et al. 1993 (280-300) (pH=7-7.5)

Evaluation of the EPA Recalculation Procedure Technical Report in the Arid West 5-8 May 2006
Table 5-2 (Continued) Acute Copper Toxicity Data Added to the Revised Acute Database
Species Methoda Chemical Hardness (mg/L as CaCO3)
LC50 (µg/L) Reference
Hyalella azteca S,M,T Cu(NO3)2 290.0 87 Schubauer-Berigan et al. 1993 (280-300) (pH=8-8.5) Ceriodaphnia dubia S,M,T Cu(NO3)2 290.0 9.5 Schubauer-Berigan et al. 1993 (280-300) (pH=6-6.5) Ceriodaphnia dubia S,M,T Cu(NO3)2 290.0 28 Schubauer-Berigan et al. 1993 (280-300) (pH=7-7.5) Ceriodaphnia dubia S,M,T Cu(NO3)2 290.0 200 Schubauer-Berigan et al. 1993 (280-300) (pH=8-8.5) Pimephales promelas F,M,T,D CuSO4 47.0 31.75 Erickson et al. 1996 Pimephales promelas F,M,T,D CuSO4 243.2 117.48 Erickson et al. 1996 Pimephales promelas F,M,T,D CuSO4 255.7 48.26 Erickson et al. 1996 Pimephales promelas F,M,T,D CuSO4 47.0 73.03 Erickson et al. 1996 Pimephales promelas F,M,T,D CuSO4 45.0 59.06 Erickson et al. 1996 Pimephales promelas F,M,T,D CuSO4 45.0 78.74 Erickson et al. 1996 Pimephales promelas F,M,T,D CuSO4 45.5 22.23 Erickson et al. 1996 Pimephales promelas F,M,T,D CuSO4 49.0 6.99 Erickson et al. 1996 Pimephales promelas F,M,T,D CuSO4 45.0 22.23 Erickson et al. 1996 Pimephales promelas F,M,T,D CuSO4 43.0 107.32 Erickson et al. 1996 Pimephales promelas F,M,T,D CuSO4 45.0 81.28 Erickson et al. 1996 Pimephales promelas F,M,T,D CuSO4 45.5 241.3 Erickson et al. 1996 Pimephales promelas F,M,T,D CuSO4 45.0 133.35 Erickson et al. 1996 Pimephales promelas F,M,T,D CuSO4 44.0 93.98 Erickson et al. 1996 Pimephales promelas F,M,T,D CuSO4 44.0 67.95 Erickson et al. 1996 Pimephales promelas F,M,T,D CuSO4 22.5 4.76 Erickson et al. 1996 Pimephales promelas F,M,T,D CuSO4 24.0 13.97 Erickson et al. 1996 Pimephales promelas F,M,T,D CuSO4 23.0 29.85 Erickson et al. 1996 Pimephales promelas F,M,T,D CuSO4 21.5 59.69 Erickson et al. 1996 Oncorhynchus mykiss F,M,D CuSO4 362.5 102.0 Fogels and Sprague 1977 (350-375) Jodanella floridae F,M,D CuSO4 362.5 1,270.0 Fogels and Sprague 1977 (350-375) Brachydanio rerio F,M,D CuSO4 362.5 149.0 Fogels and Sprague 1977 (350-375) Chydorus sphaericus R,U CuSO4 33.8 3.3 Koivisto et al. 1992 Bosmina longirostrus R,U CuSO4 33.8 1.4 Koivisto et al. 1992 Daphnia galeata R,U CuSO4 33.8 4.1 Koivisto et al. 1992 Daphnia magna R,U CuSO4 33.8 11.5 Koivisto et al. 1992 Daphnia pulex R,U CuSO4 33.8 3.4 Koivisto et al. 1992 Daphnia magna S,M,I -- 100.0 35.6 Borgman and Charlton 1984
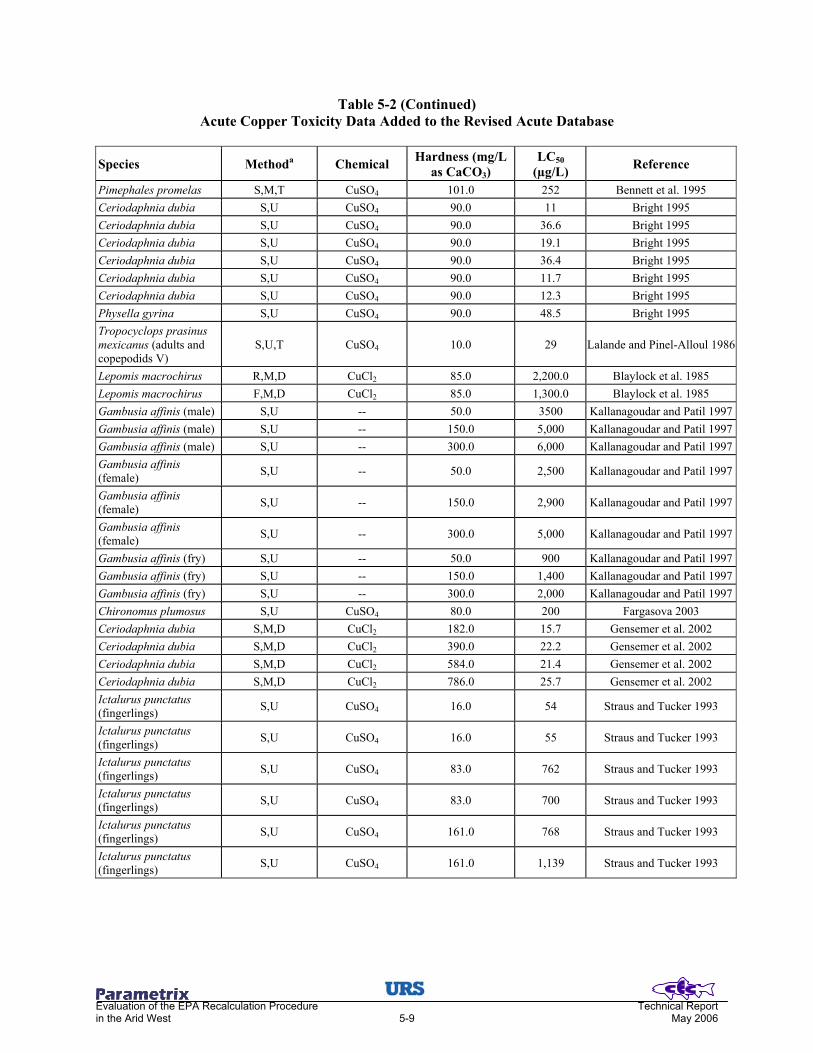
Evaluation of the EPA Recalculation Procedure Technical Report in the Arid West 5-9 May 2006
Table 5-2 (Continued) Acute Copper Toxicity Data Added to the Revised Acute Database
Species Methoda Chemical Hardness (mg/L as CaCO3)
LC50 (µg/L) Reference
Pimephales promelas S,M,T CuSO4 101.0 252 Bennett et al. 1995 Ceriodaphnia dubia S,U CuSO4 90.0 11 Bright 1995 Ceriodaphnia dubia S,U CuSO4 90.0 36.6 Bright 1995 Ceriodaphnia dubia S,U CuSO4 90.0 19.1 Bright 1995 Ceriodaphnia dubia S,U CuSO4 90.0 36.4 Bright 1995 Ceriodaphnia dubia S,U CuSO4 90.0 11.7 Bright 1995 Ceriodaphnia dubia S,U CuSO4 90.0 12.3 Bright 1995 Physella gyrina S,U CuSO4 90.0 48.5 Bright 1995 Tropocyclops prasinus mexicanus (adults and copepodids V)
S,U,T CuSO4 10.0 29 Lalande and Pinel-Alloul 1986
Lepomis macrochirus R,M,D CuCl2 85.0 2,200.0 Blaylock et al. 1985 Lepomis macrochirus F,M,D CuCl2 85.0 1,300.0 Blaylock et al. 1985 Gambusia affinis (male) S,U -- 50.0 3500 Kallanagoudar and Patil 1997Gambusia affinis (male) S,U -- 150.0 5,000 Kallanagoudar and Patil 1997Gambusia affinis (male) S,U -- 300.0 6,000 Kallanagoudar and Patil 1997Gambusia affinis (female) S,U -- 50.0 2,500 Kallanagoudar and Patil 1997
Gambusia affinis (female) S,U -- 150.0 2,900 Kallanagoudar and Patil 1997
Gambusia affinis (female) S,U -- 300.0 5,000 Kallanagoudar and Patil 1997
Gambusia affinis (fry) S,U -- 50.0 900 Kallanagoudar and Patil 1997Gambusia affinis (fry) S,U -- 150.0 1,400 Kallanagoudar and Patil 1997Gambusia affinis (fry) S,U -- 300.0 2,000 Kallanagoudar and Patil 1997Chironomus plumosus S,U CuSO4 80.0 200 Fargasova 2003 Ceriodaphnia dubia S,M,D CuCl2 182.0 15.7 Gensemer et al. 2002 Ceriodaphnia dubia S,M,D CuCl2 390.0 22.2 Gensemer et al. 2002 Ceriodaphnia dubia S,M,D CuCl2 584.0 21.4 Gensemer et al. 2002 Ceriodaphnia dubia S,M,D CuCl2 786.0 25.7 Gensemer et al. 2002 Ictalurus punctatus (fingerlings) S,U CuSO4 16.0 54 Straus and Tucker 1993
Ictalurus punctatus (fingerlings) S,U CuSO4 16.0 55 Straus and Tucker 1993
Ictalurus punctatus (fingerlings) S,U CuSO4 83.0 762 Straus and Tucker 1993
Ictalurus punctatus (fingerlings) S,U CuSO4 83.0 700 Straus and Tucker 1993
Ictalurus punctatus (fingerlings) S,U CuSO4 161.0 768 Straus and Tucker 1993
Ictalurus punctatus (fingerlings) S,U CuSO4 161.0 1,139 Straus and Tucker 1993

Evaluation of the EPA Recalculation Procedure Technical Report in the Arid West 5-10 May 2006
Table 5-2 (Continued) Acute Copper Toxicity Data Added to the Revised Acute Database
Species Methoda Chemical Hardness (mg/L as CaCO3)
LC50 (µg/L) Reference
Ictalurus punctatus (fingerlings) S,U CuSO4 287.0 1,041 Straus and Tucker 1993
Ictalurus punctatus (fingerlings) S,U CuSO4 287.0 925 Straus and Tucker 1993
Juga plicifera F,M,T CuCl2 21.0 15 Nebeker et al. 1986 Lithoglyphus virens F,M,T CuCl2 21.0 8 Nebeker et al. 1986 Procambarus clarkii (larva) F,T,M CuCl2 17.0 720 Rice and Harrison 1983
Oncorhynchus tshawytscha F,M,D CuCl2 36.0 7.4 Welsh et al. 2000
(Ca:Mg=0.82) Oncorhynchus tshawytscha F,M,D CuCl2 35.0 12.5 Welsh et al. 2000
(Ca:Mg=1.5) Oncorhynchus tshawytscha F,M,D CuCl2 38.0 14.3 Welsh et al. 2000
(Ca:Mg=0.75) Oncorhynchus tshawytscha F,M,D CuCl2 36.0 18.3 Welsh et al. 2000
(Ca:Mg=1.46) Oncorhynchus mykiss R,M,D CuCl2 42.0 3.4 Welsh et al. 2000 (Ca:Mg=0.17) Oncorhynchus mykiss R,M,D CuCl2 39.0 8.1 Welsh et al. 2000 (Ca:Mg=4.75) Oncorhynchus mykiss R,M,D CuCl2 90.0 17.2 Welsh et al. 2000 (Ca:Mg=0.77) Oncorhynchus mykiss R,M,D CuCl2 90.0 32.0 Welsh et al. 2000 (Ca:Mg=5.16) Ceriodaphnia dubia S,M,D --- 45.0 25.0 Belanger et al. 1988 Ceriodaphnia dubia S,M,D --- 45.0 17.0 Belanger et al. 1988 Ceriodaphnia dubia S,M,D --- 45.0 30.0 Belanger et al. 1988 Ceriodaphnia dubia S,M,D --- 45.0 24.0 Belanger et al. 1988 Ceriodaphnia dubia S,M,D --- 45.0 28.0 Belanger et al. 1988 Ceriodaphnia dubia S,M,D --- 45.0 32.0 Belanger et al. 1988 Ceriodaphnia dubia S,M,D --- 45.0 23.0 Belanger et al. 1988 Ceriodaphnia dubia S,M,D --- 45.0 20.0 Belanger et al. 1988 Ceriodaphnia dubia S,M,D --- 45.0 19.0 Belanger et al. 1988 Catostomus latipinnis S,U CuSO4 144.0 175 Hamilton and Buhl 1997b Ephemerella subuaria S,U CuSO4 44.0 320 Warnick and Bell 1969 Oncorhynchus gorbuscha (alevin, newly hatched)
F,M,T CuSO4 83.1 143 Servizi and Martens 1978

Evaluation of the EPA Recalculation Procedure Technical Report in the Arid West 5-11 May 2006
Table 5-2 (Continued) Acute Copper Toxicity Data Added to the Revised Acute Database
Species Methoda Chemical Hardness (mg/L as CaCO3)
LC50 (µg/L) Reference
Oncorhynchus gorbuscha (alevin)
F,M,T CuSO4 83.1 87 Servizi and Martens 1978
Oncorhynchus gorbuscha (fry) F,M,T CuSO4 83.1 199 Servizi and Martens 1978
Oncorhynchus nerka (alevin, newly hatched) F,M,T CuSO4 83.1 190 Servizi and Martens 1978
Oncorhynchus nerka (alevin) F,M,T CuSO4 83.1 200 Servizi and Martens 1978
Oncorhynchus nerka (alevin) F,M,T CuSO4 83.1 100 Servizi and Martens 1978
Oncorhynchus nerka (alevin) F,M,T CuSO4 83.1 110 Servizi and Martens 1978
Oncorhynchus nerka (alevin) F,M,T CuSO4 83.1 130 Servizi and Martens 1978
Oncorhynchus nerka (fry) F,M,T CuSO4 83.1 150 Servizi and Martens 1978
Oncorhynchus nerka (smolt) F,M,T CuSO4 83.1 210 Servizi and Martens 1978
Oncorhynchus nerka (smolt) F,M,T CuSO4 83.1 170 Servizi and Martens 1978
Oncorhynchus nerka (smolt) F,M,T CuSO4 83.1 190 Servizi and Martens 1978
Oncorhynchus nerka (smolt) F,M,T CuSO4 83.1 240 Servizi and Martens 1978
Oncorhynchus mykiss S,M,T CuSO4 169.0 110 Dwyer et al. 1995 Oncorhynchus mykiss S,M,T CuSO4 169.0 50 Dwyer et al. 1995 Oncorhynchus mykiss S,M,T CuSO4 169.0 60 Dwyer et al. 1995 Gila elegans S,M,T CuSO4 173.0 200 Dwyer et al. 1995 Oncorhynchus apache S,M,T CuSO4 169.0 70 Dwyer et al. 1995 Oncorhynchus clarki henshawi S,M,T CuSO4 169.0 80 Dwyer et al. 1995
Oncorhynchus clarki henshawi S,M,T CuSO4 169.0 60 Dwyer et al. 1995
Pimephales promelas S,M,T CuSO4 173.0 290 Dwyer et al. 1995 Pimephales promelas S,M,T CuSO4 173.0 630 Dwyer et al. 1995 Pimephales promelas S,M,T CuSO4 173.0 400 Dwyer et al. 1995 Pimephales promelas S,M,T CuSO4 173.0 390 Dwyer et al. 1995 Ptychocheilus oregonensis S,M,T CuSO4 173.0 380 Dwyer et al. 1995
Ptychocheilus oregonensis S,M,T CuSO4 173.0 480 Dwyer et al. 1995
Xyrauchen texanus S,M,T CuSO4 173.0 220 Dwyer et al. 1995 Xyrauchen texanus S,M,T CuSO4 173.0 340 Dwyer et al. 1995
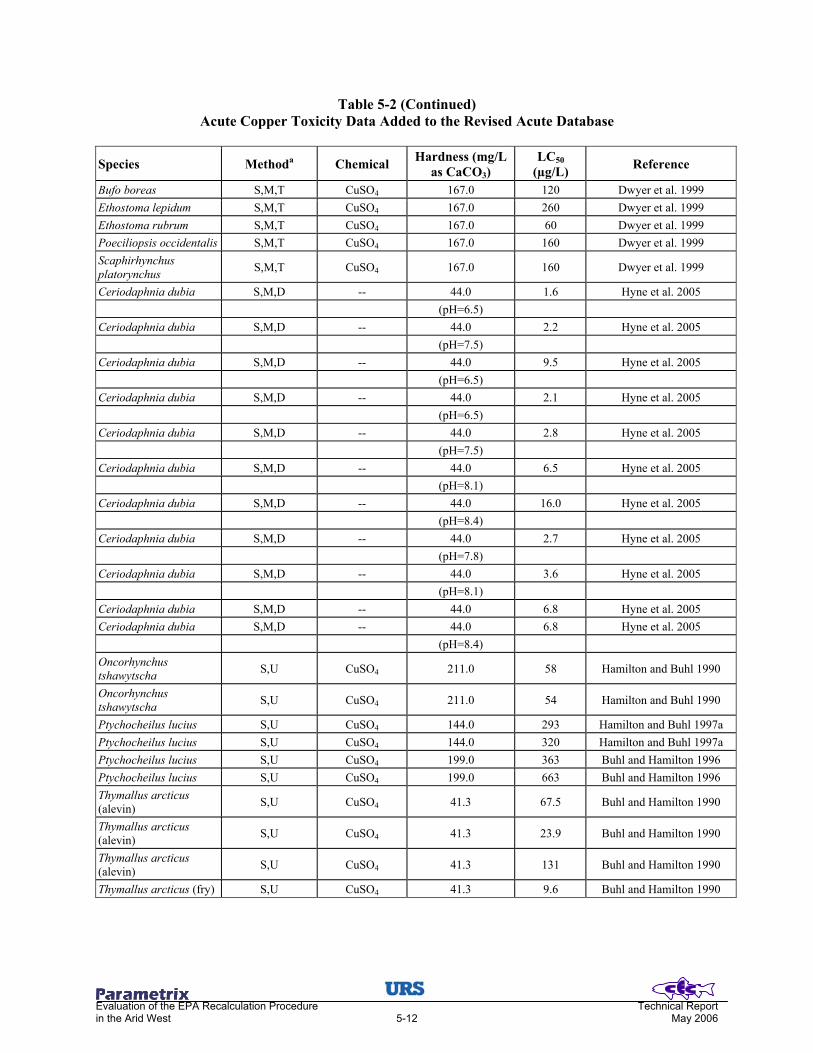
Evaluation of the EPA Recalculation Procedure Technical Report in the Arid West 5-12 May 2006
Table 5-2 (Continued) Acute Copper Toxicity Data Added to the Revised Acute Database
Species Methoda Chemical Hardness (mg/L as CaCO3)
LC50 (µg/L) Reference
Bufo boreas S,M,T CuSO4 167.0 120 Dwyer et al. 1999 Ethostoma lepidum S,M,T CuSO4 167.0 260 Dwyer et al. 1999 Ethostoma rubrum S,M,T CuSO4 167.0 60 Dwyer et al. 1999 Poeciliopsis occidentalis S,M,T CuSO4 167.0 160 Dwyer et al. 1999 Scaphirhynchus platorynchus S,M,T CuSO4 167.0 160 Dwyer et al. 1999
Ceriodaphnia dubia S,M,D -- 44.0 1.6 Hyne et al. 2005 (pH=6.5) Ceriodaphnia dubia S,M,D -- 44.0 2.2 Hyne et al. 2005 (pH=7.5) Ceriodaphnia dubia S,M,D -- 44.0 9.5 Hyne et al. 2005 (pH=6.5) Ceriodaphnia dubia S,M,D -- 44.0 2.1 Hyne et al. 2005 (pH=6.5) Ceriodaphnia dubia S,M,D -- 44.0 2.8 Hyne et al. 2005 (pH=7.5) Ceriodaphnia dubia S,M,D -- 44.0 6.5 Hyne et al. 2005 (pH=8.1) Ceriodaphnia dubia S,M,D -- 44.0 16.0 Hyne et al. 2005 (pH=8.4) Ceriodaphnia dubia S,M,D -- 44.0 2.7 Hyne et al. 2005 (pH=7.8) Ceriodaphnia dubia S,M,D -- 44.0 3.6 Hyne et al. 2005 (pH=8.1) Ceriodaphnia dubia S,M,D -- 44.0 6.8 Hyne et al. 2005 Ceriodaphnia dubia S,M,D -- 44.0 6.8 Hyne et al. 2005 (pH=8.4) Oncorhynchus tshawytscha S,U CuSO4 211.0 58 Hamilton and Buhl 1990
Oncorhynchus tshawytscha S,U CuSO4 211.0 54 Hamilton and Buhl 1990
Ptychocheilus lucius S,U CuSO4 144.0 293 Hamilton and Buhl 1997a Ptychocheilus lucius S,U CuSO4 144.0 320 Hamilton and Buhl 1997a Ptychocheilus lucius S,U CuSO4 199.0 363 Buhl and Hamilton 1996 Ptychocheilus lucius S,U CuSO4 199.0 663 Buhl and Hamilton 1996 Thymallus arcticus (alevin) S,U CuSO4 41.3 67.5 Buhl and Hamilton 1990
Thymallus arcticus (alevin) S,U CuSO4 41.3 23.9 Buhl and Hamilton 1990
Thymallus arcticus (alevin) S,U CuSO4 41.3 131 Buhl and Hamilton 1990
Thymallus arcticus (fry) S,U CuSO4 41.3 9.6 Buhl and Hamilton 1990
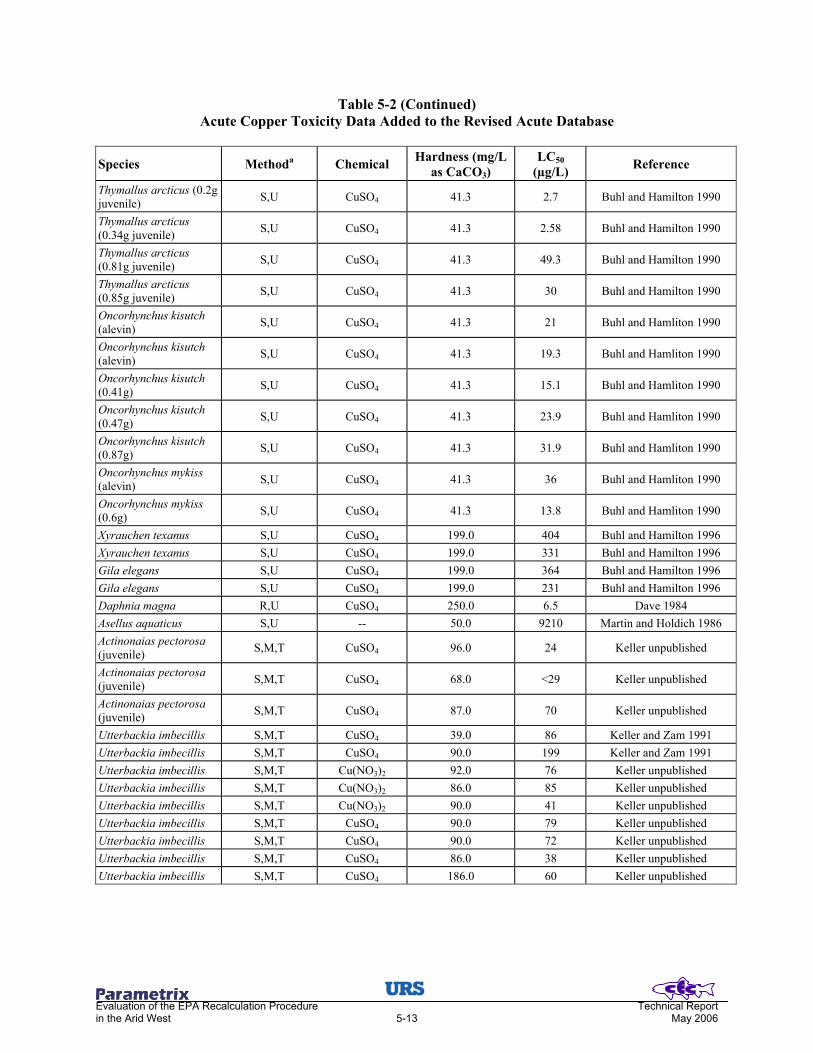
Evaluation of the EPA Recalculation Procedure Technical Report in the Arid West 5-13 May 2006
Table 5-2 (Continued) Acute Copper Toxicity Data Added to the Revised Acute Database
Species Methoda Chemical Hardness (mg/L as CaCO3)
LC50 (µg/L) Reference
Thymallus arcticus (0.2g juvenile) S,U CuSO4 41.3 2.7 Buhl and Hamilton 1990
Thymallus arcticus (0.34g juvenile) S,U CuSO4 41.3 2.58 Buhl and Hamilton 1990
Thymallus arcticus (0.81g juvenile) S,U CuSO4 41.3 49.3 Buhl and Hamilton 1990
Thymallus arcticus (0.85g juvenile) S,U CuSO4 41.3 30 Buhl and Hamilton 1990
Oncorhynchus kisutch (alevin) S,U CuSO4 41.3 21 Buhl and Hamliton 1990
Oncorhynchus kisutch (alevin) S,U CuSO4 41.3 19.3 Buhl and Hamliton 1990
Oncorhynchus kisutch (0.41g) S,U CuSO4 41.3 15.1 Buhl and Hamliton 1990
Oncorhynchus kisutch (0.47g) S,U CuSO4 41.3 23.9 Buhl and Hamliton 1990
Oncorhynchus kisutch (0.87g) S,U CuSO4 41.3 31.9 Buhl and Hamliton 1990
Oncorhynchus mykiss (alevin) S,U CuSO4 41.3 36 Buhl and Hamliton 1990
Oncorhynchus mykiss (0.6g) S,U CuSO4 41.3 13.8 Buhl and Hamliton 1990
Xyrauchen texanus S,U CuSO4 199.0 404 Buhl and Hamilton 1996 Xyrauchen texanus S,U CuSO4 199.0 331 Buhl and Hamilton 1996 Gila elegans S,U CuSO4 199.0 364 Buhl and Hamilton 1996 Gila elegans S,U CuSO4 199.0 231 Buhl and Hamilton 1996 Daphnia magna R,U CuSO4 250.0 6.5 Dave 1984 Asellus aquaticus S,U -- 50.0 9210 Martin and Holdich 1986 Actinonaias pectorosa (juvenile) S,M,T CuSO4 96.0 24 Keller unpublished
Actinonaias pectorosa (juvenile) S,M,T CuSO4 68.0 <29 Keller unpublished
Actinonaias pectorosa (juvenile) S,M,T CuSO4 87.0 70 Keller unpublished
Utterbackia imbecillis S,M,T CuSO4 39.0 86 Keller and Zam 1991 Utterbackia imbecillis S,M,T CuSO4 90.0 199 Keller and Zam 1991 Utterbackia imbecillis S,M,T Cu(NO3)2 92.0 76 Keller unpublished Utterbackia imbecillis S,M,T Cu(NO3)2 86.0 85 Keller unpublished Utterbackia imbecillis S,M,T Cu(NO3)2 90.0 41 Keller unpublished Utterbackia imbecillis S,M,T CuSO4 90.0 79 Keller unpublished Utterbackia imbecillis S,M,T CuSO4 90.0 72 Keller unpublished Utterbackia imbecillis S,M,T CuSO4 86.0 38 Keller unpublished Utterbackia imbecillis S,M,T CuSO4 186.0 60 Keller unpublished
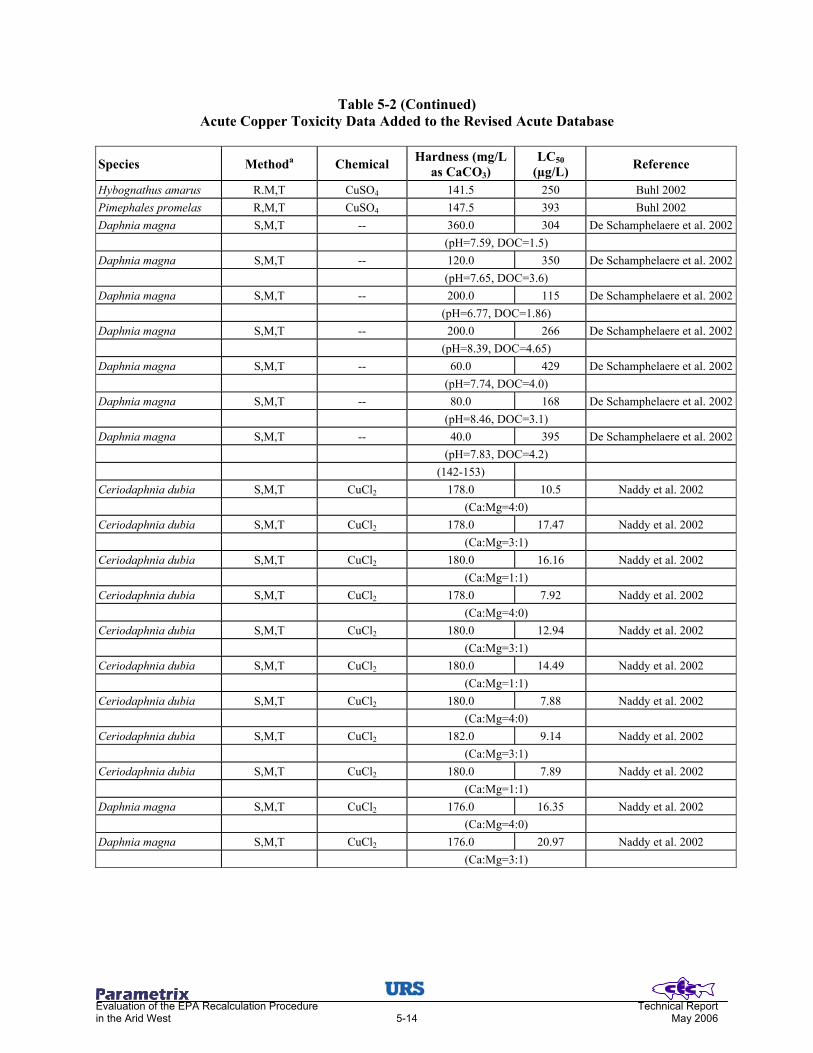
Evaluation of the EPA Recalculation Procedure Technical Report in the Arid West 5-14 May 2006
Table 5-2 (Continued) Acute Copper Toxicity Data Added to the Revised Acute Database
Species Methoda Chemical Hardness (mg/L as CaCO3)
LC50 (µg/L) Reference
Hybognathus amarus R.M,T CuSO4 141.5 250 Buhl 2002 Pimephales promelas R,M,T CuSO4 147.5 393 Buhl 2002 Daphnia magna S,M,T -- 360.0 304 De Schamphelaere et al. 2002 (pH=7.59, DOC=1.5) Daphnia magna S,M,T -- 120.0 350 De Schamphelaere et al. 2002 (pH=7.65, DOC=3.6) Daphnia magna S,M,T -- 200.0 115 De Schamphelaere et al. 2002 (pH=6.77, DOC=1.86) Daphnia magna S,M,T -- 200.0 266 De Schamphelaere et al. 2002 (pH=8.39, DOC=4.65) Daphnia magna S,M,T -- 60.0 429 De Schamphelaere et al. 2002 (pH=7.74, DOC=4.0) Daphnia magna S,M,T -- 80.0 168 De Schamphelaere et al. 2002 (pH=8.46, DOC=3.1) Daphnia magna S,M,T -- 40.0 395 De Schamphelaere et al. 2002 (pH=7.83, DOC=4.2) (142-153) Ceriodaphnia dubia S,M,T CuCl2 178.0 10.5 Naddy et al. 2002 (Ca:Mg=4:0) Ceriodaphnia dubia S,M,T CuCl2 178.0 17.47 Naddy et al. 2002 (Ca:Mg=3:1) Ceriodaphnia dubia S,M,T CuCl2 180.0 16.16 Naddy et al. 2002 (Ca:Mg=1:1) Ceriodaphnia dubia S,M,T CuCl2 178.0 7.92 Naddy et al. 2002 (Ca:Mg=4:0) Ceriodaphnia dubia S,M,T CuCl2 180.0 12.94 Naddy et al. 2002 (Ca:Mg=3:1) Ceriodaphnia dubia S,M,T CuCl2 180.0 14.49 Naddy et al. 2002 (Ca:Mg=1:1) Ceriodaphnia dubia S,M,T CuCl2 180.0 7.88 Naddy et al. 2002 (Ca:Mg=4:0) Ceriodaphnia dubia S,M,T CuCl2 182.0 9.14 Naddy et al. 2002 (Ca:Mg=3:1) Ceriodaphnia dubia S,M,T CuCl2 180.0 7.89 Naddy et al. 2002 (Ca:Mg=1:1) Daphnia magna S,M,T CuCl2 176.0 16.35 Naddy et al. 2002 (Ca:Mg=4:0) Daphnia magna S,M,T CuCl2 176.0 20.97 Naddy et al. 2002 (Ca:Mg=3:1)

Evaluation of the EPA Recalculation Procedure Technical Report in the Arid West 5-15 May 2006
Table 5-2 (Continued) Acute Copper Toxicity Data Added to the Revised Acute Database
Species Methoda Chemical Hardness (mg/L as CaCO3)
LC50 (µg/L) Reference
Daphnia magna S,M,T CuCl2 180.0 57.28 Naddy et al. 2002 (Ca:Mg=1:1) Daphnia magna S,M,T CuCl2 180.0 21.55 Naddy et al. 2002 (Ca:Mg=4:0) Daphnia magna S,M,T CuCl2 182.0 31.77 Naddy et al. 2002 (Ca:Mg=3:1) Daphnia magna S,M,T CuCl2 180.0 42.68 Naddy et al. 2002 (Ca:Mg=1:1) Daphnia magna S,M,T CuCl2 90.0 12.2 Naddy et al. 2002 (Ca:Mg=4:0) Daphnia magna S,M,T CuCl2 90.0 16.93 Naddy et al. 2002 (Ca:Mg=3:1) Daphnia magna S,M,T CuCl2 92.0 11.99 Naddy et al. 2002 (Ca:Mg=1:1) Gammarus sp. R,M,T CuCl2 176.0 181 Naddy et al. 2002 (Ca:Mg=4:0) Gammarus sp. R,M,T CuCl2 176.0 103 Naddy et al. 2002 (Ca:Mg=3:1) Gammarus sp. R,M,T CuCl2 182.0 133 Naddy et al. 2002 (Ca:Mg=1:1) Oncorhynchus mykiss R,M,T CuCl2 172.0 67.9 Naddy et al. 2002 (Ca:Mg=4:0) Oncorhynchus mykiss R,M,T CuCl2 178.0 53.9 Naddy et al. 2002 (Ca:Mg=3:1) Oncorhynchus mykiss R,M,T CuCl2 176.0 35.5 Naddy et al. 2002 (Ca:Mg=1:1) Oncorhynchus mykiss R,M,T CuCl2 176.0 18.1 Naddy et al. 2002 (Ca:Mg=1:3) Oncorhynchus mykiss R,M,T CuCl2 176.0 52.5 Naddy et al. 2002 (Ca:Mg=4:0) Oncorhynchus mykiss R,M,T CuCl2 180.0 46.2 Naddy et al. 2002 (Ca:Mg=3:1) Oncorhynchus mykiss R,M,T CuCl2 178.0 30.7 Naddy et al. 2002 (Ca:Mg=1:1) Oncorhynchus mykiss R,M,T CuCl2 180.0 17.9 Naddy et al. 2002 (Ca:Mg=1:3) Oncorhynchus mykiss R,M,T CuCl2 176.0 18.1 Naddy et al. 2002 (Ca:Mg=1:4) Oncorhynchus mykiss R,M,T CuCl2 179.0 37.3 Naddy et al. 2002 (Ca:Mg=4:0)
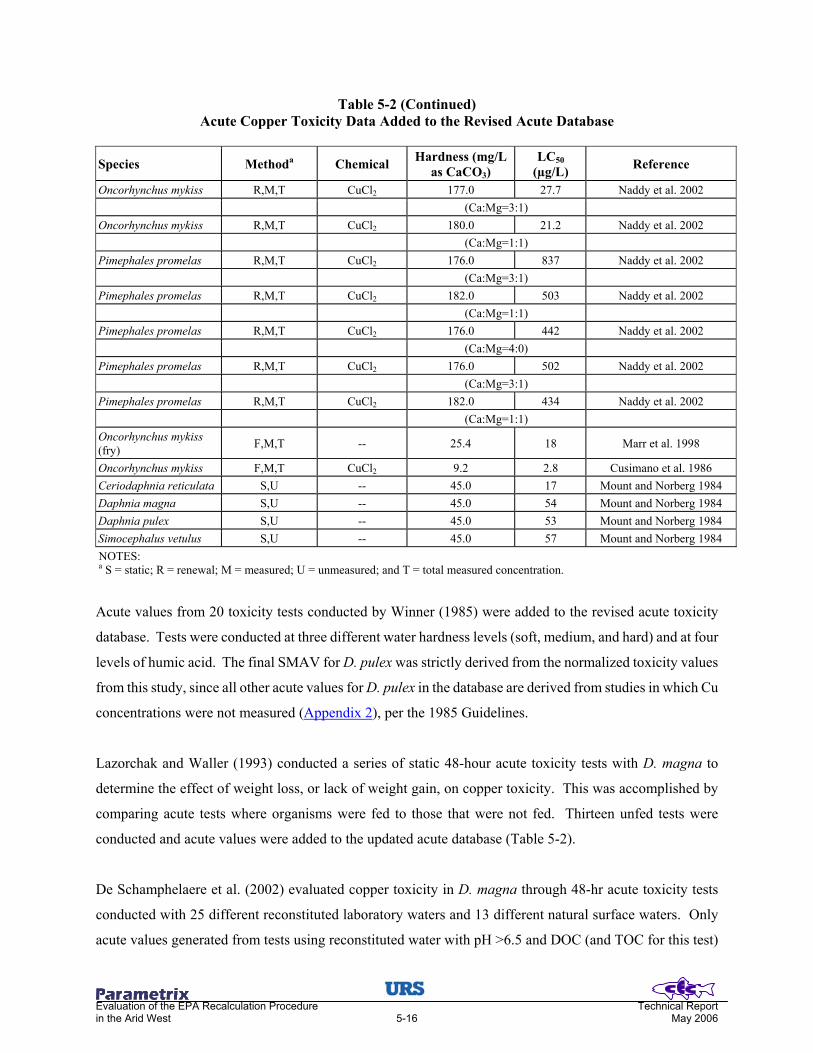
Evaluation of the EPA Recalculation Procedure Technical Report in the Arid West 5-16 May 2006
Table 5-2 (Continued) Acute Copper Toxicity Data Added to the Revised Acute Database
Species Methoda Chemical Hardness (mg/L as CaCO3)
LC50 (µg/L) Reference
Oncorhynchus mykiss R,M,T CuCl2 177.0 27.7 Naddy et al. 2002 (Ca:Mg=3:1) Oncorhynchus mykiss R,M,T CuCl2 180.0 21.2 Naddy et al. 2002 (Ca:Mg=1:1) Pimephales promelas R,M,T CuCl2 176.0 837 Naddy et al. 2002 (Ca:Mg=3:1) Pimephales promelas R,M,T CuCl2 182.0 503 Naddy et al. 2002 (Ca:Mg=1:1) Pimephales promelas R,M,T CuCl2 176.0 442 Naddy et al. 2002 (Ca:Mg=4:0) Pimephales promelas R,M,T CuCl2 176.0 502 Naddy et al. 2002 (Ca:Mg=3:1) Pimephales promelas R,M,T CuCl2 182.0 434 Naddy et al. 2002 (Ca:Mg=1:1) Oncorhynchus mykiss (fry) F,M,T -- 25.4 18 Marr et al. 1998
Oncorhynchus mykiss F,M,T CuCl2 9.2 2.8 Cusimano et al. 1986 Ceriodaphnia reticulata S,U -- 45.0 17 Mount and Norberg 1984 Daphnia magna S,U -- 45.0 54 Mount and Norberg 1984 Daphnia pulex S,U -- 45.0 53 Mount and Norberg 1984 Simocephalus vetulus S,U -- 45.0 57 Mount and Norberg 1984 NOTES: a S = static; R = renewal; M = measured; U = unmeasured; and T = total measured concentration.
Acute values from 20 toxicity tests conducted by Winner (1985) were added to the revised acute toxicity
database. Tests were conducted at three different water hardness levels (soft, medium, and hard) and at four
levels of humic acid. The final SMAV for D. pulex was strictly derived from the normalized toxicity values
from this study, since all other acute values for D. pulex in the database are derived from studies in which Cu
concentrations were not measured (Appendix 2), per the 1985 Guidelines.
Lazorchak and Waller (1993) conducted a series of static 48-hour acute toxicity tests with D. magna to
determine the effect of weight loss, or lack of weight gain, on copper toxicity. This was accomplished by
comparing acute tests where organisms were fed to those that were not fed. Thirteen unfed tests were
conducted and acute values were added to the updated acute database (Table 5-2).
De Schamphelaere et al. (2002) evaluated copper toxicity in D. magna through 48-hr acute toxicity tests
conducted with 25 different reconstituted laboratory waters and 13 different natural surface waters. Only
acute values generated from tests using reconstituted water with pH >6.5 and DOC (and TOC for this test)

Evaluation of the EPA Recalculation Procedure Technical Report in the Arid West 5-17 May 2006
<5.0 mg/L were added to the revised acute database. This study provided seven new acute toxicity values for
D. magna.
A recent publication from Long et al. (2004) reports acute copper toxicity values for D. magna at various
water harness and pH values. Test methods were reviewed and toxicity tests conducted at pH >6.5 were
determined suitable for use in criteria development. Ten data points from this study were added to the revised
acute database.
Hyne et al. (2005) conducted a series of static 48-hr acute toxicity tests with Ceriodaphnia dubia to evaluate
the influence of pH, hardness, alkalinity, and DOC on zinc and copper toxicity. Test water consisted of soft
reconstituted laboratory water, modified with the parameter of interest as well as site water. Results using
reconstituted water with pH ∃6.5 and DOC <5.0 mg/L were determined acceptable for use in criteria
derivation. These results added 10 acute values to C. dubia, a species that was not previously represented in
the national acute copper toxicity database.
An additional study that contributed considerable toxicity data to the C. dubia SMAV is Belanger et al.
(1988). Belanger et al. (1988) conducted acute and chronic toxicity tests with dechlorinated laboratory water,
and two site waters (the New and Clinch rivers) that differed in hardness, and alkalinity. Only the toxicity
values derived from tests using laboratory water were added to the revised acute database, since only minimal
water chemistry was reported for the two river sites.
Belanger and Cherry (1990) acclimated C. dubia to three sites waters (New River, Clinch River, and Amy
Bayou) that differed in hardness and had no detectable copper or zinc. Acute and chronic tests were
conducted at pH 6, 8, and 9. No measurements of site DOC concentration were reported; yet, the 2003
Copper Draft reports all concentrations were <5.0 mg/L. Since more water chemistry, including background
metal concentrations were reported in this effort and site water was acceptable for use, acute values from tests
run at pH 8 and 9 were added to the revised acute database.
Naddy et al. (2002) evaluated the effect of the calcium-magnesium ratio on the toxicity of copper to C. dubia,
D. magna, Gammarus, sp., Oncorhynchyus mykiss, and P. promelas, while holding hardness and alkalinity
relatively constant. Appropriately assigned 48-hr and 96-hr static-renewal toxicity tests were conducted with
each species in reconstituted laboratory water. All toxicity values derived from this effort were added to the
revised acute database, yet were not used in the acute-hardness slope derivation (see Section 5.4.1, below),
due to the increased variability associated with these data at a given hardness.

Evaluation of the EPA Recalculation Procedure Technical Report in the Arid West 5-18 May 2006
Kovisto et al. (1992) conducted acute and chronic copper toxicity tests with five cladoceran species that
differed in size (D. magna, D. pulex, D galeata, Bosmina longirostris, and Chydorus spaericus). All
organisms except D. magna were initially field collected and then cultured in the laboratory. Acute 48-hr
static tests were conducted with and without feeding and chronic tests consisted of 21d renewal tests. The test
water was soft spring water (hardness = 33.8 mg/L as CaCO3) and copper concentrations were not measured.
Toxicity values generated from the unfed tests contribute acute copper toxicity values for three cladocerans
not previously represented in the national database (B. longirostrus, C. sphaericus, and D. galeata). These
species rank as the three most sensitive species in the database.
Recent efforts by Dwyer et al. (1995; 1999) have contributed a significant volume of toxicity data for a
variety of toxicants in threatened or endangered (T&E) species. Authors conducted simultaneous static
96-hour acute copper toxicity tests using the T&E species and a potential surrogate species (e.g., P. promelas
and O. mykiss) to determine the relative differences in copper sensitivity. T&E species tested included Gila
elegans (Federally listed), Oncorhynchus clarki henshawi (Federally listed), O. clari stomias (Federally
listed), Ptychoceilus lucius (Federally listed), Xyrauchen texanus (Federally listed), Bufo boreas (state listed-
Colorado), Etheostoma rubrum (Federally listed), E. lepidum (state listed-Texas), and Poeciliopsis
occidentalis (Federally listed). Acute values generated from the T&E species and potential surrogate tests
were added to the revised and updated acute toxicity database.
5.3.2 New Chronic Copper Toxicity Data
In addition to the new acute data, a total of 24 chronic values from ten sources were added to the revised
chronic toxicity database. The new chronic data included new chronic toxicity data for two cladocerans and
one rotifer (Brachionus calyciflorus) not previously represented in the national chronic database (Table 5-3).
Three papers (Winner 1985; Spehar and Fiandt 1986; Belanger and Cherry 1990) reported paired acute and
chronic values that contribute to the (FACR) derivation.
Table 5-3 Chronic Copper Toxicity Data Added to the Revised Chronic Database
Species Methoda Chemical Hardness NOEC LOEC Chronic Value (µg/L) Reference
Brachinus calyciflorus LC, T CuSO4 85.00 1.2 2.5 1.73 Jansen et al. 1994 Daphnia magna LC, T CuCl2 225.00 -- -- 21.5 van Leeuwin et al. 1988 Daphnia pulex LC, T CuSO4 57.5 4.0 6.0 4.90 Winner 1985 (42d) (HA=0mg/L) Daphnia pulex LC, T CuSO4 57.5 20.0 25.0 22.36 Winner 1985 (42d) (HA=0.75mg/L) Daphnia pulex LC, T CuSO4 57.5 30.0 40.0 34.64 Winner 1985 (42d) (HA=1.5mg/L)

Evaluation of the EPA Recalculation Procedure Technical Report in the Arid West 5-19 May 2006
Table 5-3 (Continued) Chronic Copper Toxicity Data Added to the Revised Chronic Database
Species Methoda Chemical Hardness NOEC LOEC Chronic Value (µg/L) Reference
Daphnia pulex LC, T CuSO4 115.0 5.0 10.0 7.07 Winner 1985 (42d) (HA=0mg/L) Daphnia pulex LC, T CuSO4 115.0 20.0 30.0 24.49 Winner 1985 (42d) (HA=0.75mg/L) Daphnia pulex LC, T CuSO4 115.0 40.0 50.0 44.72 Winner 1985 (42d) (HA=1.5mg/L) Daphnia pulex LC, T CuSO4 230.0 10.0 15.0 12.25 Winner 1985 (42d) (HA=0.15mg/L) Daphnia pulex LC, T CuSO4 230.0 10.0 20.0 14.14 Winner 1985 (42d) (HA=0.75mg/L) Daphnia pulex LC, T CuSO4 230.0 20.0 30.0 24.49 Winner 1985 (42d) (HA=0.75mg/L) Ceriodaphnia dubia LC, T CuSO4 8.00 3.2 -- Suedel et al. 1996 Ceriodaphnia dubia LC, T -- 22.00 4 6 4.90 Jop et al. 1995 (16-28) Ceriodaphnia dubia LC, D CuCl2 32.00 12 32 19.60 Carlson et al. 1986 Ceriodaphnia dubia LC, T -- 97.60 0 10 <10 Belanger and Cherry 1990 (pH=8) Ceriodaphnia dubia LC, T -- 97.60 10 20 14.14 Belanger and Cherry 1990 (pH=9) Ceriodaphnia dubia LC, T -- 113.60 20 40 28.28 Belanger and Cherry 1990 (pH=8) Ceriodaphnia dubia LC, T -- 113.60 20 40 28.28 Belanger and Cherry 1990 (pH=9) Ceriodaphnia dubia LC, T -- 182.00 0 20 <20 Belanger and Cherry 1990 (pH=8) Ceriodaphnia dubia LC, T -- 182.00 0 20 <20 Belanger and Cherry 1990 (pH=9) Ceriodaphnia dubia LC, T CuSO4 27.00 -- -- 24.5 Oris et al. 1991 Ceriodaphnia dubia LC, T CuSO4 57.00 -- -- 30.8 Oris et al. 1991 Oncorhynchus mykiss ELS, T CuCl2 25 2.2 4.6 3.18 Marr et al. 1996 NOTES: aELS = early life stage and LC = life cycle or partial life cycle; T = measured total; D = measured dissolved. bValue adjusted to hardness = 50 using the revised chronic slope (0.7432) found in Table 5-4.
5.4 PHASE III - RECALCULATION OF ACUTE AND CHRONIC AWQC FOR COPPER
5.4.1 Updated Acute Hardness Slope
An updated acute hardness slope was developed from the revised and updated acute toxicity database and
procedures set forth in the 1985 Guidelines. All species mean acute slopes (SMAS) used in the 1984 acute
hardness slope derivation were updated with new toxicity data and nine new taxa were added from our

Evaluation of the EPA Recalculation Procedure Technical Report in the Arid West 5-20 May 2006
analysis (Table 5-4). SMASs ranged from 0.5149 for O. tshawytscha (R2 = 0.76) to 1.5736 for P. oregonensis
(R2=0.99). Pooling the normalized acute and water hardness values for all 17 taxa results in a pooled acute
hardness slope of 0.9801 (R2 = 0.73) (Figure 5-1). The updated acute slope is slightly steeper than the EPA
slope of 0.9422 and was derived from hardness values ranging from 7.1 to 400 mg/L as CaCO3.
Table 5-4 Updated Acute Copper Hardness Slope
Species N SMAS R2 Code Ceriodaphnia dubia 18 0.9452 0.69 3 Daphnia magna 61 0.9199 0.72 2 Daphnia pulex 6 0.9918 0.75 3 Daphnia pulicaria 11 0.6767 0.83 2 Gambusia affinis 11 1.0742 0.50 3 Ictalurus punctalus 8 1.0563 0.89 3 Lepomis macrochirus 17 1.1469 0.84 2 Morone saxatilis 5 0.5865 0.58 3 Oncorhynchus clarkii 9 0.8783 0.61 2 Oncorhynchus mykiss 64 0.9923 0.71 2 Oncorhynchus tshawytscha 12 0.5149 0.76 2 Pimephales promelas 39 1.1681 0.89 2 Poecillia reticulata 4 1.3917 0.90 2 Ptychocheilus oregonensis 4 1.5736 0.99 3 Salvelinus confluentus 5 1.5875 0.93 3 Tubifex tubifex 2 0.8669 -- 3 Vilosa vibex 2 0.5697 -- 3
Revised Pooled Slope = 0.9801 0.73 NOTES: SMAS = species mean acute slope. 2 = updated/revised SMAS 3 = new species
-2.5 -2 -1.5 -1 -0.5 0.5 1 1.5 2
-4
-3
-2
-1
1
2
3
In (n
orm
aliz
ed a
cute
val
ue)
In (normalized hardness)
y=0.9801x-0.0007R2=0.7295
Figure 5-1
Relationship Between Acute Copper Toxicity and Water Hardness using the Revised and Updated Acute Database

Evaluation of the EPA Recalculation Procedure Technical Report in the Arid West 5-21 May 2006
The updated acute slope of 0.9801 was used to normalize all acute values to a hardness of 50 mg/L and to
develop a hardness-based final acute equation. The resulting SMAV and GMAV for the species in the
revised and updated database are presented in Table 5-5 and ranked from least to most sensitive.
Table 5-5 Recalculated Species Mean Acute Values (SMAVs) using Revised and
Updated Acute Database and Ranked by Genus Mean Acute Values (GMAV) Rank Species Common Name GMAV
(µg/L) SMAV (µg/L) Code
69 Notemigonus crysoleucas Golden shiner 59,017.19 59,017.19 2 68 Acroneuria lycorias Stonefly 9,407.86 9,407.86 1,2 67 Corbicula manilensis Asiatic clam >7,484.64 >7,484.64 1,2 66 Trichoptera spp. Caddisfly 6,200.00 6,200.00 1,2 65 Anguilla rostrata American eel 5,747.51 5,747.51 2 64 Zygoptera spp. Damselfly 4,600.00 4,600.00 1,2 63 Procambarus clarkii Crayfish 2,072.67 2,072.67 1,2 62 Campeloma decisum Snail 1,859.40 1,859.40 1,2 61 Oronectes rusticus Crayfish 1,363.30 1,363.30 1,2 60 Crangonyx pseudogracilis Amphipod 1,290.00 1,290.00 1,2 59 Lepomis gibbosus Pumpkinseed 929.07 619.00 2 Lepomis macrochirus Bluegill 1,394.46 2
58 Amnicola spp. Snail 900.00 900.00 1,2 57 Gambusia affinis Mosquitofish 795.54 795.54 2 56 Fundulus diaphanus Banded killifish 788.32 788.32 2 55 Cyprinus carpio Common carp 746.62 746.62 2 54 Tilapia mossambica Mozambique tilapia 663.07 663.07 2 53 Ephemerella subuaria Mayfly 362.71 362.71 1,2 52 Notropis chrysocephalus Striped shiner 314.86 314.86 2 51 Carassius auratus Goldfish 288.69 288.69 2 50 Chironomus tentans Midge 194.13 452.70 1,2 Chironomus spp. Midge 30.00 1,2 Chironomus decorus Midge 837.64 1,2 Chrionomus plumosus Midge 124.86 1,2
49 Jordanella floridae Flagfish 189.81 189.81 2 48 Tropocyclops prasinus Copepod 140.43 140.43 1,2 47 Acrocheilus alutaceus Chiselmouth 132.61 132.61 2 46 Ictalurus nebulosus Brown bullhead 128.61 66.22 2 Ictalurus punctatus Channel catfish 249.80 1,2
45 Pectinatella magnifica Bryozoan 128.27 128.27 2 44 Salmo salar Atlantic salmon 114.58 114.58 1 43 Morone americana White perch 95.34 5,842.52 2 Morone saxatilis Striped bass 95.34 2
42 Poecilia reticulata Guppy 81.76 81.76 2 41 Nais spp. Worm 90.00 90.00 1,2

Evaluation of the EPA Recalculation Procedure Technical Report in the Arid West 5-22 May 2006
Table 5-5 (Continued) Recalculated Species Mean Acute Values (SMAVs) using Revised and
Updated Acute Database and Ranked by Genus Mean Acute Values (GMAV)
Rank Species Common Name GMAV (µg/L)
SMAV (µg/L) Code
40 Etheostoma caeruleum Rainbow darter 87.66 82.24 2 Etheostoma spectabile Orangethroat darter 218.44 2 Etheostoma lepidum Greenthroat darter 79.74 2 Etheostoma nigrum Johnny darter 159.55 2 Etheostoma rubrum Fountain darter 18.40 2 Etheostoma flabellare Fantail darter 107.94 2
39 Hybognathus amarus Rio Grande silvery minnow 86.59 86.59 2 38 Rhinichthys atratulus Blacknose dace 82.24 82.24 2 37 Xyrauchen texanus Razorback sucker 81.02 81.02 2 36 Semotilus atromaculatus Creek chub 79.67 79.67 2 35 Pimephales notatus Bluntnose minnow 74.33 68.49 2 Pimephales promelas Fathead minnow 80.66 2
34 Campostoma anomalum Central stoneroller 74.53 74.53 2 33 Ptychocheilus oregonensis Northern pikeminnow 68.61 40.14 2 Ptychocheilus lucius Colorado pikeminnow 117.29 2
32 Salvelinus fontinalis Brook trout 66.15 110.88 1 Salvelinus confluentus Bull trout 39.47 1
31 Simocephalus vetulus Cladoceran 63.20 63.20 1, 2 30 Catostomus latipinnis Flannelmouth sucker 62.06 62.06 2 29 Gila elegans Bonytail chub 59.25 59.25 2 28 Oncorhynchus kisutch Coho salmon 55.41 115.58 1 Oncorhynchus nerka Sockeye salmon 132.57 1 Oncorhynchus clarki (henshawi) Cutthroat trout 65.19 1 Oncorhynchus tshawytscha Chinook salmon 33.23 1
Oncorhynchus mykiss Rainbow trout 27.70 1 Oncorhynchus apache Apache trout 21.22 1 Oncorhynchus gorbuscha Pink salmon 82.22 1
27 Gyraulus circumstriatus Snail 54.75 54.75 1, 2 26 Limnodrilus hoffmeisteri Worm 51.71 51.71 1, 2 25 Poeciliposis occidentalis Gila topminnow 49.07 49.07 2 24 Scaphirhynchus platorynchus Shovelnose sturgeon 49.07 49.07 2 23 Lampsilis teres Yellow sandshell 47.21 44.80 2 Lampsilis s. clairbornensis Freshwater mussel 49.75 2
22 Lumbriculus variegatus Worm 46.40 46.40 1, 2 21 Utterbackia imbecillis Paper pondshell mussel 41.83 41.83 2 20 Physa heterostropha Snail 38.91 34.98 1, 2 Physa integra Snail 43.28 1, 2
19 Bufo boreas Boreal toad 36.80 36.80 1 18 Juga plicifera Snail 35.10 35.10 1, 2 17 Lophopodella carteri Bryozoan 35.21 35.21 2 16 Plumatella emarginata Bryozoan 35.21 35.21 2

Evaluation of the EPA Recalculation Procedure Technical Report in the Arid West 5-23 May 2006
Table 5-5 (Continued) Recalculated Species Mean Acute Values (SMAVs) using Revised and
Updated Acute Database and Ranked by Genus Mean Acute Values (GMAV)
Rank Species Common Name GMAV (µg/L)
SMAV (µg/L) Code
15 Villosa vibex Rainbow mussel 33.52 45.15 2 Villosa vilosa Freshwater mussel 24.89 2
14 Tubifex tubifex Worm 33.28 33.28 1, 2 13 Physella gyrina Snail 27.26 27.26 1, 2 12 Gammarus pseudolimnaeus Amphipod 23.80 22.72 1, 2 Gammarus pulex Amphipod 15.22 1, 2 Gammarus sp. Amphipod 39.00 1, 2
11 Thymallus arcticus Arctic grayling 23.52 23.52 1 10 Brachydanio rerio Zebrafish 22.27 22.27 2 9 Ephoron virgo Mayfly 19.35 19.35 1, 2 8 Lithoglyphus virens Snail 18.72 18.72 1, 2 7 Scapholeberis spp. Cladoceran 17.32 17.32 1, 2 6 Actinonaias pectorosa Pheasantshell mussel 16.48 16.48 2 5 Hyalella azteca Amphipod 16.35 16.35 1, 2 4 Daphnia galeata Cladoceran 10.42 6.02 1, 2 Daphnia magna Cladoceran 14.93 1, 2 Daphnia pulex Cadoceran 14.64 1, 2 Daphnia pulicaria Cladoceran 8.98 1, 2 3 Ceriodaphnia reticulata Cladoceran 8.64 9.65 1, 2 Ceriodaphnia dubia Cladoceran 7.74 1, 2 2 Chydorus sphaericus Cladoceran 4.84 4.84 1, 2 1 Bosmina longirostrus Cladoceran 2.05 2.05 1, 2
NOTES: All values are normalized to hardness = 50 mg/L as CaCO3. 1 = Coldwater species. 2 = Warmwater species.
5.4.2 Chronic Hardness Slope
As previously stated, the chronic hardness slope used by the EPA in the 1984/1995 chronic criteria equation
was derived from the acute hardness relationship, and then lowered for further protection at high water
hardness. We evaluated the potential of deriving a chronic hardness relationship from the revised and updated
chronic database. Five taxa of the 15 represented in the revised and updated chronic database were tested at
the broad range of hardness values necessary for slope derivation (Stephan et al. 1985). No apparent
relationship appears to exist between chronic copper toxicity and hardness for D. magna; yet, chronic toxicity
of the four other taxa (O. mykiss, P. promelas, D. pulex, and C. dubia) all exhibit significant positive
relationships with water hardness (Table 5-6). Pooling the chronic data of these four taxa results in a
significant positive hardness slope of 0.5897 (P = <0.001, R2 = 0.5446) (Figure 5-2). This slope was derived
from chronic data and, therefore, better represents the relationship between chronic copper toxicity and water
hardness than the existing EPA slope (0.8545).

Evaluation of the EPA Recalculation Procedure Technical Report in the Arid West 5-24 May 2006
Table 5-6 New Chronic Copper Hardness Slope Derived from the Revised and Updated Chronic Database
Species N SMCS R2
Daphnia magna* 4 -0.0462 0.004 Oncorhynchus mykiss 4 0.8490 0.63 Pimephales promelas 5 0.4459 0.46 Daphnia pulex 3 0.6610 0.97 Ceriodaphnia dubia 11 0.5687 0.53
Revised Pooled Slope = 0.5897 0.54 NOTES: SMCS = Species mean chronic slope. * = Not used in chronic pooled slope calculations. The updated chronic slope was used to normalize all chronic toxicity data for criterion derivation and in the
final chronic toxicity equation. The resulting species mean chronic values (SMCV) and genus mean chronic
values (GMCV) calculated from the revised and updated chronic database are presented in Table 5-7 and
ranked from least to most sensitive, per the 1985 Guidelines.
-2.5 -2 -1.5 -1 -0.5 0.5 1 1.5
-2
-1.5
-1
-0.5
0.5
1
In (n
orm
aliz
ed c
hron
ic v
alue
)
In (normalized hardness)
y=0.5897x-1.06E-16R2=0.446
Figure 5-2
The Relationship Between Chronic Copper Toxicity and Water Hardness using the Revised and Updated Chronic Toxicity Database

Evaluation of the EPA Recalculation Procedure Technical Report in the Arid West 5-25 May 2006
Table 5-7 Recalculated Species Mean Chronic Values (SMCV) using the Revised and Updated Chronic
Toxicity Database and Ranked by Genus Mean Chronic Values (GMCV)
Rank Species Common Name GMCV (µg/L)
SMCV (µg/L) Code
11 Esox lucius Northern pike 63.90 63.90 1, 2 10 Salmo trutta Brown trout 32.63 32.63 1 9 Catostomus commersoni White sucker 22.10 22.10 1, 2 8 Salevlinus fontinalis Brook trout 18.63 10.75 1 Salvelinus namaycush Lake trout 32.29 1
7 Campeloma decisum Snail 11.58 11.58 1, 2 6 Ceriodaphnia dubia Cladoceran 13.19 13.19 1, 2 5 Daphnia magna Cladoceran 10.30 10.15 1, 2 Daphnia pulex Cladoceran 10.46 1, 2
4 Clistornia magnifica Caddisfly 10.39 10.39 1, 2 3 Oncorhynchus mykiss Rainbow trout 7.07 10.60 1 Oncorhynchus tshawytscha Chinook salmon 4.71 1
2 Pimephales notatus Bluntnose minnow 7.06 3.96 2 Pimephales promelas Fathead minnow 12.59 2
1 Brachionus calyciflorus Rotifer 1.27 1.27 1, 2 NOTES: All values are normalized to hardness = 50 mg/L as CaCO3. 1 = Coldwater species 2 = Warmwater species
5.4.3 Potential relationships with other water quality parameters
Multiple water quality factors are known to modify to toxicity of copper to aquatic life in addition to water
hardness (e.g., parameters in the BLM). Recent investigations of other water quality parameters have
suggested alkalinity maybe an equally important modifier of copper toxicity as water hardness
(Welsh et al. 2000, Gensemer et al. 2002). We investigated this potential relationship using studies from the
revised and updated acute toxicity database that published both test water hardness and alkalinity
measurements. Eight species contained an appropriate range of alkalinity data of the highest concentration
being three times the lowest and 100 mg/L greater than the lowest concentration tested. Theses species
include two cladocerans (D. magna, and C. dubia) and six fish (O. mykiss, O. clarki, O, tshwytscha, L.
macrochirus, I. Punctatus, and P. promelas). Species mean acute slopes ranged from 0.5667 to 1.5691, with
a pooled slope of 1.0571 (R2 = 0.41, P<0.001).
Although the relationship between copper toxicity and alkalinity is significant, we did not factor this
relationship in the revised and updated copper criteria due to the resulting reduction in the database. Limiting
the database to acute values with alkalinity data reduces the number of data points in the acute database by
59% and the number of species represented by 47% - similar to the reduction observed when limited to
studies with BLM-related data. Given the goal of this study is to derive site-specific criteria via the

Evaluation of the EPA Recalculation Procedure Technical Report in the Arid West 5-26 May 2006
recalculation procedure, which further refines the database via the deletion process, it is necessary to start out
with as robust of a database as possible. Limiting the database to values with test water alkalinity
measurements (or BLM-required data) removes important resident species of the sites under consideration for
recalculation such as the amphipod, H. azteca, the mosquitofish, G. affinis, the only acute toxicity value for
the insect order Odonata, and others.
5.4.4 Updated Final Acute-Chronic Ratio
An updated (FACR) was also determined using all data reported in the current criteria document and data
obtained from CEC’s literature review (Table 5-8). Methods followed those described by Stephan et al.
(1985). Eight new data points were added from studies in which acute and chronic values were calculated at
similar hardness values for a given species. These new data included paired toxicity values for Daphnia pulex
and Ceriodaphnia dubia, which are two acutely sensitive species not previously included in the EPA FACR
calculations. ACRs for Gammarus pseudolimnaeus and Lepomis macrochirus were deleted from the FACR
consideration since chronic data were derived from tests with unacceptable control survival and deleted from
the revised chronic database (Table 7-1). The updated FACR (2.9008) was derived from the three cladoceran
species mean ACRs (SMACRs), whose SMAVs were closest to the updated FAV. The revised FACR of
2.901 is slightly greater than the EPA FACR of 2.823 (EPA 1984).
Table 5-8 Derivation of Revised Species Mean Acute-to-Chronic Ratios (ACRs)
and the Final Acute-to-Chronic (FACR) for Copper Existing ACR Data: New ACR Derivation Data: Species Species Mean ACR Species Species Mean ACRCampeloma decisum 156.2 Campeloma decisum 153.80 Lepomis macrochirus 37.96 Salvelinus fontinalis 7.776 Salvelinus fontinalis 7.776 Pimephales notatus 26.358 Pimephales notatus 26.36 Pimephales promelas 12.653 Oncorhynchus tshawytscha >4.473 Oncorhynchus tshawytscha 11.107 Physa integral 3.585 Oncorhynchus mykiss 3.592 Gammarus pseudolimnaeus* 3.297 Ceriodaphnia dubia* 2.097 Daphnia magna* 2.418 Daphnia magna* 2.418
EPA FACR = 2.823 Daphnia pulex* 4.8143 Updated FACR = 2.901
New ACR Data From Updated Toxicity Databases: Species Hardness Acute Value Chronic Value ACR Reference
Ceriodaphnia dubia 97.6 31.00 14.14 2.1920 Belanger and Cherry 1990 Ceriodaphnia dubia 113.6 76.00 28.28 2.6870 Belanger and Cherry 1990 Ceriodaphnia dubia 113.6 91.00 28.28 3.2173 Belanger and Cherry 1990 Ceriodaphnia dubia 36.0 20.0 19.60 1.0204 Carolson et al. 1986
Daphnia pulex 57.5 25.74 2.83 9.0943 Winner 1985 Daphnia pulex 115.0 27.60 7.07 3.9038 Winner 1985 Daphnia pulex 230.0 28.79 9.16 3.1430 Winner 1985
*=Used in EPA FACR calculation.
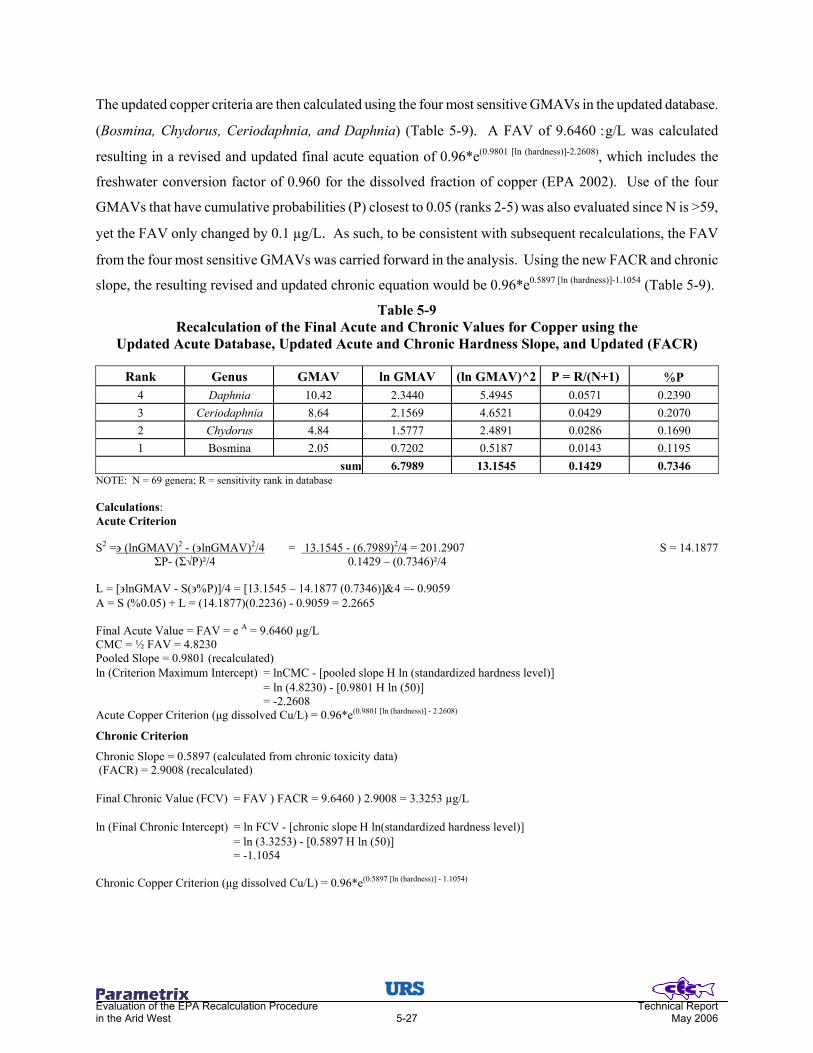
Evaluation of the EPA Recalculation Procedure Technical Report in the Arid West 5-27 May 2006
The updated copper criteria are then calculated using the four most sensitive GMAVs in the updated database.
(Bosmina, Chydorus, Ceriodaphnia, and Daphnia) (Table 5-9). A FAV of 9.6460 :g/L was calculated
resulting in a revised and updated final acute equation of 0.96*e(0.9801 [ln (hardness)]-2.2608), which includes the
freshwater conversion factor of 0.960 for the dissolved fraction of copper (EPA 2002). Use of the four
GMAVs that have cumulative probabilities (P) closest to 0.05 (ranks 2-5) was also evaluated since N is >59,
yet the FAV only changed by 0.1 µg/L. As such, to be consistent with subsequent recalculations, the FAV
from the four most sensitive GMAVs was carried forward in the analysis. Using the new FACR and chronic
slope, the resulting revised and updated chronic equation would be 0.96*e0.5897 [ln (hardness)]-1.1054 (Table 5-9).
Table 5-9 Recalculation of the Final Acute and Chronic Values for Copper using the
Updated Acute Database, Updated Acute and Chronic Hardness Slope, and Updated (FACR)
Rank Genus GMAV ln GMAV (ln GMAV)^2 P = R/(N+1) %P 4 Daphnia 10.42 2.3440 5.4945 0.0571 0.2390 3 Ceriodaphnia 8.64 2.1569 4.6521 0.0429 0.2070 2 Chydorus 4.84 1.5777 2.4891 0.0286 0.1690 1 Bosmina 2.05 0.7202 0.5187 0.0143 0.1195
sum 6.7989 13.1545 0.1429 0.7346 NOTE: N = 69 genera; R = sensitivity rank in database Calculations: Acute Criterion S2 =∋ (lnGMAV)2 - (∋lnGMAV)2/4 = 13.1545 - (6.7989)2/4 = 201.2907 S = 14.1877
ΣΡ- (Σ√P)²/4 0.1429 – (0.7346)²/4 L = [∋lnGMAV - S(∋%P)]/4 = [13.1545 – 14.1877 (0.7346)]&4 =- 0.9059 A = S (%0.05) + L = (14.1877)(0.2236) - 0.9059 = 2.2665 Final Acute Value = FAV = e A = 9.6460 µg/L CMC = ½ FAV = 4.8230 Pooled Slope = 0.9801 (recalculated) ln (Criterion Maximum Intercept) = lnCMC - [pooled slope Η ln (standardized hardness level)] = ln (4.8230) - [0.9801 Η ln (50)] = -2.2608 Acute Copper Criterion (µg dissolved Cu/L) = 0.96*e(0.9801 [ln (hardness)] - 2.2608)
Chronic Criterion
Chronic Slope = 0.5897 (calculated from chronic toxicity data) (FACR) = 2.9008 (recalculated) Final Chronic Value (FCV) = FAV ) FACR = 9.6460 ) 2.9008 = 3.3253 µg/L ln (Final Chronic Intercept) = ln FCV - [chronic slope Η ln(standardized hardness level)] = ln (3.3253) - [0.5897 Η ln (50)] = -1.1054 Chronic Copper Criterion (µg dissolved Cu/L) = 0.96*e(0.5897 [ln (hardness)] - 1.1054)

Evaluation of the EPA Recalculation Procedure Technical Report in the Arid West 5-28 May 2006
Table 5-10 presents a summary of these revised and updated acute and chronic copper criteria at varying
hardness levels, with inclusion of the conversion factor for dissolved criteria.
Table 5-10 Summary of Existing (EPA 1996) and Revised Copper Criteria (as µg dissolved Cu/L) at
Varying Hardness Levels using the Updated Toxicity Databases, Revised Acute and Chronic Pooled-Hardness Slopes, and Updated Final Acute-Chronic Ratios
Mean Hardness in mg/L CaCO3
Equations 25 50 75 100 150 200 250 300 350 400 Current EPA Criteria Acute = 0.96 ( e0.9422 [ln (hardness)]-1.7000 3.640 7.286 10.675 13.999 20.512 26.899 33.192 39.413 45.574 51.684Chronic = 0.96 ( e0.8545 [ln (hardness)]-1.7020 2.739 4.953 7.004 8.956 12.664 16.193 19.595 22.898 26.122 29.279CEC Update (all data) Acute = 0.96 ( e0.9801 [ln (hardness)]-2.2608 2.380 4.709 7.018 9.316 13.886 18.431 22.969 27.472 31.974 36.466Chronic = 0.96 e0.5897 [ln (hardness)]-1.1054 2.121 3.192 4.054 4.804 6.102 7.230 8.246 9.182 10.056 10.880CEC Update (w/o Koivisto et al. 1992) Acute = 0.96 ( e0.9801[ln(hardness)]-2.2835 4.082 8.077 12.039 15.980 23.818 31.615 39.382 47.124 54.846 62.551Chronic = 0.96 ( e 0.5897[(ln(hardness)-1.1281 3.638 5.476 6.955 8.240 10.466 12.401 14.145 15.751 17.250 18.663 Precautionary Note:
One study in particular, Koivisto et al. 1992, highly influenced the updated final acute value. As previously
mentioned, this study provides the only data for the three most sensitive species in the revised and updated
acute database (B. longirostrus, C. sphaericus, and D. galeata). All acute values presented from this study are
unmeasured. Although calculated or nominal concentrations are generally acceptable when no other toxicity
data exists (as with this situation), it is a bit disconcerting and creates high uncertainty with a criterion when
the three of the most sensitive SMAVs, including the two most sensitive GMAVs, are derived from
unmeasured values from a single study. It would not be appropriate to remove these unmeasured values
without removing all unmeasured values; therefore, these data were retained. However, criteria calculated
without acute values from Koivisto et al. (1992) may be more appropriate for revised national criteria. A
comparison of the calculated criteria at various hardness levels with and without the Koivisto et al. (1992)
study can be found in Table 5-10.
5.5 LITERATURE CITED
Andros, J.D., and R.R. Garton. 1980. Acute lethality of copper, cadmium, and zinc to northern squawfish. Trans. Am. Fish. Soc. 109:235-238.
Arthur, J.W., and E.N. Leonard. 1970. Effects of copper on Gammarus pseudolimnaeus, Physa integra, and
Campeloma decisum in soft water. J. Fish. Res. Bd. Canada 27(7):1277-1283. Baird, D.J., I. Barber, M. Bradley, A.M.V.M. Soares, and P. Callow. 1991. A comparative study of genotype
sensitivity to acute toxic stress using closed of Daphnia magna Straus. Ecotoxicol. Environ. Safety 21:257-265.

Evaluation of the EPA Recalculation Procedure Technical Report in the Arid West 5-29 May 2006
Banks, K.E., S.H. Wood, C. Matthews, and K.A. Thuesen. 2003. Joint acute toxicity of diazinon and copper to Ceriodaphnia dubia. Environ. Toxicol. Chem. 22(7):1562-1567.
Belanger, S.E., J.F. Farris, and D.S. Cherry. 1988. Effects of diet, water hardness, and population source on
acute and chronic copper toxicity to Ceriodaphnia dubia. Arch. Environ. Contam. Toxicol. 18:601-611. Belanger, S.E., and D.S. Cherry. 1990. Interacting effects of pH acclimation, pH, and heavy metals of acute
and chronic toxicity to Ceriodaphnia dubia (Cladoceran). J. Crustacean Biol. 10(@):225-235. Bennett, W.A., A. Sosa, and T.L. Beitinger. 1995. Oxygen tolerance of fathead minnows previously exposed
to copper. Bull. Environ. Contam. Toxicol. 55:517-524. Benoit, D.A. 1975. Chronic effects of copper on survival, growth, and reproduction of the bluegill (Lepomis
macrochirus). Trans. Am. Fish. Soc. 104:353-358. Biesinger, K.E., and G.M. Christensen. 1972. Effects of various metals on survival, growth, reproduction,
and metabolism of Daphnia magna. J. Fish Res. Bd. Canada 29:1691. Birge, W.J., W.H. Benson, and J.A. Black. 1983. The Induction of Tolerance to Heavy Metals in Natural
and Laboratory Populations of Fish. Research Report No. 141. Water Resources Research Institute, University of Kentucky, Lexington, KY.
Blaylock, B.G., M.L. Frank, and J.F. McCarthy. 1985. Comparative toxicity of copper and acridine to fish,
Daphnia and algae. Environ. Toxicol. Chem. 4:63-71. Borgmann, U., and C.C. Charlton. 1984. Copper complexation and toxicity to Daphnia in natural waters. J.
Great Lakes Res. 10(4):393-398. Bright, G.R. 1995. Variability of the “water effect ratio” for copper toxicity - a case study. Proc. Toxic.
Subst. Water Environ. 5/23-5/30. Water Environment Federation, Alexandria, VA. Brown, R.J., S.D. Rundle, T.H. Hutchinson, T.D. Williams, and M.B. Jones. 2005. A micro plate freshwater
copepod bioassay for evaluating acute and chronic effects of chemicals. Environ. Toxicol. Chem. 24(6):1528-1531.
Buhl, K.J., and S.J. Hamilton. 1990. Comparative toxicity of inorganic contaminants released by placer
mining to early life stages of salmonid. Ecotoxicol. Environ. Safety 20:325-342. Buhl, K.J., and S.J. Hamilton. 1996. Toxicity of inorganic contaminants, individually and in environmental
mixtures, to three endangered fishes (Colorado squawfish, bonytail, and razorback sucker). Arch. Environ. Contam. Toxicol. 30:84-92.
Buhl, K.J. 2002. The Relative Toxicity of Waterborne Inorganic Contaminants in the Rio Grande Silvery
Minnow (Hybognathus amarus) and Fathead Minnow (Pimephales promelas) in a Water Quality Simulating that in the Rio Grande, New Mexico. Study No. 2F33-962003. Final report to the U.S. Fish and Wildlife Service. U.S. Geological Survey, Columbia Environmental Research Center, Yankton Field Research Station, SD.
Carlson, A.R., H. Nelson, and D. Hammermeister. 1986. Development and validation of site-specific water
quality criteria for copper. Environ. Toxicol. Chem. 5:997-1012.

Evaluation of the EPA Recalculation Procedure Technical Report in the Arid West 5-30 May 2006
Chakoumakos, C., R.C. Russo, and R.V. Thurston. 1979. Toxicity of copper to cutthroat trout (Salmo clarki) under different conditions of alkalinity, pH, and hardness. Environ. Sci. Techno. 13(2):213-219.
Chapman, G.A. 1975. Toxicity of Copper, Cadmium and Zinc to Pacific Northwest Salmonid. Interim
Report. National Environmental Research Center, Corvallis, OR. Chapman, G.A. 1978. Toxicities of copper, cadmium and zinc to four juvenile stages of chinook salmon and
steelhead. Trans. Am. Fish. Soc. 107(6):841-847. Chapman, G.A. 1982. Letter re: chinook salmon early life stage tests with cadmium, zinc, and copper to C.
Stephan, U.S. Environmental Protection Agency, Duluth, Minnesota, dated December 6, 1982. Chapman, G.A. 1999. Tables of toxicity data selected for inclusion in the revised AWQC for copper.
Appendix A. IN: EPA (eds.). Ecological Risk Assessment, Clark Fork River Operable Unit, Milltown Sediments/ClarkFork River Superfund Site, Public Review Draft. U.S. Environmental Protection Agency, Denver, Colorado.
Chapman, G.A., and J.K. McCrady. 1977. Copper toxicity: A question of form. Pages 132-151. IN: Tubb,
R.A. (ed.). Recent Advances in Fish Toxicology. EPA-600/3-77-085. National Technical Information Service, Springfield, Virginia.
Chapman, G.A., and D.G. Stevens. 1978. Acutely lethal levels of cadmium, copper, and zinc to adult male
coho salmon and steelhead. Trans. Am. Fish. Soc. 107(6):837-840. Chapman, G.A., S. Ota, and F. Rect. 1980. Effects of Water Hardness on the Toxicity of Metals to Daphnia
magna (Status Report - Sept. 1980). EPA, Corvallis Environmental Research Laboratory, Corvallis, Oregon.
Cusimano, R.F., D.F. Brakke, and G.A. Chapman. 1986. Effects of pH on the toxicities of cadmium, copper
and zinc to steel head trout (Salmo gairdneri). Can. J. Fish. Aquat. Sci. 43(8):1497-1503. Dave, G. 1984. Effects of copper on growth, reproduction, survival and hemoglobin in Daphnia magna.
Comp. Biochem. Physiol. 78C(2):439-443. De Schamphelaere, K.A.C., D.G. Heijerick, and C.R. Janssen. 2002. Refinement and field validation of a
biotic ligand model predicting acute copper toxicity to Daphnia magna. Comp. Biochem. Physiol. Part C 133:243-258.
De Schamphelaere, K.A.C., and C.R. Janssen. 2004. Effects of chronic dietary copper exposure on growth
and reproduction of Daphnia magna. Environ. Toxicol. Chem. 23(8):2038-2047. Di Toro, D.M., H.E. Allen, H.L. Bergman, J.S. Meyer, P.R. Paquin, and R.C. Santore. 2001. Biotic ligand
model of the acute toxicity of metals. 1. Technical basis. Environ. Toxicol. Chem. 20(10):2383-2396. Diamond, J.M., D.E. Koplish, J. McMahon, III, and R. Rost. 1997. Evaluation of the water-effect ratio
procedure for metals in a riverine system. Environ. Toxicol. Chem. 16(3):509-520. Dwyer, F.J., D.K. Hardesty, C.E. Henke, C.G. Ingersoll, D.W. Whites, D.R. Mount, C.M. Bridges. 1999.
Assessing Contaminant Sensitivity of Endangered and Threatened Species: Toxicant Classes. EPA/600/R-99-098. U.S. Environmental Protection Agency Environmental Research Laboratory, Gulf Breeze, Florida.
Evaluation of the EPA Recalculation Procedure Technical Report in the Arid West 5-31 May 2006
Dwyer, F.J., L.C. Sappington, D.R. Buckler, S.B. Jones. 1995. Use of Surrogate Species in Assessing Contaminant Risk to Endangered and Threatened Fishes. EPA/600/R-029. EPA, Environmental Research Laboratory, Gulf Breeze, Florida.
Elnabarawy, M.T., A.N. Welter, and R.R. Robideau. 1986. Relative sensitivity of three Daphnid species to
selected organic and inorganic chemicals. Environ. Toxcol. Chem. 5:393-398. Erickson, R.J., D.A. Beloit, V.R. Mattson, H.P. Nelson, Jr., and E.N. Leonard. 1996. The effects of water
chemistry on the toxicity of copper to fathead minnows. Environ. Toxicol. Chem. 15(2):181-193. Fargasova, A. 2003. Cadmium, copper, zinc, and aluminum binary combinations acute toxicity for
Chironomus plumosus larvae. Fresenius Environ. Bull. 12(8):830-834. Fogels, A., and J.B. Sprague. 1977. Comparative short-term tolerance of zebrafish, flagfish, and rainbow
trout to five poisons including potential reference toxicant. Water Res. 11:811-817. Gauss, J.D., P.E. Woods, R.W. Winner, and J.H. Skillings. 1985. Acute toxicity of copper to three life stages
of Chironomus tentans as affected by water hardness-alkalinity. Environ. Pollut. 37A(2):149-57. Geckler, J.R., W.B. Horning, T.M. Neiheisel, Q.H. Pickering, E.L. Robinson, and C.E. Stephan. 1976.
Validity of Laboratory Tests for Predicting Copper Toxicity in Streams. EPA-600/3-76-116. Environmental Research Laboratory-Duluth, Cincinnati, Ohio.
Gensemer, R.W., R.B. Naddy, W.A. Stubblefield, J.R. Hockett, R. Santore, and P. Paquin. 2002. Evaluating
the role of ion composition on the toxicity of copper to Ceriodaphnia dubia in very hard waters. Compar. Biochem. Physiol. Part C 133:87-97.
Goettl, J.P., Jr., J.R. Sinley, and P.H. Davies. 1972. Water pollution studies. Pages 36-44. IN: Yeager, LE.,
and D.T. Weber (eds.). Colorado Fisheries Research Review No. 7. Colorado Division of Wildlife, Fort Collins, Colorado.
Hale, J.G. 1977. Toxicity of metal mining wastes. Bull. Environ. Contam. Toxicol. 17(1):66-73. Hamilton, S.J., and K.J. Buhl. 1990. Safety assessment of selected inorganic elements to fry of chinook
salmon (Oncohynchus tshawytscha). Ecotoxicol. Environ. Safety 20:307-324. Hamilton, S.J., and K.J. Buhl. 1997a. Hazard assessment of inorganic, individually and in mixtures, to two
endangered fish in the San Juan River, New Mexico. Environ. Toxicol. Water Qual. 12:195-209. Hamilton, S.J., and K.J. Buhl. 1997b. Hazard assessment of inorganics, singly and in mixtures, to
flannelmouth sucker Catostomus latipinnis in the San Juan River, New Mexico. Ecotoxicol. Environ. Safety 38:296-308.
Harmon, S.M., W.L. Specht, and G.T. Chandler. 2003. A comparison of Daphnids Ceriodaphnia dubia and
Daphnia ambigua for their utilization in routine toxicity testing in the southeastern United States. Arch. Environ. Contam. Toxicol. 45:79-85.
Harrison, F.L., J.P. Knezovich, and D.W. Rice, Jr. 1984. The toxicity of copper to the adult and early life
stages of the freshwater clam, Corbicula manilensis. Arch. Environ. Contam. Toxicol. 13:85-92.

Evaluation of the EPA Recalculation Procedure Technical Report in the Arid West 5-32 May 2006
Hauri, J.F., and A.J. Horne. 2004. Reduction in labile copper in the 7-day Ceriodaphnia dubia toxicity test due to the interaction with zooplankton food. Chemosphere 56:717-723.
Hollis, L., K. Burnison, R.C. Playle. 1996. Does the age of metal-dissolved organic carbon complexes
influence binary of metals to fish gills? Aquat. Toxicol. 35:253-264. Howarth, R.S., and J.B. Sprague. 1978. Copper lethality to rainbow trout in waters of various hardness and
pH. Water Res. 12:455-462. Hughes, J.S. Acute Toxicity of Thirty Chemicals to Striped Bass (Morone saxatilis). Louisiana Wild Life and
Fisheries Commission. Hyne, R.V., F. Pablo, M. Julli, and S.J. Markich. 2005. Influence of water chemistry on the acute toxicity of
copper and zinc to the cladoceran Ceriodaphnia CF dubia. Environ. Toxicol. Chem. 24(7):1667-1675. Jacobson, P.J., R.J. Neves, D.S. Cherry, and J.L. Farris. 1997. Sensitivity of glochidial stages of freshwater
mussels (Bivalvia: Unionidae) to copper. Environ. Toxicol. Chem. 16(11):2384-2392. Janssen, C.R., G. Persoone, and T.W. Snell. 1994. Cyst-based toxicity tests. VIII. Short-chronic toxicity
tests with the freshwater rotifer Brachionus calyciflorus. Aquat. Toxicol. 28:243-258. Johnston, J.S. 2002. Letter re: Idaho Department of Environmental Quality Comments on EPA’s Proposed
Plan for Remediation of the Blackbird Mine Site, August 2002 to F. Allans, U.S. Environmental Protection Agency, Boise, ID, dated October 10, 2002.
Jop, K.M., A.M. Askew, and R.B. Foster. 1995. Development of a water-effect ratio for copper, cadmium,
and lead for the Great Works River in Maine using Ceriodaphnia dubia and Salvelinus fontinalis. Bull. Environ. Contam. Toxicol. 54:29-35.
Kallanagoudar, Y.P., and H.S. Patil. 1997. Influence of water hardness on copper, zinc and nickel toxicity to
Gambusia affinis (B & G). J. Environ. Biol. 18(4):409-413. Keller, A.E., and S.G. Zam. 1991. The acute toxicity of selected metals to the freshwater mussel, Anodonta
imbecilis. Environ. Toxicol. Chem. 10(4):539-546. Keller, A.E. 2000. Water Quality and Toxicity Data for Unpublished Unionid Mussel Tests. Memorandum
to R. Pepsin and C. Roberts, EPA, dated November 10, 2000. Khangarot, B.S. 1991. Toxicity of metals to a freshwater tubificid worm, Tubifex tubifex (Muller). Arch.
Environ. Contam. Toxicol. 46:906-912. Khangarot, B.S., and V.K. Rajbanshi. 1979. Experimental studies on toxicity of zinc to a freshwater teleost,
Rasbora daniconius (Hamilton). Hydrobiol. 65(2):141-144. Khangarot, B.S., V.S. Durve, and V.K. Rajbanshi. 1981. Toxicity of interactions of zinc - nickel, copper -
nickel and zinc - nickel - copper to a freshwater teleost, Lebistes reticulatus (Peters). Acta Hydrochim. Hydrolbiol. 9:(5):495-503.
Koivisto, S., M. Ketola, and M. Walls. 1992. Comparison of five cladoceran species in short- and long-term
copper exposure. Hydrobiol. 248(2):125-136.

Evaluation of the EPA Recalculation Procedure Technical Report in the Arid West 5-33 May 2006
Lalande, M., and B. Pinel-Alloul. 1986. Acute toxicity of cadmium, copper, mercury and zinc to Tropocyclops prasinus mexicanus (Cyclopoida, Copepoda) from three Quebec lakes. Environ. Toxicol. Chem. 5:95-102.
Lazorchak, J.M., and W.T. Waller. 1993. The relationship of total copper 48-h LC50s to Daphnia magna
dry weight. Environ. Toxicol. Chem. 12:903-911. Lind, D., K. Alto, and S. Chatterton. 1978. Regional Copper-Nickel Study: Aquatic Toxicology Study,
Preliminary Draft Report. Minnesota Environmental Quality Board, St. Paul, Minnesota. Long, K.E., E.J. Van Genderen, and S.J. Klaine. 2004. The effects of low hardness and pH on copper
toxicity to Daphnia magna. Environ. Toxicol. Chem. 23(1):72-75. Marr, J.C.A. 1994. Effects of Acclimation and Pulsed Exposure on Lethal and Sub-Lethal Responses of
Brown and Rainbow Trout Exposed to a Metals Mixture. Doctorate Dissertation. University of Wyoming, Laramie, Wyoming.
Marr, J., J. Lipton, and D. Cacela. 1995. Fisheries Toxicity Injury Studies, Blackbird Mine Site, Idaho.
Prepared for National Oceanic and Atmospheric Administration. Marr, J.C.A., J. Lipton, D. Cacela, J.A. Hansen, H.L. Bergman, J.S. Meyer, and C. Hogstrand. 1996.
Relationship between copper exposure duration, tissue copper concentrations, and rainbow trout gowth. Aquat. Toxicol. 36:17-30.
Marr, J.C.A., J.A. Hansen, J.S. Meyer, D. Cacela, T. Podrabsky, J. Lipton, H.L. Bergman. 1998. Toxicity of
cobalt and copper to rainbow trout: application of a mechanistic model for predicting survival. Aquat. Toxicol. 43:225-238.
Martin, T.R., and D.M. Holdich. 1986. The acute lethal toxicity of heavy metals to per acarid crustaceans
(with particular reference to freshwater asellids and gammarids). Water Res. 20(9):1137-1147. McGee, J.C., C. Szebedinszky, D.G. McDonald, and C.M. Wood. 2002. The role of dissolved organic
carbon in moderating the bioavailability and toxicity of Cu to rainbow trout during chronic waterborne exposure. Comp. Biochem. Physiol. Part C 133:147-160.
McKim, J.M., J.G. Eaton, and G.W. Holcombe. 1978. Metal toxicity to embryos and larvae of eight species
of freshwater fish - II: Copper. Bull. Environ. Contam. Toxicol. 19:608-616. Meador, J.P. 1991. The interaction of pH, dissolved organic carbon, and total copper in the determination of
ionic copper and toxicity. Aquat. Toxicol. 19:13-32. Miller, T.G., and W.C. Mackay. 1979. The effects of hardness, alkalinity and pH of test water on the toxicity
of copper to rainbow trout (Salmo gairdneri). Water Res. 14:129-133. Mount, D.I., and C.E. Stephan. 1969. Chronic toxicity of copper to the fathead minnow (Pimephales
promelas) in soft water. J. Fish. Res. Bd. Canada 26:2449-2457. Mount, D.I., and T.J. Norberg. 1984. A seven-day life-cycle cladoceran toxicity test. Environ. Toxicol.
Chem. 3:425-434.

Evaluation of the EPA Recalculation Procedure Technical Report in the Arid West 5-34 May 2006
Mount, D.R., A.K. Barth, T.D. Garrison, K.A. Barten, and J.R. Hockett. 1994. Dietary and waterborne exposure of rainbow trout (Oncorhynchus mykiss) to copper, cadmium, lead and zinc using a live diet. Environ. Toxicol. Chem. 13(12):2031-2041.
Mudge, J.E., T.E. Northstrom, G.S. Jeane, W. Davis, and J.L. Hickam. 1993. Effect of varying
environmental conditions on the toxicity of copper to salmon. Pages 19-33. IN: Gorsuch, J.W., F.J. Dwyer, C.G. Ingersoll, and T.W. LaPoint (eds.). Environmental Toxicology and Risk Assessment. ASTM STP 1216. American Society for Testing and Materials, Philadelphia, Pennsylvania.
Naddy, R.B., W.A. Stubblefield, J.R. May, S.A. Tucker, and J.R. Hockett. 2002. The effect of calcium and
magnesium ratios on the toxicity of copper to five aquatic species in freshwater. Environ. Toxicol. Chem. 21(2):347-352.
Nebeker, A.V., C. Savonen, R.J. Baker, and J.K. McCrady. 1984. Effects of copper, nickel and zinc on the
life cycle of the caddisfly Clistornia magnifica (Limnephilidae). Environ. Toxicol. Chem. 3:645-649. Nebeker, A.V., A. Stinchfield, C. Savonen, and G.A. Chapman. 1986. Effects of copper, nickel and zinc on
three species of Oregon freshwater snails. Environ. Toxicol. Chem. 5:807-811. Nriagu, J.O. (ed.). 1979. Copper in the Environment. John Wiley & Sons, New York. Oris, J.T., R.W. Winner, and M.V. Moore. 1991. A four-day survival and reproduction toxicity test for
Ceriodaphnia dubia. Environ. Toxicol. Chem. 10:217-224. Palawski, D., J.B. Hunn, and F.J. Dwyer. 1985. Sensitivity of young striped bass to organic and inorganic
contaminants in fresh and saline waters. Trans. Am. Fish. Soc. 114(5):748-753. Pickering, Q., W. Brungs, and M. Gast. 1977. Effect of exposure time and copper concentration on
reproduction of the fathead minnow (Pimephales promelas). Water Res. 11:1079-1083. Playle, R.C., and D.G. Dixon. 1993. Copper and cadmium binding to fish gills: Modification by dissolved
organic carbon and synthetic ligand. Can. J. Fish. Aquat. Sci. 50:2667-2677. Rehwoldt, R., G. Bida, and B. Nerrie. 1971. Acute toxicity of copper, nickel and zinc ions to some Hudson
River fish species. Bull. Environ. Contam. Toxicol. 6(5):445-448. Rehwoldt, R., L. Lasso, C. Shaw, and E. Wirhowski. 1973. The acute toxicity of some heavy metal ions
toward benthic organisms. Bull. Environ. Contam. Toxicol. 10(5):291-294. Rice, D.W., Jr., and F.L. Harrison. 1983. The Sensitivity of Adult, Embryonic, and Larval Crayfish
Procambaris clarki to Copper. NUREG/CR-3133, UCRL-53048. Prepared for Office of Nuclear Regulatory Research, Washington, DC.
Santore, R.C., D.M. Di Toro, P.R. Paquin, H.E. Allen and J.S. Meyer. 2001. Biotic ligand model of the acute
toxicity of metals. 2. Application to acute copper toxicity in freshwater fish and Daphnia. Environ Toxicol. Chem. 20(10):2397-2402.
Schubauer-Berrigan, M.K., J.R. Kierkes, P.D. Monson, and G.T. Ankley. 1993. Ph-dependent toxicity of
cadmium, copper, nickel, lead and zinc to Ceriodaphnia dubia, Pimephales promelas, Hyalella azteca and Lumbriculus variegatus. Environ. Toxicol. Chem. 12(7):1261-1266.

Evaluation of the EPA Recalculation Procedure Technical Report in the Arid West 5-35 May 2006
Seim, W.K., L.R. Curtis, S.W. Glenn, and G.A. Chapman. 1984. Growth and survival of developing steelhead trout (Salmo gairdneri) continuously or intermittently exposed to copper. Can. J. Fish. Aquat. Sci. 41:433-438.
Servizi, J.A., and D.W. Martens. 1978. Effects of Selected Heavy Metals on Early Life of Sockeye and Pink
Salmon. Progress Report No. 39. International Pacific Salmon Fisheries Commission, New Westminster, B.C., Canada.
Sharma, M.S., and C.S. Selvaraj. 1994. Zinc, lead and cadmium toxicity to selected freshwater zooplankters.
Poll. Res. 13(2):191-201. Spehar, R.L., and J.T. Fiandt. 1986. Acute and chronic effects of water quality criteria-based metal mixtures
on three aquatic species. Environ. Toxicol. Chem. 5:917-931. Straus, D.L., and C.S. Tucker. 1993. Acute toxicity of copper sulfate and chelated copper to channel catfish
Ictalurus punctatus. J. World Aquacult. Soc. 24(3):390-395. Stephan, C.E., D.I. Mount, D.J. Hansen, J.H. Gentile, G.A. Chapman, and W.A. Brungs. 1985. Guidelines
for Deriving Numerical National Water Quality Criteria for the Protection of Aquatic Organisms and Their Uses. PB-85-227049. U.S. Environmental Protection Agency, Office of Research and Development, Duluth, Minnesota.
Stephenson, R.R. 1983. Effects of water hardness, water temperature, and size of the test organism on the
susceptibility of the freshwater shrimp, Gammarus pulex (L.), to toxicants. Bull. Environ. Contam. Toxicol. 31:459-466.
Suedel, B.C., E. Deaver, and J.H. Rodgers, Jr. 1996. Experimental factors that may affect toxicity of
aqueous and sediment-bound copper to freshwater organisms. Arch. Environ. Contam. Toxicol. 30:40-46. Taylor, R.M., G.D. Watson, and M.A. Alikhan. 1995. Comparative sub-lethal and lethal acute toxicity of
copper to the freshwater crayfish, Cambarus robustus (Cambaridae, Decapoda, Crustacea) from an acidic metal-contaminated lake and a circumneutral uncontaminated stream. Water Res. 29(2):401-408.
Thompson, K.W., A.C. Hendricks, and J. Cairns, Jr. 1980. Acute toxicity of zinc and copper singly and in
combination to the bluegill (Lepomis macrochirus). Bull. Environ. Contam. Toxicol. 25:122. Trama, F.B. 1954. The acute toxicity of copper to the common bluegill Lepomis macrochirus Rafinesque.
Notulae Naturae 257:1-13. U.S. Environmental Protection Agency. 1985. Ambient Water Quality Criteria for Copper - 1984. EPA
449.5-84-031. Office of Water, Washington, DC. U.S. Environmental Protection Agency. 1996. 1995 Updates: Water Quality Criteria Documents for the
Protection of Aquatic Life in Ambient Water. EPA-820-B-96-001. Office of Water, Washington, DC. U.S. Environmental Protection Agency. 2002. National Recommended Water Quality Criteria.
EPA-822-R-02-047. Office of Water, Washington, DC. U.S. Environmental Protection Agency. 2003. 2003 Update of Ambient Water Quality Criteria for Copper.
CAS Registry No. 7440-50-8. Office of Water, Washington, DC.

Evaluation of the EPA Recalculation Procedure Technical Report in the Arid West 5-36 May 2006
University of Wisconsin-Superior. 1995. Results of Freshwater Simulation Tests Concerning Dissolved Metal. Final Report to Environmental Research Laboratory, Duluth Minnesota.
Warnick, S.L., and H.L. Bell. 1969. The acute toxicity of some heavy metals to different species of aquatic
insects. J. WPCF Part 1 41(2):280-284. Welsh, P.G., J. Lipton, G.A. Chapman, and T.L. Podrabsky. 2000. Relative importance of calcium and
magnesium in hardness-based modification of copper toxicity. Environ. Toxicol. Chem. 19(6):1624-1631.
Winner, R.W., and M.P. Farrell. 1976. Acute and chronic toxicity of copper to four species of Daphnia. J.
Fish. Res. Bd. Canada 33:1685-1691. Winner, R.W. 1984. The toxicity and bioaccumulation of cadmium and copper as affected by humic acid.
Aquat. Toxicol. 5:267-274. Winner, R.W. 1985. Bioaccumulation and toxicity of copper as affected by interactions between humic acid
and water hardness. Water Res. 19(4):449-455. Wong, C.K., and A.P. Pak. 2004. Acute and subchronic toxicity of the heavy metals copper, chromium,
nickel, and zinc, individually and in mixture, to the freshwater copepod Mesocyclops pehpeiensis. Arch. nviron. Contam. Toxicol. 73:190-196.

Evaluation of the EPA Recalculation Procedure Technical Report in the Arid West 6-1 May 2006
6.0 DIAZINON CRITERIA REVIEW AND UPDATE The EPA has not established national aquatic life criteria for diazinon, but did produce a draft entitled Draft
Ambient Aquatic Life Water Quality Criteria Diazinon (EPA 2000), hereinafter referred to as the 2000
Diazinon Draft. This document established a working database and draft derived AWQC to protect fresh- and
saltwater organisms. Since distribution of the 2000 Diazinon Draft, additional information on the
environmental significance of freshwater organism diazinon exposure and available toxicity studies has been
published.
6.1 BACKGROUND
Diazinon is an organo-phosphate (OP) compound used as a broad-spectrum insecticide. Diazinon has been in
use since 1948, and has effectively replaced parathion and methylparathion, which were banned due to
potential high acute mammalian toxicity (rat LD50 <20 mg/kg). In California, diazinon is heavily used in the
San Joaquin River Valley where presence in storm water runoff is a major water quality problem in
agricultural areas (Werner et al. 2004). In addition to agricultural areas, diazinon may contribute to water
quality problems in surface waters of developed areas where it is used in professional landscaping and
maintenance, pet shampoos, and structural pest control. Hoffman et al. (2000) surveyed eight U.S. urban
streams and reported diazinon detection frequency of 69.3% above 0.01 µg/L and 24.9% above 0.05 µg/L
from 200 observations. In a nation-wide reconnaissance of organic wastewater contaminants in 139 streams
across 30 states, Kolpin et al. (2002) identified diazinon in 25.9% of sample streams at a detection level of
0.03 µg/L, with a median and maximum value of 0.07 µg/L and 0.35 µg/L, respectively. In an agricultural
setting, diazinon concentrations can be expected to spike in surface water after application and rainwater
runoff events. In urban settings, surface water diazinon concentrations might be greater after rain runoff
events, but wastewater effluent could contribute to chronic low-level aquatic organism exposure.
The proposed mechanism of diazinon toxicity is cholinesterase inhibition (Aldridge and Reiner 1972), briefly
described below. At the intercellular neuron-axon synapses, electrical transmission of signals pass across
synapses to dendrites via chemical neurotransmitters and transmitter inactivators. When a nerve impulse
reaches the synapse, chemical neurotransmitters are released and then travel across the synaptic cleft to the
post-synaptic dendrite. The signal strength is controlled via transmitter binding strength to the dendrite. The
binding strength is controlled via acetylcholinesterase-dependent de-esterification that rapidly cleaves the
neurotransmitter acetylcholine. OPs, such as diazinon, strongly bind to acetylcholinesterase and are not easily
cleaved due to enzyme phosphorylation. This semi-permanent bond between acetylcholinesterase and
diazinon effectively silences the nerve signal transmission inactivation, resulting in acetylcholinesterase
protein and nerve terminal membrane damage (Klaassen 2001).

Evaluation of the EPA Recalculation Procedure Technical Report in the Arid West 6-2 May 2006
Invertebrates efficiently oxidize diazinon into more toxic diazoxon during P450 metabolism. This increased
oxidation efficiency during metabolism and less efficient de-esterification of diazinon at the synaptic cleft
might be the reason for increased toxicity in more sensitive macroinvertebrate organisms (Klaassen 2001).
Since OPs, such as diazinon, are developed and used to kill pest invertebrates, it would be expected that
aquatic invertebrates would be more sensitive than fish. Higher vertebrates such as fish and mammals have
efficient metabolic processes that effectively reduce toxic effects of acute and chronic diazinon exposure.
Unfortunately, vertebrates do not develop these metabolic processes until specific life stages are reached
during development, potentially leaving early life stage organisms at risk. This lack of protective mechanisms
could contribute to increased toxicity during life0-cycle toxicity testing that cover a sensitive stage of
development. However, later life stages of the same organism might be relatively resistant to diazinon, which
complicates comparison of acute and chronic values.
Uptake of diazinon by aquatic organisms is rapid, with body burdens reaching maximum concentrations after
3-7 days (World Health Organization 1998). When transferred to clean water, higher vertebrates, such as
fish, can rapidly metabolize diazinon and efficiently excrete metabolites. Organs that show the greatest
bioconcentration are associated with metabolism and excretion, i.e., the liver and kidney (Tsuda et al. 1990).
This route for efficient excretion plays a protective role in fish species exposed to pulse- dominated exposure
patterns and reduces risk of chronic toxicity. With such a well-understood mechanism of toxicity, a
significant scientific literature base has been developed that includes effects in many aquatic organisms.
Unfortunately, little is known of the environmental fate of diazinon in aquatic environments, and the toxicity
of diazinon metabolites to aquatic organisms.
Inherent physical and chemical properties of diazinon predict that it is most stable in neutral media, less stable
in alkaline media, and least stable in acidic media. Each diazinon molecule is subject to acid-/base-catalyzed
hydrolysis, which results in the breakage at the phosphorus-oxygen bond. Faust and Gomaa (1972) reported a
pH-dependent degradation of diazinon in laboratory water at 20ºC; the half-life was determined to be 0.5,
184.8, and 6.1 days at respective pH values of 3.1, 7.4, and 10.4. Medina et al. (1999) compared the half-life
of diazinon in filtered river water under light and dark conditions and found a somewhat shorter half-life for
sunlight-exposed samples (31 days) compared to unexposed samples (37 days). Kanazawa (1975) tested
degradation in tap water and found a 27% degradation of diazinon after 30 days, but other authors (i.e.,
Ferrando et al. 1991) reported 49% degradation after 96 hours in toxicity test experimental water. One could
expect that reported degradation rates would be greater in natural waters due to sunlight exposure and the
presence of aquatic organisms that actively metabolize diazinon.
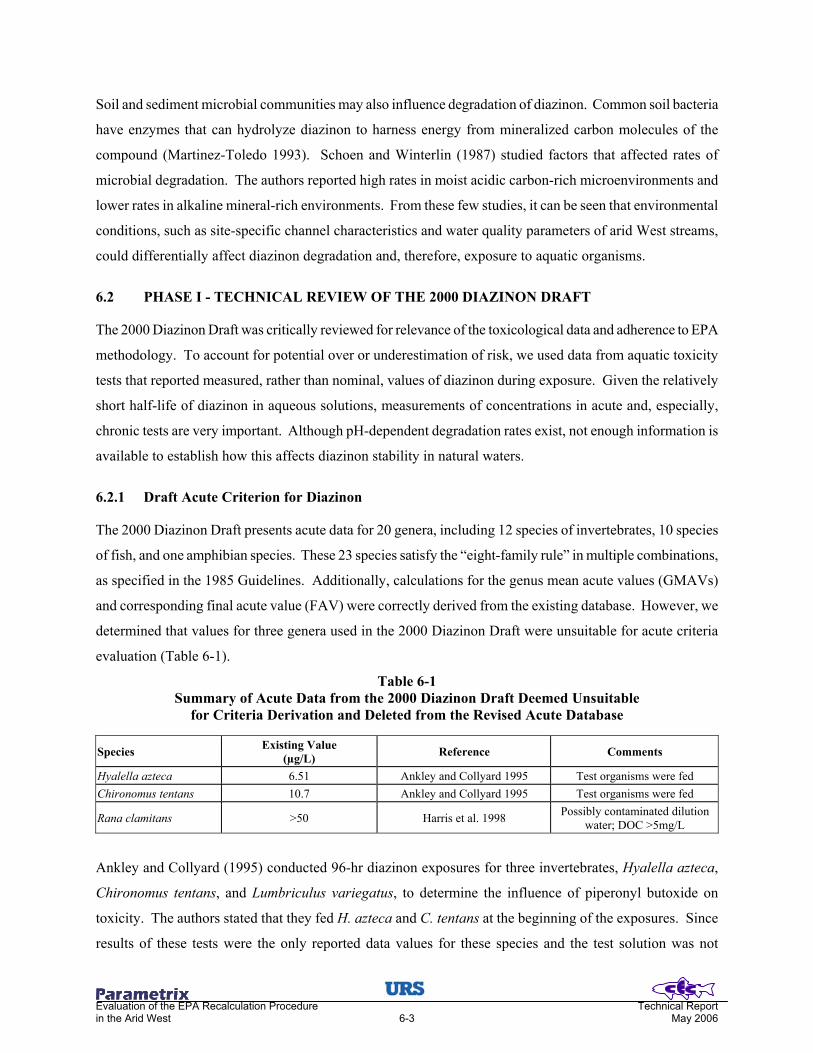
Evaluation of the EPA Recalculation Procedure Technical Report in the Arid West 6-3 May 2006
Soil and sediment microbial communities may also influence degradation of diazinon. Common soil bacteria
have enzymes that can hydrolyze diazinon to harness energy from mineralized carbon molecules of the
compound (Martinez-Toledo 1993). Schoen and Winterlin (1987) studied factors that affected rates of
microbial degradation. The authors reported high rates in moist acidic carbon-rich microenvironments and
lower rates in alkaline mineral-rich environments. From these few studies, it can be seen that environmental
conditions, such as site-specific channel characteristics and water quality parameters of arid West streams,
could differentially affect diazinon degradation and, therefore, exposure to aquatic organisms.
6.2 PHASE I - TECHNICAL REVIEW OF THE 2000 DIAZINON DRAFT
The 2000 Diazinon Draft was critically reviewed for relevance of the toxicological data and adherence to EPA
methodology. To account for potential over or underestimation of risk, we used data from aquatic toxicity
tests that reported measured, rather than nominal, values of diazinon during exposure. Given the relatively
short half-life of diazinon in aqueous solutions, measurements of concentrations in acute and, especially,
chronic tests are very important. Although pH-dependent degradation rates exist, not enough information is
available to establish how this affects diazinon stability in natural waters.
6.2.1 Draft Acute Criterion for Diazinon
The 2000 Diazinon Draft presents acute data for 20 genera, including 12 species of invertebrates, 10 species
of fish, and one amphibian species. These 23 species satisfy the “eight-family rule” in multiple combinations,
as specified in the 1985 Guidelines. Additionally, calculations for the genus mean acute values (GMAVs)
and corresponding final acute value (FAV) were correctly derived from the existing database. However, we
determined that values for three genera used in the 2000 Diazinon Draft were unsuitable for acute criteria
evaluation (Table 6-1).
Table 6-1 Summary of Acute Data from the 2000 Diazinon Draft Deemed Unsuitable
for Criteria Derivation and Deleted from the Revised Acute Database
Species Existing Value (µg/L) Reference Comments
Hyalella azteca 6.51 Ankley and Collyard 1995 Test organisms were fed Chironomus tentans 10.7 Ankley and Collyard 1995 Test organisms were fed
Rana clamitans >50 Harris et al. 1998 Possibly contaminated dilution water; DOC >5mg/L
Ankley and Collyard (1995) conducted 96-hr diazinon exposures for three invertebrates, Hyalella azteca,
Chironomus tentans, and Lumbriculus variegatus, to determine the influence of piperonyl butoxide on
toxicity. The authors stated that they fed H. azteca and C. tentans at the beginning of the exposures. Since
results of these tests were the only reported data values for these species and the test solution was not

Evaluation of the EPA Recalculation Procedure Technical Report in the Arid West 6-4 May 2006
measured, there was insufficient evidence to indicate that the food did not affect the toxicity or exposure of
the test material. If a similar toxicity test of these species, duration, and water quality parameters in which
test organisms were not fed was available, results could be compared. Unfortunately, no such data were
available for comparison, providing insufficient evidence to indicate influence of feeding on diazinon toxicity.
The decision to not use this study was also supported by the fact that test solution concentrations were not
measured, further complicating issues with diazinon degradation and/or sorption to organics, as noted above.
Toxicity data derived for L. variegatus from this study were used because organisms were not fed during the
test, although diazinon concentrations were calculated and not measured.
Harris et al. (1998) provided data on green frog, Rana clamitans, diazinon toxicity as part of a larger field
study using caged animals. Laboratory toxicity testing was performed with an unknown percentage of active
ingredient technical diazinon pesticide formulation and reference site water. No chemical analyses were
performed on the reference site water to determine whether any confounding residual contaminants were
present that one might expect from an agricultural area surface water source. Additionally, reported water
quality parameters of site water that were used for dilution exceeded the total organic carbon limit (5 mg/L) as
stated in Stephan et al. (1985) without providing sufficient evidence of effect on toxicity.
6.2.2 Draft Chronic Criterion for Diazinon
The 2000 Diazinon Draft chronic database presents chronic data for five genera of freshwater organisms,
including one species of invertebrate and four species of fish. These five species from four families do not
satisfy the “eight-family rule” as specified in the 1985 Guidelines. The chronic database assemblage does,
however, satisfy the minimal requirements for calculation of an acute-to-chronic ratio (ACR), if the saltwater
shrimp species Americamysis bahia is considered. After calculations of three valid ACRs for three species, it
was evident that species that were acutely sensitive had lower ACRs, and species that were acutely insensitive
had higher ACRs. Given this relationship, a final ACR (FACR) value was calculated by EPA using only this
most acutely sensitive Ceriodaphnia dubia and A. bahia, which resulted in a FACR that was less than 2. The
1985 Guidelines (Stephan et al. 1985) state if the most appropriate FACR is less then 2, then acclimation had
probably occurred and the FACR should be assumed to be 2. Dividing the FAV by 2 resulted in a final
chronic value of 0.0963 µg/L, which is equivalent to the CMC (CMC = FAV/2). Compared to the modest
acute database, the chronic database on diazinon is lacking diversity and robustness.

Evaluation of the EPA Recalculation Procedure Technical Report in the Arid West 6-5 May 2006
6.3 PHASE II – UPDATE TO THE NATIONAL DIAZINON TOXICITY DATABASES
A comprehensive literature review of diazinon documents used and not used in the 2000 Diazinon Draft was
conducted. This included a review of documents published since the 2000 Diazinon Draft, as well as those
published prior to 1999 that were not used in the criterion derivation. Approximately 100 papers were
obtained and reviewed for appropriate data.
6.3.1 New Acute Diazinon Toxicity Data
The literature review contributed 25 new acute data points from 19 studies to the revised acute database
(Table 6-2). Of the 19 studies added to the database, 16 were published prior to the 2000 Diazinon Draft.
Five of these studies were not cited in either Table 1 (“Acute Toxicity of Diazinon to Aquatic Animals”) or
Table 6 (“Other Data on Effects of Diazinon on Aquatic Organisms”) of the 2000 Diazinon Draft and,
apparently, represent data unknown to the EPA at the time.
Toxicity testing data points that had more than one listed reference were specifically investigated - since this
may be a result of different authors citing the same test data (e.g., Cope 1965 a, b; Sanders and Cope 1966;
Johnson and Finley 1980; Mayer and Ellersieck 1986). It was determined from this investigation that
additional data for eight tests used in the 2000 Diazinon Draft were available, but not included. The
additional data included two acceptable 48-hr LC50 tests for Daphnia pulex, two usable 48-hr LC50s for
Simocephalus serrulatus, and one usable 96-hr LC50 for Lepomis macrochirus (Table 6-2). Forty-eight-hour
LC50 test data were also available for Pteronarcys (=Pteronarcella) californicus, Oncorhynchus mykiss, and
L. macrochirus, but were not considered acceptable, for use in criteria calculations, due to short test duration.
Table 6-2
Summary of Acute Data that were Deemed Acceptable for use and Added to the Updated Diazinon Acute Database
Species Method LC50 (µg/L) Reference Girardia tigrina S, M 630 Villar et al. 1994 Lepomis macrochirus S, U 22 Cope 1965b Daphnia pulex S, U 0.9 Sanders and Cope 1966 Daphnia pulex S, U 0.8 Johnson and Finley 1980 Simocephalus serrulatus S, U 1.4 Johnson and Finley 1980 Simocephalus serrulatus S, U 2 Cope 1965a Oncorhynchus mykiss S, U 90 Cope 1965b Oncorhynchus mykiss R, U >1,000 Beauvais et al. 2000 Chironomus tentans S, M 30 Belden 2000 Brachydanio rerio S, M 7,304 Keizer 1993 Poecilia reticulate S, M 669.57 Keizer 1993
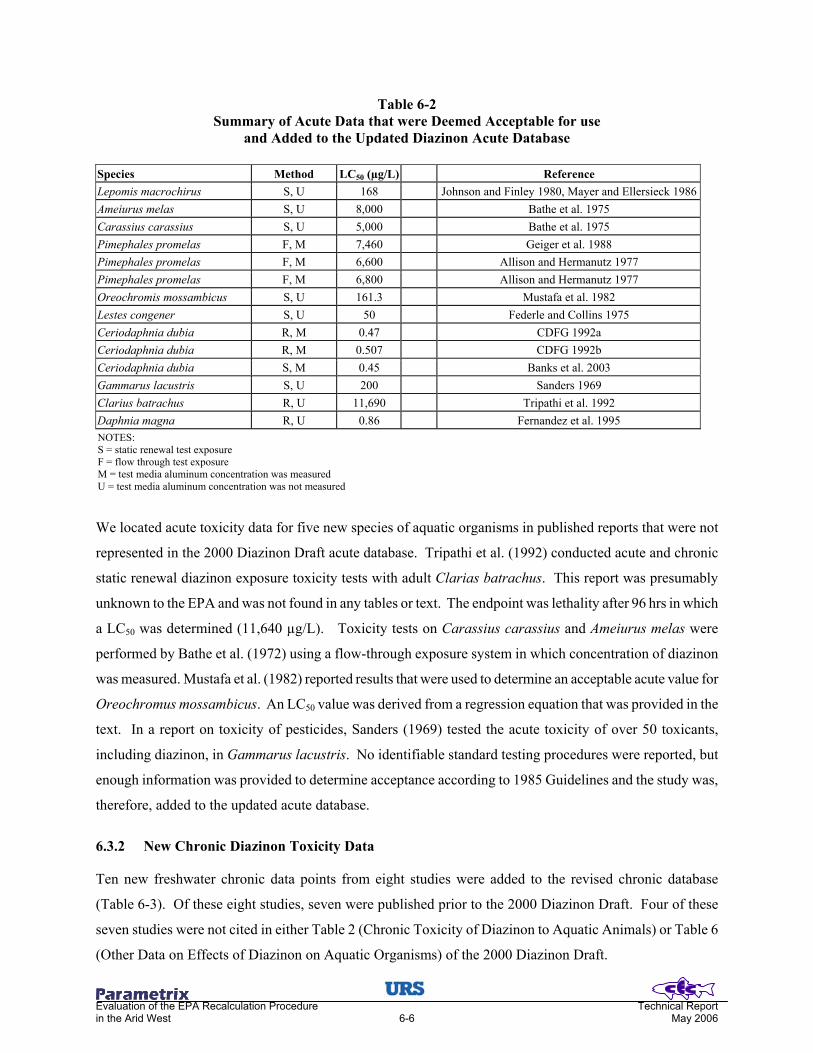
Evaluation of the EPA Recalculation Procedure Technical Report in the Arid West 6-6 May 2006
Table 6-2 Summary of Acute Data that were Deemed Acceptable for use
and Added to the Updated Diazinon Acute Database Species Method LC50 (µg/L) Reference Lepomis macrochirus S, U 168 Johnson and Finley 1980, Mayer and Ellersieck 1986Ameiurus melas S, U 8,000 Bathe et al. 1975 Carassius carassius S, U 5,000 Bathe et al. 1975 Pimephales promelas F, M 7,460 Geiger et al. 1988 Pimephales promelas F, M 6,600 Allison and Hermanutz 1977 Pimephales promelas F, M 6,800 Allison and Hermanutz 1977 Oreochromis mossambicus S, U 161.3 Mustafa et al. 1982 Lestes congener S, U 50 Federle and Collins 1975 Ceriodaphnia dubia R, M 0.47 CDFG 1992a Ceriodaphnia dubia R, M 0.507 CDFG 1992b Ceriodaphnia dubia S, M 0.45 Banks et al. 2003 Gammarus lacustris S, U 200 Sanders 1969 Clarius batrachus R, U 11,690 Tripathi et al. 1992 Daphnia magna R, U 0.86 Fernandez et al. 1995 NOTES: S = static renewal test exposure F = flow through test exposure M = test media aluminum concentration was measured U = test media aluminum concentration was not measured
We located acute toxicity data for five new species of aquatic organisms in published reports that were not
represented in the 2000 Diazinon Draft acute database. Tripathi et al. (1992) conducted acute and chronic
static renewal diazinon exposure toxicity tests with adult Clarias batrachus. This report was presumably
unknown to the EPA and was not found in any tables or text. The endpoint was lethality after 96 hrs in which
a LC50 was determined (11,640 µg/L). Toxicity tests on Carassius carassius and Ameiurus melas were
performed by Bathe et al. (1972) using a flow-through exposure system in which concentration of diazinon
was measured. Mustafa et al. (1982) reported results that were used to determine an acceptable acute value for
Oreochromus mossambicus. An LC50 value was derived from a regression equation that was provided in the
text. In a report on toxicity of pesticides, Sanders (1969) tested the acute toxicity of over 50 toxicants,
including diazinon, in Gammarus lacustris. No identifiable standard testing procedures were reported, but
enough information was provided to determine acceptance according to 1985 Guidelines and the study was,
therefore, added to the updated acute database.
6.3.2 New Chronic Diazinon Toxicity Data
Ten new freshwater chronic data points from eight studies were added to the revised chronic database
(Table 6-3). Of these eight studies, seven were published prior to the 2000 Diazinon Draft. Four of these
seven studies were not cited in either Table 2 (Chronic Toxicity of Diazinon to Aquatic Animals) or Table 6
(Other Data on Effects of Diazinon on Aquatic Organisms) of the 2000 Diazinon Draft.

Evaluation of the EPA Recalculation Procedure Technical Report in the Arid West 6-7 May 2006
Allison and Hermanutz (1977) conducted 96-hr acute and partial life-cycle chronic toxicity tests with
Salvelinus fontinalis and Pimephales promelas using technical grade diazinon. The EPA only presented the
results from the S. fontinalis test, whereas a suitable chronic value for P. promelas was also available. The
authors reported an incidence of scoliosis with P. promelas after 91 days of exposure and 50% mortality after
107 days of exposure in the 60.3 µg/L treatment (LOEC). The next lowest treatment without a response was
28.0 µg/L (NOEC), which results in a chronic value of 41.09 µg/L. The authors also reported 96-hr LC50s for
P. promelas (Table 6-2) that were added to the acute database and can be used in the final acute-chronic ratio
(FACR) calculation.
Table 6-3 Summary of Chronic Data that were Deemed Acceptable for use
and Added to the Updated Diazinon Chronic Database
Species Method End Point Chronic Value
(µg/L) Reference Pimephales promelas PLC S, R 41.09 Allison and Hermanutz 1977 Pimephales promelas PLC G 125 Suprenant 1988a Lepomis macrochirus PLC G 14.23 Giddings et al. 1996 Lepomis macrochirus PLC S 34.467 Giddings et al. 1996 Brachionus calyciflorus LC S, R 15,748 Snell and Moffat 1992 Daphnia magna PLC S <0.15 Fernandez et al. 1995 Daphnia magna PLC R 0.165 Fernandez et al. 1995 Daphnia magna PLC S, R <0.05 Sanchez et al. 2000 Daphnia magna PLC I 0.23 Suprenant 1988b Clarias batrachus PLC S 2,418.6 Tripathi et al. 1992 NOTES: PLC = partial life cycle test LC = life cycle test S = survival R = reproduction I = immobilization
Springborne Life Sciences (Suprenant 1988 a, b) performed 21- and 34-day flow-through toxicity tests using
D. magna and P. promelas, respectively. ASTM (1980) and EPA (1981) test standards were used to obtain
LOECs and NOECs for immobilization in D. magna and growth in P. promelas. The resulting chronic values
were added to the revised chronic database.
Giddings et al. (1996) performed a microcosm study in which Lepomis macrochirus were exposed to
measured concentrations of diazinon. Authors reported NOECs and LOECs for growth and survival.
Although microcosm studies could be questionable for use in the derivation of water quality standards, test
methods were well described and followed appropriate guidelines. Therefore, we determined that the values
were suitable for use in criteria derivation and added the two chronic values to the revised chronic database.
Evaluation of the EPA Recalculation Procedure Technical Report in the Arid West 6-8 May 2006
Snell and Moffat (1992) conducted a two-day life cycle test with the rotifer Brachionus calyciflorus.
Although test duration was very short, a full life cycle test was valid due to the short maturation and
generation times of this species. The values for survival and reproduction were similar and resulted in an
undefined chronic value of >15,748 µg/L.
Finally, acute and chronic toxicity of diazinon exposure in Claris batrachus was investigated by Tripathi
(1992). The author reported an LC50 for 96 hrs and 40days that are later used to derive an ACR for this
species. Test organisms consisted of adults, rather than an early life stage, which might explain the
insensitivity of C. batrachus to chronic and acute diazinon exposure. C. batrachus showed little sensitivity
to diazinon exposure with a chronic value of 2,419 µg/L for survival.
Fernandez et al. (1995) conducted a 21-day static renewal chronic toxicity test with D. magna. Adequate data
were generated to report a survival chronic value and an undefined reproduction chronic value. Acute toxicity
data (Table 6-2) were also provided by Fernandez et al. (1995), which are later used in the FACR
calculations. Sanchez et al. (2000) similarly tested 21-day survival and reproduction for D. magna.
6.4 PHASE III - REVISED AND UPDATED AWQC FOR DIAZINON
Utilizing data discovered and screened during phase II of this project, the diazinon acute and chronic
databases were updated and revised. These databases were then used to derive updated acute and chronic
freshwater WQC for diazinon.
6.4.1 Updated Acute Database
The revised and updated diazinon acute toxicity database contains data for 22 genera, including 12 species of
invertebrates and 14 species of fish (Table 6-4). These 26 species in 17 families satisfy the “eight-family
rule” as specified in the 1985 Guidelines.

Evaluation of the EPA Recalculation Procedure Technical Report in the Arid West 6-9 May 2006
Table 6-4 Updated Diazinon Species Mean Acute Values (SMAV) Calculated from the Revised and
Updated Acute Database and Ranked by Genus Mean Acute Values (GMAV)
Rank Species Common Name GMAV (µg/L) SMAV (µg/L) 22 Clarias batrachus Walking catfish 14,792 14,792 21 Gyraulus altilis Snail 11,000 11,000 20 Ameiurus melas Black bullhead 8,000 8,000 19 Lumbriculus variegatus Worm 7,841 7,841 18 Brachydanio rerio Zebrafish 7,644 7,644 17 Carassius auratus Goldfish 6,708 9,000 Carassius carassius Crucian carp 5,000
16 Pimephales promelas Fathead minnow 6,475 6,475 15 Physa paludosa Snail 3,198 3,198 14 Girardia tigrina Planaria 2,708 2,708 13 Jordanella floridea Flagfish 1,643 1,643 12 Poecilia reticulate Guppy 732 732 11 Salvelinus fontinalis Brook trout 660 723 Salvelinus namaycush Lake trout 602
10 Oncorhynchus clarki Cuttthroat trout 455 2,166* Oncorhynchus mykiss Rainbow trout 455 9 Oreochromis mossambicus Tilapia 161 161 8 Lepomis macrochirus Bluegill 116 116 7 Lestes congener Damselfly 50 50 6 Chironomus tentans Midge 30 30 5 Pteronarcys californicus Stonefly 25 25 4 Simocephalus serrulatus Cladoceran 1.70 1.70 3 Daphnia magna Cladoceran 0.93 1.05 Daphnia pulex Cladoceran 0.82 2 Ceriodaphnia dubia Cladoceran 0.40 0.40 Gammarus lacustris Amphipod 200* 1 Gammarus fasciatus Amphipod 0.20 0.20
NOTE: * = Not used in FAV calculation (see text).
During the literature review, we discovered a discrepancy in toxicity between the two species representing the
genus Gammarus. The discrepancy was found when the species mean acute value (SMAVs) for G. lacustris,
derived from a single static unmeasured toxicity test using technical grade diazinon (Sanders 1969), was
compared to the SMAV for G. fasciatus. The Sanders (1969) value was 1,000-fold greater than the SMAV
for G. fasciatus (0.20 µg/L, Table 6-4) from Johnson and Finley (1980). If both species are used in the
updated genus mean acute value (GMAV) calculation for Gammarus by taking the geometric mean of the two
SMAVs, the result would be a change in rank from 1 to 4, and the final acute value (FAV) would increase
two-fold. It is difficult to assign more significance to one SMAV or the other. Both SMAVs were derived
from tests using static, unmeasured exposures; and from the discussion of diazinon degradation earlier, one
could expect some discrepancy in actual test concentrations after a 96-hr exposure. Since test treatments were
similar, we investigated data from other closely related species. The closest species available for comparison

Evaluation of the EPA Recalculation Procedure Technical Report in the Arid West 6-10 May 2006
was toxicity data from another amphipod, Hyalella azteca (Ankley and Collyard 1995). Although the data for
this species were deemed inappropriate for criteria derivation, the GMAV for Hyalella (6.32 µg/L) is very
close to the geometric mean of G. lacustris and G. fasciatus (6.51 µg/L). This similarity of GMAVs for
Hyalella and Gammarus provides some evidence that the true value likely lies somewhere between the
reported values for G. lacustris and G. fasciatus. Despite the discrepancy in toxicity between Gammarus
species, EPA methodology was followed and only the most sensitive species was used to derive the updated
GMAV for Gammarus.
Our updated acute national database contained a wide range of toxicity values for O. mykiss (90 to
3,200 µg/L) (Appendix 2). Further investigation into test methods used to derive these values uncovered a
potential life stage-diazinon toxicity relationship. The greatest toxicity value reported by Bathe et al. (1975)
was for large (25 to 50 g) fish, which were considerabley larger than reported fish weights from other studies.
Because of this apparent life stage sensitivity observation we feel that it was necessary to drop the 3,200 µg/L
value from the O. mykiss SMAV derivation. Additionally, due to the great difference between O. mykiss and
O. clarki SMAVs (455 vs. 2,166 µg/L), we set the Oncorhynchus GMAV to the most sensitive species.
A possible relationship between two water quality parameters (hardness and pH) and acute diazinon toxicity
was investigated using the updated acute database. Considering the physical and chemical properties of
diazinon and degradation kinetics briefly discussed earlier, an equation-based diazinon AWQC with either
hardness or pH is plausible. Water hardness is often influential in metal toxicity to aquatic organisms;
however, no such relationship could be determined with the updated diazinon database, even with a
moderately robust range of hardness values. Test water pH similarly resulted in little to no statistical
relationship with acute diazinon toxicity. The lack of a relationship with pH may be the result of the limited
number of tests reporting pH and the limited range of values tested. The range of pH values is 7.25 to 8.35
among all species in the database.
6.4.2 Updated Chronic Database
The revised and updated diazinon chronic toxicity database presents data for nine genera of freshwater
organisms, including three species of invertebrates and six species of fish (Table 6-5). Although a substantial
addition has been made to the chronic database, it still does not satisfy the “eight-family rule” requirement as
defined by the 1985 Guidelines and is plagued by undefined values. The chronic criterion should, therefore,
be derived via an ACR.

Evaluation of the EPA Recalculation Procedure Technical Report in the Arid West 6-11 May 2006
Table 6-5 Recalculated Species Mean Chronic Values (SMCV) using the Updated and
Revised Chronic Database and Ranked Genus Mean Chronic Values (GMAV)
Rank Species Common Name GMCV (µg/L)
SMCV (µg/L)
9 Brachionus calyciflorus Rotifer 15,748 15,748 8 Clarias batrachus Walking catfish 2,419 2,419 7 Brachydanio rerio Zebrafish >200 >200 6 Pimephales promelas Fathead minnow 54 54 5 Lepomis macrochirus Bluegill 14 14 4 Jordanella floridae Flagfish <14 <14 3 Salvelinus fontinalis Brook trout <0.80 <0.8 2 Ceriodaphnia dubia Cladoceran 0.34 0.34 1 Daphnia magna Cladoceran <0.12 <0.12
Updating the final acute-chronic ratio (FACR) was evaluated using paired acute and chronic values from the
revised and updated databases. Undefined (i.e., greater or less than) values are generally not used in an ACR
calculation; however, we included these values in our evaluation to at least establish the potential range of
ACRs for the existing database. Defined species mean acute-to-chronic ratios (SMACRs) could be calculated
for three taxa, including P. promelas, Clarias batrachus, and Ceriodaphnia dubia (Table 6-6). SMACRs
ranged from 1.1118 to 194.09, with no apparent trend between SMACRs and SMAVs. Therefore, the
existing ACRs do not comply with 1985 Guidelines for an FACR calculation. Because of this, it was
necessary to default to an ACR of 2, as was done in the 2000 Diazinon Draft.
Table 6-6 Updated Diazinon Species Mean Acute-to-Chronic Ratios (SMACR)
and Species Mean Acute Values (SMAV)
Species Common Name Acute Value (µg/L)
Chronic Value (µg/L)
ACR SMACR SMAV (µg/L)
Pimephales promelas Fathead minnow 7,800 41 189.8272 Pimephales promelas Fathead minnow 6,900 67 102.8623 Pimephales promelas Fathead minnow 9,350 25 374.4493 194.09 6,576 Jordanella floridae Flagfish 1,643 <14 117.3571 >117.36 1,643 Salvelinus fontinalis Brook trout 723 <0.8 903.7500 >903.75 723 Clarias batrachus Walking catfish 14,792 24.19 6.1158 6.1158 14,792 Daphnia magna Cladoceran 0.86 <0.15 5.7333 >5.7333 1.05 Ceriodaphnia dubia Cladoceran 0.38 0.34 1.1118 1.1118 0.40 NOTE: SMACR = geometric mean of individual ACRs for a particular species.
6.4.3 Updated Criteria Derivation for Diazinon
The updated diazinon acute criteria were then calculated using the GMAVs for the four most sensitive genera
(Simocephalus, Daphnia, Ceriodaphnia, and Gammarus). The resulting FAV of 0.22 µg/L is slightly greater
than the existing FAV of 0.19 µg/L. This increase was due to a slight increase in GMAVs for three of the

Evaluation of the EPA Recalculation Procedure Technical Report in the Arid West 6-12 May 2006
four most sensitive organisms and an increase in the degrees of freedom associated with new genera
(Table 6-7). Uncertainty exists in the true value of the most sensitive species whose acute value is
unsupported by toxicity testing using similar organisms in the same (Gammarus) or very similar genus
(Hyalella). Although mechanistically feasible, no significant water quality toxicity relationships were
discovered with diazinon toxicity using the updated diazinon databases. The resulting updated acute criterion
for diazinon is 0.11 µg/L.
Table 6-7 Recalculation of the Final Acute and Chronic Values for Diazinon using the Revised Acute and Chronic Databases
Rank Genus GMAV ln GMAV (ln GMAV)^2 P = R/(N+1) %P 4 Simocephalus 1.6979 0.5294 0.2803 0.1739 0.4170 3 Daphnia 0.9043 -0.1006 0.0101 0.1304 0.3612 2 Ceriodaphnia 0.4023 -0.9104 0.8289 0.0870 0.2949 1 Gammarus 0.2000 -60949 2.5903 0.0435 0.2085
sum -2.0911 3.7096 0.4348 1.2816 NOTES: N = 22 genera and R = sensitivity rank in database. Calculations:
Acute Criterion
S2 =∋ (lnGMAV)2 - (∋lnGMAV)2/4 = 3.7096 - -2.0911)2&4 = 108.262 S = 10.4049 ΣΡ – (√Ρ)²/4 0.4348 - (1.2816)2&4
L = [∋lnGMAV - S(∋%P)]/4 = [-2.0911 - 10.4049 (1.2816)]&4 = -3.8564 A = S (%0.05) + L = (10.4049)(0.2236) - 3.8564 = -1.5298 Final Acute Value = FAV = e A = 0.2166 µg/L CMC = ½ FAV = 0.1083
---------------------------------------------------------------------------------------------------------------------
Chronic Criterion
Defaulted Acute-Chronic ratio (FACR) = 2 Final Chronic Value (FCV) = FAV ) ACR = 0.217 ) 2 = 0.108 µg/L
The updated chronic criterion of 0.11 µg/L is equal to the acute criterion, since the FACR and acute criterion
divison factor to calculate an LC-low are both equal to 2. Generally, one would expect the chronic criterion
to be less than the acute; yet due to diazinon behavior, mechanisms of toxicity, organism excretion, and
exposure patterns in aquatic environments, these results are not surprising and should be appropriate for the
protection of aquatic life. Diazinon is inherently unstable in the aquatic environment, resulting in a short half-
life and, therefore, relatively rapid elimination. Furthermore, vertebrates efficiently metabolize diazinon to
less toxic forms, which additionally reduces exposure duration. Lastly, since the exposure of diazinon to
aquatic life is generally patchy and not continual, acute exposure likely poses the greatest threat to aquatic

Evaluation of the EPA Recalculation Procedure Technical Report in the Arid West 6-13 May 2006
communities. Until additional chronic toxicity tests present the need for further chronic protection with a
lower criterion, we support use of the acute criterion of 0.11 µg/L.
6.5 LITERATURE CITED
Aldridge, W.N., and E. Reiner. 1972. Enzyme Inhibitors as Substrates. North Holland/America Elsevier, Amsterdam and New York.
Allison, D.T., and R.O. Hermanutz. 1977. Toxicity of Diazinon to Brook Trout and Fathead Minnows.
PB-269/293 or EPA-600/77-060. National Technical Information Service, Springfield, Virginia. Ankley, G.T., and S.A. Collard. 1995. Influence of piperonyl butoxide on the toxicity of organophosphate
insecticides to three species of freshwater benthic invertebrates. Comparative Biochemistry and Physiology C Pharmacology Toxicology & Endocrinology 110(2):149-155.
ASTM. 1980. Standard Practice for Conducting Acute Toxicity Tests with Fishes, Macroinvertebrates, and
Amphibians. E729-80. ASTM, Philadelphia, Pennsylvania. Bailey, H.C., J.L. Miller, M.J. Miller, L.C. Wiborg, L. Deanovic, and T. Shed. 1997. Joint acute toxicity of
diazinon and chlorpyrifos to Ceriodaphnia dubia. Environmental Toxicology and Chemistry 16(11)2304-2308.
Banks, K.E., S.H. Wood, L. Mathews, and K.A. Thuesen. 2003. Joint acute toxicity of diazinon and copper
to Ceriodaphnia dubia. Environmental Toxicology and Chemistry 22:1562-1567. Bathe, R., K. Sachsse, L. Ullmann, W.D. Hermann, F. Zak, and R. Hess. 1975. The evaluation of fish
toxicity in the laboratory. Procedures of the European Society of Toxicology 16:113-124. Beauvais, S.L., S.B. Jones, S.K. Brewer, and E.E. Little. 2000. Physiological measures of neurotoxicity of
diazinon and malathion to larval rainbow trout (Oncorhynchus mykiss) and their correlation with hebaviorial measures. Environmental Toxicology and Chemistry 19(7):187-1880.
Belden, J.B., and M.J. Lydy. 2000. Impact of atrazine on organophosphate insecticide toxicity.
Environmental Toxicology and Chemistry 19:2266-2274. California Department of Fish and Game. 1992a. Test 157. Aquatic Toxicology Laboratory, Elk Grove,
California. California Department of Fish and Game. 1992b. Test 163. Aquatic Toxicology Laboratory, Elk Grove,
California. Collyard, S.A., G.T. Ankley, R.A. Hoke, and T. Goldenstein. 1994. Influence of age on the relative
sensitivity of Hyalella azteca to diazinon, alkylphenol ethoxylates, copper, cadmium, and zinc. Archives of Environmental Contamination and Toxicology 26(1):110-113.
Cope, O.B. 1965a. Contamination of the freshwater ecosystem by pesticides. Journal of Applied Ecology
3(supplement):33-44. Cope, O.B. 1965b. Sport Fishery Investigations. Circular No. 226:51-63. U.S. Fish and Wildlife Service.

Evaluation of the EPA Recalculation Procedure Technical Report in the Arid West 6-14 May 2006
Faust, S.D., and H.M. Gomaa. 1972. Chemical hydrolysis of some organic phosphorus and carbamate pesticides in aquatic environments. Environmental Letters 3:171-201.
Federle, P.F., and W.J. Collins. 1975. Insecticide toxicity to three insects from Ohio ponds. Ohio Journal of
Science 76(1):19-24. Fernandez-Casalderrey, A., M.D. Ferrando, and E. Andreu-Moline. 1995. Chronic toxicity of diazinon to
Daphnia magna: effects on survival, reproduction and growth. Toxicology and Environmental Chemistry 49:25-32.
Ferrando, M.D., E. Sancho, and E. Andreu-Moliner. 1991. Comparative acute toxicities of selected
pesticides to Anguilla anguilla. Journal of Environmental Science and Health 26B:491-498. Giddings, J.M., R.C. Biever, M.E. Annuziato, and A.J. Hosmer. 1996. Effects of diazinon on large outdoor
pond microcosms. Environmental Toxicology and Chemistry 15(5)618-629. Geiger, D.L., D.J. Call, and L.T. Brooke (eds.). 1988. Acute Toxicities of Organic Chemicals to Fathead
Minnows (Pimephales promelas), Vol. 4. Center for Lake Superior Environmental Studies, University of Wisconsin-Superior Press, Superior, Wisconsin.
Harris, M.I., C.A. Bishop, J. Struger, B. Ripley, and J.P. Bogart. 1998. The functional integrity of northern
leopard frog (Rana pipiens) and green frog (Rana clamitans) populations in orchard wetlands. II. Effects of pesticides and eutrophic conditions on early life stage development. Environmental Toxicology and Chemistry 17(7):1351-63.
Hoffman, R.S., P.D. Capel, and S.J. Larson. 2000. Comparison of pesticides in eight U.S. urban streams.
Environmental Toxicology and Chemistry 19(9):2249-2258. Johnson, W.W., and M.T. Finley. 1980. Handbook of Acute Toxicity of Chemicals to Fish and Aquatic
Invertebrates. Resource Publication 137. U.S. Fish and Wildlife Service, Washington, DC. Kanazawa, J. 1975. Uptake and excretion of organophosphorus and carbamate insecticides by fresh water
fish, Motsugo, Pseudorasbora parva. Bulletin of Environmental Contamination and Toxicology 14:346-352.
Keizer, J., G. D’agostino, and L. Vittozzi. 1991. The importance of biotransformation in the toxicity of
xenobiotics to fish: I. toxicity and bioaccumulation of diazinon in guppy (Poecilia reticulata) and zebra fish (Brachydanio rerio). Aquatic Toxicology (Amst) 21(3-4):239-254.
Keizer, J., G. D’Agostino, R. Nagel, F. Gramenzi, and L. Vittozzi. 1993. Comparative diazinon toxicity in
guppy and zebra fish: different role of oxidative metabolism. Environmental Toxicology and Chemistry 12(7):1243-1250.
Klaassen, C.D. 2001. Casarett and Doull’s Toxicology, The Basic Science of Poisons, 6th Edition. McGraw-
Hill Medical Publishing Division, New York. Kolpin, D.W., E.T. Furlong, M.T. Meyer, E.M. Thurman, S.D. Zaugg, L.B. Barber, and H.T. Buxton. 2002.
Pharmaceuticals, hormones, and other organic wastewater contaminants in U.S. streams, 1999-2000: A national reconnaissance. Environmental Toxicology and Chemistry 36(6):1202-1211.

Evaluation of the EPA Recalculation Procedure Technical Report in the Arid West 6-15 May 2006
Martinez-Toledo, M.V., V. Salmeron, and J. Gonzalez-Lopez. 1993. Effects of diazinon and quinalphos on some functional groups of soil microflora. Environmental Toxicology and Chemistry 37:165-172.
Mayer, F.L., Jr., and M.R. Ellersieck. 1986. Manual of Acute Toxicity: Interpretation and Data Base for
410 Chemicals and 66 Species of Freshwater Animals. Resource Publication No. 160. U.S. Fish and Wildlife Service, Washington, DC.
Medina, D., A. Prieto, G. Ettiene, I. Buscema, and A. Abreu de V. 1999. Persistence of organophosphorus
pesticide residues in Limon River waters. Bulletin of Environmental Contamination and Toxicology 63:39-44.
Mustafa, M., F. Anjum, and S.S.H. Qadri. 1982. A technique to evaluate acute toxicity of insecticide
(technical and formulation) to fresh-water fish, Tilapia mossambica. International Pest Control 24:90-92.
Sanchez, M., M.D. Ferrando, E. Sancho, and E. Andreu. 2000. Physiological perturbations in several
generations of Daphnia magna straus exposed to diazinon. Ecotoxicology and Environmental Safety 46:87-94.
Sanders, H.O., and O.B. Cope. 1966. Toxicities of several pesticides to two species of cladoceran.
Transactions of the American Fisheries Society 95:165-169. Sanders, H.O. 1969. Toxicity of Pesticides to the Crustacean Gammarus lacustris. Tech. Paper No. 25.
U.S. Fish and Wildlife Service, Washington, DC. Schoen, S.R., and W.L. Winterlin. 1987. The effects of various soil factors and amendments on the
degradation of pesticide mixture. Journal of Environmental Science and Technology 25:155-160. Snell, T.W., and B.D. Moffat. 1995. A 2-d life cycle test with the rotifer Brachionus calyciflorus.
Environmental Toxicology and Chemistry 11:1249-1257. Stephan, C.E., D.I. Mount, D.J. Hansen, J.H. Gentile, G.A. Chapman, and W.A. Brungs. 1985. Guidelines
for Deriving Numerical National Water Quality Criteria for the Protection of Aquatic Organisms and Their Uses. PB-85-227049. U.S. Environmental Protection Agency, Office of Research and Development, Duluth, Minnesota.
Suprenant, D.C. 1988a. The Toxicity of Diazinon Technical to Fathead Minnow Pimephales promelas
Embryo and Larvae. Giba-Geigy Report 88-5-2702. Suprenant, D.C. 1988b. Chronic Toxicity of 14C-Diazinon Technical to Daphnia magna Under Flow-
Through Conditions. Ciba Geigy Report 1781-0987-6150-130. Tripathi, G. 1992. Relative toxicity of aldrin, fenualerate, captan and diazinon to the freshwater food fish,
Clarias batrachus. Biomedical and Environmental Science 5:33-38. Tsuda, T., S. Aoki, M. Kajima, and H. Harada. 1990. bioconcentration and excretion of diazinon, IBP,
malathion and fenitrothion by carp. Comparative Biochemistry and Physiology 96C:23-26. U.S. Environmental Protection Agency/ACE. 1981. Procedures for Handling and Chemical Analysis of
Sediment and Water Samples. Technical Report EPA/CE-81-1. U.S. Army Engineer Waterways Experiment Station, Environmental Laboratory, Vicksburg, Mississippi.

Evaluation of the EPA Recalculation Procedure Technical Report in the Arid West 6-16 May 2006
U.S. Environmental Protection Agency. 2000. Draft Ambient Aquatic Life Water Quality Criteria Diazinon. CAS Registry No. 333-41-5. Office of Water, Washington, DC.
Villar, D., M. Gonzalez, M.J. Gualda, and D.J. Schaeffer. 1994. Effects of organophosphorus insecticides on
Dugesia tigrina: cholinesterase activity and head regeneration. Bulletin of Environmental Contamination and Toxicology 52(2):319-324.
Werner, I., F.G. Zalom, M.N. Oliver, L.A. Deanovic, T.S. Kimball, J.D. Henderson, B.W. Wilson, W.
Krieger, and W.W. Wallender. 2004. Toxicity of storm-water runoff after dormant spray application in a French prune orchard, Glenn County, California, USA: temporal patterns and the effect of ground covers. Environmental Toxicology and Chemistry 23(11):2719-26
World Health Organization. 1998. Environmental Health Criteria, 198 - Diazinon. International Programme
on Chemical Safety, World Health Organization, Geneva. 140 pp.

Evaluation of the EPA Recalculation Procedure Technical Report in the Arid West 7-1 May 2006
7.0 ZINC CRITERIA REVIEW AND UPDATE
7.1 PHASE I - TECHNICAL REVIEW OF EPA AWQC DOCUMENTS FOR ZINC
The “1995 Updates” (EPA 1996) presents the most up-to-date national AWQC database for zinc. The acute
database contains toxicity values for 36 genera of freshwater biota, including 21 species of invertebrates, 22
species of fish, and one frog species. These 44 species satisfy the “eight-family rule” as specified in the 1985
Guidelines (Stephen et al. 1985). Additionally, the 1987 zinc AWQC document (EPA 1987) presents chronic
data for seven genera of freshwater organisms, including two invertebrates and seven species of fishes (the
“1995 Updates” did not provide any new chronic data). These nine species do not satisfy the “eight-family
rule;” therefore, chronic criteria were derived via a final acute-chronic ratio (FACR). Both acute and chronic
criteria area modified with respect to water hardness with a slope of 0.8473. Overall, the databases used to
derive current zinc criteria comply with toxicity test restrictions established in the 1985 Guidelines and
criteria were derived appropriately. No corrections were made to the existing acute and chronic databases.
7.2 PHASE II - UPDATE TO THE NATIONAL ZINC TOXICITY DATABASES
7.2.1 New Acute Zinc Toxicity Data
Approximately 90 papers containing at least some zinc toxicity information were located and reviewed as
potential sources of data to be added to the updated zinc databases. From this search, over 120 data points
from 35 sources were added to an updated acute database (Table 7-1). This included a number of studies
conducted by the Colorado Department of Wildlife (CDOW) published as gray literature (i.e., Federal Aid to
Fisheries reports) and recent laboratory toxicity testing with Colorado native aquatic insects conducted by
CEC on behalf of Climax Molybdenum Company (CEC 2005).
Many of the data points added to the database provided new toxicity data for sensitive species not previously
in the database and additional data for the top four most sensitive genera. Given the number of toxicity values
added to the database, we will not discuss each study added, but only comment on those which influenced the
GMAVs used in criteria derivation.

Evaluation of the EPA Recalculation Procedure Technical Report in the Arid West 7-2 May 2006
Table 7-1 New Acute Zinc Data Added to the National Database
Species Common Name Method Hardness(CaCO3 mg/L)
LC50 (µg/L) Reference
Oncorhynchus mykiss Rainbow trout F, M 350 4,520 Goettl et al. 1972 Oncorhynchus mykiss Rainbow trout F, M 350 1,190 Goettl et al. 1972 Oncorhynchus mykiss Rainbow trout F, M 30 560 Goettl et al. 1972 Oncorhynchus mykiss Rainbow trout F, M 30 240 Goettl et al. 1972 Oncorhynchus mykiss Rainbow trout F, M 38 105 Davies 1980 Oncorhynchus mykiss Rainbow trout F, M 38 186 Davies 1980 Oncorhynchus mykiss Rainbow trout F, D 33.2 125 Brinkman and Hansen 2004 Oncorhynchus mykiss Rainbow trout F, D 145.4 588 Brinkman and Hansen 2004 Oncorhynchus clarkii Cutthroat trout F, D 31.1 140 Brinkman and Hansen 2004 Oncorhynchus clarkii Cutthroat trout F, D 149.4 1,645 Brinkman and Hansen 2004 Salmo trutta (wild) Brown trout (wild) F, M 37.6 642 Davies and Brinkman 1994 Salmo trutta Brown trout F, M 42.3 476 Davies et al. 2000 Salmo trutta Brown trout F, M 52.6 484 Davies et al. 2000 Salmo trutta Brown trout F, M 52.6 603 Davies et al. 2000 Salmo trutta Brown Trout F, M 206.7 2,267 Davies and Brinkman 1999 (alk = 37.5) Salmo trutta Brown Trout F, M 54.4 1,033 Davies and Brinkman 1999 (alk = 37.4) Salmo trutta Brown Trout F, M 54.0 690 Davies and Brinkman, 1999 (alk = 139.6) Salmo trutta Brown Trout F, M 207.2 >2,660 Davies and Brinkman 1999 (alk = 141.4) Salvelinus fontinalis Brook trout F, M 52.6 738 Davies et al. 2000 Salvelinus fontinalis Brook trout F, M 52.6 1,178 Davies et al. 2000 Thymallus arcticus Arctic grayling (0.34g) S, U 41.3 112 Buhl and Hamilton 1990 Thymallus arcticus Arctic grayling (0.2g) S, U 41.3 142 Buhl and Hamilton 1990 Thymallus arcticus Arctic grayling (0.85g) S, U 41.3 166 Buhl and Hamilton 1990 Thymallus arcticus Arctic grayling (0.97g) S, U 41.3 168 Buhl and Hamilton 1990 Thymallus arcticus Arctic grayling (1.85g) S, U 41.3 168 Buhl and Hamilton 1990 Thymallus arcticus Arctic grayling (fry) S, U 41.3 315 Buhl and Hamilton 1990 Thymallus arcticus Arctic grayling (alevin) S, U 41.3 1,580 Buhl and Hamilton 1990 Thymallus arcticus Arctic grayling (alevin) S, U 41.3 2,920 Buhl and Hamilton 1990 Cottus bairdii Mottled sculpin F, M 48.6 156 Woodling et al. 2002 Cottus bairdii Mottled sculpin F, M 154 439 Brinkman and Woodling 2005 Cottus bairdii Mottled sculpin F, M 156 590 Brinkman and Woodling 2005 Catostomus latipinnis Flannelmouth sucker 144 1,480 Hamilton and Buhl 1997a
Ptychocheilus lucius Colorado pikeminnow (larvae) S, U 199 3,340 Buhl and Hamilton 1996
Ptychocheilus lucius Colorado pikeminnow (juvenile) S, U 199 8,620 Buhl and Hamilton 1996
Gila elegans Bonytail (larvae) S, U 199 5,350 Buhl and Hamilton 1996 Gila elegans Bonytail (larvae) S, U 199 8,010 Buhl and Hamilton 1996 Xyrauchen texanus Razorback sucker (larvae) S, U 199 4,100 Buhl and Hamilton 1996 Xyrauchen texanus Razorback sucker (juvenile) S, U 199 2,920 Buhl and Hamilton 1996
Xyrauchen texanus Razorback sucker (larvae) S, U 144 9,800 Hamilton and Buhl 1997b
Gambusia affinis (fry) Mosquitofish S, U 50 50,000 Kallanagoudar and Patil 1997 Gambusia affinis (fry) Mosquitofish S, U 150 80,000 Kallanagoudar and Patil 1997 Gambusia affinis (fry) Mosquitofish S, U 300 100,000 Kallanagoudar and Patil 1997

Evaluation of the EPA Recalculation Procedure Technical Report in the Arid West 7-3 May 2006
Table 7-1 (Continued) New Acute Zinc Data Added to the National Database
Species Common Name Method Hardness(CaCO3 mg/L)
LC50 (µg/L) Reference
Gambusia affinis (male) Mosquitofish S, U 50 115,000 Kallanagoudar and Patil 1997 Gambusia affinis (male) Mosquitofish S, U 150 140,000 Kallanagoudar and Patil 1997 Gambusia affinis (male) Mosquitofish S, U 300 150,000 Kallanagoudar and Patil 1997 Gambusia affinis (female) Mosquitofish S, U 50 90,000 Kallanagoudar and Patil 1997 Gambusia affinis (female) Mosquitofish S, U 150 120,000 Kallanagoudar and Patil 1997 Gambusia affinis (female) Mosquitofish S, U 300 140,000 Kallanagoudar and Patil 1997 Lepomis macrochirus Bluegill F, M NR 3,200 Thompson et al. 1980 Lepomis macrochirus Bluegill F, M, T 40.2 3,600 Thompson et al. 1980 Lepomis macrochirus Bluegill F, M, T 40.2 3,000 Thompson et al. 1980 Aeolosoma headleyi Worm -- 45 18,100 Cairns, Jr., et al. 1978 Aeolosoma headleyi Worm -- 45 17,600 Cairns, Jr., et al. 1978 Aeolosoma headleyi Worm -- 45 15,600 Cairns, Jr., et al. 1978 Aeolosoma headleyi Worm -- 45 15,000 Cairns, Jr., et al. 1978 Aeolosoma headleyi Worm -- 45 13,500 Cairns, Jr., et al. 1978 Tubifex tubifex Worm -- 224 130,000 Qureshi et al. 1980b Tubifex tubifex Worm -- 34.2 2,570 Brkovic-Popovic & Popovic 1977Tubifex tubifex Worm -- 261 60,200 Brkovic-Popovic & Popovic 1977Tubifex tubifex Worm -- 0.1 110 Brkovic-Popovic & Popovic 1977Tubifex tubifex Worm -- 34.2 2,980 Brkovic-Popovic & Popovic 1977Tubifex tubifex Worm R, U 245 17,780 Khangarot 1991 Anodonta imbecilis FW mussel S, M, T 39 268 Keller and Zam 1991 Anodonta imbecilis FW mussel S, M, T 90 438 Keller and Zam 1991 Bryocamptus zschokkei (nauplius) Copepod S, M, T 100 920 Brown et al. 2005
Bryocamptus zschokkei (copepodid) Copepod S, M, T 100 620 Brown et al. 2005
Bryocamptus zschokkei (adult) Copepod S, M, T 100 2,070 Brown et al. 2005
Heliodiaptomus viduus Copepod 37.6 500 Sharma and Selverai 1994 Mesocyclops hyalinus Copepod 37.6 3,800 Sharma and Selverai 1994 Tropocyclops prasinus Copepod S, U 10 52 Lelande and Pinel-Alloul 1985 Asellus aquaticus Isopod S, U 50 18,200 Martin and Holdich 1986 Echinogammarus tibaldii Amphipod 240 25,900 Pantani et al. 1997 Gammarus italicus Amphipod 240 8,800 Pantani et al. 1997 Hyalella azteca Amphipod 100 436 Eisenhauer et al. 1999 Ceriodaphnia dubia Cladoceran S, M 44 413 Hyne et al. 2005 (pH = 6.5) Ceriodaphnia dubia Cladoceran S, M, D 44 200 Hyne et al. 2005 (pH = 7.5) Ceriodaphnia dubia Cladoceran S, M, D 44 60 Hyne et al. 2005 (pH = 6.5, DOC = 1.0) Ceriodaphnia dubia Cladoceran S, M, D 44 58 Hyne et al. 2005 (pH = 6.5, DOC = 0.1) Ceriodaphnia dubia Cladoceran S, M, D 44 155 Hyne et al. 2005 (pH = 7.5, Alk = 30) Ceriodaphnia dubia Cladoceran S, M, D 374 390 Hyne et al. 2005 (pH = 7.5, Alk = 30) Ceriodaphnia dubia Cladoceran S, M, D 44 70 Hyne et al. 2005 (pH = 8.4, Alk = 125) Ceriodaphnia dubia Cladoceran S, M, D 374 160 Hyne et al. 2005 (pH = 8.4)
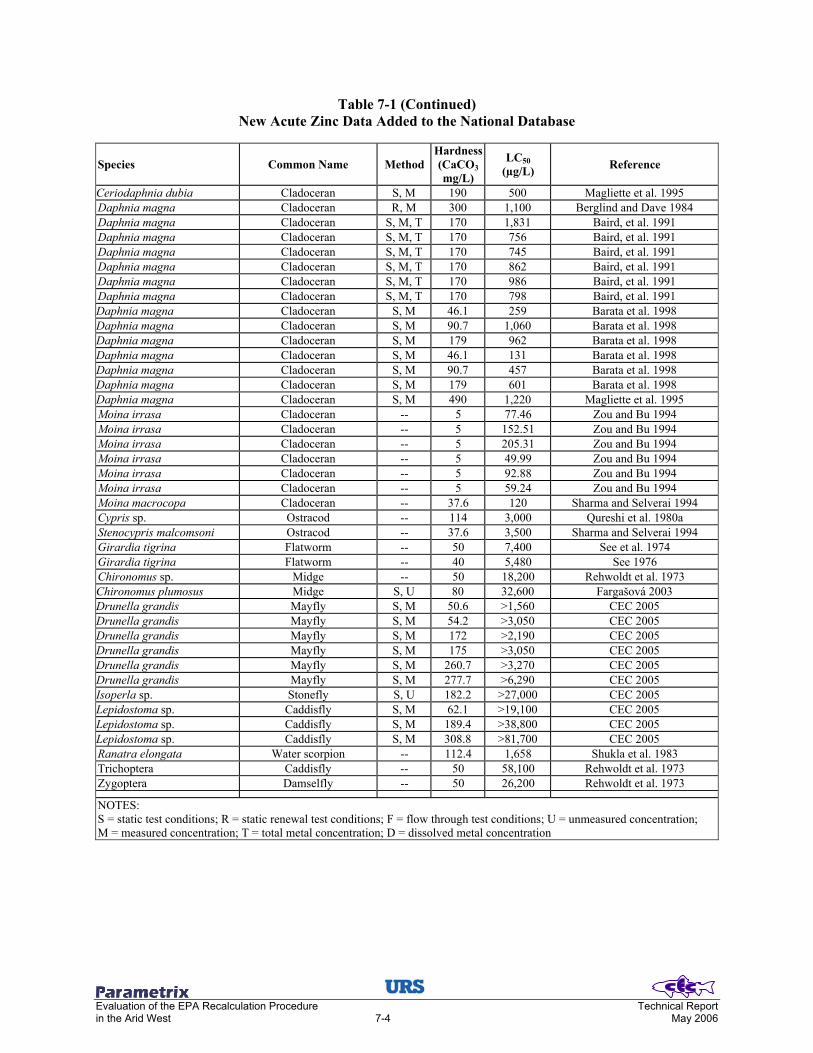
Evaluation of the EPA Recalculation Procedure Technical Report in the Arid West 7-4 May 2006
Table 7-1 (Continued) New Acute Zinc Data Added to the National Database
Species Common Name Method Hardness(CaCO3 mg/L)
LC50 (µg/L) Reference
Ceriodaphnia dubia Cladoceran S, M 190 500 Magliette et al. 1995 Daphnia magna Cladoceran R, M 300 1,100 Berglind and Dave 1984 Daphnia magna Cladoceran S, M, T 170 1,831 Baird, et al. 1991 Daphnia magna Cladoceran S, M, T 170 756 Baird, et al. 1991 Daphnia magna Cladoceran S, M, T 170 745 Baird, et al. 1991 Daphnia magna Cladoceran S, M, T 170 862 Baird, et al. 1991 Daphnia magna Cladoceran S, M, T 170 986 Baird, et al. 1991 Daphnia magna Cladoceran S, M, T 170 798 Baird, et al. 1991 Daphnia magna Cladoceran S, M 46.1 259 Barata et al. 1998 Daphnia magna Cladoceran S, M 90.7 1,060 Barata et al. 1998 Daphnia magna Cladoceran S, M 179 962 Barata et al. 1998 Daphnia magna Cladoceran S, M 46.1 131 Barata et al. 1998 Daphnia magna Cladoceran S, M 90.7 457 Barata et al. 1998 Daphnia magna Cladoceran S, M 179 601 Barata et al. 1998 Daphnia magna Cladoceran S, M 490 1,220 Magliette et al. 1995 Moina irrasa Cladoceran -- 5 77.46 Zou and Bu 1994 Moina irrasa Cladoceran -- 5 152.51 Zou and Bu 1994 Moina irrasa Cladoceran -- 5 205.31 Zou and Bu 1994 Moina irrasa Cladoceran -- 5 49.99 Zou and Bu 1994 Moina irrasa Cladoceran -- 5 92.88 Zou and Bu 1994 Moina irrasa Cladoceran -- 5 59.24 Zou and Bu 1994 Moina macrocopa Cladoceran -- 37.6 120 Sharma and Selverai 1994 Cypris sp. Ostracod -- 114 3,000 Qureshi et al. 1980a Stenocypris malcomsoni Ostracod -- 37.6 3,500 Sharma and Selverai 1994 Girardia tigrina Flatworm -- 50 7,400 See et al. 1974 Girardia tigrina Flatworm -- 40 5,480 See 1976 Chironomus sp. Midge -- 50 18,200 Rehwoldt et al. 1973 Chironomus plumosus Midge S, U 80 32,600 Fargašová 2003 Drunella grandis Mayfly S, M 50.6 >1,560 CEC 2005 Drunella grandis Mayfly S, M 54.2 >3,050 CEC 2005 Drunella grandis Mayfly S, M 172 >2,190 CEC 2005 Drunella grandis Mayfly S, M 175 >3,050 CEC 2005 Drunella grandis Mayfly S, M 260.7 >3,270 CEC 2005 Drunella grandis Mayfly S, M 277.7 >6,290 CEC 2005 Isoperla sp. Stonefly S, U 182.2 >27,000 CEC 2005 Lepidostoma sp. Caddisfly S, M 62.1 >19,100 CEC 2005 Lepidostoma sp. Caddisfly S, M 189.4 >38,800 CEC 2005 Lepidostoma sp. Caddisfly S, M 308.8 >81,700 CEC 2005 Ranatra elongata Water scorpion -- 112.4 1,658 Shukla et al. 1983 Trichoptera Caddisfly -- 50 58,100 Rehwoldt et al. 1973 Zygoptera Damselfly -- 50 26,200 Rehwoldt et al. 1973
NOTES: S = static test conditions; R = static renewal test conditions; F = flow through test conditions; U = unmeasured concentration; M = measured concentration; T = total metal concentration; D = dissolved metal concentration

Evaluation of the EPA Recalculation Procedure Technical Report in the Arid West 7-5 May 2006
Hyne et al. (2005) conducted a study to evaluate the influence of pH, alkalinity, DOC, and hardness on acute
zinc and copper toxicity in Ceriodaphnia dubia. Synthetic soft water was modified to test the effect of
different water quality characteristics; yet, only results from tests conducted at pH ∃ 6.5 and DOC <5.0 were
added to the database. This study added eight new acute toxicity data points for C. dubia, one of the two
species in the most sensitive generus Ceriodaphnia. Prior to these updates, only one toxicity value was
present for C. dubia in the national database. However, even with the new datapoints, the SMAV remained
virtually unchanged (old SMAV = 174, new SMAV = 175).
Recent studies conducted by Woodling et al. (2002) and Brinkman and Woodling (2005) identified the acute
sensitivity of the mottled sculpin (Cottus bairdii) to zinc. Sculpin were not previously represented in the
national database. Three acute values from these studies were added to the updated database, which places
Cottus as the third most sensitive genus.
Buhl and Hamilton (1990) conducted static acute zinc toxicity tests with early life stage salmonids in standard
soft reconstituted water. Test organisms included Oncorhynchus mykiss, O. kisutch, and Thymallus arcticus.
Tested zinc concentrations were not measured. Given that flow-through, measured tests take precedence over
static, unmeasured tests, the unmeasured values for O. mykiss and O. kisutch were not added to the updated
database since toxicity values derived via flow-through tests already existed in the database. Toxicity data for
T. arcticus, on the other hand, did not previously exist, and eight values were added to the updated database.
These data place Thymallus as the fourth most sensitive genus in the updated database.
7.2.2 New Chronic Zinc Toxicity Data
In addition to the new acute data, a total of 23 data points from 12 sources have been added to the chronic
database (Table 7-2). These new data resulted in addition of 12 new genera and 11 new species. The updated
chronic database still does not meet the “eight-family rule” for direct criteria derivation, as it is missing a
benthic crustacean and a family in a phylum other than Arthropoda or Chordata.
Table 7-2 Updated Chronic Zinc Database
Species Common Name Hardness (CaCO3 mg/L)
Chronic Value (mg/L) Reference
Daphnia magna Cladoceran 45 <140.3 Biesinger et al. 1986 Daphnia magna Cladoceran 52 135.8 Chapman et al. Manuscript Daphnia magna Cladoceran 104 47.29 Chapman et al. Manuscript Daphnia magna Cladoceran 211 46.73 Chapman et al. Manuscript Bryocamptus zschokkei (copepodid) Copepod 100 379.5 *Brown et al. 2005
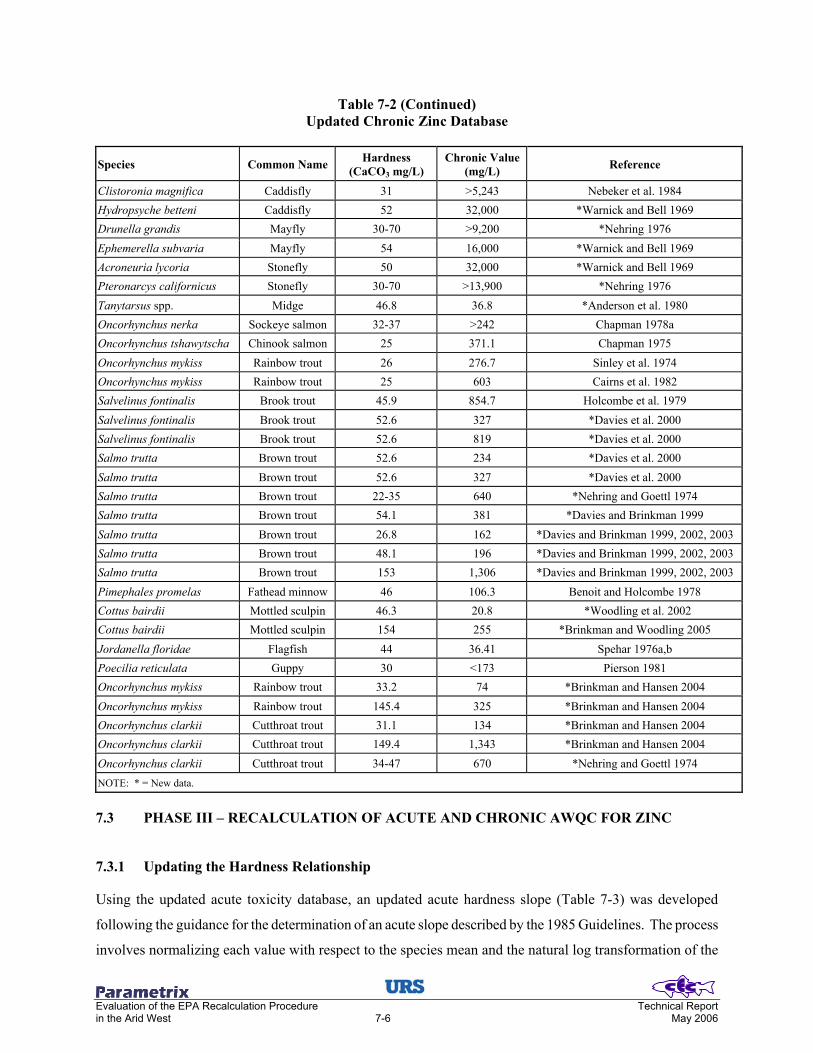
Evaluation of the EPA Recalculation Procedure Technical Report in the Arid West 7-6 May 2006
Table 7-2 (Continued) Updated Chronic Zinc Database
Species Common Name Hardness (CaCO3 mg/L)
Chronic Value(mg/L) Reference
Clistoronia magnifica Caddisfly 31 >5,243 Nebeker et al. 1984 Hydropsyche betteni Caddisfly 52 32,000 *Warnick and Bell 1969 Drunella grandis Mayfly 30-70 >9,200 *Nehring 1976 Ephemerella subvaria Mayfly 54 16,000 *Warnick and Bell 1969 Acroneuria lycoria Stonefly 50 32,000 *Warnick and Bell 1969 Pteronarcys californicus Stonefly 30-70 >13,900 *Nehring 1976 Tanytarsus spp. Midge 46.8 36.8 *Anderson et al. 1980 Oncorhynchus nerka Sockeye salmon 32-37 >242 Chapman 1978a Oncorhynchus tshawytscha Chinook salmon 25 371.1 Chapman 1975 Oncorhynchus mykiss Rainbow trout 26 276.7 Sinley et al. 1974 Oncorhynchus mykiss Rainbow trout 25 603 Cairns et al. 1982 Salvelinus fontinalis Brook trout 45.9 854.7 Holcombe et al. 1979 Salvelinus fontinalis Brook trout 52.6 327 *Davies et al. 2000 Salvelinus fontinalis Brook trout 52.6 819 *Davies et al. 2000 Salmo trutta Brown trout 52.6 234 *Davies et al. 2000 Salmo trutta Brown trout 52.6 327 *Davies et al. 2000 Salmo trutta Brown trout 22-35 640 *Nehring and Goettl 1974 Salmo trutta Brown trout 54.1 381 *Davies and Brinkman 1999 Salmo trutta Brown trout 26.8 162 *Davies and Brinkman 1999, 2002, 2003 Salmo trutta Brown trout 48.1 196 *Davies and Brinkman 1999, 2002, 2003 Salmo trutta Brown trout 153 1,306 *Davies and Brinkman 1999, 2002, 2003 Pimephales promelas Fathead minnow 46 106.3 Benoit and Holcombe 1978 Cottus bairdii Mottled sculpin 46.3 20.8 *Woodling et al. 2002 Cottus bairdii Mottled sculpin 154 255 *Brinkman and Woodling 2005 Jordanella floridae Flagfish 44 36.41 Spehar 1976a,b Poecilia reticulata Guppy 30 <173 Pierson 1981 Oncorhynchus mykiss Rainbow trout 33.2 74 *Brinkman and Hansen 2004 Oncorhynchus mykiss Rainbow trout 145.4 325 *Brinkman and Hansen 2004 Oncorhynchus clarkii Cutthroat trout 31.1 134 *Brinkman and Hansen 2004 Oncorhynchus clarkii Cutthroat trout 149.4 1,343 *Brinkman and Hansen 2004 Oncorhynchus clarkii Cutthroat trout 34-47 670 *Nehring and Goettl 1974 NOTE: * = New data.
7.3 PHASE III – RECALCULATION OF ACUTE AND CHRONIC AWQC FOR ZINC
7.3.1 Updating the Hardness Relationship
Using the updated acute toxicity database, an updated acute hardness slope (Table 7-3) was developed
following the guidance for the determination of an acute slope described by the 1985 Guidelines. The process
involves normalizing each value with respect to the species mean and the natural log transformation of the

Evaluation of the EPA Recalculation Procedure Technical Report in the Arid West 7-7 May 2006
normalized values for each species in which acute values exist for a wide range of hardness values. Hardness
slopes for each species are calculated as the slope from a least squares regression of the mean normalized and
ln transformed acute values on the corresponding transformed hardness values. If covariance analysis shows
that these individual slopes are similar, the pooled acute slope is subsequently determined by treating all
normalized data as if they were from the same species and conducting a least squares regression of all the
transformed acute values on the corresponding hardness values (Stephan et al. 1985).
Table 7-3 Updated Acute Zinc Hardness Slope
Species N SMAS R2 Code Oncorhynchus mykiss 33 0.8490 0.63 2 Salvelinus fontinalis 8 1.0423 0.73 2 Salmo trutta 9 0.8801 0.68 3 Physa heterostropha 12 0.9296 0.56 1 Daphnia magna 13 0.8717 0.71 2 Pimephales promelas 27 0.9119 0.66 2 Poecillia reticulata 5 1.6441 0.82 1 Morone saxatilis 2 0.6500 -- 1 Cottus bairdi 3 1.0216 0.96 3 Lepomis macrochirus 18 0.5764 0.48 2 Oncorhynchus clarki 2 1.5699 -- 3 Ceriodaphnia dubia 2 0.7884 -- 3 Tubifex tubifex 5 0.8235 0.87 3 Revised Pooled Slope 0.8537 0.68 NOTES: SMAS = species mean acute slope. 1 = SMAS equivalent to SMAS reported by EPA (1987) 2 = updated/revised SMAS 3 = new species
Using the latest data obtained from our literature review combined with the original data from the criteria
documents, a revised updated acute hardness slope was determined (0.8537) (Table 9-3). This slope is only
slightly steeper than the existing slope of 0.8473. One data point from a test conducted at very low hardness
appears to be an outlier; yet it was retained to account for zinc toxicity at low hardness, since it does not
highly skew the regression analysis (Figure 7-1). The hardness slope without this data point is slightly steeper
(0.8997) than the updated acute slope of 0.8537.

Evaluation of the EPA Recalculation Procedure Technical Report in the Arid West 7-8 May 2006
-6 -5 -4 -3 -2 -1 1 2 3
-5
-4
-3
-2
-1
1
2
3
4
In (n
orm
aliz
ed a
cute
val
ue)
In (normalized hardness)
Zinc Acute
y=0.8537x + 3E-160.0008R2=0.6787
Figure 7-1
Relationship Between Acute Zinc Toxicity and Water Hardness using the Updated Acute Database
7.3.2 Updated Normalized Acute Database
The updated slope was used to normalize acute values to a hardness of 50 mg/L and to develop a hardness-
based final acute equation. Table 7-4 summarizes the updated ranked acute database. All species were
assigned a habitat code as either being a warm or cold-water species for future use in site-specific criteria
calculations. The new acute database contains 62 genera and 78 species (previously 36 genera and 44
species; Appendix 2).
Table 7-4 Revised and Updated Acute Zinc Genus Mean Acute Values (GMAV) and
Species Mean Acute Value (SMAV) Ranked from Least Sensitive to Most Sensitive Genus (all modified by revised acute hardness slope = 0.8537)
Rank Species Common Name GMAV (µg/L) SMAV (µg/L) Habitat Code
62 Argia sp. Damselfly 89,488 89,488 1, 2
61 Trichoptera Caddisfly 58,100 58,100 1, 2 60 Gambusia affinis Mosquitofish 32,370 32,370 2 59 Zygoptera Damselfly 26,200 26,200 1, 2 58 Chironomus sp. Midge 19,930 18,200 1, 2 Chironomus plumosus Midge 21,825 1, 2

Evaluation of the EPA Recalculation Procedure Technical Report in the Arid West 7-9 May 2006
Table 7-4 (Continued) Revised and Updated Acute Zinc Genus Mean Acute Values (GMAV) and
Species Mean Acute Value (SMAV) Ranked from Least Sensitive to Most Sensitive Genus (all modified by revised acute hardness slope = 0.8537)
Rank Species Common Name GMAV
(µg/L) SMAV (µg/L) Habitat Code
57 Crangonyx pseudogracilis Amphipod 19,800 19,800 1, 2 56 Xenopus laevis Frog 19,091 19,091 2 55 Nais sp. Worm 18,400 18,400 1, 2 54 Asellus aquaticus Isopod 18,200 18,200 1, 2 53 Fundulus diaphanus Banded killifish 17,935 17,935 2 52 Aeolosoma headleyi Worm 17,362 17,362 1, 2 51 Amnicola sp. Snail 16,817 16,817 1, 2 50 Lepidostoma sp. Caddisfly >15,054 >15,054 1, 2 49 Anguilla rostrata American eel 13,627 13,627 2 48 Carassius auratus Goldfish 10,276 10,276 2 46 Lepomis gibbosus Pumpkinseed 9,967 18,778 2 Lepomis macrochirus Bluegill 5,290 2
46 Lumbriculus variegatus Worm 9,744 9,744 1, 2 45 Tubifex tubifex Worm 9,612 9,612 1, 2 44 Isoperla sp. Stonefly >8,952 >8,952 1, 2 43 Caecidotea bicrenata Isopod 8,120 5,677 1, 2 Caecidotea communis Isopod 11,614 1, 2
42 Cyprinus carpio Common carp 7,245 7,245 2 41 Girardia tigrina Flatworm 7,004 7,004 1, 2 40 Echinogammarus tibaldii Amphipod 6,788 6,788 1, 2 39 Notemigonus crysoleucus Golden shiner 6,000 6,000 2 38 Poecilia reticulata Guppy 5,926 5,926 2 37 Corbicula fluminea Asiatic clam 4,892 4,892 1, 2 36 Mesocyclops hyalinus Copepod 4,847 4,847 1, 2 35 Stenocypris malcomsoni Ostracod 4,464 4,464 1, 2 34 Gammarus sp. Amphipod 4,322 8,100 1, 2 Gammarus italicus Amphipod 2,306 1, 2
33 Xiphophorus maculatus Southern platyfish 4,308 4,308 2 32 Pimephales promelas Fathead minnow 3,808 3,808 2 31 Ptychocheilus lucius Colorado pikeminnow 3,790 2,211 2 Ptychocheilus oregonensis Northern pikeminnow 6,495 2
30 Lirceus alabamae Isopod 3,242 3,242 1, 2 29 Gila elegans Bonytail 2,013 2,013 2 28 Salvelinus fontinalis Brook trout 1,691 1,691 1 27 Lophopodella carteri Bryozoan 1,688 1,688 1, 2 26 Jordanella floridae Flagfish 1,673 1,673 2 25 Xyrauchen texanus Razorback sucker 1,651 1,651 2 24 Plumatella emarginata Bryozoan 1,589 1,589 1, 2 23 Helisoma campanulatum Snail 1,579 1,579 1, 2

Evaluation of the EPA Recalculation Procedure Technical Report in the Arid West 7-10 May 2006
Table 7-4 (Continued) Revised and Updated Acute Zinc Genus Mean Acute Values (GMAV) and
Species Mean Acute Value (SMAV) Ranked from Least Sensitive to Most Sensitive Genus (all modified by revised acute hardness slope = 0.8537)
Rank Species Common Name GMAV
(µg/L) SMAV (µg/L) Habitat Code
22 Cypris sp. Ostracod 1,484 1,484 1, 2 21 Physa gyrina Snail 1,354 1,686 1, 2 Physa heterostropha Snail 1,087 1, 2
20 Pectinatella magnifica Bryozoan 1,292 1,292 1, 2 19 Drunella grandis Mayfly >1,264 >1,264 1, 2 18 Limnodrilus hoffmeisteri Worm >1,258 >1,258 1, 2 17 Ranatra elongata Water scorpion 830 830 1, 2 16 Tilapia mossambica Mozambique tilapia 786 786 2 15 Oncorhynchus mykiss Rainbow trout 750 582 1 Onchorhynchus kisutch Coho salmon 1,635 1 Oncorhynchus nerka Sockeye salmon 1,510 1 Oncorhynchus tshawytscha Chinook salmon 449 1 Oncorhynchus clarkii Cutthroat trout 368 1
14 Salmo salar Atlantic salmon >647* 2,194 1 Salmo trutta Brown trout >647 1
13 Heliodiaptomus viduus Copepod 638 638 1, 2 12 Catostomus latipinnis Flannelmouth sucker 600* 600 2 Catostomus commersonii White sucker 5,263 1,2
11 Bryocamptus zschokkei Copepod 343 343 1,2 10 Moina irrasa Cladoceran 320 667 1, 2 Moina macrocopa Cladoceran 153 1, 2
9 Anodonta imbecilis Freshwater mussel 296 296 2 8 Daphnia magna Cladoceran 275 299 1, 2 Daphnia pulex Cladoceran 253 1, 2
7 Hyalella azteca Amphipod 241 241 1, 2 6 Agrosia chrysogaster Longfin dace 226 226 2 5 Tropocyclops prasinus Copepod 205 205 1,2 4 Thymallus arcticus Arctic grayling 199 199 1 3 Cottus bairdii Mottled sculpin 182 182 1 2 Morone saxatilis Striped bass 119* 119 2 Morone americana White perch 13,439 2
1 Ceriodaphnia dubia Cladoceran 94.2 175 1, 2 Ceriodaphnia reticulata Cladoceran 51 1, 2
NOTES: 1 - Coldwater species 2 - Warmwater species * - Only most sensitive species used

Evaluation of the EPA Recalculation Procedure Technical Report in the Arid West 7-11 May 2006
7.3.3 Update to the Acute-to-Chronic Ratio
An updated final acute-chronic ratio (FACR) was also determined using all data reported in the current
criteria document and data obtained from the literature review (Table 7-5). Methods followed those described
by Stephan et al. (1985). Twelve new data points were added from studies in which acute and chronic values
were calculated at similar hardness values for a given species. Using the existing EPA’s FACR (2.000), the
acute and chronic standards are the same value, since the final acute value is divided by two before the
intercept for the final acute equation is determined. However, the updated FACR (2.3726) yields chronic
values that are lower than acute values, which is a more realistic scenario.
Table 7-5 Updated Derivation of Revised Species Mean Acute-Chronic Ratios (ACRs)
and the Final Acute-Chronic Ratio (FACR) for Zinc
Existing ACR Data: New ACR Derivation Data:Species Species Mean ACR Species Species Mean ACROncorhynchus mykiss 1.554 Daphnia magna 7.2604 Oncorhynchus nerka* <6.074 Oncorhynchus clarkii 1.1312 Oncorhynchus tshawytscha 0.7027 Oncorhynchus mykiss 1.6809 Daphnia magna 7.26 Oncorhynchus tshawytscha 0.7027 Pimephales promelas* 5.664 Salvelinus fontinalis 2.1887 Salvelinus fontinalis* 2.335 Salmo trutta 1.9865 Jordanella floridae** 41.2 Cottus bairdii 3.5933
Pimephales promelas 5.664 Bryocamptus zschokkei 2.7852 EPA FACR = 1.9940
Updated FACR = 2.3726
NOTES: * = Not used in EPA calculation ** = Not used because order of magnitude different
New ACR Data From Updated Toxicity Databases: Species Hardness Acute Value Chronic Value ACR Reference Salvelinus fontinalis 52.6 932.4 517.5 1.8017 Davies et al. 2000 Cottus bairdii 46.3-48.6 156 20.8 7.5000 Woodling et al. 2002 Cottus bairdii 138-167 439 255 1.7216 Brinkman and Woodling 2005Bryocamptus zschokkei 100 920 379.5 2.4244 Brown et al. 2005 Bryocamptus zschokkei 100 620 279.5 1.6338 Brown et al. 2005 Broycamptus zschokkei 100 2,070 379.5 5.4548 Brown et al. 2005 Salmo trutta 50 392 194 2.0206 Davies and Brinkman 1999 Salmo trutta 52.6 540.2 276.6 1.9530 Davies et al. 2000 Oncorhynchus mykiss 33.2 125 75 1.6892 Brinkman and Hansen 2004 Oncorhynchus mykiss 145.4 588 325 1.8092 Brinkman and Hansen 2004 Oncorhynchus clarkii 31.1 140 134 1.0448 Brinkman and Hansen 2004 Oncorhynchus clarkii 149.4 1,645 1,343 1.2249 Brinkman and Hansen 2004

Evaluation of the EPA Recalculation Procedure Technical Report in the Arid West 7-12 May 2006
7.3.4 Updated Acute and Chronic Criteria
The updated zinc criteria are then calculated using the genus mean acute values for the four most sensitive
genera (Thymallus, Cottus, Morone, and Ceriodaphnia; Table 7-6). Calculations followed the EPA methods
for criteria derivation (Stephan et al. 1985). A FAV of 170.6 µg/L was calculated resulting in a revised
updated final acute equation of 0.978*e(0.8537 [ln (hardness)]+1.1182), which includes the EPA (2002) acute zinc
conversion factor to account for the dissolved fraction of total zinc.
Table 7-6 Recalculation of the Final Acute Values for Zinc using the Updated Acute Database
Rank Genus GMAV ln GMAV (ln GMAV)^2 P = R/(N+1) %P
4 Thymallus 199.2 5.2943 28.0299 0.0635 0.2520 3 Cottus 181.7 5.2023 27.0643 0.0476 0.2182 2 Morone 119.0 4.7791 22.8400 0.0317 0.1782 1 Ceriodaphnia 94.2 4.5457 20.6636 0.0159 0.1260 sum 19.8215 98.5978 0.1587 0.7744 NOTE: N = 62 genera; R = sensitivity rank in database. Calculations:
Acute Criterion
S2 =∋ (lnGMAV)2 - (∋lnGMAV)2/4 = 98.5978 - (19.8215)2&4 = 42.4744 S = 6.5172 ΣΡ - (Σ √Ρ)2/4 0.1587 – (0.7744)2/4
L = [∋lnGMAV - S(∋%P)]/4 = [19.8215 - 6.5172 (0.7744)]&4 = 3.6937 A = S (√0.05) + L = (6.5172)(0.2236) + 3.6937 = 5.1510
Final Acute Value = FAV = e A = 172.6057 µg/L CMC = ½ FAV = 86.3029 Pooled Slope = 0.8537 (recalculated) ln (Criterion Maximum Intercept) = lnCMC - [pooled slope Η ln (standardized hardness level)] = ln (86.3029) - [0.8537 Η ln (50)] = 1.1182 Acute Zinc Criterion (as µg dissolved Zn/L) = 0.976*e(0.8537 [ln (hardness)] + 1.1182)
---------------------------------------------------------------------------------------------------------------------
Chronic Criterion
Chronic Slope = 0.8537 (recalculated) Final Acute-Chronic ratio (FACR) = 2.3726 (recalculated) Final Chronic Value (FCV) = FAV ) FACR = 86.3029 ) 2.3726 = 72.7496 µg/L ln (Final Chronic Intercept) = ln FCV - [chronic slope Η ln(standardized hardness level)] = ln (72.7496) - [0.8537 Η ln (50)] = 0.9473 Chronic Zinc Criterion (as µg dissolved Zn/L) = 0.986*e(0.8537 [ln (hardness)] + 0.9473)
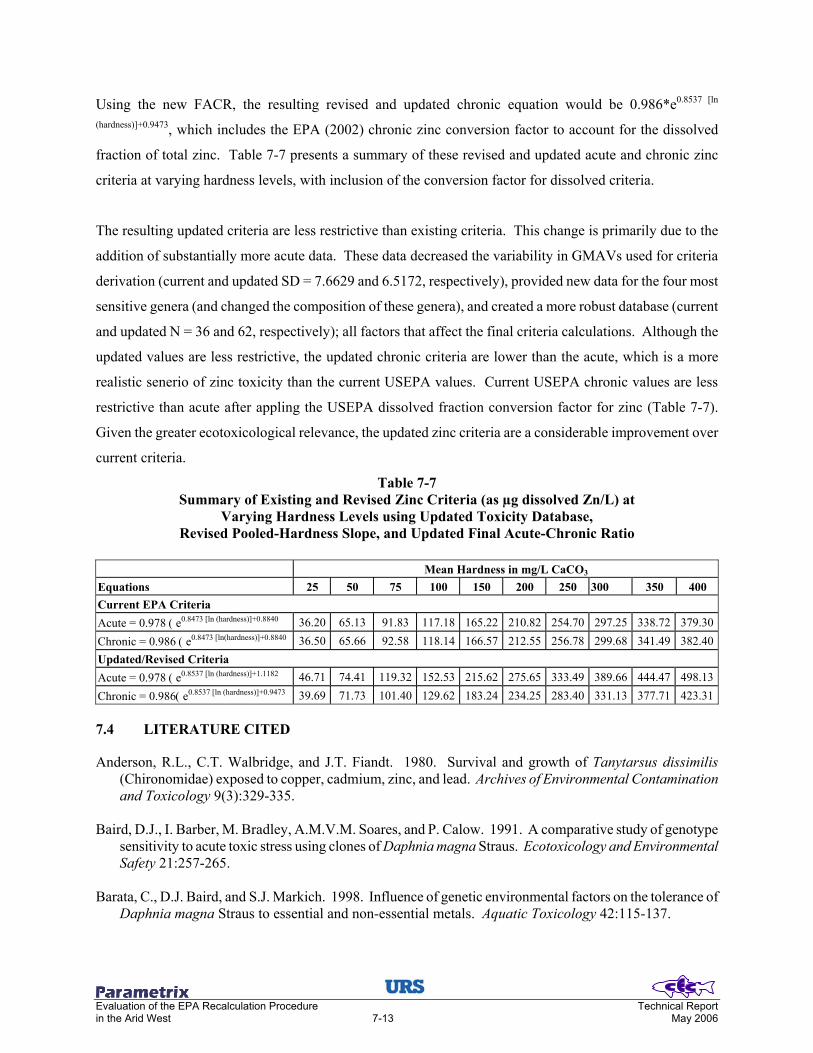
Evaluation of the EPA Recalculation Procedure Technical Report in the Arid West 7-13 May 2006
Using the new FACR, the resulting revised and updated chronic equation would be 0.986*e0.8537 [ln
(hardness)]+0.9473, which includes the EPA (2002) chronic zinc conversion factor to account for the dissolved
fraction of total zinc. Table 7-7 presents a summary of these revised and updated acute and chronic zinc
criteria at varying hardness levels, with inclusion of the conversion factor for dissolved criteria.
The resulting updated criteria are less restrictive than existing criteria. This change is primarily due to the
addition of substantially more acute data. These data decreased the variability in GMAVs used for criteria
derivation (current and updated SD = 7.6629 and 6.5172, respectively), provided new data for the four most
sensitive genera (and changed the composition of these genera), and created a more robust database (current
and updated N = 36 and 62, respectively); all factors that affect the final criteria calculations. Although the
updated values are less restrictive, the updated chronic criteria are lower than the acute, which is a more
realistic senerio of zinc toxicity than the current USEPA values. Current USEPA chronic values are less
restrictive than acute after appling the USEPA dissolved fraction conversion factor for zinc (Table 7-7).
Given the greater ecotoxicological relevance, the updated zinc criteria are a considerable improvement over
current criteria.
Table 7-7 Summary of Existing and Revised Zinc Criteria (as µg dissolved Zn/L) at
Varying Hardness Levels using Updated Toxicity Database, Revised Pooled-Hardness Slope, and Updated Final Acute-Chronic Ratio
Mean Hardness in mg/L CaCO3
Equations 25 50 75 100 150 200 250 300 350 400 Current EPA Criteria Acute = 0.978 ( e0.8473 [ln (hardness)]+0.8840 36.20 65.13 91.83 117.18 165.22 210.82 254.70 297.25 338.72 379.30Chronic = 0.986 ( e0.8473 [ln(hardness)]+0.8840 36.50 65.66 92.58 118.14 166.57 212.55 256.78 299.68 341.49 382.40Updated/Revised Criteria Acute = 0.978 ( e0.8537 [ln (hardness)]+1.1182 46.71 74.41 119.32 152.53 215.62 275.65 333.49 389.66 444.47 498.13Chronic = 0.986( e0.8537 [ln (hardness)]+0.9473 39.69 71.73 101.40 129.62 183.24 234.25 283.40 331.13 377.71 423.31
7.4 LITERATURE CITED
Anderson, R.L., C.T. Walbridge, and J.T. Fiandt. 1980. Survival and growth of Tanytarsus dissimilis (Chironomidae) exposed to copper, cadmium, zinc, and lead. Archives of Environmental Contamination and Toxicology 9(3):329-335.
Baird, D.J., I. Barber, M. Bradley, A.M.V.M. Soares, and P. Calow. 1991. A comparative study of genotype
sensitivity to acute toxic stress using clones of Daphnia magna Straus. Ecotoxicology and Environmental Safety 21:257-265.
Barata, C., D.J. Baird, and S.J. Markich. 1998. Influence of genetic environmental factors on the tolerance of
Daphnia magna Straus to essential and non-essential metals. Aquatic Toxicology 42:115-137.

Evaluation of the EPA Recalculation Procedure Technical Report in the Arid West 7-14 May 2006
Benoit, D.A., and G.W. Holcombe. 1978. Toxic effects of zinc on fathead minnows Pimephales promelas in soft water. Journal of Fish Biology 13:701-708.
Berglind, R., and G. Dave. 1984. Acute toxicity of chromate, DDT, PCB, TPBS, and zinc to Dapnhia magna
cultured in hard and soft water. Bulletin of Environmental Contamination and Toxicology 33:63-68. Biesinger, K.E., G.M. Christensen, and J.T. Fiandt. 1986. Effects of metal salt mixtures on Daphnia magna
reproduction. Ecotoxicology and Environmental Safety 11:9-14. Brinkman, S., and D. Hansen. 2004. Water Pollution Studies. Job Progress Report. Federal Aid Project F-
243-R11. Fish Research Section, Colorado Division of Wildlife, Fort Collins, Colorado. Brinkman, S., and J. Woodling. 2005. Zinc toxicity to the mottled sculpin (Cottus bairdi) in high-hardness
water. Environmental Toxicology and Chemistry 24(6):1515-1571. Brkovic-Popovic, I., and M. Popovic. 1977. Effects of heavy metals on survival and respiration rate of
Tubificid Worms: Part 1-Effects on survival. Environmental Pollution 13(1):65-72. Brown, A.V., R.L. Limbeck, and M.D. Schram. 1989. Trophic importance of zooplankton in streams with
alluvial riffle and pool geomorphometry. Archiv für Hydrobiologie. 114(3):349-367. Brown, R.J., S.D. Rundle, T.H. Hutchinson, T.D. Williams, and M.B. Jones. 2005. A micro plate freshwater
copepod bioassay for evaluating acute and chronic effects of chemicals. Environmental Toxicology and Chemistry 24(6):1528-1531.
Buhl, K.J., and S.J. Hamiton. 1990. Comparative toxicity of inorganic contaminants released by Placer
Mining to early life stages of salmonids. Ecotoxicology and Environmental Safety 20:325-342. Buhl, K.J., and S.J. Hamilton. 1996. Toxicity of inorganic contaminants, individually and in environmental
mixtures, to three endangered fishes (Colorado squawfish, ponytail, and razorback sucker). Archives of Environmental Contamination and Toxicology 30:84-92.
Cairns, J., Jr., and A. Scheier. 1958a. The effects of periodic low oxygen upon the toxicity of various
chemicals to aquatic organisms. Proceedings of the Industrial Waste Conference. Purdue University 12:165-176.
Cairns, J., Jr., and A. Scheier. 1958b. The effects of temperature and hardness of water upon the toxicity of
zinc to the pond snail, Physa heterostropha (Say). Cotulae Naturae 308:1-11. Cairns, J., Jr., and A. Scheier. 1959. The relationship of bluegill sunfish body size to tolerance for some
chemicals. Proceedings of the Industrial Waste Conference. Purdue University 13:243-252. Cairns, J., Jr., W.T. Waller, and J.C. Smrchek. 1969. Fish bioassays contrasting constant and fluctuating
input of toxicants. Revista de Biolologia (Lisbon) 7:75-91. Cairns, J, Jr., T.K. Bahns, D.T. Burton, K.L. Dicks on, R.E. Sparks, and W.T. Waller. 1971. The effects of
pH, solubility and temperature upon the acute toxicity of zinc to the bluegill sunfish (Lepomis macrochirus Raf.). Transactions of the Kansas Academy of Sciences 74:81-92.
Cairns, M.A., R.R. Garton, and R.A. Tubb. 1982. Use of fish ventilation frequency to estimate chronically
safe toxicant concentrations. Transactions of the American Fisheries Society 111:70-77.

Evaluation of the EPA Recalculation Procedure Technical Report in the Arid West 7-15 May 2006
Cairns, Jr., J., A.L. Buikema, Jr., A.G. Heath, and B.C. Parker. 1978. Effects of Temperature on Aquatic Organism Sensitivity to Selected Chemicals. OWRT Project B-084-VA. Virginia Water Resources Research Center, Bulletin106, Office of Water Research and Technology, VA Polytech. Inst. State Univ., Blacksburg, Virginia:1-88.
Chadwick Ecological Consultants, Inc. 2005. Native Aquatic Insect Zinc Toxicity Testing. Technical
Memorandum prepared for Climax Mining Company, Colorado. Chapman, G.A. 1975. Toxicity of Copper, Cadmium, and Zinc to Pacific Northwest Salmonids. Interim
report. EPA, Corvallis, OR. Available from: C.E. Stephan, EPA, Duluth, Minnesota. Chapman, G.A. 1978a. Effects of continuous zinc exposure on sockeye salmon during adult-to-smolt
freshwater residency. Transactions of the American Fisheries Society 107:828-836. Chapman, G.A., and D.G. Stevens. 1978. Acutely lethal levels of cadmium, copper, and zinc to adult male
coho salmon and steelhead. Transactions of the American Fisheries Society 197(6):837-840. Chapman, G.A., S. Ota, and F. Recht. Manuscript. Effects of Water Hardness on the Toxicity of Metals to
Daphnia magna. Available from: C.E. Stephan, EPA, Duluth, Minnesota. Davies, P.H. 1980. Effect of Aeration on the Toxicity of Zinc to Rainbow Trout. Water Pollution Studies,
Federal Aid Project F-33-R-15. Colorado Division of Wildlife, Fort Collins, Coloarado. Davies, P.H., and S. Brinkman. 1994. Toxicity of Cadmium and Zinc to Wild Brown Trout. Water Pollution
Studies, Federal Aid Project F-33. Colorado Division of Wildlife, Fort Collins, Colorado. Davies, P.H., and S. Brinkman. 1999. Toxicity of Zinc to Brown Trout under Conditions of Embroyonic
Exposure (Acclimated), Non-exposure (Unacclimated) and Following 2 and 3 Weeks Deacclimation. Water Pollution Studies, Federal Aid Project F-243-R-6. Colorado Division of Wildlife, Fort Collins, Colorado.
Davies, P.H., S. Brinkman, and D. Hansen. 2000. Toxicity of Copper and Zinc to Three Species of Trout in
the Animas River and Laboratory Water. Water Pollution Studies, Federal Aid Project F-243-R6. Colorado Division of Wildlife, Fort Collins, Colorado.
Davies, P.H., S.F. Brinkman, and D. Hansen. 2002. Water Pollution Studies. Federal Aid Project F-243-R-
9. Colorado Division of Wildlife, Fort Collins, Colorado. June 1999. 50 pp. Davies, P.H., S.F. Brinkman, and D. Hansen. 2003. Water Pollution Studies. Federal Aid Project
F-242-R-10. Colorado Division of Wildlife, Fort Collins, Colorado. June 1999. 50 pp. Eisenhauer, J.B., K.B. Sullivan, and M.J. Lydy. 1999. Response of genotypes of Hyalella azteca to zinc
toxicity. Bulletin of Environmental Contamination and Toxicology 63(1):125-132. Fargašová, A. 2003. Cd, Cu, Zn, Al and their binary combinations, acute toxicity for Chironomus plumosus
larvae. Fresinus Environmental Bulletin 12(8):830-834. Goettl, J.P.J., J.R. Sinley, and P.H. Davies. 1972. Laboratory studies: water pollution. Pages 36-39. IN:
Yeager, L.E., and D.T. Weber (eds.). Colorado Fisheries Research Review No. 7. Division of Game, Fish, and Parks, Fort Collins, Colorado.
Evaluation of the EPA Recalculation Procedure Technical Report in the Arid West 7-16 May 2006
Hamilton, S.J., and K.J. Buhl. 1997a. Hazard evaluation of inorganics, singly and in mixtures, to flannelmouth sucker Catostomus latipinnis in the San Juan River, New Mexico. Ecotoxicology and Environmental Safety 38(3):296-308.
Hamilton, S.J., and K.J. Buhl. 1997b. Hazard assessment of inorganic, individually and in mixtures, to two
endangered fish in the San Juan River, New Mexico. Environmental Toxicology and Water Quality 12:195-209.
Holcombe, G.W., and R.W. Andrew. 1978. The Acute Toxicity of Zinc to Rainbow and Brook Trout.
Comparison in Hard and Soft Water. EPA-600/3-78-094. National Technical Information Service, Springfield, Virginia.
Holcombe, G.W., D.A. Benoit, and E.N. Leonard. 1979. Long-term effects of zinc exposures on brook trout
(Salvelinus fontinalis). Transactions of the American Fisheries Society 108:76-87. Hyne, R.V., F. Pablo, M. Bulli, and S.J. Markich. 2005. Influence of water chemistry on the acute toxicity of
copper and zinc to the cladoceran Ceriodaphnia cf dubia. Environmental Toxicology and Chemistry 24(7):1667-1675.
Kallanagoudar, Y.P., and H.S. Patil. 1997. Influence of water hardness on copper, zinc and nickel toxicity to
Gambusia affinis (B & G). Journal of Environmental Biology 18(4):409-413. Keller, A.E., and S.G. Zam. 1991. The acute toxicity of selected metals to the freshwater mussel, Anodonta
imbecilis. Environmental Toxicology and Chemistry 10(4):539-546. Khangarot, B.S. 1991. Toxicity of metals to a freshwater tubificid worm, Tubifex tubifex (Muller). Bulletin
of Environmental Contamination and Toxicology 46:906-912. Lelande, M., and B. Pinel-Alloul. 1986. Acute toxicity of cadmium, copper, mercury and zinc to
Tropocyclops prasinus mexicanus (Cyclopoida, Copepoda) from three Quebec lakes. Environmental Toxicology and Chemistry 5:95-102.
Magliette, R.J., F.G. Doherty, D. McKinney, and E.S. Venkataramani. 1995. Need for environmental quality
guidelines based on ambient freshwater quality criteria in natural waters - case study “zinc.” Bulletin of Environmental Contamination and Toxicology 54(4):626-632.
Martin, T.R., and D.M. Holdich. 1986. The acute lethal toxicity of heavy metals to Paracarid crustaceans
(with particular reference to fresh-water Asellids and Gammarids). Water Research 20(9):1137-1147. Nebeker, A.V., C. Savonen, R.J. Baker, and J.K. McCrady. 1984. Effects of copper, nickel, and zinc on the
life cycle of the caddisfly Clistoronia magnifica (Limnephilidae). Environmental Toxicology and Chemistry 3:645-649.
Nehring, R.B. 1976. Aquatic insects as biological indicators of heavy metal pollution. Bulletin of
Environmental Contamination and Toxicology 15(2):147-154. Nehring, B., and J. Goettl. 1974. Acute toxicity of a zinc-polluted stream to four species of salmonids.
Bulletin of Environmental Contamination and Toxicology 12(4):464-469.

Evaluation of the EPA Recalculation Procedure Technical Report in the Arid West 7-17 May 2006
Pantani, C., G. Pannunzio, M. De Cristofaro, A.A. Novelli, and M. Salvatori. 1997. Comparative acute toxicity of some pesticides, metals, and surfactants to Gammarus italicus Goedm. and Echinogammarus tibaldii Pink. and stock. Bulletin of Environmental Contamination and Toxicology 59(6):963-967.
Pierson, K.B. 1981. Effects of chronic zinc exposure on the growth, sexual maturity, reproduction, and
bioaccumulation of the guppy, Poecilia reticulata. Canadian of Fisheries and Aquatic Sciences 38:23-31.
Qureshi, S.A., A.B. Saksena, and V.P. Singh. 1980a. Acute toxicity of some heavy metals to fish food
organisms. International Journal of Environmental Studies 14(4):325-327. Qureshi, S.A., A.B. Saksena, and V.P. Singh. 1980b. Acute toxicity of four heavy metals to benthic fish
food organisms from the River Khan, Ujjain. International Journal of Environmental Studies 15(1):59-61.
Rehwoldt, R., L. Lasko, C. Shaw, and E. Wirhowski. 1973. The acute toxicity of some heavy metal ions
toward benthic organisms. Bulletin of Environmental Contamination and Toxicology 10(5):291-294. See, C.L. 1976. The Effect of Sublethal Concentrations of Selected Toxicants on the Negative Phototactic
Response of Dugesia tigrina. Ph.D. Dissertation. Virginia Polytechnic Institute and State University, Blacksburg, VA.
See, C.L., A.L. Buikema, Jr., and J. Cairns, Jr. 1974. The effects of selected toxicants on survival of Dugesia
tigrina (Turbellaria). Association of Southeastern Biologists Bulletin 21(2):82. Sharma, M.S., and C.S. Selvaraj. 1994. Zinc, lead and cadmium toxicity to selected freshwater zooplankters.
Pollution Research 13(2):191-201. Shukla, G.S., R. Murti, and Omkar. 1983. Cadmium and zinc toxicity to an aquatic insect, Ranatra elongata
(Fabr.). Toxicology Letters 15(1):39-41. Sinley, J.R., J.P. Goettl, Jr., and P.H. Davies. 1974. The effects of zinc on rainbow trout (Salmo gairderi) in
hard and soft water. Bulletin of Environmental Contamination and Toxicology 12(2):193-201. Spehar, R.L. 1976a. Cadmium and Zinc Toxicity to Jordanella floridae. EPA-600/3-76-096. National
Technical Information Service, Springfield, Virginia. Spehar, R.L. 1976b. Cadmium and zinc toxicity to flagfish, Jordanella floridae. Journal of the Fisheries
Research Board of Canada 33:1939-1945. Stephan, C.E., D.I. Mount, D.J. Hansen, J.H. Gentile, G.A. Chapman, W.A. Brungs. 1985. Guidelines for
Deriving Numerical National Water Quality Criteria for the Protection of Aquatic Organisms and Their Uses. Accession No. PB-85-227049. National Technical Information Service, Springfield, Virginia.
Thompson, K.W., A.C. Hendricks, J. Cairns, Jr. 1980. Acute toxicity of zinc and copper singly and in
combination to the bluegill (Lepomis macrochirus). Bulletin of Environmental Contamination and Toxicology 25(1):122-129.
U.S. Environmental Protection Agency. 1987. Ambient Water Quality Criteria for Zinc - 1987. EPA-440/5-
87-003. Office of Water, Washington, DC.

Evaluation of the EPA Recalculation Procedure Technical Report in the Arid West 7-18 May 2006
U.S. Environmental Protection Agency. 1996. 1995 Updates: Water Quality Criteria Documents for the Protection of Aquatic Life in Ambient Water. EPA-820-B-96-001. Office of Water, Washington, DC.
U.S. Environmental Protection Agency. 2002. National Recommended Water Quality Criteria. EPA-822-R-
02-047. Office of Water, Washington, DC. Warnick, S.L., and H.L. Bell. 1969. The acute toxicity of some heavy metals to different species of aquatic
insects. Journal of the Water Pollution Control Foundation 41(2):280-284. Woodling, J., S. Brinkman, and S. Albeke. 2002. Acute and chronic toxicity of zinc to the mottled sculpin
Cottus bairdi. Environmental Toxicology and Chemistry 21(9):1922-1926. Zou, E., and S. Bu. 1994. Acute toxicity of copper, cadmium, and zinc to the water flea, Moina irrasa
(Cladocera). Bulletin of Environmental Contamination and Toxicology 52(5):742-748.

Evaluation of the EPA Recalculation Procedure Technical Report in the Arid West 8-1 May 2006
8.0 AMBIENT WATER QUALITY CRITERIA RECALCULATION ARID WEST EFFLUENT-DOMINATED STREAMS This chapter provides an introduction to methods and available resources that are important in developing
site-specific criteria databases and subsequent analysis of these databases using the EPA recalculation
procedure. An overview of current EPA recalculation methodology provides necessary background
information in understanding our interpretation of published guidance documents. The second part of this
section develops recommended modifications to the recalculation procedure needed to address the problems
associated with meeting minimum data requirements (MDRs) and performing site-specific recalculations in
effluent-dominated, arid West streams and rivers. In the final part of this chapter, methods are provided for
performing site-specific recalculations for the five case study streams described in Chapters 1 and 2, as well
as two regional recalculations.
8.1 OVERVIEW OF THE EPA RECALCULATION PROCEDURE
National ambient water quality criteria (AWQC) are to be derived from the most up-to-date toxicity databases
for species resident to North America. Established methods for data selection and national criteria derivation
are published in Guidelines for Deriving Numerical National Water Quality Criteria for the Protection of
Aquatic Organisms and Their Uses (Stephan et al. 1985), as well as Appendix B: The Recalculation
Procedure in Interim Guidance on Determination and Use of Water-Effect Ratios for Metals (EPA 1994).
National criteria established by the EPA provide guidance to state agencies that establish the State’s AWQC,
yet may need to be modified to better represent environmental conditions of the State. The EPA recognizes
that some of the species within the national database may not reside in the State, or the state may have
sensitive species that are not represented in the database. In these situations, the national criteria may be over
or under protective for certain aquatic communities.
To resolve under- or overprotective criteria, the EPA offers a number of options to derive site-specific
criteria, which take into account the local environmental conditions. General guidelines for conducting a site-
specific recalculation were originally published in the criteria derivation guidance document by the EPA
(1984). Since then, more specialized documents have been published (e.g., EPA 1994; 2001) to ensure that
the contaminant of concern is properly accounted for. The basic steps involved with the recalculation
procedure include (EPA 1994):
a) Corrections to the national database,
b) Updating the national database,

Evaluation of the EPA Recalculation Procedure Technical Report in the Arid West 8-2 May 2006
c) Deletions of taxa that do not occur at the site,
d) If new database does not meet MDRs, generating the data necessary to meet MDRs,
e) Recalculating new acute and chronic criteria based on the revised and updated databases, and
f) Presenting results in a report.
The first two steps of the recalculation procedure listed above, performing corrections and updating the
national database, were presented for the selected criteria in Chapters 3-7 of this report. The next steps in
generating site-specific AWQC will use these updated national databases with comparisons to resident species
lists previously analyzed and presented in Chapter 2.
Before we proceed with the deletion and recalculation procedure, it is important to understand the EPA
recalculation methodology, specifically the aspects related to defining resident species at a given site. We
will also revisit MDRs needed to develop arid West, effluent-dependent streams, site-specific AWQC.
8.2 RESIDENT VS. TRANSIENT SPECIES
A key component of the recalculation procedure, specifically with regard to deletion of non-resident taxa
from the database, is the definition of the phrase “occur at the site.” This is a key factor in the potential
deletion of non-resident taxa from the native toxicity database. The EPA (1994) defines occur at site as the
species, genera, Families, Orders, Classes and Phyla that:
a) are usually present at the site,
b) are present at the site only seasonally due to migration,
c) are present intermittently because they periodically return to or extend their ranges into the site,
d) were present at the site in the past, are not currently present at the site due to degraded conditions,
and are expected to return to the site when conditions improve, and
e) are present in nearby bodies of water, are not currently present at the site due to degraded conditions,
and are expected to be present at the site when conditions improve.
For this analysis, we have taken this occur at site phrase a step further by delineating the organisms that occur
at the site into “resident” and “transient” species. A resident species is defined as an organism using the
habitat located at the site for reproduction, foraging, and/or refuge, which can include migratory species. A

Evaluation of the EPA Recalculation Procedure Technical Report in the Arid West 8-3 May 2006
transient species, on the other hand, is defined as a species that may occur at the site, but does not utilize the
habitat for these functions, and is only passively moving through the site.
8.3 DELETION PROCESS
After a list of resident species for a site is compiled, the formal EPA (1994) deletion process can be exercised.
Resident species lists are used to screen the corrected and updated national databases for each criterion. The
deletion process specifies which species must be deleted and which species must be retained. A step-wise
process is applied to each species in the corrected and updated national database to determine deletion status.
The first step in the EPA process is to “circle” all species that are found at the site that are also in the toxicity
database; these species must not be deleted (EPA 1994). It is important to note the significance of this first
step. The EPA places greater significance on the circled species since they occur at the site, and assumes
these species better represent a Family, Order, or Class than species that do not occur at the site, but would be
retained by the subsequent step-wise process. Such emphasis on “circled species” is very important since the
circled species can override the retention of other taxa, while the lack of a circled species can lead to the
retention of multiple taxa that are only distantly related.
The remaining species in the toxicity database are then subject to further screening (EPA 1994) that is
designed to ensure that:
a) Each species that occurs both in the national database and at the site also occurs in the site-specific
data set,
b) Each species that occurs at the site but does not occur in the national database is represented in the
site-specific database by all species in the national data set that are in the same genus,
c) Each genus that occurs at the site but does not occur in the national database is represented in the site-
specific data set by all genera in the national data set that are in the same Family, and
d) Each Order, Class, and Phylum that occurs both in the national database and at the site is represented
in the site-specific database by one or more species in the national database that are most closely
related to a species that occurs at the site (emphasis added).
After reviewing the EPA (1994) deletion process, we identified a possible conflict between 1) the step-wise
process they describe, 2) their accompanying figure that shows an example of the deletion process using three
Phyla, and 3) the previously stated goal of deriving a site-specific database that contains the most closely
related taxa to taxa found at the site. The discrepancy occurs during the retention of a species based on an
Evaluation of the EPA Recalculation Procedure Technical Report in the Arid West 8-4 May 2006
Order-level commonality or higher. According to the EPA step-wise procedure, a species is retained only at
Order level when the national database does not contain a circled species in the same Order of the species
being screened. Conversely, the explanation of the Order code given in the example provided by EPA states
that the species being screened will be retained if the Order occurs at the site and is not represented by a lower
taxon, which may or may not be a circled species. This last phrase, not represented by a lower taxon, is not
consistent with the step-wise procedure when a species is retained, but not circled, at other lower levels of
identification (e.g., Family). Furthermore, retaining some taxa on a high level of identification (e.g., Class
and Phylum), when a representative in a lower taxon is already retained, but not circled, generally results in a
muddied database, which is counterintuitive to the primary goal in the recalculation procedure of revising the
national database to taxa that are most closely related to the species that occur at the site.
To resolve these conflicts, we refined the EPA step-wise process with the goal of generating a site-specific
toxicity dataset more representative of the species that occur at the site than what would be derived using the
standard process.
The first step would remain the same, which is “circling” all species that satisfy the definition of Aoccur at the
site. Note: Circled taxa may be at a higher level of identification than species if no lower level of
identification is available for taxa at the site. Some studies used to develop the resident species lists only
identified invertebrates to Order, Family, or genus. When this occurred, all species in the lowest level of
identification are initially circled. For example, we only have “Trichoptera" sampled at the Santa Cruz River
site near Nogales. In this situation, all species in the Order Trichoptera were initially circled.
Following the initial circling process, a refined step-wise circling process, described below, was used to
determine which of the remaining species in the toxicity database must be deleted and which must be
retained.
8.3.1 Refined Step-Wise Process for Deletion of Non-Resident Taxa
1) Circle all species/taxa that satisfy the definition of “occur at the site.”
a) Then follow steps below for uncircled species.
2) Does the genus occur at the site?
a) If no, go to step 3.
b) If yes, are there one or more species in the genus that occur at the site but are not in
the dataset?
i) If no, go to step 3.

Evaluation of the EPA Recalculation Procedure Technical Report in the Arid West 8-5 May 2006
ii) If yes, circle all species in genus.*
3) Does the family occur at the site?
a) If no, go to step 4.
b) If yes, are there one or more genera in the family that occur at the site, but are not
in the dataset?
i) If no, delete all uncircled species in family.*
ii) If yes, circle all species in the genera not already represented.*
4) Does the Order occur at the site?
a) If no, go to step 5.
b) If yes, are there one or more families in the Order that occur at the site, but are not
in the dataset?
i) If no, delete all uncircled species in this family.*
ii) If yes, circle all species in families not already represented.*
5) Does the Class occur at the site?
a) If no, go to step 6.
b) If yes, does the dataset contain a circled species in the same Class?
i) If no, circle all species in this Class.*
ii) If yes, delete all uncircled species in this Class.*
6) Does the Phylum occur at the site?
a) If no, delete all species in this Phylum.
b) If yes, does the dataset contain a circled species in this Phylum?
i) If no, circle all uncircled species in this Phylum.*
ii) If yes, delete the uncircled species in this Phylum.*
7) Once all species in the national toxicity database have been considered, retain all circled
species. *Continue the deletion process by starting at step 2 for another uncircled species, unless all uncircled species in the dataset have been
considered.
This revised step-wise deletion procedure was performed on the corrected and updated databases for each
criterion and for each study site, as described below. The detailed results are found in Appendix 3, with a
coded explanation of the deletion process used to screen each species.
The result of this site-specific deletion process is a database that best reflects the taxonomic profile of each
site for each criterion. Upon completion of each site-specific database, MDRs must then be checked and each

Evaluation of the EPA Recalculation Procedure Technical Report in the Arid West 8-6 May 2006
database must still satisfy the minimum requirements in order to proceed with AWQC derivation for that site.
Otherwise, additional toxicity data would have to be generated to create a site-specific database that satisfies
MDRs. This was not considered necessary for any of the sites we evaluated in the present study.
8.4 MINIMUM DATA REQUIREMENTS
As previously stated, a direct calculation of a criterion (not just assigning the most sensitive species in the
database) requires an MDR for the toxicity database such that it contains data for eight diverse families
(Stephen et al. 1985). For national criteria—and as outlined in the current recalculation procedure
(EPA 1994) —these families must include:
1) the Family Salmonidae, 2) a Family in the Class Osteichthyes, 3) a Family in the Phylum Chordata, 4) a planktonic crustacean, 5) a benthic crustacean, 6) an aquatic insect, 7) a Family in a Phylum other than Arthropoda or Chordata, and 8) a Family in any Order of insect or any Phylum not already represented.
This MDR is commonly referred to as the “eight-family rule.” National AWQC derived from a database that
meets the eight-family rule are calculated from a series of formulas using the geometric mean toxicity values
of the four most sensitive genera, and the total number of genera represented in the database. The resulting
criteria concentrations are expected to protect at least 95% of all aquatic organisms and aquatic habitats (lotic,
lentic, cold-water, and warm-water habitats). To ensure that the derived criteria are sufficiently protective,
toxicity values for sensitive species and, sometimes, those that are limited to a particular location or habitat
can also be used as the basis of the criterion to the exclusion of the other data included in the national
database.
8.5 REDEFINING THE RECALCULATION PROCEDURE FOR ARID WEST STREAMS
The EPA guidelines and MDRs listed in the previous section are the foundation for the arid West effluent-
dependent stream AWQC recalculations. However, we believe along with the clarification of the deletion
procedure outlined above, slight modifications of the MDRs may also be warranted given the habitats present
and organisms expected to occur in these habitats. For example, all sites under consideration for recalculation
are classified as warm-water segments; therefore, we would not expect to find cold-water taxa such as trout or
salmon at, or downstream of, these sites. This can be verified by the review of the resident species lists of the
arid West study streams noted earlier (see Chapter 2). Only one of the five sites under consideration for
recalculation, Fountain Creek, contains a salmonid (although those fish could arguably be classified as
transients based on their sampling location and underlying size structure). Eliminating all non-resident trout

Evaluation of the EPA Recalculation Procedure Technical Report in the Arid West 8-7 May 2006
and salmon for all other sites violates the generalized EPA MDRs, since a member of the Family Salmonidae
is required for a direct criteria calculation.
Furthermore, we would not expect many arid West effluent-dependent stream sites to have resident
zooplankton communities. However, the exclusion of zooplankton, including planktonic crustaceans, would
be another violation of the “eight-family rule.” Of course, zooplankton are not equally represented in all
aquatic ecosystems with respect to abundance and ecological significance. In lentic (i.e., lake) ecosystems,
these small invertebrates are an important primary consumer, with high biomass and rapid population turn
over (Wetzel 2001). Zooplankton are essential to lentic ecosystem function and an integral component to
many food webs. In lotic (i.e., stream) ecosystems, however, the presence of zooplankton are greatly reduced
and frequently absent due to habitat limitations, since by definition, zooplankton are unable to withstand
stream current. If zooplankton are sampled from high velocity streams/rivers, it is likely that these organisms
were washed out of an upstream off-channel lake, pond, or reservoir and have no means of sustaining a
population within the stream system without continual contributions from the source populations
(Hynes 2001). Zooplankton washed into stream channels are generally thought to be transient species, since
densities rapidly decline with downstream distance from the source population (Chandler 1937; Ward 1975;
Novotny and Hoyt 1982; Thorp et al. 1994; Phillips 1995; Hynes 2001; Walks and Cyr 2004). In the case of
effluent-dominated streams, the source population of zooplankton sampled just downstream of a WWTP
discharge could likely be the WWTP tanks and/or ponds themselves (CEC, unpublished sampling data).
8.5.1 Potential Revised “Eight-Family Rule” for Arid West Streams
A possible solution is to create a revised “eight-family rule” that utilizes EPA methodology and incorporates
more typical arid West stream aquatic communities. The exact method for recalculation (derivation of a 5th
percentile FAV via the recalculation procedure, or defaulting the FAV to the most sensitive species) will
generally be determined by the size of the database and organisms within the database. To increase the
potential for a 5th percentile calculation, one option is to derive an alternate eight-family rule that better
represents the aquatic communities found in these unique stream segments.
Redefining the MDRs, or providing suitable surrogate organisms for a particular habitat type would entail
replacing current EPA MDRs that are expected to be non-resident in arid West effluent-dependent streams
with organisms of approximately equal sensitivity that would be expected to occur in the river segments. For
example, requiring a salmonid in the database serves two purposes. First, these fish are the dominant top
predators in cold-water aquatic ecosystems. Second, salmonids tend to be relatively sensitive to
contaminants. However, if obligate cold-water fish are not a resident species, an appropriate surrogate fish

Evaluation of the EPA Recalculation Procedure Technical Report in the Arid West 8-8 May 2006
Family for the salmonid requirement would be an organism within the Family Cyprinidae or Centrarchidae.
Cyprinids represent 22-42% of fish taxa for each of the streams under consideration for recalculation,
excluding one site with a limited fish population (see Chapter 2). The second most abundant Family
represented is Centrarchidae, which can be the top predator in many warm water stream systems.
Furthermore, Cyprinids are the most sensitive warm water fish for three (zinc, ammonia, and diazinon) of the
five contaminants considered for recalculation. Thus, we suggest that the first two rules of the eight-family
rule should be changed to include an organism in the Family Centrarchidae and one in Cyprinidae.
Including zooplankton as a resident species of the arid West streams will likely need to be evaluated on a site-
specific basis. If zooplankton are determined to be a non-resident, once again the site will be in violation of
the MDRs and a surrogate family needs to be established. A potential surrogate for a planktonic crustacean
maybe an additional aquatic insect in a family not already represented in the database. The percentage of
invertebrate taxa in the arid West streams that are aquatic insects ranges from 59% to 86% (Chapter 2). The
toxicity database would better represent invertebrate communities of arid West streams if toxicity databases
included information on at least two aquatic insect Orders. Furthermore, all databases under consideration for
recalculation contain toxicity data for two aquatic insect families, making this substitution feasible without
additional toxicity testing.
Considering the non-resident taxa in the EPA MDRs and the relative importance of other taxa not included in
the EPA MDRs, a revised eight-family rule specific for arid West streams is proposed below. Note: This
revised eight-family rule is for the protection of warm water aquatic communities residing in arid West
effluent-dependent stream habitats, not in lakes and/or ponds.
Arid West Stream Eight-Family Rule [AWS-MDRs]
1) an organism in the Family Centrarchidae, 2) an organism in the Family Cyprinidae, 3) a Family in the Phylum Chordata, 4) an aquatic insect, 5) a second aquatic insect in a different Order, 6) a benthic crustacean, 7) a Family in a Phylum other than Arthropoda or Chordata, and 8) a Family in any Order of insect or any Phylum not already represented.
Although the AWS-MDRs better represent potential aquatic communities residing in arid West streams than
national MDRs, further exceptions to MDRs may be necessary if one of the above eight families does not
reside at a particular site. For example, as noted in Chapter 4, San Timoteo Wash (a tributary to the Santa
Evaluation of the EPA Recalculation Procedure Technical Report in the Arid West 8-9 May 2006
Ana River) does not contain fish due to naturally intermittent flows. Three of the eight families in the AWS-
MDRs are for fish (or vertebrates), making it impossible to meet all eight of the AWS-MDRs (or EPA MDRs,
as well). Additionally, the Santa Cruz River and San Timoteo Wash do not have resident benthic crustaceans.
In these situations, requiring at least an eight-family database may be acceptable, or perhaps species that
could potentially occur at the site may be retained, or the criteria could default to a generalized regional arid
West stream criterion. The exact procedure used in these situations will need to be determined on site-
specific basis.
Another potential problem in satisfying the MDRs would occur in site-specific databases that contain fewer
then eight families. In this circumstance, the EPA states that a special version of the recalculation procedure
must be used, but only if data are available for at least one species in each of the families that occur at the site.
It is at this point when the lowest SMAV of a species that occurs at the site must be used as the FAV. In our
situation, none of the resident species lists have fewer than eight families due to the extensive collection of
aquatic invertebrate data.
We propose a slight modification of this special version of the recalculation procure. If at least eight Families
are present in the site-specific toxicity database and the AWS-MDRs are still not met even after efforts to
substitute taxonomically similar organisms are made, then the FAV can be set to the most sensitive species
SMAV in the final site-specific database. When the final site-specific toxicity database contains less than
eight Families, a FAV cannot be derived. In this situation, managers could use criteria derived from
respective regional databases to provide guidance in establishing AWQC.
8.5.2 Additional Revised Recalculation Methods
AWQC are presently derived from ranked genus mean acute and chronic values (GMAV, GMCV) calculated
as the geometric mean of species mean values (SMAV, SMCV). Furthermore, the number of genera
represented in the database rather than the number of species determines database robustness. The decision to
rank the toxicity databases at the generic level of identification over species level is not specifically addressed
in the 1985 Guidelines. Many genera are represented by only one species, yet others are represented by
multiple species.
For the analysis presented herein, we are proposing that criteria derived during the recalculation process be
calculated from SMAVs rather than GMAVs for a number of reasons. First, the deletion process itself is
conducted on a species level rather than a genus level, making it more acceptable to utilize the SMAVs for the
FAV calculation (Great Lakes Environmental Center 2005). Second, while within-genus toxicity values are
Evaluation of the EPA Recalculation Procedure Technical Report in the Arid West 8-10 May 2006
relatively consistent (at least more so than higher taxonomic levels), toxicity of a contaminant to different
species within the same generus is not always equivalent. Even though the difference in toxicity between
species may be small (< a factor of 10; e.g., Physa sp. for zinc), using a GMAV dilutes the sensitivity of the
more sensitive species. Other genera contain species with highly divergent (> a factor of 10-100) toxicity
values (e.g., Catostomus, Oncorhynchus, Daphnia, Morone, Gammarus). In these situations, only the SMAV
for the most sensitive species is used in the GMAV calculation and valid data for other species in the genus
are lost. Third, little overlap of arid West resident species lists and species within the various toxicity
databases can artificially lower the criterion if derived at the GMAV level. This is because the FAV
derivation procedure is designed to calculate a more conservative criterion when database size is small
(Erickson and Stephan 1988).
A lower criterion due to a reduction in database sample size, rather than the presence of more sensitive
species, may thus be over protective of the arid West stream community. Calculating criteria from the
number of species in the database rather than genera can slightly increase the database sample size to help
resolve potential sample size effects, without affecting the protectiveness of the resulting criteria through
inclusion of SMAVs for sensitive species.
8.6 RECALCULATION OF AMBIENT WATER QUALITY CRITERIA
In the previous section, we provided an introduction to the methods in which site-specific databases were
created, and we identified recommended alternatives to EPA deletion methods, MDRs, and use of SMAV
versus GMAV, in order to derive site-specific AWQC. In this section, we provide a detailed description of
the methods that were used to create the site-specific databases and subsequent analysis of the databases to
derive site-specific criteria. To illustrate the potential outcome of using these revised procedures, we
conducted criteria recalculations for each of the model criteria and case study streams described earlier (see
Chapter 9).
8.6.1 Comparison of Resident Species Lists to Toxicity Databases
As stated above (Chapter 8.3), the first step of the deletion process is the comparison of the site resident
species lists to each updated criterion database. This is accomplished by classifying (or “coding”) each
organism in each updated criterion database to its taxonomic classification unit from species up to Phylum
(see worksheets in Appendix 3). To keep our analysis consistent between criteria and sites, we followed the
steps of the revised step-wise deletion process (Section 8.3.1).

Evaluation of the EPA Recalculation Procedure Technical Report in the Arid West 8-11 May 2006
Resulting databases for each criterion and site may include cold-water salmonids and cladocerans if
applicable, yet are marked with an asterisk if not used in the final calculations. Additionally, any deletion or
acceptance that did not follow the exact interpretation of the revised step-wise deletion process was also
marked in Appendix 3 and further explained in the respective report section.
The step-wise deletion process was conducted using the revised and updated national toxicity databases and
resident species list for each river with exception of the Santa Cruz River, which was separated into two
different sites. These sites were identified as the Santa Cruz River below Nogales and the Santa Cruz River
below Tucson.
When the site-specific databases for the two regions (Southwest and High Plains) were created, the species
lists for rivers in each respective region were compiled before the step-wise deletion process commenced.
Because of the intricacies of the deletion process, one cannot simply combine all of the species in each
database from each river in a region, but must treat all of the species that reside in the region as a single site,
and then perform the step-wise procedure. Results of the regional deletion process were similar to those of
each river and are again reported in Appendix 3. Once the site-specific databases were created, checking of
AWS-MDRs, the ranking process, and final site-specific criteria derivation was performed.
8.6.2 Threatened and Endangered Species and the Use of Surrogates
According to the EPA (1994) recalculation procedure, toxicological data for “listed” species or taxonomically
similar organisms must be incorporated into the site-specific database to ensure the protection of a threatened
or endangered (T&E) species. Many of the robust databases (e.g. copper and zinc) already contain toxicity
data for T&E species or acceptable surrogates (see Chapter 9). Criteria with limited databases (e.g., diazinon
and aluminum), on the other hand, likely do not contain toxicity data for T&E species. In these situations, we
need to identify a species that is most closely related to the T&E species within the toxicity database. Most
databases contain a species within the same family or genus as the T&E species (the ideal situation).
However, there are a few site-specific databases in which fish in a different family may be the only available
toxicity data to represent a T&E fish. Despite the lack of “ideal” surrogates for T&E species, site-specific
recalculations were still conducted. These criteria would undoubtedly benefit from additional toxicity testing
with the contaminant and species of concern.
8.6.3 Final Recalculation of Ambient Water Quality Criteria
The first step after completion of the site-specific databases was to check for acceptance of the AWS-MDRs.
In our analysis, we followed the proposed “arid West eight-family rule” discussed in the previous sections of
Evaluation of the EPA Recalculation Procedure Technical Report in the Arid West 8-12 May 2006
this chapter. In addition to compliance with the AWS-MDR, it is important to identify threatened,
endangered, and/or recreationally economically important species that reside at a site. Six T&E species were
identified in three of the five rivers and in one of the regional resident species lists. The EPA recalculation
guidance document (1994) states that these species must be accounted for by an acceptable surrogate species
in the site-specific database for the respective site. Considerations for the best surrogate species for each
listed threatened or endangered species are provided with a discussion in the text when necessary. If the
AWS-MDRs were not met for a particular criterion at a particular site, then the regional site-specific criterion
could provide an alternative AWQC recommendation.
Although the 1985 Guidelines and EPA (1994) AWQC guidance document specify that the GMAVs of the
four most sensitive genera be used in the calculation of the FAV, we ranked species by their SMAVs instead
of GMAVs for this analysis (Section 8.5.2). When the AWS-MDRs were satisfied, the four most sensitive
SMAVs and the total number of species in the site-specific database were then used to calculate the FAV.
Chronic criteria were derived via the final acute-chronic ratios used in each of the updated national criteria
calculations. This precluded the need to create site-specific chronic databases and is the recommended
procedure by the EPA.
The deletion process generated site-specific toxicity databases that were used to calculate a FAV and FCV for
each site. AWQC are based on either direct calculation of the CMC (equal to half of the FAV) and CCC
(equal to the FCV or FAV ÷ FACR), or these values inserted in equations that derives the CMC and CCC for
a given water quality parameter, such as pH or hardness. Table 8-1 provides a summary of these generic
equations.
Water quality information, slopes, intercepts, FAVs, FCVs, and conversion factors were all model parameters
that were defined before solving for the final criterion. Ambient water quality parameters included hardness
for aluminum, copper, and zinc and pH for ammonia. Toxicity modification slopes for each toxicant were
generated in each national update Chapters (3, 5, and 7) using linear regression.
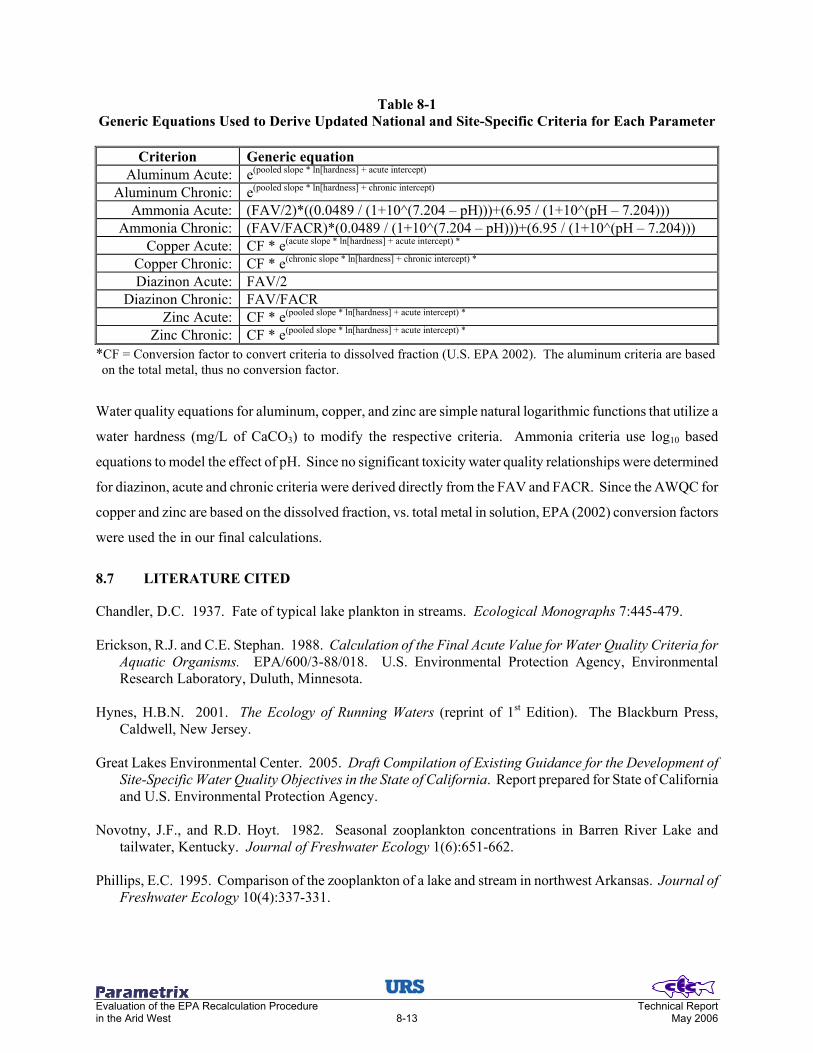
Evaluation of the EPA Recalculation Procedure Technical Report in the Arid West 8-13 May 2006
Table 8-1 Generic Equations Used to Derive Updated National and Site-Specific Criteria for Each Parameter
Criterion Generic equation Aluminum Acute: e(pooled slope * ln[hardness] + acute intercept)
Aluminum Chronic: e(pooled slope * ln[hardness] + chronic intercept) Ammonia Acute: (FAV/2)*((0.0489 / (1+10^(7.204 – pH)))+(6.95 / (1+10^(pH – 7.204)))
Ammonia Chronic: (FAV/FACR)*(0.0489 / (1+10^(7.204 – pH)))+(6.95 / (1+10^(pH – 7.204))) Copper Acute: CF * e(acute slope * ln[hardness] + acute intercept) *
Copper Chronic: CF * e(chronic slope * ln[hardness] + chronic intercept) * Diazinon Acute: FAV/2
Diazinon Chronic: FAV/FACR Zinc Acute: CF * e(pooled slope * ln[hardness] + acute intercept) *
Zinc Chronic: CF * e(pooled slope * ln[hardness] + acute intercept) * *CF = Conversion factor to convert criteria to dissolved fraction (U.S. EPA 2002). The aluminum criteria are based on the total metal, thus no conversion factor.
Water quality equations for aluminum, copper, and zinc are simple natural logarithmic functions that utilize a
water hardness (mg/L of CaCO3) to modify the respective criteria. Ammonia criteria use log10 based
equations to model the effect of pH. Since no significant toxicity water quality relationships were determined
for diazinon, acute and chronic criteria were derived directly from the FAV and FACR. Since the AWQC for
copper and zinc are based on the dissolved fraction, vs. total metal in solution, EPA (2002) conversion factors
were used the in our final calculations.
8.7 LITERATURE CITED
Chandler, D.C. 1937. Fate of typical lake plankton in streams. Ecological Monographs 7:445-479. Erickson, R.J. and C.E. Stephan. 1988. Calculation of the Final Acute Value for Water Quality Criteria for
Aquatic Organisms. EPA/600/3-88/018. U.S. Environmental Protection Agency, Environmental Research Laboratory, Duluth, Minnesota.
Hynes, H.B.N. 2001. The Ecology of Running Waters (reprint of 1st Edition). The Blackburn Press,
Caldwell, New Jersey. Great Lakes Environmental Center. 2005. Draft Compilation of Existing Guidance for the Development of
Site-Specific Water Quality Objectives in the State of California. Report prepared for State of California and U.S. Environmental Protection Agency.
Novotny, J.F., and R.D. Hoyt. 1982. Seasonal zooplankton concentrations in Barren River Lake and
tailwater, Kentucky. Journal of Freshwater Ecology 1(6):651-662. Phillips, E.C. 1995. Comparison of the zooplankton of a lake and stream in northwest Arkansas. Journal of
Freshwater Ecology 10(4):337-331.
Evaluation of the EPA Recalculation Procedure Technical Report in the Arid West 8-14 May 2006
Stephan, C.E., D.I. Mount, D.J. Hansen, J.H. Gentile, G.A. Chapman, and W.A. Brungs. 1985. Guidelines for Deriving Numerical National Water Quality Criteria for the Protection of Aquatic Organisms and Their Uses. PB85-227049. U.S. Environmental Protection Agency, Environmental Research Laboratory, Duluth, MN, Narragansett, RI, and Corvallis, OR.
Thorp, J.H., A.R. Black, K.H. Haag, and J.D. Wehr. 1994. Zooplankton assemblages in the Ohio River:
seasonal, tributary, and navigation dam effects. Canadian Journal of Fisheries and Aquatic Sciences 51:1634-1643.
U.S. Environmental Protection Agency. 1984. Guidelines for Deriving Numerical Aquatic Site-Specific
Water Quality Criteria by Modifying National Criteria. EPA-100/3-84-099. Office of Water, Washington, DC.
U.S. Environmental Protection Agency. 1994. EPA Interim Guidance on Determination and Use of Water-
Effect Ratios for Metals. EPA-823-B-94-001. Office of Water, Washington, DC. U.S. Environmental Protection Agency. 2001. Streamlined Water-Effect Ratio Procedure for Discharges of
Copper. EPA-822-R-01-005. Office of Water, Washington, DC. U.S. Environmental Protection Agency. 2002. National Recommended Water Quality Criteria: 2002.
EPA-822-R-02-047. Office of Water, Washington, DC. Walks, D.J., and H. Cyr. 2004. Movement of plankton through lake-stream systems. Freshwater Biology
49:745-759. Ward, J.V. 1975. Downstream fate of zooplankton form a hypolimnial release mountain reservoir.
Verhandlung für Internatinale Vereinigung Limnologie 19:1798-1804. Wetzel, R.G. 2001. Limnology: Lake and Reservoir Ecosystems, 3rd Edition. Academic Press, San Diego,
California.
Evaluation of the EPA Recalculation Procedure Technical Report in the Arid West 9-1 May 2006
9.0 CASE STUDIES FOR EVALUATION OF THE RECALCULATION PROCEDURE IN ARID WEST EFFLUENT DEPENDENT STREAMS This chapter presents the results from the recalculation procedure for each site and toxicant based on the
calculated FAV and FCV. Comparisons between sites and to the updated national values were conducted at
the FAV and FCV level since these values are normalized to a common water hardness or pH. This approach
allows us to quantify the effect of the recalculation procedure on the foundational criterion, without the
influence of ambient water quality conditions later used to compare the site-specific criteria (Chapter 10).
9.1 ALUMINUM
The derivation of site-specific criteria for each study stream is based on the recalculation methods outlined
above (Chapter 8). Following deletion of non-resident taxa, site-specific toxicity databases were developed
(Appendix 3; Tables 3.1.1 through 3.1.6) and criteria were calculated for each study stream and the two
proposed regions. All values presented below are normalized to hardness = 50 mg/L as CacO3.
9.1.1 Santa Ana River
Following deletion of non-resident taxa, the new site-specific aluminum toxicity database for Santa Ana River
contains 14 species, found in 10 families (Table 9-1). Of these 14 species, six are fish and eight are
invertebrates. The 10 families found in the Santa Ana River-specific database satisfy the AWS-MDRs.
Compared to the updated national database, the deletion process resulted in six species being removed,
including the two most sensitive organisms (the zooplankter, Ceriodaphnia and the trout/salmon, Salmo), and
the next two most sensitive genera have been re-ranked. The most sensitive organism in the Santa Ana River
database is the smallmouth bass, Micropterus dolomieu (retained to represent the non-native largemouth bass,
Micropterus salmoides, present in the Santa Ana River). The SMAV for M. dolomieu was derived from a
single undefined value that was added to the updated national toxicity database (Table 5-2). In site-specific
databases that include M. dolomieu, there might be some question as to the validity of accepting a “greater
than” undefined value as the most sensitive organism. We decided to use this value in this site-specific
database because an organism within the same genus was present at this site and non-lethal toxic effects were
noted, such as lethargy and abnormal mucus production, in fish exposed to the reported concentration of
aluminum at which 20% mortality occured (Kane and Rabeni 1987).

Evaluation of the EPA Recalculation Procedure Technical Report in the Arid West 9-2 May 2006
Table 9-1 Site-Specific Aluminum Acute Toxicity Database, with Ranked
Species Mean Acute Values (SMAV) Specific to Each Study Stream Site-Specific Ranking Santa Cruz River
Species Organism SMAV (µg/L)
Santa Ana
River
Near Nogales*
Near Tucson
Salt/Gila
Rivers
Fountain Creek
South Platte River
SW HP
Tanytarsus dissimilis Midge >192,155 14 9 8 13 15 14 14 15 Lepomis cyanellus Green sunfish >52,274 13 8 7 12 14 13 13 14 Perca flavescens Yellow perch >52,064 12 11 13 12 12 13 Ictalurus punctatus Channel catfish >50,078 11 6 10 12 11 11 12 Physa sp. Snail 32,907 10 7 9 11 10 10 11
Hybognathus amarus Rio Grande silvery minnow >25,075 9 6 8 10 9 9 10
Acroneuria sp. Stonefly >23,628 8 5 7 9 8 8 9 Gammarus pseudolimnaeus Amphipod 23,000 7 5 4 6 8 7 7 8 Girardia tigrina Flatworm >17,355 6 5 7 6 6 7 Pimephales promelas Fathead minnow 13,461 5 4 4 6 5 5 6 Tubifex tubifex Worm 13,373 4 3 3 3 5 4 4 5 Crangonyx pseudogracilis Amphipod 9,190 3 2 2 2 4 3 3 4 Asellus aquaticus Isopod 4,370 2 1 1 3 2 2 3 Micropterus dolomieu Smallmouth bass >3,183 1 1 2 1 1 2 Salmo salar Atlantic salmon 3,154 1 1 Final Acute Value (µg/L) = 2,299 4,370 N/A 2,819 2,118 2,299 2,299 2,118 Final Chronic Value (µg/L) = 459 873 N/A 563 423 459 459 423 * = Did not satisfy the MDR “arid West eight-family rule.” NOTE: Values normalized for hardness = 50 mg/L of CaCO3. SW = southwest region, HP = High Plains region.
Recalculation of the aluminum acute and chronic criteria resulted in values that were slightly lower than the
updated national criteria (Figure 9-1). The recalculated Santa Ana River FAV is 2,299 µg/L, which is almost
300 µg less than the updated national value (2,560 µg). Using our recommended ACR of 5.0039, the
resultant FCV is 459 µg/L.
The Santa Ana River resident species analysis identified one species listed as threatened, Catostomus
santaanae. According to the EPA (1994), toxicological data for listed species or taxonomically similar
organisms must be incorporated into the site-specific database for the protection of a threatened or endangered
species. The Santa Ana River aluminum toxicity database does not contain any toxicity information for the
family Catostomidae. Therefore, following EPA guidance, the next most closely related family, Cyprinidae,
would have to provide potential surrogate species for C. santaanae. Given the ecological similarity of these
two families and the abundance of cyprinids in the Santa Ana River (Chapter 2), this seems a reasonable
approach.

Evaluation of the EPA Recalculation Procedure Technical Report in the Arid West 9-3 May 2006
0 100 200 300 400 500
Hardness (mg/L as CaCO 3)
0
500
1000
1500
2000
2500
3000
3500
4000
4500
Chr
onic
Alu
min
um C
riter
ia(µ
g to
tal A
l/L)
Updated Chronic CriteriaSanta Ana River, South Platte River, Southwest regionSanta Cruz near NogalesSalt/Gila riversFountain Creek, High Plains region
Figure 9-1 Comparison of Site-Specific Chronic Aluminum Criteria to
the Updated National Criteria at Varying Hardness
9.1.2 Santa Cruz River
9.1.2.1 Santa Cruz near Nogales
The Santa Cruz River near the Nogales site-specific database contains aluminum toxicity data for nine species
in seven Families (Table 9-1). Of the nine species, three are fish and six are invertebrates. Because a family
not already represented in the Phylum Chordata and a second insect did not exist, the AWS-MDRs were not
met, even after three benthic crustaceans were re-added after the deletion process. Only one species was
common between the resident species list and the updated national database due to the low diversity at this
site.
Compared to the updated national database, 11 non-resident species had been removed including three of the
most sensitive genera. Since the site-specific database did not meet the AWS-MDRs and more than eight
families were present at the site, we defaulted the FAV to the SMAV of the most sensitive organism in the
remaining database (EPA 1994). The most sensitive organism was Asellus aquaticus, resulting in a FAV of
4,370 µg/L. Using our recommended ACR of 5.0039, the resultant FCV is 873 µg/L.
The Santa Cruz River near Nogales resident species analysis identified one possible threatened or endangered
species, Poeciliopsis occidentalis, as a resident at this site. The site-specific database for aluminum in the

Evaluation of the EPA Recalculation Procedure Technical Report in the Arid West 9-4 May 2006
Santa Cruz River near Nogales does not contain any fish species in the listed species, genus, family, or order
of the species; therefore, an unrelated fish in the site-specific toxicity database (e.g., P. promelas) would have
to serve as a surrogate, based on EPA recalculation guidance. While not a preferred surrogate, this is basically
the only reasonable species available.
9.1.2.2 Santa Cruz near Tucson
The Santa Cruz River near Tucson revised site-specific database included aluminum toxicity data for eight
species of aquatic organisms found in seven families (Table 9-1). Since the database includes just seven
families, the AWS-MDRs were not satisfied. Because of the limited Families present in the Santa Cruz River
near Tucson site-specific database, setting the FAV to the most sensitive SMAV or using the recalculation
procedure to generate a FAV was not possible. Therefore, it might be preferable to consider the southwest
arid stream regional site-specific analysis (described below in Section 9.1.7) when developing site-specific
aluminum criteria for Santa Cruz River near Tucson. The Santa Cruz River near Tucson resident species
analysis did not identify any threatened or endangered species.
9.1.3 Salt/Gila Rivers
The Salt/Gila Rivers species composition analysis resulted in a site-specific database that includes aluminum
toxicity data for 13 species found in 10 families (Table 9-1). The AWS-MDRs were met after the addition of
Acroneuria sp. Other than providing a second insect family, this nonresident species would be a good
surrogate for other potentially sensitive insects found at the site and not in the toxicity database.
The most sensitive organism in the Salt/Gila Rivers’ database was Micropterus dolomieu. Reasons for
retaining this organism in the database are similar to that reported for Santa Ana River, as discussed in
Section 9.1. The FAV for the Salt/Gila Rivers is 2,819 µg/L. Using our recommended ACR of 5.0039, the
resultant FCV is 563 µg/L, again with both values at hardness = 50 mg/L.
The Salt/Gila Rivers’ resident species analysis identified five possible threatened or endangered species. The
five species are Xyauchen texanus, Cyprinodon macularus, Poeciliopsis occidentalis, Gila elegans, and
Rhinichthys cobitis. The Salt/Gila Rivers aluminum database does not contain any Catostomids; therefore, a
potential surrogate species for X. texanus would have to an unrelated species, such as a cyprinid. The updated
national database also lacks species in the Class Cyprinodontiformes that could be surrogates for
C. macularus and P. occidentalis. The site-specific database does contain aluminum toxicity data on
Pimephales promelas, a species that could represent G. elegans and R. cobitis, as these species could reside

Evaluation of the EPA Recalculation Procedure Technical Report in the Arid West 9-5 May 2006
together in warm water streams and rivers, and all are Cyprinids. However, as with the Santa Ana River,
P. promelas would also need to serve as a surrogate for the razorback sucker (Xyrauchen).
9.1.4 Fountain Creek
The Fountain Creek site-specific database contains aluminum toxicity data for 15 species in 11 Families. Of
the 15 species, seven are fish and eight are invertebrates (Table 9-1). Because of the diversity of the
9 families present in the site-specific database, the AWS-MDRs were satisfied (plus, inclusion of a “resident”
salmonid). Compared to the updated national database, only five species had been removed that included the
most sensitive organism (Ceriodaphnia), and the other three most sensitive genera have been re-ranked. The
most sensitive organism in the Fountain Creek database was Salmo salar, followed by Micropterus dolomieu–
both retained to represent species found at the site without toxicity data.
Recalculation of the aluminum acute and chronic criteria resulted in values that were more restrictive than the
revised national criteria (Figure 9-1). The recalculated Fountain Creek FAV and FCV are 2,118 and 423
µg/L, respectively. The FAV for Fountain Creek was one of the lowest of all sites. This was directly
associated with the addition of the second most sensitive organisms in the updated national database
(S. salar)– which was retained to represent brown trout (Salmo trutta) which is present at the site, but possibly
more “transient” than “resident” (see discussion in Chapter 2).
9.1.5 South Platte River
The South Platte River’s site-specific database has the second greatest number of taxa of the five sites in our
analysis. Of the 14 species in 11 families, the database includes acute values for six fish and eight
invertebrates (Table 9-1). The South Platte River site-specific database satisfies all of the MDRs, including
the AWS-MDRs. The most sensitive organism in the South Platte River database was Micropterus dolomieu.
Recalculation of the aluminum acute and chronic criteria resulted in values that were lower than the revised
national criteria. The recalculated South Platte River FAV is 2,299 µg/L. Using our recommended ACR of
5.0039 and the above FAV resulted in an FCV of 459 µg/L (again, at hardness = 50 mg/L).
9.1.6 Southwest Arid Stream Systems (CA, AZ, NV, NM)
The Southwest arid stream region species composition analysis resulted in a site-specific database containing
aluminum toxicity data for 14 species found in 11 families. The Southwest region site-specific database
contains six species of fish and eight invertebrate species (Table 9-1). Because of the diversity of organisms
in the database, the AWS-MDRs were satisfied.

Evaluation of the EPA Recalculation Procedure Technical Report in the Arid West 9-6 May 2006
The four most sensitive species were the same as in the Santa Ana and South Platte Rivers’ site-specific
toxicity databases. Recalculation of the aluminum acute and chronic criteria resulted in values that were
lower than the revised national criteria and were based on a toxicity database more robust than most sites that
are in the Southwest region (Fig. 9-1). The recalculated Southwest regional FAV is 2,299 µg/L. Using our
recommended ACR of 5.0039, the resultant FCV is 459 µg/L (at hardness = 50 mg/L).
Since the Southwest region species list was created from a pooled river species list, the regional list included
endangered or threatened species found in those rivers. The regional species list contained two Catostomid,
one Poeciliid, and one Cyprinodontid, Catostomus santaanae, Xyauchen texanus, Poeciliopsis occidentalis,
and Cyprinodont macularus, respectively, in which no acceptable surrogates could be added to the regional
database. However, available potential surrogates for the remaining listed species, Gila elegans and
Rhinichthys cobitis, could be accounted for by Pimephales promelas, which is found in the updated national
and regional database, because they are all Cyprinids and occur together at most sites in this region.
9.1.7 High Plains Arid Stream Systems (WY, CO, NM)
The High Plains arid stream regional species composition analysis resulted in a site-specific database that
presents aluminum toxicity for 15 species found in 11 families. The High Plains regional site-specific
database contains seven species of fish and eight invertebrate species. Because of the diversity of organisms
in the database, the AWS-MDRs were satisfied. The four most sensitive ranked species were the same as in
Fountain Creek, with Salmo salar ranked first, followed by Micropterus dolomieu.
Recalculation of the aluminum acute and chronic criteria resulted in values that were lower than the revised
national criteria and slightly lower than the Southwest region. The recalculated High Plains regional FAV
and FCV normalized to hardness = 50 mg/L are 2,118 and 423 µg/L, respectively. These derived AWQC are
comparable to the criteria derived for each river in the region. These results indicate that High Plains regional
AWQC can perhaps better be applied to individual rivers and streams within this region than can the
Southwest regional aluminum criteria to streams in that region. The High Plains regional species list did not
identify any threatened or endangered species; therefore, identifying surrogate species is not necessary.
9.2 AMMONIA
The derivation of site-specific criteria for each study stream is based on the recalculation methods outlined in
Chapter 8. Following deletion of non-resident taxa, site-specific toxicity databases were developed
(Appendix 3; Tables 3.2.1 through 3.2.6) and criteria calculated for each study stream and the two proposed
regions. All values presented below are normalized to pH 8 for comparisons between sites.

Evaluation of the EPA Recalculation Procedure Technical Report in the Arid West 9-7 May 2006
9.2.1 Santa Ana River
As a result of the step-wise deletion process for compiling site-specific databases, 40 species representing
25 families were included in the Santa Ana River ammonia database. The robust database satisfies the AWS-
MDRs, with the four most sensitive species in the Santa Ana River database being Notemigonus crysoleucas,
Gambusia affinis, Etheostoma spectable, and Cyprinella whipplei (Table 9-2). Collectively, these fish are
four of the six most sensitive species in the updated warm water database. The Santa Ana database also
contains Catostomus platyrynchus, which serves as a surrogate species for the endangered Santa Ana sucker
(Catostomus santaanae).
Table 9-2 Site-Specific Preliminary Updated Ammonia Acute Toxicity Database
Ranked Species Mean Acute Values (SMAV) Site-Specific Ranking Santa Cruz River
Species Common Name SMAV (TA-N
mg/L@ pH 8)
Santa Ana
River
Near Nogales
Near Tucson*
Salt/Gila Rivers
Fountain Creek
South Platte River
SW HP
Orconectes immunis Calico crayfish 770.46 33 19 40 44 46 Erythromma najas Damselfly 308.62 40 32 18 38 39 43 47 45 Philarctus quaeris Caddisfly 282.09 39 31 17 37 38 42 46 44 Ephemerella grandis Mayfly 189.16 38 30 37 41 45 43 Caecidotea racovitzai Sowbug 165.94 37 29 16 36 40 44 42 Callibaetis skokianus Mayfly 164.08 36 28 15 36 35 39 43 41 Lestes sponsa Dragonfly 139.48 35 27 35 34 38 42 40 Stenelmis sexlineata Riffle beetle 113.17 34 26 14 34 33 37 41 39 Sympetrum flaveolum Dragonfly 100.50 33 25 32 36 40 38 Tubifex tubifex Tube worm 97.82 32 24 13 33 31 35 39 37 Gammarus pulex Amphipod 95.40 31 23 12 32 30 34 38 36 Baetis rhodani Mayfly 94.19 30 22 11 31 29 33 37 35 Crangonyx sp. Amphipod 92.10 21 10 30 28 36 34 Crangonyx seudogracillis Amphipod 83.19 20 9 29 27 35 33 Arcynopteryx parallela Stonefly 77.10 29 8 26 32 34 32 Callibaetis sp. Mayfly 75.93 28 19 7 28 25 31 33 31 Physa gyrina Snail 74.48 27 18 27 24 30 32 30 Cyprinodon sp. Pupfish 63.79 26 23 29 31 29 Helisoma trivolvis Snail 60.84 26 17 25 22 28 30 28 Cottus bairdi Mottled sculpin 51.73 25 29 Hyalella azteca Amphipod 51.34 24 16 6 24 21 27 28 27 Catostomus commersonii White sucker 45.82 23 15 23 20 26 27 26 Cyprinella lutrensis Red shiner 45.65 22 14 22 19 25 26 25 Pimephales promelas Fathead minnow 41.89 21 13 21 18 24 25 24

Evaluation of the EPA Recalculation Procedure Technical Report in the Arid West 9-8 May 2006
Table 9-2 (Continued)
Site-Specific Preliminary Updated Ammonia Acute Toxicity Database Ranked Species Mean Acute Values (SMAV)
Site-Specific Ranking Santa Cruz River
Species Common Name
SMAV (TA-N
mg/L@ pH 8)
Santa Ana
River
Near Nogales
Near Tucson*
Salt/Gila Rivers
Fountain Creek
South Platte River
SW HP
Orconectes naias Crayfish 41.27 12 5 17 23 23 Micropterus dolomieui Smallmouth bass 36.90 20 16 22 24 22 Ictalurus punctatus Channel catfish 35.81 20 4 19 15 21 23 21 Musculium transversum Fingernail clam 35.65 19 20 22 20 Poecilia reticulata Guppy 33.15 18 11 18 14 19 21 Dendrocoelom lacteum Flat worm 32.82 17 17 13 18 20 19 Catostomus platyrynchus Mountain sucker 31.71 16 10 16 12 17 19 18 Morone americana White perch 30.89 15 15 18 Cyprinus carpio Common carp 30.32 14 9 14 11 16 17 17 Lepomis cyanellus Green sunfish 30.31 13 8 3 13 10 15 16 16
Procambarus clarkii Red swamp crayfish 30.05 12 7 2 14 15 15
Campostoma anomalum Central stoneroller 26.97 11 6 12 9 13 14 14
Sander vitreus Walleye 25.89 10 12 13 13 Lepomis machrochirus Bluegill 24.16 9 11 8 11 12 12 Salmo trutta Brown trout 23.74 7 11
Hybognathus amarus Rio Grande silvery minnow 20.26 8 5 10 6 10 11 10
Micropterus salmoides Largemouth bass 20.03 7 9 9 10 9 Chasmistes brevirostris Shortnose sucker 19.61 8 8 9 8 Cyprinella spilopterus Spotfin shiner 19.51 6 4 7 5 7 8 7 Morone chrysops White bass 19.16 5 6 7 Cyprinella whipplei Steelcolor shiner 18.83 4 3 5 4 6 6 6
Etheostoma spectabile Orangethroat darter 18.14 3 3 5 5 5
Lepomis gibbosus Pumpkinseed 18.05 4 4 4 4 Deltistes luxatus Lost river sucker 16.01 3 3 3 3
Gambusia affinis Western mosquitofish 15.25 2 2 1 2 2 2 2 2
Notemigonus crysoleucas Golden shiner 14.67 1 1 1 1 1 1 1 Final Acute Value (mg/L) = 16.1 15.7 15.3 15.5 16.1 15.8 16.0 15.9
Final Chronic Value (mg/L) = 3.3 3.2 3.1 3.2 3.3 3.2 3.3 3.2
NOTES: *Did not satisfy the MDR Aarid West eight-family rule”, therefore the FAV was set to the most sensitive species in database SW = Southwest Region HP = High Plains Region

Evaluation of the EPA Recalculation Procedure Technical Report in the Arid West 9-9 May 2006
The 5th percentile derivation process results in a site-specific pH-normalized FAV of 16.1 mg/L TA-N, which
is slightly greater than the updated acute warm water FAV (15.7 mg/L TA-N). This value results in site-
specific acute criterion that is slightly less restrictive throughout a range of pH values from 6.5 to 9.0 than
updated warm water criterion. Using the proposed FACR methodology to derive chronic criterion, the FCV
is 3.29 mg/L TA-N. This value results in site-specific chronic criterion that is less restrictive throughout a
range of pH values than updated warm water criterion (Figure 9-2).
7 7.5 8 8.5 9
pH
0
2
4
6
8
10
12
14
16
Chr
onic
Am
mon
ia C
riter
ia(m
g TA
-N/L
)
Updated Warm Water CriteriaSalt & Gila riversSanta Cruz River - NogalesSanta Cruz River - TucsonSanta Ana RiverFountain CreekSouth Platte River
Figure 9-2
Site-Specific Chronic Ammonia Criteria as a Function of pH (Acute Criteria Distribution is Similar to Chronic)
9.2.2 Santa Cruz River
9.2.2.1 Santa Cruz Near Nogales
The site-specific database contains 33 species representing 18 families; however, it initially failed to meet the
AWS-MDRs because benthic crustaceans have not been observed at this study site. For reasons discussed
earlier, all eight species in the Class Malacostroca were added to the site-specific database to meet the MDRs
and allow derivation of site-specific criteria. The four most sensitive species in the modified site-specific
database include N. crysoleucas, G. affinis, C. whipplei, and N. spiloperus (Table 9-2). The modified FAV is
15.7 mg/L TA-N, which would result in acute criterion the same as the updated warm water criteria
concentration. The FACR approach for developing site-specific chronic criteria results in a FCV of 3.20

Evaluation of the EPA Recalculation Procedure Technical Report in the Arid West 9-10 May 2006
mg/L TA-N, which would also result in criterion that is the same as the updated warm water value
(Figure 9-2).
9.2.2.2 Santa Cruz near Tucson
The site-specific database contains 19 species, representing 13 Families of aquatic organisms. This site did
not meet the AWS-MDRs even after addition of the eight benthic crustaceans because cyprinids have not
been observed at this study site. Therefore, by default, the site-specific criteria shall be based upon the lowest
SMAV in the site-specific database. In this circumstance, the western mosquito fish (Gambusia affinis) is the
most sensitive species in the database; thus, the FAV is 15.3 mg/L TA-N and the FCV is 3.12 mg/L TA-N.
Arguably, deriving site-specific criteria using a non-native, nuisance species is problematic. However, the G.
affinis (SMAV)-driven criteria is functionally the same as the proposed updated warm water criterion (FAV
15.7 mg/L TA-N). Thus, the mosquito fish remained as the driving force in the Santa Cruz River near Tucson
database.
9.2.3 Salt/Gila Rivers
The site-specific ammonia database for the Salt/Gila Rivers contains 38 species representing 19 families of
aquatic organisms, and satisfies the AWS-MDRs. The four most sensitive genera include Notemigonus
crysoleucas, Gambusia affinis, Deltiste luxatus, and Lepomis gibbosus (Table 9-2), which are also the four
most sensitive fish species in the warm water database. The site-specific FAV (15.5 mg/L TA-N, again at
pH 8) results in an acute criterion, which is similar to the updated warm water criterion. The FACR approach
to deriving site-specific chronic criteria also results in criterion similar to the updated warm water limits
(Figure 9-2), with an FCV of 3.2 mg/L.
The Salt/Gila Rivers also contain five threatened and endangered fish species, which include Xyrauchen
texanus, Gila elegans, Rhinichthys cobitis, Cyprinodon macularius, and Poeciliopsis occidentalis. Fish
species that serve as surrogates for these endangered species include: Deltistes luxatus (for X. texanus),
which is also a threatened and endangered species, N. crysoleucas (for G. elegans and R. cobitis), which is the
most sensitive fish in the updated acute database, Cyprinodon sp. (for C. macularius), and G. affinis (for
P. occidentalis).
9.2.4 Fountain Creek
The site-specific database contains 40 species representing 25 families, and satisfies the AWS-MDRs. The
database is unique among the arid West sites because it contains Salmo trutta, a coldwater species. This fish
was retained for recalculation purposes, even though it may potentially be considered a transient (see
discussion in Chapter 4). However, this species had a minimal affect on the FAV because it was the seventh

Evaluation of the EPA Recalculation Procedure Technical Report in the Arid West 9-11 May 2006
most sensitive species in the database. The four most sensitive species in this database are N. crysoleucas,
G. affinis, E. spectabile, and C. whipplei (Table 9-2). As a result, the FAV was 16.1 mg/L TA-N, which led
to site-specific acute criterion less restrictive than the updated warm water limits. Similar to the other arid
West recalculations, the FACR approach resulted in chronic criterion less restrictive over a range of pH when
compared to the updated warm water limits (Figure 9-2), with an FCV of 3.3 mg/L.
9.2.5 South Platte River
The site-specific South Platte River ammonia database contained the largest number of species of the selected
arid West study sites. A total of 44 species representing 24 Families were included in the database, which
satisfies the AWS-MDRs. The four most sensitive genera include N. crysoleucas, G. affinis, D. luxatus, and
L. gibbosus, which are also the four most sensitive fish in the updated warm water database. As a result, the
site-specific FAV is 15.8 mg/L TA-N, which leads to site-specific acute criterion that is similar to the updated
warm water limits. Again, the FACR derived chronic criterion is similar to updated warm water limits
(Figure 9-2), with a normalized FCV of 3.2 mg/L.
9.2.6 Southwest Arid Stream Systems (CA, AZ, NV, NM)
Site-specific ammonia toxicity databases for the Santa Ana River, Santa Cruz River (near Nogales and near
Tucson), Salt/Gila Rivers were combined to form a Southwest region database. The Southwest region
database contains 47 species representing 27 families of aquatic organisms, which satisfies the AWS-MDRs.
The resulting FAV of 16.0 mg/L TA-N derives an acute criterion very similar to the updated warm water
acute criterion. Again, the derivation of chronic criteria using the FACR results in criterion very similar to
the updated warm water limits (Figure 9-3), with a normalized FCV of 3.3 mg/L. Since the Southwest region
species list was crated from a pooled river resident species list, the regional list included all six threatened or
endangered species found in those rivers. The site-specific database also contains all of the species that were
identified as surrogates in each of the pooled rivers; therefore, surrogate species for the Southwest region are
similar, and were identified in previous sections.

Evaluation of the EPA Recalculation Procedure Technical Report in the Arid West 9-12 May 2006
7 7.5 8 8.5 9
pH
0
2
4
6
8
10
12
14
16
Chr
onic
Am
mon
ia C
riter
ia(m
g TA
-N/L
)Updated Warm Water CriteriaSouthwest regionHigh Plains region
Figure 9-3 Regional Chronic Ammonia Criteria as a Function of pH
Compared to the Updated Warm Water Criteria (Acute Criteria Distribution is Similar to Chronic.)
9.2.7 High Plains Arid Stream Systems (WY, CO, NM)
Site-specific databases for Fountain Creek and South Platte River were combined to create the High Plains
region database. Given the similarities of the regional toxicity databases, the High Plains database results in
criteria very similar to the Southwest region. The High Plains database contains 46 species representing
26 families of aquatic organisms, which satisfies the AWS-MDRs. The four most sensitive species are the
same as the Southwest region, and results in a FAV of 15.9 mg/L TA-N. Again, both the regional acute and
chronic criteria are very similar to the updated warm water criterion (Figure 9-3), with a normalized FCV of
3.2 mg/L.
9.3 COPPER
The derivation of site-specific copper criteria for each study stream is based on the recalculation methods
outlined above (Chapter 8). Following deletion of non-resident taxa, site-specific toxicity databases were
developed (Appendix 3; Tables 3.3.1 through 3.3.6) and criteria calculated for each study stream and the two
proposed regions. All values presented below are normalized to hardness = 50 mg/L as CacO3, not to site
hardness, which is presented in Chapter 10.

Evaluation of the EPA Recalculation Procedure Technical Report in the Arid West 9-13 May 2006
A general deletion common to all sites includes the removal of zooplankton (including cladocerans) due to
their transient nature in these streams (see Section 10.2). Cladocerans accounted for the four most sensitive
genera and eight most sensitive species in the updated national toxicity database for copper. The lack of
zooplankton in the site-specific and regional databases shifts the national criterion, which is highly influenced
by cladocerans, to site-specific criteria that better reflect the sensitivity of taxa that are more representative of
the resident species of arid West effluent-dependent/dominated streams. Discussions of the resulting site-
specific values are found below.
9.3.1 Santa Ana River
The site-specific acute copper toxicity database for the Santa Ana River contains 37 species. Given the level
of identification (some invertebrate taxa are only identified to Order), these species represent at least
22 families and meet the AWS-MDRs (Table 9-3). The four most sensitive species in the site-specific
database include Gammarus pulex, Hyalella azteca, Ephoron virgo, and G. pseudolimnaeus. All of these
species are macroinvertebrates, which confirms the sensitivity of invertebrates to copper. The resulting FAV
and FCV are 17.03 µg/L and 5.87 µg/L (at hardness = 50 mg/L), respectively, which are approximately 76%
greater than the updated copper values presented in Chapter 7 of this report (Figures 9-4 and 9-5).
The resident species analysis identified one threatened species, Catostomus santaanae, at this site. Although
this species is not in the updated national acute toxicity database, the database contains C. latipinnis
(Table 9-3), which is a potential surrogate species for C. santaanae.
Table 9-3 Site-Specific Acute Toxicity Databases for Copper, Ranked Species Mean Acute Values (SMAV)
Site-Specific Ranking
Santa Cruz River Species Organism SMAV
(µg/L) Santa Ana
River Near Nogales
Near Tucson
*
Salt/Gila
Rivers
Fountain Creek
South Platte River
SW HP
Notemigonus crysoleucas Golden shiner 59,017 41 43 47 51 52 52 Acroneuria lycorias
Stonefly
9,408
37
23
46
50
51
51
Corbicula manilensis Asiatic clam
7,485
36
49
50
50
Trichoptera spp. Caddisfly
6,200
35
40
22
42
45
48
49
49
Morone americana White bass
5,843
41
48
Zygoptera spp. Damselfly
4,600
34
39
21
40
44
47
47
48
Procambarus clarkii Crayfish
2,073
33
38
20
46
46
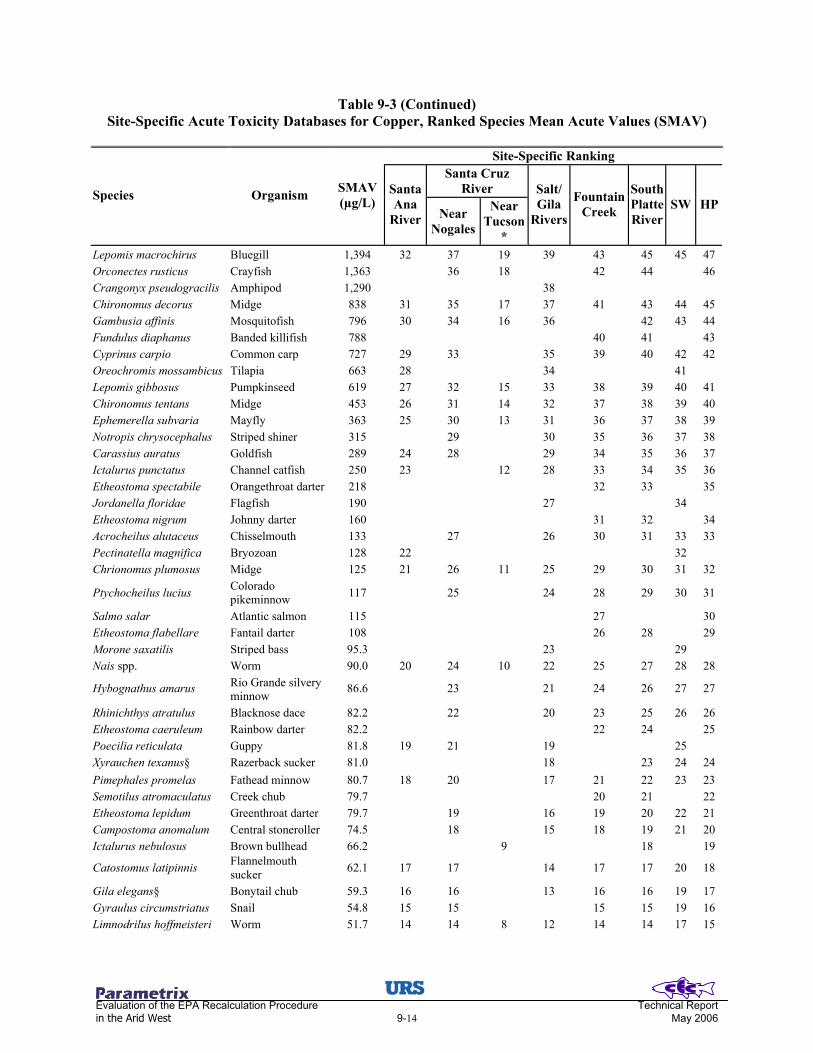
Evaluation of the EPA Recalculation Procedure Technical Report in the Arid West 9-14 May 2006
Table 9-3 (Continued) Site-Specific Acute Toxicity Databases for Copper, Ranked Species Mean Acute Values (SMAV)
Site-Specific Ranking
Santa Cruz River Species Organism SMAV
(µg/L) Santa Ana
River Near Nogales
Near Tucson
*
Salt/Gila
Rivers
Fountain Creek
South Platte River
SW HP
Lepomis macrochirus
Bluegill
1,394
32
37
19
39
43
45
45
47
Orconectes rusticus Crayfish
1,363
36
18
42
44
46
Crangonyx pseudogracilis Amphipod
1,290
38
Chironomus decorus Midge
838
31
35
17
37
41
43
44
45
Gambusia affinis Mosquitofish
796
30
34
16
36
42
43
44
Fundulus diaphanus Banded killifish
788
40
41
43
Cyprinus carpio Common carp
727
29
33
35
39
40
42
42
Oreochromis mossambicus Tilapia
663
28
34
41
Lepomis gibbosus Pumpkinseed
619
27
32
15
33
38
39
40
41
Chironomus tentans Midge
453
26
31
14
32
37
38
39
40
Ephemerella subvaria Mayfly
363
25
30
13
31
36
37
38
39
Notropis chrysocephalus Striped shiner
315
29
30
35
36
37
38
Carassius auratus Goldfish
289
24
28
29
34
35
36
37
Ictalurus punctatus Channel catfish
250
23
12
28
33
34
35
36
Etheostoma spectabile Orangethroat darter
218
32
33
35
Jordanella floridae Flagfish
190
27
34
Etheostoma nigrum Johnny darter
160
31
32
34
Acrocheilus alutaceus Chisselmouth
133
27
26
30
31
33
33
Pectinatella magnifica Bryozoan
128
22
32
Chrionomus plumosus Midge
125
21
26
11
25
29
30
31
32
Ptychocheilus lucius
Colorado pikeminnow
117
25
24
28
29
30
31
Salmo salar
Atlantic salmon
115
27
30
Etheostoma flabellare Fantail darter
108
26
28
29
Morone saxatilis Striped bass
95.3
23
29
Nais spp. Worm
90.0
20
24
10
22
25
27
28
28
Hybognathus amarus Rio Grande silvery minnow 86.6 23 21 24 26 27 27
Rhinichthys atratulus
Blacknose dace
82.2
22
20
23
25
26
26
Etheostoma caeruleum Rainbow darter
82.2
22
24
25
Poecilia reticulata Guppy
81.8
19
21
19
25
Xyrauchen texanus§ Razerback sucker
81.0
18
23
24
24
Pimephales promelas Fathead minnow
80.7
18
20
17
21
22
23
23
Semotilus atromaculatus Creek chub
79.7
20
21
22
Etheostoma lepidum Greenthroat darter
79.7
19
16
19
20
22
21
Campostoma anomalum Central stoneroller
74.5
18
15
18
19
21
20
Ictalurus nebulosus Brown bullhead
66.2
9
18
19
Catostomus latipinnis Flannelmouth sucker 62.1 17 17 14 17 17 20 18
Gila elegans§
Bonytail chub
59.3
16
16
13
16
16
19
17
Gyraulus circumstriatus Snail
54.8
15
15
15
15
19
16
Limnodrilus hoffmeisteri Worm
51.7
14
14
8
12
14
14
17
15
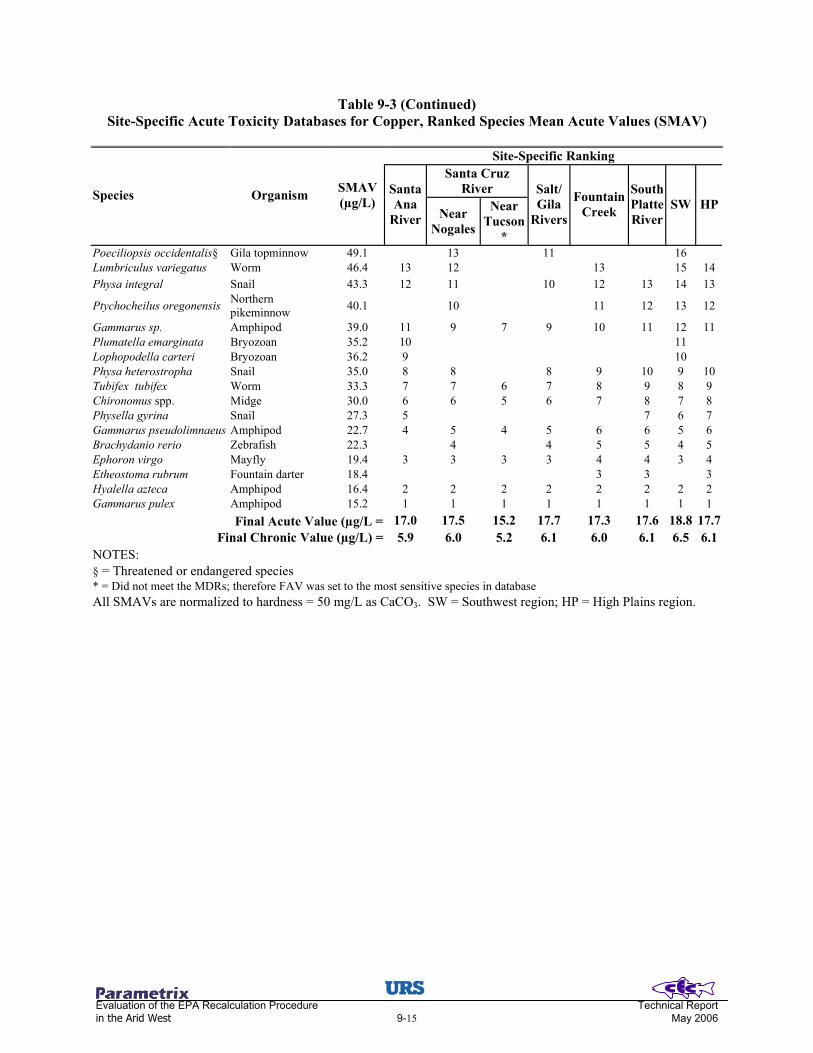
Evaluation of the EPA Recalculation Procedure Technical Report in the Arid West 9-15 May 2006
Table 9-3 (Continued) Site-Specific Acute Toxicity Databases for Copper, Ranked Species Mean Acute Values (SMAV)
Site-Specific Ranking
Santa Cruz River Species Organism SMAV
(µg/L) Santa Ana
River Near Nogales
Near Tucson
*
Salt/Gila
Rivers
Fountain Creek
South Platte River
SW HP
Poeciliopsis occidentalis§ Gila topminnow 49.1 13 11 16 Lumbriculus variegatus Worm 46.4 13 12 13 15 14 Physa integral
Snail
43.3
12
11
10
12
13
14
13
Ptychocheilus oregonensis Northern pikeminnow 40.1 10 11 12 13 12
Gammarus sp. Amphipod 39.0 11 9 7 9 10 11 12 11 Plumatella emarginata Bryozoan 35.2 10 11 Lophopodella carteri Bryozoan 36.2 9 10 Physa heterostropha Snail 35.0 8 8 8 9 10 9 10 Tubifex tubifex Worm 33.3 7 7 6 7 8 9 8 9 Chironomus spp. Midge 30.0 6 6 5 6 7 8 7 8 Physella gyrina Snail 27.3 5 7 6 7 Gammarus pseudolimnaeus Amphipod 22.7 4 5 4 5 6 6 5 6 Brachydanio rerio Zebrafish 22.3 4 4 5 5 4 5 Ephoron virgo Mayfly 19.4 3 3 3 3 4 4 3 4 Etheostoma rubrum Fountain darter 18.4 3 3 3 Hyalella azteca Amphipod 16.4 2 2 2 2 2 2 2 2 Gammarus pulex Amphipod 15.2 1 1 1 1 1 1 1 1
Final Acute Value (µg/L = 17.0 17.5 15.2 17.7 17.3 17.6 18.8 17.7
Final Chronic Value (µg/L) = 5.9 6.0 5.2 6.1 6.0 6.1 6.5 6.1NOTES: § = Threatened or endangered species * = Did not meet the MDRs; therefore FAV was set to the most sensitive species in database All SMAVs are normalized to hardness = 50 mg/L as CaCO3. SW = Southwest region; HP = High Plains region.

Evaluation of the EPA Recalculation Procedure Technical Report in the Arid West 9-16 May 2006
0 100 200 300 400 500
Hardness (mg/L as CaCO 3)
0
20
40
60
80
100
Acu
te C
oppe
r Crit
eria
(µg
diss
olve
d C
u/L)
Updated National Acute CriteriaSanta Ana RiverSanta Cruz near NogalesSanta Cruz near TucsonSalt/Gila rivers
Fountain CreekSouth Platte RiverSouthwest regionHigh Plains region
Figure 9-4
Comparison of Site-Specific Acute Copper Criteria to the Updated National Acute Copper Criteria at Varying Hardness Values
0 100 200 300 400 500
Hardness (mg/L as CaCO 3)
0
5
10
15
20
25
30
Chr
onic
Cop
per C
riter
ia(µ
g di
ssol
ved
Cu/
L)
Updated National ChronicSanta Ana RiverSanta Cruz near NogalesSanta Cruz near TucsonSalt/Gila rivers
Fountain CreekSouth Platte RiverSouthwest regionHigh Plains region
Figure 9-5
Comparison of Site-Specific Chronic Copper Criteria to the Updated National Chronic Copper Criteria at Varying Hardness Values

Evaluation of the EPA Recalculation Procedure Technical Report in the Arid West 9-17 May 2006
9.3.2 Santa Cruz River
Both river segments (near Nogales and near Tucson) initially did not meet the AWS-MDRs since benthic
crustaceans are not included in the resident species list. Given that both sites contain other benthic
macroinvertebrates as resident taxa, which suggests that the appropriate habitat exists, we determined benthic
crustaceans could occur at these sites. Therefore, two crayfish (Orconectes rusticus, and Procambarus
clarkii) and four amphipods (Hyalella azteca, Gammarus sp., G. pulex, and G. pseudolimnaeus)—retained at
genus level or lower at the other arid West sites—were retained in the Santa Cruz calculations. An additional
code not previously used by the U.S. EPA of “R” (“retained”) was assigned to these species in Appendix 3 of
this report.
9.3.2.1 Santa Cruz near Nogales
The resulting site-specific acute copper toxicity database for the Santa Cruz River near Nogales contains 41
species that represent at least 15 Families and meet the AWS-MDRs. The four most sensitive species in the
database include G. pulex, H. azteca, E. virgo, and Brachydanio rerio (Table 9-3). Although the genus
Brachydanio does not reside at this site, this species—in addition to all genera in the Family Cyprinidae—
were retained to represent Agosia chrysogaster, which is a resident species without copper toxicity data. The
resulting FAV and FCV are 17.48 and 6.03 µg/L, respectively, which are approximately 81% greater than the
updated copper values presented in Chapter 7 of this report (Figures 9-4 and 9-5).
One endangered species, Poeciliopsis occidentalis, was identified as a resident in the Santa Cruz River near
Nogales site. Acute copper toxicity data are available for this species, which ranks as the 13th most sensitive
of the 41 species at this site (Table 9-3).
9.3.2.2 Santa Cruz near Tucson
The resulting site-specific acute copper toxicity database for the Santa Cruz River near Tucson contains 23
species, representing 12 Families (Table 9-3), which is the most limited database of all sites under
consideration for recalculation. The resulting Families do not meet the AWS-MDRs, since an organism
within the Family Cyprinidae does not reside at the site. The four most sensitive species in this database
(G. pulex, H. azteca, Ephron virgo, and G. pseudolimnaeus) are identical to the Santa Ana site-specific
database (Table 9-3). Since the site-specific database does not meet the AWS-MDRs and at least eight
Families are represented, the FAV defaults to the SMAV of the most sensitive species in the site-specific
database. The resulting FAV and FCV are 15.2 and 5.2 µ/L, respectively. These values are the most
restrictive of all of the site-specific copper recalculations, yet are still approximately 57% greater than the
updated copper values presented in Chapter 7 of this report.
Evaluation of the EPA Recalculation Procedure Technical Report in the Arid West 9-18 May 2006
9.3.3 Salt/Gila Rivers
The only documentation of benthic crustaceans for the Salt/Gila Rivers is the presence of the Order
Amphipoda. Therefore, all species within this Order were retained in the site-specific copper toxicity
database. The resulting site-specific acute copper toxicity database for the Salt/Gila Rivers contains 39
species, representing at least 18 Families, and meets the AWS-MDRs (Table 9-3). The four most sensitive
species in the database include Gammarus pulex, Hyalella azteca, Ephoron virgo, and Brachydanio rerio.
Once again, B. rerio is not a resident species at the site, yet was retained—in addition to all genera in the
Family Cyprinidae that were not already in the site-specific database—to represent the five genera of
Cyprinids that are found at the site without copper toxicity data. The resulting FAV and FCV are 17.72 and
6.11 µg/L, respectively, which are approximately 85% greater than the updated copper values presented in
Chapter 7 of this report (Figures 9-4 and 9-5).
The Salt/Gila Rivers resident species analysis identified five threatened or endangered species including
Xyrauchen texanus, Gila elegans, Rhinichthys cobitis, Cyprinodon macularius, and Poeciliopsis occidentalis.
Three of these species, X. texanus, G. elegans, and P. occidentalis, contain acute copper toxicity data are
already represented in the site-specific database (i.e., no surrogates are needed). All Cyprinids in the updated
national database were retained, except Ptychocheilus oregonenis because the genus was already represented.
Any of these Cyprinids are a potential surrogate for R. colitis. Lastly, the only species in the Family
Cyprinodontidae was retained at the Family level to represent C. macularius (Appendix 3; Table 3.3.3).
9.3.4 Fountain Creek
The site-specific acute copper toxicity database for the Fountain Creek contains 47 species, representing at
least 19 Families, and meets the AWS-MDRs (Table 9-3). The four most sensitive species in the database
include G. pulex, H. azteca, Etheostoma rubrum, and E. virgo. The resulting FAV and FCV are 17.30 µg/L
and 5.97 µg/L (hardness = 50 mg/L), respectively, which are approximately 80% greater than the updated
copper values presented in Chapter 7 of this report (Figures 9-4 and 9-5).
9.3.5 South Platte River
The site-specific acute copper toxicity database for the South Platte River contains 51 species, representing at
least 19 families, and meets the AWS-MDRs. This is the largest site-specific database of all sites under
consideration for recalculation. The four most sensitive species in the database include G. pulex, H. azteca, E.
rubrum, and E. virgo (Table 9-3), which are identical to the four most sensitive species for Fountain Creek.
The resulting site-specific FAV and FCV are 17.59 µg/L and 6.06µg/L, respectively, which are approximately
82% greater than the updated copper values presented in Chapter 7 of this report (Figures 9-4 and 9-5).

Evaluation of the EPA Recalculation Procedure Technical Report in the Arid West 9-19 May 2006
9.3.6 Southwest Arid Stream Systems (CA, AZ, NV, NM)
Combining the resident species lists for the Santa Ana River, Salt/Gila Rivers, and both sites for the Santa
Cruz River resulted in a Southwest regional acute copper toxicity database containing 52 species, representing
at least 24 families (Table 9-3). This regional database is in compliance with the AWS-MDRs. The top four
most sensitive species include G. pulex, H. azteca, E. virgo, and B. rerio. Three of these species are the same
as the top four most sensitive species in the site-specific databases already discussed in Sections 9.3.1 through
9.3.5. The higher degrees of freedom associated with the regional toxicity database resulted in slightly greater
final acute and chronic values (18.76 µg/L and 6.47 µg/L, respectively, at hardness = 50 mg/L) than any of
the site-specific recalculations. The resulting Southwest regional values are approximately 95% greater than
the updated copper values presented in Chapter 7 of this report (Figures 9-4 and 9-5).
9.3.7 High Plains Arid Stream Systems (WY, CO, NM)
Combining the resident species lists for the Fountain Creek and the South Platte River for the High Plains
region resulted in a regional acute copper toxicity database containing 52 species, representing at least 21
families (Table 9-3). This regional database is in compliance with the AWS-MDRs. Since the database size
is only slightly greater than the site-specific databases and four more the sensitive species are identical for
both sites, the resulting FAV and FCV of 17.67 µg/L and 6.09 µg/L, respectively, are only moderately greater
than the site-specific recalculations. The resulting High Plains regional values are approximately 83% greater
than the updated copper values presented in Chapter 7 of this report (Figures 9-4 and 9-5).
9.4 DIAZINON
The derivation of site-specific criteria for each study stream is based on the recalculation methods outlined in
Chapter 8. Following deletion of non-resident taxa, site-specific toxicity databases were developed
(Appendix 3; Tables 3.4.1 through 3.4.6) and criteria calculated for each study stream and the two proposed
regions. Here we compare only the site-specific final chronic values (FCVs) to the national FCV, since acute
and chronic criteria calculate are the same when the final acute-chronic ratio is equal to 2 (see Chapter 8).
Although zooplankton are influential organisms in deriving the diazinon AWQC in the national database, they
were deemed transient organisms in the arid West sites and not used in our site-specific analyses. This
removal has been discussed in Chapter 8.2, but it is important to note their significance in the diazinon
national update (Chapter 6). Toxicity data indicated that zooplankton, such as Cladocerans, are extremely
sensitive to diazinon exposure (>tenfold difference from other invertebrates in the database). Removal of
Cladocerans from site-specific databases could greatly affect site-specific diazinon criteria.

Evaluation of the EPA Recalculation Procedure Technical Report in the Arid West 9-20 May 2006
9.4.1 Santa Ana River
The site-specific database for Santa Ana River contains 15 species, representing 13 families (Table 9-4). Of
these 15 species, seven are fish and eight are invertebrates. The 13 Families found in the Santa Ana database
satisfy the AWS-MDRs. The four most sensitive genera in the national database that were deleted include
three Cladocerans (Ceriodaphnia, Daphnia, and Simocephalus) and one species within the genus Gammarus.
G. fasciatus was removed from the site-specific database, since the other Gammarus species in the toxicity
database was reported to occur at this site and found in the updated database. Resident species, G. lacustris,
was less acutely toxic to diazinon than the deleted species, and represents the sixth most sensitive species in
the Santa Ana site-specific database.
The recalculated Santa Ana River FCV is 8.56 µg/L, which is considerably greater than the revised national
value. The significant increase in the site-specific values are directly associated with the deletion of the
cladocerans and the most sensitive Gammarus species. Although these invertebrates were removed, the four
most sensitive organisms in the site-specific toxicity database include three invertebrate species, supporting
the observation that invertebrates are the most sensitive organisms to diazinon exposure.
Table 9-4 Site-Specific Diazinon Acute Toxicity Databases,
with Ranked Species Mean Acute Values (SMAV) for Each Site
Site-Specific Ranking
Santa Cruz River
Species Organism SMAV (µg/L)
Santa Ana
River
Near Nogales
Near Tucson
*
Salt/ Gila
Rivers
Fountain Creek
South Platte River
SW HP
Clarias batrachus Walking catfish 14,792 16 17 18 18 18 18
Gillia altilis
Pebble snail
11,000
15
12
16
17
17
17
17
Carassius auratus Goldfish
9,000
14
11
15
16
16
16
16
Ameiurus melas Black bullhead
8,000
13
8
14
15
15
15
15
Lumbriculus variegatus Worm
7,841
12
10
7
13
14
14
14
14
Brachydanio rerio Zebrafish
7,044
11
9
12
13
13
13
13
Pimephales promelas Fathead minnow 6,416 10 8 11 12 12 12 12
Carassius carassius
Crucian carp
5,000
7 10 11 11 11 11
Pomacea paludosa Fla. apple snail 3,198 9 6 9 10 10 10 10 Girardiaia tigrina Planaria 2,708 9 8 9 9 9 9 Jordanella floridea Flagfish 1,643 8 7 8 8 8 8 Poecilia reticulata Guppy 732 7 5 6 6 7 7 7 7 Gammarus lacustris Amphipod 200 6 4 5 5 6 6 6 6 Oreochromis mossambicus Tilapia 161 5 4 5 5 5 5
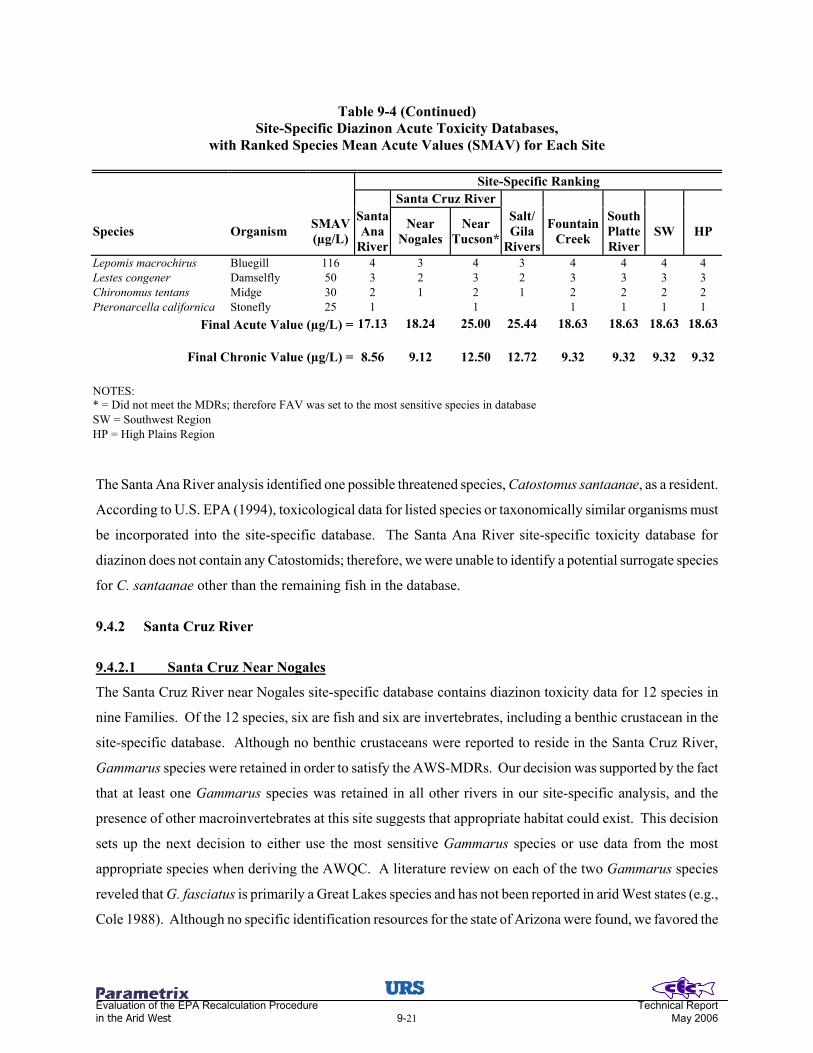
Evaluation of the EPA Recalculation Procedure Technical Report in the Arid West 9-21 May 2006
Table 9-4 (Continued) Site-Specific Diazinon Acute Toxicity Databases,
with Ranked Species Mean Acute Values (SMAV) for Each Site
Site-Specific Ranking Santa Cruz River
Species Organism SMAV (µg/L)
Santa Ana
River
Near Nogales
Near Tucson*
Salt/Gila
Rivers
Fountain Creek
South Platte River
SW HP
Lepomis macrochirus Bluegill 116 4 3 4 3 4 4 4 4 Lestes congener Damselfly 50 3 2 3 2 3 3 3 3 Chironomus tentans Midge 30 2 1 2 1 2 2 2 2 Pteronarcella californica Stonefly 25 1 1 1 1 1 1
Final Acute Value (µg/L) = 17.13 18.24 25.00 25.44 18.63 18.63 18.63 18.63
Final Chronic Value (µg/L) = 8.56 9.12 12.50 12.72 9.32 9.32 9.32 9.32
NOTES: * = Did not meet the MDRs; therefore FAV was set to the most sensitive species in database SW = Southwest Region HP = High Plains Region The Santa Ana River analysis identified one possible threatened species, Catostomus santaanae, as a resident.
According to U.S. EPA (1994), toxicological data for listed species or taxonomically similar organisms must
be incorporated into the site-specific database. The Santa Ana River site-specific toxicity database for
diazinon does not contain any Catostomids; therefore, we were unable to identify a potential surrogate species
for C. santaanae other than the remaining fish in the database.
9.4.2 Santa Cruz River
9.4.2.1 Santa Cruz Near Nogales
The Santa Cruz River near Nogales site-specific database contains diazinon toxicity data for 12 species in
nine Families. Of the 12 species, six are fish and six are invertebrates, including a benthic crustacean in the
site-specific database. Although no benthic crustaceans were reported to reside in the Santa Cruz River,
Gammarus species were retained in order to satisfy the AWS-MDRs. Our decision was supported by the fact
that at least one Gammarus species was retained in all other rivers in our site-specific analysis, and the
presence of other macroinvertebrates at this site suggests that appropriate habitat could exist. This decision
sets up the next decision to either use the most sensitive Gammarus species or use data from the most
appropriate species when deriving the AWQC. A literature review on each of the two Gammarus species
reveled that G. fasciatus is primarily a Great Lakes species and has not been reported in arid West states (e.g.,
Cole 1988). Although no specific identification resources for the state of Arizona were found, we favored the

Evaluation of the EPA Recalculation Procedure Technical Report in the Arid West 9-22 May 2006
use of G. lacustris in the site-specific database due to its common occurrence in the arid Western states when
compared to G. fasciatus.
The nine families found in the Santa Cruz River near Nogales database satisfy the AWS-MDRs. The most
sensitive organism in the Santa Cruz River near Nogales species ranked database was the midge Chironomus
tentans (Table 9-4). The recalculated Santa Cruz River near Nogales FCV is 9.12 µg/L.
The Santa Cruz River near Nogales resident species analysis identified one possible endangered species,
Poeciliopsis occidentalis, as a resident at this site. The diazinon Santa Cruz River site-specific database
contains Poecilia reticulata, which is a potential surrogate for P. occidentalis, since both taxa are within the
Family Poecilidae.
9.4.2.2 Santa Cruz Near Tucson
The Santa Cruz River near Tucson had the fewest number of taxa among all sites. The revised site-specific
database included diazinon toxicity data for eight species of aquatic organisms found in eight Families, after
addition of G. lacustris (Table 9-4). Although the database includes eight Families, the AWS-MDRs were not
satisfied, since the resident species list lacked a Cyprinid species. Because the MDRs were not met, and at
least eight Families were present in the toxicity database, we defaulted the FAV to the most sensitive SMAV
in the site-specific database. The most sensitive organism in the Santa Cruz River near Tucson site-specific
database was the stonefly Pteronarcys californica with a SMAV of 25 µg/L; therefore, the FCV is 12.5 µg/L.
9.4.3 Salt/Gila Rivers
The Salt/Gila Rivers species composition analysis resulted in a site-specific database that contains diazinon
toxicity data for 17 species found in 13 Families (Table 9-4). The Salt/Gila Rivers site-specific database
contains 10 species of fish and seven invertebrate species. Because of the diversity of organisms in the
database, the AWS-MDRs were satisfied. Both Gammarus species were in the site-specific database, but
only G. lacustris was retained in the working database for site-specific criteria calculations for reasons
explained above.
The four most sensitive organisms are slightly different than all other site-specific databases, in that
Oreochromis mossambicus ranked fourth most sensitive. Recalculation of the acute and chronic diazinon
criteria resulted in values that were greater than the revised national criteria and all other diazinon site-specific
AWQC. The recalculated Salt/Gila Rivers FCV is 12.72 µg/L, which is the greatest site-specific FCV of all
the sites evaluated.

Evaluation of the EPA Recalculation Procedure Technical Report in the Arid West 9-23 May 2006
The Salt/Gila Rivers resident species analysis identified five possible threatened or endangered species,
including Xyauchen texanus, Gila elegans, Rhinichthys cobitis, Cyprinodon macularus, and Poeciliopsis
occidentalis. The Salt/Gila rivers database does not contain any Catostomids; therefore, a potential surrogate
species for X. texanus might have to be an unrelated fish species. The site-specific database does contain
diazinon toxicity data on Pimephales promelas, a species that potentially best represents G. elegans and R.
cobitis, as these species are all within the Family Cyprinidae. A potential surrogate for C. macularus is
Jordanella floridea, because these two species are in the same Family, Cyprinodontiformes. The diazinon
Salt/Gila Rivers site-specific database also contains Poecilia reticulata that could possibly represent
P. occidentalis, since both are Poecilids.
9.4.4 Fountain Creek
Fountain Creek species composition analysis resulted in a site-specific database that contains diazinon
toxicity data for 18 species found in 14 families (Table 9-4). Of the 18 species, 10 are fish and eight are
invertebrates. Because of the diversity of the Families present in the site-specific database, the AWS-MDRs
were satisfied. The most sensitive organism in the Fountain Creek database was Pteronarcys californica.
The four most sensitive genera in the Fountain Creek database are the same organisms from the same order as
in the Santa Ana River and Santa Cruz River near Tucson site-specific diazinon databases.
Recalculation of the diazinon acute and chronic criteria resulted in values that were greater than the revised
national criteria. The recalculated Fountain Creek FCV is 9.32 µg/L. The FCV for Fountain Creek was very
similar to that of Santa Ana River. The slight difference in the FCV was due to the different degrees of
freedom associated with two more species found in the Fountain Creek database.
9.4.5 South Platte River
South Platte River species composition analysis resulted in a site-specific database that presents diazinon
toxicity data for 18 species found in 14 Families (Table 9-4). Of the 14 Families present, the database
includes acute toxicity data for 10 fish and eight invertebrate species, and satisfies all of the AWS-MDRs.
The four most sensitive genera for this site are the same organisms as in the site-specific diazinon databases
for Santa Ana River, Santa Cruz River near Tucson, and Fountain Creek. The amphipod G. lacustris was
found at this site (Table 4-2); therefore, G. fasciatus was deleted from the site-specific database according to
EPA guidelines (1994). The recalculated South Platte River FCV is 9.32 µg/L.
Evaluation of the EPA Recalculation Procedure Technical Report in the Arid West 9-24 May 2006
9.4.6 Southwest Arid Stream Systems (CA, AZ, NV, NM)
The Southwest arid stream region species composition analysis resulted in a site-specific database that
presents diazinon toxicity data for 18 species found in 14 Families (Table 9-4). The Southwest region site-
specific database contains 10 species of fish and eight invertebrate species, and satisfies the AWS-MDRs.
The four most sensitive ranked species were the same as most of the other sites; therefore, the number of
species in the database was influential in the derivation of the diazinon AWQC. The recalculated Southwest
region FCV is 9.32 µg/L.
Because the Southwest region species list was created from a pooled river resident species list, the regional
list included threatened or endangered species found in those rivers. The regional species list contained two
Catostomids, Catostomus santaanae and Xyauchen texanus, in which no acceptable surrogates existed in the
updated national toxicity database, although other fish are in the site-specific database. However, the
remaining listed species, Gila elegans, Rhinichthys cobitis, Cyprinodon macularus, and Poeciliopsis
occidentalis, were accounted for with species found in the updated national database because they shared
common Families with listed species.
9.4.7 High Plains Arid Stream Systems (WY, CO, NM)
The High Plains arid stream region species composition analysis resulted in a site-specific database that
presents diazinon toxicity data for 18 species found in 14 Families (Table 9-4). The High Plains region site-
specific database contains 10 species of fish and eight invertebrate species, and the AWS-MDRs were met.
The four most sensitive species were similar to those found at the sites in the High Plains region. The
recalculated High Plains region FCV is 9.32 µg/L. The similarity of these results to individual High Plains
sites provided some evidence that a regional AWQC can be applied to individual rivers and streams within the
region. The High Plains region resident species list did not identify any threatened or endangered species;
therefore, no surrogate species needed to be identified.
9.5 ZINC
The derivation of site-specific criteria for each study stream is based on the recalculation methods outlined
above (Chapter 8). Following deletion of non-resident taxa, site-specific toxicity databases were developed
(Appendix 3; Tables 3.5.1 through 3.5.6) and criteria calculated for each study stream and the two proposed
regions. As with copper and aluminum, all values presented below are normalized to hardness = 50 mg/L as
CacO3, rather than to site-specific hardness, which is included in Chapter 10.

Evaluation of the EPA Recalculation Procedure Technical Report in the Arid West 9-25 May 2006
9.5.1 Santa Ana River
The site-specific acute zinc toxicity database for the Santa Ana River contains 39 species. Given the lowest
level of identification (some invertebrates are only identified to Order), these species represent at least 26
Families and meet the AWS-MDRs. The four most sensitive species in the database include Cottus bairdi,
Hyalella azteca, Catostomus latipinnis, and Oreochromis mossambicus (Table 9-5). The resulting FAV and
FCV are 310 and 131 µg/L, respectively (at hardness = 50 mg/L), which are approximately 80% greater than
the updated zinc values presented in Chapter 9 of this report (Figure 9-6). The resident species analysis
identified one threatened species in the Santa Ana River, Catostomus santaanae. The Santa Ana database
contains two Catostomid species, C. commersonii and C. latipinnis, that serve as potential surrogates for
C. santaanae.
9.5.2 Santa Cruz River
Both river segments (near Nogales and near Tucson) initially did not meet the AWS-MDRs following
deletion of non-resident taxa, since benthic crustaceans are not included in the resident species list
(Table 2-2). Given that both sites could contain appropriate habitat because other benthic macroinvertebrates
are resident taxa, we determined that benthic crustaceans could potentially occur at these sites. Therefore, the
three isopods (Asellus aquaticus, Caecidotea communis, and Caecidotea bicrenata) and three amphipods
(Hyalella azteca, Gammarus italicus, and Gammarus sp.) retained at genus level or lower at the other arid
West sites were retained in the calculation. An additional code not previously used by the EPA of “R”
(“retained”) was assigned to these species in Appendix 3 of this report.
Table 9-5 Site-Specific Acute Zinc Toxicity Databases Ranked by Species Mean Acute Values (SMAV)
Site-Specific Ranking Santa Cruz
River Species Common Name SMAV(µg/L)
Santa Ana
River Near Nogales
Near Tucson
*
Salt/Gila Rivers
Fountain Creek
South Platte River
SW HP
Argia Sp.
Damselfly
89,488
39
27
21
38
40
41
47
43
Trichoptera
Caddisfly
58,100
38
26
20
37
39
40
46
42 Gambusia affinis
Mosquitofish
32,370
37
25
19
36
39
45
42
Zygoptera
Damselfly
26,200
36
24
18
35
38
38
44
40 Chironomus plumosus
Midge
21,825
35
23
17
34
37
37
43
39
Crangonyx pseudogracilis
Amphipod
19,800
33
Lepomis gibbosus
Pumpkinseed
18,778
34
22
16
32
36
36
42
38 Nais Sp.
Worm
18,400
33
21
15
31
35
35
41
37
Chironomus Sp.
Midge
18,200
32
20
14
34
34
40
36
Asellus aquaticus
Isopod
18,200
19
13
33
33
35
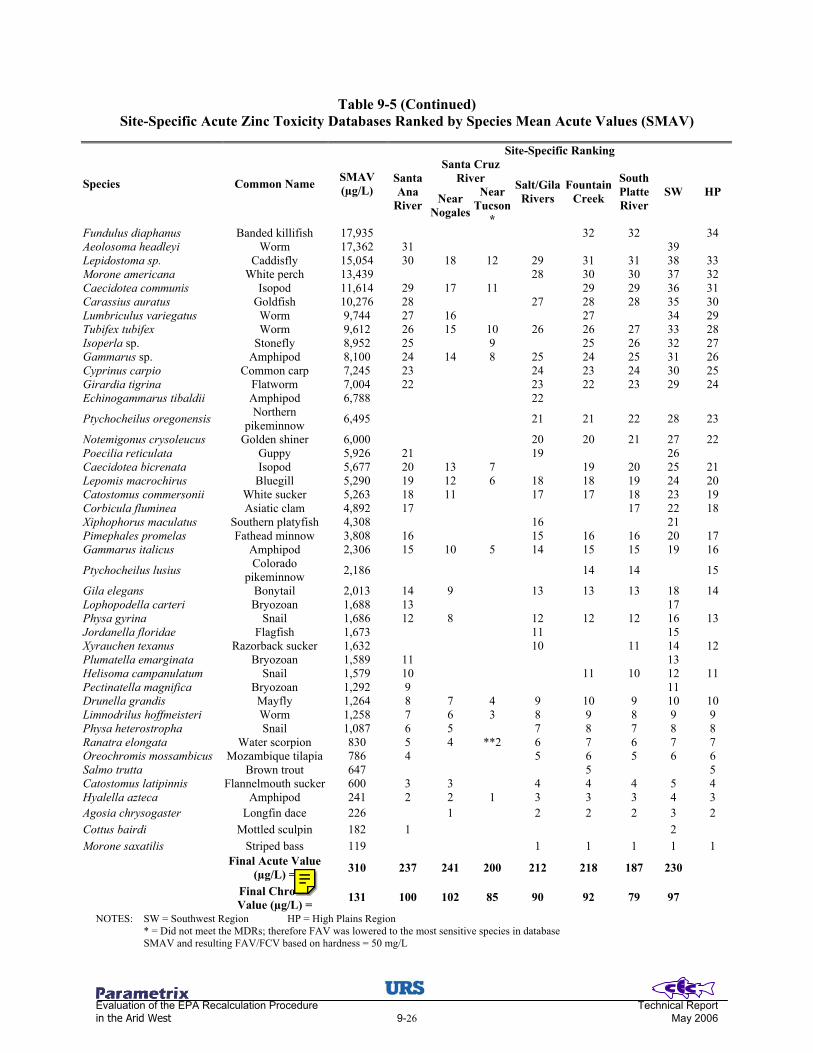
Evaluation of the EPA Recalculation Procedure Technical Report in the Arid West 9-26 May 2006
Table 9-5 (Continued) Site-Specific Acute Zinc Toxicity Databases Ranked by Species Mean Acute Values (SMAV)
Site-Specific Ranking
Santa Cruz River Species Common Name SMAV
(µg/L) Santa Ana
River Near Nogales
Near Tucson
*
Salt/Gila Rivers
Fountain Creek
South Platte River
SW HP
Fundulus diaphanus Banded killifish 17,935 32 32 34 Aeolosoma headleyi Worm 17,362 31 39 Lepidostoma sp. Caddisfly 15,054 30 18 12 29 31 31 38 33 Morone americana White perch 13,439 28 30 30 37 32 Caecidotea communis Isopod 11,614 29 17 11 29 29 36 31 Carassius auratus Goldfish 10,276 28 27 28 28 35 30 Lumbriculus variegatus Worm 9,744 27 16 27 34 29 Tubifex tubifex Worm 9,612 26 15 10 26 26 27 33 28 Isoperla sp. Stonefly 8,952 25 9 25 26 32 27 Gammarus sp. Amphipod 8,100 24 14 8 25 24 25 31 26 Cyprinus carpio Common carp 7,245 23 24 23 24 30 25 Girardia tigrina Flatworm 7,004 22 23 22 23 29 24 Echinogammarus tibaldii Amphipod 6,788 22
Ptychocheilus oregonensis Northern pikeminnow 6,495 21 21 22 28 23
Notemigonus crysoleucus Golden shiner 6,000 20 20 21 27 22 Poecilia reticulata Guppy 5,926 21 19 26 Caecidotea bicrenata Isopod 5,677 20 13 7 19 20 25 21 Lepomis macrochirus Bluegill 5,290 19 12 6 18 18 19 24 20 Catostomus commersonii White sucker 5,263 18 11 17 17 18 23 19 Corbicula fluminea Asiatic clam 4,892 17 17 22 18 Xiphophorus maculatus Southern platyfish 4,308 16 21 Pimephales promelas Fathead minnow 3,808 16 15 16 16 20 17 Gammarus italicus Amphipod 2,306 15 10 5 14 15 15 19 16
Ptychocheilus lusius Colorado pikeminnow 2,186 14 14 15
Gila elegans Bonytail 2,013 14 9 13 13 13 18 14 Lophopodella carteri Bryozoan 1,688 13 17 Physa gyrina Snail 1,686 12 8 12 12 12 16 13 Jordanella floridae Flagfish 1,673 11 15 Xyrauchen texanus Razorback sucker 1,632 10 11 14 12 Plumatella emarginata Bryozoan 1,589 11 13 Helisoma campanulatum Snail 1,579 10 11 10 12 11 Pectinatella magnifica Bryozoan 1,292 9 11 Drunella grandis Mayfly 1,264 8 7 4 9 10 9 10 10 Limnodrilus hoffmeisteri Worm 1,258 7 6 3 8 9 8 9 9 Physa heterostropha Snail 1,087 6 5 7 8 7 8 8 Ranatra elongata Water scorpion 830 5 4 **2 6 7 6 7 7 Oreochromis mossambicus Mozambique tilapia 786 4 5 6 5 6 6 Salmo trutta Brown trout 647 5 5 Catostomus latipinnis Flannelmouth sucker 600 3 3 4 4 4 5 4 Hyalella azteca Amphipod 241 2 2 1 3 3 3 4 3 Agosia chrysogaster
Longfin dace
226
1
2
2
2
3
2
Cottus bairdi
Mottled sculpin
182
1
2
Morone saxatilis
Striped bass
119
1
1
1
1
1
Final Acute Value (µg/L) = 310 237 241 200 212 218 187 230
Final Chronic Value (µg/L) = 131 100 102 85 90 92 79 97
NOTES: SW = Southwest Region HP = High Plains Region * = Did not meet the MDRs; therefore FAV was lowered to the most sensitive species in database SMAV and resulting FAV/FCV based on hardness = 50 mg/L

Evaluation of the EPA Recalculation Procedure Technical Report in the Arid West 9-27 May 2006
9.5.2.1 Santa Cruz near Nogales
The resulting site-specific acute zinc toxicity database for the Santa Cruz River near Nogales contains 27
species (Table 9-5). Once again, given the lowest level of identification, these species represent at least
16 families and meet the AWS-MDRs. The four most sensitive species in the database include Morone
saxatilis, Agosia chrysogaster, Hyalella azteca, and Catostomus latipinnis (Table 9-5). The resulting FAV
and FCV are 237 and 100 µg/L, respectively, which are approximately 38% greater than the updated zinc
values presented in Chapter 7 of this report (Figure 9-6). Only one endangered species, Poeciliopsis
occidentalis, was identified as a resident in the Santa Cruz River near Nogales site. Possible surrogates could
be Xiphophorus maculates, Gambusia affinis, or Poecilia reticulata, since all are Poecilids.
0 100 200 300 400 500
Hardness (mg/L as CaCO 3)
0
200
400
600
800
1000
Chr
onic
Zin
c C
riter
ia(µ
g di
ssol
ved
Zn/L
)
Updated National ChronicSanta Ana RiverSalt/Gila riversSanta Cruz near NogalesSanta Cruz near TucsonFountain CreekSouth Platte-SMAV
Figure 9-6
Comparison of Site-Specific Chronic Zinc Criteria to the Updated National Chronic Zinc Criteria at Various Hardness Concentrations
9.5.2.2 Santa Cruz near Tucson
The resulting site-specific acute zinc toxicity database for the Santa Cruz River near Tucson contains 21
species representing 13 families, which is the most limited database of all sites under consideration for
recalculation for zinc. The resulting numbers of families do not meet the AWS-MDRs, since an organism
within the Family Cyprinidae does not reside at the site. The four most sensitive species in this database
(H. azteca, Ranatra elongate, Limodrilus hoffmeisteri, and Drunella grandis) result in the widest range of
SMAVs of all sites (Table 15-1). However, the FAV must default to the SMAV of the most sensitive species
in the site-specific database because more eight Families are present, but the specific AWS-MDRs are not
met. The resulting FAV and FCV are 241 and 102 µg/L, respectively, which are approximately 40% greater
than the updated zinc values presented in Chapter 7 of this report (Figure 9-6). This defaulted FAV is only
slightly lower than what would result from a 5th percentile FAV calculation.

Evaluation of the EPA Recalculation Procedure Technical Report in the Arid West 9-28 May 2006
9.5.3 Salt/Gila Rivers
The only documentation of benthic crustaceans for the Salt/Gila Rivers is the presence of the Order
Amphipoda. Therefore, all species within this Order were retained in the site-specific database. The resulting
site-specific acute zinc toxicity database for the Salt/Gila Rivers contains 39 species representing at least
18 Families, and meets the AWS-MDRs. The four most sensitive species in the database include M. saxatilis,
A. chrysogaster, H. azteca, and Catostomus latipinnis (Table 9-5). The resulting FAV and FCV are 201 and
85 µg/L, respectively, which are approximately 15% greater than the updated zinc values presented in
Chapter 7 of this report (Figure 9-6).
The Salt/Gila Rivers resident species analysis identified five threatened or endangered species, including
Xyrauchen texanus, Gila elegans, Rhinichthys cobitis, Cyprinodon macularius, and Poeciliopsis occidentalis.
Two of these species, X. texanus and G. elegans, are in the database therefore no surrogates are required.
R. cobitis, is not in the site-specific database. However, all Cyprinids in the updated national zinc database
were retained, except Ptychocheilus oregonensis because the genus was already represented. Any of these
Cyprinids could be a surrogate for R. cobitis. C. macularius is within the Family Cypridonotidae. The
updated national database contains only one species within this Family, Jordanella floridae. J. floridae was
retained at the Family level (Appendix 3), and is a potential surrogate for C. macularius. Possible surrogates
for P. occidentalis are X. maculates, G. affinis, or P. reticulata, since all are Poecilids.
9.5.4 Fountain Creek
The site-specific acute zinc toxicity database for the Fountain Creek contains 40 species, representing at least
22 families and meets the AWS-MDRs. The four most sensitive species in the database include M. saxatilis,
A. chrysogaster, H. azteca, and C. latipinnis (Table 9-5). The resulting FAV and FCV are 212 and 90 µg/L,
respectively (at hardness = 50 mg/L), which are approximately 25% greater than the updated zinc values
presented in Chapter 7 of this report (Figure 9-6).
9.5.5 South Platte River
The site-specific acute zinc toxicity database for the South Platte River contains 41 species, representing at
least 22 Families and meets the AWS-MDRs. The South Platte River analysis resulted in the largest database
of all sites under consideration for recalculation. The four most sensitive species in the database include M.
saxatilis, A. chrysogaster, H. azteca, and C. latipinnis (Table 9-5), which are identical to the four most
sensitive species for Fountain Creek. The resulting FAV and FCV are 218 and 92 µg/L, respectively, which
are approximately 27% greater than the updated zinc values presented in Chapter 7 of this report (Figure 9-6).

Evaluation of the EPA Recalculation Procedure Technical Report in the Arid West 9-29 May 2006
9.5.6 Southwest Arid Stream Systems (CA, AZ, NV, NM)
Combining the resident species lists for the Santa Ana River, Salt/Gila Rivers, and both sites for the Santa
Cruz River resulted in a Southwest regional acute zinc toxicity database containing 48 species, representing at
least 28 families (Table 9-5). This regional database is in compliance with the AWS-MDRs. Although the
Southwest database is more robust than any individual site-specific database, the distribution of the SMAVs
for the four most sensitive species (M. saxatilis, Cottus bairdi, A. chrysogaster, and H. azteca) results in a
more restrictive criterion than any of the site-specific recalculations. The resulting FAV and FAC are 187 and
79 µg/L, respectively, which are only 9% greater than the updated zinc values presented in Chapter 7 of this
report (Figure 9-7). Because the Southwest region species list was created from a pooled river resident
species list, the regional list included all six threatened or endangered species found in those rivers. The site-
specific database also contains all of the species that were identified as surrogates in each of the pooled rivers
therefore surrogate species for the Southwest region are similar and were identified in previous sections.
9.5.7 High Plains Arid Stream Systems (WY, CO, NM)
Combining the resident species lists for the Fountain Creek and the South Platte River results in a High Plains
regional acute zinc toxicity database containing 43 species, representing at least 24 families (Table 9-5). This
regional database is in compliance with the AWS-MDRs. Since the database size is only slightly greater than
the site-specific databases for the two study streams and the four most sensitive species are identical for both
sites, the resulting FAV and FCV are only moderately greater than the site-specific values. The resulting
criteria (Figure 9-7) are approximately 34% greater than the updated zinc values presented in Chapter 7 of this
report.

Evaluation of the EPA Recalculation Procedure Technical Report in the Arid West 9-30 May 2006
0 100 200 300 400 500
Hardness (mg/L as CaCO3)
0
100
200
300
400
500
600
Chr
onic
Zin
c C
riter
ia(µ
g di
ssol
ved
Zn/L
)
Updated National ChronicSouthwest regionHigh Plains region
Figure 9-7
Comparison of the Region (Southwest and High Plains) Specific Chronic Zinc Criteria to the Updated National Chronic Zinc Criteria at Various Hardness Concentrations
9.6 LITERATURE CITED
Cole, G.A. 1988. A Report on Noel’s amphipod (Gammarus desperatus). Report submitted to the Endangered Species Program. Professional Services Contract 519-77-02. New Mexico Department of Game and Fish, Santa Fe, New Mexico.
Kane, D.A., and C.F. Rabeni. 1987. Effects of aluminum and pH on the early life stages of smallmouth bass
(Micropterus dolomieu). Water Resources 21(6):633-639. U.S. Environmental Protection Agency. 1994. EPA Interim Guidance on Determination and Use of Water-
Effect Ratios for Metals. EPA-823-B-94-001. Office of Water, Washington, DC.
Evaluation of the EPA Recalculation Procedure Technical Report in the Arid West 10-1 May 2006
10.0 SUMMARY OF RECALCULATION ANALYSES
10.1 COMPARISONS OF SITE-SPECIFIC STANDARDS TO UPDATED NATIONAL CRITERIA
For ease of analysis, Chapter 9 used “absolute” toxicity values (FAV or FCV) for comparison of the results of
recalculated vs. national criteria. In this way, values normalized to like hardness or pH could be compared
directly.
To present comparisons of actual recalculated site-specific standards to national criteria, the equations or
CMC and CCC values for each contaminant and each site are solved for mean hardness and pH of each site,
as appropriate. Historical ambient water quality data for the study streams were derived using water quality
data presented in the arid West HCS (PCWWM 2002) and from the BLM validation study (PCWWM 2005).
10.1.1 Santa Ana River
An average total hardness of 188 mg/L as CaCO3 and average pH of 7.2 were used in the site-specific criteria
derivation process below, based on water quality data from the HCS and BLM validation study. Site-specific
criteria are less restrictive than the updated copper, daizinon and zinc criteria, near equivalent to the updated
ammonia criteria, and more restrictive than the updated aluminum criteria (Tables 10-1 and 10-2).
10.1.2 Santa Cruz River
Average ambient water quality data for the Santa Cruz River near Nogales and Tucson sites were estimated
from the arid West HCS (PCWWM 2002) water quality figures. An average hardness of 170 mg/L as CaCO3
and pH of 7.5 for the Santa Cruz near Nogales site, and hardness of 150 mg/L as CaCO3 and pH of 7.2 for the
near Tucson sites, were used in the site-specific criteria derivations below. Site-specific criteria for the near
Nogales site were less restrictive than the updated aluminum, copper, daizinon and zinc criteria, and near
equivalent to the updated ammonia criteria (Tables 10-1 and 10-2). Similar relationships with the updated
criteria resulted for the near Tucson site, except no criterion was derived for aluminum.

Evaluation of the EPA Recalculation Procedure Technical Report in the Arid West 10-2 May 2006
Table 10-1 Site-Specific Acute Criterion Concentrations for Each
Chemical Using Mean Hardness and pH When Necessary
Site-Specific CMC Regional CMC Santa Cruz Salt/ Santa
Ana River
Near Nogales
Near Tucson
Gila River
Fountain Creek
South Platte River
Southwest Region
High Plains Region
Hardness (mg/L) 188 170 150 388 218 280 208 247 pH 7.2 7.5 7.2 7.4 7.4 7.4 7.3 7.4 Aluminum (µg total Al/L)
3464 (3856)
6054 (3546)
NA (3195)
7763 (7050)
3609 (4362)
4826 (5373) 3768
(4195) 4005
(4840) Ammonia (mg TA-N/L)
28.38 (27.52)
18.53 (18.53)
26.81 (27.52)
21.16 (21.40)
22.07 (21.40)
21.63 (21.40) 24.96
(24.42) 21.79
(21.40) Copper (µg dissolved Cu/L)
29.93 (16.96)
27.84 (15.36)
21.32 (13.59)
63.36 (34.49)
35.18 (19.57)
45.68 (25.05) 36.42
(18.69) 40.56
(22.14) Diazinon (µg total diazinon/L)
8.56 (0.11)
9.12 (0.11)
12.50 (0.11)
12.72 (0.11)
9.32 (0.11)
9.32 (0.11) 9.32
(0.11) 9.32
(0.11) Zinc (µg dissolved Zn/L)
470.2 (261.5)
329.9 (239.9)
301.4 (215.6)
565.0 (485.3)
364.2 (296.2)
464.0 (367.4) 308.2
(284.6) 439.4
(329.9) NOTES: NA = Data were not available to derive criteria for that site (see Chapter 9 for discussion). Values in () = updated national acute criterion, given site hardness or pH, for comparison.
Table 10-2 Site-Specific Chronic Criterion Concentrations for Each Chemical Using Mean Hardness and pH when Necessary
Site-Specific CCC Regional CCC
Santa Cruz Santa Ana
River Near
Nogales Near
Tucson
Salt/ Gila
River
Fountain Creek
South Platte River
Southwest Region
High Plains Region
Hardness (mg/L) 188 170 150 388 218 280 208 247 pH 7.2 7.5 7.2 7.4 7.4 7.4 7.3 7.4 Aluminum (µg total Al/L)
1384 (1541)
2420 (1417)
NA (1277)
3103 (2818)
1443 (1744)
1929 (2148) 1506
(1677) 1601
(1935) Ammonia (mg TA-N/L)
11.58 (11.23)
7.56 (7.56)
10.94 (11.23)
8.64 (8.73)
9.00 (8.73)
8.83 (8.73) 10.19
(9.97) 8.89
(8.73) Copper (µg dissolved Cu/L)
12.31 (6.97)
11.90 (6.57)
9.57 (6.10)
19.63 (10.69)
13.65 (7.61)
16.08 (8.82) 14.39
(7.40) 14.99 (8.19)
Diazinon (µg total diazinon/L)
8.56 (0.11)
9.12 (0.11)
12.50 (0.11)
12.72 (0.11)
9.32 (0.11)
9.32 (0.11) 9.32
(0.11) 9.32
(0.11)
Zinc (µg dissolved Zn/L)
399.6 (222.2)
280.4 (203.9)
256.1 (183.2)
480.2 (412.4)
310.1 (252.1)
394.3 (312.2) 262.3
(242.2) 373.6
(280.5)
NOTES: NA = Data were not available to derive criteria for that site – see Chapter 9 for discussion Values in () = updated national chronic criterion, given site hardness or pH, for comparison.

Evaluation of the EPA Recalculation Procedure Technical Report in the Arid West 10-3 May 2006
10.1.3 Salt/Gila Rivers
Salt/Gila Rivers chemical data were based on water quality data from the HSC and BLM validation study.
The Salt/Gila Rivers have an average hardness of 388 mg/L with a pH of 7.4, which were used in the site-
specific criteria calculations below. Aluminum and ammonia site- specific criteria for the Salt/Gila Rivers are
nearly equivalent to the updated national criteria, where as results for site-specific copper, diazinon, and zinc
criteria are less restrictive than the updated national criteria (Tables 10-1 and 10-2).
10.1.4 Fountain Creek
Fountain Creek historical ambient water quality data were obtained from the arid West HCS (PCWWM
2002). Average water hardness of 218 mg/L as CaCO3 and pH of 7.4 were used for the site-specific criteria
derivations below. Like the Santa Ana River, site-specific criteria are more restrictive than the updated
national criteria for aluminum, near equivalent to the updated ammonia criteria, and less restrictive than the
updated national copper diazinon, and zinc criteria (Tables 10-1 and 10-2).
10.1.5 South Platte River
South Platte River historical chemical data were based on water quality data from the HSC and BLM
validation study. The South Platte has an average hardness of 280 mg/L as CaCO3 and pH of 7.4, which were
used in the site-specific criteria calculations. Comparisons of these site-specific standards to national criteria
are summarized in Tables 10-1 and 10-2.
10.1.6 Southwest Region
Ambient water quality data should be used in the application of a regional criterion to a particular site. To
provide an example of potential criteria that would be derived using the southwest databases, we estimated an
average water hardness and pH for the southwest region by taking the geometric mean of respective values.
The resulting average water hardness of 208 mg/L as CaCO3 and pH of 7.3 were used in the regional criteria
calculations. Southwest region criteria are generally similar to the site-specific values, except for zinc, which
is nearly equivalent to the updated national criteria (Tables 10-1 and 10-2).
10.1.7 High Plains Region
Once again, ambient water quality should be used in the application of regional criteria to a particular site. To
provide an example of criteria using the high plains databases we calculated an average water hardness and
pH from the water quality data of two high plains sites used in this analysis. The resulting average hardness
of 247 mg/L as CaCO3 and pH of 7.4 were used in the example high plains regions calculations below. The

Evaluation of the EPA Recalculation Procedure Technical Report in the Arid West 10-4 May 2006
High Plains database derived moderate criteria that are between the site-specific values for the two sites taken
into consideration (Tables 10-1 and 10-2), except for daizinon, in which all criteria are equivalent.
10.1.8 Conclusions on Usefulness of Recalculation Procedure for Arid West Effluent Dominated Streams
To quantify the relative numeric implication of applying the arid West recalculation procedure for particular
contaminant/site combinations, we compared these site-specific standards with their respective updated
national criteria (Table 10-3). A net change of 10% in the site-specific standard vs. national criteria was used
to quantify whether calculating site-specific criteria via the recalculation procedure would have a significant
impact relative to national criteria for a particular contaminant at a particular site. Note that the “significance”
of the recalculation procedure in this context is not based on the results being less or more restrictive than
national criteria, but rather on whether a recalculated criterion was more than 10% different.
Table 10-3 Recalculation Findings Decision Matrix
Santa Ana
River
Santa Cruz near
Nogales
Santa Cruz near
Tucson
Salt/Gila Rivers
Fountain Creek
South Platte River
Southwest Region
High Plains Region
Aluminum - + NA = - - - - Ammonia = = = = = = = = Copper + + + + + + + + Diazinon + + + + + + + + Zinc + + + + + + = + NOTES: + = recalculated criteria are less restrictive than national updated criteria. - = recalculated criteria are more restrictive than national updated criteria. = = less than 10% change in recalculated criteria from national updated criteria. NA = Data were not available to conduct the analysis.
Results suggest that the recalculation procedure for development of site-specific standards would generally
derive substantially different criteria concentrations for all of the case-study streams. The one exception to
this is ammonia, which shows no noteworthy change when compared to the updated national criteria
following recalculation.
10.2 CRITERIA-SPECIFIC ISSUES WITH THE RECALCULATION PROCEDURE
The following discussion provides a summary of the issues that arose during the recalculation evaluation for
each criterion, with comments on the mechanics of updating the national criteria, creating site-specific
databases, and deriving final site-specific criteria.

Evaluation of the EPA Recalculation Procedure Technical Report in the Arid West 10-5 May 2006
10.2.1 Aluminum
Since publication of EPA’s (1988) aluminum AWQC document, many refinements on the AWQC derivation
process and published aquatic organism toxicity data have become available. The relatively outdated
aluminum criteria document was a good candidate for an update (Chapter 3), which would also include
hardness-based equations for criteria derivation (Table 3-8). This is particularly important in arid Western
streams that average moderate to high hardness (PCWWM 2002). These new criteria reflect our findings that
aluminum becomes less toxic to aquatic organisms as hardness increases, probably through complex
speciation dynamics that determine the solubility and, ultimately, exposure of organisms to aluminum.
Compared to the updated national aluminum criteria, site-specific aluminum criteria were more restrictive or
equal to the national criteria, except for the Santa Cruz near Nogales site (Table 10-4; Chapter 9.1). This
would appear to be counterintuitive at first, considering that the most sensitive species, Salmo salar, was
deleted from all but one site-specific database, Fountain Creek (Section 9.1.4).
These counter intuitive findings resulted from two general commonalities among all databases that influence
the FAV calculation. First, all site-specific databases contained greater variability in the four lowest SMAVs,
resulting in less confident FAV calculations and, hence, more restrictive criteria. Variance of these site-
specific recalculations was on average 10 fold greater than the national update variance. Second, the site-
specific databases resulted in fewer taxa than the updated national databases. This reduction in number of
species (N) within the site-specific toxicity databases decreases the degrees of freedom afforded to the four
lowest ranked SMAVs. As with sample variability, the degrees of freedom (i.e., database size or sample size)
is very influential in final criteria calculations (Figure 10-1). A larger database lowers the weight of the four
lowest SMAVs, as the probability of 95% protection is diluted among more organisms.
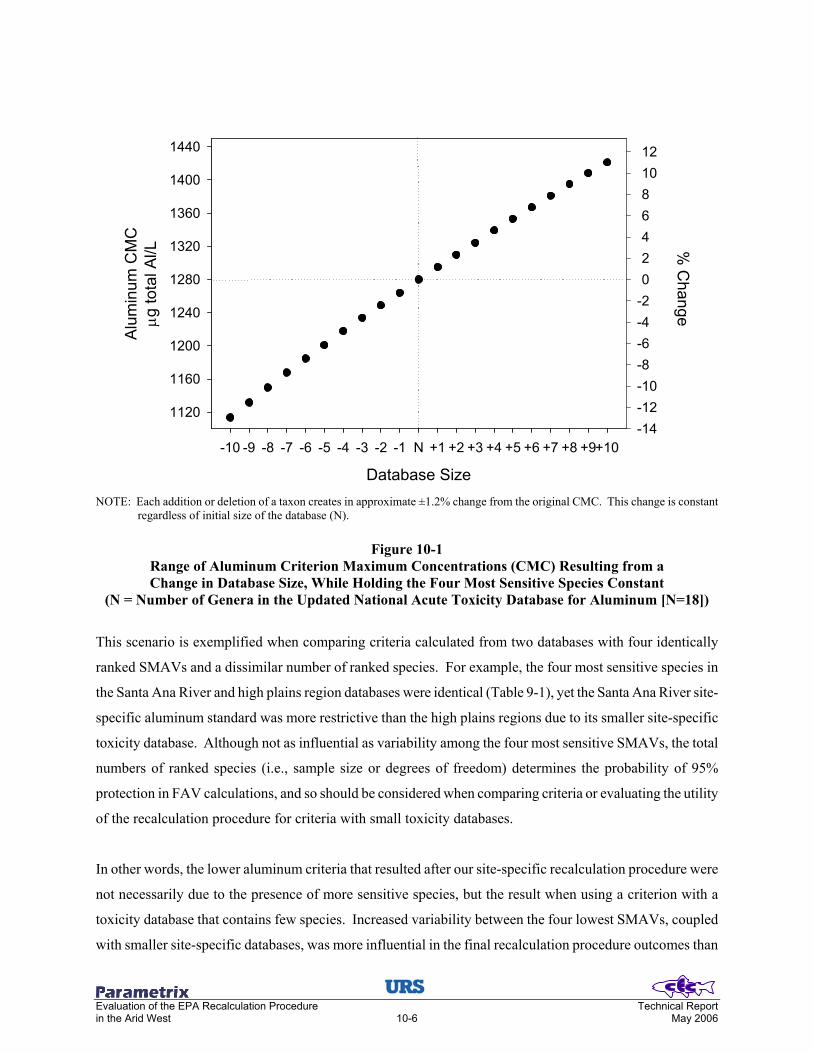
Evaluation of the EPA Recalculation Procedure Technical Report in the Arid West 10-6 May 2006
Database Size
-10 -9 -8 -7 -6 -5 -4 -3 -2 -1 N +1 +2 +3 +4 +5 +6 +7 +8 +9+10
Alu
min
um C
MC
µ g to
tal A
l/L
1120
1160
1200
1240
1280
1320
1360
1400
1440%
Change
-14-12-10-8-6-4-2024681012
NOTE: Each addition or deletion of a taxon creates in approximate ±1.2% change from the original CMC. This change is constant
regardless of initial size of the database (N).
Figure 10-1 Range of Aluminum Criterion Maximum Concentrations (CMC) Resulting from a Change in Database Size, While Holding the Four Most Sensitive Species Constant
(N = Number of Genera in the Updated National Acute Toxicity Database for Aluminum [N=18])
This scenario is exemplified when comparing criteria calculated from two databases with four identically
ranked SMAVs and a dissimilar number of ranked species. For example, the four most sensitive species in
the Santa Ana River and high plains region databases were identical (Table 9-1), yet the Santa Ana River site-
specific aluminum standard was more restrictive than the high plains regions due to its smaller site-specific
toxicity database. Although not as influential as variability among the four most sensitive SMAVs, the total
numbers of ranked species (i.e., sample size or degrees of freedom) determines the probability of 95%
protection in FAV calculations, and so should be considered when comparing criteria or evaluating the utility
of the recalculation procedure for criteria with small toxicity databases.
In other words, the lower aluminum criteria that resulted after our site-specific recalculation procedure were
not necessarily due to the presence of more sensitive species, but the result when using a criterion with a
toxicity database that contains few species. Increased variability between the four lowest SMAVs, coupled
with smaller site-specific databases, was more influential in the final recalculation procedure outcomes than
Evaluation of the EPA Recalculation Procedure Technical Report in the Arid West 10-7 May 2006
using the more representative assemblage of arid West organisms. In fact, the assemblages of organisms in
the site-specific aluminum databases were less sensitive to aluminum than the national updated database,
although five of the eight recalculated criteria were more restrictive than updated national criteria
(Table 10-3).
We would recommend adoption of the updated aluminum AWQC presented in the national review and update
(Chapter 3) and continue further investigation into site-specific recalculations when a more robust database
becomes available. The updated national recalculations provide new criteria derived by a water quality
equation that could potentially supersede the outdated U.S. EPA criteria recommendations (EPA 1988). The
updated aluminum criteria with hardness- based criteria equations thus may prove to be a more useful tool
than the recalculation procedure for adjusting criteria for arid West streams.
10.2.2 Ammonia
The EPA national ammonia (EPA 1999) criteria utilize two acute equations as a function of pH to derive
ammonia criteria, one equation for sites with salmonids and one for sites without salmonids. In our review of
the national criteria (Chapter 4), we critically addressed issues of including or excluding “large”
Oncorhynchus mykiss age-class toxicity values that were influential in establishing the separate equations, as
well as recently published unionid clam toxicity data.
We also reviewed and updated the chronic criterion and deriving chronic criteria via a FACR calculation,
rather than the approach used by EPA. This approach was suggested because of the limited chronic toxicity
database that did not meet important MDRs. Generally, when the chronic toxicity database does not meet the
MDRs, the chronic criterion is derived via a FACR (Stephan et al. 1985). Furthermore, the EPA 1999
document assumed a possible age-dependent ammonia chronic toxicity relationship. To account for this, final
chronic criteria included a temperature component as a surrogate to protect early life stage fish in the form of
two separate chronic equations. Unfortunately, evidence of a temperature-dependent chronic ammonia
toxicity relationship was based on only one study (Arthur et al. 1987), which reported a non-statistically
significant relationship in their acute testing. Coupled with conflicting fish and invertebrate temperature data,
this led to development of national chronic criteria primarily driven only by Lepomis and Hyalella. It is
questionable that a criterion derived from two organisms provides the diversity of data needed to protect
aquatic organisms from chronic ammonia exposure.
The irregularly and questionably derived acute and chronic ammonia criteria provided us with an opportunity
to improve the national criteria development as part of the arid West recalculation procedure evaluation.

Evaluation of the EPA Recalculation Procedure Technical Report in the Arid West 10-8 May 2006
Considerable changes in the updated criteria were recommended in how the acute criteria are developed,
while still using basic methodologies set forth in the original document (EPA 1999). Instead of separate
equations for “salmonids present or absent,” we proposed updated criteria that included warm water biota and
cold water biota equations. Additionally, given the sensitivity and distribution of Unionids, the warm water
criterion was separated into two equations for sites with and without Unionids. These habitat-based criteria
account for potential differences in sensitivity of cold and warm water species. Both the updated acute and
chronic criteria equations are solely a function of pH, with no temperature component beyond habitat
characterization, consistent with the current EPA acute equations.
Another major improvement over existing criteria derivation was the development of a FACR for use in the
derivation of chronic criteria rather than the approach used by the EPA. Although we slightly deviated from
the 1985 Guidelines when deriving the FACR by using acute and chronic toxicity values derived among
different studies, we believe this approach is more scientifically defensible than methods used by the authors
of the current national criteria (EPA 1999). In summary, our critical review and update to the national
AWQC was very important in clarifying technical issues with the existing criteria and created a user-friendly,
habitat-oriented database which is more useable in deriving arid West site-specific ammonia criteria with the
recalculation procedure than the existing equations.
Selection of ammonia to exemplify steps in arid West site-specific criteria development provided an
opportunity to practice recalculation procedures on a robust updated national database while utilizing unique
criteria derivation equations. From our analysis, a few technical generalizations can be made. First, there is
little variability in site-specific standards between any of the sites or regions (Table 10-2). This was still the
case in the Santa Cruz near Tucson site in which the FAV defaulted to the most sensitive species, and among
sites with dissimilar ranked or total number of ranked SMAVs. Second, regional criteria are less restrictive
than all but one site-specific criterion. This is directly associated with using the larger regional toxicity
databases when compared to the site-specific databases. As previously mentioned in the aluminum analysis, a
larger database numerically lowers the influence of the four most sensitive SMAVs, as the probability of 95%
protection is diluted among more organisms. Finally, recalculated site-specific criteria do not deviate far from
the updated national warm water without Unionid ammonia criterion. The similarity in results for all sites
and regions with the updated national criterion suggest that site-specific recalculations for ammonia might not
be necessary, as our breakdown of warm and cold water habitats proposed in our national updated ammonia
criteria accounts for site-specific differences in arid-west streams, making further species-based recalculation
efforts unnecessary.
Evaluation of the EPA Recalculation Procedure Technical Report in the Arid West 10-9 May 2006
10.2.3 Copper
Copper was selected due to its prevalence in effluent-dependent streams, and to provide an example of the
recalculation procedure using a toxicant with a large toxicity database that could be modified by multiple
ambient water quality characteristics. The original copper AWQC were developed in 1984 (EPA 1985) and
later updated in 1995 (EPA 1996). The most recent draft update (EPA 2003) is still in review and uses a
BLM to normalize toxicity values according to a myriad of water quality parameters such as temperature, pH,
DOC, % humic acid, and major ions.
Although promising, very few toxicity tests found in the national database report all of the model variables
needed to run the BLM. The resulting database will be severely limited if the BLM criteria are fully accepted,
and application of the recalculation procedure to a BLM-based criteria is not necessarily straightforward.
This is because the proposed BLM-based criterion depends numerically on the 50% lethal metal accumulation
(LA50) value of a single hypothetical species of 5th percentile sensitivity. Therefore, we decided to abandon
the BLM approach in favor of a more robust updated national copper toxicity database (N = 69 genera vs N =
27 genera for the BLM-adjusted database) for our analysis. However, it should be noted that BLM-based
criteria tend to be much less restrictive than more traditional hardness-based criteria for many of the same
effluent-dependent waters evaluated in the present study (PCWWM 2005).
Many improvements were made to the current copper national criteria during our review (Chapter 5). First,
the acute and chronic hardness toxicity water quality relationships were updated and corrected. After our
additions to the chronic database, enough chronic toxicity data were available to adequately model a separate
chronic toxicity-hardness relationship (Figure 5-2) that did not previously exist. Interestingly, the chronic
hardness-relationship is not as “steep” as found in acute data, providing evidence of a less dramatic change in
toxicity as a function of hardness. Second, the FACR was revised using the data from similar toxicity tests
reported in updated acute and chronic databases. Lastly, we provided updated criteria equations. Our updated
criteria are substantially more restrictive than current EPA criteria (Table 5-10) due to the addition of new
acute copper toxicity data for sensitive Cladocerans that were not previously represented. However, we
suggest cautious acceptance of these updated criteria with all Cladocerans included, since values are highly
influenced by the three most sensitive species with SMAVs derived from single, LC50s derived from
unmeasured concentrations and reported from one study (Koivisto et al. 1992).
Site-specific copper toxicity databases were created using the arid-west stepwise deletion process and resident
species list created for each site. Although zooplankton species were identified at a few of the sites, it was
determined that these species were transient organisms and they were removed from the site-specific

Evaluation of the EPA Recalculation Procedure Technical Report in the Arid West 10-10 May 2006
databases when not formally removed during the deletion process (Appendix 3). Removal of these species
effectively muted concern regarding inclusion of the three most sensitive species with single, unmeasured
acute values.
The next most sensitive organisms, after zooplankton, were amphipods. In fact, Hyalella azteca and
Gammarus pulex were the most sensitive species found in each site-specific database. In contrast, remaining
lists of the less acutely sensitive species were quite variable between sites. Since these amphipods
demonstrated roughly seven-fold greater tolerance to copper exposure than the deleted Cladocerans, site-
specific copper FAVs were almost double that derived in the updated national database. Although species
lists were variable between sites, the site-specific standards were similar among most sites
(Tables 10-1 and 10-2). The greatest recalculated copper criteria were derived from the southwest regional
database that was one of the two most robust databases. The lowest copper FAV was derived from the Santa
Cruz near Tucson database, where the FAV was set to the lowest SMAV. Although the FAVs and FCVs
were not diverse among sites, modifying the criteria with site-specific average hardness resulted in substantial
differences between sites (Tables 10-1 and 10-2).
In summary, the recalculation procedure for copper provided substantial site-specific differences in criteria
concentrations in arid West study streams compared to national criteria. Unlike ammonia, we found a
substantial increase in all site-specific criteria compared to national or updated national AWQC (Table 10-2).
10.2.4 Diazinon
Diazinon criteria provided an opportunity to evaluate the recalculation procedure using a nonmetal
contaminant for which no final EPA national criteria have yet been established. The environmental
significance of diazinon exposure is gaining concern in arid West states such as California, where diazinon
runoff from the San Joaquin Valley is resulting in frequent exposure to aquatic life (Werner et al. 2004).
Furthermore, diazinon as been suspect in WET testing failures of urban wastewater dominated streams. Our
updated criteria were slightly greater than the criteria presented in the (2000) Diazinon Draft (0.22 vs.
0.19 µg/L), which was the result of the increased number of genera that were added to the acute database in
our critical review and update of the national criteria (Chapter 6).
Diazinon toxicity databases that reflect the taxonomic profiles for each site were used to calculate criteria that
are uniquely protective of resident organisms or their close surrogates. Only one site failed to meet the AWS-
MDRs (Santa Cruz River near Tucson), but alternative methods for FAV derivation were successful in

Evaluation of the EPA Recalculation Procedure Technical Report in the Arid West 10-11 May 2006
generating site-specific criteria. Generally, the two regional criteria were similar to their respective site-
specific criteria, and might be helpful in investigating sites beyond those evaluated in the present study.
Resulting site-specific diazinon criteria were substantially greater (i.e., less restrictive) than the updated
national criteria. As explained in our aluminum summary above, the relative sensitivity and variability of the
four most sensitive taxa are the most influential factors in calculating the FAV. The national database
contains sensitive organisms with a high variability in the GMAVs, which resulted in very restrictive national
criteria. The hundredfold increase in the site-specific diazinon criteria was therefore due to removal of the
most sensitive amphipod (Gammarus fasciatus) and the three Cladoceran species that essentially drove the
updated national criterion. Additionally, the site-specific databases, with the cladocerans and amphipod
removed, are half as variable as the national update, which increases confidence in respective estimates and
results in greater values. This added confidence in the FAV calculations, in addition to the loss of more
sensitive organisms, led to the considerably less restrictive site-specific diazinon criteria.
Furthermore, the site-specific criterion for diazinon was more variable between sites (8.56 – 12.72 µg/L) than
other criteria in this analysis. This variability was partly due to the manipulation of diazinon’s moderately
sized toxicity database with respect to the resident species lists. Although the most sensitive organisms are
similar between most sites, the variability in database size between sites was substantially different. The
numbers of species in the site-specific databases range from 8 to 18, resulting in dissimilar degrees of
freedom assigned to the 5th percentile organisms. It is also important to note that the greatest site-specific
criterion, derived for the Salt/Gila Rivers site was the result of having a high N in conjunction with a unique
assemblage of less sensitive species that were specific to the site. The significant increase of the recalculated
criterion and the variability of criterion between sites provide some evidence that moderately sized databases
are uniquely sensitive to the arid West recalculation procedure. This sensitivity supports our opinion that the
arid West recalculation procedure can be useful when establishing diazinon AWQC for effluent dominated
streams.
10.2.5 Zinc
Substantial additions to the acute and chronic toxicity databases were made during our update of the current
national zinc criteria (EPA 1996). The number of genera in the acute database was increased from 36 to 61
and the chronic database increased from 7 to 10 genera. Two sensitive species were added that previously did
not exist in the national database that directly influenced the derivation of the updated national acute criteria,
and four toxicity values for Cottus bairdii were added from two separate published sources (Woodling et al.
2002; Brinkman and Woodling 2005). These data resulted in ranking Cottus as the third most sensitive genus

Evaluation of the EPA Recalculation Procedure Technical Report in the Arid West 10-12 May 2006
when normalized for hardness. Additionally, new data on acute zinc toxicity to Thymallus articus (Buhl and
Hamilton 1990) ranked Thymallus as the fourth most sensitive genus. Although more sensitive organisms are
represented, the larger acute database resulted in updated national acute criteria that were slightly less
restrictive than the 1996 zinc criteria.
Although significant additions were made to the national chronic database, the “eight family rule” was still
not satisfied. Generally, chronic data are lacking the diversity and robustness seen in the acute database. We
were able to refine the FACR from 1.9940 to 2.3726 after addition of newly paired acute and chronic data.
This slight adjustment resulted in updated chronic criteria, which are more restrictive than the updated acute
criteria. Furthermore, unlike current EPA criteria, chronic values are less restrictive than acute values after
application of the conversion factors for dissolved criteria (Table 7-7). Setting a chronic criterion to be higher
than the acute criterion is not biologically plausible; therefore the revised FACR is a noteworthy
improvement.
Application of the arid West deletion process and subsequent removal of zooplankton resulted in exclusion of
half of the species found in the updated national database. These reductions in database size alone could have
resulted in more restrictive criteria (e.g., Figure 10-1). However the retained species were generally less
sensitive to zinc than the national database. The four most sensitive species in most of the site-specific
databases contained three fish and one invertebrate species. This was the same pattern of organisms found in
the updated national database, supporting our observation that fish are as acutely sensitive to zinc exposure as
invertebrates, even after the most sensitive Ceriodaphnia genus was removed.
With the most sensitive zooplankton species in the updated national database removed, the recalculation
procedure resulted in less restrictive site-specific criteria than updated national criteria. The difference
between site-specific criteria and updated national criteria (Tables 10-1 and 10-2) could have been greater, but
the generally high variability among the four most sensitive species and the reduced size of the site-specific
databases restrained the final acute value derivations. Low numbers of organisms found in the Santa Cruz
sites lowered these site-specific criteria by reducing the degrees of freedom, which also led to MDR failure at
the Santa Cruz near Tucson site.
In general, the arid West recalculation procedure applied to the updated national zinc database successfully
generates site-specific criteria that reflect the relative sensitivity of organisms at the site, rather than criteria
that strictly reflect a change in database size. The species composition of the site-specific databases and
ranking were variable among sites, which greatly influenced the variability in the recalculated criteria.

Evaluation of the EPA Recalculation Procedure Technical Report in the Arid West 10-13 May 2006
Initiating the deletion process with the robust updated database makes it more likely the site-specific
databases will reflect the unique species composition for each arid West site. The significant improvements
made when updating the national criteria, coupled with the diversity of resident taxa found in site-specific
databases, produces scientifically defendable site-specific zinc criteria.
10.3 LITERATURE CITED
Arthur, J.W., C.W. West, K.N. Allen, and S.F. Hedtke. 1987. Seasonal toxicity of ammonia to five fish and nine invertebrate species. Bulletin of Environmental Contamination and Toxicology 38:324-331.
Brinkman, S., and J. Woodling. 2005. Zinc toxicity to the mottled sculpin (Cottus bairdi) in high-hardness
water. Environmental Toxicology and Chemistry 24(6):1515-1571. Buhl, K.J., and S.J. Hamilton. 1990. Comparative toxicity of inorganic contaminants released by Placer
Mining to early life stages of salmonids. Ecotoxicology and Environmental Safety 20:325-342. Koivisto, S., M. Ketola, and M. Walls. 1992. Comparison of five cladoceran species in short- and long-term
copper exposure. Hydrobiol. 248(2):125-136. Pima County Wastewater Management. 2002. Habitat Characterization Study: Final Report. Prepared in
support of the Arid West Water Quality Research Project by Camp Dresser & McKee, in association with URS, Chadwick Ecological Consultants, Inc., EPG (Environmental Planning Group), and Risk Sciences.
Pima County Wastewater Management Department. 2005. Evaluation of the Reliability of Biotic Ligand
Model Predictions for Copper Toxicity in Waters Characteristic of the Arid West: Draft Final Report. Prepared in support of the Arid West Water Quality Research Project by Parametrix. Inc., in collaboration with HydroQual, Inc.
Stephan, C.E., D.I. Mount, D.J. Hansen, J.H. Gentile, G.A. Chapman, W.A. Brungs. 1985. Guidelines for
Deriving Numerical National Water Quality Criteria for the Protection of Aquatic Organisms and Their Uses. Accession No. PB-85-227049. National Technical Information Service, Springfield, VA.
U.S. Environmental Protection Agency. 1985. Ambient Water Quality Criteria for Copper - 1984. EPA 449.5-84-031. Office of Water, Washington, DC.
U.S. Environmental Protection Agency. 1987. Ambient Water Quality Criteria for Zinc - 1987.
EPA-440/5-87-003. Office of Water, Washington, DC. U.S. Environmental Protection Agency. 1994. EPA Interim Guidance on Determination and Use of Water-
Effect Ratios for Metals. EPA-823-B-94-001. Office of Water, Washington, DC. U.S. Environmental Protection Agency. 1996. 1995 Updates: Water Quality Criteria Documents for the
Protection of Aquatic Life in Ambient Water. EPA-820-B-96-001. Office of Water, Washington, DC. U.S. Environmental Protection Agency. 2000. Draft Ambient Aquatic Life Water Quality Criteria Diazinon.
CAS Registry No. 333-41-5. Office of Water, Washington, DC. U.S. Environmental Protection Agency. 2002. National Recommended Water Quality Criteria.
EPA-822-R-02-047. Office of Water, Washington, DC.

Evaluation of the EPA Recalculation Procedure Technical Report in the Arid West 10-14 May 2006
U.S. Environmental Protection Agency. 2003. 2003 Update of Ambient Water Quality Criteria for Copper. CAS Registry No. 7440-50-8. Office of Water, Washington, DC.
Werner, I., F.G. Zalom, M.N. Oliver, L.A. Deanovic, T.S. Kimball, J.D. Henderson, B.W. Wilson,
W. Krieger, and W.W. Wallender. 2004. Toxicity of storm-water runoff after dormant spray application in a french prune orchard, Glenn County, California, USA: temporal patterns and the effect of ground covers. Environmental Toxicology and Chemistry 23(11):2719-26.
Woodling, J., S. Brinkman, and S. Albeke. 2002. Acute and chronic toxicity of zinc to the mottled sculpin
Cottus bairdi. Environmental Toxicology and Chemistry 21(9):1922-1926.

Evaluation of the EPA Recalculation Procedure Technical Report in the Arid West 11-1 May 2006
11.0 RECOMMENDATIONS
11.1 CONCLUSIONS
11.1.1 Factors Affecting Recalculation “Success”
Based on our analysis, the recalculation procedure can be a useful tool, particularly when modified and
applied to arid West streams as recommended in this report. The results of recalculated site-specific criteria
were successful for some, but not all AWQC reviewed in this analysis. Success was measured by a change in
values of at least 10% from the updated national criteria (any change less than this may or may not be worth
the effort) and the biological relevance of the site-specific values.
Successful recalculations conducted in this effort include copper, diazinon and zinc. These toxicants
produced universally less restrictive criteria than updated national criteria, while ensuring the same levels of
protection for resident fauna for all study streams. Site-specific criteria for diazinon were in general similar
among all sites, whereas copper and zinc site-specific criteria were variable among sites. This variability
reflected the differences in sensitivity of resident species and community composition between sites, as well
as the size of the toxicity database when initiating the deletion process and overlap of resident species with
the national toxicity database. It is clear that starting the deletion process for criteria with a more robust
toxicity database increases the chance the taxa retained for each site will vary, which then influences the final
values.
Criteria that were generally unsuccessful at deriving biologically relevant and/or significant changes
compared to national AWQC include ammonia and aluminum, but for two different reasons. For ammonia,
the primary reasons are: 1) ammonia criteria are already partitioned into cold and warm water equations.
This initial separation at the national level essentially removes many non-resident arid West taxa from the
national database, which generates a refined toxicity database for initiating the step-wise deletion process; and
2) the most sensitive species in the updated warm water database are all resident to the arid West. If resident
species lists are similar to the toxicity database, the resulting site-specific criteria will be similar.
The issues with recalculation for aluminum criteria were the result of the relatively limited number of species
in the updated national toxicity database. Once non-resident taxa were removed during the deletion process,
the “sample size effect” overwhelmed the resulting site-specific criteria. Until more aluminum toxicity data
are available for more aquatic organisms common to the arid West, it may be more appropriate to adopt the

Evaluation of the EPA Recalculation Procedure Technical Report in the Arid West 11-2 May 2006
updated national criterion developed in this study, which now incorporates a hardness modification, rather
than initiating site-specific standards via the recalculation procedure.
11.1.2 Data Needs and Effort Involved in Recalculation
Although results from the recalculation procedure could successfully be used to derive scientifically
defensible site-specific criteria, the tasks involved require considerable effort. The EPA prefers the toxicity
database for each criterion to be updated prior to the recalculation, since many of the criteria are based on
documents produced up to 20 years ago. This initial step can take considerable effort, especially for the older
criteria that have many years of studies to track down and review. Chapters 3 through 7 of this report present
the results of this initial step for aluminum, ammonia, copper, diazinon, and zinc AWQC. These updated
databases (Appendix 2) can be used as a starting point for future updates to these criteria.
Furthermore, relevant invertebrate and fish population data are required for the development of resident
species lists. If no monitoring data exists for a particular stream segment, data from similar rivers in the
region could be used. However, there is a chance these data are not very representative of species found at
your site. Rather than taking this chance, invertebrate and fish population monitoring plans should be
initiated and maintained in the reach of interest.
11.1.3 Is it Worth the Effort?
Regardless of the outcome of the recalculation values, we believe our analysis shows that the investment will
be worth the effort. Specifically, the findings assure that any resulting criteria are more relevant for a
particular stream than a generalized, often out-dated national value. In fact, simply updating the national
criteria, without proceeding with the recalculation procedure, can be worth the effort by establishing more
confidence in the calculated values. Alternatively, regional-specific recalculated criteria, such as those
presented here for the Southwest and High Plains, would be a cost-effective and protective solution for
smaller dischargers in these regions.
11.2 RECOMMENDATIONS
Completion of this analysis of the recalculation procedure in arid West streams has generated the following
recommendations:
1) Adopt the arid West modifications to the recalculation procedure outlined in Chapter 8. These
modifications include:
o Use of a revised arid West eight family rule (AW-MDRs), which was specifically designed
to better represent aquatic communities expected to occur in arid West stream segments
relative to the default eight family rule.

Evaluation of the EPA Recalculation Procedure Technical Report in the Arid West 11-3 May 2006
o Use of the refined step-wise deltion process for deriving site-specific toxicity databases.
o Conducting the recalculation procedure on the species level (with SMAVs), rather than at the
genus level (with GMAVS) that is presently used in AWQC derivation. Use of SMAVs
maximizes the size of the toxicity database, which is particularly important in effluent-
dependent waters that may posses limited numbers of resident species.
2) Develop a resident species list for each river segment of interest for development of a site-specific
water quality standard.
o Based the species list on existing monitoring program, if this effort has already been
established.
o Establish a monitoring program if none exists.
Data collected should include both fish and invertebrate communities.
Efforts can be shared with other dischargers in the basin and potentially coordinated
with State and Federal agencies.
3) Support continued updates of existing EPA AWQC.
o Recommend that the EPA update their older criteria.
Permits would then be based on AWQC using most up-to-date toxicity data and
information.
o Alternatively, updates can be completed by other entities.
AWWQRP special project
WESTCAS
Other consortium?
o However, any update must be approved by the EPA, as well as State and local authorities.
This should be done as an open, multi-stakeholder process to ensure any approach would be
acceptable at all levels of regulatory authority.
4) It is imperative that more toxicity testing for all AWQC be conducted with species resident to arid
West streams.
o Concentrate on criteria of interest to arid West rivers and criteria with more limited databases
(e.g., aluminum, daizinon).
o Funding for these tests could come from interested parties,
USEPA
AWWQRP
WESTCAS
others?
Evaluation of the EPA Recalculation Procedure Technical Report in the Arid West A1-1 May 2006
APPENDIX 1 DATA COLLECTION USED FOR DEVELOPING RESIDENT SPECIES LIST
Evaluation of the EPA Recalculation Procedure Technical Report in the Arid West A2-1 May 2006
APPENDIX 2 UPDATED TOXICITY DATABASES FOR CRITERIA DEVELOPMENT

Evaluation of the EPA Recalculation Procedure Technical Report in the Arid West A3-1 May 2006
APPENDIX 3 RECALCULATION WORKSHEETS


