AREVA Credit update
Pierre AUBOUIN, Chief Financial Executive OfficerPierre FOURRIER, Group Treasurer
January 2012
AREVA – Credit Roadshow – January 11, 12 & 13, 2012 – p.2
Table of Contents
Introduction
Market outlook
Positioning and strategy
Performance plan
Financial outlook
Conclusion
AREVA – Credit Roadshow – January 11, 12 & 13, 2012 – p.3
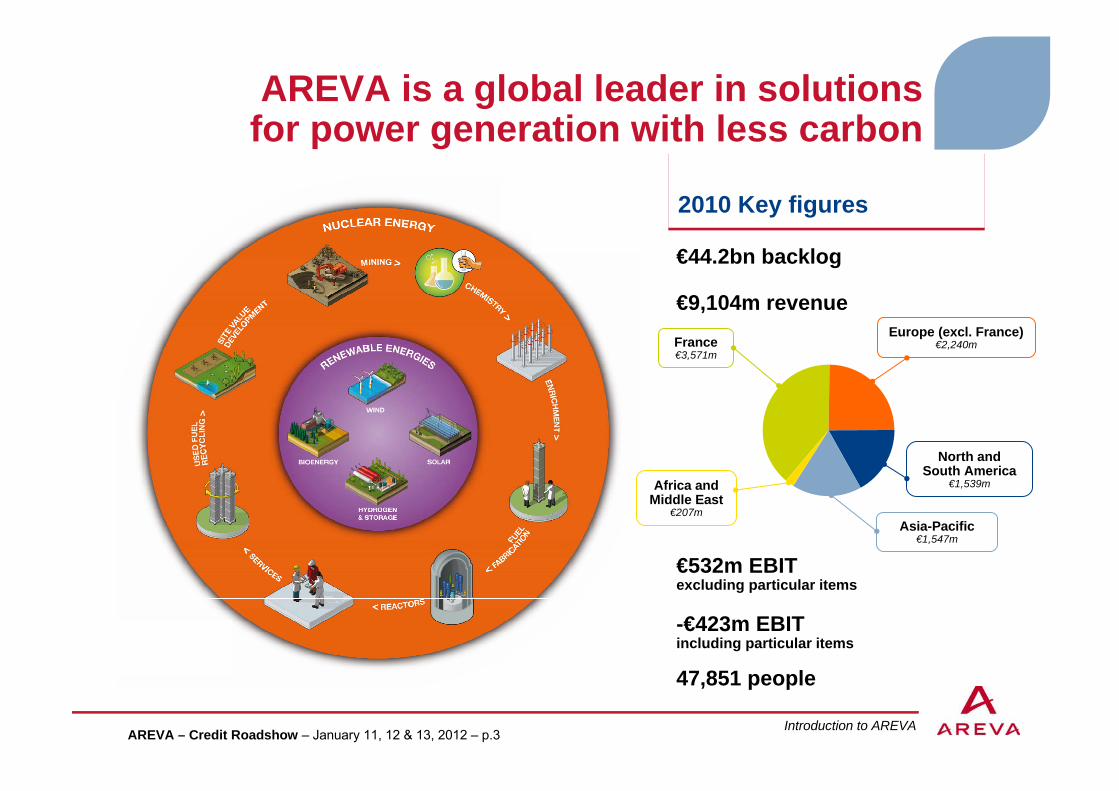
AREVA is a global leader in solutions for power generation with less carbon
€9,104m revenue
€44.2bn backlog
€532m EBIT excluding particular items
47,851 people
-€423m EBIT including particular items
2010 Key figures 2010 Key figures
Introduction to AREVA
France €3,571m
Europe (excl. France) €2,240m
Africa and Middle East
€207mAsia-Pacific
€1,547m
North and South America
€1,539m

AREVA – Credit Roadshow – January 11, 12 & 13, 2012 – p.4
44,06243,122
H1 2011 key figures
4,1583,997
Backlog (in millions of euros) Backlog (in millions of euros) Revenue (in millions of euros) Revenue (in millions of euros)
Operating income (in millions of euros)Operating income (in millions of euros)
H1 2010 H1 2011 H1 2010 H1 2011
-2.1% -3.9%
H1 2010 H1 2011
Net debt (in millions of euros) Net debt (in millions of euros)
2009 H1 2011
6,193
2,7723,672
2010
Gearing 45% 28% 22%
€-3,421m
€(485)m €710mReportedoperating income
213
62
€-151mExcluding particular items

AREVA – Credit Roadshow – January 11, 12 & 13, 2012 – p.5
Context of the “Action 2016” plan
*Excluding the acquisition of AREVA NP shares from Siemens
10 billion-euro capital expenditure program over the period* 2007-2011€10bn Capex financed internally by operations for 33%Financing gap filled through a significant asset disposal program, a share capital increase, and debt increaseFree operating cash flow has been negative since 2006
Energy market forecasts are subject to questions in the aftermath of the Fukushima accident and the financial crisis
Share of nuclear power in the energy mix and timing of ramp-up Pace of growth in renewable energies
AREVA launched a comprehensive review of its activities, their outlook and corresponding resource needs which lead to the “Action 2016” plan released on Dec 13th, 2011, with notably the following objectives:
Improvement of operating performanceStrengthening of AREVA financial profileContinuous focus on safety and security as key business driver
Based on the above, S&P assigned a BBB- rating with stable outlook

AREVA – Credit Roadshow – January 11, 12 & 13, 2012 – p.6
Financial outlook 2011
Revenue
EBITDA
Free operatingcash flow
Provisions identified for fiscal year ended December 31, 2011Provisions identified for fiscal year ended December 31, 2011
Operating income between -€1.4bn and -€1.6bn
> €8.9bn
> €890m
> -€2.9bn
> €240m*Excl. Siemens effects
> -€1.8bn**Excl. Siemens effects
€1.46bn impairment of mining assetsrelated to UraMin acquisition in 2007€800m of provisions for contingenciesand expenses likely to result in future cash outflows (including €150m relatedto the OL3 project) €100m of impairment of non-currentassets related to industrial facilities(capacity utilization outlook reviseddownwards)
Constant consolidation scope* €648m penalty from Siemens** €648m penalty from Siemens and acquisition of AREVA NP shares for €1,679m
Backlog c. €44bn

AREVA – Credit Roadshow – January 11, 12 & 13, 2012 – p.7
Framépargne*
Credit Agricole S.A.Total
EDF
73%
French State
CEA
CDC
AREVA current ownership structure
French Atomic Energy Research Organization, public body established in 1945 Active in three main fields : Energy, information and health technologies, defense and national security By law, CEA must retain the majority of AREVA’s capital€3.4bn annual spending (2007)
French financial organization created in 1816, part of the Government institutions under the control of the ParliamentInvests in long-term projects to serve France’s public interests and economic development; supports public policies, companies and local authoritiesAAA/Aaa with a consolidated balance sheet of €221bn
Total French State: 87%(CEA + French State + CDC)
CDC
3,3%
CEA
73%
Free float 4%
Note: Shareholding structure as at 30/06/2011 * Employees’ shareholding in AREVA
Kuwait Investment Authority entered AREVA’s capital in December, 2010.KIA took a 4,8% share in AREVA’s capital for €600m, along with the French State which took another €300m share.
KIA
4,8%
10,2%
3,3%4,8%
KIA 0,2% 2,2%0,9%
0,9%
AREVA latest financial results
AREVA – Credit Roadshow – January 11, 12 & 13, 2012 – p.8
Introduction
Market outlook
Positioning and strategy
Performance plan
Financial outlook
Conclusion
AREVA – Credit Roadshow – January 11, 12 & 13, 2012 – p.9
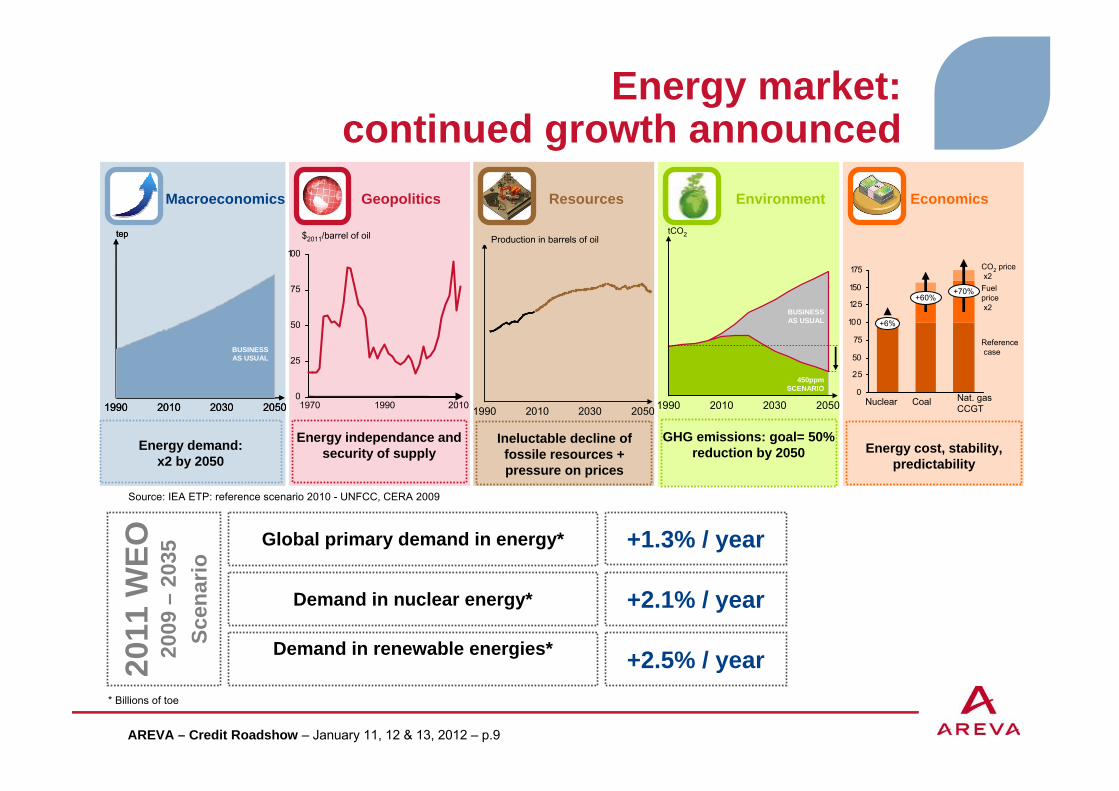
Energy market: continued growth announced
Geopolitics Resources Environment
Limitation of fossilresources
20501990 2010 2030
BarilsGHG emissions cut
by half by 2050
20501990 2010 2030
BUSINESS AS USUAL
450ppm SCENARIO
tCO2
0
25
50
75
100
$2011/barrel of oil
19901970
EconomicsMacroeconomicsEnergy demand multiplied by 2
by 2050
20501990 2010 2030
BUSINESS AS USUAL
tep
20501990 2010 2030
BUSINESS AS USUAL
tep
2010 0
25
50
75
100
125
150
175
+70%+60%
Referencecase
+6%
Fuel pricex2
CO2 pricex2
Nat. gas CCGT
Nuclear Coal
Source: IEA ETP: reference scenario 2010 - UNFCC, CERA 2009
Production in barrels of oil
* Billions of toe
Demand in nuclear energy*
Demand in renewable energies*
+2.1% / year
+2.5% / year2011
WEO
20
09 –
2035
Scen
ario
Global primary demand in energy* +1.3% / year
Ineluctable decline of fossile resources + pressure on prices
GHG emissions: goal= 50% reduction by 2050
Energy independance and security of supply Energy cost, stability,
predictabilityEnergy demand:
x2 by 2050
AREVA – Credit Roadshow – January 11, 12 & 13, 2012 – p.10
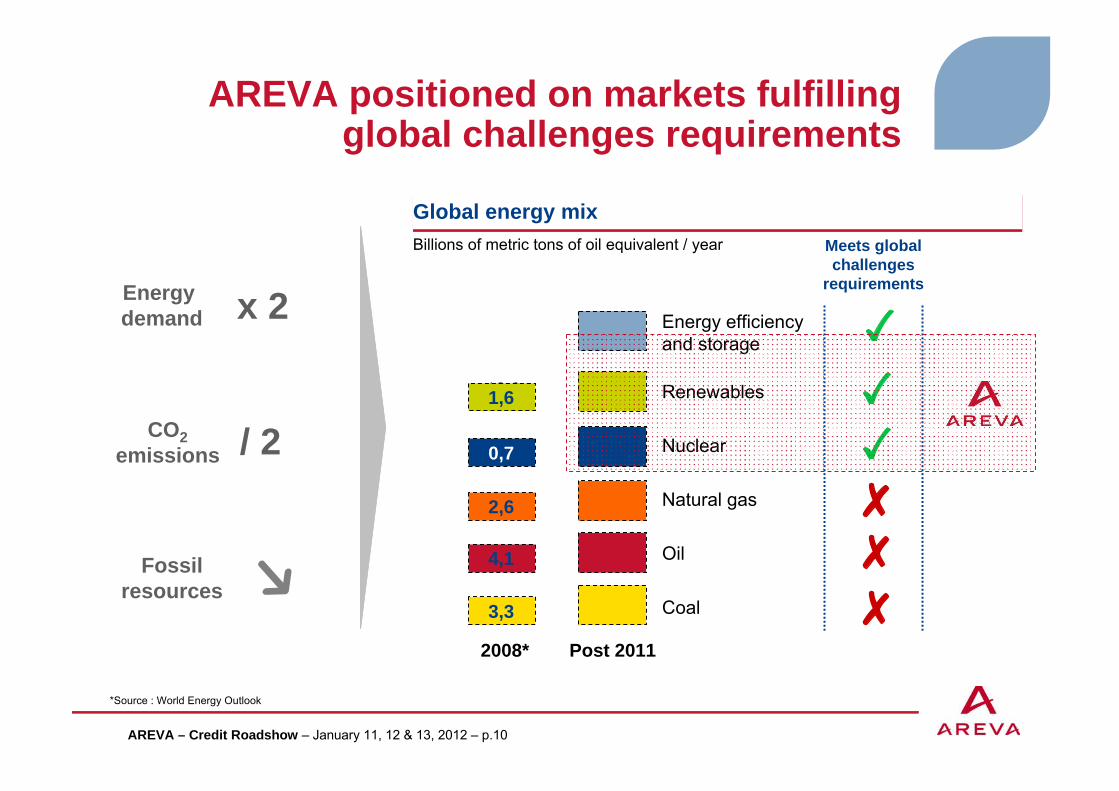
AREVA positioned on markets fulfillingglobal challenges requirements
Coal
Oil
Natural gas
Nuclear
Renewables
Energy efficiencyand storage
2008*
12,3
Billions of metric tons of oil equivalent / year
Global energy mixGlobal energy mix
Fossilresources
x 2Energy demand
CO2emissions / 2
Meets global challenges
requirements
0,7
1,6
2,6
4,1
3,3
Post 2011
*Source : World Energy Outlook
AREVA – Credit Roadshow – January 11, 12 & 13, 2012 – p.11
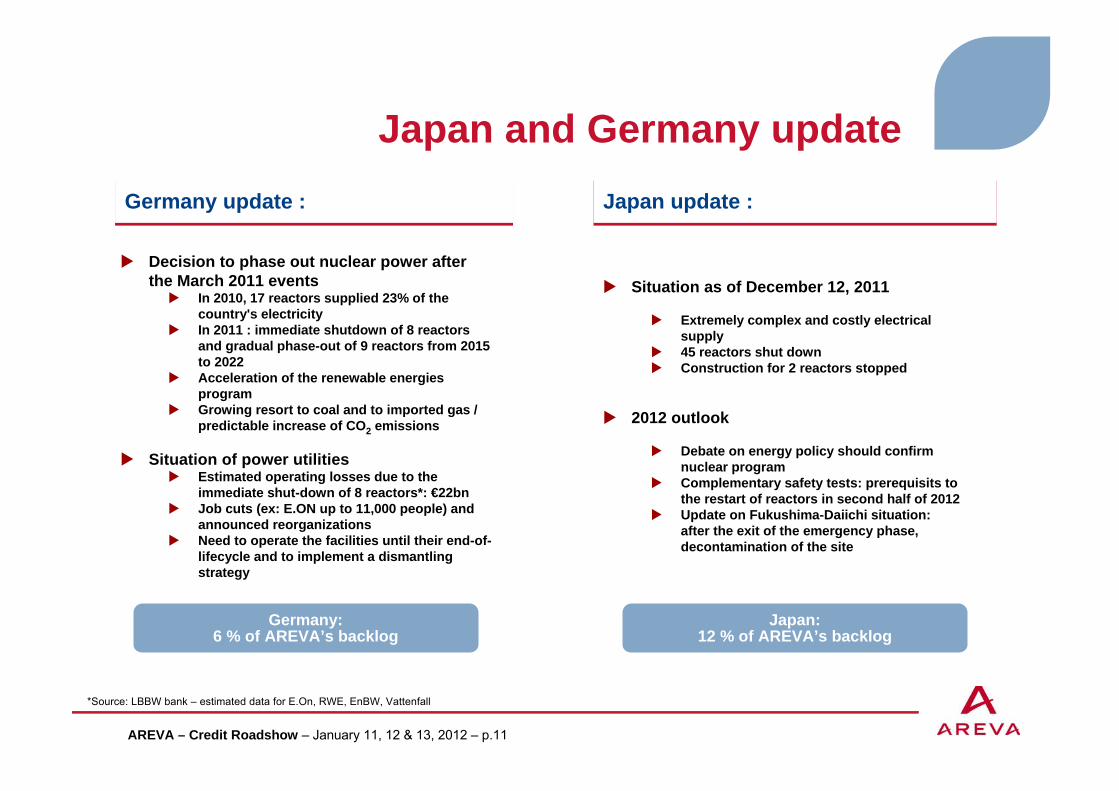
Japan and Germany update
Decision to phase out nuclear power after the March 2011 events
In 2010, 17 reactors supplied 23% of the country's electricityIn 2011 : immediate shutdown of 8 reactors and gradual phase-out of 9 reactors from 2015 to 2022Acceleration of the renewable energies programGrowing resort to coal and to imported gas / predictable increase of CO2 emissions
Situation of power utilitiesEstimated operating losses due to the immediate shut-down of 8 reactors*: €22bn Job cuts (ex: E.ON up to 11,000 people) and announced reorganizationsNeed to operate the facilities until their end-of-lifecycle and to implement a dismantling strategy
Germany update :Germany update :
Situation as of December 12, 2011
Extremely complex and costly electrical supply45 reactors shut downConstruction for 2 reactors stopped
2012 outlook
Debate on energy policy should confirm nuclear programComplementary safety tests: prerequisits to the restart of reactors in second half of 2012Update on Fukushima-Daiichi situation: after the exit of the emergency phase, decontamination of the site
Japan update :Japan update :
Germany: 6 % of AREVA’s backlog
*Source: LBBW bank – estimated data for E.On, RWE, EnBW, Vattenfall
Japan: 12 % of AREVA’s backlog

AREVA – Credit Roadshow – January 11, 12 & 13, 2012 – p.12
Major nuclear programs are confirmed
Gradual phase out of nuclear and / or plants shut downNew builds program frozen / halted
Program for new nuclear reactors abandonedNuclear programs / projects confirmed

AREVA – Credit Roadshow – January 11, 12 & 13, 2012 – p.13
Nuclear scenario: installed capacity growth will be delayed
0
150
300
450
600
350
500
650
2010
2012
2014
2016
2018
2020
2022
2024
2026
2028
2030
2030New buildsLife extensions
Plants shut down
2010
583
378
Growth in installed capacity:+2.2% per year on average until 2030
AREVA 2011 scenario (GWe) AREVA 2011 scenario (GWe) Change in global installed base (GWe)Change in global installed base (GWe)
304
159
AREVA 2010
scenario(262) 190 393 659
AREVA 2010 scenario
AREVA 2011 scenario
Reassessed as of end June 2011
New builds projects are postponed(258)
Incl. 60% in Asia
AREVA – Credit Roadshow – January 11, 12 & 13, 2012 – p.14
Introduction
Market outlook
Positioning and strategy
Performance plan
Financial outlook
Conclusion
AREVA – Credit Roadshow – January 11, 12 & 13, 2012 – p.15
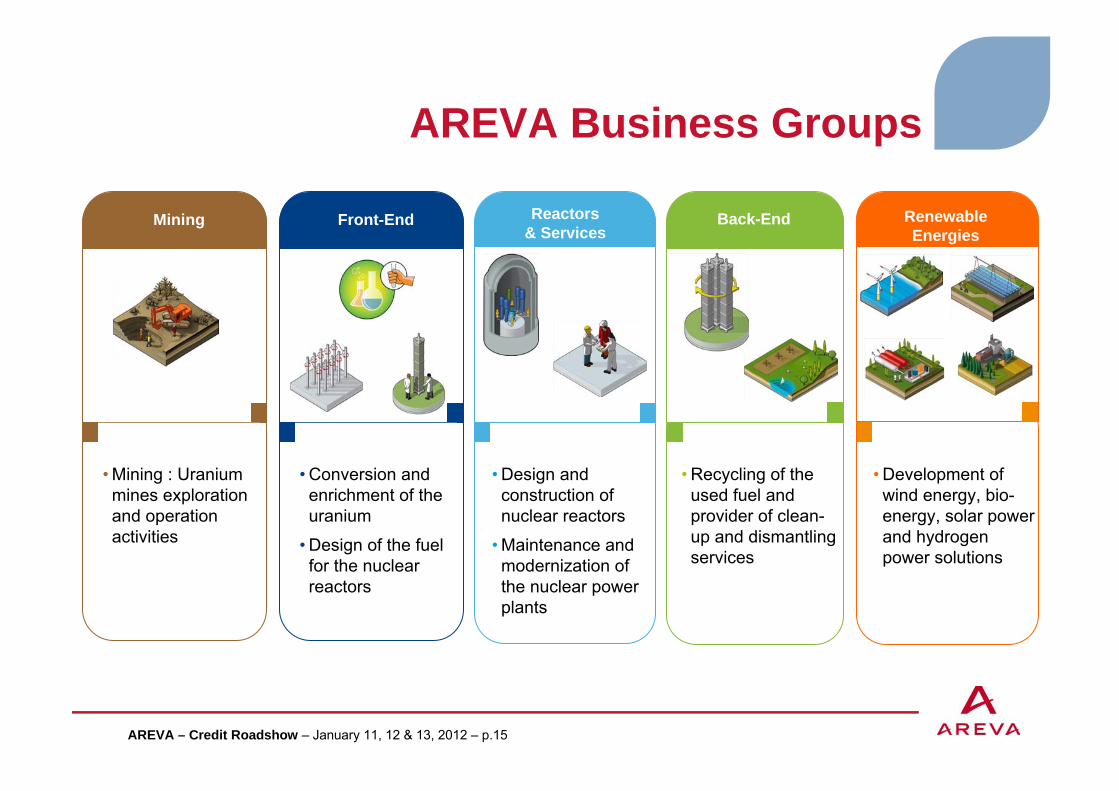
AREVA Business Groups
Mining
• Mining : Uranium mines exploration and operation activities
Reactors & Services
• Design and construction of nuclear reactors
• Maintenance and modernization of the nuclear power plants
Back-End
• Recycling of the used fuel and provider of clean-up and dismantling services
Renewable Energies
• Development of wind energy, bio-energy, solar power and hydrogen power solutions
Front-End
• Conversion and enrichment of the uranium
• Design of the fuel for the nuclear reactors

AREVA – Credit Roadshow – January 11, 12 & 13, 2012 – p.16
Nuclear and renewables:a consistent offering
AREVA’s portfolio of solutions…AREVA’s portfolio of solutions… …creating value thanks to strong synergies…creating value thanks to strong synergies
Commercial
Leveraging established relations with utilities across the world
Securing access to front-end resources and recycling for nuclear plant customers
Proposing a global answer to the CO2 challenges of customers
Financial Smoothing activity with a portfolio of business with different cycles
Technology
Sharing engineering competences and know-how
Visibility over R&D challenges for the whole nuclear value chain, a key enabler for staying ahead in the technological raceR&D and engineering synergies between nuclear and renewable
Competency Attracting and retaining talents thanks to enhanced visibility and reputation
CostDeveloping nuclear supplier base and increasing negotiation power
Mutualising go-to-market costs

AREVA – Credit Roadshow – January 11, 12 & 13, 2012 – p.17
Backlog as of end September 2011Backlog as of end September 2011
Orders: 5 years of revenue in backlog
€43bn in backlog in all AREVA group business lines
More than 50% of our 2012-2015 revenue is in backlog
€2bn
Mining €10bn 9.5 years
€18bn 6.5 years
€7bn 2 years
€6bn 3.5 years
Renouvelables
Front End
Reactors& Services
Back End
Renewables
ValueNumber of years of 2010
revenue in backlog
AREVA – Credit Roadshow – January 11, 12 & 13, 2012 – p.18
0
1 000
2 000
3 000
4 000
5 000
6 000
7 000
8 000
9 000
10 000
2005 2006 2007 2008 2009 2010
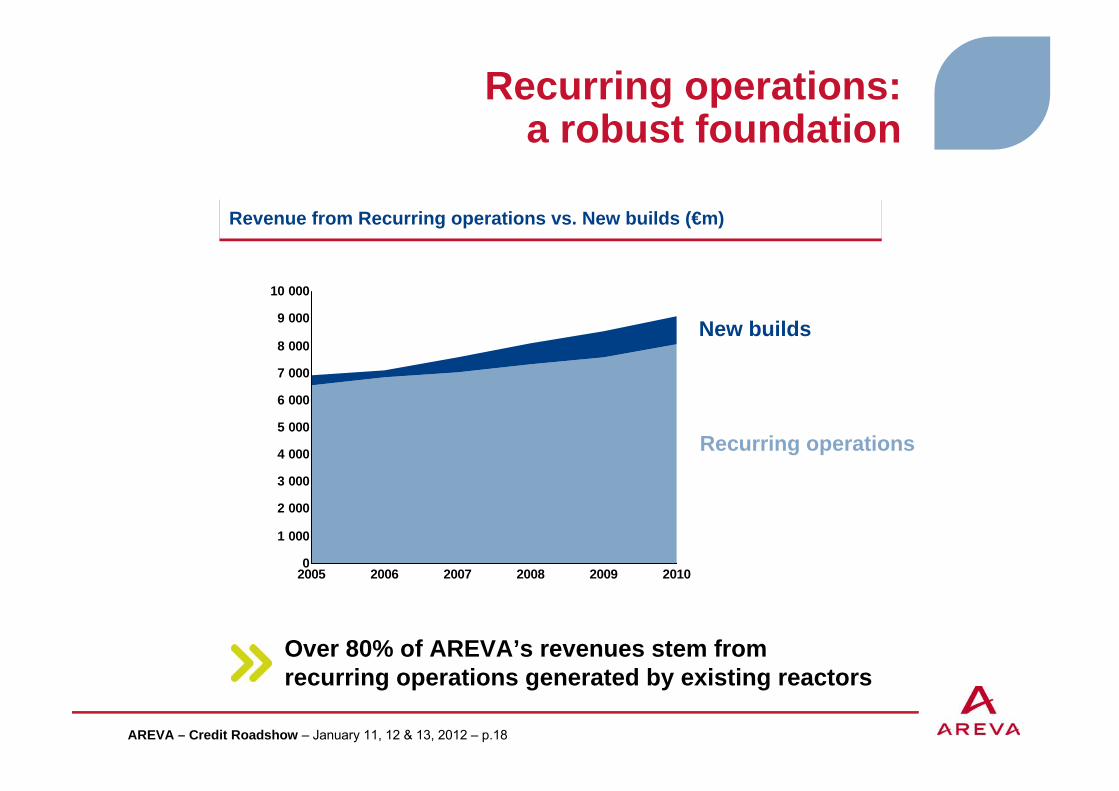
Revenue from Recurring operations vs. New builds (€m)Revenue from Recurring operations vs. New builds (€m)
Over 80% of AREVA’s revenues stem from recurring operations generated by existing reactors
Recurring operations: a robust foundation
Recurring operations
New builds
AREVA – Credit Roadshow – January 11, 12 & 13, 2012 – p.19
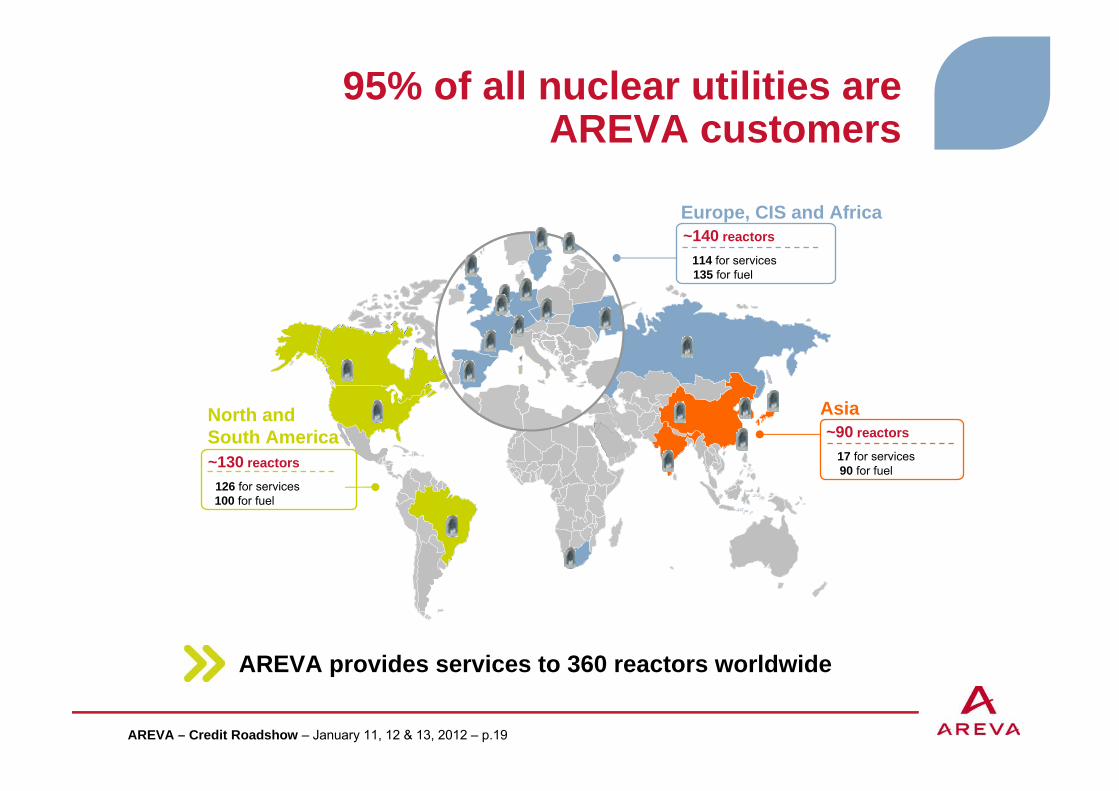
95% of all nuclear utilities are AREVA customers
AREVA provides services to 360 reactors worldwide
~130 reactors
126 for services 100 for fuel
North and South America
~140 reactors
114 for services135 for fuel
Europe, CIS and Africa
~90 reactors
17 for services 90 for fuel
Asia

AREVA – Credit Roadshow – January 11, 12 & 13, 2012 – p.20
2007-2011 capex for our customers’ benefit
Capital expenditure in RenewablesCapital expenditure in Renewables
Capital expenditure in the fuel cycle (Mining/Front End/Back End)Capital expenditure in the fuel cycle (Mining/Front End/Back End)
Development of a diversified portfolio of projects to secure uranium resources
Replacement and improvement of production facilities
Deployment of the most advanced technologies
Expansion of the offering and optimization of nuclear fuel
Building of a portfolio of renewable energy solutionsthrough targeted acquisitions
Capacity development and industrializationof existing activities
Gross capital expenditure, 2007-2011*Gross capital expenditure, 2007-2011*
Total: about €10bn(incl. about €2bn for safety, security, maintenance)
Capital expenditure in Reactors & ServicesCapital expenditure in Reactors & Services
Design and certification of Gen III+ reactors
Optimization of component manufacturing facilities
~40%
~5%~5%
~15%
~30%
Mining
Front End
Reactors & Services
Back EndRenewables
Other
*Excl. acquisition of AREVA NP shares

AREVA – Credit Roadshow – January 11, 12 & 13, 2012 – p.21
Introduction
Market outlook
Positioning and strategy
Performance plan
Financial outlook
Conclusion

AREVA – Credit Roadshow – January 11, 12 & 13, 2012 – p.22
Improving our performance
Safety Security Transparency
Commercial priority given
to value creation
Selectivity in
capital spendingDebt
management

AREVA – Credit Roadshow – January 11, 12 & 13, 2012 – p.23
Strategic objectivesby Business Group
Front End Reactors & Services Back End RenewablesMining
Achieve the best profitability level
Focus capital spending on most profitable assets
Maintain resources and reserves for 20 years of production
Achieve full production at the Georges Besse IIand Comurhex II
facilities
Optimize our industrial footprint to
improve competitiveness
Manage the safety termination of
operations at Eurodif
Increase the commercial footprint in the fuel activity in
Asia
Continue to improve the competitiveness of the EPR reactor
and the qualification of the ATMEA reactor
Contribute to improved reactor
safety and reactor life expansion projects for existing reactors
Participate in growth in Asia
Prepare the technologies of the
future (SMR and Generation IV)
Ensure full usage production capacity at La Hague and Melox
Participate in the development of the
new regional recycling platforms (China, Japan, UK)
Capitalize on our unique experience in fuel cycle facility and reactor dismantling
Expand our leadership in storage and logistics services
Refocus our business portfolio
Turn first projects into landmark contracts
Become a reference leader in offshore wind turbines in
Europe (Germany, France, UK)
Become an reference leader in concentrated
solar power in Asia and the Middle East

AREVA – Credit Roadshow – January 11, 12 & 13, 2012 – p.24
Improving our performance
Safety Security Transparency
Commercial priority given
to value creation
Debt management
Selective capital
expenditure

AREVA – Credit Roadshow – January 11, 12 & 13, 2012 – p.25
Installed base: doubling profitability by 2016
► Reducing the volume of used fuel in the pools (recycling or drystorage) ► Improving pool safety
► Capturing 35% of the accessible market of post-Fukushima safety works (estimated at €3.5bn over 10 years)
Post-Fukushima
safety
Recycling: promoting
safer management approaches for used fuel
Fuel offering ► Expanding integrated offerings in the front end cycle
► Replacing primary components► Installing digital I&C systems
Reactor modernization/ life extension

AREVA – Credit Roadshow – January 11, 12 & 13, 2012 – p.26
New nuclear plants: becoming the reference technology
Ongoing negotiations (bilateral)Ongoing negotiations (bilateral) Ongoing bidsOngoing bids Bids to come (in 3-5 years)Bids to come (in 3-5 years)
Taishan 3-4
Jaitapur 1-2
Hinkley PointC-D
Penly 3
Wylfa 3-4
Temelin 3-4
Calvert Cliff 3Bell BendPiketon
Pyhäjoki
Saoudi Arabia
ESKOM
Delta
Vattenfall
PGE
TVO
GDF Suez – Iberdrola
Ameren
New Brunswick Power
Horizon Nuclear Power
Fennovoima
CEZ
JAEC
CGNPC
NPCIL
EDF
EDF
EDFPPL
Duke Energy

AREVA – Credit Roadshow – January 11, 12 & 13, 2012 – p.27
Contract wins since Fukushima
Fuel cycleFuel cycle Reactors & ServicesReactors & Services Renewable EnergiesRenewable Energies
►Uranium supply and conversion services for a European power company
► Supply of fuel assembly in Japan and in the US
► Supply of 32 steam generators to EDF for 1,300 MW reactors (€1.1bn) in France
► Upgrade of instrumentation and control systems for 20 EDF 1,300 MW reactors (€600m) in France
► Solutions provided to TVA to complete the Bellefonte plant in the US
► Supply of digital instrumentation & control systems for JNPC’s Tianwan3&4 reactors (VVER type) in China
► Supply of services for electrical and I&C systems for Kozloduy 5&6 in Bulgaria
► Supply of forgings for EDF Energy Hinkley Point EPR in the UK
► Agreement with CNNC on safety checks post Fukushima in China
► Supply to TEPCO of a treatment-recycling solution for contaminated water at the Fukushima site in Japan
► Supply of dismantling services with the CEA for the Marcoule site over the 2011-2015 period in France
►Supply of dry storage casks for 2 European customers
►Integrated fuel and related services contract for Xcel Energy (uranium, conversion, enrichment, fuel design and fabrication and related services)
► Construction of a biomass cogeneration plant for Coriance(€45m)
► Construction of a biomass cogeneration plant for Eneco(€155m)
► Selected to be involved in the part 1 of the “Solar Flagships”program in Australia (250 MW)
€5.6bn orders at the end of October, 2011

AREVA – Credit Roadshow – January 11, 12 & 13, 2012 – p.28
Improving our performance
Safety Security Transparency
Commercial priority given
to value creation
Debt management
Selective capital
expenditure
AREVA – Credit Roadshow – January 11, 12 & 13, 2012 – p.29
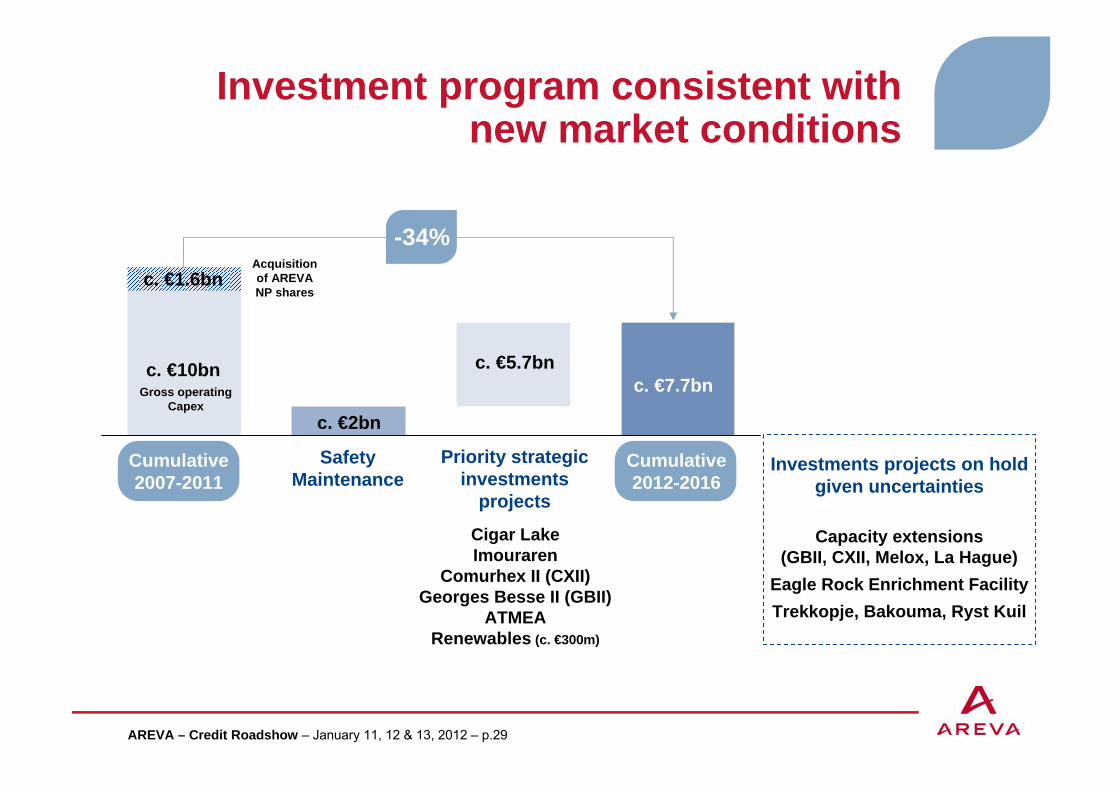
Investment program consistent with new market conditions
Safety Maintenance
Priority strategic investments
projects
Cigar LakeImouraren
Comurhex II (CXII)Georges Besse II (GBII)
ATMEARenewables (c. €300m)
Investments projects on hold given uncertainties
Capacity extensions (GBII, CXII, Melox, La Hague)
Eagle Rock Enrichment FacilityTrekkopje, Bakouma, Ryst Kuil
Cumulative2012-2016
Cumulative2007-2011
c. €5.7bn
c. €2bn
c. €7.7bnc. €10bn
-34%c. €1.6bn
Gross operating Capex
Acquisition of AREVA NP shares
AREVA – Credit Roadshow – January 11, 12 & 13, 2012 – p.30
Capital spending trend 2012-2016
Safety, security, maintenance
Other
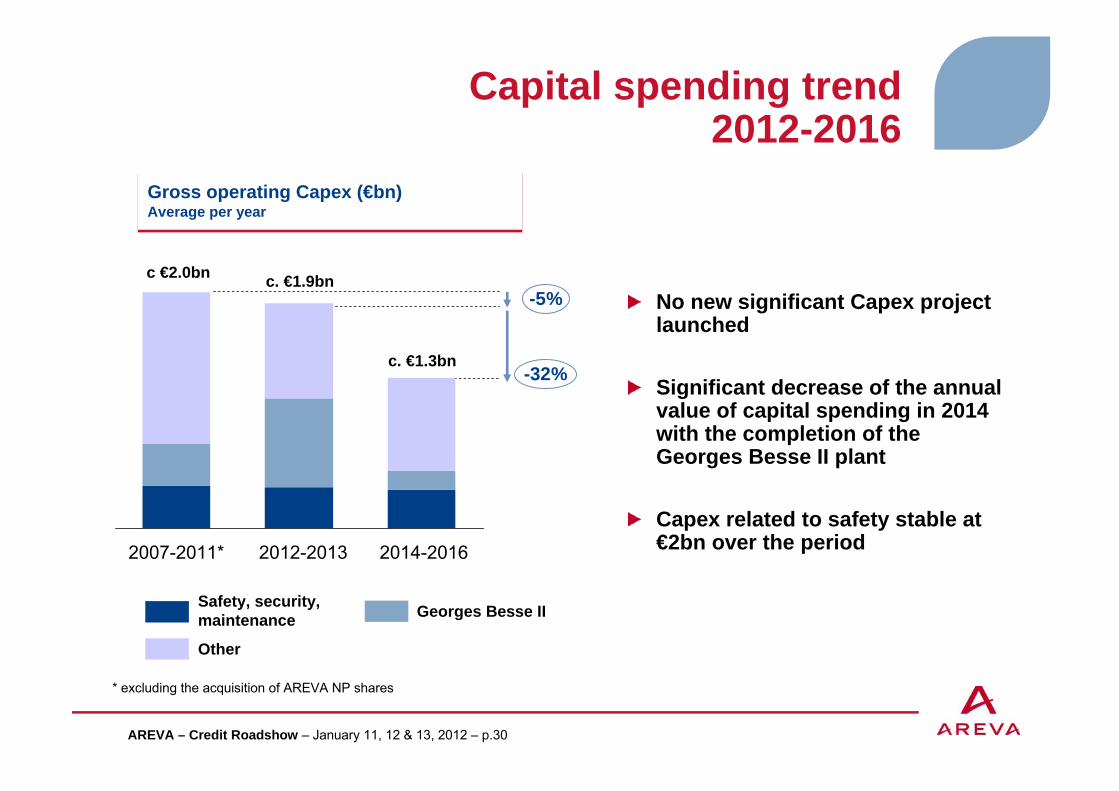
Gross operating Capex (€bn) Average per yearGross operating Capex (€bn) Average per year
c €2.0bn c. €1.9bn
c. €1.3bn
No new significant Capex project launched
Significant decrease of the annual value of capital spending in 2014 with the completion of the Georges Besse II plant
Capex related to safety stable at €2bn over the period
* excluding the acquisition of AREVA NP shares
-32%
-5%
2007-2011* 2014-20162012-2013
Georges Besse II

AREVA – Credit Roadshow – January 11, 12 & 13, 2012 – p.31
Improving our performance
Safety Security Transparency
Commercial priority given
to value creation
Debt management
Selective capital
expenditure

AREVA – Credit Roadshow – January 11, 12 & 13, 2012 – p.32
Financial structure objectives
2012-2013:Limited use of external financing Maintain an
appropriate level of short-term liquidity
Maintain a solid financial structure
2012-2016:Fully self-finance
cumulative Capex*
*vs 33% over 2007-2011 period

AREVA – Credit Roadshow – January 11, 12 & 13, 2012 – p.33
A financing plan in line with the group's financial structure objectives
Plans for disposal / secondary offering of equity interestsPlans for disposal of non-strategic operationsPlans for disposal of minority interests / partnerships in strategic projects or operations
Long-term bond issue program
Cumulative objective 2012-2013> €1.2bn
Capex fully funded from operations from 2014 onwards

AREVA – Credit Roadshow – January 11, 12 & 13, 2012 – p.34
Dividend policy
Approved by the Supervisory Board on June 30, 2009
2012 and 2013 dividend (based on financial statements foryears ending December 31, 2011 and 2012) limited to 25% of consolidated net income group share

AREVA – Credit Roadshow – January 11, 12 & 13, 2012 – p.35
Financial debt profile
2012 2013 2014 2015 2016 2017 2018 2019 2020 2021 2022 2023 2024
Bond issues
No major debt maturing before 2016 Share of fixed rate debt: 70%
* European Investment Bank
EIB loans*
1,250750
1,000
200
200
Average debt maturity: 7,5 years
500750
Maturity of main financial obligations (in million € as of Dec. 31, 2011)Maturity of main financial obligations (in million € as of Dec. 31, 2011)
Commercial paper
450 approx
1 500
2 000
Available credit lines (not utilized)
Total debt drawn : €5,1bn
AREVA – Credit Roadshow – January 11, 12 & 13, 2012 – p.36
Strong liquidity
Cash available on Dec 31st 2011: well above €1bn*
No major short-term debt roll-over
No debt subject to financial covenants
€3.5bn of available committed credit lines
€2bn syndicated facility – maturity 2014
€1.5bn bilateral facilities – maturity 2013
Investment of cash surplus in highly liquid, risk-free short-term assets
Commercial paper program: €2bn (current stock approx €450m)
* net of commercial paper and short-term debt issues
AREVA – Credit Roadshow – January 11, 12 & 13, 2012 – p.37
S&P assessment and key messages
On Dec 20, 2011, S&P reviewed AREVA’s rating to BBB-/A-3 with “stable”outlook
Stable outlook thanks to the “new management’s focus on improving AREVA’s profitability” through the “Action 2016” plan
AREVA benefits from a 3 notches State support
“[…] our opinion that there is a "high" likelihood that the French state would provide timely and sufficient extraordinary support in the event of financial distress”
A downgrade of the French sovereign rating would not impact AREVA’srating
S&P underlines : « a downgrade of France to the 'AA' category would not in itself alter the three notches of uplift that we currently factor into the ratings »

AREVA – Credit Roadshow – January 11, 12 & 13, 2012 – p.38
Improving our performance
Safety Security Transparency
Commercial priority given
to value creation
Selective capital
expenditureDebt
management
AREVA – Credit Roadshow – January 11, 12 & 13, 2012 – p.39
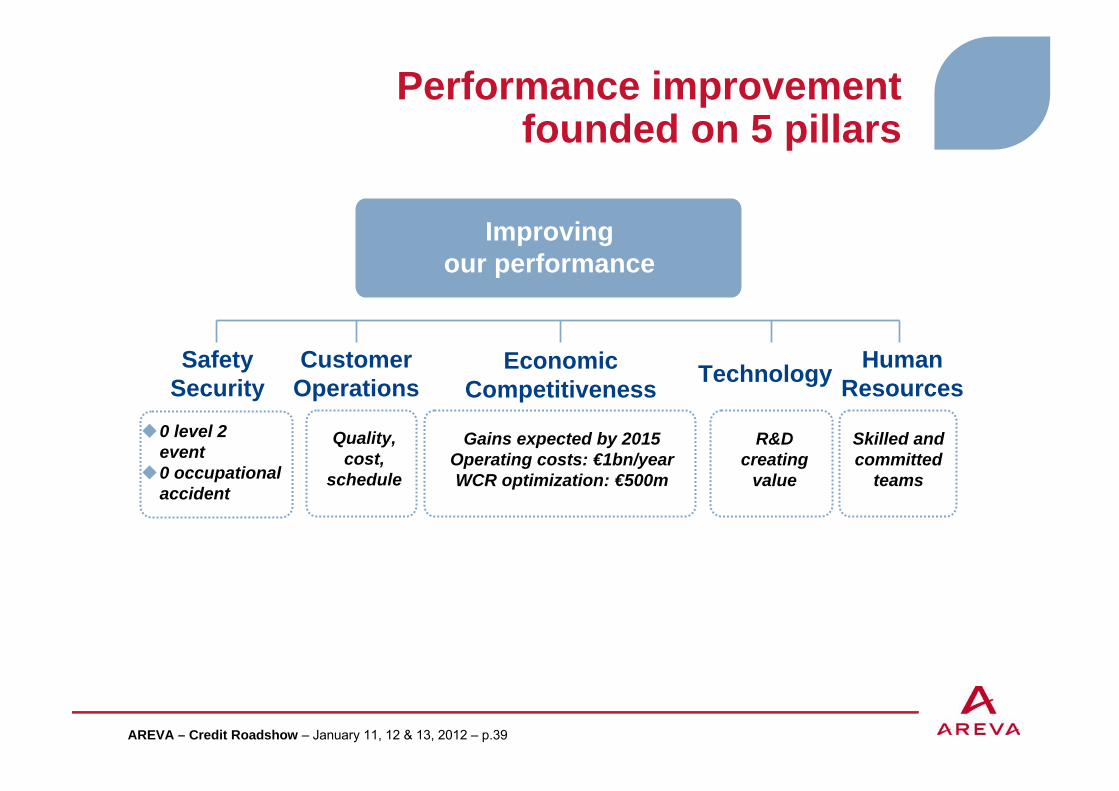
Performance improvement founded on 5 pillars
Improvingour performance
Safety Security
Customer Operations Technology Human
Resources0 level 2event0 occupationalaccident
Quality, cost,
schedule
Skilled and committed
teams
R&D creating
value
Economic Competitiveness
Gains expected by 2015Operating costs: €1bn/yearWCR optimization: €500m

AREVA – Credit Roadshow – January 11, 12 & 13, 2012 – p.40
Focus on economic competitiveness
► 300 documented and monitored initiatives
► Breakdown of operating costs and support functions reduction
70% from gains on external expenses30% from optimization of internal expenses
► 50 documented and monitored initiatives
► Simultaneous efforts concerning all components of WCR
Reduction in inventories (notably GB1–GB2 transition)Optimization of trade receivables and trade payables
Operating costs and support functions
-€1bn/year by 2015(-10% reduction cost base)
Optimization ofworking capital requirement
€500m by 2015(improvement > 15 days of revenue)

AREVA – Credit Roadshow – January 11, 12 & 13, 2012 – p.41
€1bn savings on annual operating cost base
Transition GBI GBII
► Savings of €180m per year as from 2013 on energy consumption thanks to GBII technology innovations
Subcontracting► 70% reduction in engineering
subcontracting by 2013 for a rapid adjustment of resources to lower business levels
Procurement
► Reduction in EPR cost baseline for future projects
► Procurement savings for ongoing projects and recurring business
Support functions
► Internalization of activities► Reduction in IT costs► Decrease in advertising and
sponsorship budgets; reduction of event costs
€700M on external costs€700M on external costs €300M on external costs€300M on external costs
Compensation
Germany
France
Support functions
► Gathering the Parisian sites in La Défense under consideration in 2012
► Bringing together management teams and industrial sites under consideration
► Reduction in the costs/revenue ratio of 15% to 10% by 2015
► Hiring freeze
► Intention to reduce the workforce over the period from 1,200 to 1,500 people*
► Study of possible diversification of Duisburg production
► The Executive Board renounces 2011 bonus
► Intention to freeze salaries in 2012
United States► Reducing the number of sites under
consideration► Expense reduction at head office
* including sub-contracting

AREVA – Credit Roadshow – January 11, 12 & 13, 2012 – p.42
Performance improvementdecisions taken since 2011 2nd half
Support functions and
external expenses
► Reduction in general & administrative, marketing & sales expenses as part of CAP 2012: €200m in savings by the end of 2011, in line with the objectives –acceleration over the 2nd half
► Contracts with external consultants interrupted, communication spending reduced
Operational optimization
► Gradual phase-out of fuel manufacturing operations at the Dessel site in Belgium
► Restructuring of the Biomass business in Brazil► Establishment of a program for mobility towards Renewable energies BG
operations in Germany► Establishment of a program for mobility from Saint-Marcel to Chalon Services
(150 people)► Interruption of Comurhex production for a 2-month period over year-end 2011
Disposals ► Sale of SFAR-CIVAD► Sale of 01DB Metravib
Crosscutting programs
► Simplification or elimination of indicators, reporting requirements and/or tools for a dozen group programs
► "FOCUS" project to improve leadership of customer projects

AREVA – Credit Roadshow – January 11, 12 & 13, 2012 – p.43
Introduction
Market outlook
Positioning and strategy
Performance plan
Financial outlook
Conclusion

AREVA – Credit Roadshow – January 11, 12 & 13, 2012 – p.44
2012-2016 Financial outlook: two distinct phases
Revenue
EBITDA
Capex
Free operating cash flow
excluding disposals
Data at constant consolidation scope
> -€1.5bn > +€1bn p.a.from 2015
Nuclear: +3 to 6% p.a.
> €750m
€1.3bn p.a. on average
on 2014-2016
> €1.25bn
Renewables: > €750m
Nuclear: +5 to 8% p.a.
Renewables: > €1.25bn
€1.9bn p.a. on average
Balanced
2012-2013
Transition period
2014-2016
Safe growthand cash
generation

AREVA – Credit Roadshow – January 11, 12 & 13, 2012 – p.45
Introduction
Market outlook
Positioning and strategy
Performance plan
Financial outlook
Conclusion
AREVA – Credit Roadshow – January 11, 12 & 13, 2012 – p.46
Conclusion
AREVA believes in the future of nuclear and renewable energies
AREVA is consolidating its leadership
AREVA is committed to improving its performanceCAPEX reduction and disposal programFree Operating Cash Flow break even expected by 2014

AREVA – Credit Roadshow – January 11, 12 & 13, 2012 – p.47

AREVA – Credit Roadshow – January 11, 12 & 13, 2012 – p.48
AppendixAppendix 1: Impairment of mining assets stemming from UraMin acquisition
Appendix 2: H1 2011 Key financial indicators
Appendix 3: H1 2011 Key data by BG
Appendix 4: A simplified capital structure
Appendix 5: Detailed market outlooks
Appendix 6: A portfolio of solutions to ensure nuclear safety
Appendix 7: EPR and ATMEA: designed to meet the most demanding nuclear and industrial safety standards
Appendix 8: Integrated business model: an engine for growth / Detailed positioning and strategy by BG
Appendix 9: An engineering force without equivalent
Appendix 10: Human resources: developing the Group's talents
Appendix 11: A performance plan managed and monitored
Appendix 12: Safety and security above all

AREVA – Credit Roadshow – January 11, 12 & 13, 2012 – p.49
Appendix 1: Impairment of mining assetsstemming from UraMin acquisition
Evolution of the impairment tests’hypotheses since June 30, 2011Evolution of the impairment tests’hypotheses since June 30, 2011
Unfavourable revision of (i) the level of deposit’s resources of Trekkopje from 46,2 ktU to 26,0 ktUand (ii) the cost production assumptions, following interpretation of conducted technical analysisAdjustments of the offer-demand balance and downwards evolution of future price expectations on natural uranium market and decision to postpone the start of 3 mining production projects stemming from the acquisition of UraMin(Trekkopje, Bakouma and Ryst Kuil)Revision of the production plan of those projects on the basis of above elements
Provisions identified for the year ended December 31, 2011: €1.46bn additional impairment of the property, plant and equipment and intangible assets capitalized for mining projects stemming from the UraMin acquisition in 2007 (Trekkopje, Bakouma, Ryst Kuil) bringing the net carrying amount of capitalized assets to €410m
ReminderReminder
€426m impairment booked in 2010Reference in the Notes to the consolidated financial statements for the year ended December 31, 2010 and for the half-year endedJune 30, 2011 to deposit’s resourcesof TrekkopjeInterpretation of the analyses resultson Trekkopje in progress as of the date of the closing of June 30, 2011
AREVA – Credit Roadshow – January 11, 12 & 13, 2012 – p.50
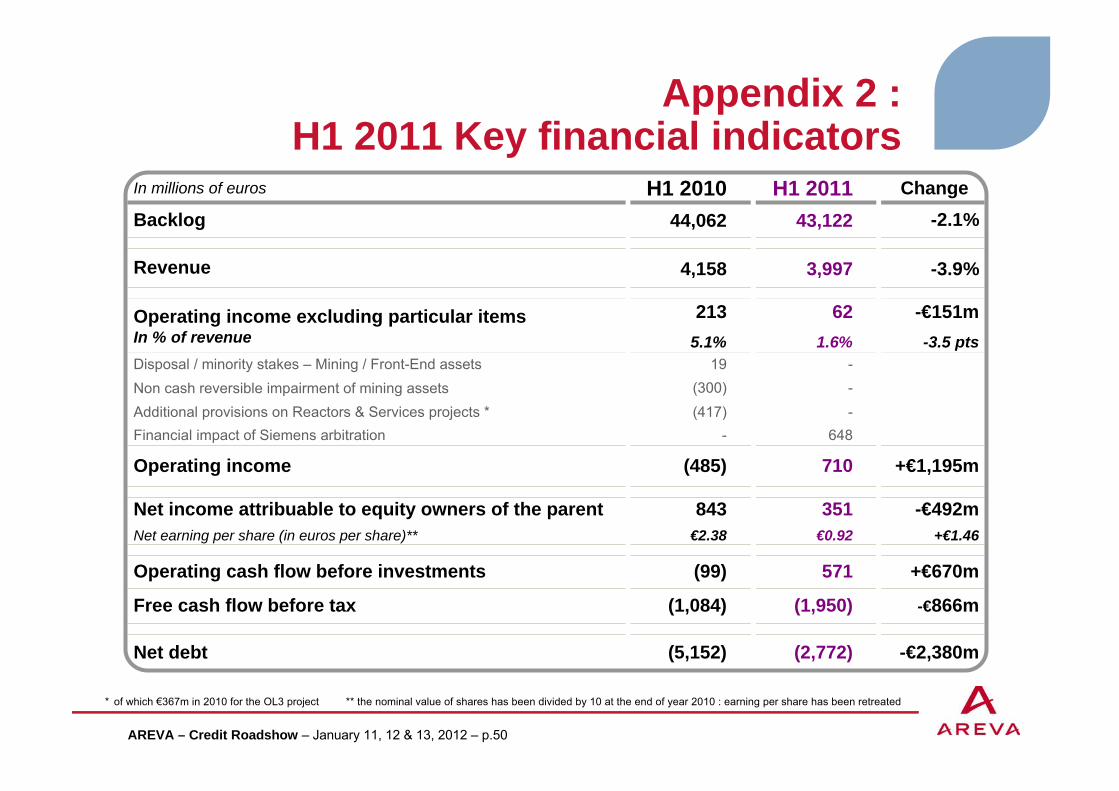
Appendix 2 : H1 2011 Key financial indicators
In millions of euros H1 2010 H1 2011 ChangeBacklog 44,062 43,122 -2.1%
Revenue 4,158 3,997 -3.9%
Operating income excluding particular itemsIn % of revenue
2135.1%
621.6%
-€151m-3.5 pts
Disposal / minority stakes – Mining / Front-End assets 19 -Non cash reversible impairment of mining assets (300) -Additional provisions on Reactors & Services projects * (417) -Financial impact of Siemens arbitration - 648
Operating income (485) 710 +€1,195m
Net income attribuable to equity owners of the parentNet earning per share (in euros per share)**
843€2.38
351€0.92
-€492m+€1.46
Operating cash flow before investments (99) 571 +€670m
Free cash flow before tax (1,084) (1,950) -€866m
Net debt (5,152) (2,772) -€2,380m
* of which €367m in 2010 for the OL3 project ** the nominal value of shares has been divided by 10 at the end of year 2010 : earning per share has been retreated
AREVA – Credit Roadshow – January 11, 12 & 13, 2012 – p.51
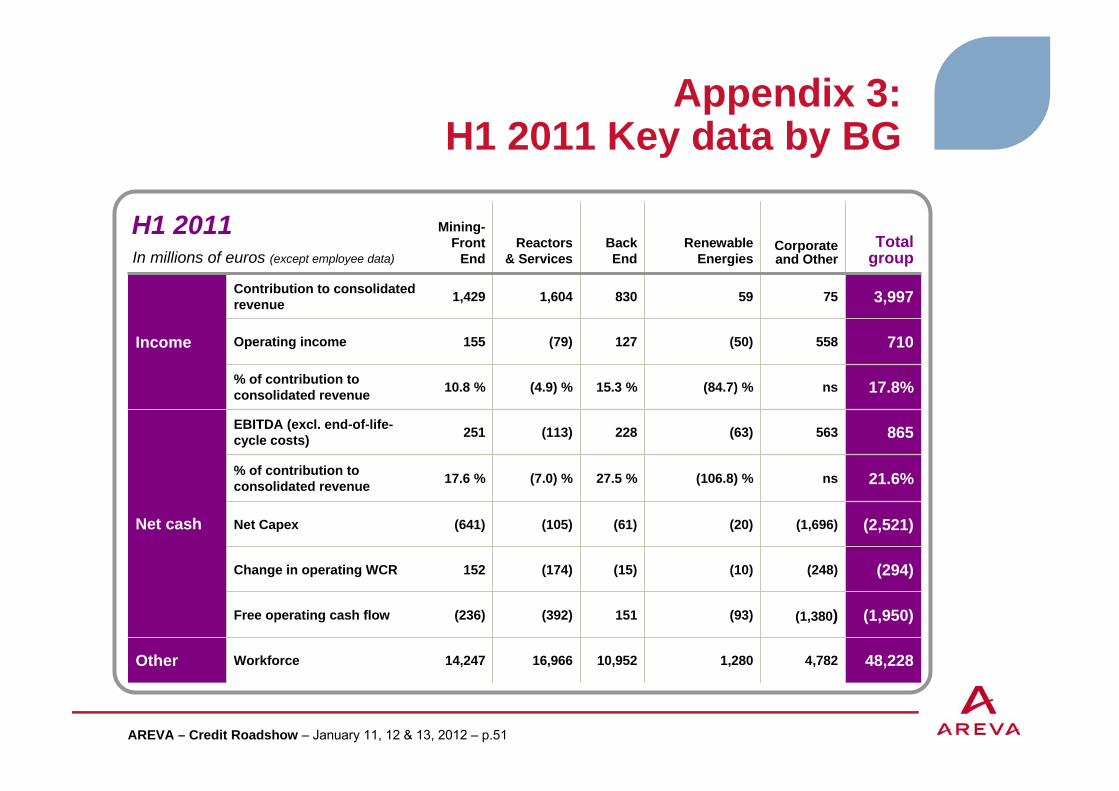
Appendix 3: H1 2011 Key data by BG
In millions of euros (except employee data)
Mining-Front
EndReactors
& ServicesBack End
Renewable Energies
Corporate and Other
Totalgroup
Income
Contribution to consolidated revenue 1,429 1,604 830 59 75 3,997
Operating income 155 (79) 127 (50) 558 710
% of contribution to consolidated revenue 10.8 % (4.9) % 15.3 % (84.7) % ns 17.8%
Net cash
EBITDA (excl. end-of-life-cycle costs) 251 (113) 228 (63) 563 865
% of contribution to consolidated revenue 17.6 % (7.0) % 27.5 % (106.8) % ns 21.6%
Net Capex (641) (105) (61) (20) (1,696) (2,521)
Change in operating WCR 152 (174) (15) (10) (248) (294)
Free operating cash flow (236) (392) 151 (93) (1,380) (1,950)
Other Workforce 14,247 16,966 10,952 1,280 4,782 48,228
H1 2011

AREVA – Credit Roadshow – January 11, 12 & 13, 2012 – p.52
Appendix 3:Mining / Front-End
In millions of euros H1 2010 H1 2011 Change
Backlog 28,590 27,702 -€888m
Contribution to consolidated revenue 1,593 1,429 -10.3%
Op. income excluding particular items In % of revenues
1489.3%
15510.8%
+€7m+1.5 pts
Disposal / new partners in assetsImpairment of mining assets
19(300)
Contribution to operating income (133) 155 +€288m
Free operating cash flow before tax (210) (236) -€26m
Key figuresKey figures

AREVA – Credit Roadshow – January 11, 12 & 13, 2012 – p.53
Appendix 3:Reactors & Services
In millions of euros H1 2010 H1 2011 Change
Backlog 7,964 7,316 -€648m
Contribution to consolidated revenue 1,543 1,604 +4.0%
Op. income excl. particular items In % of revenue
261.7%
(79)(4.9)%
-€105m-6.6 pts
Provisions on projects* (417) -
Contribution to operating income (391) (79) +€312m
Free op. cash flow before tax (420) (392) +€28m
* incl. OL3: 367 M€ in 2010
Key figuresKey figures

AREVA – Credit Roadshow – January 11, 12 & 13, 2012 – p.54
Appendix 3:Back-End
In millions of euros H1 2010 H1 2011 Change
Backlog 6,268 6,178 -€90m
Contribution to consolidated revenue 897 830 -7.5%
Contribution tooperating income In % of revenues
16718.6%
12715.3%
-€40m-3.3 pts
Free operating cash flow before tax 102 151 +€49m
Key figuresKey figures

AREVA – Credit Roadshow – January 11, 12 & 13, 2012 – p.55
Appendix 3:Renewable Energies
In millions of euros H1 2010 H1 2011 Change
Backlog 1,135 1,849 +€713m
Contribution to consolidated revenues 47 59 +26.3%
Contribution to operating income (59) (50) +€9m
Free operating cash flow before tax (272) (93) +€179m
Key figuresKey figures

AREVA – Credit Roadshow – January 11, 12 & 13, 2012 – p.56
Appendix 4: A simplified capital structure
► The 2011 capital market operations were successfully completed, they led to the conversion of all AREVA listed titles into ordinary shares.
► Listing: beginning Monday 30 May. It allowed:
The simplification of the capital structure: it is now composed of ordinary shares onlyThe free float remains at 4% of the capital
► Historical holders now hold voting rights associated to their securities. They will be able to participate to the General Meetings and to the vote of the resolutions.
► AREVA becomes more visible, more legible and more transparent on financial market and towards its shareholders
► AREVA’s shareholding structure remains unchanged. Below as of May 30, 2011:

AREVA – Credit Roadshow – January 11, 12 & 13, 2012 – p.57
Appendix 5: Fuel cycle markets: orders postponed in the short term
Uranium demand (kTU)Uranium demand (kTU) Enrichment demand (MSWU)Enrichment demand (MSWU) Fuel demand (kTHM)Fuel demand (kTHM)
0
20
40
60
80
PostFukushima
Asia
North America
Europe
Other regions
Pre-Fukushima
202020162012 0
5
10
15
2012 2016 2020
PostFukushima
Pre-Fukushima
Asia
Other regions
Europe
North America
0
20
40
60
80
100
Other regions
Asia
North America
Europe
2012 2016 2020
Pre-FukushimaPost Fukushima
Asia: main growth engine for demandEurope: drop in demand over the period
+5%
+2%
-1%
+1%
+9%
+3%
+5%
+5%
-1%
+0%
+12%
+4%
+4%
+3%
-0%
-1%
+6%
+2%
CAGR* CAGR* CAGR*
*Compound annual growth rate
Source: AREVA
AREVA – Credit Roadshow – January 11, 12 & 13, 2012 – p.58
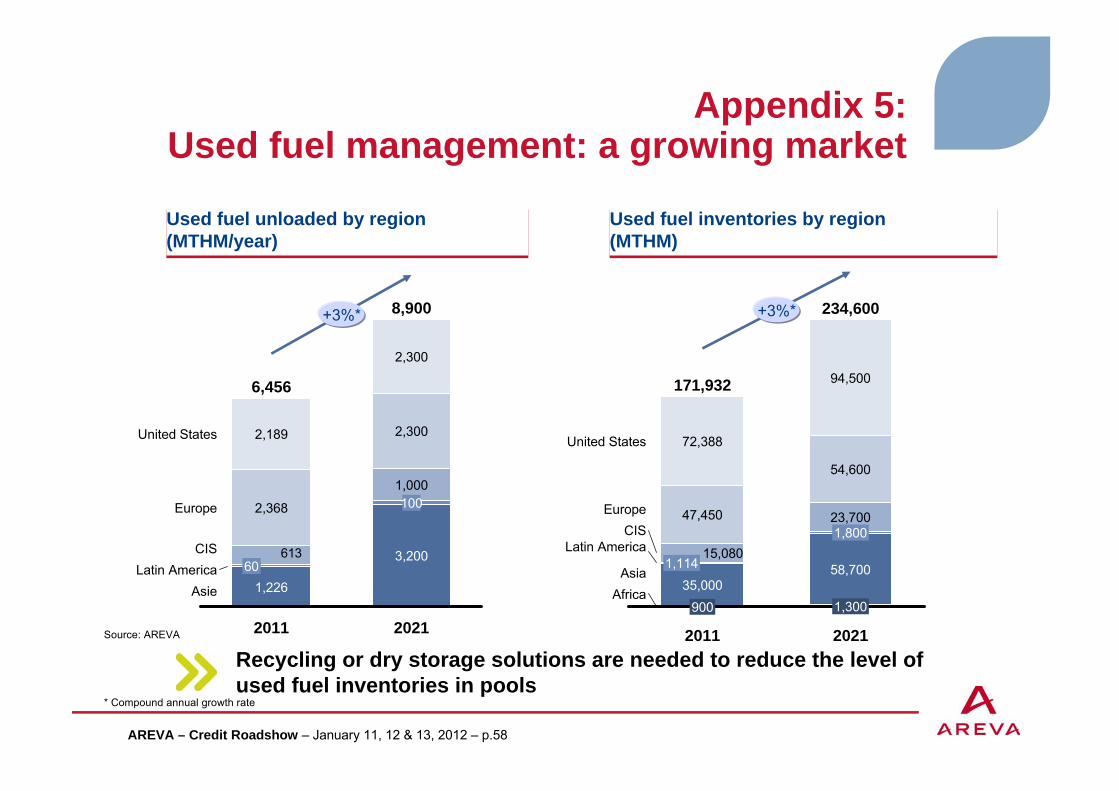
Appendix 5: Used fuel management: a growing market
Used fuel unloaded by region (MTHM/year)Used fuel unloaded by region (MTHM/year)
Used fuel inventories by region (MTHM)Used fuel inventories by region (MTHM)
Recycling or dry storage solutions are needed to reduce the level of used fuel inventories in pools
+3%*
AfricaAsia
Latin AmericaCIS
Europe
United States
2021
234,600
1,300
58,700
1,80023,700
54,600
94,500
2011
171,932
90035,000
1,11415,080
47,450
72,388
613
+3%*
AsieLatin America
CIS
Europe
United States
2021
8,900
3,200
1001,000
2,300
2,300
2011
6,456
1,22660
2,368
2,189
Source: AREVA
* Compound annual growth rate

AREVA – Credit Roadshow – January 11, 12 & 13, 2012 – p.59
Appendix 5: Accelerated growth in renewable energiesOffshore wind market will focus on the UK, Germany and FranceOffshore wind market will focus on the UK, Germany and France
0.30.7
0.90.7
1.01.01.01.0
0.91.0
0.2 0.2
0.80.9 0.9 0.9
0.61.0
1.0
1.01.1
1.3
1.41.7 1.7
0
2
4
6
17
4.7
1.6
16
3.6
1.4
15
3.4
1.2
14
2.8
0.9
2020
5.4
1.8
19
5.4
1.8
18
5.1
1.8
0.0
13
2.5
0.8
0.0
12
2.0
0.7
0.0
2011
0.9
0.6
UKGermanyFranceEurope - others
Annual addition to the installed base in Europe 2011-2020 (GW) – Reference scenario
An average of 3.6GW installed in Europe per year from 2011 to 2020
Reference scenario: 30GW installed worldwide by 2020
Global accessible market for concentrated solar could reach up to 30GW by 2020Global accessible market for concentrated solar could reach up to 30GW by 2020
Installed capacity (GW)
2020
4.0
2.3
2015In operation
EuropeUnited StatesIndiaMiddle EastAustraliaSouth AfricaNorth AfricaChinaSouth America
5.83.5
3.43.1
5.8
2.0
0
5
10
15
20
25
30
35
30.5
4.0
2.30.7
9.4
1.0
4.02.5
Source: Boston Consulting Group
AREVA – Credit Roadshow – January 11, 12 & 13, 2012 – p.60
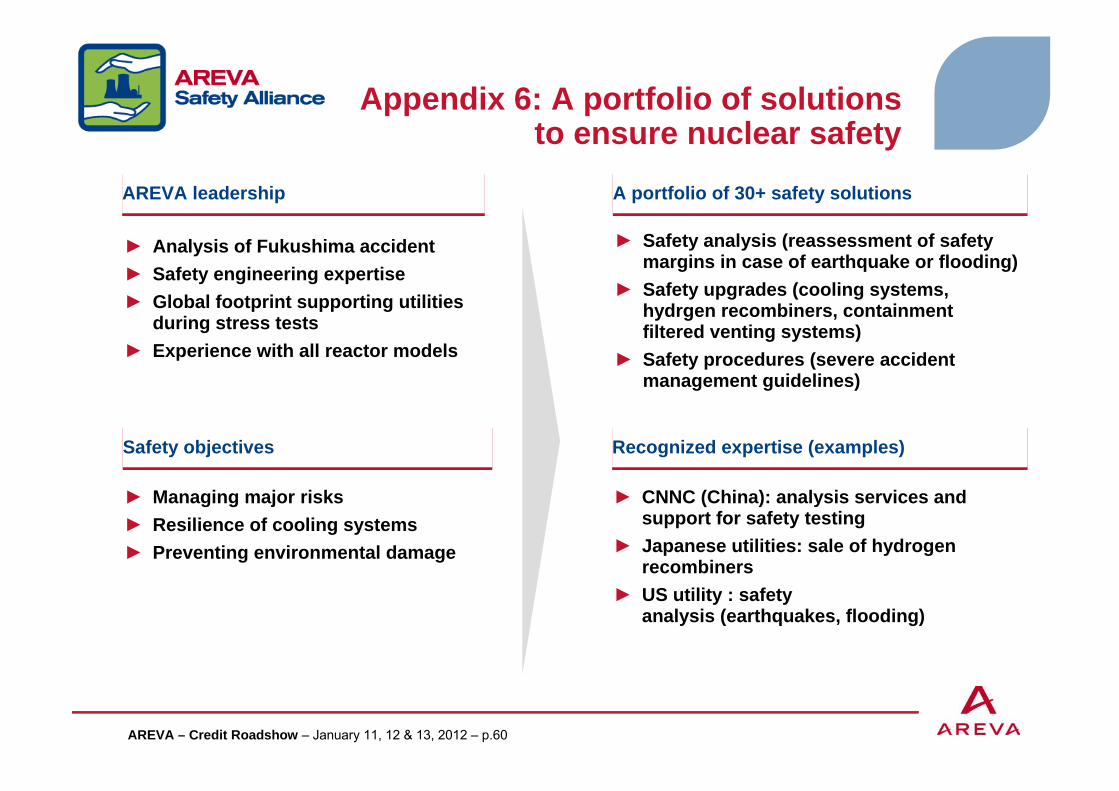
Appendix 6: A portfolio of solutionsto ensure nuclear safety
► Analysis of Fukushima accident► Safety engineering expertise► Global footprint supporting utilities
during stress tests► Experience with all reactor models
► Managing major risks► Resilience of cooling systems► Preventing environmental damage
A portfolio of 30+ safety solutions A portfolio of 30+ safety solutions
Recognized expertise (examples)Recognized expertise (examples)
AREVA leadershipAREVA leadership
Safety objectivesSafety objectives
► Safety analysis (reassessment of safety margins in case of earthquake or flooding)
► Safety upgrades (cooling systems, hydrgen recombiners, containmentfiltered venting systems)
► Safety procedures (severe accident management guidelines)
► CNNC (China): analysis services and support for safety testing
► Japanese utilities: sale of hydrogen recombiners
► US utility : safetyanalysis (earthquakes, flooding)

AREVA – Credit Roadshow – January 11, 12 & 13, 2012 – p.61
Reducing the risk of a serious accident
with core melt
Ability to withstand an airplane crash
No impact on local populations near
the site in the event of a serious
accident
Ability to withstand exceptional
accidents and natural events
Designed to benefit from nuclear accident lessons, they would have resisted Fukushima
External shellEarthquake proof Doors able to withstand explosions and flooding
External containment protecting critical buildings
Independent cooling trains + physical separationEmergency diesel generators in two different buildings
Core catcher: to collect the corium
Appendix 7: EPR and ATMEA: designed to meet the most demanding nuclear and industrial safety
standardsSafeguarddivision
APC shellFuel pool
1
23 4
AREVA – Credit Roadshow – January 11, 12 & 13, 2012 – p.62
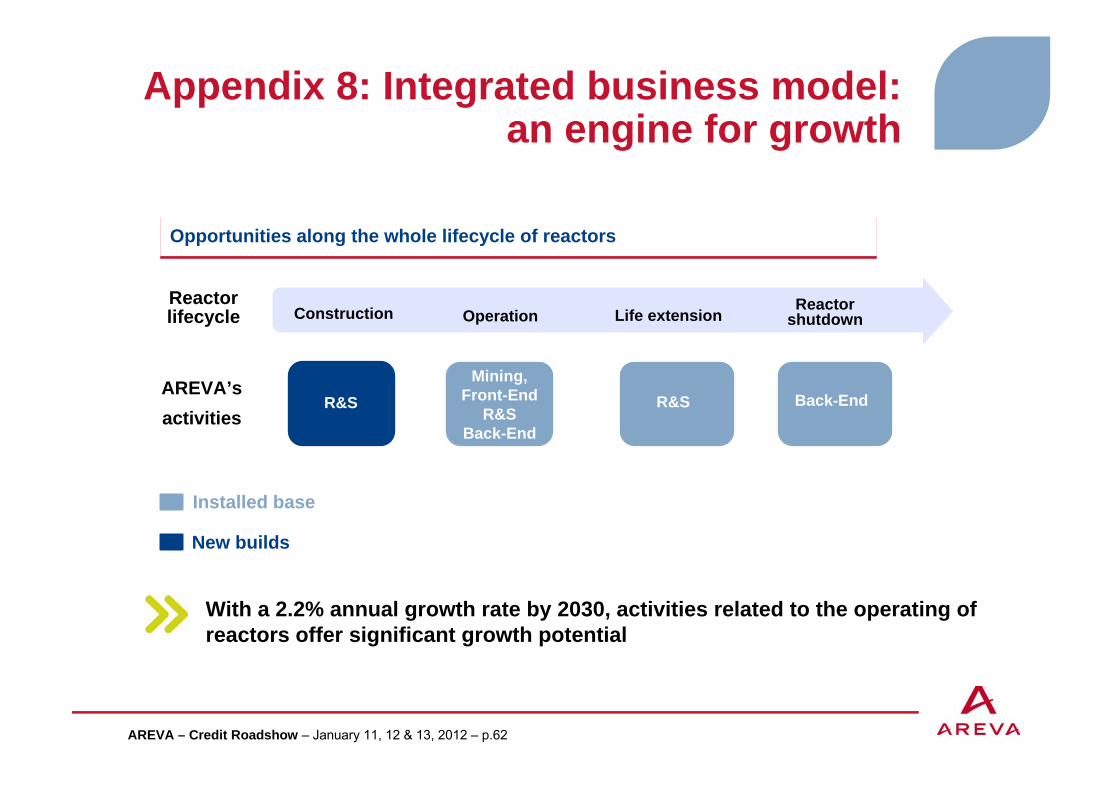
Appendix 8: Integrated business model: an engine for growth
With a 2.2% annual growth rate by 2030, activities related to the operating of reactors offer significant growth potential
Installed base
New builds
Opportunities along the whole lifecycle of reactorsOpportunities along the whole lifecycle of reactors
Construction Life extensionReactor
shutdown
Back-EndR&SR&S
Reactor lifecycle
AREVA’sactivities
Operation
Mining, Front-End
R&SBack-End
AREVA – Credit Roadshow – January 11, 12 & 13, 2012 – p.63
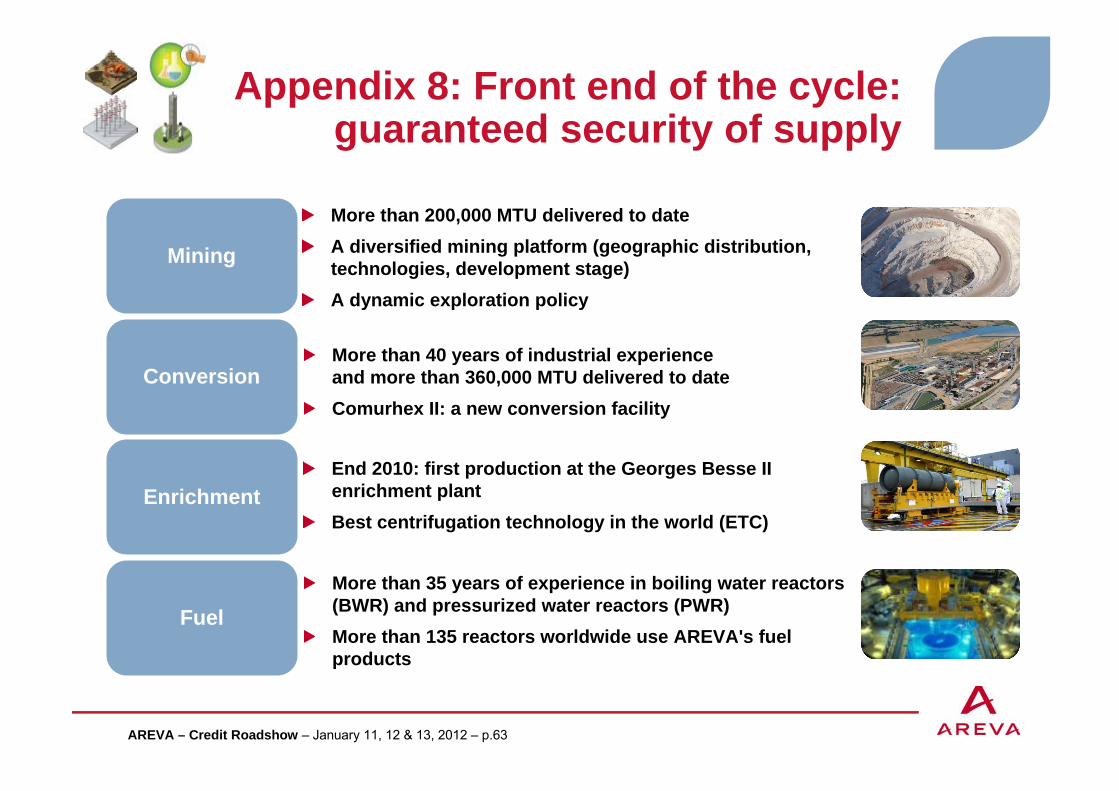
Appendix 8: Front end of the cycle:guaranteed security of supply
More than 200,000 MTU delivered to dateA diversified mining platform (geographic distribution, technologies, development stage)A dynamic exploration policy
More than 40 years of industrial experienceand more than 360,000 MTU delivered to dateComurhex II: a new conversion facility
End 2010: first production at the Georges Besse II enrichment plant Best centrifugation technology in the world (ETC)
More than 35 years of experience in boiling water reactors (BWR) and pressurized water reactors (PWR)More than 135 reactors worldwide use AREVA's fuel products
Mining
Conversion
Enrichment
Fuel
AREVA – Credit Roadshow – January 11, 12 & 13, 2012 – p.64
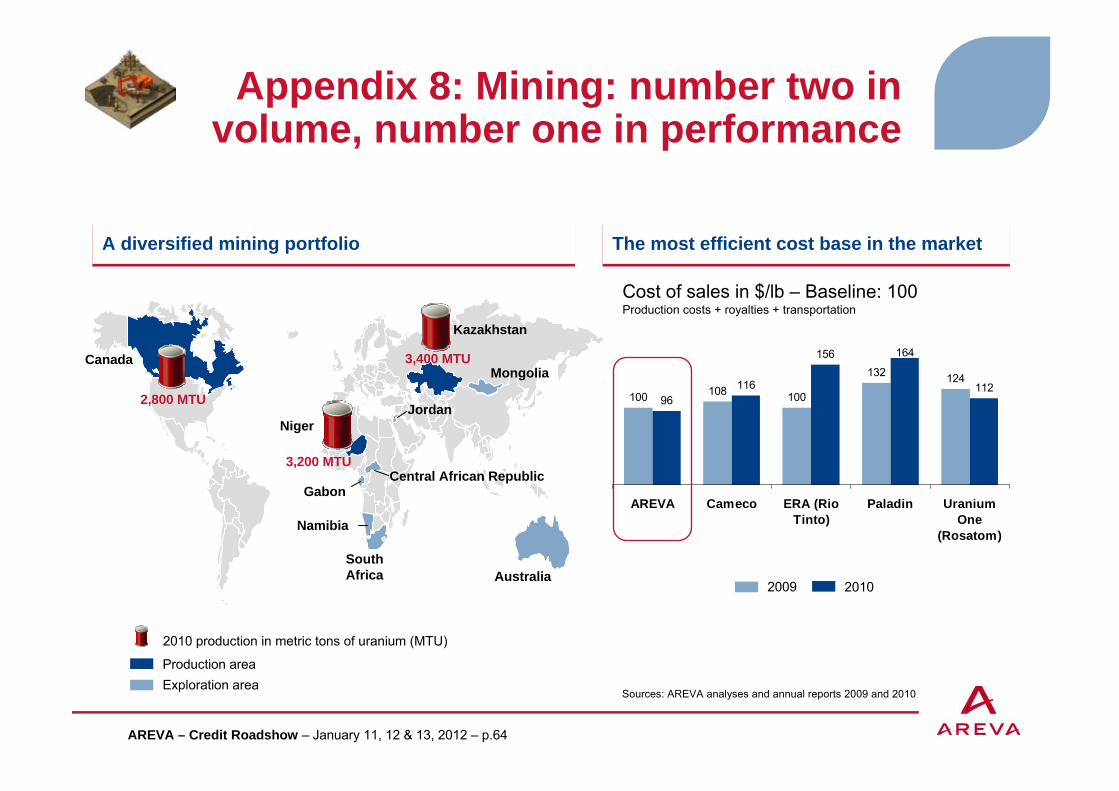
Appendix 8: Mining: number two in volume, number one in performance
Namibia
Kazakhstan
Mongolia
Niger
3,400 MTU
Production areaExploration area
2010 production in metric tons of uranium (MTU)
Australia
Canada
3,200 MTUCentral African Republic
Jordan
South Africa
Gabon
2,800 MTU 100 108 100
132 124116
156 164
11296
AREVA Cameco ERA (RioTinto)
Paladin UraniumOne
(Rosatom)
Cost of sales in $/lb – Baseline: 100Production costs + royalties + transportation
The most efficient cost base in the marketThe most efficient cost base in the marketA diversified mining portfolioA diversified mining portfolio
Sources: AREVA analyses and annual reports 2009 and 2010
20102009

AREVA – Credit Roadshow – January 11, 12 & 13, 2012 – p.65
Appendix 8: Global leadership for the construction of Gen III+ reactors
Olkiluoto 382% complete
(Supply of a turnkey power plant)
Percentage of completion in %(AREVA scope)
Percentage of completion in %(AREVA scope)
Flamanville 3
Taishan 1 & 2
56% complete (Supply of a Nuclear Steam
Supply System)
63% complete (Supply of 2 nuclear islands)

AREVA – Credit Roadshow – January 11, 12 & 13, 2012 – p.66
Appendix 8: Reactors and Services: unique lessons learned on EPR projects
Engineering
Construction
Procurement
Total Total construction time (from 1st concrete to 1st divergence)
Average procurement time (reliability of procurement planning)
Duration of construction (from 1st concrete to dome
installation)
Number of engineering hours on the Nuclear Steam Supply System scope
Evolution between OL3 and Taishan
Evolution between OL3 and Taishan
50% of the Taishan personnel had participated in OL3 or FA3 projects
-60%
-50%
-65%
-40%
AREVA – Credit Roadshow – January 11, 12 & 13, 2012 – p.67
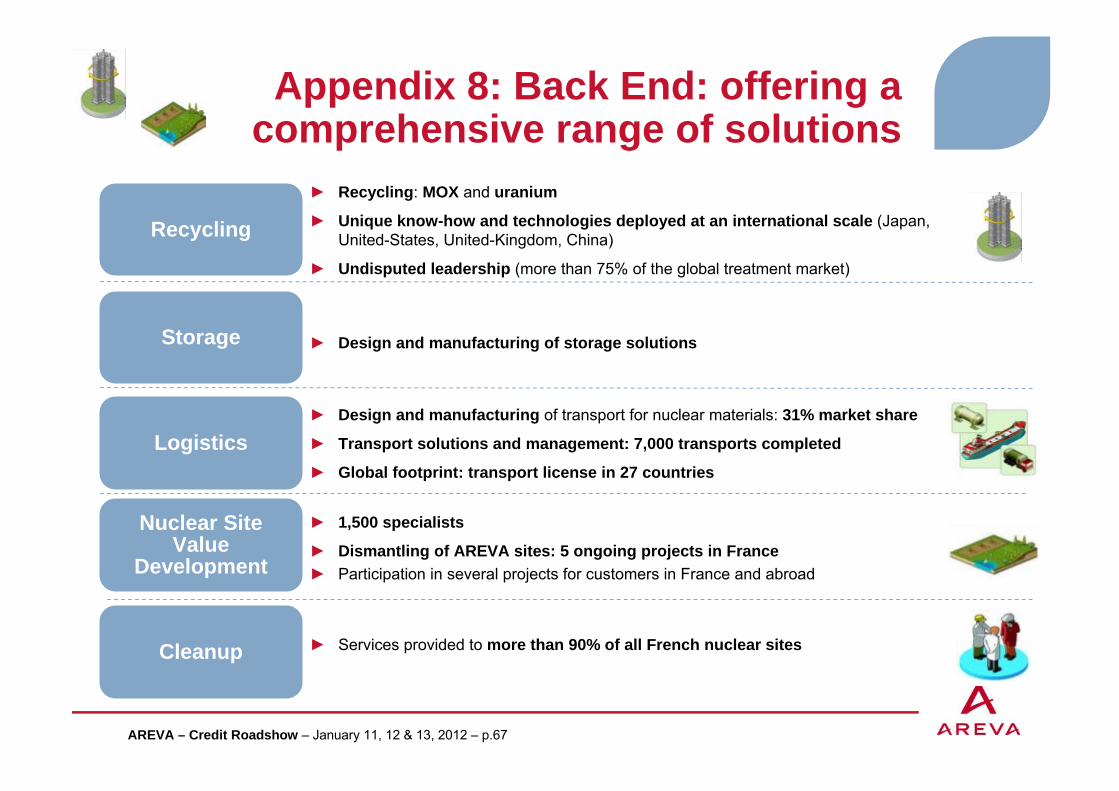
Appendix 8: Back End: offering a comprehensive range of solutions
CLEAN UP
► Recycling: MOX and uranium
► Unique know-how and technologies deployed at an international scale (Japan, United-States, United-Kingdom, China)
► Undisputed leadership (more than 75% of the global treatment market)
► 1,500 specialists
► Dismantling of AREVA sites: 5 ongoing projects in France► Participation in several projects for customers in France and abroad
► Design and manufacturing of transport for nuclear materials: 31% market share
► Transport solutions and management: 7,000 transports completed
► Global footprint: transport license in 27 countries
► Services provided to more than 90% of all French nuclear sites
Recycling
Logistics
Nuclear Site Value
Development
Cleanup
► Design and manufacturing of storage solutionsStorage

AREVA – Credit Roadshow – January 11, 12 & 13, 2012 – p.68
Appendix 8: Renewable energies:a targeted offering
* Exclusive negotiations, not included in backlog as at the end of September 2011
A portfolio of technologies meeting customer needsA portfolio of technologies meeting customer needs
Expertise demonstrated in actual projectsExpertise demonstrated in actual projects
Most powerful wind turbine in operation (5MW)Leader on the high-rated wind turbine marketInvestor confidenceRamp-up of industrial production
100 plants in service worldwideInstalled base: almost 3 GW
Alpha Ventus (30 MW)GT1 (400 MW)Borkum West II (200 MW)Exclusive ongoing negotiations for several projects
Kogan Creek (44 MW expansion)Liddell (3 MWe)Kimberlina (5 MWe)Solar Dawn (250 MWe)*
Coriance (12 MWe)Bertin (380 MWe)Bolognesi Participacoes(modernization, 330 MWe)
Offshore wind
Solar(CSP)
Bio-energies
Fresnel technology adapted to arid areas10-15% lower electricity cost than parabolic trough technology

AREVA – Credit Roadshow – January 11, 12 & 13, 2012 – p.69
Appendix 9: An engineering force without equivalent
6,500 professionals740 experts2,500+ projects in hand
Partnerships with the world’s leading research laboratories
Map of engineering and project resources Map of engineering and project resources
United States China
France
Germany
Slovakia
Finland
AREVA – Credit Roadshow – January 11, 12 & 13, 2012 – p.70
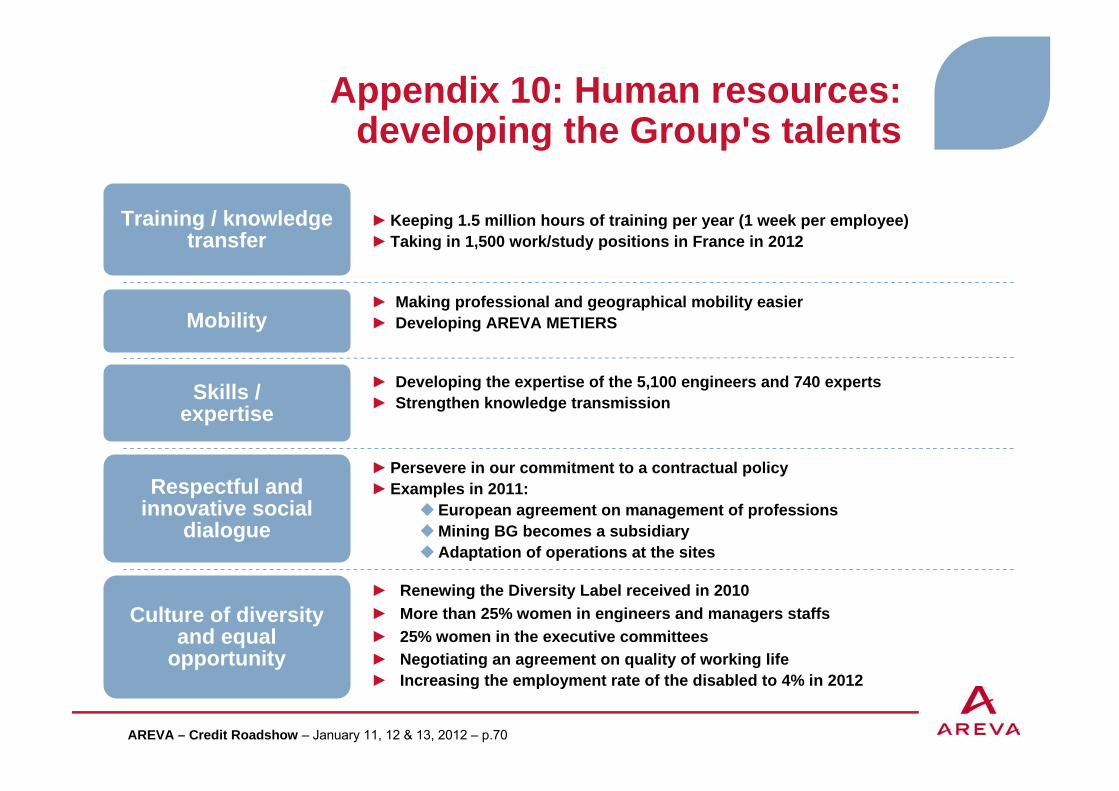
Appendix 10: Human resources:developing the Group's talents
Training / knowledge transfer
Mobility
Skills / expertise
►Keeping 1.5 million hours of training per year (1 week per employee)► Taking in 1,500 work/study positions in France in 2012
► Making professional and geographical mobility easier► Developing AREVA METIERS
► Developing the expertise of the 5,100 engineers and 740 experts► Strengthen knowledge transmission
Respectful and innovative social
dialogue
►Persevere in our commitment to a contractual policy ►Examples in 2011:
European agreement on management of professionsMining BG becomes a subsidiaryAdaptation of operations at the sites
Culture of diversity and equal
opportunity
► Renewing the Diversity Label received in 2010► More than 25% women in engineers and managers staffs► 25% women in the executive committees► Negotiating an agreement on quality of working life► Increasing the employment rate of the disabled to 4% in 2012

AREVA – Credit Roadshow – January 11, 12 & 13, 2012 – p.71
Appendix 11: A performance plan managed and monitored
Safety
► Number of accidents (Frequency rate)► Number of nuclear incidents► Severity rate► Radiation exposure
Financial competitiveness
► Operating Cash Flow after investments► Backlog margin► Operating Income► Opex savings
Operations &Customers
► On-time delivery / BU► Productivity / BU► Costs of non-quality► Orders in-take► Customer satisfaction
Technology► Added value: NPV of R&D portfolio► Number of projects going to industrialization► % of on time stage gate milestones
People► People engagement survey► Number of inter-BU mobility► Talent development / Promotion ► Diversity index
SafetySecurity
Economic Competitiveness
Customer Operations
Technology
HumanResources Level 1 KPI
Level 2 KPI
PillarsPillars Key performance indicatorKey performance indicator
AREVA – Credit Roadshow – January 11, 12 & 13, 2012 – p.72
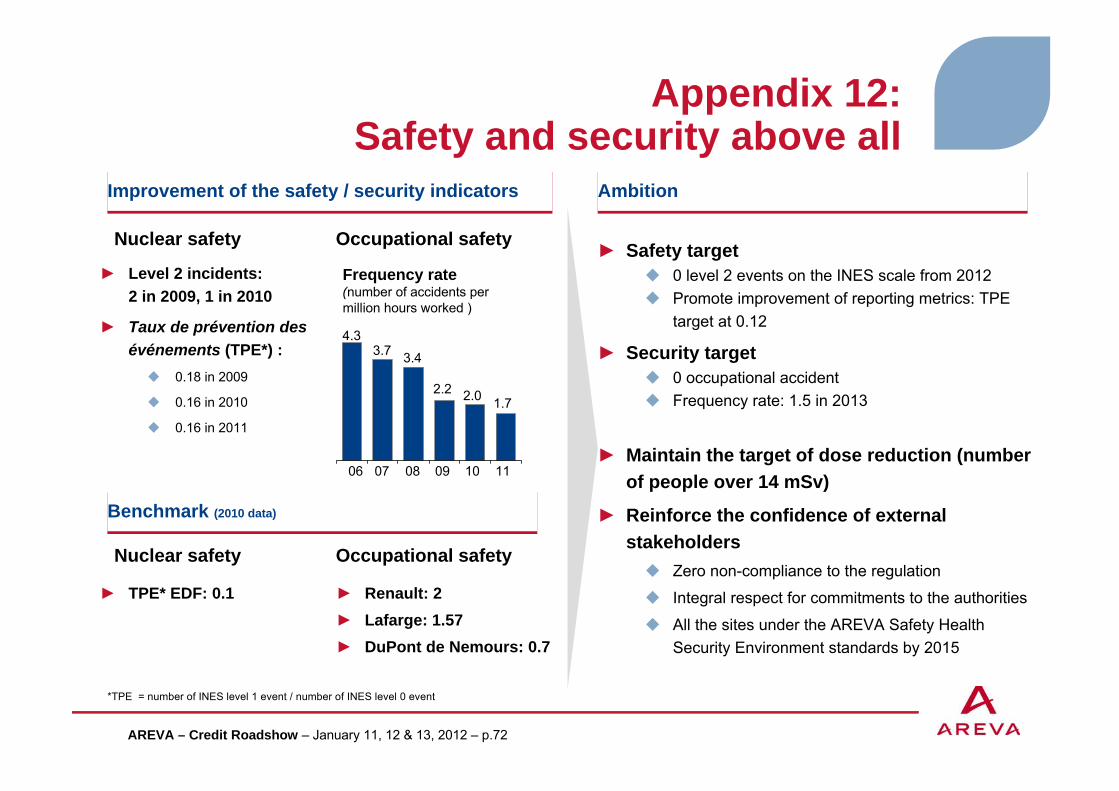
Appendix 12:Safety and security above all
► Safety target0 level 2 events on the INES scale from 2012Promote improvement of reporting metrics: TPE target at 0.12
► Security target0 occupational accident Frequency rate: 1.5 in 2013
► Maintain the target of dose reduction (number of people over 14 mSv)
► Reinforce the confidence of external stakeholders
Zero non-compliance to the regulation
Integral respect for commitments to the authorities
All the sites under the AREVA Safety Health Security Environment standards by 2015
1.7
1110
2.0
09
2.2
08
3.4
07
3.7
06
4.3
Frequency rate (number of accidents per million hours worked )
Improvement of the safety / security indicatorsImprovement of the safety / security indicators Ambition Ambition
Occupational safetyNuclear safety
► Level 2 incidents: 2 in 2009, 1 in 2010
► Taux de prévention des événements (TPE*) :
0.18 in 2009
0.16 in 2010
0.16 in 2011
Benchmark (2010 data)Benchmark (2010 data)
Occupational safetyNuclear safety
► TPE* EDF: 0.1 ► Renault: 2► Lafarge: 1.57► DuPont de Nemours: 0.7
*TPE = number of INES level 1 event / number of INES level 0 event


![2012/11/12 Areva EPR DC - AREVA Presentation for Nov. 19th ... · 1 ArevaEPRDCPEm Resource From: WILLIFORD Dennis (AREVA) [Dennis.Williford@areva.com] Sent: Monday, November 12, 2012](https://cdn.vdocuments.us/doc/165x107/5fd22ac2e220427cad0eb2a3/20121112-areva-epr-dc-areva-presentation-for-nov-19th-1-arevaeprdcpem-resource.jpg)


