
www.plindia.com
Slowdown Blues all around
April to June 2019Quarterly Preview
Demonetisation GST
NBFC Crisis
Rural Distress
Auto Slowdown
Corporate Defaults

Apr-Jun’19 Earnings Preview
July 4, 2019 2
THIS PAGE IS INTENTIONALLY LEFT BLANK
Apr-Jun’19 Earnings Preview
July 4, 2019 3
Contents
Page No.
Strategy & Quarterly Preview ................................................................................ 4
Agri Chemicals..................................................................................................... 26
Automobiles ......................................................................................................... 29
Aviation ................................................................................................................ 33
Banks ................................................................................................................... 35
Capital Goods ...................................................................................................... 45
Cement ................................................................................................................ 49
Consumer Durables ............................................................................................. 53
Consumer Staples ............................................................................................... 55
Education ............................................................................................................. 63
Financial Services................................................................................................ 65
Information Tech. ................................................................................................. 71
Media ................................................................................................................... 78
Metals .................................................................................................................. 80
Oil & Gas ............................................................................................................. 86
Pharma ................................................................................................................ 90
Others .................................................................................................................. 95
(All prices as on July 4, 2019)
Apr-Jun’19 Earnings Preview
July 4, 2019 4
Slowdown Blues all around
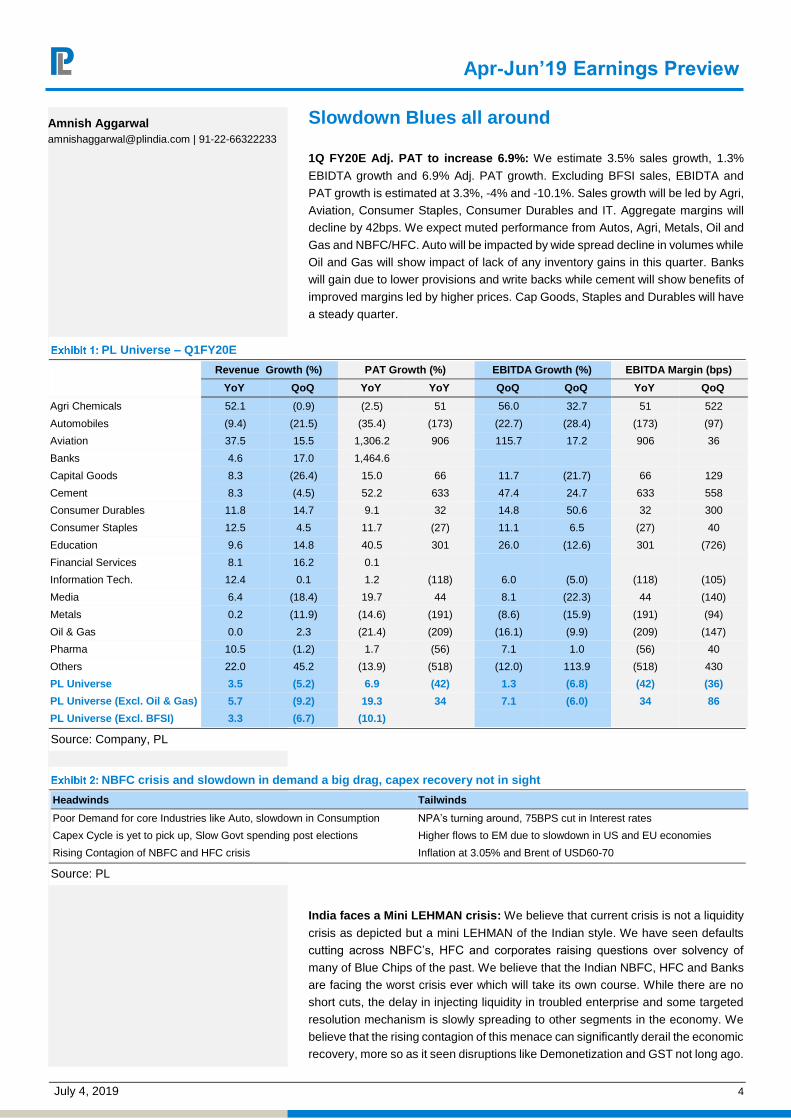
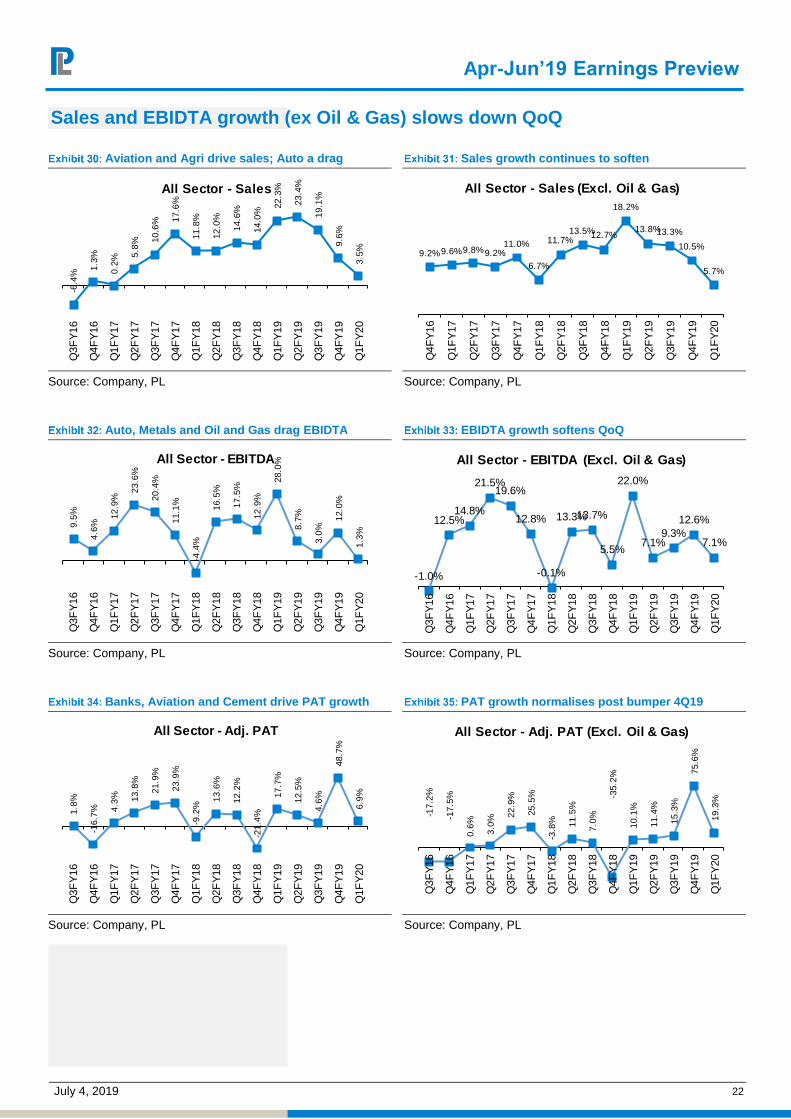
1Q FY20E Adj. PAT to increase 6.9%: We estimate 3.5% sales growth, 1.3%
EBIDTA growth and 6.9% Adj. PAT growth. Excluding BFSI sales, EBIDTA and
PAT growth is estimated at 3.3%, -4% and -10.1%. Sales growth will be led by Agri, Aviation, Consumer Staples, Consumer Durables and IT. Aggregate margins will decline by 42bps. We expect muted performance from Autos, Agri, Metals, Oil and
Gas and NBFC/HFC. Auto will be impacted by wide spread decline in volumes while Oil and Gas will show impact of lack of any inventory gains in this quarter. Banks will gain due to lower provisions and write backs while cement will show benefits of
improved margins led by higher prices. Cap Goods, Staples and Durables will have a steady quarter.
PL Universe – Q1FY20E
Revenue Growth (%) PAT Growth (%) EBITDA Growth (%) EBITDA Margin (bps)
YoY QoQ YoY YoY QoQ QoQ YoY QoQ
Agri Chemicals 52.1 (0.9) (2.5) 51 56.0 32.7 51 522
Automobiles (9.4) (21.5) (35.4) (173) (22.7) (28.4) (173) (97)
Aviation 37.5 15.5 1,306.2 906 115.7 17.2 906 36
Banks 4.6 17.0 1,464.6
Capital Goods 8.3 (26.4) 15.0 66 11.7 (21.7) 66 129
Cement 8.3 (4.5) 52.2 633 47.4 24.7 633 558
Consumer Durables 11.8 14.7 9.1 32 14.8 50.6 32 300
Consumer Staples 12.5 4.5 11.7 (27) 11.1 6.5 (27) 40
Education 9.6 14.8 40.5 301 26.0 (12.6) 301 (726)
Financial Services 8.1 16.2 0.1
Information Tech. 12.4 0.1 1.2 (118) 6.0 (5.0) (118) (105)
Media 6.4 (18.4) 19.7 44 8.1 (22.3) 44 (140)
Metals 0.2 (11.9) (14.6) (191) (8.6) (15.9) (191) (94)
Oil & Gas 0.0 2.3 (21.4) (209) (16.1) (9.9) (209) (147)
Pharma 10.5 (1.2) 1.7 (56) 7.1 1.0 (56) 40
Others 22.0 45.2 (13.9) (518) (12.0) 113.9 (518) 430
PL Universe 3.5 (5.2) 6.9 (42) 1.3 (6.8) (42) (36)
PL Universe (Excl. Oil & Gas) 5.7 (9.2) 19.3 34 7.1 (6.0) 34 86
PL Universe (Excl. BFSI) 3.3 (6.7) (10.1)
Source: Company, PL
NBFC crisis and slowdown in demand a big drag, capex recovery not in sight
Headwinds Tailwinds
Poor Demand for core Industries like Auto, slowdown in Consumption NPA’s turning around, 75BPS cut in Interest rates
Capex Cycle is yet to pick up, Slow Govt spending post elections Higher flows to EM due to slowdown in US and EU economies
Rising Contagion of NBFC and HFC crisis Inflation at 3.05% and Brent of USD60-70
Source: PL
India faces a Mini LEHMAN crisis: We believe that current crisis is not a liquidity
crisis as depicted but a mini LEHMAN of the Indian style. We have seen defaults cutting across NBFC’s, HFC and corporates raising questions over solvency of
many of Blue Chips of the past. We believe that the Indian NBFC, HFC and Banks are facing the worst crisis ever which will take its own course. While there are no short cuts, the delay in injecting liquidity in troubled enterprise and some targeted
resolution mechanism is slowly spreading to other segments in the economy. We believe that the rising contagion of this menace can significantly derail the economic recovery, more so as it seen disruptions like Demonetization and GST not long ago.
Amnish Aggarwal [email protected] | 91-22-66322233

Apr-Jun’19 Earnings Preview
July 4, 2019 5
MODI 2.0 raises Hopes amidst challenges: MODI 2.0 has raised hopes of
economic revival due to continuation of Govt., however the environment remains uncertain given 1) slowdown in auto and consumption demand 2) spiraling effect of
NBFC and HFC crisis 3) sustained rural distress 4) poor visibility on capex recovery and 4) slow global growth due to rising trade wars and protectionism. Although RBI has cut REPO rates and stance seems to be dovish, the economy needs significant
pump priming given poor state of banking and lower than anticipated tax and GST collections. We believe that the economy needs practical solutions to tackle the current crisis of confidence.
Consumption demand uncertain, expect slow recovery; Consumption demand
has entered a slow lane with categories like Auto and even consumer staples
bearing the brunt of that. Poor farm income due to patchy monsoons last year and
food deflation has added to troubles. Higher regulatory costs and NBFC crisis has
also added to decline in Auto sales across MHCV, Passenger cars, SUV, Tractors
and 2W. Consumer staples are growing but at a slower rate given pressures on
rural growth (from 1.3-1.5x urban growth to flattish to decline in some cases).
Overall business environment is uncertain and discretionary spends are under
pressure. We note that most organized retailers in Apparel and accessories have
pro-poned their end of season sales. The core sector growth last year was driven
by Govt. thrust on Housing and roads as private capex recovery is not in sight.
Given that Auto industry is battling with BSVI transition and consequent price
increase, demand recovery is expected to be slow. We believe that earliest signs
of recovery in demand would be visible only from the onset of festival season.
EL NINO chances fade away, watch out for spatial distribution: Monsoons have
seen a sharp pick up in the past fortnight, however the probability of it being normal
still remains uncertain. Bureau of Metrology (Australia) expects that the immediate
likelihood of El Nino developing has passed which is likely to increase sowing.
However, we would watch out for spatial distribution and trends in the prices of key
Agri products in coming season.
Domestic Consumption remains core Theme: With trade wars looming large,
we continue to prefer domestic consumption themes despite near term
pressures on demand.
We shall be releasing the sectoral picks and Model Portfolio Post Budget.

Apr-Jun’19 Earnings Preview
July 4, 2019 6
Monsoons: Downgrading ENSO outlook to INACTIVE provides a silver lining
Monsoon has largely been in line with estimates (owing to pick up in the last 10-15
days) till date. Rainfall is June was anticipated to be in deficit (as per Skymet’s initial
forecast). With rains picking up now, momentum is expected to continue till
September.
Bureau of Metrology (Australia) expects that the immediate likelihood of El Nino
developing has passed and its ENSO (El-Nino Southern Oscillation) Outlook has
now turned INACTIVE. This implies that the tropical Pacific Ocean is more likely to
remain in an ENSO-neutral phase over the coming months. Indian Ocean Dipole
(IOD) is also turning positive. IOD can either aggravate or weaken the impact of El
Nino on Indian monsoon. In the given circumstances, with impact of El Nino phasing
out, positive IOD is expected to further weaken the impact of El Nino.
Timeline of commentary of Bureau of Metrology
Date ENSO Outlook Indian Ocean Dipole (IOD)
25-Jun-19 El Nino Outlook downgraded to INACTIVE Indicate a positive IOD
11-Jun-19 El Nino WATCH remains Positive IOD likely
28-May-19 El Nino WATCH remains Positive IOD likelihood increases
14-May-19 El Nino Outlook downgraded to WATCH Positive IOD possible
30-Apr-19 Outlook remains at El Nino ALERT Neutral IOD
16-Apr-19 Short lived El Nino likely Neutral IOD
02-Apr-19 Outlook remains at El Nino ALERT Neutral IOD
19-Mar-19 El Nino outlook upgraded from Neutral to ALERT Neutral IOD
05-Mar-19 Neutral El Nino Outlook Neutral IOD
Source: Bureau of Metrology
Skymet’s forecast indicates pickup in Monsoons in coming months
Month LPA
June 77%
July 91%
August 102%
September 99%
Source: Skymet
Monthly distribution of rainfall is more significant than the headline number:
Timing and spatial distribution of rainfall (well spread across all four months) holds
more significance from the agriculture and agrochemical consumption perspective
than the absolute count of rainfall. Monsoon is expected to be in deficit only in the
month of June @77% of LPA. Rainfall in July is expected to be marginally below
normal rainfall @ 91% of LPA, while August/September are expected to be a period
of normal rainfall (102%/99% of LPA). At this monthly precipitation break up, we are
likely to follow a mix trend of FY16 & FY17.

Apr-Jun’19 Earnings Preview
July 4, 2019 7
2019 monthly precipitation break up is likely to be a mix of FY16 &
FY17 trend…
Months FY15 FY16 FY17 FY18 FY19 FY20E
June 115.9% 89.0% 76.8% 100.0% 89.9% 77%
July 83.6% 107.0% 128.0% 107.0% 94.9% 91%
August 78.2% 91.0% 116.4% 86.4% 93.6% 102%
September 75.8% 97.0% 128.0% 83.3% 82.8% 99%
Source: IMD
Sowing picked up significantly last week and is expected to continue in the coming weeks
Crop (Area in lakh Ha) Normal Kharif Area (DES)
Area sown till 28th Jun'19
Area sown till 28th Jun'18 YoY(%) As a % of total normal
kharif area Rice 396.3 27.1 27.1 (0.1) 6.8
Pulses 119.9 3.4 8.9 (61.4) 2.9
Coarse Cereals 188.4 19.1 21.4 (10.7) 10.1
Oilseeds 182.4 13.4 14.1 (4.6) 7.4
Sugarcane 48.3 49.8 51.3 (2.8) 103.1
Jute & Mesta 7.9 6.7 7.1 (6.6) 84.6
Cotton 120.9 27.1 32.2 (15.9) 22.4
Total 1,064.0 146.6 162.1 (9.5) 13.8
Source: Ministry of Agriculture

Apr-Jun’19 Earnings Preview
July 4, 2019 8
New GST filing from Jan-20; 1Q collections up 7%
GST collections below Rs 1000bn mark: GST Collections fell to Rs. 999.4bn in
Jun’19, average monthly collection for Q1FY20 at Rs1047bn, exceeding Q1FY19
collection by 7%. Government has failed to achieve average monthly target of Rs
1142bn during FY20, fall in collection partly due to cut in tax rates.
Strengthening systems and processes: In 35TH GST Council Meeting, focus was
on ease of adopting GST by 1) one-form GST filing system for B2B invoicing, from
Jan-20 2) extension of due date for filing GSTR-9, GSTR-9A, and GSTR-9C for
FY18 to 31st Aug and 3) eased the registration process by allowing the use of
Aadhar. In addition, tenure of National Anti-Profiteering Authority (NAA) has been
extended by two years and 10% penalty is proposed for delay in depositing
profiteered amount by more than 10 days, in order to avoid tax evasion.
GST rate cuts expectation unmet: Council failed to come up with rate cut to boost
consumer demand. Proposal for GST rate cut on Electric Vehicles, from 12% to 5%
has been sent to fitment committee. Likewise, Council directed the valuation rules
for goods and services in solar power generating systems and wind turbines to be
placed before the next Fitment Committee.
GST Collection dips below Rs 1000bn mark
1,0
34
.6
94
0.2
95
6.1
96
4.8
93
9.6
94
4.4
1,0
07
.1
97
6.4
94
7.3
1,0
25
.0
97
2.5
1,0
65
.8
1,1
39
1,0
02
.9
99
9.4
800.0
850.0
900.0
950.0
1,000.0
1,050.0
1,100.0
1,150.0
1,200.0
Apr-
18
May-
18
Jun-1
8
Jul-1
8
Aug-1
8
Sep-1
8
Oct-18
Nov-
18
Dec-
18
Jan-1
9
Feb
-19
Mar-
19
Apr-
19
May-
19
Jun-1
9
GST Collections (Rs Bn)
Source: GSTIN, PL
Cess Collection showing up by 4% YoY
85.5
73.4 81.2 83.6
76.3 79.9 80.0 80.3 78.9 86.9 84.8 82.9
92
81.3 84.6
- 10.0
20.0
30.0 40.0
50.0
60.0 70.0
80.0 90.0
100.0
Apr-
18
May-
18
Jun-1
8
Jul-1
8
Aug-1
8
Sep-1
8
Oct-18
Nov-
18
Dec-
18
Jan-1
9
Feb
-19
Mar-
19
Apr-
19
May-
19
Jun-1
9
Compensation Cess (Rs bn)
Source: GSTIN, PL
Apr-Jun’19 Earnings Preview
July 4, 2019 9
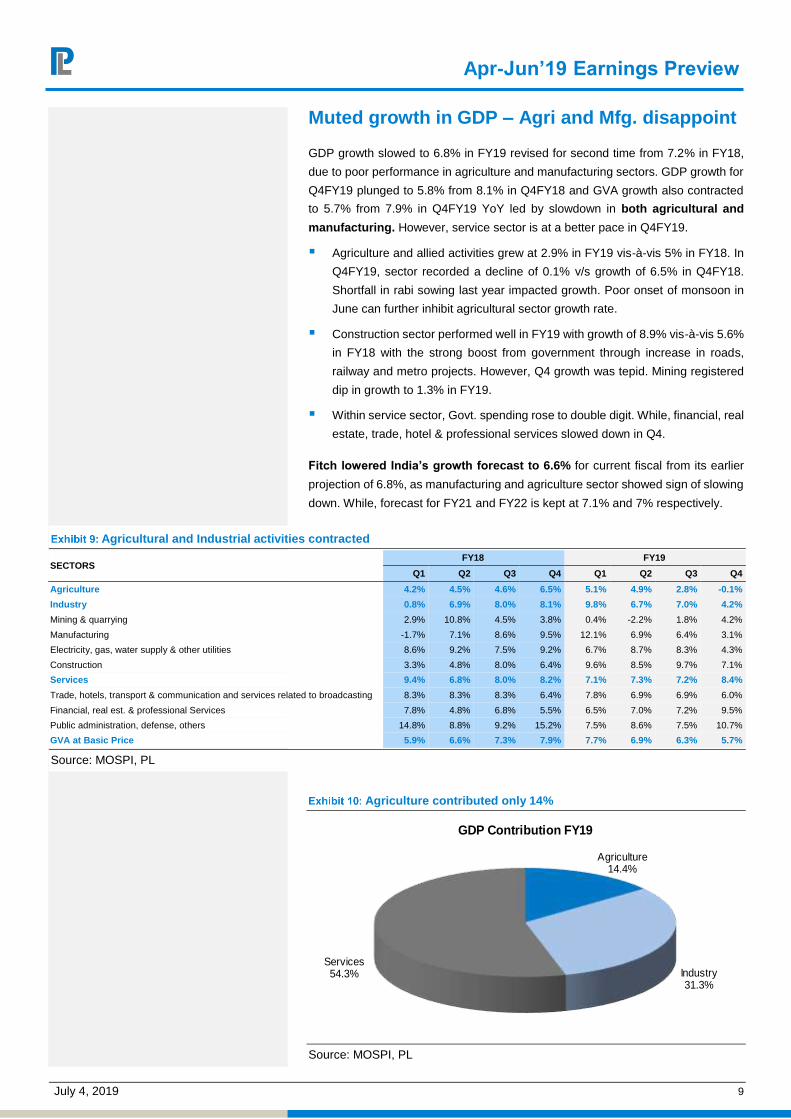
Muted growth in GDP – Agri and Mfg. disappoint
GDP growth slowed to 6.8% in FY19 revised for second time from 7.2% in FY18,
due to poor performance in agriculture and manufacturing sectors. GDP growth for
Q4FY19 plunged to 5.8% from 8.1% in Q4FY18 and GVA growth also contracted
to 5.7% from 7.9% in Q4FY19 YoY led by slowdown in both agricultural and
manufacturing. However, service sector is at a better pace in Q4FY19.
Agriculture and allied activities grew at 2.9% in FY19 vis-à-vis 5% in FY18. In
Q4FY19, sector recorded a decline of 0.1% v/s growth of 6.5% in Q4FY18.
Shortfall in rabi sowing last year impacted growth. Poor onset of monsoon in
June can further inhibit agricultural sector growth rate.
Construction sector performed well in FY19 with growth of 8.9% vis-à-vis 5.6%
in FY18 with the strong boost from government through increase in roads,
railway and metro projects. However, Q4 growth was tepid. Mining registered
dip in growth to 1.3% in FY19.
Within service sector, Govt. spending rose to double digit. While, financial, real
estate, trade, hotel & professional services slowed down in Q4.
Fitch lowered India’s growth forecast to 6.6% for current fiscal from its earlier
projection of 6.8%, as manufacturing and agriculture sector showed sign of slowing
down. While, forecast for FY21 and FY22 is kept at 7.1% and 7% respectively.
Agricultural and Industrial activities contracted
SECTORS FY18 FY19
Q1 Q2 Q3 Q4 Q1 Q2 Q3 Q4
Agriculture 4.2% 4.5% 4.6% 6.5% 5.1% 4.9% 2.8% -0.1%
Industry 0.8% 6.9% 8.0% 8.1% 9.8% 6.7% 7.0% 4.2%
Mining & quarrying 2.9% 10.8% 4.5% 3.8% 0.4% -2.2% 1.8% 4.2%
Manufacturing -1.7% 7.1% 8.6% 9.5% 12.1% 6.9% 6.4% 3.1%
Electricity, gas, water supply & other utilities 8.6% 9.2% 7.5% 9.2% 6.7% 8.7% 8.3% 4.3%
Construction 3.3% 4.8% 8.0% 6.4% 9.6% 8.5% 9.7% 7.1%
Services 9.4% 6.8% 8.0% 8.2% 7.1% 7.3% 7.2% 8.4%
Trade, hotels, transport & communication and services related to broadcasting 8.3% 8.3% 8.3% 6.4% 7.8% 6.9% 6.9% 6.0%
Financial, real est. & professional Services 7.8% 4.8% 6.8% 5.5% 6.5% 7.0% 7.2% 9.5%
Public administration, defense, others 14.8% 8.8% 9.2% 15.2% 7.5% 8.6% 7.5% 10.7%
GVA at Basic Price 5.9% 6.6% 7.3% 7.9% 7.7% 6.9% 6.3% 5.7%
Source: MOSPI, PL
Agriculture contributed only 14%
Agriculture14.4%
Industry31.3%
Services54.3%
GDP Contribution FY19
Source: MOSPI, PL
Apr-Jun’19 Earnings Preview
July 4, 2019 10
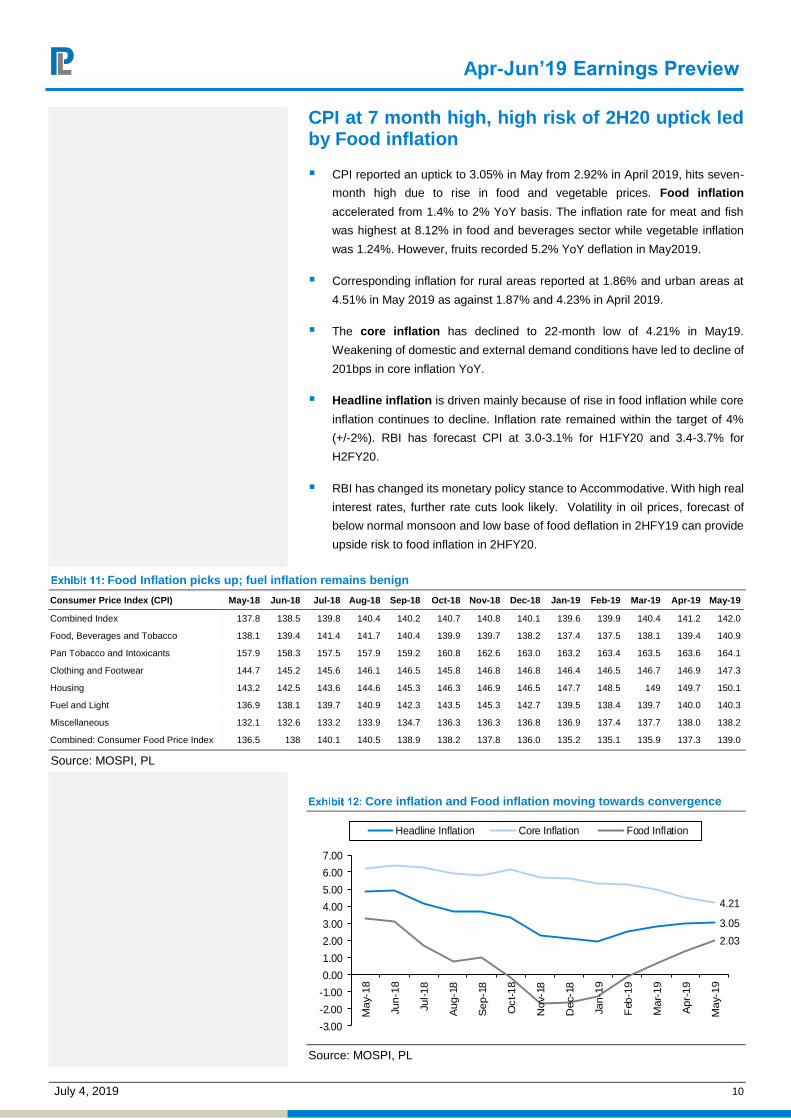
CPI at 7 month high, high risk of 2H20 uptick led by Food inflation
CPI reported an uptick to 3.05% in May from 2.92% in April 2019, hits seven-
month high due to rise in food and vegetable prices. Food inflation
accelerated from 1.4% to 2% YoY basis. The inflation rate for meat and fish
was highest at 8.12% in food and beverages sector while vegetable inflation
was 1.24%. However, fruits recorded 5.2% YoY deflation in May2019.
Corresponding inflation for rural areas reported at 1.86% and urban areas at
4.51% in May 2019 as against 1.87% and 4.23% in April 2019.
The core inflation has declined to 22-month low of 4.21% in May19.
Weakening of domestic and external demand conditions have led to decline of
201bps in core inflation YoY.
Headline inflation is driven mainly because of rise in food inflation while core
inflation continues to decline. Inflation rate remained within the target of 4%
(+/-2%). RBI has forecast CPI at 3.0-3.1% for H1FY20 and 3.4-3.7% for
H2FY20.
RBI has changed its monetary policy stance to Accommodative. With high real
interest rates, further rate cuts look likely. Volatility in oil prices, forecast of
below normal monsoon and low base of food deflation in 2HFY19 can provide
upside risk to food inflation in 2HFY20.
Food Inflation picks up; fuel inflation remains benign
Consumer Price Index (CPI) May-18 Jun-18 Jul-18 Aug-18 Sep-18 Oct-18 Nov-18 Dec-18 Jan-19 Feb-19 Mar-19 Apr-19 May-19
Combined Index 137.8 138.5 139.8 140.4 140.2 140.7 140.8 140.1 139.6 139.9 140.4 141.2 142.0
Food, Beverages and Tobacco 138.1 139.4 141.4 141.7 140.4 139.9 139.7 138.2 137.4 137.5 138.1 139.4 140.9
Pan Tobacco and Intoxicants 157.9 158.3 157.5 157.9 159.2 160.8 162.6 163.0 163.2 163.4 163.5 163.6 164.1
Clothing and Footwear 144.7 145.2 145.6 146.1 146.5 145.8 146.8 146.8 146.4 146.5 146.7 146.9 147.3
Housing 143.2 142.5 143.6 144.6 145.3 146.3 146.9 146.5 147.7 148.5 149 149.7 150.1
Fuel and Light 136.9 138.1 139.7 140.9 142.3 143.5 145.3 142.7 139.5 138.4 139.7 140.0 140.3
Miscellaneous 132.1 132.6 133.2 133.9 134.7 136.3 136.3 136.8 136.9 137.4 137.7 138.0 138.2
Combined: Consumer Food Price Index 136.5 138 140.1 140.5 138.9 138.2 137.8 136.0 135.2 135.1 135.9 137.3 139.0
Source: MOSPI, PL
Core inflation and Food inflation moving towards convergence
3.05
4.21
2.03
-3.00
-2.00
-1.00
0.00
1.00
2.00
3.00
4.00
5.00
6.00
7.00
May
-18
Jun-
18
Jul-1
8
Aug
-18
Sep
-18
Oct
-18
Nov
-18
Dec
-18
Jan-
19
Feb
-19
Mar
-19
Apr
-19
May
-19
Headline Inflation Core Inflation Food Inflation
Source: MOSPI, PL
Apr-Jun’19 Earnings Preview
July 4, 2019 11
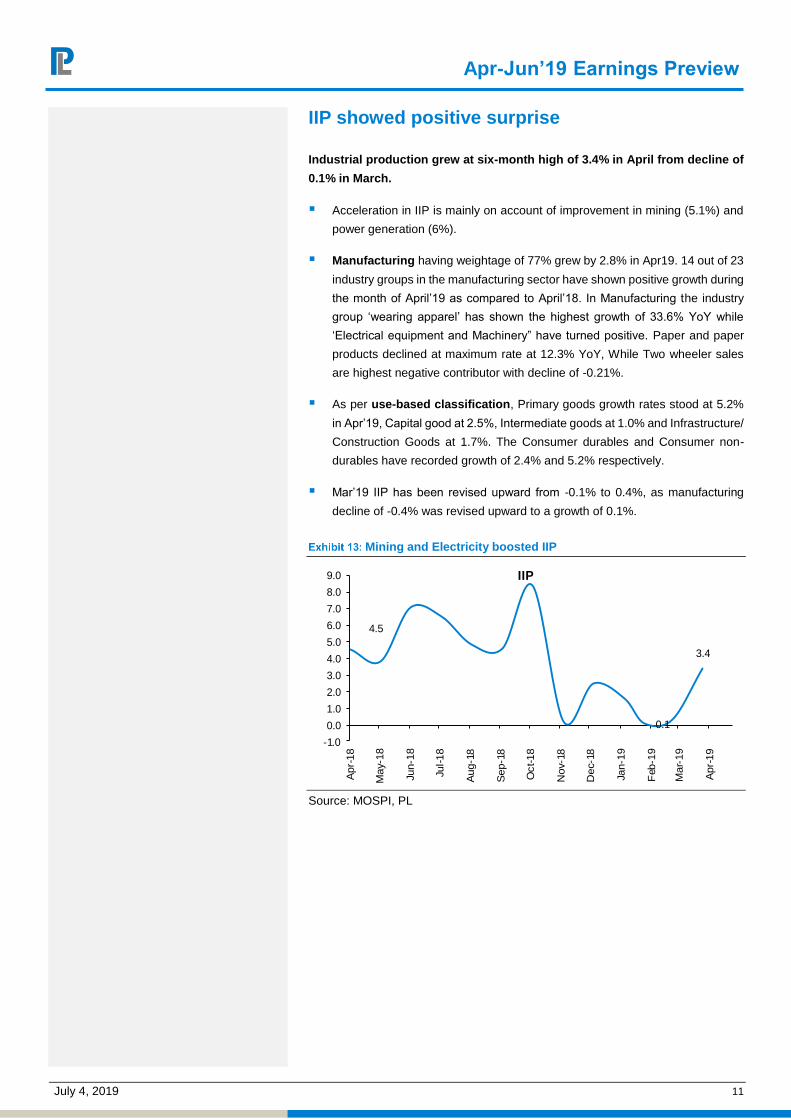
IIP showed positive surprise
Industrial production grew at six-month high of 3.4% in April from decline of
0.1% in March.
Acceleration in IIP is mainly on account of improvement in mining (5.1%) and
power generation (6%).
Manufacturing having weightage of 77% grew by 2.8% in Apr19. 14 out of 23
industry groups in the manufacturing sector have shown positive growth during
the month of April’19 as compared to April’18. In Manufacturing the industry
group ‘wearing apparel’ has shown the highest growth of 33.6% YoY while
‘Electrical equipment and Machinery” have turned positive. Paper and paper
products declined at maximum rate at 12.3% YoY, While Two wheeler sales
are highest negative contributor with decline of -0.21%.
As per use-based classification, Primary goods growth rates stood at 5.2%
in Apr’19, Capital good at 2.5%, Intermediate goods at 1.0% and Infrastructure/
Construction Goods at 1.7%. The Consumer durables and Consumer non-
durables have recorded growth of 2.4% and 5.2% respectively.
Mar’19 IIP has been revised upward from -0.1% to 0.4%, as manufacturing
decline of -0.4% was revised upward to a growth of 0.1%.
Mining and Electricity boosted IIP
4.5
0.1
3.4
-1.0
0.0
1.0
2.0
3.0
4.0
5.0
6.0
7.0
8.0
9.0
Apr
-18
May
-18
Jun-
18
Jul-1
8
Aug
-18
Sep
-18
Oct
-18
Nov
-18
Dec
-18
Jan-
19
Feb
-19
Mar
-19
Apr
-19
IIP
Source: MOSPI, PL
Apr-Jun’19 Earnings Preview
July 4, 2019 12
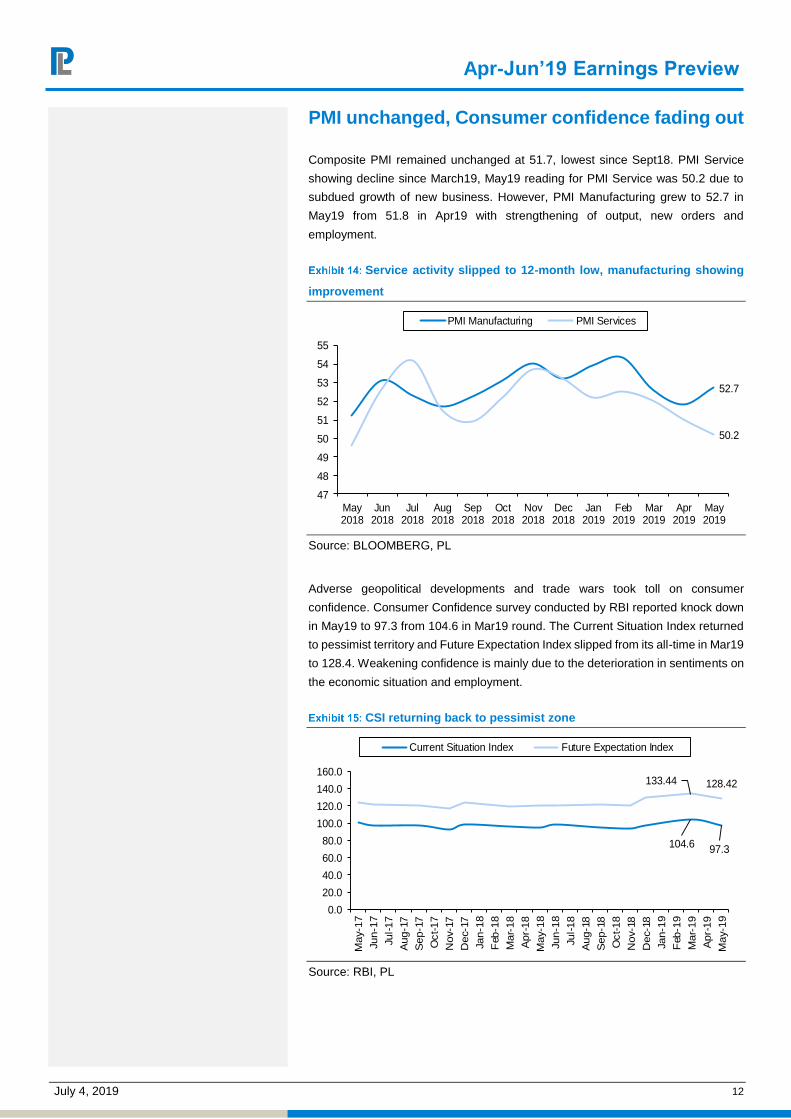
PMI unchanged, Consumer confidence fading out
Composite PMI remained unchanged at 51.7, lowest since Sept18. PMI Service
showing decline since March19, May19 reading for PMI Service was 50.2 due to
subdued growth of new business. However, PMI Manufacturing grew to 52.7 in
May19 from 51.8 in Apr19 with strengthening of output, new orders and
employment.
Service activity slipped to 12-month low, manufacturing showing
improvement
52.7
50.2
47
48
49
50
51
52
53
54
55
May2018
Jun2018
Jul2018
Aug2018
Sep2018
Oct2018
Nov2018
Dec2018
Jan2019
Feb2019
Mar2019
Apr2019
May2019
PMI Manufacturing PMI Services
Source: BLOOMBERG, PL
Adverse geopolitical developments and trade wars took toll on consumer
confidence. Consumer Confidence survey conducted by RBI reported knock down
in May19 to 97.3 from 104.6 in Mar19 round. The Current Situation Index returned
to pessimist territory and Future Expectation Index slipped from its all-time in Mar19
to 128.4. Weakening confidence is mainly due to the deterioration in sentiments on
the economic situation and employment.
CSI returning back to pessimist zone
104.6 97.3
133.44 128.42
0.0
20.0
40.0
60.0
80.0
100.0
120.0
140.0
160.0
May
-17
Jun-
17
Jul-17
Aug
-17
Sep
-17
Oct
-17
Nov
-17
Dec
-17
Jan-1
8
Feb
-18
Mar
-18
Apr-
18
May-
18
Jun-1
8
Jul-18
Aug-1
8
Sep-1
8
Oct
-18
Nov
-18
Dec
-18
Jan-
19
Feb
-19
Mar
-19
Apr
-19
May
-19
Current Situation Index Future Expectation Index
Source: RBI, PL
Apr-Jun’19 Earnings Preview
July 4, 2019 13
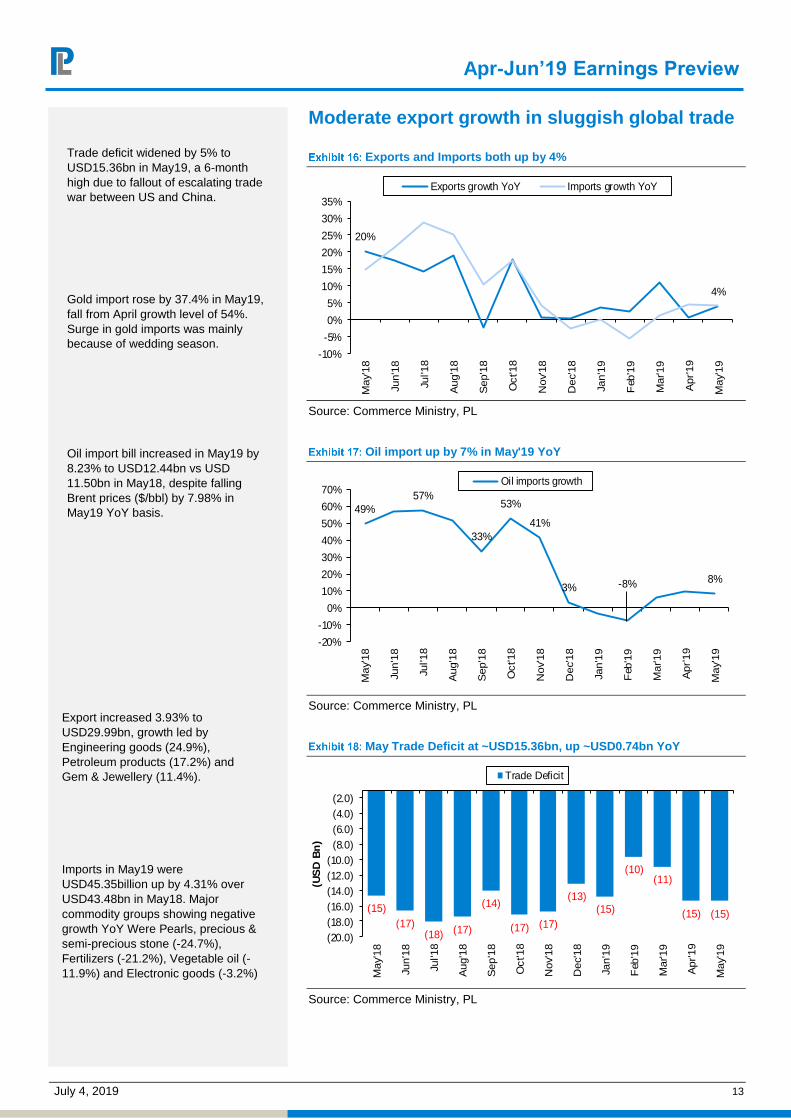
Moderate export growth in sluggish global trade
Exports and Imports both up by 4%
20%
4%
-10%
-5%
0%
5%
10%
15%
20%
25%
30%
35%
May
'18
Jun'
18
Jul'1
8
Aug
'18
Sep
'18
Oct
'18
Nov
'18
Dec
'18
Jan'
19
Feb
'19
Mar
'19
Apr
'19
May
'19
Exports growth YoY Imports growth YoY
Source: Commerce Ministry, PL
Oil import up by 7% in May'19 YoY
49%57%
33%
53%
41%
3% -8% 8%
-20%
-10%
0%
10%
20%
30%
40%
50%
60%
70%
May
'18
Jun'
18
Jul'1
8
Aug
'18
Sep
'18
Oct
'18
Nov
'18
Dec
'18
Jan'
19
Feb
'19
Mar
'19
Apr
'19
May
'19
Oil imports growth
Source: Commerce Ministry, PL
May Trade Deficit at ~USD15.36bn, up ~USD0.74bn YoY
(15)(17)
(18) (17)
(14)
(17) (17)
(13)(15)
(10)(11)
(15) (15)
(20.0) (18.0) (16.0) (14.0) (12.0) (10.0) (8.0) (6.0) (4.0) (2.0)
May
'18
Jun'
18
Jul'1
8
Aug
'18
Sep
'18
Oct
'18
Nov
'18
Dec
'18
Jan'
19
Feb
'19
Mar
'19
Apr
'19
May
'19
(US
D B
n)
Trade Deficit
Source: Commerce Ministry, PL
Trade deficit widened by 5% to USD15.36bn in May19, a 6-month high due to fallout of escalating trade war between US and China.
Gold import rose by 37.4% in May19, fall from April growth level of 54%. Surge in gold imports was mainly because of wedding season.
Oil import bill increased in May19 by 8.23% to USD12.44bn vs USD 11.50bn in May18, despite falling Brent prices ($/bbl) by 7.98% in May19 YoY basis.
Export increased 3.93% to USD29.99bn, growth led by Engineering goods (24.9%), Petroleum products (17.2%) and Gem & Jewellery (11.4%).
Imports in May19 were USD45.35billion up by 4.31% over USD43.48bn in May18. Major commodity groups showing negative growth YoY Were Pearls, precious & semi-precious stone (-24.7%), Fertilizers (-21.2%), Vegetable oil (-11.9%) and Electronic goods (-3.2%)
Apr-Jun’19 Earnings Preview
July 4, 2019 14
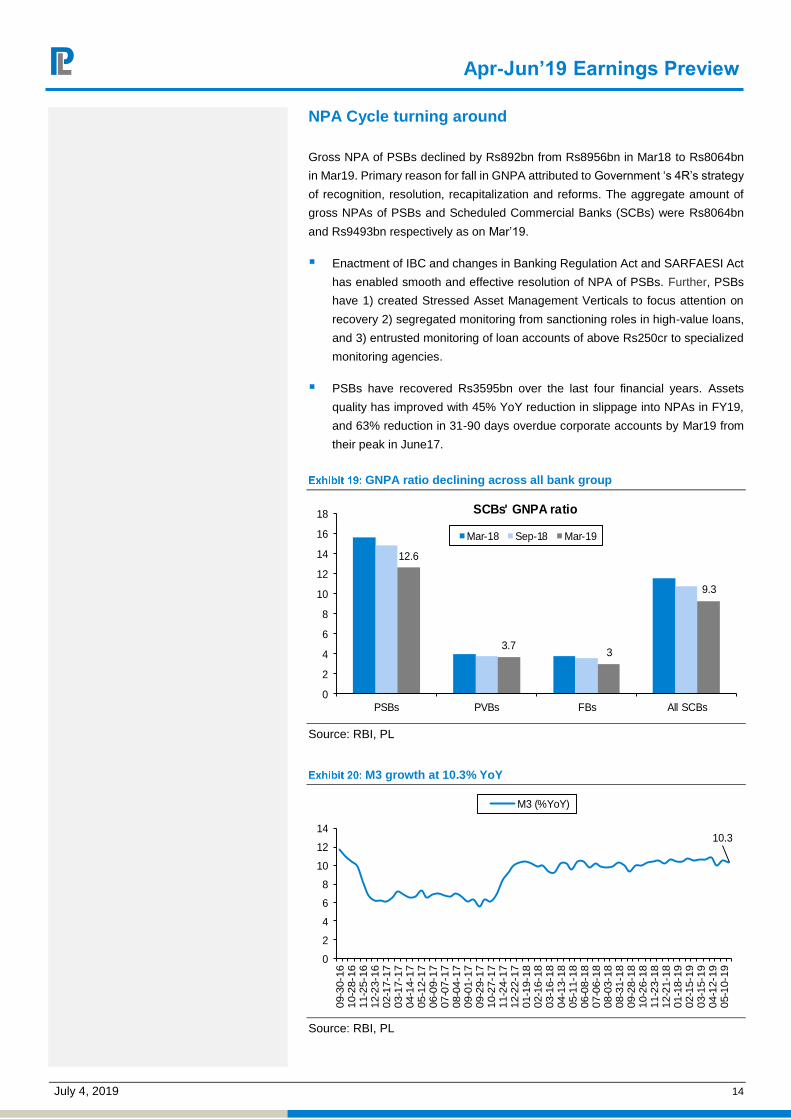
NPA Cycle turning around
Gross NPA of PSBs declined by Rs892bn from Rs8956bn in Mar18 to Rs8064bn
in Mar19. Primary reason for fall in GNPA attributed to Government ‘s 4R’s strategy
of recognition, resolution, recapitalization and reforms. The aggregate amount of
gross NPAs of PSBs and Scheduled Commercial Banks (SCBs) were Rs8064bn
and Rs9493bn respectively as on Mar’19.
Enactment of IBC and changes in Banking Regulation Act and SARFAESI Act
has enabled smooth and effective resolution of NPA of PSBs. Further, PSBs
have 1) created Stressed Asset Management Verticals to focus attention on
recovery 2) segregated monitoring from sanctioning roles in high-value loans,
and 3) entrusted monitoring of loan accounts of above Rs250cr to specialized
monitoring agencies.
PSBs have recovered Rs3595bn over the last four financial years. Assets
quality has improved with 45% YoY reduction in slippage into NPAs in FY19,
and 63% reduction in 31-90 days overdue corporate accounts by Mar19 from
their peak in June17.
GNPA ratio declining across all bank group
12.6
3.73
9.3
0
2
4
6
8
10
12
14
16
18
PSBs PVBs FBs All SCBs
SCBs' GNPA ratio
Mar-18 Sep-18 Mar-19
Source: RBI, PL
M3 growth at 10.3% YoY
10.3
0
2
4
6
8
10
12
14
09-3
0-16
10-2
8-16
11-2
5-16
12-2
3-16
02-1
7-17
03-1
7-17
04-1
4-17
05-1
2-17
06-0
9-17
07-0
7-17
08-0
4-17
09-0
1-17
09-2
9-17
10-2
7-17
11-2
4-17
12-2
2-17
01-1
9-18
02-1
6-18
03-1
6-18
04-1
3-18
05-1
1-18
06-0
8-18
07-0
6-18
08-0
3-18
08-3
1-18
09-2
8-18
10-2
6-18
11-2
3-18
12-2
1-18
01-1
8-19
02-1
5-19
03-1
5-19
04-1
2-19
05-1
0-19
M3 (%YoY)
Source: RBI, PL
Apr-Jun’19 Earnings Preview
July 4, 2019 15
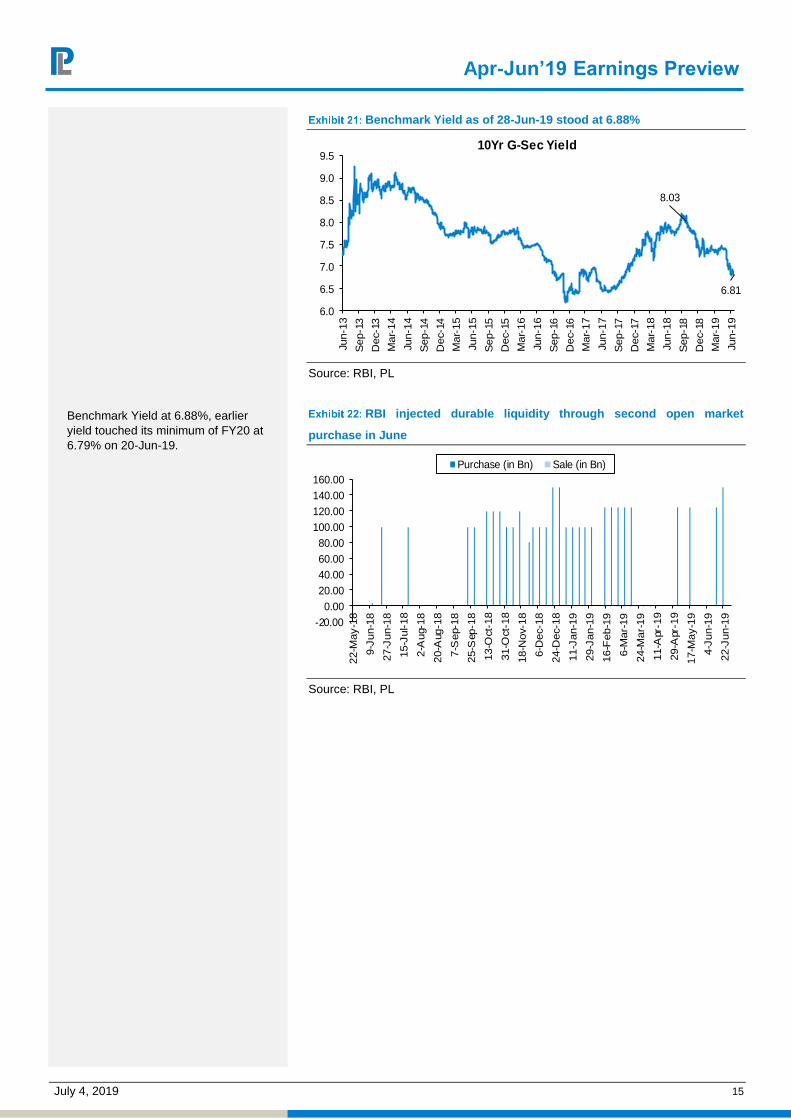
Benchmark Yield as of 28-Jun-19 stood at 6.88%
8.03
6.81
6.0
6.5
7.0
7.5
8.0
8.5
9.0
9.5
Jun-
13
Sep
-13
Dec
-13
Mar
-14
Jun-
14
Sep
-14
Dec
-14
Mar
-15
Jun-
15
Sep
-15
Dec
-15
Mar
-16
Jun-
16
Sep
-16
Dec
-16
Mar
-17
Jun-
17
Sep
-17
Dec
-17
Mar
-18
Jun-
18
Sep
-18
Dec
-18
Mar
-19
Jun-
19
10Yr G-Sec Yield
Source: RBI, PL
RBI injected durable liquidity through second open market
purchase in June
-20.000.00
20.0040.0060.0080.00
100.00120.00140.00160.00
22-M
ay-1
8
9-Ju
n-18
27-J
un-1
8
15-J
ul-1
8
2-A
ug-1
8
20-A
ug-1
8
7-S
ep-1
8
25-S
ep-1
8
13-O
ct-1
8
31-O
ct-1
8
18-N
ov-1
8
6-D
ec-1
8
24-D
ec-1
8
11-J
an-1
9
29-J
an-1
9
16-F
eb-1
9
6-M
ar-
19
24-M
ar-1
9
11-A
pr-1
9
29-A
pr-1
9
17-M
ay-
19
4-Ju
n-19
22-J
un-1
9
Purchase (in Bn) Sale (in Bn)
Source: RBI, PL
Benchmark Yield at 6.88%, earlier yield touched its minimum of FY20 at 6.79% on 20-Jun-19.

Apr-Jun’19 Earnings Preview
July 4, 2019 16
2MFY20 Fiscal Deficit lower than trends attributed by fall in expenditure
Fiscal deficit (FD) upto May’19 stood at Rs3,662bn which was 52% of the
budgeted estimates which is lowest in last three years. FD for May’18 was at
55% of budgeted estimates.
Revenue Deficit stood at 68% of budgeted target remained unchanged from
previous year budgeted target.
FD has been comparatively lower mainly as Capital expenditure declined from
Rs638bn upto May’18 to Rs477bn in May’19, a decline by 25%. The decline in
expenditure was seen from lower expenditure v/s budgeted in road & rural
The total expenditure of the government recorded at Rs5,130bn or 18% of
budget estimate.
On the other hand, Cumulative May total revenue receipt accounted for
Rs1,468bn or 7% of budgeted estimates unchanged from May’18. Cumulative
GST collection decline by 7%.
Total subsidies increased to 38.8% of May’19 budgeted estimate from 33.6%
seen in May’18 and market borrowing to Budget estimate at 52.4%, absolute
amount stood at Rs2,348bn.
Total expenditure at 18% of Budgeted Estimate
Government Accounts (Rs bn) Upto
May'19 Upto
May'18 YoY %
Revised Budget
Est
% to total Budget
Est.
Revenue Receipts 1,438 1,265 14% 19,777 7%
Tax Revenue (Net) 1,153 1,024 13% 17,050 7%
Non-Tax Revenue 284 240 18% 2,726 10%
Non-Debt Capital Receipts 31 10 205% 1,025 3%
Recovery of Loans 7 6 25% 125 6%
Other Receipts 24 4 443% 900 3%
Total Receipts 1,468 1,275 15% 20,802 7%
Revenue Expenditure 4,653 4,092 14% 24,484 19%
(i) of which Interest Payments 748 736 2% 6,651 11%
Capital Expenditure 477 638 -25% 3,358 14%
(i) of which Loans disbursed 38 92 -59% 277 14%
Total Expenditure 5,130 4,730 8% 27,842 18% Source: CGA, PL
Apr-Jun’19 Earnings Preview
July 4, 2019 17
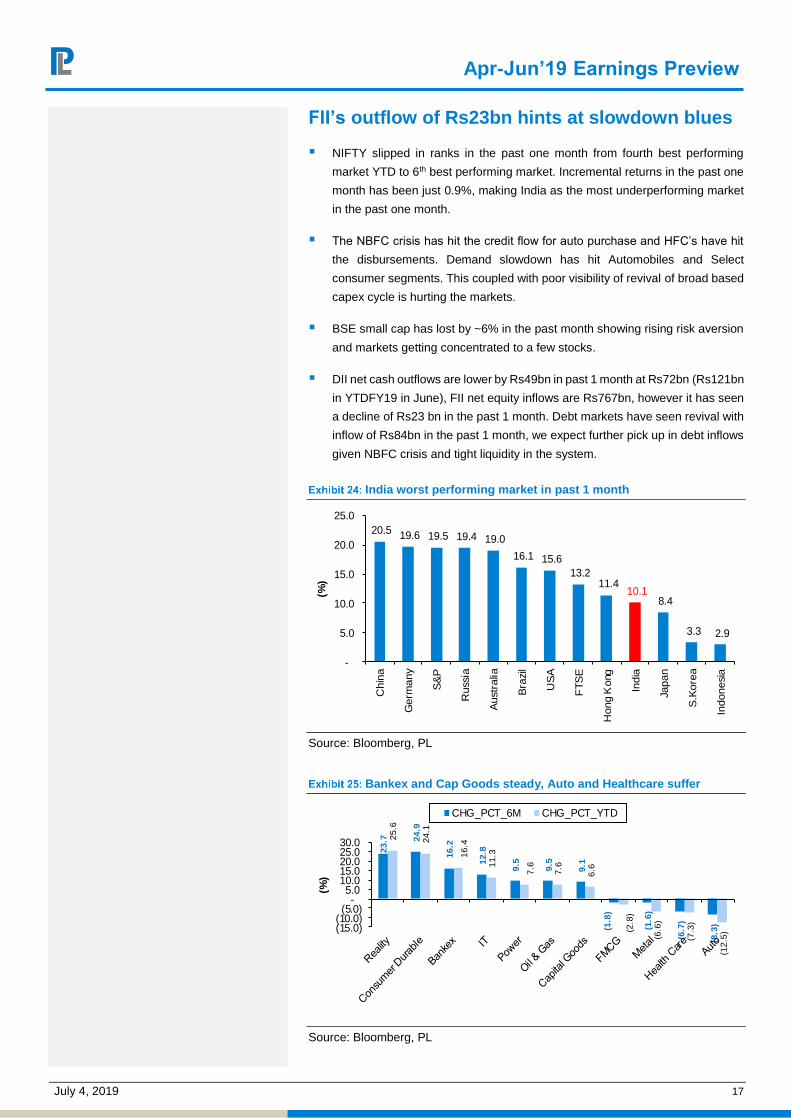
FII’s outflow of Rs23bn hints at slowdown blues
NIFTY slipped in ranks in the past one month from fourth best performing
market YTD to 6th best performing market. Incremental returns in the past one
month has been just 0.9%, making India as the most underperforming market
in the past one month.
The NBFC crisis has hit the credit flow for auto purchase and HFC’s have hit
the disbursements. Demand slowdown has hit Automobiles and Select
consumer segments. This coupled with poor visibility of revival of broad based
capex cycle is hurting the markets.
BSE small cap has lost by ~6% in the past month showing rising risk aversion
and markets getting concentrated to a few stocks.
DII net cash outflows are lower by Rs49bn in past 1 month at Rs72bn (Rs121bn
in YTDFY19 in June), FII net equity inflows are Rs767bn, however it has seen
a decline of Rs23 bn in the past 1 month. Debt markets have seen revival with
inflow of Rs84bn in the past 1 month, we expect further pick up in debt inflows
given NBFC crisis and tight liquidity in the system.
India worst performing market in past 1 month
20.5 19.6 19.5 19.4 19.0
16.1 15.6 13.2
11.4 10.1
8.4
3.3 2.9
-
5.0
10.0
15.0
20.0
25.0
Chi
na
Ger
man
y
S&
P
Rus
sia
Aus
tral
ia
Bra
zil
US
A
FTS
E
Hon
g K
ong
Indi
a
Japa
n
S.K
orea
Indo
nesi
a
(%)
Source: Bloomberg, PL
Bankex and Cap Goods steady, Auto and Healthcare suffer
23.7
24.9
16.2
12.8
9.5
9.5
9.1
(1.8
)
(1.6
)
(6.7
)
(8.3
)
25.6
24.1
16.4
11
.3
7.6
7.6
6.6
(2.8
)
(6.6
)
(7.3
)
(12.
5)
(15.0) (10.0) (5.0)
- 5.0
10.0 15.0 20.0 25.0 30.0
(%)
CHG_PCT_6M CHG_PCT_YTD
Source: Bloomberg, PL

Apr-Jun’19 Earnings Preview
July 4, 2019 18
Markets continue to center around select large caps
3.3
3.1
2.5
1.6
(4.0
)
(2.9
)
12
.0
11
.5
9.7
8.0
(1.7
)
(1.2
)
12
.1
11
.1
9.4
6.3
(10
.6) (2
.9)
(15.0) (10.0) (5.0)
- 5.0
10.0 15.0
Sen
sex
Nift
y
BS
E-1
00
BS
E-5
00
BS
E S
mal
l-Cap
BS
E M
id-C
ap
(%)
CHG_PCT_3M CHG_PCT_6M CHG_PCT_1YR
Source: Bloomberg, PL
FII equity outflows at Rs23bn over past month
262
-219
278
-569
-735
-303
676
371
908 1,09
4
-72
843
1,33
9
-37
1,29
3
1,11
3
974
184
188 52
9
-342
767
-1,000
-500
-
500
1,000
1,500
2009
2010
2011
2012
2013
2014
2015
2016
2017
2018
YT
D20
19
(Rs
bn
)
DII Net Cash FII Net Cash
Source: Bloomberg, PL
FII Debt inflows up Rs84bn in past month
48
489
415
362
-537
1,59
2
469
-443
1,48
5
-465
115
-1,000
-500
-
500
1,000
1,500
2,000
(Rs
bn
)
Source: Bloomberg, PL
NIFTY movement has strong correlation with FII inflows
71.5%
17.2%
-24.9%
27.4%
5.9%
31.4%
-4.1%2.8%
28.1%
4.1% 9.7%
-40.0%
-20.0%
0.0%
20.0%
40.0%
60.0%
80.0%
-600 -400 -200
- 200 400 600 800
1,000 1,200 1,400 1,600
FII Net Cash % Nifty Chng.
Source: Company, PL
Small cap index has again gone into red (-4% for 3M as against 1.9% positive in previous month) showing rising risk aversion and market’s
continued flight to safety
Apr-Jun’19 Earnings Preview
July 4, 2019 19
Key Sector Snapshots
Agri Inputs: Domestic performance of agrochemical companies will be in limelight
over the next 6 months due to the onset of monsoon and the start of Kharif season.
Business in 1Q is largely driven by placements. While placements in the initial 2.5
months was tepid, pick up in rainfall over the last 15 days led to increased seed
sales and placement of agrochemicals. Season and sowing activity has delayed by
15-20 days which has also marginally impacted the placements for the
agrochemical industry. We expect some tailwinds in gross margins due to decline
in raw materials prices. Ex-UPL, we expect aggregate revenue and EBITDA to grow
by 8.4% and 2.4% YoY for our coverage universe. Aggregate adjusted profit is
expected to be flat YoY.
Automobiles: • The prevailing demand headwinds during 1QFY20 as reflected
in PVs/2Ws/CVs volumes decline of 16%/6%/13 YoY to continue dent financial
performance. We expect, impact of negative operating leverage and product mix to
partially offset by ease in commodity inflation and cost control initiatives.
Consequently, for our auto OEMs universe (ex-TTMT), we expect YoY
revenue/EBITDA/PAT decline of -4%/-19%/-19.5% with margins contracting by
180bp YoY. We like MSIL and MSS among large caps and EXID from mid-caps.
Aviation: Capacity constraints in peak holiday season due to Jet’s suspended
operations and grounding of Boeing 737 Max aircrafts has led to a surge in air fares.
Notwithstanding the flat domestic passenger traffic growth over April-May, airlines
are expected to enjoy another stellar quarter and report strong margins &
profitability on the back of high yield environment and soft ATF prices (down 1.2%
YoY)
Banks: Banks will continue to see improvement in asset quality ratios from lower
impairment ratios and see further improvement in PCR, though credit cost trends
for most large banks should be heading downwards. Lowered benchmark yields
could likely help treasury gains and MTM benefit on investment provisions, aiding
overall operating performance. RBI’s action on benchmark should act with positive
bias on NIMs as pass on through MCLR has been minimal in last 6 months. NII
growth would grow at 17% YoY but will continue to be led by private banks with
growth of 23.5% YoY Key trends to watch for (i) Retail loan growth especially
unsecured segment as base effect plays out (ii) any likely initiation in resolution
plans post implementation of revised FRSA in Jun’19 and (iii) retail deposits trends
which have been making life tougher for private banks. Key play continues to be
corporate banks especially ICICI/SBI as risk-reward remains favorable, while
IIB/BOB will see merged numbers it will be crucial to see the financial impact (also
individual asset quality for IIB) & path ahead. Yes Bank will continue to see
challenging time on asset quality, provisions and capital. In mid-cap banks we see
lower concerns on Federal Bank

Apr-Jun’19 Earnings Preview
July 4, 2019 20
Capital Goods: We expect execution momentum to continue over the next 2-3
quarters, however order inflow (up ~10% YoY in FY19) could witness some
slowdown (-4% YoY) in 1QFY20 due to cyclicality factors. We expect it to pick-up
from 2QFY20 onwards. We expect revenue (Capital goods coverage universe) to
grow 8% YoY mainly led by large cap companies like L&T (+9% YoY), SIEM (+15%
YoY) and TMX (+12% YoY). On mid/small-cap we anticipate Apar (+16% YoY),
ENGR (+19% YoY), KPP (+14% YoY) and VAMP (+20% YoY). We believe an
overall 130bps YoY EBITDA margin improvement in 1QFY20, resulting ~12% YoY
EBITDA growth. PAT is expected to grow ~15% YoY. We remain positive on the
sector due to robust order back-log & order pipeline, better execution focus and
reasonable valuations.
Cement: We expect EBITDA of our coverage universe to grow by 48% YoY, led by
sharp increase in realizations negating fall in volumes. Volumes would fall by 1.6%
YoY due to elections, lower government spending and continued sluggishness in
real estate sector. Due to improvement in realizations, EBITDA/t of coverage
universe to grow by 51% YoY to Rs1,235.
Consumer: Growth rates in rural have remained soft during the quarter considering
last year’s poor monsoons, food deflation and tight liquidity. Though liquidity
scenario has improved QoQ, it remains far from being satisfactory. Despite delay
in onset of monsoons by more than a week and forecasts of being below normal,
spatial distribution in drought prone areas remains a key factor. Input costs
headwinds are visible going forward. Food inflation coupled with higher government
spends, benefits of PM Kisan Yojana and increase in MSP would increase farmers
purchasing power and boost rural demand. Increase in margins from this levels
would be in a calibrated manner only.
Consumer Durables: RAC industry is expected to report strong volume growth
aided by harsh summer and a lower base. However, inability to take any price
increase on the back of high channel inventory prior to start of the summer season
& competitive scenario shall limit gains from softening of commodity prices. With
sluggish demand scenario across products observed in 4Q19 continuing in 1Q20,
gains derived from softening of commodity prices shall be limited. Industry
continues to focus on providing a differentiated value proposition
Education: Navneet is expected to be in limelight as it derives ~50-55% of sales in
1Q. We believe the company is on track to achieve full year growth guidance amid
rising share of exports and proposed syllabus changes in Gujarat & Maharashtra.
In case of S Chand, focus will be on cash flow & working capital management.
Financial Services: With new challenges emerging for NBFCs, Q1FY20 is unlikely
to show any respite from the trend of past couple of quarters. Even as concerns on
high funding costs and sluggish growth persist, liquidity issues continue to cause
problems. Since NBFCs recalibrate their balance sheets in order to limit credit risks
and combat liquidity cycles, valuation multiples are likely to remain under pressure.
Due to RBI’s timely intervention (in OMOs & FX swaps) tightening liquidity is not a
concern yet, however, increased risk perception adds to unease investor interest
into NBFCs. ILFS fallout and slowdown in auto industry have led to moderate
disbursements for asset financiers. Tight liquidity concerns, pressure on asset
quality from developer side and riskier SME led LAP businesses have turned
housing financiers cautious. With increased competition from banks, NBFCs will
continue to focus on diversifying its assets.
Apr-Jun’19 Earnings Preview
July 4, 2019 21
Q1FY20 should witness a breather in terms of steady margins and flat credit costs
QoQ to offset NBFC’s benign credit growth. We continue to prefer HDFC Ltd in
housing and Cholamandalam Finance in vehicle finance. We also like SHTF at
compelling valuations with a key overhang behind.
Information Technology: We expect Q1FY20E to be a mixed quarter for Indian IT
services with TCS & Infosys likely to post steady revenue growth in tier-1 &
Hexaware, Mphasis, LTTS to post steady revenue growth in tier-2 IT services under
our coverage universe. We expect revenue growth in CC between -0.7%-3.2% QoQ
for Tier-1 IT companies. We expect TCS to deliver 3.2% QoQ CC broad-based
growth across verticals & geographies. We expect Infosys to deliver steady growth
of 2.5% QoQ CC with ~146 bps QoQ decline in margins led by wage hike, H-1B
visa costs & INR appreciation.
Media: Radio companies are expected to report subdued growth as advertising
environment across sectors like BFSI, auto, retail, real estate and FMCG is muted.
Inventory utilization and pricing is expected to remain flat. Operating leverage
benefit may not fully play out given growth concerns.
Metals: We expect EBITDA of our coverage universe to fall by 16% QoQ/9% YoY
due to fall in steel prices (down by Rs300/t QoQ) and weak volumes. Trade disputes
between USA and China, weak sentiments and overcapacity would keep earnings
highly volatile for the sector. We do expect imposition of some safeguard measures
by Govt to support margins of domestic steel industry given the sharp fall in steel
prices and sharp cut in exports. Admittedly, these measures would provide boost
to earnings for a very short period given the temporary nature of these tools. This
would drive short-term rally in steel stocks. However, weak domestic demand,
limited life (of around six months) of safeguard measures and volatile global
environment would keep the up move under check. We expect short-livid run-up of
10-15% in stocks in reaction to likely introduction of provisional safeguard duty.
Oil and Gas: Q1FY20 Oil sector earnings are expected to be strong with healthy
performance of gas players and upstream companies despite weak performance
by OMCs. Upstream earnings will benefit from higher crude oil and gas prices while
inventory losses will drag OMCs earnings. RIL earnings will recover by way of
higher refining earnings and strong petrochemicals profitability. IGL, MGL and
PLNG are likely to report healthy performance during the quarter.
Pharma/Healthcare: With appreciation of INR against major currencies, we expect
reported growth and margins to be impacted in Q1FY20E. Emerging market (EM)
sales are to remain tepid as all major EM currencies (against USD) declined further
in Q1FY20E. India Formulations growth to be 8-10% in our coverage universe. An
increase in volume and bigger growth in price were the reason for better India
formulations growth in Q4FY19. The sector valuation remains unaffected and fails
to reflect unfavorable risk-return matrices
Apr-Jun’19 Earnings Preview
July 4, 2019 22
Sales and EBIDTA growth (ex Oil & Gas) slows down QoQ
Aviation and Agri drive sales; Auto a drag
Source: Company, PL
Sales growth continues to soften
Source: Company, PL
Auto, Metals and Oil and Gas drag EBIDTA
Source: Company, PL
EBIDTA growth softens QoQ
Source: Company, PL
Banks, Aviation and Cement drive PAT growth
Source: Company, PL
PAT growth normalises post bumper 4Q19
Source: Company, PL
3.5%
9.6%
19.1
%
23.4
%
22.3
%
14.0
%
14.6
%
12.0
%
11.8
%17.6
%
10.6
%
5.8%
0.2%1.3%
-6.4
%
Q1F
Y20
Q4F
Y19
Q3F
Y19
Q2F
Y19
Q1F
Y19
Q4F
Y18
Q3F
Y18
Q2F
Y18
Q1F
Y18
Q4F
Y17
Q3F
Y17
Q2F
Y17
Q1F
Y17
Q4F
Y16
Q3F
Y16
All Sector - Sales
5.7%
10.5%
13.3%13.8%
18.2%
12.7%13.5%11.7%
6.7%
11.0%9.2%9.8%9.6%9.2%
Q1F
Y20
Q4F
Y19
Q3F
Y19
Q2F
Y19
Q1F
Y19
Q4F
Y18
Q3F
Y18
Q2F
Y18
Q1F
Y18
Q4F
Y17
Q3F
Y17
Q2F
Y17
Q1F
Y17
Q4F
Y16
All Sector - Sales (Excl. Oil & Gas)
1.3%
12.0
%
3.0%
8.7%
28.0
%
12.9
%
17.5
%
16.5
%
-4.4
%
11.1
%20.4
%
23.6
%
12.9
%
4.6%9.
5%
Q1F
Y20
Q4F
Y19
Q3F
Y19
Q2F
Y19
Q1F
Y19
Q4F
Y18
Q3F
Y18
Q2F
Y18
Q1F
Y18
Q4F
Y17
Q3F
Y17
Q2F
Y17
Q1F
Y17
Q4F
Y16
Q3F
Y16
All Sector - EBITDA
7.1%
12.6%9.3%
7.1%
22.0%
5.5%
13.7%13.3%
-0.1%
12.8%
19.6%21.5%
14.8%12.5%
-1.0%
Q1F
Y20
Q4F
Y19
Q3F
Y19
Q2F
Y19
Q1F
Y19
Q4F
Y18
Q3F
Y18
Q2F
Y18
Q1F
Y18
Q4F
Y17
Q3F
Y17
Q2F
Y17
Q1F
Y17
Q4F
Y16
Q3F
Y16
All Sector - EBITDA (Excl. Oil & Gas)
6.9%
48.7
%
4.6%12
.5%
17.7
%
-21.
4%
12.2
%
13.6
%
-9.2
%
23.9
%
21.9
%
13.8
%
4.3%
-16.
7%1.8%
Q1F
Y20
Q4F
Y19
Q3F
Y19
Q2F
Y19
Q1F
Y19
Q4F
Y18
Q3F
Y18
Q2F
Y18
Q1F
Y18
Q4F
Y17
Q3F
Y17
Q2F
Y17
Q1F
Y17
Q4F
Y16
Q3F
Y16
All Sector - Adj. PAT19
.3%
75.6
%
15.3
%
11.4
%
10.1
%
-35.
2%
7.0%11
.5%
-3.8
%
25.5
%
22.9
%
3.0%
0.6%
-17.
5%
-17.
2%
Q1F
Y20
Q4F
Y19
Q3F
Y19
Q2F
Y19
Q1F
Y19
Q4F
Y18
Q3F
Y18
Q2F
Y18
Q1F
Y18
Q4F
Y17
Q3F
Y17
Q2F
Y17
Q1F
Y17
Q4F
Y16
Q3F
Y16
All Sector - Adj. PAT (Excl. Oil & Gas)
Apr-Jun’19 Earnings Preview
July 4, 2019 23
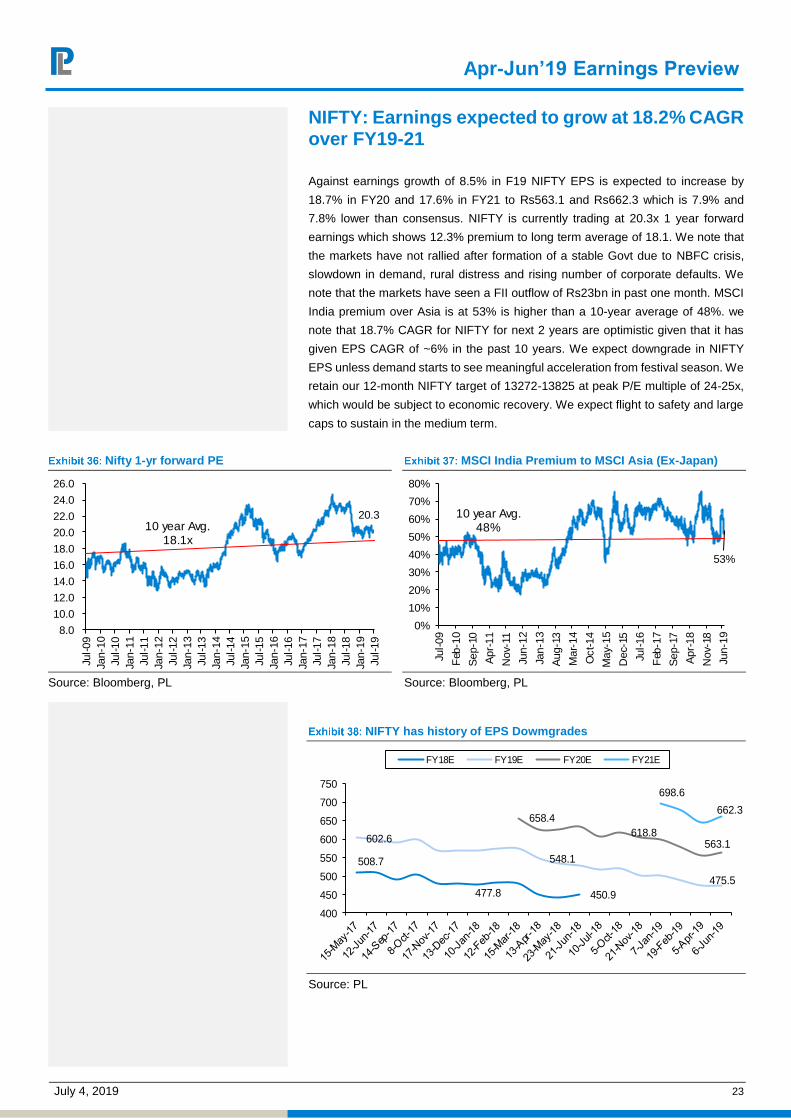
NIFTY: Earnings expected to grow at 18.2% CAGR over FY19-21
Against earnings growth of 8.5% in F19 NIFTY EPS is expected to increase by
18.7% in FY20 and 17.6% in FY21 to Rs563.1 and Rs662.3 which is 7.9% and
7.8% lower than consensus. NIFTY is currently trading at 20.3x 1 year forward
earnings which shows 12.3% premium to long term average of 18.1. We note that
the markets have not rallied after formation of a stable Govt due to NBFC crisis,
slowdown in demand, rural distress and rising number of corporate defaults. We
note that the markets have seen a FII outflow of Rs23bn in past one month. MSCI
India premium over Asia is at 53% is higher than a 10-year average of 48%. we
note that 18.7% CAGR for NIFTY for next 2 years are optimistic given that it has
given EPS CAGR of ~6% in the past 10 years. We expect downgrade in NIFTY
EPS unless demand starts to see meaningful acceleration from festival season. We
retain our 12-month NIFTY target of 13272-13825 at peak P/E multiple of 24-25x,
which would be subject to economic recovery. We expect flight to safety and large
caps to sustain in the medium term.
Nifty 1-yr forward PE
20.3
8.0
10.0
12.0
14.0
16.0
18.0
20.0
22.0
24.0
26.0
Jul-0
9Ja
n-10
Jul-1
0Ja
n-11
Jul-1
1Ja
n-12
Jul-1
2Ja
n-13
Jul-1
3Ja
n-14
Jul-1
4Ja
n-15
Jul-1
5Ja
n-16
Jul-1
6Ja
n-17
Jul-1
7Ja
n-18
Jul-1
8Ja
n-19
Jul-1
9
10 year Avg.18.1x
Source: Bloomberg, PL
MSCI India Premium to MSCI Asia (Ex-Japan)
53%
0%
10%
20%
30%
40%
50%
60%
70%
80%
Jul-0
9
Feb
-10
Sep
-10
Apr
-11
Nov
-11
Jun-
12
Jan-
13
Aug
-13
Mar
-14
Oct
-14
May
-15
Dec
-15
Jul-1
6
Feb
-17
Sep
-17
Apr
-18
Nov
-18
Jun-
19
10 year Avg.48%
Source: Bloomberg, PL
NIFTY has history of EPS Dowmgrades
508.7
477.8 450.9
602.6
548.1
475.5
658.4618.8
563.1
698.6
662.3
400
450
500
550
600
650
700
750
FY18E FY19E FY20E FY21E
Source: PL

Apr-Jun’19 Earnings Preview
July 4, 2019 24
Nifty Valuation
Source: Company Data, Bloomberg, PL Research
Note: Telecom Nos. is Bloomberg Consensus / Sector Weightages are updated as on July 04, 2019
Weight- age (%)
FY18 FY19 FY20E FY21EWeight- age (%)
FY18 FY19 FY20E FY21E
Banking & Fin. 40.6% Cement 1.0%PER (x) 54.8 44.3 26.0 20.2 PER (x) 48.6 52.4 25.7 24.1 PAT Grow th (%) (1.1) 23.5 70.3 28.9 PAT Grow th (%) (3.4) (7.2) 104.0 6.5
Technology 13.6% Others 0.8%PER (x) 25.3 22.1 21.0 18.7 PER (x) 12.8 19.3 7.0 5.8 PAT Grow th (%) 1.1 14.4 5.0 12.5 PAT Grow th (%) (15.4) (33.8) 174.8 21.0
Oil & Gas 12.1% Media 0.4%PER (x) 14.2 13.3 12.7 11.6 PER (x) 23.1 21.8 19.4 16.9 PAT Grow th (%) 2.0 6.2 4.7 10.2 PAT Grow th (%) (33.4) 5.9 12.9 14.7
Consumer 10.6% Ports & Logistics 0.7%PER (x) 50.3 44.6 39.2 34.2 PER (x) 9.3 8.6 7.4 6.4 PAT Grow th (%) 14.3 12.7 13.8 14.8 PAT Grow th (%) (6.1) 8.6 15.7 15.5
Auto 5.7% Agro Chemicals 0.8%PER (x) 19.0 21.6 17.9 15.9 PER (x) 18.9 15.5 11.6 9.3 PAT Grow th (%) (7.3) (12.1) 20.6 12.8 PAT Grow th (%) 0.2 21.5 33.8 25.0
Eng. & Power 6.3% Nifty as on Jul 4 11,947 PER (x) 18.1 15.0 14.1 12.6 EPS (Rs) - Free Float 480.9 445.7 563.1 662.3 PAT Grow th (%) 7.8 20.9 6.2 11.9 Growth (%) (4.9) 8.5 18.7 17.6
PER (x) 27.3 25.2 21.2 18.0 Metals 3.5%PER (x) 13.3 8.2 8.8 8.3 EPS (Rs) - Free Float - Nifty Cons. 480.9 445.7 611.7 718.3 PAT Grow th (%) 15.0 62.8 (6.6) 6.1 Var. (PLe v/s Cons.) (%) - - (7.9) (7.8)
Pharma 2.1% Sensex as on Jul 4 39,908 PER (x) 39.2 28.3 21.0 19.3 EPS (Rs) - Free Float 1,504.3 1,339.1 1,742.0 2,072.6 PAT Grow th (%) (50.0) 38.7 34.4 8.9 Growth (%) (11.1) 6.2 18.4 19.0
PER (x) 26.5 29.8 22.9 19.3 Telecom 1.9%PER (x) 65.4 80.9 161.5 50.8 EPS (Rs) - Free Float - Sensex Cons. 1,504.3 1,339.1 1,903.8 2,274.8 PAT Grow th (%) (45.1) (19.2) (49.9) 217.7 Var. (PLe v/s Cons.) (%) - - (8.5) (8.9)
Apr-Jun’19 Earnings Preview
July 4, 2019 25
SECTORS
July 4, 2019 26
July 4, 2019
Top Picks
PI Industries
UPL
Dhanuka Agritech
Insecticide India
Prashant Biyani [email protected] | 91-22-66322260
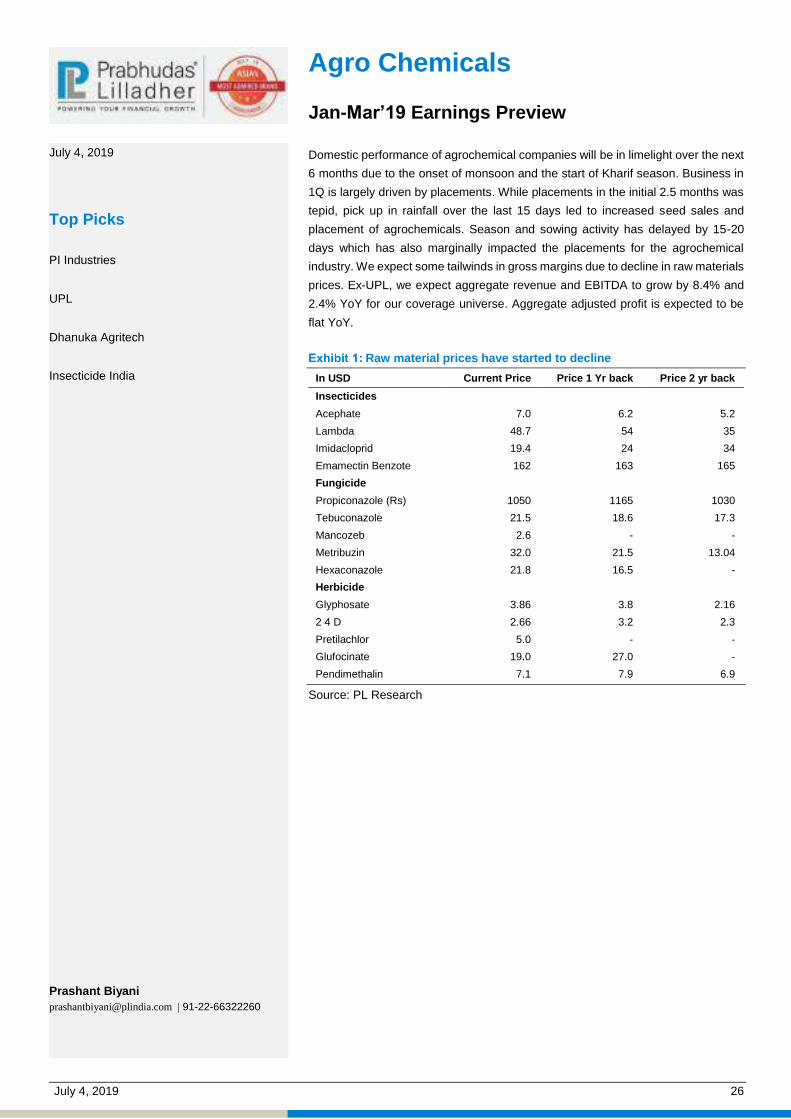
Agro Chemicals Jan-Mar’19 Earnings Preview
Domestic performance of agrochemical companies will be in limelight over the next
6 months due to the onset of monsoon and the start of Kharif season. Business in
1Q is largely driven by placements. While placements in the initial 2.5 months was
tepid, pick up in rainfall over the last 15 days led to increased seed sales and
placement of agrochemicals. Season and sowing activity has delayed by 15-20
days which has also marginally impacted the placements for the agrochemical
industry. We expect some tailwinds in gross margins due to decline in raw materials
prices. Ex-UPL, we expect aggregate revenue and EBITDA to grow by 8.4% and
2.4% YoY for our coverage universe. Aggregate adjusted profit is expected to be
flat YoY.
Raw material prices have started to decline
In USD Current Price Price 1 Yr back Price 2 yr back
Insecticides
Acephate 7.0 6.2 5.2
Lambda 48.7 54 35
Imidacloprid 19.4 24 34
Emamectin Benzote 162 163 165
Fungicide
Propiconazole (Rs) 1050 1165 1030
Tebuconazole 21.5 18.6 17.3
Mancozeb 2.6 - -
Metribuzin 32.0 21.5 13.04
Hexaconazole 21.8 16.5 -
Herbicide
Glyphosate 3.86 3.8 2.16
2 4 D 2.66 3.2 2.3
Pretilachlor 5.0 - -
Glufocinate 19.0 27.0 -
Pendimethalin 7.1 7.9 6.9
Source: PL Research
Agro Chemicals
July 4, 2019 27
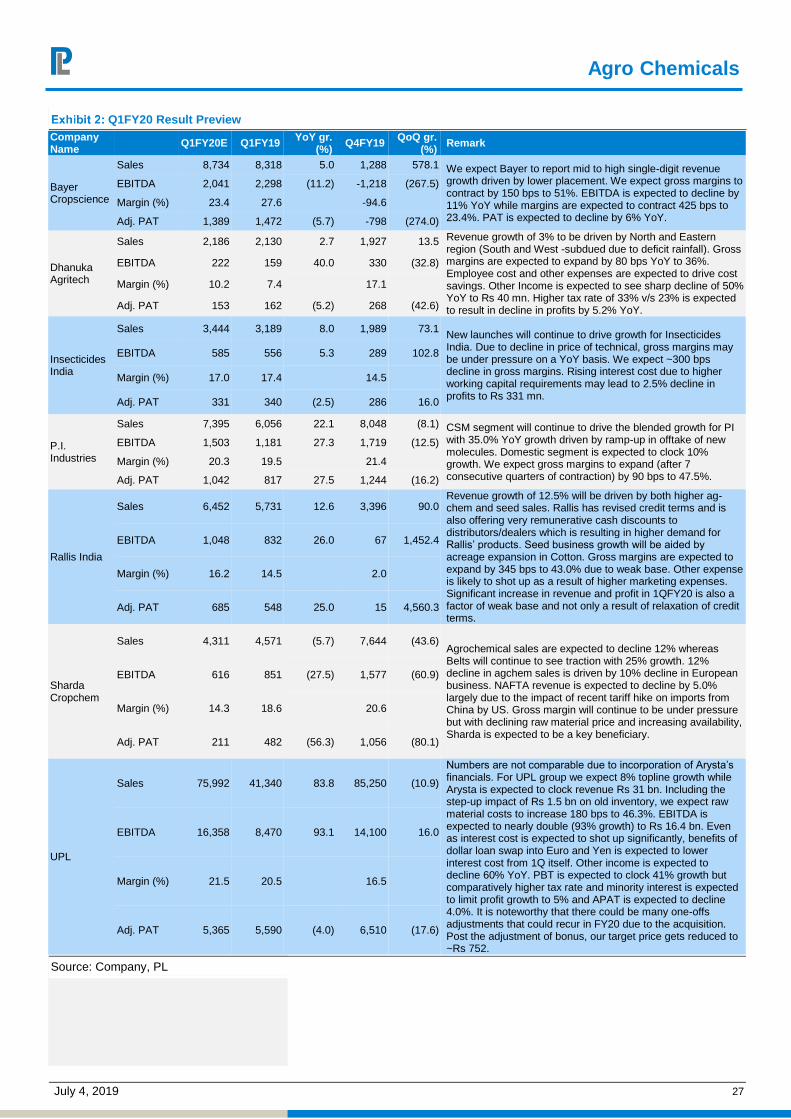
Q1FY20 Result Preview Company Name Q1FY20E Q1FY19 YoY gr.
(%) Q4FY19 QoQ gr.
(%) Remark
Bayer Cropscience
Sales 8,734 8,318 5.0 1,288 578.1 We expect Bayer to report mid to high single-digit revenue growth driven by lower placement. We expect gross margins to contract by 150 bps to 51%. EBITDA is expected to decline by 11% YoY while margins are expected to contract 425 bps to 23.4%. PAT is expected to decline by 6% YoY.
EBITDA 2,041 2,298 (11.2) -1,218 (267.5)
Margin (%) 23.4 27.6 -94.6
Adj. PAT 1,389 1,472 (5.7) -798 (274.0)
Dhanuka Agritech
Sales 2,186 2,130 2.7 1,927 13.5 Revenue growth of 3% to be driven by North and Eastern region (South and West -subdued due to deficit rainfall). Gross margins are expected to expand by 80 bps YoY to 36%. Employee cost and other expenses are expected to drive cost savings. Other Income is expected to see sharp decline of 50% YoY to Rs 40 mn. Higher tax rate of 33% v/s 23% is expected to result in decline in profits by 5.2% YoY.
EBITDA 222 159 40.0 330 (32.8)
Margin (%) 10.2 7.4 17.1
Adj. PAT 153 162 (5.2) 268 (42.6)
Insecticides India
Sales 3,444 3,189 8.0 1,989 73.1 New launches will continue to drive growth for Insecticides India. Due to decline in price of technical, gross margins may be under pressure on a YoY basis. We expect ~300 bps decline in gross margins. Rising interest cost due to higher working capital requirements may lead to 2.5% decline in profits to Rs 331 mn.
EBITDA 585 556 5.3 289 102.8
Margin (%) 17.0 17.4 14.5
Adj. PAT 331 340 (2.5) 286 16.0
P.I. Industries
Sales 7,395 6,056 22.1 8,048 (8.1) CSM segment will continue to drive the blended growth for PI with 35.0% YoY growth driven by ramp-up in offtake of new molecules. Domestic segment is expected to clock 10% growth. We expect gross margins to expand (after 7 consecutive quarters of contraction) by 90 bps to 47.5%.
EBITDA 1,503 1,181 27.3 1,719 (12.5)
Margin (%) 20.3 19.5 21.4
Adj. PAT 1,042 817 27.5 1,244 (16.2)
Rallis India
Sales 6,452 5,731 12.6 3,396 90.0 Revenue growth of 12.5% will be driven by both higher ag-chem and seed sales. Rallis has revised credit terms and is also offering very remunerative cash discounts to distributors/dealers which is resulting in higher demand for Rallis’ products. Seed business growth will be aided by acreage expansion in Cotton. Gross margins are expected to expand by 345 bps to 43.0% due to weak base. Other expense is likely to shot up as a result of higher marketing expenses. Significant increase in revenue and profit in 1QFY20 is also a factor of weak base and not only a result of relaxation of credit terms.
EBITDA 1,048 832 26.0 67 1,452.4
Margin (%) 16.2 14.5 2.0
Adj. PAT 685 548 25.0 15 4,560.3
Sharda Cropchem
Sales 4,311 4,571 (5.7) 7,644 (43.6) Agrochemical sales are expected to decline 12% whereas Belts will continue to see traction with 25% growth. 12% decline in agchem sales is driven by 10% decline in European business. NAFTA revenue is expected to decline by 5.0% largely due to the impact of recent tariff hike on imports from China by US. Gross margin will continue to be under pressure but with declining raw material price and increasing availability, Sharda is expected to be a key beneficiary.
EBITDA 616 851 (27.5) 1,577 (60.9)
Margin (%) 14.3 18.6 20.6
Adj. PAT 211 482 (56.3) 1,056 (80.1)
UPL
Sales 75,992 41,340 83.8 85,250 (10.9)
Numbers are not comparable due to incorporation of Arysta’s financials. For UPL group we expect 8% topline growth while Arysta is expected to clock revenue Rs 31 bn. Including the step-up impact of Rs 1.5 bn on old inventory, we expect raw material costs to increase 180 bps to 46.3%. EBITDA is expected to nearly double (93% growth) to Rs 16.4 bn. Even as interest cost is expected to shot up significantly, benefits of dollar loan swap into Euro and Yen is expected to lower interest cost from 1Q itself. Other income is expected to decline 60% YoY. PBT is expected to clock 41% growth but comparatively higher tax rate and minority interest is expected to limit profit growth to 5% and APAT is expected to decline 4.0%. It is noteworthy that there could be many one-offs adjustments that could recur in FY20 due to the acquisition. Post the adjustment of bonus, our target price gets reduced to ~Rs 752.
EBITDA 16,358 8,470 93.1 14,100 16.0
Margin (%) 21.5 20.5 16.5
Adj. PAT 5,365 5,590 (4.0) 6,510 (17.6)
Source: Company, PL

Agro Chemicals
July 4, 2019 28
Valuation Summary
Company Names Rating CMP (Rs) TP (Rs)
Sales (Rs bn) EBITDA (Rs bnm) PAT (Rs bn) EPS (Rs) RoE (%) PE (x)
FY18 FY19 FY20E FY21E FY18 FY19 FY20E FY21E FY18 FY19 FY20E FY21E FY18 FY19 FY20E FY21E FY18 FY19 FY20E FY21E FY18 FY19 FY20E FY21E
Bayer Cropscience HOLD 3,359 3,783 27.1 26.9 29.3 32.8 4.1 3.7 4.2 5.3 2.7 2.4 2.9 3.6 77.8 69.2 83.2 105.4 13.9 13.0 14.3 16.2 43.2 48.5 40.4 31.9
Dhanuka Agritech Buy 432 578 9.6 10.1 11.1 12.1 1.7 1.5 1.9 2.2 1.3 1.1 1.3 1.5 25.7 23.7 26.5 32.1 21.8 17.7 18.1 18.9 16.8 18.3 16.3 13.5
Insecticides India BUY 650 887 10.7 11.9 13.3 14.6 1.5 1.9 2.1 2.3 0.8 1.2 1.2 1.4 40.6 59.2 56.9 68.2 16.6 20.3 17.2 19.0 16.0 11.0 11.4 9.5
P.I. Industries Buy 1,200 1,278 22.8 28.4 34.6 41.2 4.9 5.7 7.2 9.3 3.7 4.1 5.1 6.3 26.6 29.6 37.1 45.7 20.8 19.5 20.7 21.5 45.2 40.6 32.3 26.3
Rallis India Acc 157 173 17.9 19.8 21.6 24.3 2.6 2.4 2.6 3.2 1.7 1.6 1.6 2.0 8.6 8.0 8.3 10.2 14.6 12.5 12.3 14.2 18.2 19.7 18.8 15.4
Sharda Cropchem Acc 319 402 17.1 20.0 22.7 26.0 3.5 3.3 4.1 5.0 1.9 1.8 2.0 2.4 21.1 19.5 22.3 26.7 18.2 14.6 14.9 15.9 15.1 16.3 14.3 11.9
UPL BUY 698 752 173.8 218.4 357.4 396.5 35.2 41.1 77.9 89.6 18.1 22.0 29.5 36.8 35.5 43.2 38.6 48.2 21.9 18.5 19.1 18.9 19.7 16.2 18.1 14.5
Source: Company, PL
July 4, 2019 29
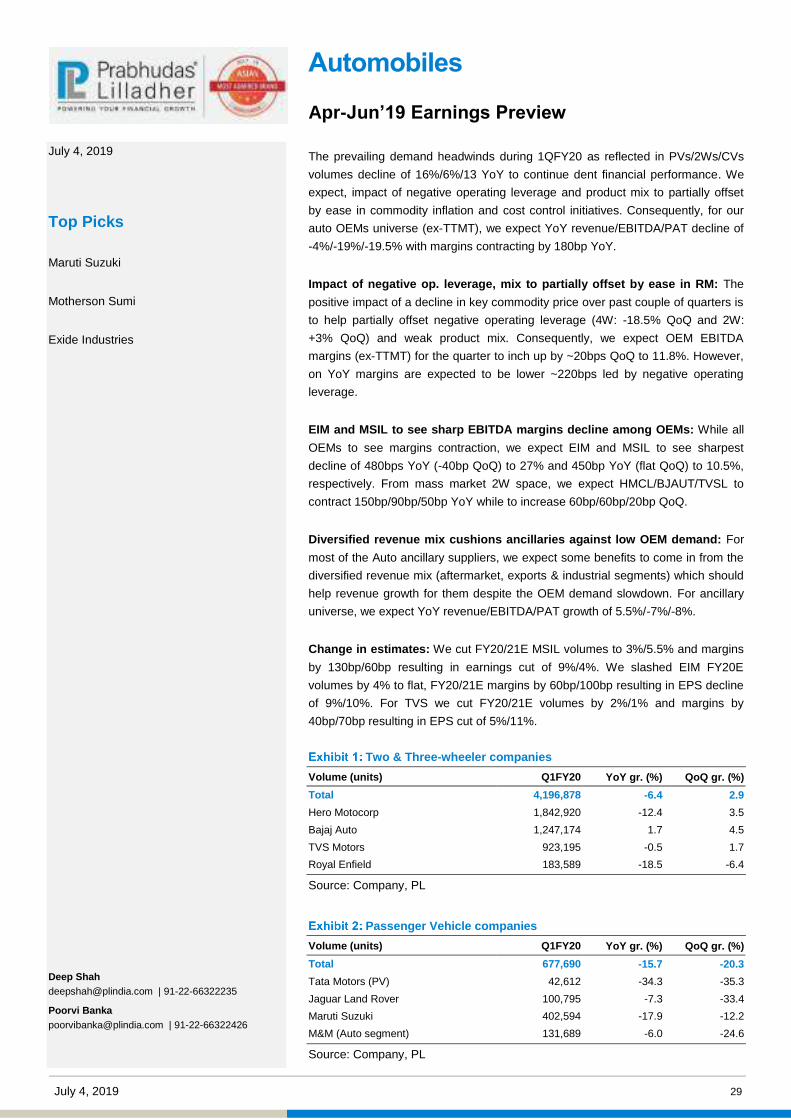
Automobiles Apr-Jun’19 Earnings Preview The prevailing demand headwinds during 1QFY20 as reflected in PVs/2Ws/CVs
volumes decline of 16%/6%/13 YoY to continue dent financial performance. We
expect, impact of negative operating leverage and product mix to partially offset
by ease in commodity inflation and cost control initiatives. Consequently, for our
auto OEMs universe (ex-TTMT), we expect YoY revenue/EBITDA/PAT decline of
-4%/-19%/-19.5% with margins contracting by 180bp YoY.
Impact of negative op. leverage, mix to partially offset by ease in RM: The
positive impact of a decline in key commodity price over past couple of quarters is
to help partially offset negative operating leverage (4W: -18.5% QoQ and 2W:
+3% QoQ) and weak product mix. Consequently, we expect OEM EBITDA
margins (ex-TTMT) for the quarter to inch up by ~20bps QoQ to 11.8%. However,
on YoY margins are expected to be lower ~220bps led by negative operating
leverage.
EIM and MSIL to see sharp EBITDA margins decline among OEMs: While all
OEMs to see margins contraction, we expect EIM and MSIL to see sharpest
decline of 480bps YoY (-40bp QoQ) to 27% and 450bp YoY (flat QoQ) to 10.5%,
respectively. From mass market 2W space, we expect HMCL/BJAUT/TVSL to
contract 150bp/90bp/50bp YoY while to increase 60bp/60bp/20bp QoQ.
Diversified revenue mix cushions ancillaries against low OEM demand: For
most of the Auto ancillary suppliers, we expect some benefits to come in from the
diversified revenue mix (aftermarket, exports & industrial segments) which should
help revenue growth for them despite the OEM demand slowdown. For ancillary
universe, we expect YoY revenue/EBITDA/PAT growth of 5.5%/-7%/-8%.
Change in estimates: We cut FY20/21E MSIL volumes to 3%/5.5% and margins
by 130bp/60bp resulting in earnings cut of 9%/4%. We slashed EIM FY20E
volumes by 4% to flat, FY20/21E margins by 60bp/100bp resulting in EPS decline
of 9%/10%. For TVS we cut FY20/21E volumes by 2%/1% and margins by
40bp/70bp resulting in EPS cut of 5%/11%.
Two & Three-wheeler companies
Volume (units) Q1FY20 YoY gr. (%) QoQ gr. (%)
Total 4,196,878 -6.4 2.9
Hero Motocorp 1,842,920 -12.4 3.5
Bajaj Auto 1,247,174 1.7 4.5
TVS Motors 923,195 -0.5 1.7
Royal Enfield 183,589 -18.5 -6.4
Source: Company, PL
Passenger Vehicle companies
Volume (units) Q1FY20 YoY gr. (%) QoQ gr. (%)
Total 677,690 -15.7 -20.3
Tata Motors (PV) 42,612 -34.3 -35.3
Jaguar Land Rover 100,795 -7.3 -33.4
Maruti Suzuki 402,594 -17.9 -12.2
M&M (Auto segment) 131,689 -6.0 -24.6
Source: Company, PL
July 4, 2019
Top Picks
Maruti Suzuki
Motherson Sumi
Exide Industries
Deep Shah [email protected] | 91-22-66322235
Poorvi Banka [email protected] | 91-22-66322426

Automobiles
July 4, 2019 30
Commercial Vehicle Companies
Volume (units) Q1FY20 YoY gr. (%) QoQ gr. (%)
Total 148,168 -12.8 -28.6
Tata Motors (CV) 94,997 -14.9 -25.3
Ashok Leyland 39,608 -6.0 -33.5
VECV 13,563 -16.4 -35.4
Source: Company, PL
Q1FY20 Result Preview
Company Name
Q1FY20E Q1FY19 YoY gr. (%)
Q4FY19 QoQ gr. (%)
Remark
Ashok Leyland
Sales 57,589 62,501 (7.9) 88,459 (34.9) AL reported a 6% YoY / 33.5% QoQ decline in volumes this quarter owing to excess capacity with fleet operators and limited freight availability in the segment. Anticipating realisations also to decline by 2% YoY on account of weaker product mix (lower MHCVs), we expect revenues to degrow by ~8% YoY and margins to contract by 30bps YoY / 100bps QoQ given the negative operating leverage.
EBITDA 5,816 6,475 (10.2) 9,854 (41.0)
Margin (%) 10.1 10.4 11.1
Adj. PAT 3,167 3,910 (19.0) 6,647 (52.4)
Bharat Forge
Sales 16,020 14,797 8.3 16,686 (4.0) With user industries like North America trucks as well as domestic CVs witnessing weak demand, we expect shipment tonnage to be lower 6% YoY in Q1FY20E. Overall revenue for Bharat Forge is expected to increase by 8% YoY and EBITDA margin is expected at 30%, up 100bps YoY but lower 100bps QoQ.
EBITDA 4,806 4,286 12.1 5,173 (7.1)
Margin (%) 30.0 29.0 31.0
Adj. PAT 2,711 2,345 15.6 2,995 (9.5)
Bajaj Auto
Sales 77,862 74,193 4.9 73,952 5.3 Overall volume growth for BJAUT over Q1FY20 has inched up 1.7% YoY / 4.5% QoQ, however, the volume mix has not been favourable with higher share of domestic motorycles (Platina/CT100) and lower 3Ws. While exports were higher (44% of volumes v/s 40.3% in Q4FY19), growth has been from lower margin African geography. With favourable currency, we expect margins to inch-up 60bps QoQ but be lower 100bps YoY.
EBITDA 12,718 12,814 (0.8) 11,623 9.4
Margin (%) 16.3 17.3
15.7
Adj. PAT 11,731 11,152 5.2 9,636 21.7
CEAT
Sales 16,722 17,063 (2.0) 17,605 (5.0) Ceat is expected to report 2% YoY / 5% QoQ de-growth in its revenues over Q1FY20 on account of negative volume growth in the OEM segment along with subdued replacement demand. Raw material prices too have been inching up (rubber prices up ~5% QoQ, crude up ~10% QoQ). We expect consol EBITDA margin to be at 8.7%, down 160bps YoY / 50bps QoQ.
EBITDA 1,461 1,758 (16.9) 1,623 (10.0)
Margin (%) 8.7 10.3 9.2
Adj. PAT 539 731 (26.3) 798 (32.5)
Eicher Motors
Sales 23,429 25,478 (8.0) 25,001 (6.3) Royal Enfield's Q1FY20 volumes have recorded a de-growth of 18.5% YoY / 6.4% QoQ to 183.6K units, while VECV volumes have also de-grown ~16% YoY / 35% QoQ to 13.6K units. We expect EIM to report consolidated revenue decline of ~8% YoY, with EBITDA margin slipping to 27%, lower 480bps YoY/ 40bps QoQ, on account of the negative operating leverage.
EBITDA 6,314 8,096 (22.0) 6,847 (7.8)
Margin (%) 27.0 31.8 27.4
Adj. PAT 4,957 5,762 (14.0) 5,448 (9.0)
Exide Industries
Sales 26,338 27,725 (5.0) 25,987 1.4 On the high base of last year, with weakening OEM demand, we expect Exide to report ~5% YoY but inch up 1.4% QoQ on account of Q1 being seasonally better. Despite lead prices softening (down ~6% QoQ), our EBITDA margin expectation is at 14%, down 20bps YoY & 40bps QoQ.
EBITDA 3,687 3,928 (6.1) 3,733 (1.2)
Margin (%) 14.0 14.2
14.4
Adj. PAT 1,988 2,099 (5.3) 2,107 (5.7)
Hero Motocorp
Sales 82,293 88,098 -6.6 78,850 4.4 With volume de-growth of 12% YoY but expected realisation increase of ~7.5% YoY on account of the ABS/CBS related price hike over Q1FY20, revenue de-growth is expected at 6.6% YoY (up 4.4% QoQ given volumes inching up 3.5% QoQ). Operating margins are expected to contract 140bps YoY but, with better product mix, rise 60bps QoQ.
EBITDA 11,667 13,773 (15.3) 10,693 9.1
Margin (%) 14.2 15.6 13.6 Adj. PAT 7,663 9,092 (15.7) 7,303 4.9
Automobiles
July 4, 2019 31
Company Name
Q1FY20E Q1FY19 YoY gr. (%)
Q4FY19 QoQ gr. (%)
Remark
Mahindra & Mahindra
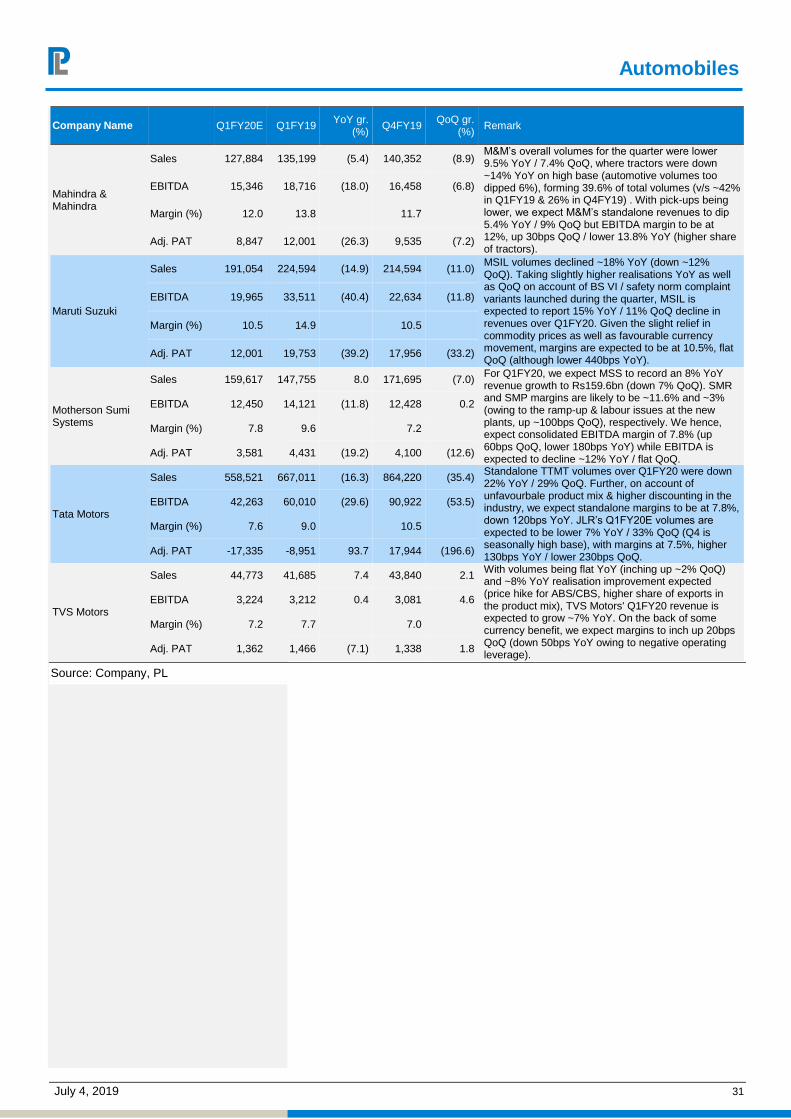
Sales 127,884 135,199 (5.4) 140,352 (8.9) M&M’s overall volumes for the quarter were lower 9.5% YoY / 7.4% QoQ, where tractors were down ~14% YoY on high base (automotive volumes too dipped 6%), forming 39.6% of total volumes (v/s ~42% in Q1FY19 & 26% in Q4FY19) . With pick-ups being lower, we expect M&M’s standalone revenues to dip 5.4% YoY / 9% QoQ but EBITDA margin to be at 12%, up 30bps QoQ / lower 13.8% YoY (higher share of tractors).
EBITDA 15,346 18,716 (18.0) 16,458 (6.8)
Margin (%) 12.0 13.8
11.7
Adj. PAT 8,847 12,001 (26.3) 9,535 (7.2)
Maruti Suzuki
Sales 191,054 224,594 (14.9) 214,594 (11.0) MSIL volumes declined ~18% YoY (down ~12% QoQ). Taking slightly higher realisations YoY as well as QoQ on account of BS VI / safety norm complaint variants launched during the quarter, MSIL is expected to report 15% YoY / 11% QoQ decline in revenues over Q1FY20. Given the slight relief in commodity prices as well as favourable currency movement, margins are expected to be at 10.5%, flat QoQ (although lower 440bps YoY).
EBITDA 19,965 33,511 (40.4) 22,634 (11.8)
Margin (%) 10.5 14.9 10.5
Adj. PAT 12,001 19,753 (39.2) 17,956 (33.2)
Motherson Sumi Systems
Sales 159,617 147,755 8.0 171,695 (7.0) For Q1FY20, we expect MSS to record an 8% YoY revenue growth to Rs159.6bn (down 7% QoQ). SMR and SMP margins are likely to be ~11.6% and ~3% (owing to the ramp-up & labour issues at the new plants, up ~100bps QoQ), respectively. We hence, expect consolidated EBITDA margin of 7.8% (up 60bps QoQ, lower 180bps YoY) while EBITDA is expected to decline ~12% YoY / flat QoQ.
EBITDA 12,450 14,121 (11.8) 12,428 0.2
Margin (%) 7.8 9.6 7.2
Adj. PAT 3,581 4,431 (19.2) 4,100 (12.6)
Tata Motors
Sales 558,521 667,011 (16.3) 864,220 (35.4) Standalone TTMT volumes over Q1FY20 were down 22% YoY / 29% QoQ. Further, on account of unfavourbale product mix & higher discounting in the industry, we expect standalone margins to be at 7.8%, down 120bps YoY. JLR’s Q1FY20E volumes are expected to be lower 7% YoY / 33% QoQ (Q4 is seasonally high base), with margins at 7.5%, higher 130bps YoY / lower 230bps QoQ.
EBITDA 42,263 60,010 (29.6) 90,922 (53.5)
Margin (%) 7.6 9.0
10.5
Adj. PAT -17,335 -8,951 93.7 17,944 (196.6)
TVS Motors
Sales 44,773 41,685 7.4 43,840 2.1 With volumes being flat YoY (inching up ~2% QoQ) and ~8% YoY realisation improvement expected (price hike for ABS/CBS, higher share of exports in the product mix), TVS Motors' Q1FY20 revenue is expected to grow ~7% YoY. On the back of some currency benefit, we expect margins to inch up 20bps QoQ (down 50bps YoY owing to negative operating leverage).
EBITDA 3,224 3,212 0.4 3,081 4.6
Margin (%) 7.2 7.7 7.0
Adj. PAT 1,362 1,466 (7.1) 1,338 1.8
Source: Company, PL

Automobiles
July 4, 2019 32
Valuation Summary
Company Names Rating CMP (Rs) TP (Rs)
Sales (Rs bn) EBITDA (Rs bn) PAT (Rs bn) EPS (Rs) RoE (%) PE (x)
FY18 FY19 FY20E FY21E FY18 FY19 FY20E FY21E FY18 FY19 FY20E FY21E FY18 FY19 FY20E FY21E FY18 FY19 FY20E FY21E FY18 FY19 FY20E FY21E
Ashok Leyland BUY 90 106 263.6 290.5 320.4 317.3 29.6 31.4 33.5 32.4 17.2 19.8 18.9 17.2 5.9 6.8 6.4 5.8 25.8 25.6 21.3 18.2 15.3 13.3 14.0 15.4
Bharat Forge HOLD 476 513 83.6 101.5 104.0 111.4 17.3 20.6 22.3 23.5 8.3 10.3 12.8 13.7 17.9 22.2 27.5 29.4 19.0 20.6 22.3 21.1 26.6 21.5 17.3 16.2
Bajaj Auto Reduce 2,895 2,823 251.6 302.5 325.8 347.9 47.8 49.8 53.2 56.7 40.9 44.4 47.2 50.1 141.4 153.3 163.2 173.0 22.6 21.7 20.4 19.2 20.5 18.9 17.7 16.7
CEAT Reduce 936 886 62.8 69.8 75.2 81.2 6.1 6.4 6.7 7.2 2.7 3.0 2.6 2.6 67.2 73.4 63.4 63.3 10.8 11.1 8.9 8.3 13.9 12.7 14.8 14.8
Eicher Motors HOLD 19,825 19,318 89.6 98.0 103.6 111.2 28.1 29.0 29.2 30.8 21.8 22.2 23.4 24.5 799.6 813.9 859.3 899.8 35.2 27.8 24.2 21.9 24.8 24.4 23.1 22.0
Exide Industries Acc 207 231 91.9 105.9 112.5 117.1 12.4 14.1 15.5 16.2 7.1 7.4 8.8 9.0 8.4 8.7 10.3 10.6 13.7 12.9 13.9 13.0 24.7 23.9 20.0 19.6
Hero Motocorp Acc 2,606 2,729 322.3 336.5 353.2 369.3 52.8 49.3 49.5 50.9 37.0 33.8 33.6 34.1 185.1 169.5 168.1 170.5 33.8 27.5 25.1 23.5 14.1 15.4 15.5 15.3
Mahindra & Mahindra BUY 672 815 486.9 536.1 583.9 623.9 62.2 66.4 75.0 77.7 39.2 48.3 52.6 56.7 33.0 40.5 44.1 47.6 13.7 15.0 14.5 14.0 20.4 16.6 15.2 14.1
Maruti Suzuki BUY 6,544 7,100 797.6 860.2 932.7 1,036.7 120.6 110.0 114.3 136.6 78.2 76.2 78.8 93.2 259.0 252.4 261.0 308.7 20.0 17.3 16.2 17.0 25.3 25.9 25.1 21.2
Motherson Sumi Systems Acc 127 131 562.9 635.2 713.5 787.2 51.2 53.5 54.9 68.6 14.2 16.1 16.0 22.9 6.7 5.1 5.1 7.3 15.6 15.5 14.5 19.6 18.8 24.8 25.0 17.5
Tata Motors Acc 165 189 2,946.2 3,019.4 3,193.3 3,438.1 369.7 297.9 363.3 386.5 58.3 17.3 56.6 71.1 17.2 5.1 16.7 20.9 7.6 2.2 9.0 10.2 9.6 32.4 9.9 7.9
TVS Motors HOLD 433 423 151.3 182.1 205.4 229.3 11.3 14.3 16.6 18.5 6.6 6.7 8.0 9.1 13.9 14.1 16.9 19.2 25.1 21.5 21.9 21.2 31.0 30.7 25.7 22.5
Source: Company, PL
July 4, 2019 33
July 4, 2019
Paarth Gala [email protected] | 91-22-66322242
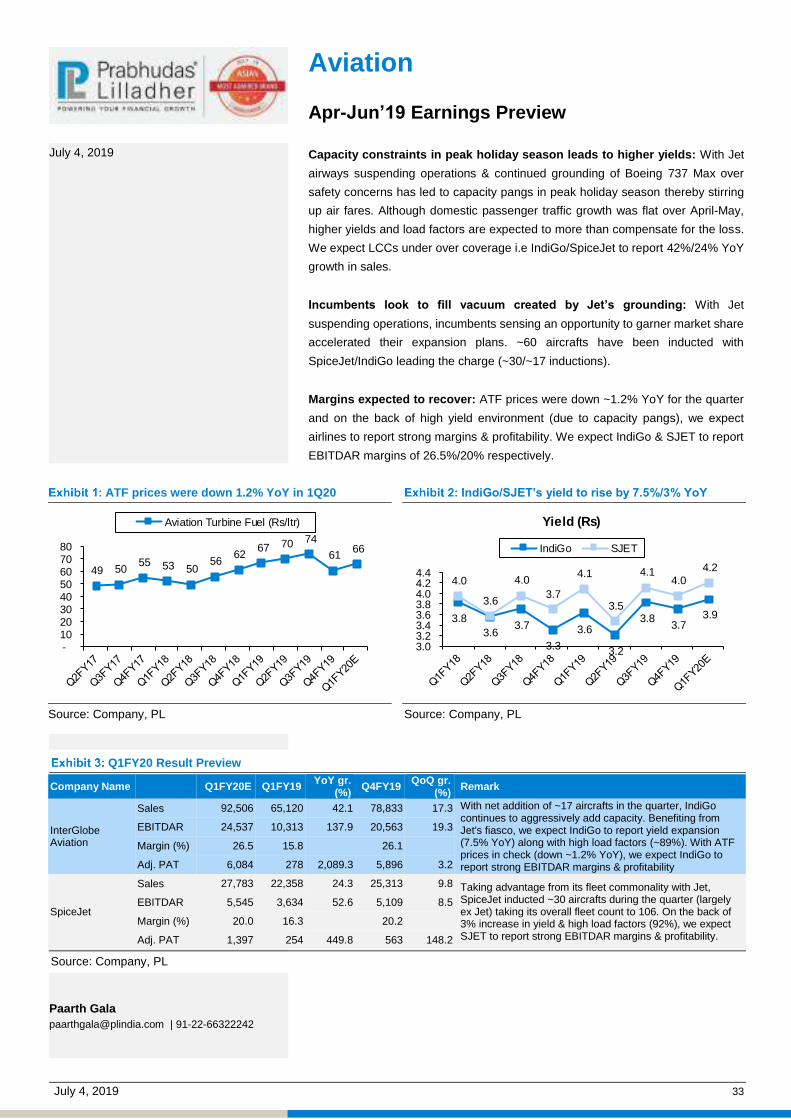
Aviation Apr-Jun’19 Earnings Preview
Capacity constraints in peak holiday season leads to higher yields: With Jet
airways suspending operations & continued grounding of Boeing 737 Max over
safety concerns has led to capacity pangs in peak holiday season thereby stirring
up air fares. Although domestic passenger traffic growth was flat over April-May,
higher yields and load factors are expected to more than compensate for the loss.
We expect LCCs under over coverage i.e IndiGo/SpiceJet to report 42%/24% YoY
growth in sales.
Incumbents look to fill vacuum created by Jet’s grounding: With Jet
suspending operations, incumbents sensing an opportunity to garner market share
accelerated their expansion plans. ~60 aircrafts have been inducted with
SpiceJet/IndiGo leading the charge (~30/~17 inductions).
Margins expected to recover: ATF prices were down ~1.2% YoY for the quarter
and on the back of high yield environment (due to capacity pangs), we expect
airlines to report strong margins & profitability. We expect IndiGo & SJET to report
EBITDAR margins of 26.5%/20% respectively.
ATF prices were down 1.2% YoY in 1Q20
49 50 55 53 50
56 62
67 70 74
61 66
- 10 20 30 40 50 60 70 80
Aviation Turbine Fuel (Rs/ltr)
Source: Company, PL
IndiGo/SJET’s yield to rise by 7.5%/3% YoY
3.8 3.6
3.7
3.3
3.6
3.2
3.8 3.7
3.9
4.0
3.6
4.0 3.7
4.1
3.5
4.1 4.0
4.2
3.0 3.2 3.4 3.6 3.8 4.0 4.2 4.4
Yield (Rs)
IndiGo SJET
Source: Company, PL
Q1FY20 Result Preview
Company Name Q1FY20E Q1FY19 YoY gr. (%) Q4FY19 QoQ gr.
(%) Remark
InterGlobe Aviation
Sales 92,506 65,120 42.1 78,833 17.3 With net addition of ~17 aircrafts in the quarter, IndiGo continues to aggressively add capacity. Benefiting from Jet's fiasco, we expect IndiGo to report yield expansion (7.5% YoY) along with high load factors (~89%). With ATF prices in check (down ~1.2% YoY), we expect IndiGo to report strong EBITDAR margins & profitability
EBITDAR 24,537 10,313 137.9 20,563 19.3
Margin (%) 26.5 15.8 26.1
Adj. PAT 6,084 278 2,089.3 5,896 3.2
SpiceJet
Sales 27,783 22,358 24.3 25,313 9.8 Taking advantage from its fleet commonality with Jet, SpiceJet inducted ~30 aircrafts during the quarter (largely ex Jet) taking its overall fleet count to 106. On the back of 3% increase in yield & high load factors (92%), we expect SJET to report strong EBITDAR margins & profitability.
EBITDAR 5,545 3,634 52.6 5,109 8.5
Margin (%) 20.0 16.3 20.2
Adj. PAT 1,397 254 449.8 563 148.2
Source: Company, PL
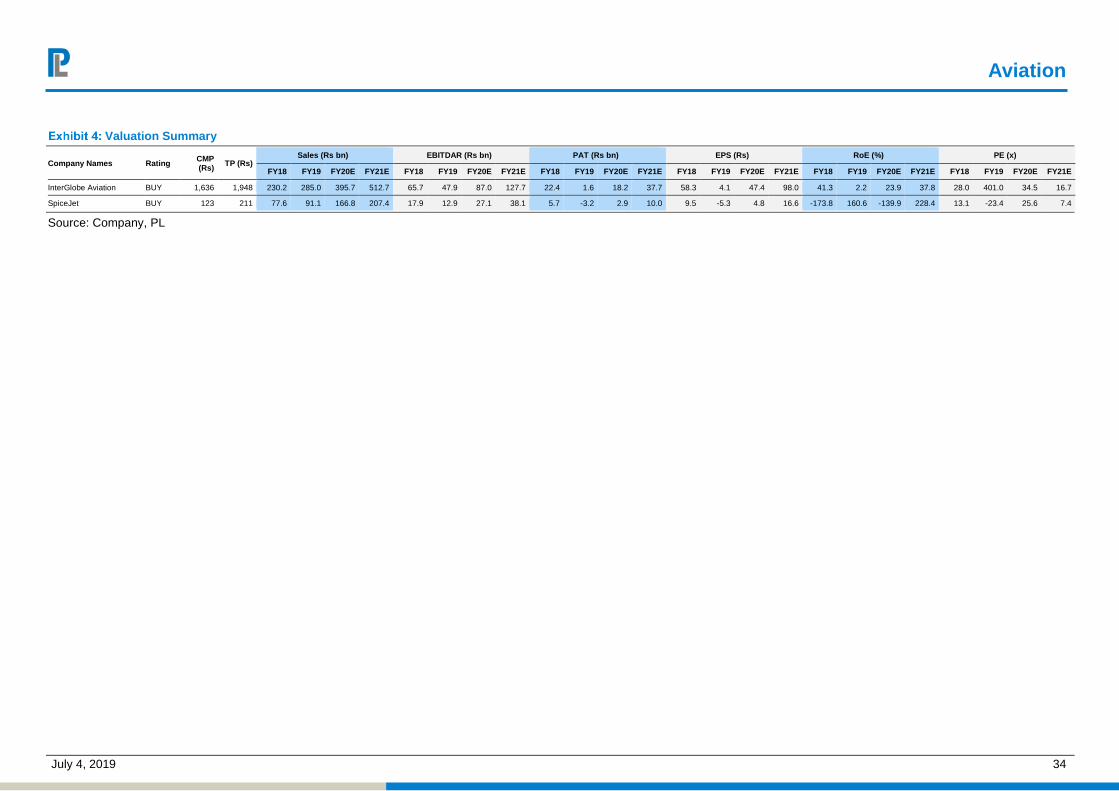
Aviation
July 4, 2019 34
Valuation Summary
Company Names Rating CMP (Rs) TP (Rs)
Sales (Rs bn) EBITDAR (Rs bn) PAT (Rs bn) EPS (Rs) RoE (%) PE (x)
FY18 FY19 FY20E FY21E FY18 FY19 FY20E FY21E FY18 FY19 FY20E FY21E FY18 FY19 FY20E FY21E FY18 FY19 FY20E FY21E FY18 FY19 FY20E FY21E
InterGlobe Aviation BUY 1,636 1,948 230.2 285.0 395.7 512.7 65.7 47.9 87.0 127.7 22.4 1.6 18.2 37.7 58.3 4.1 47.4 98.0 41.3 2.2 23.9 37.8 28.0 401.0 34.5 16.7
SpiceJet BUY 123 211 77.6 91.1 166.8 207.4 17.9 12.9 27.1 38.1 5.7 -3.2 2.9 10.0 9.5 -5.3 4.8 16.6 -173.8 160.6 -139.9 228.4 13.1 -23.4 25.6 7.4
Source: Company, PL

July 4, 2019 35
Banks Apr-Jun’19 Earnings Preview Banks will continue to see improvement in asset quality ratios from lower
impairment ratios and observe a further improvement in PCR, even though
credit cost trends for most large banks should be heading downwards.
Decline in benchmark yields would likely help treasury gains and M-T-M
benefit on investment provisions, while certain PSBs will benefit from gratuity
& wage revisions one-offs in base, aiding overall operating performance.
RBI’s action on benchmark should act with positive bias on NIMs as pass on
through MCLR has been minimal in last 6 months. Key trends to watch for in
the quarter (i) Retail loan growth especially unsecured segment as base effect
plays out (ii) any likely initiation in resolution plans post implementation of
revised FRSA in Jun’19 and (iii) retail deposits trends which have been tough
for private banks.
Key play continues to be corporate banks especially ICICI/SBI with favorable
risk-reward, while IIB/BOB will see merged numbers it will be crucial to see
its financial impact (also individual asset quality for IIB) & path ahead. Yes
Bank will continue to see challenging time on asset quality, provisions and
capital. In mid-cap banks we see lower concerns on Federal Bank.
Loan growth has moderated and skewed towards certain segments:
Overall systemic loan growth has moderated to 11-12% YoY although deposit
growth was at 9-10%YoY. Loan growth continues to be skewed towards retail
& services (NBFCs), while industry credit growth has improved for Power,
Telecom & Roads. Bank continue to target retail deposits for granular liabilities,
while CASA continues to remain challenging.
Asset quality for sector will continue to see improvement: Overall asset
quality & stress levels are coming off with lowering credit cost. Baring concerns
amongst few banks, GNPA/NNPA should decline as PCR improves. Although
recoveries/upgrades remain limited, banks will continue to do higher write-off.
Any early stage indicators of stress will be watched as resolution plans will be
initiated under revised framework.
Positive bias from lowered yields & rate cuts: Banks should benefit from
the low benchmark yields on treasury (Q1 banks also shift to HTM from AFS)
helping other income and possibly positive MTM. Benchmark rate cuts from
RBI has also seen limited pass on MCLRs, while some easing on deposits
costs should help in positive bias on NIMs of banks.
Earnings picture – Recovery in earnings for most bank post weak FY19:
We build in sharp recovery in most banks earnings from a lower base seen in
Q1FY19 and one off large recovery of Bhushan Steel. NII growth for Bank
would grow at 17% YoY but will continue to be led by private banks with growth
of 23.5% YoY with positive bias on NIMs. Other operating metrics for most will
show improvement aided by treasury, steady opex and credit costs
normalization- considering impairment is lowering. Among private banks, we
expect HDFCB/KMB to report steady numbers, while IIB/Yes asset quality is
watched. IIB/BOB will also see mergers. ICICI/Axis bank should witness much
better earnings than previous quarters.
July 4, 2019
Top Picks
HDFC Bank
ICICI Bank
IndusInd Bank
Federal Bank
Pritesh Bumb [email protected] | 91-22-66322232
Prabal Gandhi [email protected] | 91-22-66322258
Banks
July 4, 2019 36
Q1FY20 Banks Preview:
Private Banks – Loan growth for private banks (except ICICI/Axis) is expected
to be at 20-25% YoY. ICICI/Axis loan growth should grow at 13-14% YoY but
domestic is expected be better and led by retail segment. Private banks will
continue to focus on retail term deposits while CASA growth should be slower
at 10-12% YoY. Although intensity of raising at higher rates has come off with
NBFCs facing issues on incrementally raising funds. ICICI/Axis/SBI should
see strong improvement in operating performances, while HDFCB/KMB should
continue to be steady, but with robust trends. IIB/Yes asset quality and credit
cost will be closely watched, while IIB specifically will see benefit from merger
with BHAFIN this quarter.
Public Sector Banks – PSBs earnings will see sharp recovery, while it will be
aided from lower benchmark yields from treasury gains & MTM gains (also
banks could shift higher from HTM to AFS). Impairment ratios will come down
sharply, although PSBs will continue to resort to higher write-offs to help
improve asset quality trends. We expect NII growth of 11.4% YoY for PSBs &
PPOP growth of 16.9% YoY. SBI to see sharp earnings recovery, while we
build slippages of Rs80-82bn and credit cost of 200bps (annualized) which
should improve PCR to 70% but also help in higher write-off. BOB should see
merged financials of Vijaya & Dena, although recent disclosures on balance
sheet does not showcase in large shock. PNB/BOI/Union should continue to
be operationally weak with Union continuing to see higher deterioration in asset
quality with lower PCR than its peers PSBs.
Regional/Mid-sized banks – Region focused & mid-sized banks should see
steady trends in most operating metrics similar to previous quarters. Asset
quality pressure also seems to be under control, however different banks have
applied diverse approach on slippages & coverage in the past since their
collaterals have been different. Certain mid-sized banks will take higher
provision route which have lower PCR and hence earnings will be under
pressure. Federal will continue to showcase strong loan growth with better NII,
(although we watch SME/Agri/corporate slippages) we don’t expect any
adverse case in asset quality and continue to have positive operating leverage
helping earnings. For IDFCFBK key carefully tracked metrics have been
CASA/retail deposits accretion, loan book mix and branch/network additions.
There could likely be further credit cost on certain recent stress names from
erstwhile IDFC Bank.

Banks
July 4, 2019 37
Valuation Summary for PL Banks & Insurance Coverage
Coverage Universe Rating MCap (Rs B)
CMP (Rs)
PT (Rs)
Upside (%)
P/ABV (x) RoE (%)
FY19 FY20E FY21E FY19 FY20E FY21E
Axis Bank ACC 2,119 809 837 3.5 3.7 3.0 2.5 7.2 13.1 16.1
HDFC Bank BUY 6,778 2,484 2,700 8.7 4.7 4.1 3.6 16.5 16.0 17.0
ICICI Bank BUY 2,814 436 475 8.9 2.3 2.0 1.8 3.2 10.1 11.9
IndusInd Bank BUY 901 1,493 1,800 20.6 3.6 3.0 2.4 15.9 18.0 18.3
Yes Bank REDUCE 223 96 190 97.4 0.9 0.8 0.7 6.5 9.7 13.2
Kotak HOLD 2,859 1,498 1,385 (7.5) 5.7 5.0 4.3 12.1 12.7 13.4
Federal BUY 216 109 112 2.9 1.9 1.7 1.5 9.8 12.7 14.1
J&K Bank BUY 23 41 80 95.4 0.8 0.6 0.4 8.1 9.5 11.7
South Indian Bank BUY 24 13 18 38.5 0.8 0.7 0.6 4.9 5.4 7.3
IDFC First Bank BUY 215 45 55 22.2 1.3 1.3 1.2 (11.6) 2.7 4.5
Bank of Baroda BUY 498 129 161 24.4 0.9 0.7 0.5 (5.8) 0.9 19.8
Bank of India REDUCE 310 95 90 (4.8) 0.9 1.0 1.0 (15.7) (1.0) (1.9)
Punjab National Bank REDUCE 378 82 75 (8.6) 2.3 1.5 1.1 (26.6) 5.4 10.9
SBI BUY 3,279 367 427 16.2 1.8 1.5 1.3 0.4 10.1 12.5
Union Bank REDUCE 150 85 71 (16.3) 1.5 1.1 0.9 2.7 (24.0) (13.3)
HDFC Life BUY 987 489 464 (5.2) 5.4 4.4 3.6 22.0 23.4 23.4
ICICI Pru Life BUY 566 394 511 29.6 2.6 2.3 1.9 15.1 16.2 15.6
Max Financial BUY 112 414 629 52.0 1.3 1.1 0.9 19.9 21.0 21.6
SBI Life BUY 757 757 787 3.9 3.4 2.9 2.4 17.5 17.3 17.9
Source: Company, PL
Note – *Kotak & SBI valuation on S’lone bookNote – For Insurance companies, valuations are based on P/EV (x) and Op. RoEV (%)
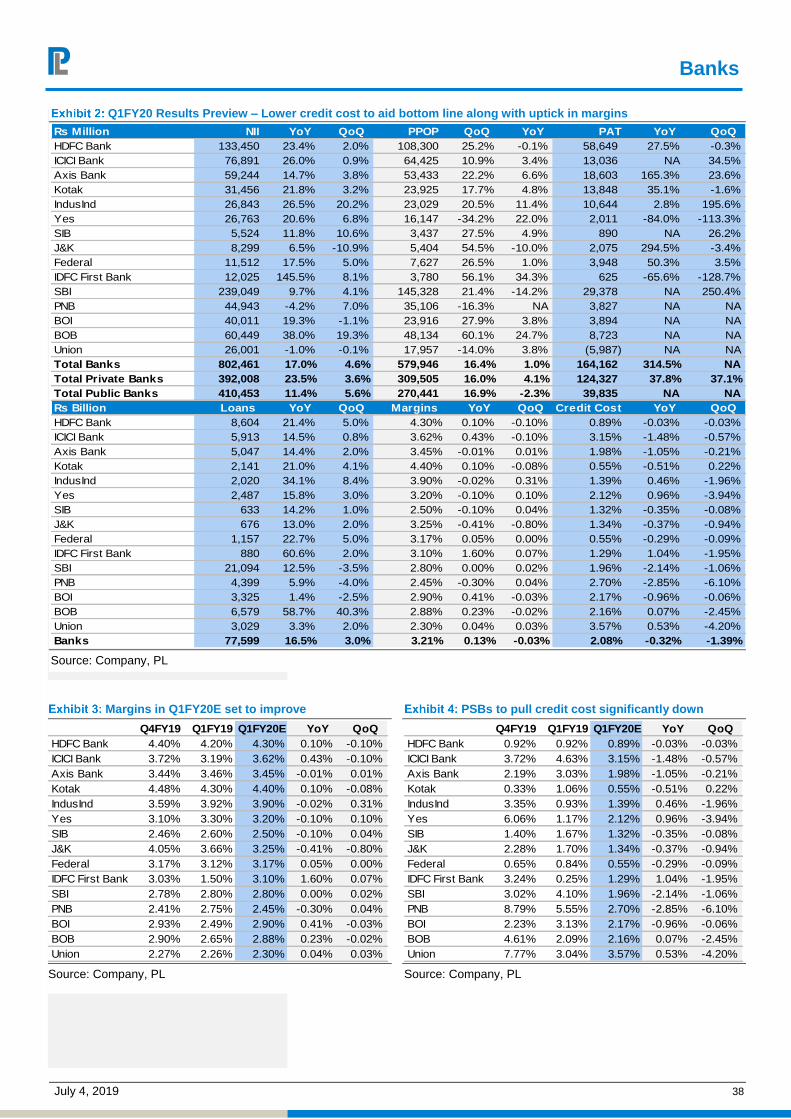
Banks
July 4, 2019 38
Q1FY20 Results Preview – Lower credit cost to aid bottom line along with uptick in margins Rs Million NII YoY QoQ PPOP QoQ YoY PAT YoY QoQHDFC Bank 133,450 23.4% 2.0% 108,300 25.2% -0.1% 58,649 27.5% -0.3%ICICI Bank 76,891 26.0% 0.9% 64,425 10.9% 3.4% 13,036 NA 34.5%Axis Bank 59,244 14.7% 3.8% 53,433 22.2% 6.6% 18,603 165.3% 23.6%Kotak 31,456 21.8% 3.2% 23,925 17.7% 4.8% 13,848 35.1% -1.6%IndusInd 26,843 26.5% 20.2% 23,029 20.5% 11.4% 10,644 2.8% 195.6%Yes 26,763 20.6% 6.8% 16,147 -34.2% 22.0% 2,011 -84.0% -113.3%SIB 5,524 11.8% 10.6% 3,437 27.5% 4.9% 890 NA 26.2%J&K 8,299 6.5% -10.9% 5,404 54.5% -10.0% 2,075 294.5% -3.4%Federal 11,512 17.5% 5.0% 7,627 26.5% 1.0% 3,948 50.3% 3.5%IDFC First Bank 12,025 145.5% 8.1% 3,780 56.1% 34.3% 625 -65.6% -128.7%SBI 239,049 9.7% 4.1% 145,328 21.4% -14.2% 29,378 NA 250.4%PNB 44,943 -4.2% 7.0% 35,106 -16.3% NA 3,827 NA NABOI 40,011 19.3% -1.1% 23,916 27.9% 3.8% 3,894 NA NABOB 60,449 38.0% 19.3% 48,134 60.1% 24.7% 8,723 NA NAUnion 26,001 -1.0% -0.1% 17,957 -14.0% 3.8% (5,987) NA NATotal Banks 802,461 17.0% 4.6% 579,946 16.4% 1.0% 164,162 314.5% NATotal Private Banks 392,008 23.5% 3.6% 309,505 16.0% 4.1% 124,327 37.8% 37.1%Total Public Banks 410,453 11.4% 5.6% 270,441 16.9% -2.3% 39,835 NA NARs Billion Loans YoY QoQ Margins YoY QoQ Credit Cost YoY QoQHDFC Bank 8,604 21.4% 5.0% 4.30% 0.10% -0.10% 0.89% -0.03% -0.03%ICICI Bank 5,913 14.5% 0.8% 3.62% 0.43% -0.10% 3.15% -1.48% -0.57%Axis Bank 5,047 14.4% 2.0% 3.45% -0.01% 0.01% 1.98% -1.05% -0.21%Kotak 2,141 21.0% 4.1% 4.40% 0.10% -0.08% 0.55% -0.51% 0.22%IndusInd 2,020 34.1% 8.4% 3.90% -0.02% 0.31% 1.39% 0.46% -1.96%Yes 2,487 15.8% 3.0% 3.20% -0.10% 0.10% 2.12% 0.96% -3.94%SIB 633 14.2% 1.0% 2.50% -0.10% 0.04% 1.32% -0.35% -0.08%J&K 676 13.0% 2.0% 3.25% -0.41% -0.80% 1.34% -0.37% -0.94%Federal 1,157 22.7% 5.0% 3.17% 0.05% 0.00% 0.55% -0.29% -0.09%IDFC First Bank 880 60.6% 2.0% 3.10% 1.60% 0.07% 1.29% 1.04% -1.95%SBI 21,094 12.5% -3.5% 2.80% 0.00% 0.02% 1.96% -2.14% -1.06%PNB 4,399 5.9% -4.0% 2.45% -0.30% 0.04% 2.70% -2.85% -6.10%BOI 3,325 1.4% -2.5% 2.90% 0.41% -0.03% 2.17% -0.96% -0.06%BOB 6,579 58.7% 40.3% 2.88% 0.23% -0.02% 2.16% 0.07% -2.45%Union 3,029 3.3% 2.0% 2.30% 0.04% 0.03% 3.57% 0.53% -4.20%Banks 77,599 16.5% 3.0% 3.21% 0.13% -0.03% 2.08% -0.32% -1.39% Source: Company, PL
Margins in Q1FY20E set to improve
Q4FY19 Q1FY19 Q1FY20E YoY QoQHDFC Bank 4.40% 4.20% 4.30% 0.10% -0.10%ICICI Bank 3.72% 3.19% 3.62% 0.43% -0.10%Axis Bank 3.44% 3.46% 3.45% -0.01% 0.01%Kotak 4.48% 4.30% 4.40% 0.10% -0.08%IndusInd 3.59% 3.92% 3.90% -0.02% 0.31%Yes 3.10% 3.30% 3.20% -0.10% 0.10%SIB 2.46% 2.60% 2.50% -0.10% 0.04%J&K 4.05% 3.66% 3.25% -0.41% -0.80%Federal 3.17% 3.12% 3.17% 0.05% 0.00%IDFC First Bank 3.03% 1.50% 3.10% 1.60% 0.07%SBI 2.78% 2.80% 2.80% 0.00% 0.02%PNB 2.41% 2.75% 2.45% -0.30% 0.04%BOI 2.93% 2.49% 2.90% 0.41% -0.03%BOB 2.90% 2.65% 2.88% 0.23% -0.02%Union 2.27% 2.26% 2.30% 0.04% 0.03% Source: Company, PL
PSBs to pull credit cost significantly down
Q4FY19 Q1FY19 Q1FY20E YoY QoQHDFC Bank 0.92% 0.92% 0.89% -0.03% -0.03%ICICI Bank 3.72% 4.63% 3.15% -1.48% -0.57%Axis Bank 2.19% 3.03% 1.98% -1.05% -0.21%Kotak 0.33% 1.06% 0.55% -0.51% 0.22%IndusInd 3.35% 0.93% 1.39% 0.46% -1.96%Yes 6.06% 1.17% 2.12% 0.96% -3.94%SIB 1.40% 1.67% 1.32% -0.35% -0.08%J&K 2.28% 1.70% 1.34% -0.37% -0.94%Federal 0.65% 0.84% 0.55% -0.29% -0.09%IDFC First Bank 3.24% 0.25% 1.29% 1.04% -1.95%SBI 3.02% 4.10% 1.96% -2.14% -1.06%PNB 8.79% 5.55% 2.70% -2.85% -6.10%BOI 2.23% 3.13% 2.17% -0.96% -0.06%BOB 4.61% 2.09% 2.16% 0.07% -2.45%Union 7.77% 3.04% 3.57% 0.53% -4.20% Source: Company, PL

Banks
July 4, 2019 39
Benign inflation & slower growth has compelled RBI to lower rates
4.55.05.56.06.57.07.58.08.59.09.5
Jun-
06D
ec-0
6Ju
n-07
Dec
-07
Jun-
08D
ec-0
8Ju
n-09
Dec
-09
Jun-
10D
ec-1
0Ju
n-11
Dec
-11
Jun-
12D
ec-1
2Ju
n-13
Dec
-13
Jun-
14D
ec-1
4Ju
n-15
Dec
-15
Jun-
16D
ec-1
6Ju
n-17
Dec
-17
Jun-
18D
ec-1
8Ju
n-19
(%)
Movement in Repo Rate
Source: Bloomberg, PL
G-sec aided by accommodative stance by RBI
8.03
6.88
6.0
6.5
7.0
7.5
8.0
8.5
9.0
9.5
Jun-
13
Oct
-13
Feb
-14
Jun-
14
Oct
-14
Feb
-15
Jun-
15
Oct
-15
Feb
-16
Jun-
16
Oct
-16
Feb
-17
Jun-
17
Oct
-17
Feb
-18
Jun-
18
Oct
-18
Feb
-19
Jun-
19
10Yr G-Sec Yield
Source: Bloomberg, PL
Sharp decline in yields across tenures
5.8
6.0
6.2
6.4
6.6
6.8
7.0
7.2
7.4
7.6
3Month 1Year 5Year 10Year
Dec-18 Mar-19 Jun-19
Source: Company, PL
Liquidity has been largely deficit..
(2,500)
(2,000)
(1,500)
(1,000)
(500)
-
500
1,000
Jun-
17
Aug
-17
Oct
-17
Dec
-17
Feb
-18
Apr
-18
Jun-
18
Aug
-18
Oct
-18
Dec
-18
Feb
-19
Apr
-19
Jun-
19
Net Liquidity (Rs Bn)
Source: Bloomberg, PL
…but RBI infused liquidity using occasional OMOs
-
3
6
9
12
Jun-
17
Sep
-17
Dec
-17
Mar
-18
Jun-
18
Sep
-18
Dec
-18
Mar
-19
Jun-
19
Rs
Tri
llio
n
Repo R-Repo Var Repo Var R-RepoMSF SLF Net OMOs MSS
Source: Bloomberg, PL
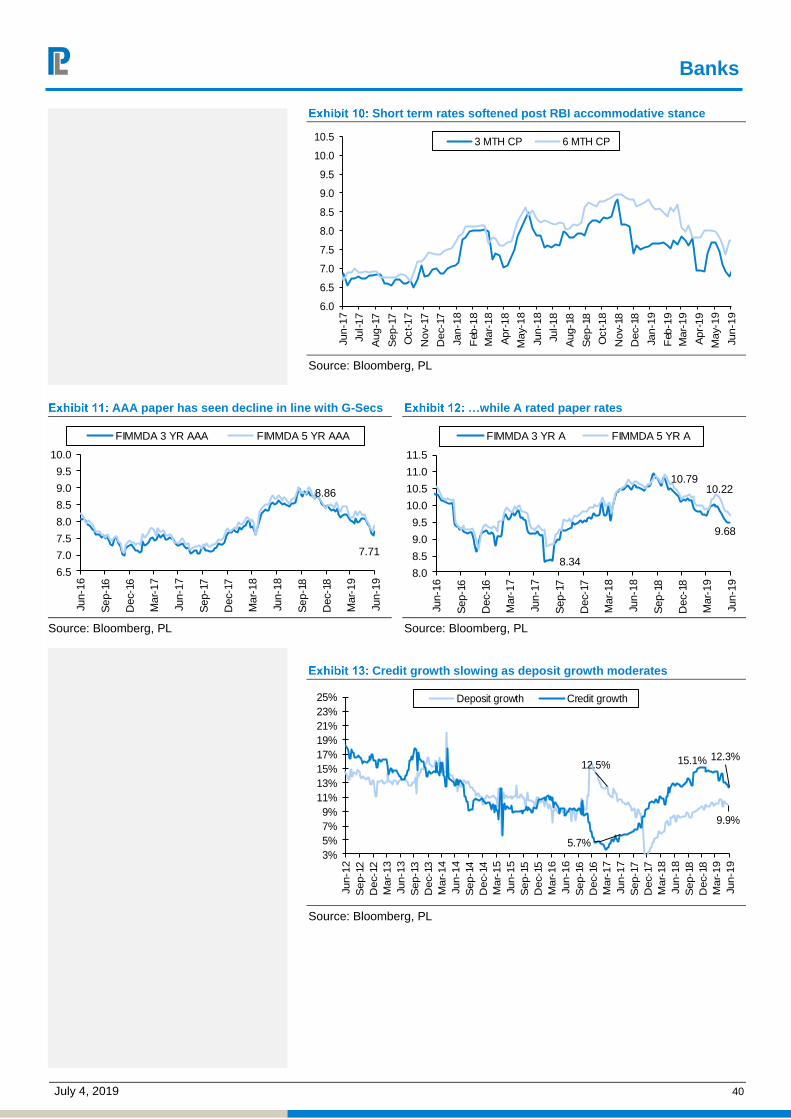
Banks
July 4, 2019 40
Short term rates softened post RBI accommodative stance
6.0
6.5
7.0
7.5
8.0
8.5
9.0
9.5
10.0
10.5
Jun-
17
Jul-1
7
Aug
-17
Sep
-17
Oct
-17
Nov
-17
Dec
-17
Jan-
18
Feb
-18
Mar
-18
Apr
-18
May
-18
Jun-
18
Jul-1
8
Aug
-18
Sep
-18
Oct
-18
Nov
-18
Dec
-18
Jan-
19
Feb
-19
Mar
-19
Apr
-19
May
-19
Jun-
19
3 MTH CP 6 MTH CP
Source: Bloomberg, PL
AAA paper has seen decline in line with G-Secs
8.86
7.71
6.5
7.0
7.5
8.0
8.5
9.0
9.5
10.0
Jun-
16
Sep
-16
Dec
-16
Mar
-17
Jun-
17
Sep
-17
Dec
-17
Mar
-18
Jun-
18
Sep
-18
Dec
-18
Mar
-19
Jun-
19
FIMMDA 3 YR AAA FIMMDA 5 YR AAA
Source: Bloomberg, PL
…while A rated paper rates
8.34
10.7910.22
9.68
8.0
8.5
9.0
9.5
10.0
10.5
11.0
11.5
Jun-
16
Sep
-16
Dec
-16
Mar
-17
Jun-
17
Sep
-17
Dec
-17
Mar
-18
Jun-
18
Sep
-18
Dec
-18
Mar
-19
Jun-
19
FIMMDA 3 YR A FIMMDA 5 YR A
Source: Bloomberg, PL
Credit growth slowing as deposit growth moderates
12.5%
9.9%
5.7%
15.1% 12.3%
3%5%7%9%
11%13%15%17%19%21%23%25%
Jun-
12S
ep-1
2D
ec-1
2M
ar-1
3Ju
n-13
Sep
-13
Dec
-13
Mar
-14
Jun-
14S
ep-1
4D
ec-1
4M
ar-1
5Ju
n-15
Sep
-15
Dec
-15
Mar
-16
Jun-
16S
ep-1
6D
ec-1
6M
ar-1
7Ju
n-17
Sep
-17
Dec
-17
Mar
-18
Jun-
18S
ep-1
8D
ec-1
8M
ar-1
9Ju
n-19
Deposit growth Credit growth
Source: Bloomberg, PL

Banks
July 4, 2019 41
Pvt banks hold up their deposit rates, PSBs are seen more inclined towards rate cut
-0.20
-0.15
-0.10
-0.05
0.00
0.05
0.10
Feb
-16
Apr
-16
Jun-
16A
ug-1
6O
ct-1
6D
ec-1
6F
eb-1
7A
pr-1
7Ju
n-17
Aug
-17
Oct
-17
Dec
-17
Feb
-18
Apr
-18
Jun-
18A
ug-1
8O
ct-1
8D
ec-1
8F
eb-1
9A
pr-1
9
MoM chg in Rupee Term Deposits Rate
SCBs PSBs Pvt Banks
Source: RBI, PL
NBFC crisis has lowered arbitrage between bank market rates and bank rates
-0.2 0.1 0.4 0.7 1.0 1.3 1.6 1.9 2.2 2.5
May
-17
Jul-1
7
Sep
-17
Nov
-17
Jan-
18
Mar
-18
May
-18
Jul-1
8
Sep
-18
Nov
-18
Jan-
19
Mar
-19
May
-19
Diff bet SBI 1Yr MCLR & FIMMDA 1Yr AAA
Diff bet SCB Median - MCLR & FIMMDA 1Yr AAA
Source: RBI, PL
MCLRs has reduced across banks led by Private banks
Banks MCLR 1YR MCLR 1YR
% Change
Dec-18 Mar-19 Jun-19 3Months 6Months
Axis Bank 8.70% 8.75% 8.70% -0.05% 0.00%
HDFC Bank 8.85% 8.90% 8.70% -0.20% -0.15%
ICICI Bank 8.80% 8.80% 8.75% -0.05% -0.05%
KMB 9.00% 9.00% 8.90% -0.10% -0.10%
IndusInd Bank 9.80% 9.90% 9.75% -0.15% -0.05%
Yes Bank 9.85% 9.70% 9.70% 0.00% -0.15%
SBI 8.55% 8.55% 8.45% -0.10% -0.10%
Bank of Baroda 8.65% 8.65% 8.70% 0.05% 0.05%
Bank of India 8.70% 8.65% 8.65% 0.00% -0.05%
Punjab National Bank 8.50% 8.45% 8.45% 0.00% -0.05%
Canara Bank 8.70% 8.65% 8.70% 0.05% 0.00%
Union Bank 8.70% 8.60% 8.60% 0.00% -0.10%
Federal 9.20% 9.20% 9.15% -0.05% -0.05%
South Indian Bank 9.45% 9.45% 9.50% 0.05% 0.05%
J&K Bank 9.00% 9.00% 8.85% -0.15% -0.15%
Source: Company, PL
MCLRs reduced by most banks across tenors in last quarter
-0.15%
-0.10%
-0.05%
0.00%
0.05%
0.10%
Axis HDFCB ICICIBC IIB KMB Yes SBI BOB
Quarterly Change in MCLRs
ON 1M 3M 6M 1Y
Source: Company, PL
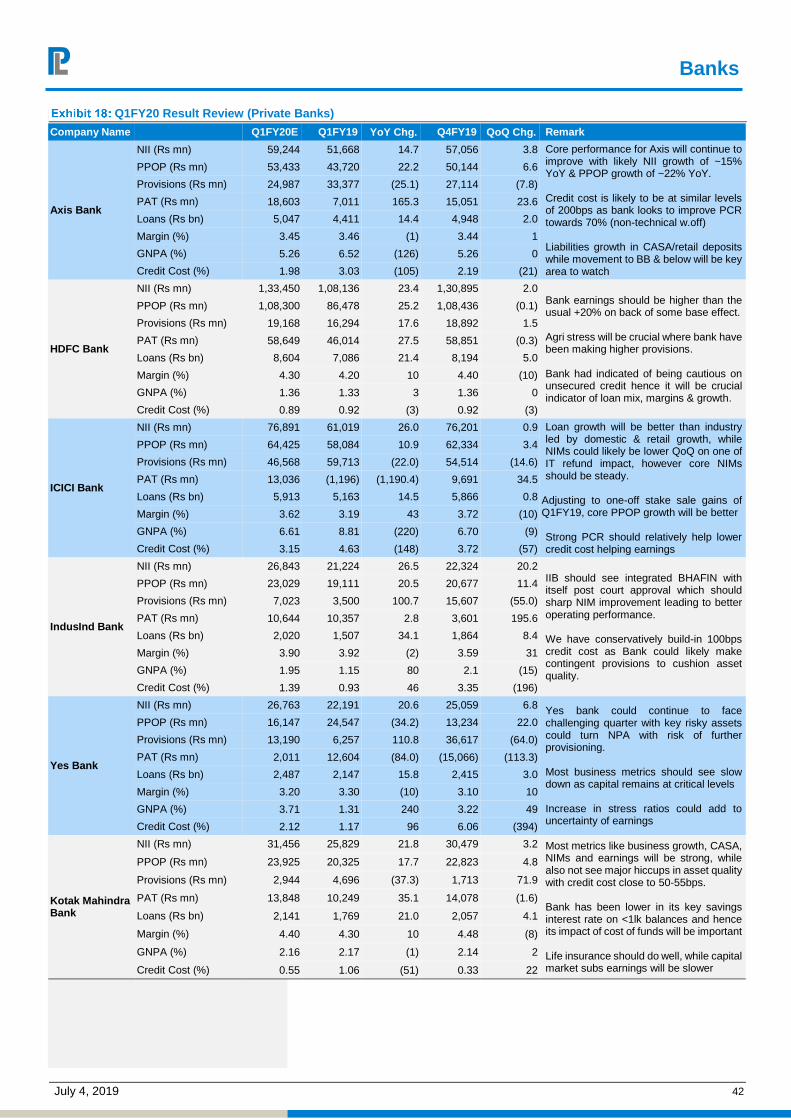
Banks
July 4, 2019 42
Q1FY20 Result Review (Private Banks)
Company Name Q1FY20E Q1FY19 YoY Chg. Q4FY19 QoQ Chg. Remark
Axis Bank
NII (Rs mn) 59,244 51,668 14.7 57,056 3.8 Core performance for Axis will continue to improve with likely NII growth of ~15% YoY & PPOP growth of ~22% YoY. Credit cost is likely to be at similar levels of 200bps as bank looks to improve PCR towards 70% (non-technical w.off) Liabilities growth in CASA/retail deposits while movement to BB & below will be key area to watch
PPOP (Rs mn) 53,433 43,720 22.2 50,144 6.6
Provisions (Rs mn) 24,987 33,377 (25.1) 27,114 (7.8)
PAT (Rs mn) 18,603 7,011 165.3 15,051 23.6
Loans (Rs bn) 5,047 4,411 14.4 4,948 2.0
Margin (%) 3.45 3.46 (1) 3.44 1
GNPA (%) 5.26 6.52 (126) 5.26 0
Credit Cost (%) 1.98 3.03 (105) 2.19 (21)
HDFC Bank
NII (Rs mn) 1,33,450 1,08,136 23.4 1,30,895 2.0 Bank earnings should be higher than the usual +20% on back of some base effect. Agri stress will be crucial where bank have been making higher provisions.
Bank had indicated of being cautious on unsecured credit hence it will be crucial indicator of loan mix, margins & growth.
PPOP (Rs mn) 1,08,300 86,478 25.2 1,08,436 (0.1)
Provisions (Rs mn) 19,168 16,294 17.6 18,892 1.5
PAT (Rs mn) 58,649 46,014 27.5 58,851 (0.3)
Loans (Rs bn) 8,604 7,086 21.4 8,194 5.0
Margin (%) 4.30 4.20 10 4.40 (10)
GNPA (%) 1.36 1.33 3 1.36 0
Credit Cost (%) 0.89 0.92 (3) 0.92 (3)
ICICI Bank
NII (Rs mn) 76,891 61,019 26.0 76,201 0.9 Loan growth will be better than industry led by domestic & retail growth, while NIMs could likely be lower QoQ on one of IT refund impact, however core NIMs should be steady.
Adjusting to one-off stake sale gains of Q1FY19, core PPOP growth will be better Strong PCR should relatively help lower credit cost helping earnings
PPOP (Rs mn) 64,425 58,084 10.9 62,334 3.4
Provisions (Rs mn) 46,568 59,713 (22.0) 54,514 (14.6)
PAT (Rs mn) 13,036 (1,196) (1,190.4) 9,691 34.5
Loans (Rs bn) 5,913 5,163 14.5 5,866 0.8
Margin (%) 3.62 3.19 43 3.72 (10)
GNPA (%) 6.61 8.81 (220) 6.70 (9)
Credit Cost (%) 3.15 4.63 (148) 3.72 (57)
IndusInd Bank
NII (Rs mn) 26,843 21,224 26.5 22,324 20.2 IIB should see integrated BHAFIN with itself post court approval which should sharp NIM improvement leading to better operating performance. We have conservatively build-in 100bps credit cost as Bank could likely make contingent provisions to cushion asset quality.
PPOP (Rs mn) 23,029 19,111 20.5 20,677 11.4
Provisions (Rs mn) 7,023 3,500 100.7 15,607 (55.0)
PAT (Rs mn) 10,644 10,357 2.8 3,601 195.6
Loans (Rs bn) 2,020 1,507 34.1 1,864 8.4
Margin (%) 3.90 3.92 (2) 3.59 31
GNPA (%) 1.95 1.15 80 2.1 (15)
Credit Cost (%) 1.39 0.93 46 3.35 (196)
Yes Bank
NII (Rs mn) 26,763 22,191 20.6 25,059 6.8 Yes bank could continue to face challenging quarter with key risky assets could turn NPA with risk of further provisioning. Most business metrics should see slow down as capital remains at critical levels Increase in stress ratios could add to uncertainty of earnings
PPOP (Rs mn) 16,147 24,547 (34.2) 13,234 22.0
Provisions (Rs mn) 13,190 6,257 110.8 36,617 (64.0)
PAT (Rs mn) 2,011 12,604 (84.0) (15,066) (113.3)
Loans (Rs bn) 2,487 2,147 15.8 2,415 3.0
Margin (%) 3.20 3.30 (10) 3.10 10
GNPA (%) 3.71 1.31 240 3.22 49
Credit Cost (%) 2.12 1.17 96 6.06 (394)
Kotak Mahindra Bank
NII (Rs mn) 31,456 25,829 21.8 30,479 3.2 Most metrics like business growth, CASA, NIMs and earnings will be strong, while also not see major hiccups in asset quality with credit cost close to 50-55bps. Bank has been lower in its key savings interest rate on <1lk balances and hence its impact of cost of funds will be important Life insurance should do well, while capital market subs earnings will be slower
PPOP (Rs mn) 23,925 20,325 17.7 22,823 4.8
Provisions (Rs mn) 2,944 4,696 (37.3) 1,713 71.9
PAT (Rs mn) 13,848 10,249 35.1 14,078 (1.6)
Loans (Rs bn) 2,141 1,769 21.0 2,057 4.1
Margin (%) 4.40 4.30 10 4.48 (8)
GNPA (%) 2.16 2.17 (1) 2.14 2
Credit Cost (%) 0.55 1.06 (51) 0.33 22

Banks
July 4, 2019 43
Company Name Q1FY20E Q1FY19 YoY Chg. Q4FY19 QoQ Chg. Remark
IDFC First Bank
NII (Rs mn) 12,025 4,898 145.5 11,129 8.1 IDFC First should continue do strong addition on liabilities & retail deposits, while continue to grow retail +20%. Earnings will be slower on higher provisions in the recent stress name but enhance the PCR Branch additions, opex cost and NIMs will be key areas to watch.
PPOP (Rs mn) 3,780 2,421 56.1 2,815 34.3
Provisions (Rs mn) 2,833 340 733.4 6,982 (59.4)
PAT (Rs mn) 625 1,815 (65.6) (2,180) (128.7)
Loans (Rs bn) 880 548 60.6 863 2.0
Margin (%) 3.10 - 310 3.03 7
GNPA (%) 2.47 3.24 (77) 2.43 4
Credit Cost (%) 1.29 0.25 104 3.24 (195)
Federal
NII (Rs mn) 11,512 9,801 17.5 10,965 5.0
Federal should see good tailwinds from operating levers with controlled opex, improving fees and NII growth of 17-18%.
Asset quality will be keenly watched as last two quarters have been better off, while bank is relatively decent on PCR credit cost expected at 50-60bps
PPOP (Rs mn) 7,627 6,029 26.5 7,548 1.0
Provisions (Rs mn) 1,600 1,992 (19.7) 1,778 (10.0)
PAT (Rs mn) 3,948 2,627 50.3 3,815 3.5
Loans (Rs bn) 1,157 943 22.7 1,102 5.0
Margin (%) 3.17 3.12 5 3.17 -
GNPA (%) 2.99 3.00 (1) 2.92 7
Credit Cost (%) 0.55 0.84 (29) 0.65 (9)
J&K Bank
NII (Rs mn) 8,299 7,792 6.5 9,313 (10.9) Loan growth expected to be at 13% YoY but J&K growth book will be strong. Other income & earnings could be benefitted from Govt yields Change in guard at bank will be closely watched for any asset quality issues especially in the restructured book Capital remains a key area to watch for
PPOP (Rs mn) 5,404 3,498 54.5 6,006 (10.0)
Provisions (Rs mn) 2,259 2,550 (11.4) 3,780 (40.2)
PAT (Rs mn) 2,075 526 294.5 2,148 (3.4)
Loans (Rs bn) 676 598 13.0 663 2.0
Margin (%) 3.25 3.66 (41) 4.05 (80)
GNPA (%) 8.94 9.83 (89) 8.97 (3)
Credit Cost (%) 1.34 1.70 (37) 2.28 (94)
South Indian Bank
NII (Rs mn) 5,524 4,943 11.8 4,994 10.6 We expect loan growth to be healthy at 14% YoY but NII growth will be slow as NIMs have been suboptimal. PPOP will be benefitted from some treasury gaians and lower opex. Earnings should continue to remain under pressure on higher provisions as bank enhances its PCR upwards and maintains a slippages rate.
PPOP (Rs mn) 3,437 2,696 27.5 3,276 4.9
Provisions (Rs mn) 2,089 2,315 (9.8) 2,192 (4.7)
PAT (Rs mn) 890 230 286.1 705 26.2
Loans (Rs bn) 633 554 14.2 627 1.0
Margin (%) 2.50 2.60 (10) 2.46 4
GNPA (%) 4.95 4.54 41 4.92 3
Credit Cost (%) 1.32 1.67 (35) 1.40 (8)
Source: Company, PL
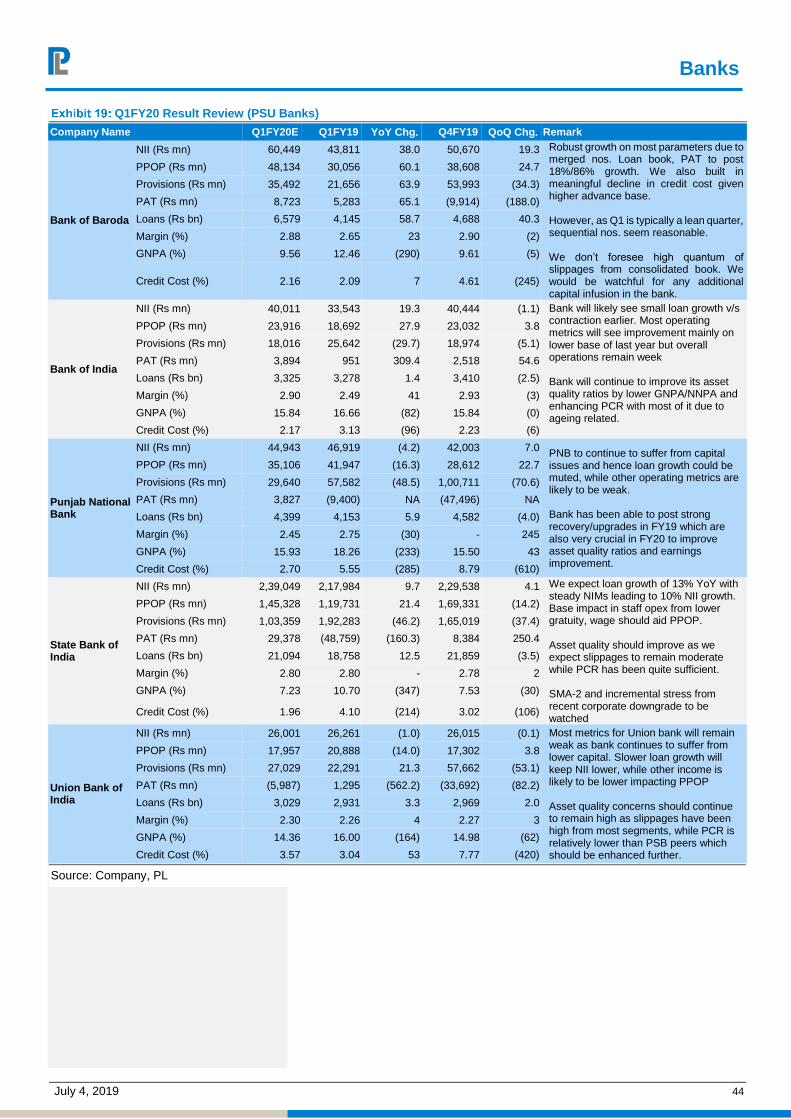
Banks
July 4, 2019 44
Q1FY20 Result Review (PSU Banks)
Company Name Q1FY20E Q1FY19 YoY Chg. Q4FY19 QoQ Chg. Remark
Bank of Baroda
NII (Rs mn) 60,449 43,811 38.0 50,670 19.3 Robust growth on most parameters due to merged nos. Loan book, PAT to post 18%/86% growth. We also built in meaningful decline in credit cost given higher advance base. However, as Q1 is typically a lean quarter, sequential nos. seem reasonable. We don’t foresee high quantum of slippages from consolidated book. We would be watchful for any additional capital infusion in the bank.
PPOP (Rs mn) 48,134 30,056 60.1 38,608 24.7
Provisions (Rs mn) 35,492 21,656 63.9 53,993 (34.3)
PAT (Rs mn) 8,723 5,283 65.1 (9,914) (188.0)
Loans (Rs bn) 6,579 4,145 58.7 4,688 40.3
Margin (%) 2.88 2.65 23 2.90 (2)
GNPA (%) 9.56 12.46 (290) 9.61 (5)
Credit Cost (%) 2.16 2.09 7 4.61 (245)
Bank of India
NII (Rs mn) 40,011 33,543 19.3 40,444 (1.1) Bank will likely see small loan growth v/s contraction earlier. Most operating metrics will see improvement mainly on lower base of last year but overall operations remain week Bank will continue to improve its asset quality ratios by lower GNPA/NNPA and enhancing PCR with most of it due to ageing related.
PPOP (Rs mn) 23,916 18,692 27.9 23,032 3.8
Provisions (Rs mn) 18,016 25,642 (29.7) 18,974 (5.1)
PAT (Rs mn) 3,894 951 309.4 2,518 54.6
Loans (Rs bn) 3,325 3,278 1.4 3,410 (2.5)
Margin (%) 2.90 2.49 41 2.93 (3)
GNPA (%) 15.84 16.66 (82) 15.84 (0)
Credit Cost (%) 2.17 3.13 (96) 2.23 (6)
Punjab National Bank
NII (Rs mn) 44,943 46,919 (4.2) 42,003 7.0 PNB to continue to suffer from capital issues and hence loan growth could be muted, while other operating metrics are likely to be weak. Bank has been able to post strong recovery/upgrades in FY19 which are also very crucial in FY20 to improve asset quality ratios and earnings improvement.
PPOP (Rs mn) 35,106 41,947 (16.3) 28,612 22.7
Provisions (Rs mn) 29,640 57,582 (48.5) 1,00,711 (70.6)
PAT (Rs mn) 3,827 (9,400) NA (47,496) NA
Loans (Rs bn) 4,399 4,153 5.9 4,582 (4.0)
Margin (%) 2.45 2.75 (30) - 245
GNPA (%) 15.93 18.26 (233) 15.50 43
Credit Cost (%) 2.70 5.55 (285) 8.79 (610)
State Bank of India
NII (Rs mn) 2,39,049 2,17,984 9.7 2,29,538 4.1 We expect loan growth of 13% YoY with steady NIMs leading to 10% NII growth. Base impact in staff opex from lower gratuity, wage should aid PPOP. Asset quality should improve as we expect slippages to remain moderate while PCR has been quite sufficient. SMA-2 and incremental stress from recent corporate downgrade to be watched
PPOP (Rs mn) 1,45,328 1,19,731 21.4 1,69,331 (14.2)
Provisions (Rs mn) 1,03,359 1,92,283 (46.2) 1,65,019 (37.4)
PAT (Rs mn) 29,378 (48,759) (160.3) 8,384 250.4
Loans (Rs bn) 21,094 18,758 12.5 21,859 (3.5)
Margin (%) 2.80 2.80 - 2.78 2
GNPA (%) 7.23 10.70 (347) 7.53 (30)
Credit Cost (%) 1.96 4.10 (214) 3.02 (106)
Union Bank of India
NII (Rs mn) 26,001 26,261 (1.0) 26,015 (0.1) Most metrics for Union bank will remain weak as bank continues to suffer from lower capital. Slower loan growth will keep NII lower, while other income is likely to be lower impacting PPOP Asset quality concerns should continue to remain high as slippages have been high from most segments, while PCR is relatively lower than PSB peers which should be enhanced further.
PPOP (Rs mn) 17,957 20,888 (14.0) 17,302 3.8
Provisions (Rs mn) 27,029 22,291 21.3 57,662 (53.1)
PAT (Rs mn) (5,987) 1,295 (562.2) (33,692) (82.2)
Loans (Rs bn) 3,029 2,931 3.3 2,969 2.0
Margin (%) 2.30 2.26 4 2.27 3
GNPA (%) 14.36 16.00 (164) 14.98 (62)
Credit Cost (%) 3.57 3.04 53 7.77 (420)
Source: Company, PL
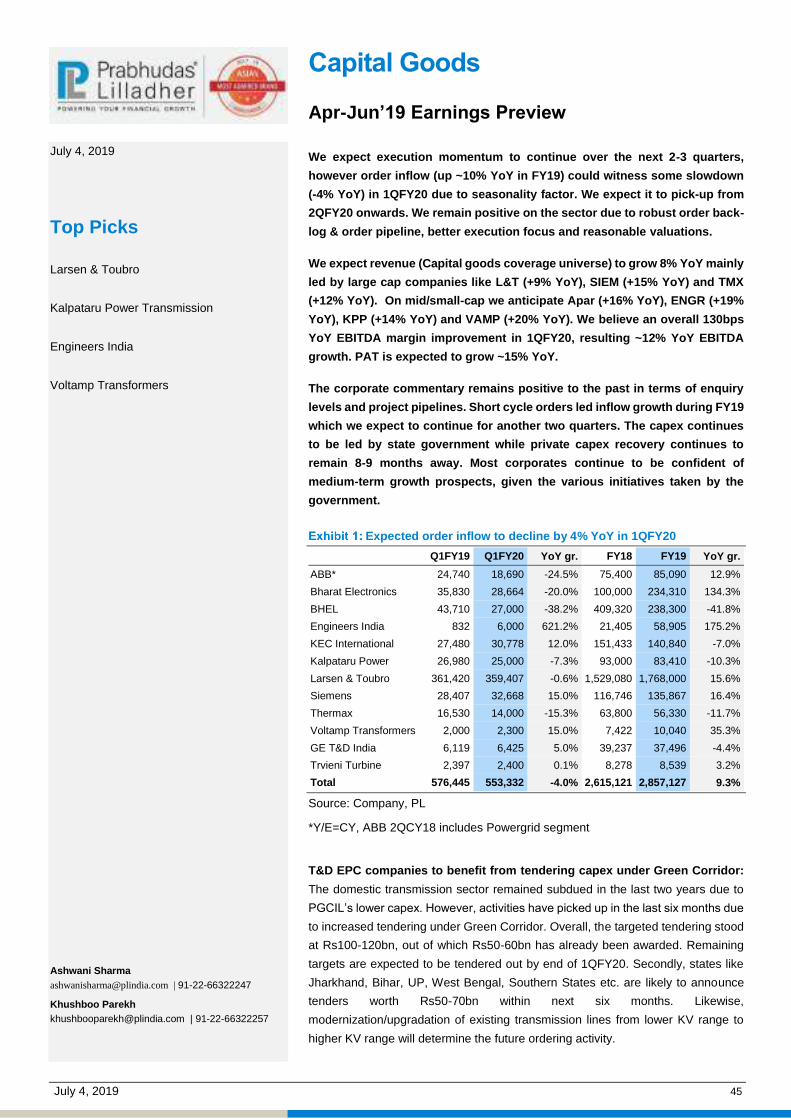
July 4, 2019 45
Capital Goods Apr-Jun’19 Earnings Preview We expect execution momentum to continue over the next 2-3 quarters,
however order inflow (up ~10% YoY in FY19) could witness some slowdown
(-4% YoY) in 1QFY20 due to seasonality factor. We expect it to pick-up from
2QFY20 onwards. We remain positive on the sector due to robust order back-
log & order pipeline, better execution focus and reasonable valuations.
We expect revenue (Capital goods coverage universe) to grow 8% YoY mainly
led by large cap companies like L&T (+9% YoY), SIEM (+15% YoY) and TMX
(+12% YoY). On mid/small-cap we anticipate Apar (+16% YoY), ENGR (+19%
YoY), KPP (+14% YoY) and VAMP (+20% YoY). We believe an overall 130bps
YoY EBITDA margin improvement in 1QFY20, resulting ~12% YoY EBITDA
growth. PAT is expected to grow ~15% YoY.
The corporate commentary remains positive to the past in terms of enquiry
levels and project pipelines. Short cycle orders led inflow growth during FY19
which we expect to continue for another two quarters. The capex continues
to be led by state government while private capex recovery continues to
remain 8-9 months away. Most corporates continue to be confident of
medium-term growth prospects, given the various initiatives taken by the
government.
Expected order inflow to decline by 4% YoY in 1QFY20
Q1FY19 Q1FY20 YoY gr. FY18 FY19 YoY gr.
ABB* 24,740 18,690 -24.5% 75,400 85,090 12.9%
Bharat Electronics 35,830 28,664 -20.0% 100,000 234,310 134.3%
BHEL 43,710 27,000 -38.2% 409,320 238,300 -41.8%
Engineers India 832 6,000 621.2% 21,405 58,905 175.2%
KEC International 27,480 30,778 12.0% 151,433 140,840 -7.0%
Kalpataru Power 26,980 25,000 -7.3% 93,000 83,410 -10.3%
Larsen & Toubro 361,420 359,407 -0.6% 1,529,080 1,768,000 15.6%
Siemens 28,407 32,668 15.0% 116,746 135,867 16.4%
Thermax 16,530 14,000 -15.3% 63,800 56,330 -11.7%
Voltamp Transformers 2,000 2,300 15.0% 7,422 10,040 35.3%
GE T&D India 6,119 6,425 5.0% 39,237 37,496 -4.4%
Trvieni Turbine 2,397 2,400 0.1% 8,278 8,539 3.2%
Total 576,445 553,332 -4.0% 2,615,121 2,857,127 9.3%
Source: Company, PL
*Y/E=CY, ABB 2QCY18 includes Powergrid segment
T&D EPC companies to benefit from tendering capex under Green Corridor:
The domestic transmission sector remained subdued in the last two years due to
PGCIL’s lower capex. However, activities have picked up in the last six months due
to increased tendering under Green Corridor. Overall, the targeted tendering stood
at Rs100-120bn, out of which Rs50-60bn has already been awarded. Remaining
targets are expected to be tendered out by end of 1QFY20. Secondly, states like
Jharkhand, Bihar, UP, West Bengal, Southern States etc. are likely to announce
tenders worth Rs50-70bn within next six months. Likewise,
modernization/upgradation of existing transmission lines from lower KV range to
higher KV range will determine the future ordering activity.
July 4, 2019
Top Picks
Larsen & Toubro
Kalpataru Power Transmission
Engineers India
Voltamp Transformers
Ashwani Sharma [email protected] | 91-22-66322247
Khushboo Parekh [email protected] | 91-22-66322257

Capital Goods
July 4, 2019 46
Capacity utilization raised to 75.9% in Dec 2018 from 74.8% in Sep 2018. This was
the highest utilization rate reported by RBI’s OBICUS in four years. As per CMIE
data, new project announcement grew 23% YoY at Rs10.1 trn, while June 2019
witnessed decline of 87% due to elections. We expect pick-up in new projects from
2QFY20 onwards post general elections.
Quarterly Capex Aggregates
Rs trillion Jun-17 Sep-17 Dec-17 Mar-18 Jun-18 Sep-18 Dec-18 Mar-19 Jun-19
New projects 1.7 1.3 4.3 3.4 2.0 2.5 2.2 0.4 1.7
Completed projects 1.1 1.2 1.7 1.3 1.0 1.3 2.3 0.5 1.1
Stalled projects 0.9 0.9 4.0 0.4 0.5 3.2 2.7 0.1 0.9
Revived projects 0.3 0.2 0.3 0.3 0.5 0.9 0.1 0.1 0.3
Implementation stalled projects NA 0.7 1.5 0.1 0.6 0.3 1.5 0.9 NA
Source: CMIE, PL
IIP Trends
-15
-10
-5
0
5
10
15
20
25
Dec
-17
Jan-
18
Feb
-18
Mar
-18
Apr
-18
May
-18
Jun-
18
Jul-1
8
Aug
-18
Sep
-18
Oct
-18
Nov
-18
Dec
-18
Jan-
19
Feb
-19
Mar
-19
Apr
-19
IIP growth (%) Capital Goods (%)
Source: CMIE, PL
Q1FY20 Result Preview
Company Name Q1FY20E Q1FY19 YoY gr. (%) Q4FY19 QoQ gr.
(%) Remark
ABB
Sales 19,256 27,127 -29.0 18,503 4.1 The company continues to expand its digitalization footprints across verticals and sectors by offering average efficiency between 20-30%. Its fives focus areas would be - Power, Manufacturing, Smart infrastructure, Hospitals, Retail, Schools etc.
EBITDA 1,469 1,959 (25.0) 1,455 0.9
Margin (%) 7.6 7.2 7.9
Adj. PAT 937 1,022 (8.2) 890 5.3
Apar Industries
Sales 17,373 14,956 16.2 24,646 (29.5) Expects to improve its revenue mix by increasing share of high-margin products in all the three segments in FY20, thus leading to higher profitability. EBITDA margins are expected to improve sequentially on account of improvement in Transformer Oil /Conductor business.
EBITDA 1,153 1,091 5.7 1,353 (14.8)
Margin (%) 6.6 7.3 5.5
Adj. PAT 334 290 15.1 437 (23.7)
Bharat Electronics
Sales 24,594 21,021 17.0 38,846 (36.7) Expect revenue to grow in the range of 13-15% in FY20 which will include execution of LRSAM project (deadline 4QFY20) which has relatively higher imported content.EBITDA margin to be in the range of 20-21%.
EBITDA 5,288 3,105 70.3 9,290 (43.1)
Margin (%) 21.5 14.8 23.9
Adj. PAT 3,359 1,797 86.9 6,686 (49.8)
BHEL
Sales 62,900 59,355 6.0 1,02,972 (38.9) Expect a market potential of 20GW out of which 15GW has already been tendered and 5GW is expected to be tendered in few months. Company signed MoU for revenues of Rs330 bn for FY20. Expected order inflow for Q1FY20 is Rs27 bn
EBITDA 3,774 2,872 31.4 13,952 (73.0)
Margin (%) 6.0 4.8 13.5
Adj. PAT 1,833 1,556 17.8 6,827 (73.1)
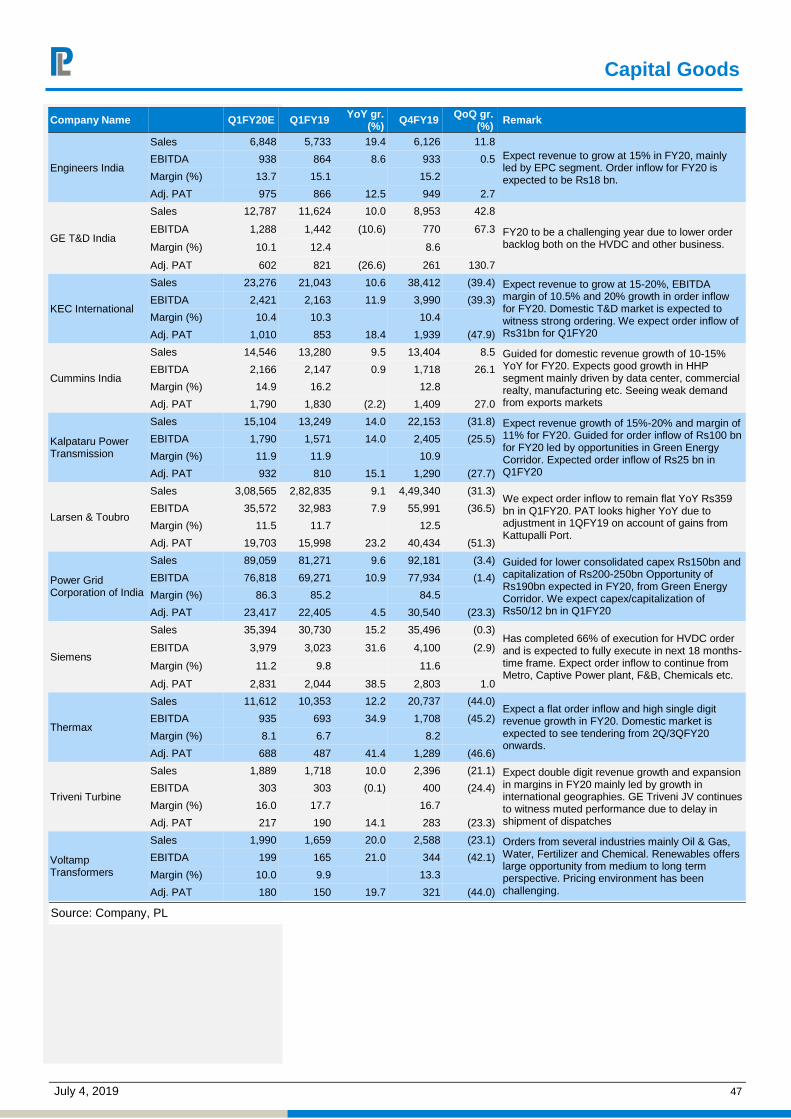
Capital Goods
July 4, 2019 47
Company Name Q1FY20E Q1FY19 YoY gr. (%) Q4FY19 QoQ gr.
(%) Remark
Engineers India
Sales 6,848 5,733 19.4 6,126 11.8 Expect revenue to grow at 15% in FY20, mainly led by EPC segment. Order inflow for FY20 is expected to be Rs18 bn.
EBITDA 938 864 8.6 933 0.5
Margin (%) 13.7 15.1 15.2
Adj. PAT 975 866 12.5 949 2.7
GE T&D India
Sales 12,787 11,624 10.0 8,953 42.8
FY20 to be a challenging year due to lower order backlog both on the HVDC and other business.
EBITDA 1,288 1,442 (10.6) 770 67.3
Margin (%) 10.1 12.4 8.6
Adj. PAT 602 821 (26.6) 261 130.7
KEC International
Sales 23,276 21,043 10.6 38,412 (39.4) Expect revenue to grow at 15-20%, EBITDA margin of 10.5% and 20% growth in order inflow for FY20. Domestic T&D market is expected to witness strong ordering. We expect order inflow of Rs31bn for Q1FY20
EBITDA 2,421 2,163 11.9 3,990 (39.3)
Margin (%) 10.4 10.3 10.4
Adj. PAT 1,010 853 18.4 1,939 (47.9)
Cummins India
Sales 14,546 13,280 9.5 13,404 8.5 Guided for domestic revenue growth of 10-15% YoY for FY20. Expects good growth in HHP segment mainly driven by data center, commercial realty, manufacturing etc. Seeing weak demand from exports markets
EBITDA 2,166 2,147 0.9 1,718 26.1
Margin (%) 14.9 16.2 12.8
Adj. PAT 1,790 1,830 (2.2) 1,409 27.0
Kalpataru Power Transmission
Sales 15,104 13,249 14.0 22,153 (31.8) Expect revenue growth of 15%-20% and margin of 11% for FY20. Guided for order inflow of Rs100 bn for FY20 led by opportunities in Green Energy Corridor. Expected order inflow of Rs25 bn in Q1FY20
EBITDA 1,790 1,571 14.0 2,405 (25.5)
Margin (%) 11.9 11.9 10.9
Adj. PAT 932 810 15.1 1,290 (27.7)
Larsen & Toubro
Sales 3,08,565 2,82,835 9.1 4,49,340 (31.3) We expect order inflow to remain flat YoY Rs359 bn in Q1FY20. PAT looks higher YoY due to adjustment in 1QFY19 on account of gains from Kattupalli Port.
EBITDA 35,572 32,983 7.9 55,991 (36.5)
Margin (%) 11.5 11.7 12.5
Adj. PAT 19,703 15,998 23.2 40,434 (51.3)
Power Grid Corporation of India
Sales 89,059 81,271 9.6 92,181 (3.4) Guided for lower consolidated capex Rs150bn and capitalization of Rs200-250bn Opportunity of Rs190bn expected in FY20, from Green Energy Corridor. We expect capex/capitalization of Rs50/12 bn in Q1FY20
EBITDA 76,818 69,271 10.9 77,934 (1.4)
Margin (%) 86.3 85.2 84.5
Adj. PAT 23,417 22,405 4.5 30,540 (23.3)
Siemens
Sales 35,394 30,730 15.2 35,496 (0.3) Has completed 66% of execution for HVDC order and is expected to fully execute in next 18 months-time frame. Expect order inflow to continue from Metro, Captive Power plant, F&B, Chemicals etc.
EBITDA 3,979 3,023 31.6 4,100 (2.9)
Margin (%) 11.2 9.8 11.6
Adj. PAT 2,831 2,044 38.5 2,803 1.0
Thermax
Sales 11,612 10,353 12.2 20,737 (44.0) Expect a flat order inflow and high single digit revenue growth in FY20. Domestic market is expected to see tendering from 2Q/3QFY20 onwards.
EBITDA 935 693 34.9 1,708 (45.2)
Margin (%) 8.1 6.7 8.2
Adj. PAT 688 487 41.4 1,289 (46.6)
Triveni Turbine
Sales 1,889 1,718 10.0 2,396 (21.1) Expect double digit revenue growth and expansion in margins in FY20 mainly led by growth in international geographies. GE Triveni JV continues to witness muted performance due to delay in shipment of dispatches
EBITDA 303 303 (0.1) 400 (24.4)
Margin (%) 16.0 17.7 16.7
Adj. PAT 217 190 14.1 283 (23.3)
Voltamp Transformers
Sales 1,990 1,659 20.0 2,588 (23.1) Orders from several industries mainly Oil & Gas, Water, Fertilizer and Chemical. Renewables offers large opportunity from medium to long term perspective. Pricing environment has been challenging.
EBITDA 199 165 21.0 344 (42.1)
Margin (%) 10.0 9.9 13.3
Adj. PAT 180 150 19.7 321 (44.0)
Source: Company, PL

Capital Goods
July 4, 2019 48
Valuation Summary
Company Names Rating CMP (Rs) TP (Rs)
Sales (Rs bn) EBITDA (Rs bn) PAT (Rs bn) EPS (Rs) RoE (%) PE (x)
FY18 FY19 FY20E FY21E FY18 FY19 FY20E FY21E FY18 FY19 FY20E FY21E FY18 FY19 FY20E FY21E FY18 FY19 FY20E FY21E FY18 FY19 FY20E FY21E
ABB Reduce f 1,320 60.9 66.9 77.0 88.9 4.1 4.6 5.5 6.8 4.2 5.1 6.2 7.7 19.8 24.1 29.5 36.2 12.2 13.4 15.2 17.8 83.4 68.5 56.0 45.7
Apar Industries Acc 588 795 58.2 79.6 89.9 98.7 4.1 4.7 5.4 6.2 1.4 1.4 1.8 2.3 37.8 35.6 47.4 58.9 13.5 11.8 14.3 16.0 15.5 16.5 12.4 10.0
Bharat Electronics Acc 114 120 103.2 120.8 137.7 153.0 20.0 28.6 29.3 31.5 14.0 19.3 18.8 20.2 5.7 7.9 7.7 8.3 18.3 23.4 20.6 20.0 19.8 14.4 14.7 13.7
BHEL Hold 73 77 288.1 303.5 329.1 358.7 19.3 21.4 26.4 32.7 8.1 12.2 15.7 20.7 2.2 3.5 4.5 5.9 2.5 3.8 5.0 6.4 33.3 20.9 16.2 12.3
Engineers India BUY 120 139 18.2 24.8 28.2 32.4 4.3 3.8 4.1 5.0 3.8 3.7 4.2 4.9 6.1 5.9 6.7 7.7 14.8 15.5 17.1 19.2 19.8 20.5 18.0 15.5
GE T&D India Reduce 237 257 43.3 42.2 44.7 50.5 2.6 4.3 4.0 4.8 2.1 2.1 1.9 2.6 8.2 8.3 7.6 10.3 18.8 16.2 13.0 15.8 29.1 28.5 31.2 23.0
KEC International BUY 333 352 100.5 110.0 126.5 142.0 10.1 11.5 13.2 14.9 4.6 4.9 6.0 6.9 17.8 18.9 23.3 26.9 25.6 21.9 22.3 21.5 18.7 17.6 14.3 12.4
Cummins India Acc 760 841 50.8 56.6 61.6 68.5 7.3 8.6 9.4 10.5 7.1 7.2 7.9 9.0 25.6 26.1 28.6 32.3 18.3 17.8 18.8 20.1 29.7 29.2 26.6 23.5
Kalpataru Power Transmission BUY 532 565 57.4 71.2 82.9 94.9 6.3 7.8 9.1 10.4 3.2 4.0 5.0 5.7 21.0 26.2 32.3 37.1 12.3 13.6 14.7 14.9 25.3 20.3 16.4 14.3
Larsen & Toubro BUY 1,572 1,744 1196.8 1410.1 1588.3 1812.9 136.4 163.2 183.8 210.1 72.5 86.1 103.2 120.6 51.7 61.4 73.7 86.0 13.8 14.7 15.8 16.7 30.4 25.6 21.3 18.3
Power Grid Corporation of India BUY 210 224 297.5 341.2 354.3 389.4 259.4 292.8 308.9 339.6 82.4 99.4 101.5 113.5 15.7 19.0 19.4 21.7 15.8 17.5 16.5 17.0 13.3 11.1 10.8 9.7
Siemens Acc 1,358 1,263 110.6 128.0 142.6 162.3 10.5 13.3 15.3 17.8 11.4 9.0 10.2 12.0 31.9 25.3 28.6 33.7 15.7 11.3 11.8 12.8 42.5 53.6 47.5 40.3
Thermax Acc 1,058 1,147 44.6 59.7 62.8 68.3 4.0 4.6 5.2 6.0 2.3 3.3 3.7 4.3 20.5 28.9 33.2 38.2 8.8 11.4 11.9 12.5 51.6 36.6 31.8 27.7
Triveni Turbine Acc 105 124 7.5 8.4 9.5 10.5 1.6 1.5 1.8 2.1 1.0 1.0 1.2 1.4 2.9 3.1 3.7 4.4 22.4 22.6 25.7 25.9 36.0 33.8 27.9 23.7
Voltamp Transformers BUY 1,160 1,505 6.4 8.3 9.4 10.5 0.7 0.9 1.1 1.2 0.7 0.8 1.0 1.1 72.6 83.4 98.0 107.5 12.4 13.0 13.9 13.8 16.0 13.9 11.8 10.8
Source: Company, PL
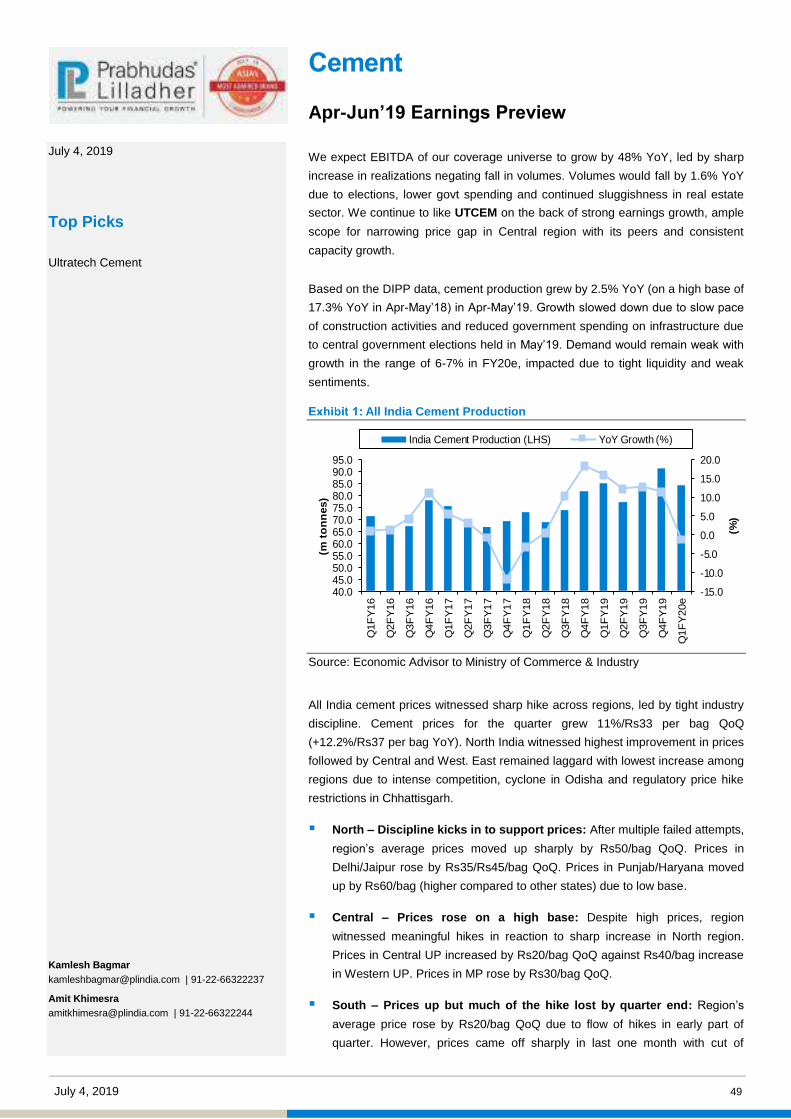
July 4, 2019 49
Cement Apr-Jun’19 Earnings Preview We expect EBITDA of our coverage universe to grow by 48% YoY, led by sharp
increase in realizations negating fall in volumes. Volumes would fall by 1.6% YoY
due to elections, lower govt spending and continued sluggishness in real estate
sector. We continue to like UTCEM on the back of strong earnings growth, ample
scope for narrowing price gap in Central region with its peers and consistent
capacity growth.
Based on the DIPP data, cement production grew by 2.5% YoY (on a high base of
17.3% YoY in Apr-May’18) in Apr-May’19. Growth slowed down due to slow pace
of construction activities and reduced government spending on infrastructure due
to central government elections held in May’19. Demand would remain weak with
growth in the range of 6-7% in FY20e, impacted due to tight liquidity and weak
sentiments.
All India Cement Production
-15.0
-10.0
-5.0
0.0
5.0
10.0
15.0
20.0
40.045.050.055.060.065.070.075.080.085.090.095.0
Q1F
Y16
Q2F
Y16
Q3F
Y16
Q4F
Y16
Q1F
Y17
Q2F
Y17
Q3F
Y17
Q4F
Y17
Q1F
Y18
Q2F
Y18
Q3F
Y18
Q4F
Y18
Q1F
Y19
Q2F
Y19
Q3F
Y19
Q4F
Y19
Q1F
Y20
e
(%)
(m to
nn
es)
India Cement Production (LHS) YoY Growth (%)
Source: Economic Advisor to Ministry of Commerce & Industry
All India cement prices witnessed sharp hike across regions, led by tight industry
discipline. Cement prices for the quarter grew 11%/Rs33 per bag QoQ
(+12.2%/Rs37 per bag YoY). North India witnessed highest improvement in prices
followed by Central and West. East remained laggard with lowest increase among
regions due to intense competition, cyclone in Odisha and regulatory price hike
restrictions in Chhattisgarh.
North – Discipline kicks in to support prices: After multiple failed attempts,
region’s average prices moved up sharply by Rs50/bag QoQ. Prices in
Delhi/Jaipur rose by Rs35/Rs45/bag QoQ. Prices in Punjab/Haryana moved
up by Rs60/bag (higher compared to other states) due to low base.
Central – Prices rose on a high base: Despite high prices, region
witnessed meaningful hikes in reaction to sharp increase in North region.
Prices in Central UP increased by Rs20/bag QoQ against Rs40/bag increase
in Western UP. Prices in MP rose by Rs30/bag QoQ.
South – Prices up but much of the hike lost by quarter end: Region’s
average price rose by Rs20/bag QoQ due to flow of hikes in early part of
quarter. However, prices came off sharply in last one month with cut of
July 4, 2019
Top Picks
Ultratech Cement
Kamlesh Bagmar [email protected] | 91-22-66322237
Amit Khimesra [email protected] | 91-22-66322244
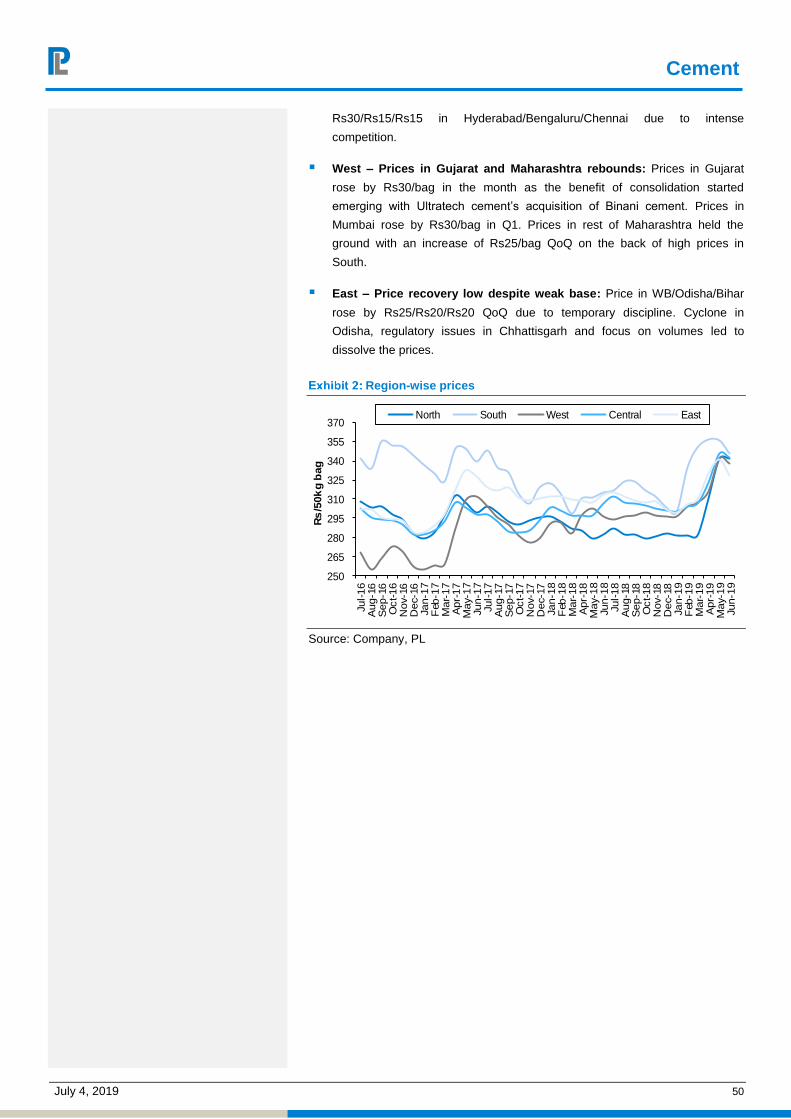
Cement
July 4, 2019 50
Rs30/Rs15/Rs15 in Hyderabad/Bengaluru/Chennai due to intense
competition.
West – Prices in Gujarat and Maharashtra rebounds: Prices in Gujarat
rose by Rs30/bag in the month as the benefit of consolidation started
emerging with Ultratech cement’s acquisition of Binani cement. Prices in
Mumbai rose by Rs30/bag in Q1. Prices in rest of Maharashtra held the
ground with an increase of Rs25/bag QoQ on the back of high prices in
South.
East – Price recovery low despite weak base: Price in WB/Odisha/Bihar
rose by Rs25/Rs20/Rs20 QoQ due to temporary discipline. Cyclone in
Odisha, regulatory issues in Chhattisgarh and focus on volumes led to
dissolve the prices.
Region-wise prices
250
265
280
295
310
325
340
355
370
Jul-1
6A
ug-1
6S
ep-1
6O
ct-1
6N
ov-1
6D
ec-1
6Ja
n-17
Feb
-17
Mar
-17
Apr
-17
May
-17
Jun-
17Ju
l-17
Aug
-17
Sep
-17
Oct
-17
Nov
-17
Dec
-17
Jan-
18F
eb-1
8M
ar-1
8A
pr-1
8M
ay-1
8Ju
n-18
Jul-1
8A
ug-1
8S
ep-1
8O
ct-1
8N
ov-1
8D
ec-1
8Ja
n-19
Feb
-19
Mar
-19
Apr
-19
May
-19
Jun-
19
Rs
/50k
g b
ag
North South West Central East
Source: Company, PL

Cement
July 4, 2019 51
Q1FY20 Result Preview
Company Name Q1FY20E Q1FY19
YoY gr. (%)
Q4FY19 QoQ gr. (%) Remark
ACC
Sales 38,957 37,679 3.4 38,496 1.2 Volume is expected to fall 2% YoY at 7.1m tonnes (t). Realisations are expected to improve by 5.5%/Rs286 YoY (+7%/Rs358/t QoQ) at Rs5,491/t. Due to better realisations, EBITDA/t is expected to expand 13.6%/Rs111 YoY at Rs923.
EBITDA 6,550 5,884 11.3 4,622 41.7
Margin (%) 16.8 15.6
12.0
Adj. PAT 4,144 3,584 15.6 2,804 47.8
Volume (mn te) 7.1 7.2 (2.0) 7.5 (5.4)
Net Realisations (Rs/te) 5,491 5,204 5.5 5,133 7.0
EBITDA (Rs/te) 923 813 13.6 616 49.8
Ambuja Cement
Sales 28,959 29,270 (1.1) 28,470 1.7 Volume is expected to fall 8.5% YoY at 5.9m tonnes. Realisations are expected to expand by 8%/Rs371 YoY (+10.5%/Rs468/t QoQ) at Rs4,937/t. Due to higher realisations and increase in costs, EBITDA/t is expected to increase 19%/Rs160 YoY to Rs990.
EBITDA 5,802 5,324 9.0 3,826 51.6
Margin (%) 20.0 18.2
13.4
Adj. PAT 4,243 4,993 (15.0) 3,873 9.6
Volume (mn te) 5.9 6.4 (8.5) 6.4 (7.9)
Net Realisations (Rs/te) 4,937 4,566 8.1 4,469 10.5
EBITDA (Rs/te) 989 831 19.1 601 64.7
Heidelberg Cement
Sales 5,666 5,369 5.5 5,347 6.0 Volume is expected to fall 5% YoY at 1.2m tonnes. Realisations are expected to improve by 11%/Rs470 YoY (+6.6%/Rs292/t QoQ) at Rs4,707/t. Due to increase in realisations, EBITDA/t is expected to expand by 23.8%/Rs218 YoY at Rs1,133.
EBITDA 1,364 1,160 17.6 1,162 17.4
Margin (%) 24.1 21.6
21.7
Adj. PAT 747 511 46.1 609 22.7
Volume (mn te) 1.2 1.3 (5.0) 1.2 (0.6)
Net Realisations (Rs/te) 4,707 4,237 11.1 4,415 6.6
EBITDA (Rs/te) 1,133 915 23.8 959 18.1
JK Lakshmi Cement
Sales 9,745 9,234 5.5 11,725 (16.9) Volume is expected to fell 4% YoY at 2.2m tonnes. Realisations are expected to grow 10%/Rs400/t YoY (11.3%/Rs450/t QoQ) at Rs4,440/t. Led by better realisations, EBITDA/t is expected to expand 87.3%/Rs358 YoY at Rs769.
EBITDA 1,688 939 79.8 1,312 28.6
Margin (%) 17.3 10.2
11.2
Adj. PAT 667 137 385.1 433 54.2
Volume (mn te) 2.2 2.3 (4.0) 2.9 (25.3)
Net Realisations (Rs/te) 4,439 4,038 9.9 3,989 11.3
EBITDA (Rs/te) 769 410 87.3 447 72.2
Shree Cement
Sales 31,112 30,699 1.3 32,849 (5.3)
Cement volume is expected to fall sharply by 12.4% YoY at 6.1m tonnes. Realisations are expected to improve by 15.7% YoY/Rs647/t (+12.5%/Rs528/t QoQ) at Rs4,753. Due to sharp increase in realisations, cement EBITDA/t is expected to expand 77.7% YoY/Rs676 to Rs1,547.
EBITDA 9,920 6,502 52.6 8,478 17.0
Margin (%) 31.9 21.2
25.8
Adj. PAT 5,296 3,447 53.6 3,210 65.0
Volume (mn te) - Cement 6.1 7.0 (12.4) 7.3 (16.2)
Volume (mn units) - Power 430 451 (4.6) 382 12.7
Net Realisations (Rs/te) 4,753 4,107 15.7 4,225 12.5
Realised rate (Rs/unit) 5 4.4 5.6 5.3 (10.6)
Cement EBITDA (Rs/te) 1,547 871 77.7 1,103 40.3
The Ramco Cements
Sales 13,603 11,860 14.7 15,265 (10.9) Volume is expected to grow 4.5% YoY at 2.7m tonnes. Realisations are expected to grow 9.8%/Rs443 YoY (+7.3%/Rs340 QoQ) at Rs4,980. Due to better realisations, EBITDA/t is expected to expand by 50%/Rs412 YoY at Rs1,240.
EBITDA 3,388 2,164 56.6 3,192 6.1
Margin (%) 24.9 18.2
20.9
Adj. PAT 1,986 1,250 58.9 1,732 14.7
Volume (mn te) 2.7 2.6 4.5 3.3 (17.0)
Net Realisations (Rs/te) 4,980 4,537 9.8 4,640 7.3
EBITDA (Rs/te) 1,240 828 49.8 970 27.8
UltraTech Cement
Sales 96,898 83,548 16.0 103,340 (6.2) Blended realisations are expected to increase by 11.3%/Rs540 YoY (+9.5%/Rs462 QoQ) to Rs5,314/t. Grey cement volumes are expected to grow 4.1% YoY at 17.9m tonnes due to consolidation of acquired assets. On the back of improved realisations, EBITDA/t is expected to expand 66%/Rs544 to Rs1,371.
EBITDA 24,974 14,448 72.9 20,470 22.0
Margin (%) 25.8 17.3
19.8
Adj. PAT 13,209 5,984 120.7 10,175 29.8
Volume (mn te) 17.9 17.2 4.1 20.9 (14.3)
Net Realisations (Rs/te) 5,318 4,774 11.4 4,852 9.6
EBITDA (Rs/te) 1,371 826 66.0 961 42.6
Source: Company, PL

Cement
July 4, 2019 52
Valuation Summary
Company Names Rating CMP (Rs) TP (Rs)
Sales (Rs bn) EBITDA (Rs bn) PAT (Rs bn) EPS (Rs) RoE (%) PE (x)
FY18 FY19 FY20E FY21E FY18 FY19 FY20E FY21E FY18 FY19 FY20E FY21E FY18 FY19 FY20E FY21E FY18 FY19 FY20E FY21E FY18 FY19 FY20E FY21E
ACC BUY 1,577 1,750 129.3 144.8 152.8 159.2 15.2 17.2 23.9 25.7 9.0 15.2 15.3 16.9 48.0 80.9 81.2 90.1 9.9 15.3 13.7 13.7 32.9 19.5 19.4 17.5
Ambuja Cement Hold 216 210 231.0 254.2 271.9 286.1 32.7 33.9 40.9 44.7 14.4 22.8 20.6 21.4 7.3 11.5 10.4 10.8 7.1 10.6 8.9 8.6 29.8 18.8 20.8 20.0
Heidelberg Cement India Acc 204 220 18.6 21.1 22.6 23.4 3.3 4.6 5.3 5.0 1.3 2.2 2.7 2.6 5.9 9.6 12.1 11.6 13.2 19.7 21.7 18.3 34.7 21.2 16.8 17.5
JK Lakshmi Cement Acc 333 401 34.1 38.8 42.4 43.4 4.1 4.1 6.8 5.9 0.8 0.8 3.1 2.6 7.1 6.8 26.7 21.7 5.9 5.3 18.8 13.1 46.7 49.3 12.4 15.4
Shree Cement Reduce 21,648 19,750 98.1 117.2 134.0 142.5 24.5 27.9 38.5 37.5 13.8 12.7 23.1 21.6 397.3 364.0 663.4 619.0 16.7 13.7 21.3 16.6 54.5 59.5 32.6 35.0
The Ramco Cements Hold 790 820 43.2 50.6 58.2 66.8 10.1 9.5 13.8 15.7 5.5 5.1 8.2 9.1 23.3 21.8 34.9 38.6 14.1 12.1 16.9 16.1 33.9 36.2 22.6 20.5
Ultratech Cement BUY 4,645 5,175 309.7 369.0 472.4 512.7 57.1 63.0 107.2 107.7 26.2 24.3 49.7 52.9 95.5 88.7 172.1 183.3 10.3 8.9 14.9 12.9 48.6 52.4 27.0 25.3
Source: Company, PL

July 4, 2019 53
July 4, 2019
Top Picks
Crompton Greaves Consumer Electricals
Amnish Aggarwal [email protected] | 91-22-66322233
Paarth Gala [email protected] | 91-22-66322242
Consumer Durables Apr-Jun’19 Earnings Preview
RAC to report strong volume growth aided by harsh summer, lower base:
After an erratic FY19 (industry de-grew by 3%), FY20 has started on a positive note.
RAC industry is expected to report strong volume growth aided by a harsh summer
and lower base. However, high channel inventory prior to the start of the summer
season and competitive scenario has prevented brands from taking any price hikes.
Margins are set improve with softening of commodity prices and appreciating INR.
Slowdown in demand to curtail gains from falling commodity prices:
Commodity prices have softened with spot copper prices down by 8% YoY/ 3%
QoQ while aluminum spot prices are down by 18% YoY / 5% QoQ. However, with
sluggish demand observed in 4Q19 (owing to liquidity crunch and general elections)
continuing in 1Q20, gains derived from soft commodity prices shall be limited.
Demand for fans is expected to be strong due to strong summer season sales. With
rising competitive intensity, brands continue to focus on innovation, expanding
distribution reach & optimizing costs improve margins.
LME copper spot prices down by 3% QoQ
2,00,000 2,50,000 3,00,000 3,50,000 4,00,000 4,50,000 5,00,000 5,50,000
01-A
pr-1
601
-Jun
-16
01-A
ug-1
601
-Oct
-16
01-D
ec-1
601
-Feb
-17
01-A
pr-1
701
-Jun
-17
01-A
ug-1
701
-Oct
-17
01-D
ec-1
701
-Feb
-18
01-A
pr-1
801
-Jun
-18
01-A
ug-1
801
-Oct
-18
01-D
ec-1
801
-Feb
-19
01-A
pr-1
901
-Jun
-19
Copper Spot (INR/MT)
Source: PL
LME aluminum sport prices down by 5% QoQ
60,000 80,000
1,00,000 1,20,000 1,40,000 1,60,000 1,80,000
01-A
pr-1
601
-Jun
-16
01-A
ug-1
601
-Oct
-16
01-D
ec-1
601
-Feb
-17
01-A
pr-1
701
-Jun
-17
01-A
ug-1
701
-Oct
-17
01-D
ec-1
701
-Feb
-18
01-A
pr-1
801
-Jun
-18
01-A
ug-1
801
-Oct
-18
01-D
ec-1
801
-Feb
-19
01-A
pr-1
901
-Jun
-19
Aluminium Spot (INR/MT)
Source: PL
Q1FY20 Result Preview
Company Name Q1FY20E Q1FY19 YoY gr. (%) Q4FY19 QoQ gr.
(%) Remark
Crompton Greaves Consumer Electricals
Sales 13,316 12,039 10.6 12,069 10.3 ECD growth momentum to moderate due to demand slowdown. However, fans likely to benefit from a harsh summer. Lighting set to continue posting double digit margins on the back of moderating price erosion in LED bulbs and cost optimizing program
EBITDA 1,931 1,673 15.4 1,685 14.6
Margin (%) 14.5 13.9 14.0
Adj. PAT 1,225 1,043 17.5 1,132 8.2
Voltas
Sales 24,175 21,481 12.5 20,628 17.2 RAC volumes to report strong growth aided by harsh summer and a low base. Inability to take price hikes due to high competitive intensity and high inventory at start of season to limit margin expansion. MEP business to remain subdued as a result of general elections and higher base. Beko JV to remain a drag
EBITDA 2,780 2,432 14.3 1,443 92.6
Margin (%) 11.5 11.3 7.0
Adj. PAT 1,920 1,839 4.4 1,396 37.6
Source: Company, PL
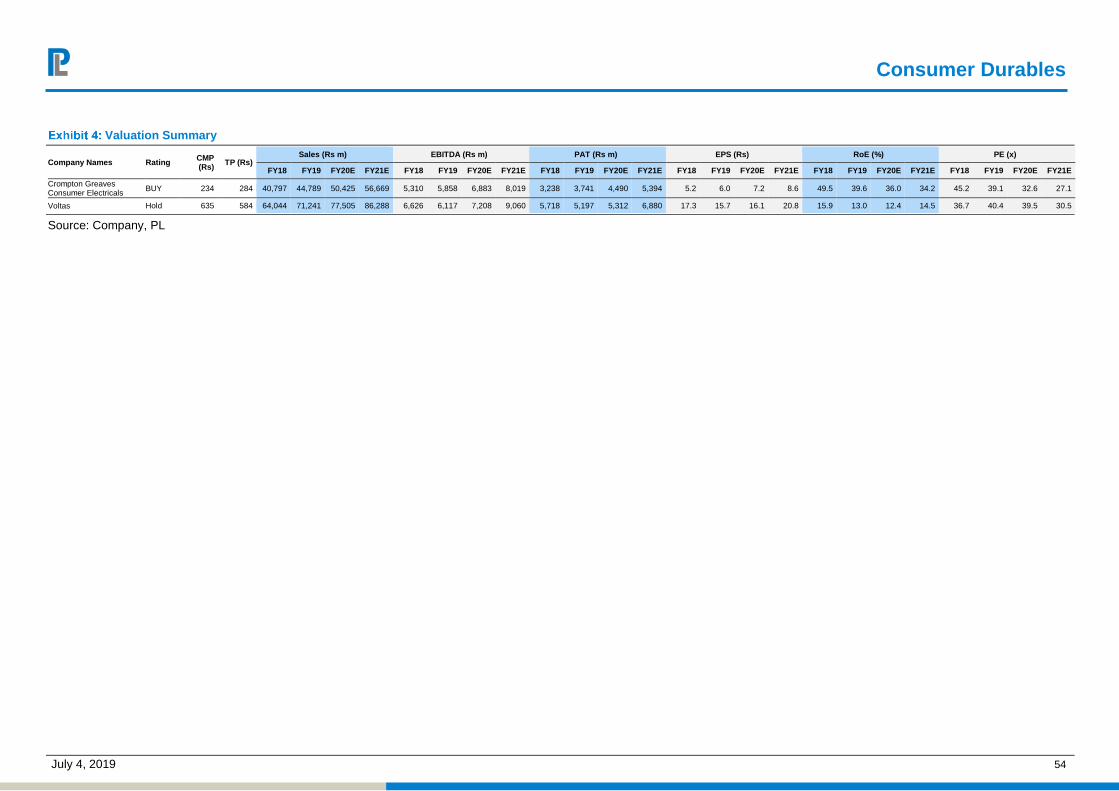
Consumer Durables
July 4, 2019 54
Valuation Summary
Company Names Rating CMP (Rs) TP (Rs)
Sales (Rs m) EBITDA (Rs m) PAT (Rs m) EPS (Rs) RoE (%) PE (x)
FY18 FY19 FY20E FY21E FY18 FY19 FY20E FY21E FY18 FY19 FY20E FY21E FY18 FY19 FY20E FY21E FY18 FY19 FY20E FY21E FY18 FY19 FY20E FY21E
Crompton Greaves Consumer Electricals BUY 234 284 40,797 44,789 50,425 56,669 5,310 5,858 6,883 8,019 3,238 3,741 4,490 5,394 5.2 6.0 7.2 8.6 49.5 39.6 36.0 34.2 45.2 39.1 32.6 27.1
Voltas Hold 635 584 64,044 71,241 77,505 86,288 6,626 6,117 7,208 9,060 5,718 5,197 5,312 6,880 17.3 15.7 16.1 20.8 15.9 13.0 12.4 14.5 36.7 40.4 39.5 30.5
Source: Company, PL

July 4, 2019 55
Consumer Apr-Jun’19 Earnings Preview
Q1FY20 Adj. PAT to increase 11.7%
1QFY20 performance is likely to be impacted by rural slowdown and poor consumer
sentiments. Sales and Adj. PAT is expected to grow at 12.5% and 11.7%
respectively (13.2% and 23.5% in 4QFY19) on 27bps decline in EBITDA margins
(79bps decline in 4QFY19).
Avenue Supermart, Titan, Jubilant FoodWorks, Future retail and ITC are expected
to report double digit sales growth. Raw material headwinds are emerging, so
EBIDTA margin expansion will be a function of operating leverage and internal
efficiencies. Jubilant Foodworks, Avenue Supermart, Titan and Marico are
expected to report a strong profit growth.
Monsoons and liquidity remain key factors
Rural demand slowdown and liquidity crunch visible across segments:
Despite the normal trend of increase in rural demand for FMCG during elections,
growth rates have remained soft considering last year’s poor monsoons, food
deflation and tight liquidity have led to rural distress. Considering rural demand
growth was below Urban demand growth (earlier 1.5x in 2Q19 and 1.1x in 4Q19),
companies with higher rural share have witnessed subdued demand growth.
Though liquidity scenario has improved QoQ, it remains far from being satisfactory.
Seasonality factors: Prolonged winters have impacted the onset and early
demand for summer portfolio, although intense heat wave boosted a pickup in the
later part. Dabur (Juices) and Emami (Personal care and other cooling products)
are likely to be affected.
Spatial distribution of monsoons crucial for growth: Last year’s monsoons
remained below normal and patchy. Though there has been a delay in its onset by
more than a week and forecasts of below normal monsoons, spatial distribution in
drought prone areas remains a key factor. Dependence on monsoons has been
decreasing over the years and agriculture is now just 30% of the total rural income.
Food inflation, increase in government spends to improve rural incomes:
After five months of Food deflation, CPI food Inflation has turned positive from
March’19. Food inflation coupled with higher government spends, benefits of PM
Kisan Yojana and increase in MSP would increase farmers purchasing power and
boost rural demand.
Implementation of IndAS 116 on Leases w.e.f. FY20: The existing distinction
between Finance and operating lease would cease and the current lease payments
will split into depreciation and interest expense. Reported EBITDA will increase
while higher depreciation, Interest and front loading of lease will impact PBT. The
lease asset would be recognised as asset for depreciation and a corresponding
loan in the liabilities. This IndAS would mainly impact retail companies like Jubilant
FoodWorks, Future retail, Titan (only for leased stores), ITC (WLS stores) etc.
Impact on other consumer companies would be insignificant.
July 4, 2019
Top Picks
Jubilant Foodworks
Britannia Industries
Amnish Aggarwal [email protected] | 91-22-66322233
Nishita Doshi [email protected] | 91-22-66322381

Consumer
July 4, 2019 56
Crude has softened; Raw material headwinds visible
Brent Crude has increased in 1QFY20 to USD65.5/barrel with an average of USD68.6/barrel (4QFY19 average at USD63/barrel). However, crude linked
inputs would increase in tandem with a lag.
VAM and Soda Ash have remained volatile and has declined gradually. HDPE has corrected by 27.4% from its peak. TiO2 and LLP prices have started declining.
Wheat prices have started increasing post a short correction in April’19 and are
up 11.9% YoY, however down by 6% QoQ.
Sugar prices remain at high levels with 10.4% up YoY and 2.8% up QoQ.
Barley prices remain at elevated levels and are up 23.4% YoY, however, down by 4% QoQ.
Mentha prices have corrected by 11.4% in 1Q20, however, they still remain 10.2% up YoY and would continue to impact raw material costs of Emami.
SMP prices have increased 59.4% in 1-year led by implementation of Export
incentives.
Palm oil prices are gradually declining and they remain down 18.7% YoY and 4.2% QoQ.
Exhibit 1: Crude linked Commodities for 1QFY20
Input Price Trend (Y-o-Y) Unit 52 Week H/L Current
Price YoY
change % QoQ
change % Impact Companies (% of sales)
Soda Ash Down INR/50Kg 1475/1160 1225 8.9% 2.2% Negative HUL, Jyothy Labs
VAM Down USD/MT 1315/896 898 -20.4% -2.3% Positive PIDI (6.4%)
HDPE Down INR/MT 94206/68872 68872 -20.2% -1.1% Positive All Companies for packaging (8-15%)
TiO2 Down INR/Kg 284/263 270 6.2% 0.0% Negative YoY,
Flat QoQ APNT (19%), Kansai Nerolac, and other paint companies
LLP* Down Rs/ltr 55/44 48 0.9% 2.6% Flattish Marico, Emami (8%), Dabur
Source: PL, Bloomberg, Marico *(upto May’19), YOY and QoQ nos are quarterly average
Exhibit 2: Agri linked commodity for 1QFY20
Input Price Trend (Y-o-Y) Unit 52 Week
H/L Current
Price YoY
change % QoQ
change % Impact Companies (% of sales)
Wheat Up INR/Qtl 2120/1775 2031 11.9% -6.0% Negative YoY, Positive QoQ
Nestle (5%) , Britannia (14%), ITC, GSK Consumer
Palm Fatty Acid Down INR/MT 40781/21893 25064 -16.0% -6.1% Positive HUL (6.5%)
Palm Oil Down INR/MT 38977/29051 31196 -18.7% -4.2% Positive Britannia (9%) , Nestle (3.5%), HUL
Sugar Up INR/Qtl 3395/3045 3195 10.4% 2.8% Negative Britannia (8.5%) , Nestle (1.5%) , GSK Consumer, Dabur, ITC, HUL
SMP Up Rs/kg 165/116 162 33.9% 1.9% Negative Nestle (2.6%) , GSK Consumer (5%), Britannia
Barley Down Rs/Quintal 1960/1494 1826 23.4% -4.0% Negative YoY, Positive QoQ GSK Consumer (6%)
Mentha Oil Down INR/Kg 2010/1290 1380 10.2% -11.4% Negative YoY, Positive QoQ Emami (22%), Colgate, HUL, Dabur
Gold Up INR/
10gms 34329/29361 33549 4.0% -1.1% Negative YoY, Positive QoQ Titan
Coffee Up US$/MT 122.6/86.7 108 -19.1% -4.5% Positive Nestle (3.5%) , HUL (1%)
Kardi Oil* Down Rs/10kg 1580/1271 1565 19.8% -0.4% Negative YoY,
Flat QoQ Marico
Copra* Down INR/Qtl 13629/9543 10214 -23.9% -11.6% Positive Marico (16%)
Source: PL, Bloomberg, Marico, *(upto May’19), YOY and QoQ nos are quarterly average

Consumer
July 4, 2019 57
Exhibit 3: VAM prices fell 34.7% from peak; down 20.4% YoY
994
1181
1029
650
750
850
950
1050
1150
1250
1350
Sep
-16
Nov
-16
Jan-
17
Mar
-17
May
-17
Jul-1
7
Sep
-17
Nov
-17
Jan-
18
Mar
-18
May
-18
Jul-1
8
Sep
-18
Nov
-18
Jan-
19
Mar
-19
May
-19
US
D/M
T
Source: Bloomberg, PL
Exhibit 4: Tio2 prices down to Rs270/kg from Rs280/kg peak
270
200
220
240
260
280
300
Jul-
16
Oct
-16
Jan-
17
Apr
-17
Jul-
17
Oct
-17
Jan-
18
Apr
-18
Jul-
18
Oct
-18
Jan-
19
Apr
-19
TiO2
Source: Bloomberg, PL
Exhibit 5: PFAD prices correct; down 16% YoY & 6.1% QoQ
-4.4%
6.7%28.7%
69.7%
30.3%
3.1%2.7%
-6.9%-15.3%-13.7%-14.6%
-32.2%
-21.4%-16.0%
-40.0%
-20.0%
0.0%
20.0%
40.0%
60.0%
80.0%
Mar
-16
Jun-
16
Sep
-16
Dec
-16
Mar
-17
Jun-
17
Sep
-17
Dec
-17
Mar
-18
Jun-
18
Sep
-18
Dec
-18
Mar
-19
Jun-
19
YoY QoQ
Source: Bloomberg, PL
Exhibit 6: Sugar prices remain range-bound; up 10.4% YoY
3,195
2,200 2,400 2,600 2,800 3,000 3,200 3,400 3,600 3,800 4,000 4,200
Mar
-14
Jul-1
4
Nov
-14
Mar
-15
Jul-1
5
Nov
-15
Mar
-16
Jul-1
6
Nov
-16
Mar
-17
Jul-1
7
Nov
-17
Mar
-18
Jul-1
8
Nov
-18
Mar
-19
(Rs
/ Q
uin
tal)
Source: Bloomberg, PL
Exhibit 7: Mentha prices at high levels despite softening
1900 1800 1800
1500
1380
500
1000
1500
2000
2500
May
-17
Jul-
17
Sep
-17
Nov
-17
Jan-
18
Mar
-18
May
-18
Jul-
18
Sep
-18
Nov
-18
Jan-
19
Mar
-19
May
-19
Mentha
Source: Bloomberg, PL
Exhibit 8: Wheat prices to increase post small correction
1,593
1,565 1,650
1,955
1,768
2,053 2,031
1,400 1,500 1,600 1,700 1,800 1,900 2,000 2,100 2,200 2,300 2,400
Mar
-14
Jun-
14S
ep-1
4D
ec-1
4M
ar-1
5Ju
n-15
Sep
-15
Dec
-15
Mar
-16
Jun-
16S
ep-1
6D
ec-1
6M
ar-1
7Ju
n-17
Sep
-17
Dec
-17
Mar
-18
Jun-
18S
ep-1
8D
ec-1
8M
ar-1
9Ju
n-19
(Rs
/ Q
uin
tal)
Source: Bloomberg, PL

Consumer
July 4, 2019 58
Exhibit 9: Palm Oil decline; down 18.7% YoY & 4.2% QoQ
39,461
44,909
37,164
29,502 32,399
25,000
30,000
35,000
40,000
45,000
50,000
55,000
Feb
-16
Apr
-16
Jun-
16A
ug-1
6O
ct-1
6D
ec-1
6F
eb-1
7A
pr-1
7Ju
n-17
Aug
-17
Oct
-17
Dec
-17
Feb
-18
Apr
-18
Jun-
18A
ug-1
8O
ct-1
8D
ec-1
8F
eb-1
9A
pr-1
9Ju
n-19
(Rs
/ M
T)
Source: Bloomberg, PL
Exhibit 10: Gold prices increase sharply in June; up 4% YoY
31960
33885
24000
26000
28000
30000
32000
34000
36000
Mar
-16
Jun-
16
Sep
-16
Dec
-16
Mar
-17
Jun-
17
Sep
-17
Dec
-17
Mar
-18
Jun-
18
Sep
-18
Dec
-18
Mar
-19
Jun-
19
INR
/10g
m
Source: Bloomberg, PL
Exhibit 11: SMP price up 59.4% in a year; up 33.9% YoY
115.0
103.8103.6
149.0
161.8
8090
100110120130140150160170
Nov
-15
Jan-
16M
ar-1
6M
ay-1
6Ju
l-16
Sep
-16
Nov
-16
Jan-
17M
ar-1
7M
ay-1
7Ju
l-17
Sep
-17
Nov
-17
Jan-
18M
ar-1
8M
ay-1
8Ju
l-18
Sep
-18
Nov
-18
Jan-
19M
ar-1
9M
ay-1
9
(Rs
/ K
g)
Source: Bloomberg, PL
Exhibit 12: Barley price remain at high levels; up 23.4% YoY
1,559
1,467 1,474
1,910 1,947 1,902 1,826
1,200
1,300
1,400
1,500
1,600
1,700
1,800
1,900
2,000
Nov
-16
Jan-
17F
eb-1
7A
pr-1
7M
ay-1
7Ju
l-17
Aug
-17
Oct
-17
Nov
-17
Jan-
18F
eb-1
8A
pr-1
8M
ay-1
8Ju
l-18
Aug
-18
Oct
-18
Nov
-18
Jan-
19F
eb-1
9A
pr-1
9M
ay-1
9
(Rs
/ Q
uin
tal)
Source: Bloomberg, PL
Exhibit 13: APNT, Future retail and TTAN are expected to report healthy volume growth
Volume growth (%) 1QFY18 2QFY18 3QFY18 4QFY18 1QFY19 2QFY19 3QFY19 4QFY19 1QFY20E
Asian Paints 3.0 9.0 7.5 10.5 12.0 11.0 24.0 10.0 9.0
Britannia 2.5 6.0 13.0 13.0 13.0 12.0 7.0 7.0 6.0
Colgate -5.0 -0.9 12.0 4.0 4.0 7.0 7.0 5.0 3.5
Dabur India -4.4 7.2 13.0 7.7 21.0 8.1 12.4 4.3 6.0
GSK Consumer -6.5 2.5 17.0 8.0 12.8 13.7 9.6 6.5 6.0
ITC (Cigarettes) 1.5 -7.0 -5.0 -2.5 1.5 6.0 7.5 7.5 6.5
HUVR 0.0 4.0 11.0 11.0 12.0 10.0 10.0 7.0 5.5
Kansai Nerolac 10.0 18.0 14.5 14.5 15.0 9.0 15.0 4.0 4.0
MRCO - Parachute -9.0 12.0 15.0 -5.0 9.0 8.0 9.0 6.0 7.0
- Saffola -9.0 3.0 0.0 -1.0 10.0 5.0 2.0 18.0 5.0
- Hair Oil -8.0 12.0 8.0 11.0 15.0 5.0 7.0 1.0 5.0
Pidilite (C&B) -0.1 12.0 23.0 14.0 18.0 9.6 10.8 2.5 3.6
Titan - Jewellery 49.0 49.0 6.0 6.0 -3.0 24.0 34.0 15.0 20.0
Jubilant (Dominos) 6.5 5.5 17.8 26.5 26.5 20.5 14.6 6.0 6.0
Future Retail 11.8 10.2 10.4 6.0 3.6 5.9 5.9 11.2 9.0
-Big Bazaar 15.9 13.8 13.1 11.0 10.1 9.4 10.1 13.6 12.0
Source: Company, PL
Consumer
July 4, 2019 59
Top Pick: Jubilant Foodworks and Britannia
We structurally prefer HUVR, Titan and Britannia in the consumer space. However,
given the all-time high P/E valuations of HUVR and Titan, near term upside seems
capped. We prefer Jubilant FoodWorks and Britannia as our top picks at current
valuations.
Jubilant Foodworks: JUBI is on track to sustain steady growth led by 1) 100
Dominos store additions 2) strong consumer value under EDV offerings 3)
sustained menu innovations 4) breakeven in Dunkin Donuts 4) increased focus on
delivery and efficiencies to emerge as a Food Technology company. JUBI is
creating multiple growth levers with Dominos Bangladesh and Hong’s kitchen,
however Dominos will remain cornerstone of profitable growth in medium term. We
expect high single digit SSG and sales growth with Sales, EBIDTA and PAT CAGR
of 17%, 18.6% and 24% over FY19-21. We believe that valuations at 18.1xFY21
EV/ EBIDTA and 32.3xFY21 EPS are at a discount to most consumer names,
despite higher profit growth. We value the stock at 40xFY21 EPS and arrive at
target price of Rs1541 (24% upside).
Britannia: We remain optimistic on demand acceleration and double digit volume
growth led by 1) expected surge in rural demand post interim budget and normal
monsoon forecast 2) targeted 9% contribution from innovations in FY20 (4.5% in
FY19) 3) sustained levers of direct distribution expansion (0.25m addition/year) and
4) higher growth in Hindi heartland. Innovations pipeline remains strong led by 1)
good response to new launches like Treat cream wafers, Winky Cow milk shakes
2) expansion of cakes portfolio in Brownie, Swiss Rolls and layered cakes 3)
maiden entry into salted snacks under Timepass brand 4) launch of Treat croissants
and 5) growth in core segments post launch of Treat stars, Treat bursts, Milk Bikis
Choco cream, Whole Wheat Vita Marie Gold and GoodDay Cashew Almond.
Although volume growth for 2H19 was only 7%, we estimate 17.9% PAT CAGR
over FY19-21 and value the stock at 46xFY21 EPS given robust growth outlook
and strong innovation pipeline. We arrive at a SOTP based target price of Rs3145.

Consumer
July 4, 2019 60
Exhibit 14: Q1FY20 Result Preview
Company Name Q1FY20E Q1FY19 YoY gr. (%) Q4FY19 QoQ gr.
(%) Remark
Asian Paints
Sales 48,381 43,903 10.2 50,182 (3.6)
Decorative paints demand momentum continues. Maintaining margins remains a challenge. We expect 9% volume growth in 1Q.
EBITDA 9,531 8,744 9.0 8,230 15.8
Margin (%) 19.7 19.9 16.4
Adj. PAT 5,812 5,580 4.2 4,731 22.8
Volume Growth (%) 9.0 12.0 10.0
Britannia Industries
Sales 26,594 24,067 10.5 26,681 (0.3) We believe that rural slowdown would impact volume growth due to 40% rural exposure. There are raw material headwinds from next quarter onwards with sugar, milk and wheat prices ramping up. Watch out for new innovations
EBITDA 4,175 3,677 13.5 4,222 (1.1)
Margin (%) 15.7 15.3 15.8
Adj. PAT 2,806 2,462 14.0 2,897 (3.1)
Gross Margin (%) 40.5 39.1 40.9
Volume Growth (%) 6.0 13.0 7.0
Colgate Palmolive
Sales 11,007 10,413 5.7 11,538 (4.6) Demand remains stable QoQ. Competitive activity remains high as Patanjali has been aggressive in Ad-spends. Watch out for toothpaste market share.
EBITDA 2,884 2,816 2.4 3,104 (7.1)
Margin (%) 26.2 27.0 26.9
Adj. PAT 1,612 1,554 3.7 1,815 (11.2)
Volume Growth (%) 3.5 4.0 3.0
Dabur India
Sales 22,263 20,807 7.0 21,282 4.6 Rural slowdown and weak performance of juices on delayed summers and high base would impact volume growth. Competitive intensity in Oral care and Juices remain high.
EBITDA 4,252 3,861 10.1 4,572 (7.0)
Margin (%) 19.1 18.6 21.5
Adj. PAT 3,639 3,300 10.3 4,468 (18.6)
Volume Growth (%) 6.0 21.0 4.3
Avenue Supermarts
Sales 56,500 45,594 23.9 50,334 12.3 We expect significant acceleration in store openings in 1Q. D'Mart is estimated to report 23.9% sales growth and 15.6% PAT growth as the focus on Low Cost Low Price strategy continues.
EBITDA 4,859 4,227 15.0 3,765 29.0
Margin (%) 8.6 9.3 7.5
Adj. PAT 2,897 2,506 15.6 2,029 42.8
Cost of Retail (%) 6.2 6.3 6.9
Number of Stores added 4.0 2.0 12.0
Future Retail
Sales 54,465 45,387 20.0 53,966 0.9 We expect a healthy 12% Big Bazaar SSG growth with stable demand situation. We expect EBITDA margins to expand given improving Hypercity performance. However, EasyDay will still take time to achieve EBITDA breakeven.
EBITDA 3,050 2,208 38.1 2,907 4.9
Margin (%) 5.6 4.9 5.4
Adj. PAT 2,160 1,531 41.1 2,032 6.3
SSG % 9.0 3.6 11.2
Big Bazaar SSG % 12.0 10.1 13.6
Cost of Retail (%) 21.6 22.6 21.4
Emami
Sales 6,350 6,144 3.4 6,396 (0.7) We expect muted volume growth as delayed summers have hampered demand of summer portfolio. We expect gross margins to further decline as Mentha prices continue to remain at elevated levels.
EBITDA 1,174 1,234 (4.9) 1,546 (24.1)
Margin (%) 18.5 20.1 24.2
Adj. PAT 285 267 7.1 560 (49.0)
Volume Growth (%) 2.0 16.0 2.0
Hindustan Unilever
Sales 1,02,934 94,870 8.5 99,450 3.5 We estimate slowdown in rural demand to impact volume growth. Expect moderate margin expansion as crude prices have softened QoQ, food inflation is picking up and recent price increases.
EBITDA 24,807 22,510 10.2 23,210 6.9
Margin (%) 24.1 23.7 23.3
Adj. PAT 17,310 15,670 10.5 15,900 8.9
Volume Growth (%) 5.5 12.0 7.0
ITC
Sales 1,20,000 1,07,070 12.1 1,19,921 0.1
We estimate healthy cigarette volume growth on demand momentum and low base. Price increases in select brands is expected to improve profitability. FMCG business is picking up growth momentum.
EBITDA 46,500 42,021 10.7 45,717 1.7
Margin (%) 38.8 39.2 38.1
Adj. PAT 31,429 28,187 11.5 34,819 (9.7)
Cigarette Volume Growth (%) 6.5 1.5 7.5
Cigarette EBIT Growth (%) 11.1 8.7 10.0
FMCG EBIT 800 501 1,305
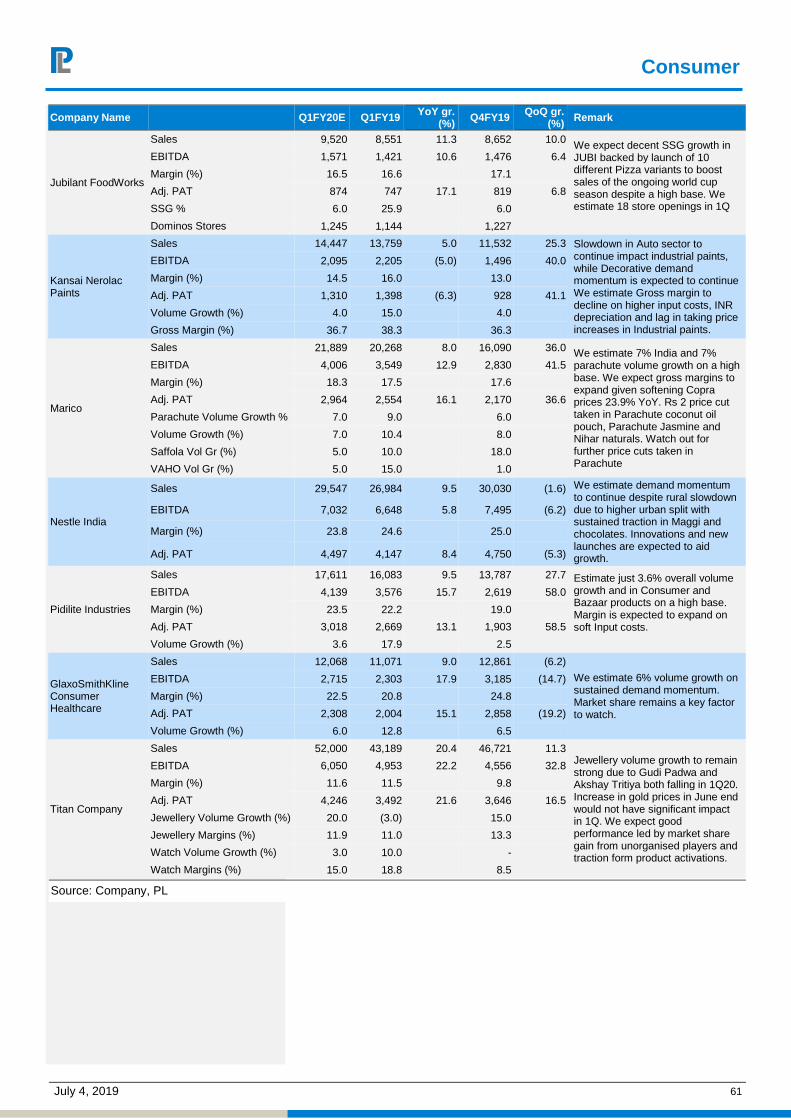
Consumer
July 4, 2019 61
Company Name Q1FY20E Q1FY19 YoY gr. (%) Q4FY19 QoQ gr.
(%) Remark
Jubilant FoodWorks
Sales 9,520 8,551 11.3 8,652 10.0 We expect decent SSG growth in JUBI backed by launch of 10 different Pizza variants to boost sales of the ongoing world cup season despite a high base. We estimate 18 store openings in 1Q
EBITDA 1,571 1,421 10.6 1,476 6.4
Margin (%) 16.5 16.6 17.1
Adj. PAT 874 747 17.1 819 6.8
SSG % 6.0 25.9 6.0
Dominos Stores 1,245 1,144 1,227
Kansai Nerolac Paints
Sales 14,447 13,759 5.0 11,532 25.3 Slowdown in Auto sector to continue impact industrial paints, while Decorative demand momentum is expected to continue We estimate Gross margin to decline on higher input costs, INR depreciation and lag in taking price increases in Industrial paints.
EBITDA 2,095 2,205 (5.0) 1,496 40.0
Margin (%) 14.5 16.0 13.0
Adj. PAT 1,310 1,398 (6.3) 928 41.1
Volume Growth (%) 4.0 15.0 4.0
Gross Margin (%) 36.7 38.3 36.3
Marico
Sales 21,889 20,268 8.0 16,090 36.0 We estimate 7% India and 7% parachute volume growth on a high base. We expect gross margins to expand given softening Copra prices 23.9% YoY. Rs 2 price cut taken in Parachute coconut oil pouch, Parachute Jasmine and Nihar naturals. Watch out for further price cuts taken in Parachute
EBITDA 4,006 3,549 12.9 2,830 41.5
Margin (%) 18.3 17.5 17.6
Adj. PAT 2,964 2,554 16.1 2,170 36.6
Parachute Volume Growth % 7.0 9.0 6.0
Volume Growth (%) 7.0 10.4 8.0
Saffola Vol Gr (%) 5.0 10.0 18.0
VAHO Vol Gr (%) 5.0 15.0 1.0
Nestle India
Sales 29,547 26,984 9.5 30,030 (1.6) We estimate demand momentum to continue despite rural slowdown due to higher urban split with sustained traction in Maggi and chocolates. Innovations and new launches are expected to aid growth.
EBITDA 7,032 6,648 5.8 7,495 (6.2)
Margin (%) 23.8 24.6 25.0
Adj. PAT 4,497 4,147 8.4 4,750 (5.3)
Pidilite Industries
Sales 17,611 16,083 9.5 13,787 27.7 Estimate just 3.6% overall volume growth and in Consumer and Bazaar products on a high base. Margin is expected to expand on soft Input costs.
EBITDA 4,139 3,576 15.7 2,619 58.0
Margin (%) 23.5 22.2 19.0
Adj. PAT 3,018 2,669 13.1 1,903 58.5
Volume Growth (%) 3.6 17.9 2.5
GlaxoSmithKline Consumer Healthcare
Sales 12,068 11,071 9.0 12,861 (6.2)
We estimate 6% volume growth on sustained demand momentum. Market share remains a key factor to watch.
EBITDA 2,715 2,303 17.9 3,185 (14.7)
Margin (%) 22.5 20.8 24.8
Adj. PAT 2,308 2,004 15.1 2,858 (19.2)
Volume Growth (%) 6.0 12.8 6.5
Titan Company
Sales 52,000 43,189 20.4 46,721 11.3 Jewellery volume growth to remain strong due to Gudi Padwa and Akshay Tritiya both falling in 1Q20. Increase in gold prices in June end would not have significant impact in 1Q. We expect good performance led by market share gain from unorganised players and traction form product activations.
EBITDA 6,050 4,953 22.2 4,556 32.8
Margin (%) 11.6 11.5 9.8
Adj. PAT 4,246 3,492 21.6 3,646 16.5
Jewellery Volume Growth (%) 20.0 (3.0) 15.0
Jewellery Margins (%) 11.9 11.0 13.3
Watch Volume Growth (%) 3.0 10.0 -
Watch Margins (%) 15.0 18.8 8.5
Source: Company, PL
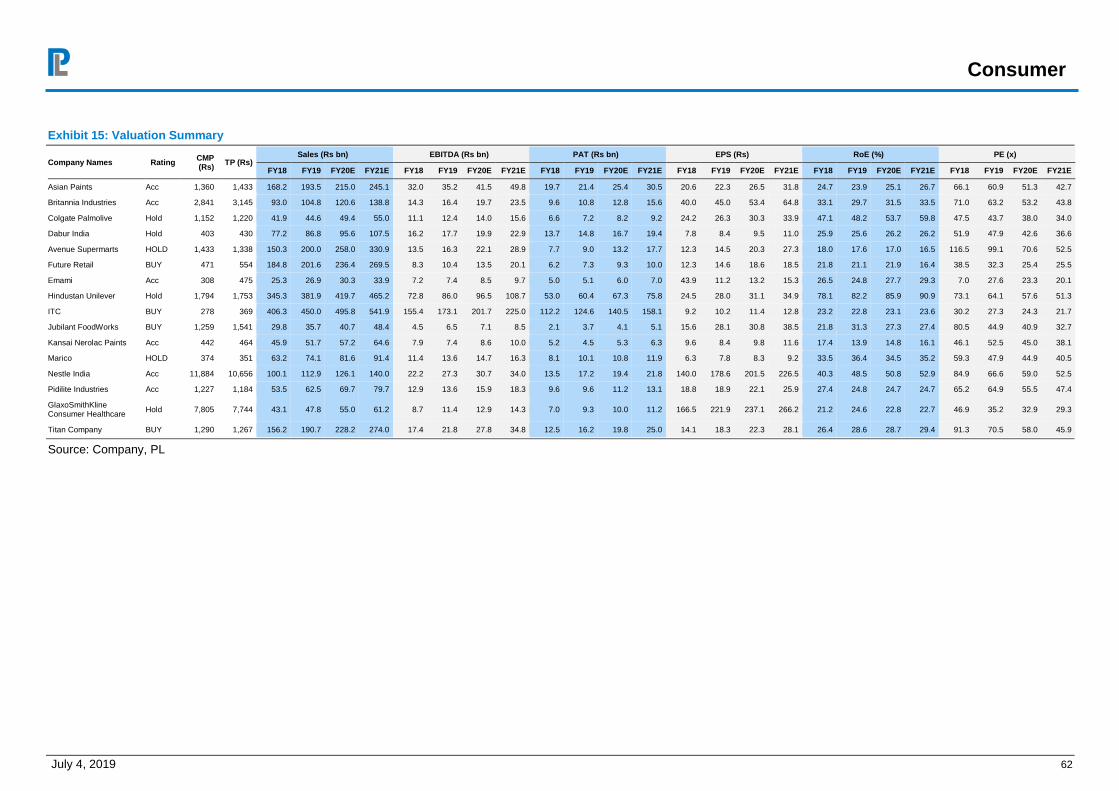
Consumer
July 4, 2019 62
Exhibit 15: Valuation Summary
Company Names Rating CMP (Rs) TP (Rs)
Sales (Rs bn) EBITDA (Rs bn) PAT (Rs bn) EPS (Rs) RoE (%) PE (x)
FY18 FY19 FY20E FY21E FY18 FY19 FY20E FY21E FY18 FY19 FY20E FY21E FY18 FY19 FY20E FY21E FY18 FY19 FY20E FY21E FY18 FY19 FY20E FY21E
Asian Paints Acc 1,360 1,433 168.2 193.5 215.0 245.1 32.0 35.2 41.5 49.8 19.7 21.4 25.4 30.5 20.6 22.3 26.5 31.8 24.7 23.9 25.1 26.7 66.1 60.9 51.3 42.7
Britannia Industries Acc 2,841 3,145 93.0 104.8 120.6 138.8 14.3 16.4 19.7 23.5 9.6 10.8 12.8 15.6 40.0 45.0 53.4 64.8 33.1 29.7 31.5 33.5 71.0 63.2 53.2 43.8
Colgate Palmolive Hold 1,152 1,220 41.9 44.6 49.4 55.0 11.1 12.4 14.0 15.6 6.6 7.2 8.2 9.2 24.2 26.3 30.3 33.9 47.1 48.2 53.7 59.8 47.5 43.7 38.0 34.0
Dabur India Hold 403 430 77.2 86.8 95.6 107.5 16.2 17.7 19.9 22.9 13.7 14.8 16.7 19.4 7.8 8.4 9.5 11.0 25.9 25.6 26.2 26.2 51.9 47.9 42.6 36.6
Avenue Supermarts HOLD 1,433 1,338 150.3 200.0 258.0 330.9 13.5 16.3 22.1 28.9 7.7 9.0 13.2 17.7 12.3 14.5 20.3 27.3 18.0 17.6 17.0 16.5 116.5 99.1 70.6 52.5
Future Retail BUY 471 554 184.8 201.6 236.4 269.5 8.3 10.4 13.5 20.1 6.2 7.3 9.3 10.0 12.3 14.6 18.6 18.5 21.8 21.1 21.9 16.4 38.5 32.3 25.4 25.5
Emami Acc 308 475 25.3 26.9 30.3 33.9 7.2 7.4 8.5 9.7 5.0 5.1 6.0 7.0 43.9 11.2 13.2 15.3 26.5 24.8 27.7 29.3 7.0 27.6 23.3 20.1
Hindustan Unilever Hold 1,794 1,753 345.3 381.9 419.7 465.2 72.8 86.0 96.5 108.7 53.0 60.4 67.3 75.8 24.5 28.0 31.1 34.9 78.1 82.2 85.9 90.9 73.1 64.1 57.6 51.3
ITC BUY 278 369 406.3 450.0 495.8 541.9 155.4 173.1 201.7 225.0 112.2 124.6 140.5 158.1 9.2 10.2 11.4 12.8 23.2 22.8 23.1 23.6 30.2 27.3 24.3 21.7
Jubilant FoodWorks BUY 1,259 1,541 29.8 35.7 40.7 48.4 4.5 6.5 7.1 8.5 2.1 3.7 4.1 5.1 15.6 28.1 30.8 38.5 21.8 31.3 27.3 27.4 80.5 44.9 40.9 32.7
Kansai Nerolac Paints Acc 442 464 45.9 51.7 57.2 64.6 7.9 7.4 8.6 10.0 5.2 4.5 5.3 6.3 9.6 8.4 9.8 11.6 17.4 13.9 14.8 16.1 46.1 52.5 45.0 38.1
Marico HOLD 374 351 63.2 74.1 81.6 91.4 11.4 13.6 14.7 16.3 8.1 10.1 10.8 11.9 6.3 7.8 8.3 9.2 33.5 36.4 34.5 35.2 59.3 47.9 44.9 40.5
Nestle India Acc 11,884 10,656 100.1 112.9 126.1 140.0 22.2 27.3 30.7 34.0 13.5 17.2 19.4 21.8 140.0 178.6 201.5 226.5 40.3 48.5 50.8 52.9 84.9 66.6 59.0 52.5
Pidilite Industries Acc 1,227 1,184 53.5 62.5 69.7 79.7 12.9 13.6 15.9 18.3 9.6 9.6 11.2 13.1 18.8 18.9 22.1 25.9 27.4 24.8 24.7 24.7 65.2 64.9 55.5 47.4
GlaxoSmithKline Consumer Healthcare Hold 7,805 7,744 43.1 47.8 55.0 61.2 8.7 11.4 12.9 14.3 7.0 9.3 10.0 11.2 166.5 221.9 237.1 266.2 21.2 24.6 22.8 22.7 46.9 35.2 32.9 29.3
Titan Company BUY 1,290 1,267 156.2 190.7 228.2 274.0 17.4 21.8 27.8 34.8 12.5 16.2 19.8 25.0 14.1 18.3 22.3 28.1 26.4 28.6 28.7 29.4 91.3 70.5 58.0 45.9
Source: Company, PL

April 5, 2019 63
April 5, 2019
Jinesh Joshi [email protected] | 91-22-66322238
Education Apr-Jun ‘19 Earnings Preview Navneet is expected to be in limelight as it derives ~50-55% of sales in 1Q. Rising
share of exports and syllabus changes in Gujarat & Maharashtra is expected to aid
growth. The company is on track to achieve full year growth guidance of 14-15%
for FY20E.
For S Chand, growth is expected to be tepid in a seasonally lean quarter as focus
has now shifted to cash flow management to improve the working capital cycle.
Nonetheless, system cleansing has already materialized and sales return are
expected to be in line with past trends during the quarter.
Q1FY20 Result Preview
Company Name Q1FY20E Q1FY19 YoY gr. (%) Q4FY19 QoQ gr.
(%) Remark
Navneet Education
Sales 7,353 6,700 9.8 2,455 199.5 Backed by steady growth in publishing aided by syllabus changes in the states of Gujarat & Maharashtra and strong visibility for stationery export orders we expect top-line growth to be in the region of 9.8% in a seasonally strong quarter.
EBITDA 2,213 1,974 12.1 282 684.6
Margin (%) 30.1 29.5 11.5
Adj. PAT 1,436 1,263 13.7 147 876.0
S Chand and Company (Standalone)
Sales 623 577 8.0 4,491 (86.1) Focus on cash flow management and tightening of credit terms is expected to result in single digit top-line growth. Channel cleansing is more or less complete and sales return is expected to be in line with normal business trends (no exceptional returns expected). EBITDA loss is expected to be at Rs371mn in a seasonally lean quarter.
EBITDA -371 -512 NM 1,827 NM
Margin (%) NM NM NM
Adj. PAT -350 -490 NM 1,213 NM
Source: Company, PL

Education
April 5, 2019 64
Valuation Summary
Company Names Rating CMP (Rs) TP (Rs)
Sales (Rs m) EBITDA (Rs m) PAT (Rs m) EPS (Rs) RoE (%) PE (x)
FY18 FY19 FY20E FY21E FY18 FY19 FY20E FY21E FY18 FY19 FY20E FY21E FY18 FY19 FY20E FY21E FY18 FY19 FY20E FY21E FY18 FY19 FY20E FY21E
Navneet Education BUY 108 142 12,040 14,450 16,678 19,017 2,225 2,708 3,277 3,795 1,270 1,528 2,028 2,339 5.4 6.7 8.9 10.2 17.6 19.8 24.0 24.2 19.8 16.2 12.2 10.6
S Chand and Company HOLD 85 125 7,944 5,220 6,159 7,271 1,927 -312 1,232 1,556 1,072 -645 546 748 30.7 -18.4 15.6 21.4 13.1 -6.7 5.7 7.4 2.8 -4.6 5.5 4.0
Source: Company, PL
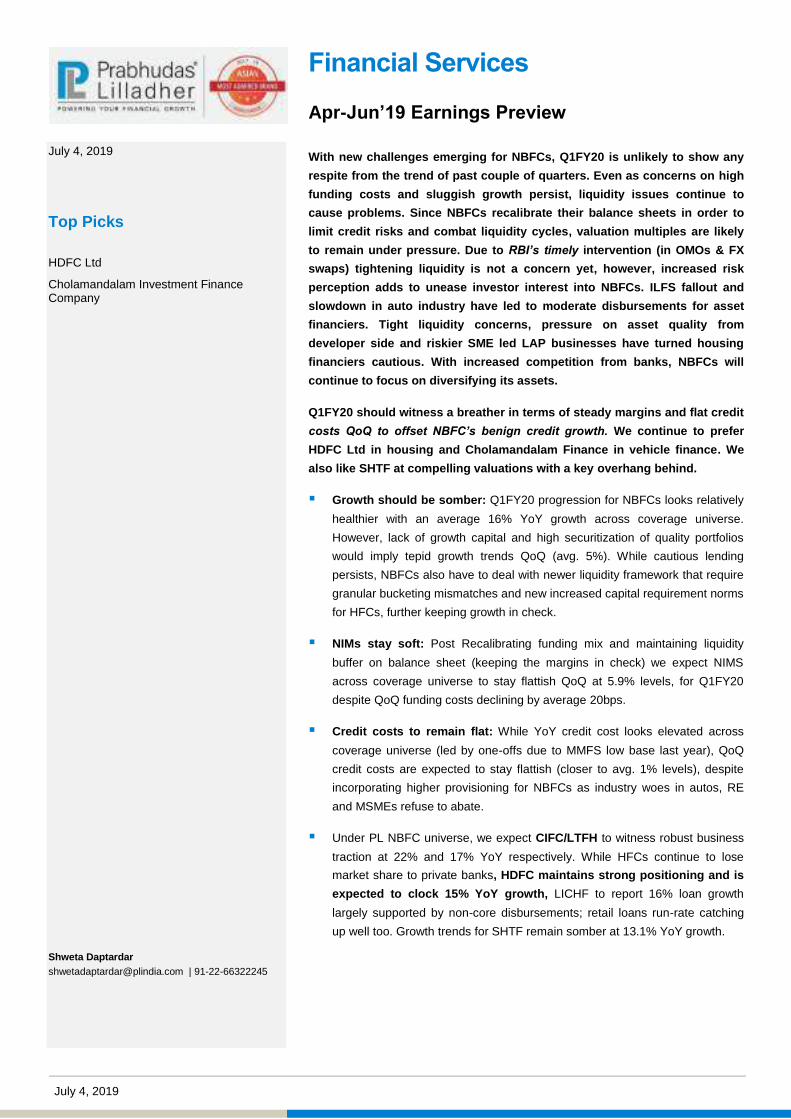
July 4, 2019 65
Financial Services Apr-Jun’19 Earnings Preview With new challenges emerging for NBFCs, Q1FY20 is unlikely to show any
respite from the trend of past couple of quarters. Even as concerns on high
funding costs and sluggish growth persist, liquidity issues continue to
cause problems. Since NBFCs recalibrate their balance sheets in order to
limit credit risks and combat liquidity cycles, valuation multiples are likely
to remain under pressure. Due to RBI’s timely intervention (in OMOs & FX
swaps) tightening liquidity is not a concern yet, however, increased risk
perception adds to unease investor interest into NBFCs. ILFS fallout and
slowdown in auto industry have led to moderate disbursements for asset
financiers. Tight liquidity concerns, pressure on asset quality from
developer side and riskier SME led LAP businesses have turned housing
financiers cautious. With increased competition from banks, NBFCs will
continue to focus on diversifying its assets.
Q1FY20 should witness a breather in terms of steady margins and flat credit
costs QoQ to offset NBFC’s benign credit growth. We continue to prefer
HDFC Ltd in housing and Cholamandalam Finance in vehicle finance. We
also like SHTF at compelling valuations with a key overhang behind.
Growth should be somber: Q1FY20 progression for NBFCs looks relatively
healthier with an average 16% YoY growth across coverage universe.
However, lack of growth capital and high securitization of quality portfolios
would imply tepid growth trends QoQ (avg. 5%). While cautious lending
persists, NBFCs also have to deal with newer liquidity framework that require
granular bucketing mismatches and new increased capital requirement norms
for HFCs, further keeping growth in check.
NIMs stay soft: Post Recalibrating funding mix and maintaining liquidity
buffer on balance sheet (keeping the margins in check) we expect NIMS
across coverage universe to stay flattish QoQ at 5.9% levels, for Q1FY20
despite QoQ funding costs declining by average 20bps.
Credit costs to remain flat: While YoY credit cost looks elevated across
coverage universe (led by one-offs due to MMFS low base last year), QoQ
credit costs are expected to stay flattish (closer to avg. 1% levels), despite
incorporating higher provisioning for NBFCs as industry woes in autos, RE
and MSMEs refuse to abate.
Under PL NBFC universe, we expect CIFC/LTFH to witness robust business
traction at 22% and 17% YoY respectively. While HFCs continue to lose
market share to private banks, HDFC maintains strong positioning and is
expected to clock 15% YoY growth, LICHF to report 16% loan growth
largely supported by non-core disbursements; retail loans run-rate catching
up well too. Growth trends for SHTF remain somber at 13.1% YoY growth.
July 4, 2019
Top Picks
HDFC Ltd
Cholamandalam Investment Finance Company
Shweta Daptardar [email protected] | 91-22-66322245
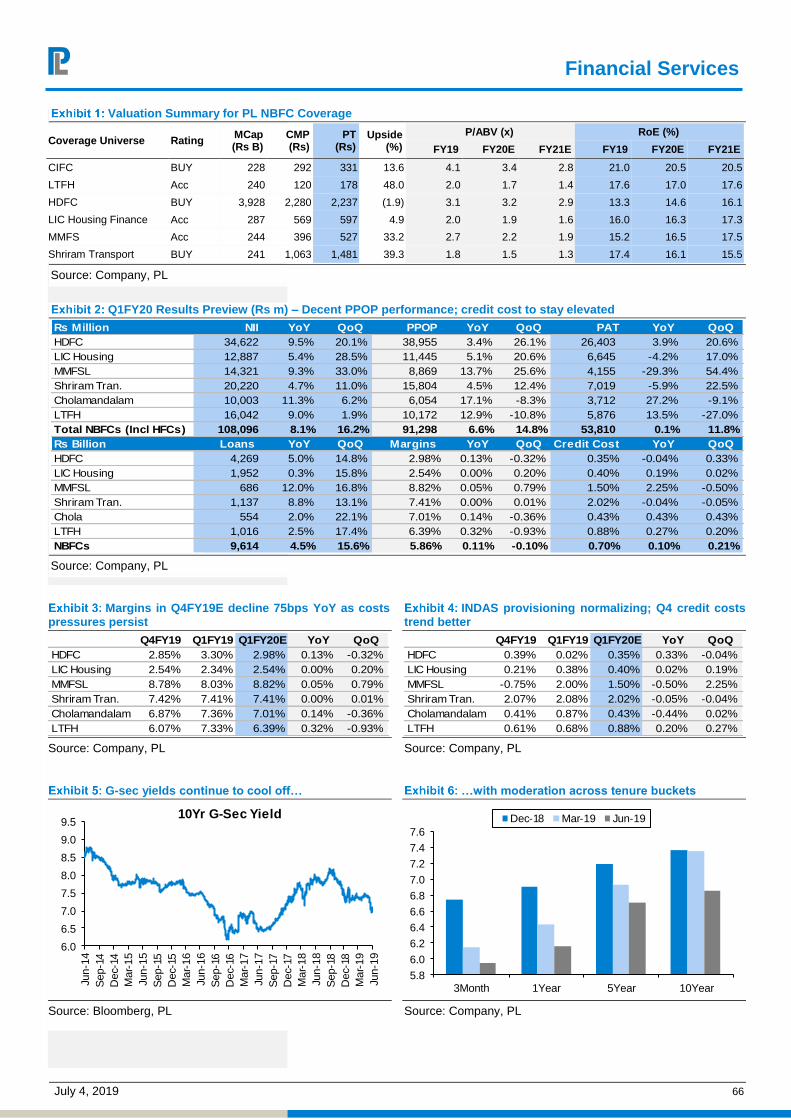
Financial Services
July 4, 2019 66
Valuation Summary for PL NBFC Coverage
Coverage Universe Rating MCap (Rs B)
CMP (Rs)
PT (Rs)
Upside (%)
P/ABV (x) RoE (%)
FY19 FY20E FY21E FY19 FY20E FY21E
CIFC BUY 228 292 331 13.6 4.1 3.4 2.8 21.0 20.5 20.5
LTFH Acc 240 120 178 48.0 2.0 1.7 1.4 17.6 17.0 17.6
HDFC BUY 3,928 2,280 2,237 (1.9) 3.1 3.2 2.9 13.3 14.6 16.1
LIC Housing Finance Acc 287 569 597 4.9 2.0 1.9 1.6 16.0 16.3 17.3
MMFS Acc 244 396 527 33.2 2.7 2.2 1.9 15.2 16.5 17.5
Shriram Transport BUY 241 1,063 1,481 39.3 1.8 1.5 1.3 17.4 16.1 15.5
Source: Company, PL
Q1FY20 Results Preview (Rs m) – Decent PPOP performance; credit cost to stay elevated Rs Million NII YoY QoQ PPOP YoY QoQ PAT YoY QoQHDFC 34,622 9.5% 20.1% 38,955 3.4% 26.1% 26,403 3.9% 20.6%LIC Housing 12,887 5.4% 28.5% 11,445 5.1% 20.6% 6,645 -4.2% 17.0%MMFSL 14,321 9.3% 33.0% 8,869 13.7% 25.6% 4,155 -29.3% 54.4%Shriram Tran. 20,220 4.7% 11.0% 15,804 4.5% 12.4% 7,019 -5.9% 22.5%Cholamandalam 10,003 11.3% 6.2% 6,054 17.1% -8.3% 3,712 27.2% -9.1%LTFH 16,042 9.0% 1.9% 10,172 12.9% -10.8% 5,876 13.5% -27.0%Total NBFCs (Incl HFCs) 108,096 8.1% 16.2% 91,298 6.6% 14.8% 53,810 0.1% 11.8%Rs Billion Loans YoY QoQ Margins YoY QoQ Credit Cost YoY QoQHDFC 4,269 5.0% 14.8% 2.98% 0.13% -0.32% 0.35% -0.04% 0.33%LIC Housing 1,952 0.3% 15.8% 2.54% 0.00% 0.20% 0.40% 0.19% 0.02%MMFSL 686 12.0% 16.8% 8.82% 0.05% 0.79% 1.50% 2.25% -0.50%Shriram Tran. 1,137 8.8% 13.1% 7.41% 0.00% 0.01% 2.02% -0.04% -0.05%Chola 554 2.0% 22.1% 7.01% 0.14% -0.36% 0.43% 0.43% 0.43%LTFH 1,016 2.5% 17.4% 6.39% 0.32% -0.93% 0.88% 0.27% 0.20%NBFCs 9,614 4.5% 15.6% 5.86% 0.11% -0.10% 0.70% 0.10% 0.21% Source: Company, PL
Margins in Q4FY19E decline 75bps YoY as costs pressures persist
Q4FY19 Q1FY19 Q1FY20E YoY QoQHDFC 2.85% 3.30% 2.98% 0.13% -0.32%LIC Housing 2.54% 2.34% 2.54% 0.00% 0.20%MMFSL 8.78% 8.03% 8.82% 0.05% 0.79%Shriram Tran. 7.42% 7.41% 7.41% 0.00% 0.01%Cholamandalam 6.87% 7.36% 7.01% 0.14% -0.36%LTFH 6.07% 7.33% 6.39% 0.32% -0.93% Source: Company, PL
INDAS provisioning normalizing; Q4 credit costs trend better
Q4FY19 Q1FY19 Q1FY20E YoY QoQHDFC 0.39% 0.02% 0.35% 0.33% -0.04%LIC Housing 0.21% 0.38% 0.40% 0.02% 0.19%MMFSL -0.75% 2.00% 1.50% -0.50% 2.25%Shriram Tran. 2.07% 2.08% 2.02% -0.05% -0.04%Cholamandalam 0.41% 0.87% 0.43% -0.44% 0.02%LTFH 0.61% 0.68% 0.88% 0.20% 0.27% Source: Company, PL
G-sec yields continue to cool off…
6.0
6.5
7.0
7.5
8.0
8.5
9.0
9.5
Jun-
14S
ep-1
4D
ec-1
4M
ar-1
5Ju
n-15
Sep
-15
Dec
-15
Mar
-16
Jun-
16S
ep-1
6D
ec-1
6M
ar-1
7Ju
n-17
Sep
-17
Dec
-17
Mar
-18
Jun-
18S
ep-1
8D
ec-1
8M
ar-1
9Ju
n-19
10Yr G-Sec Yield
Source: Bloomberg, PL
…with moderation across tenure buckets
5.8
6.0
6.2
6.4
6.6
6.8
7.0
7.2
7.4
7.6
3Month 1Year 5Year 10Year
Dec-18 Mar-19 Jun-19
Source: Company, PL

Financial Services
July 4, 2019 67
RBI turning accommodative; cut 75bps from Jan’19
4.55.05.56.06.57.07.58.08.59.09.5
Jun-0
6D
ec-0
6Ju
n-0
7D
ec-0
7Ju
n-0
8D
ec-0
8Ju
n-0
9D
ec-0
9Ju
n-1
0D
ec-1
0Ju
n-1
1D
ec-1
1Ju
n-1
2D
ec-1
2Ju
n-1
3D
ec-1
3Ju
n-1
4D
ec-1
4Ju
n-1
5D
ec-1
5Ju
n-1
6D
ec-1
6Ju
n-1
7D
ec-1
7Ju
n-1
8D
ec-1
8Ju
n-1
9
(%)
Movement in Repo Rate
Source: Bloomberg, PL
RBI extracting liquidity from banks
(3,000)
(2,500)
(2,000)
(1,500)
(1,000)
(500)
-
500
1,000
Jun-
17
Sep
-17
Dec
-17
Mar
-18
Jun-
18
Sep
-18
Dec
-18
Mar
-19
Jun-
19
Net Liquidity (Rs Bn)
Source: Bloomberg, PL
Driven by reverse repos
-
3
6
9
12
Jun-
17
Sep
-17
Dec
-17
Mar
-18
Jun-
18
Sep
-18
Dec
-18
Mar
-19
Jun-
19
Rs
Tri
llio
n
Repo R-Repo Var Repo Var R-RepoMSF SLF Net OMOs MSS
Source: Bloomberg, PL
Short term rates are easing post NBFC crisis
Source: Bloomberg, PL
6.78
7.73
6.0
6.5
7.0
7.5
8.0
8.5
9.0
9.5
10.0
10.5
Jun-
17
Jul-1
7
Aug
-17
Sep
-17
Oct
-17
Nov
-17
Dec
-17
Jan-
18
Feb
-18
Mar
-18
Apr
-18
May
-18
Jun-
18
Jul-1
8
Aug
-18
Sep
-18
Oct
-18
Nov
-18
Dec
-18
Jan-
19
Feb
-19
Mar
-19
Apr
-19
May
-19
Jun-
19
3 MTH CP 6 MTH CP

Financial Services
July 4, 2019 68
AAA tenure spread contracts as demand of AAA paper shoots up
Source: Bloomberg, PL
…while A tenure spread is giving arbitrage opportunity
Source: Bloomberg, PL
Credit growth slowing as deposit growth moderates
12.5%
9.9%
5.7%
15.1% 12.3%
3%5%7%9%
11%13%15%17%19%21%23%25%
Jun-
12S
ep-1
2D
ec-1
2M
ar-1
3Ju
n-13
Sep
-13
Dec
-13
Mar
-14
Jun-
14S
ep-1
4D
ec-1
4M
ar-1
5Ju
n-15
Sep
-15
Dec
-15
Mar
-16
Jun-
16S
ep-1
6D
ec-1
6M
ar-1
7Ju
n-17
Sep
-17
Dec
-17
Mar
-18
Jun-
18S
ep-1
8D
ec-1
8M
ar-1
9Ju
n-19
Deposit growth Credit growth
Source: Bloomberg, PL Note – Data released upto mid Dec’18
Pvt banks hold up their deposit rates, PSBs are seen more inclined towards rate cut
-0.20
-0.15
-0.10
-0.05
0.00
0.05
0.10
Feb
-16
Apr
-16
Jun-
16A
ug-1
6O
ct-1
6D
ec-1
6F
eb-1
7A
pr-1
7Ju
n-17
Aug
-17
Oct
-17
Dec
-17
Feb
-18
Apr
-18
Jun-
18A
ug-1
8O
ct-1
8D
ec-1
8F
eb-1
9A
pr-1
9
MoM chg in Rupee Term Deposits Rate
SCBs PSBs Pvt Banks
Source: Bloomberg, PL
NBFC crisis has lowered arbitrage between bank market rates and bank rates
-0.2 0.1 0.4 0.7 1.0 1.3 1.6 1.9 2.2 2.5
May
-17
Jul-1
7
Sep
-17
Nov
-17
Jan-
18
Mar
-18
May
-18
Jul-1
8
Sep
-18
Nov
-18
Jan-
19
Mar
-19
May
-19
Diff bet SBI 1Yr MCLR & FIMMDA 1Yr AAA
Diff bet SCB Median - MCLR & FIMMDA 1Yr AAA
Source: Bloomberg, PL
8.86
6.5
7.0
7.5
8.0
8.5
9.0
9.5
10.0
Jun-
16
Sep
-16
Dec
-16
Mar
-17
Jun-
17
Sep
-17
Dec
-17
Mar
-18
Jun-
18
Sep
-18
Dec
-18
Mar
-19
Jun-
19
FIMMDA 3 YR AAA FIMMDA 5 YR AAA
8.34
10.79
8.0
8.5
9.0
9.5
10.0
10.5
11.0
11.5
Jun-
16
Sep
-16
Dec
-16
Mar
-17
Jun-
17
Sep
-17
Dec
-17
Mar
-18
Jun-
18
Sep
-18
Dec
-18
Mar
-19
Jun-
19
FIMMDA 3 YR A FIMMDA 5 YR A

Financial Services
July 4, 2019 69
MCLRs has reduced across banks led by Private banks
Banks MCLR 1YR MCLR 1YR
% Change Dec-18 Mar-19 Jun-19 3Months 6Months
Axis Bank 8.70% 8.75% 8.70% -0.05% 0.00% HDFC Bank 8.85% 8.90% 8.70% -0.20% -0.15% ICICI Bank 8.80% 8.80% 8.75% -0.05% -0.05% KMB 9.00% 9.00% 8.90% -0.10% -0.10% IndusInd Bank 9.80% 9.90% 9.75% -0.15% -0.05% Yes Bank 9.85% 9.70% 9.70% 0.00% -0.15% SBI 8.55% 8.55% 8.45% -0.10% -0.10% Bank of Baroda 8.65% 8.65% 8.70% 0.05% 0.05% Bank of India 8.70% 8.65% 8.65% 0.00% -0.05% Punjab National Bank 8.50% 8.45% 8.45% 0.00% -0.05% Canara Bank 8.70% 8.65% 8.70% 0.05% 0.00% Union Bank 8.70% 8.60% 8.60% 0.00% -0.10% Federal 9.20% 9.20% 9.15% -0.05% -0.05% South Indian Bank 9.45% 9.45% 9.50% 0.05% 0.05% J&K Bank 9.00% 9.00% 8.85% -0.15% -0.15%
Source: Company, PL
MCLRs reduced by most banks across tenors in last quarter
-0.15%
-0.10%
-0.05%
0.00%
0.05%
0.10%
Axis HDFCB ICICIBC IIB KMB Yes SBI BOB
Quarterly Change in MCLRs
ON 1M 3M 6M 1Y
Source: Company, PL
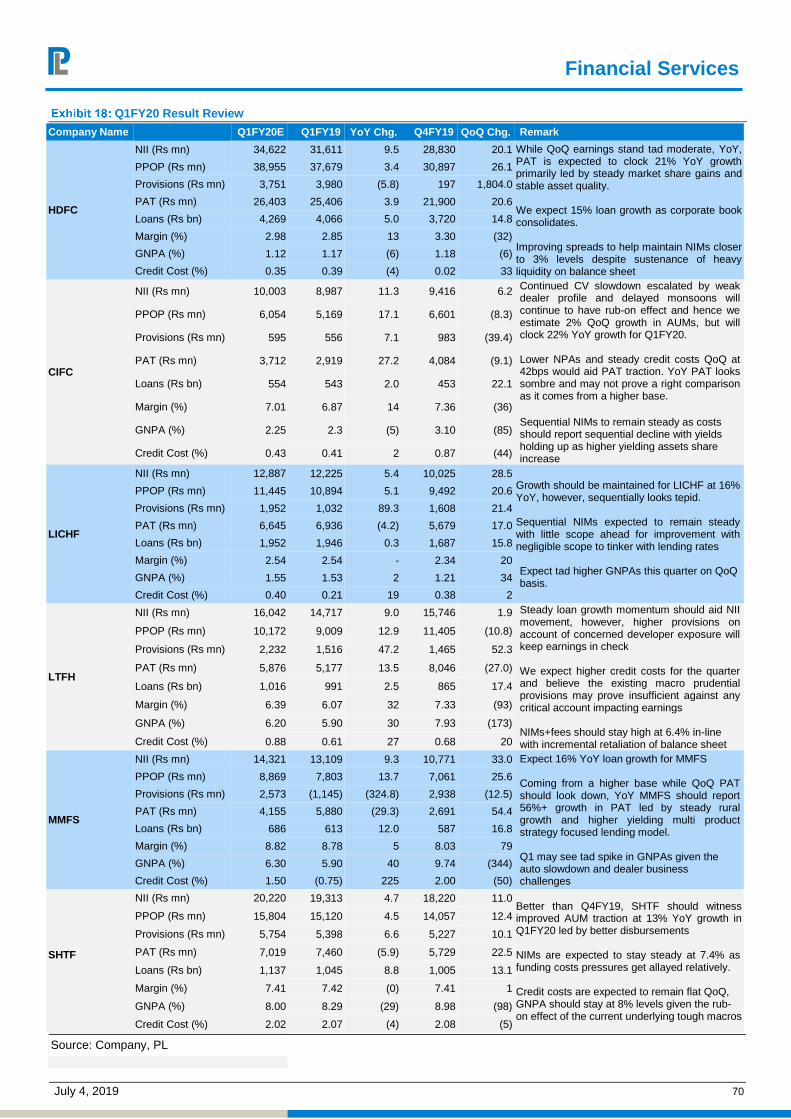
Financial Services
July 4, 2019 70
Q1FY20 Result Review
Company Name Q1FY20E Q1FY19 YoY Chg. Q4FY19 QoQ Chg. Remark
HDFC
NII (Rs mn) 34,622 31,611 9.5 28,830 20.1 While QoQ earnings stand tad moderate, YoY, PAT is expected to clock 21% YoY growth primarily led by steady market share gains and stable asset quality. We expect 15% loan growth as corporate book consolidates. Improving spreads to help maintain NIMs closer to 3% levels despite sustenance of heavy liquidity on balance sheet
PPOP (Rs mn) 38,955 37,679 3.4 30,897 26.1
Provisions (Rs mn) 3,751 3,980 (5.8) 197 1,804.0
PAT (Rs mn) 26,403 25,406 3.9 21,900 20.6
Loans (Rs bn) 4,269 4,066 5.0 3,720 14.8
Margin (%) 2.98 2.85 13 3.30 (32)
GNPA (%) 1.12 1.17 (6) 1.18 (6)
Credit Cost (%) 0.35 0.39 (4) 0.02 33
CIFC
NII (Rs mn) 10,003 8,987 11.3 9,416 6.2 Continued CV slowdown escalated by weak dealer profile and delayed monsoons will continue to have rub-on effect and hence we estimate 2% QoQ growth in AUMs, but will clock 22% YoY growth for Q1FY20. Lower NPAs and steady credit costs QoQ at 42bps would aid PAT traction. YoY PAT looks sombre and may not prove a right comparison as it comes from a higher base. Sequential NIMs to remain steady as costs should report sequential decline with yields holding up as higher yielding assets share increase
PPOP (Rs mn) 6,054 5,169 17.1 6,601 (8.3)
Provisions (Rs mn) 595 556 7.1 983 (39.4)
PAT (Rs mn) 3,712 2,919 27.2 4,084 (9.1)
Loans (Rs bn) 554 543 2.0 453 22.1
Margin (%) 7.01 6.87 14 7.36 (36)
GNPA (%) 2.25 2.3 (5) 3.10 (85)
Credit Cost (%) 0.43 0.41 2 0.87 (44)
LICHF
NII (Rs mn) 12,887 12,225 5.4 10,025 28.5 Growth should be maintained for LICHF at 16% YoY, however, sequentially looks tepid. Sequential NIMs expected to remain steady with little scope ahead for improvement with negligible scope to tinker with lending rates Expect tad higher GNPAs this quarter on QoQ basis.
PPOP (Rs mn) 11,445 10,894 5.1 9,492 20.6
Provisions (Rs mn) 1,952 1,032 89.3 1,608 21.4
PAT (Rs mn) 6,645 6,936 (4.2) 5,679 17.0
Loans (Rs bn) 1,952 1,946 0.3 1,687 15.8
Margin (%) 2.54 2.54 - 2.34 20
GNPA (%) 1.55 1.53 2 1.21 34
Credit Cost (%) 0.40 0.21 19 0.38 2
LTFH
NII (Rs mn) 16,042 14,717 9.0 15,746 1.9 Steady loan growth momentum should aid NII movement, however, higher provisions on account of concerned developer exposure will keep earnings in check We expect higher credit costs for the quarter and believe the existing macro prudential provisions may prove insufficient against any critical account impacting earnings NIMs+fees should stay high at 6.4% in-line with incremental retaliation of balance sheet
PPOP (Rs mn) 10,172 9,009 12.9 11,405 (10.8)
Provisions (Rs mn) 2,232 1,516 47.2 1,465 52.3
PAT (Rs mn) 5,876 5,177 13.5 8,046 (27.0)
Loans (Rs bn) 1,016 991 2.5 865 17.4
Margin (%) 6.39 6.07 32 7.33 (93)
GNPA (%) 6.20 5.90 30 7.93 (173)
Credit Cost (%) 0.88 0.61 27 0.68 20
MMFS
NII (Rs mn) 14,321 13,109 9.3 10,771 33.0 Expect 16% YoY loan growth for MMFS Coming from a higher base while QoQ PAT should look down, YoY MMFS should report 56%+ growth in PAT led by steady rural growth and higher yielding multi product strategy focused lending model. Q1 may see tad spike in GNPAs given the auto slowdown and dealer business challenges
PPOP (Rs mn) 8,869 7,803 13.7 7,061 25.6
Provisions (Rs mn) 2,573 (1,145) (324.8) 2,938 (12.5)
PAT (Rs mn) 4,155 5,880 (29.3) 2,691 54.4
Loans (Rs bn) 686 613 12.0 587 16.8
Margin (%) 8.82 8.78 5 8.03 79
GNPA (%) 6.30 5.90 40 9.74 (344)
Credit Cost (%) 1.50 (0.75) 225 2.00 (50)
SHTF
NII (Rs mn) 20,220 19,313 4.7 18,220 11.0 Better than Q4FY19, SHTF should witness improved AUM traction at 13% YoY growth in Q1FY20 led by better disbursements
NIMs are expected to stay steady at 7.4% as funding costs pressures get allayed relatively.
Credit costs are expected to remain flat QoQ, GNPA should stay at 8% levels given the rub-on effect of the current underlying tough macros
PPOP (Rs mn) 15,804 15,120 4.5 14,057 12.4
Provisions (Rs mn) 5,754 5,398 6.6 5,227 10.1
PAT (Rs mn) 7,019 7,460 (5.9) 5,729 22.5
Loans (Rs bn) 1,137 1,045 8.8 1,005 13.1
Margin (%) 7.41 7.42 (0) 7.41 1
GNPA (%) 8.00 8.29 (29) 8.98 (98)
Credit Cost (%) 2.02 2.07 (4) 2.08 (5)
Source: Company, PL

July 4, 2019 88
Information Technology Apr-Jun’19 Earnings Preview We expect Q1FY20E to be a mixed quarter for Indian IT services with TCS &
Infosys likely to post steady revenue growth in tier-1 & Hexaware, Mphasis,
LTTS to post steady revenue growth in tier-2 IT services under our coverage
universe. We expect revenue growth in CC between -0.7%-3.2% QoQ for Tier-
1 IT companies. We expect TCS to deliver 3.2% QoQ CC broad-based growth
across verticals & geographies. We expect Infosys to deliver steady growth
of 2.5% QoQ CC with ~146 bps QoQ decline in margins led by wage hike, H-
1B visa costs & INR appreciation.
We downgrade Tech M from Accumulate to Hold as we believe FY20E growth
prospects for Tech M are not looking exciting due to 1) Delayed spending in
5G due to global trade wars, 2) Slowdown in enterprise business, 3) Margins
at peak levels. We downgrade Wipro from Hold to Reduce as we believe Wipro
will continue to underperform its peers on revenue growth at 4.3-6% for FY20-
21 vs peers of 8-14%. This, along with the uncertainty on revenue growth
justifies the discount to its 5-year mean, only capital allocation strategy was
supporting premium multiples. While Q1 is a seasonally strong quarter for IT
services, we can observe pressure on YoY revenue momentum & there are
headwinds on margins such as 1) Higher onsite costs, 2) Investments in
digital, 3) Rupee advantage is weakening. We have already mentioned in
detail in our IT services sector report (Clouded visibility, Tread cautiously)
about the headwinds of IT sector in FY20E/21E. We continue to prefer only
TCS as our top pick in tier-1 & LTTS in tier-2 IT services.
Mixed growth from tier-1 IT pack: We expect constant currency growth of
3.2%, 2.5%, 1.6%, 1.5% & -0.7% for TCS, Infosys, Wipro, HCLT & Tech M
respectively. We expect Tech M USD revenues to decline by 1% QoQ & CC
revenues to decline by -0.7% QoQ due to weakness in communication
segment. We expect Infosys to post CC revenue growth of 2.5% & cross
currency headwind of 40bps, revenue growth will also be aided by Starter N.V
deal. In HCLT, revenue from the IBM deal to accrue only 2Q onwards. We note
that for Wipro revenue growth will be lower on reported basis due to divestment
of Workday business that impacted revenues by US$9mn.
Muted growth for Tier-II IT companies: In tier-II IT companies – Hexaware,
Mphasis & LTTS are expected to deliver steady revenue growth whereas LTI
Cyient, MTCL may post flat revenue growth. In LTI, growth momentum is
impacted by one of its big client in BFS vertical based in US capital markets.
We expect MTCL to post weak deal wins and soft TCV as uncertainty arising
from LTI deal will delay client decisions.
Pressure on margins across the pack: Wage hike, visa costs & INR
appreciation to erode margins across our coverage. Amongst large caps, we
expect Infosys, Tech M & HCLT margins to erode by 146bps, 256bps & 151bps
QoQ respectively. Transition costs of large deals won in past 3-4 quarters may
continue to put pressure on margins of Infosys, HCLT & Tech M. We expect
companies to guide cautiously on FY20E margins.
July 4, 2019
Top Picks
Tata Consultancy Services
L&T Technology Services
Aniket Pande [email protected] | 91-22-66322300
Rajat Gandhi [email protected] | 91-22-66322246
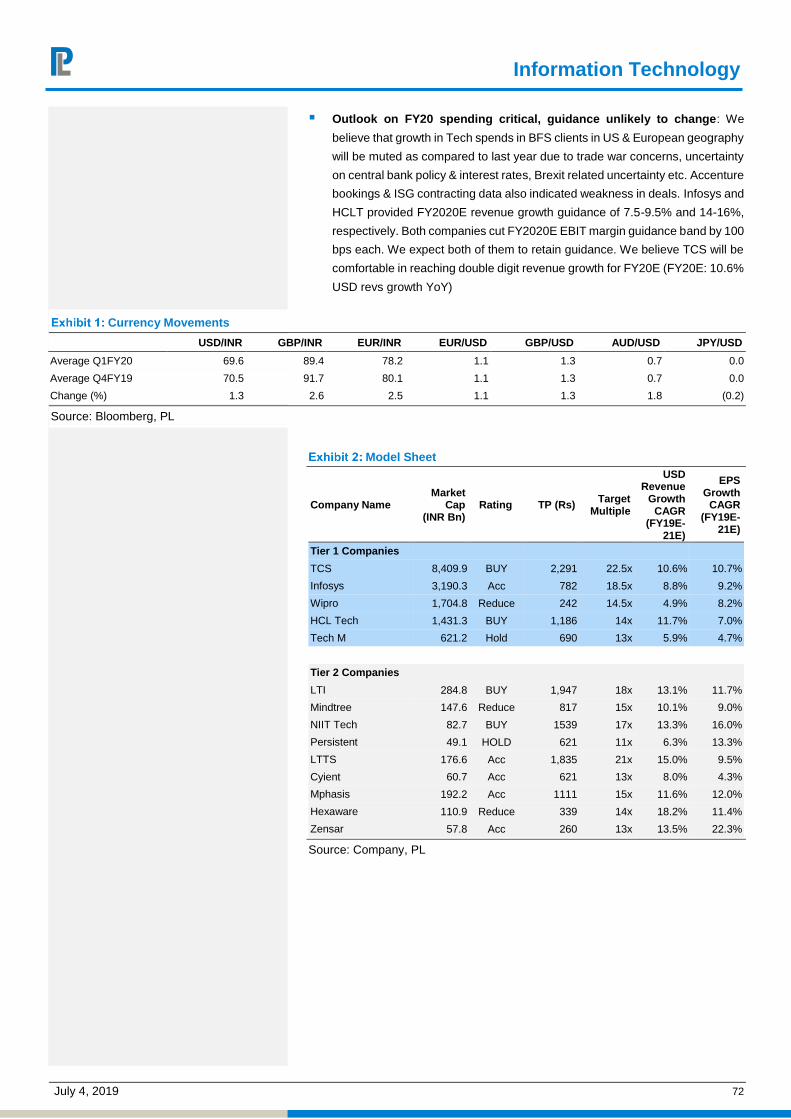
Information Technology
July 4, 2019 72
Outlook on FY20 spending critical, guidance unlikely to change: We
believe that growth in Tech spends in BFS clients in US & European geography
will be muted as compared to last year due to trade war concerns, uncertainty
on central bank policy & interest rates, Brexit related uncertainty etc. Accenture
bookings & ISG contracting data also indicated weakness in deals. Infosys and
HCLT provided FY2020E revenue growth guidance of 7.5-9.5% and 14-16%,
respectively. Both companies cut FY2020E EBIT margin guidance band by 100
bps each. We expect both of them to retain guidance. We believe TCS will be
comfortable in reaching double digit revenue growth for FY20E (FY20E: 10.6%
USD revs growth YoY)
Currency Movements
USD/INR GBP/INR EUR/INR EUR/USD GBP/USD AUD/USD JPY/USD
Average Q1FY20 69.6 89.4 78.2 1.1 1.3 0.7 0.0
Average Q4FY19 70.5 91.7 80.1 1.1 1.3 0.7 0.0
Change (%) 1.3 2.6 2.5 1.1 1.3 1.8 (0.2)
Source: Bloomberg, PL
Model Sheet
Company Name Market
Cap (INR Bn)
Rating TP (Rs) Target Multiple
USD Revenue
Growth CAGR
(FY19E-21E)
EPS Growth
CAGR (FY19E-
21E)
Tier 1 Companies
TCS 8,409.9 BUY 2,291 22.5x 10.6% 10.7%
Infosys 3,190.3 Acc 782 18.5x 8.8% 9.2%
Wipro 1,704.8 Reduce 242 14.5x 4.9% 8.2%
HCL Tech 1,431.3 BUY 1,186 14x 11.7% 7.0%
Tech M 621.2 Hold 690 13x 5.9% 4.7%
Tier 2 Companies
LTI 284.8 BUY 1,947 18x 13.1% 11.7%
Mindtree 147.6 Reduce 817 15x 10.1% 9.0%
NIIT Tech 82.7 BUY 1539 17x 13.3% 16.0%
Persistent 49.1 HOLD 621 11x 6.3% 13.3%
LTTS 176.6 Acc 1,835 21x 15.0% 9.5%
Cyient 60.7 Acc 621 13x 8.0% 4.3%
Mphasis 192.2 Acc 1111 15x 11.6% 12.0%
Hexaware 110.9 Reduce 339 14x 18.2% 11.4%
Zensar 57.8 Acc 260 13x 13.5% 22.3%
Source: Company, PL
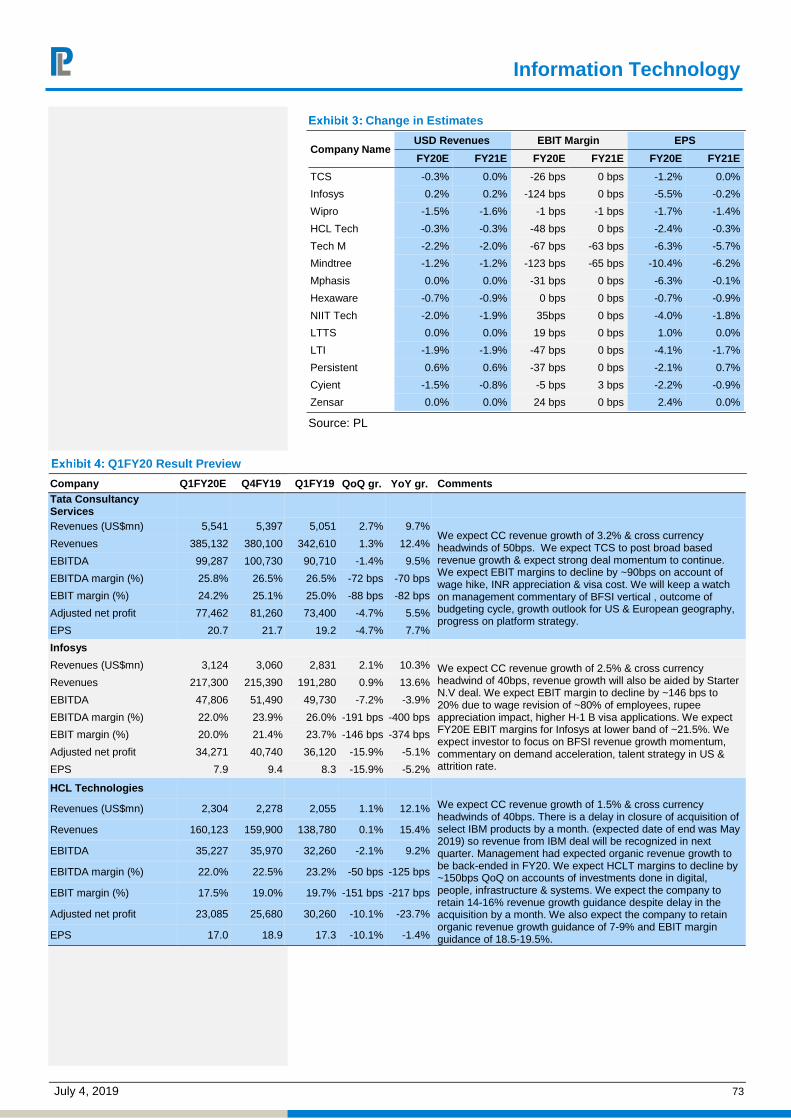
Information Technology
July 4, 2019 73
Change in Estimates
Company Name USD Revenues EBIT Margin EPS
FY20E FY21E FY20E FY21E FY20E FY21E
TCS -0.3% 0.0% -26 bps 0 bps -1.2% 0.0%
Infosys 0.2% 0.2% -124 bps 0 bps -5.5% -0.2%
Wipro -1.5% -1.6% -1 bps -1 bps -1.7% -1.4%
HCL Tech -0.3% -0.3% -48 bps 0 bps -2.4% -0.3%
Tech M -2.2% -2.0% -67 bps -63 bps -6.3% -5.7%
Mindtree -1.2% -1.2% -123 bps -65 bps -10.4% -6.2%
Mphasis 0.0% 0.0% -31 bps 0 bps -6.3% -0.1%
Hexaware -0.7% -0.9% 0 bps 0 bps -0.7% -0.9%
NIIT Tech -2.0% -1.9% 35bps 0 bps -4.0% -1.8%
LTTS 0.0% 0.0% 19 bps 0 bps 1.0% 0.0%
LTI -1.9% -1.9% -47 bps 0 bps -4.1% -1.7%
Persistent 0.6% 0.6% -37 bps 0 bps -2.1% 0.7%
Cyient -1.5% -0.8% -5 bps 3 bps -2.2% -0.9%
Zensar 0.0% 0.0% 24 bps 0 bps 2.4% 0.0%
Source: PL
Q1FY20 Result Preview
Company Q1FY20E Q4FY19 Q1FY19 QoQ gr. YoY gr. Comments Tata Consultancy Services
Revenues (US$mn) 5,541 5,397 5,051 2.7% 9.7% We expect CC revenue growth of 3.2% & cross currency headwinds of 50bps. We expect TCS to post broad based revenue growth & expect strong deal momentum to continue. We expect EBIT margins to decline by ~90bps on account of wage hike, INR appreciation & visa cost. We will keep a watch on management commentary of BFSI vertical , outcome of budgeting cycle, growth outlook for US & European geography, progress on platform strategy.
Revenues 385,132 380,100 342,610 1.3% 12.4%
EBITDA 99,287 100,730 90,710 -1.4% 9.5%
EBITDA margin (%) 25.8% 26.5% 26.5% -72 bps -70 bps
EBIT margin (%) 24.2% 25.1% 25.0% -88 bps -82 bps
Adjusted net profit 77,462 81,260 73,400 -4.7% 5.5%
EPS 20.7 21.7 19.2 -4.7% 7.7%
Infosys
Revenues (US$mn) 3,124 3,060 2,831 2.1% 10.3% We expect CC revenue growth of 2.5% & cross currency headwind of 40bps, revenue growth will also be aided by Starter N.V deal. We expect EBIT margin to decline by ~146 bps to 20% due to wage revision of ~80% of employees, rupee appreciation impact, higher H-1 B visa applications. We expect FY20E EBIT margins for Infosys at lower band of ~21.5%. We expect investor to focus on BFSI revenue growth momentum, commentary on demand acceleration, talent strategy in US & attrition rate.
Revenues 217,300 215,390 191,280 0.9% 13.6%
EBITDA 47,806 51,490 49,730 -7.2% -3.9%
EBITDA margin (%) 22.0% 23.9% 26.0% -191 bps -400 bps
EBIT margin (%) 20.0% 21.4% 23.7% -146 bps -374 bps
Adjusted net profit 34,271 40,740 36,120 -15.9% -5.1%
EPS 7.9 9.4 8.3 -15.9% -5.2%
HCL Technologies
Revenues (US$mn) 2,304 2,278 2,055 1.1% 12.1% We expect CC revenue growth of 1.5% & cross currency headwinds of 40bps. There is a delay in closure of acquisition of select IBM products by a month. (expected date of end was May 2019) so revenue from IBM deal will be recognized in next quarter. Management had expected organic revenue growth to be back-ended in FY20. We expect HCLT margins to decline by ~150bps QoQ on accounts of investments done in digital, people, infrastructure & systems. We expect the company to retain 14-16% revenue growth guidance despite delay in the acquisition by a month. We also expect the company to retain organic revenue growth guidance of 7-9% and EBIT margin guidance of 18.5-19.5%.
Revenues 160,123 159,900 138,780 0.1% 15.4%
EBITDA 35,227 35,970 32,260 -2.1% 9.2%
EBITDA margin (%) 22.0% 22.5% 23.2% -50 bps -125 bps
EBIT margin (%) 17.5% 19.0% 19.7% -151 bps -217 bps
Adjusted net profit 23,085 25,680 30,260 -10.1% -23.7%
EPS 17.0 18.9 17.3 -10.1% -1.4%
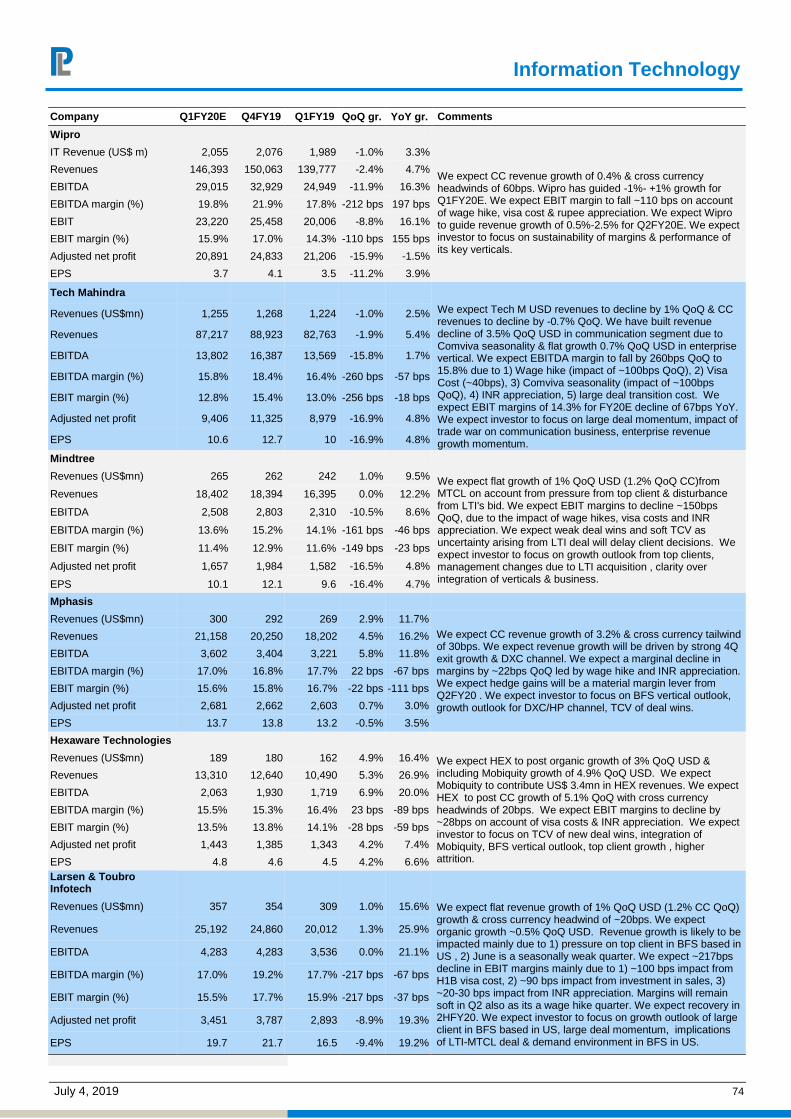
Information Technology
July 4, 2019 74
Company Q1FY20E Q4FY19 Q1FY19 QoQ gr. YoY gr. Comments
Wipro
IT Revenue (US$ m) 2,055 2,076 1,989 -1.0% 3.3%
We expect CC revenue growth of 0.4% & cross currency headwinds of 60bps. Wipro has guided -1%- +1% growth for Q1FY20E. We expect EBIT margin to fall ~110 bps on account of wage hike, visa cost & rupee appreciation. We expect Wipro to guide revenue growth of 0.5%-2.5% for Q2FY20E. We expect investor to focus on sustainability of margins & performance of its key verticals.
Revenues 146,393 150,063 139,777 -2.4% 4.7%
EBITDA 29,015 32,929 24,949 -11.9% 16.3%
EBITDA margin (%) 19.8% 21.9% 17.8% -212 bps 197 bps
EBIT 23,220 25,458 20,006 -8.8% 16.1%
EBIT margin (%) 15.9% 17.0% 14.3% -110 bps 155 bps
Adjusted net profit 20,891 24,833 21,206 -15.9% -1.5%
EPS 3.7 4.1 3.5 -11.2% 3.9%
Tech Mahindra
Revenues (US$mn) 1,255 1,268 1,224 -1.0% 2.5% We expect Tech M USD revenues to decline by 1% QoQ & CC revenues to decline by -0.7% QoQ. We have built revenue decline of 3.5% QoQ USD in communication segment due to Comviva seasonality & flat growth 0.7% QoQ USD in enterprise vertical. We expect EBITDA margin to fall by 260bps QoQ to 15.8% due to 1) Wage hike (impact of ~100bps QoQ), 2) Visa Cost (~40bps), 3) Comviva seasonality (impact of ~100bps QoQ), 4) INR appreciation, 5) large deal transition cost. We expect EBIT margins of 14.3% for FY20E decline of 67bps YoY. We expect investor to focus on large deal momentum, impact of trade war on communication business, enterprise revenue growth momentum.
Revenues 87,217 88,923 82,763 -1.9% 5.4%
EBITDA 13,802 16,387 13,569 -15.8% 1.7%
EBITDA margin (%) 15.8% 18.4% 16.4% -260 bps -57 bps
EBIT margin (%) 12.8% 15.4% 13.0% -256 bps -18 bps
Adjusted net profit 9,406 11,325 8,979 -16.9% 4.8%
EPS 10.6 12.7 10 -16.9% 4.8%
Mindtree
Revenues (US$mn) 265 262 242 1.0% 9.5% We expect flat growth of 1% QoQ USD (1.2% QoQ CC)from MTCL on account from pressure from top client & disturbance from LTI's bid. We expect EBIT margins to decline ~150bps QoQ, due to the impact of wage hikes, visa costs and INR appreciation. We expect weak deal wins and soft TCV as uncertainty arising from LTI deal will delay client decisions. We expect investor to focus on growth outlook from top clients, management changes due to LTI acquisition , clarity over integration of verticals & business.
Revenues 18,402 18,394 16,395 0.0% 12.2%
EBITDA 2,508 2,803 2,310 -10.5% 8.6%
EBITDA margin (%) 13.6% 15.2% 14.1% -161 bps -46 bps
EBIT margin (%) 11.4% 12.9% 11.6% -149 bps -23 bps
Adjusted net profit 1,657 1,984 1,582 -16.5% 4.8%
EPS 10.1 12.1 9.6 -16.4% 4.7%
Mphasis
Revenues (US$mn) 300 292 269 2.9% 11.7% We expect CC revenue growth of 3.2% & cross currency tailwind of 30bps. We expect revenue growth will be driven by strong 4Q exit growth & DXC channel. We expect a marginal decline in margins by ~22bps QoQ led by wage hike and INR appreciation. We expect hedge gains will be a material margin lever from Q2FY20 . We expect investor to focus on BFS vertical outlook, growth outlook for DXC/HP channel, TCV of deal wins.
Revenues 21,158 20,250 18,202 4.5% 16.2%
EBITDA 3,602 3,404 3,221 5.8% 11.8%
EBITDA margin (%) 17.0% 16.8% 17.7% 22 bps -67 bps
EBIT margin (%) 15.6% 15.8% 16.7% -22 bps -111 bps
Adjusted net profit 2,681 2,662 2,603 0.7% 3.0%
EPS 13.7 13.8 13.2 -0.5% 3.5%
Hexaware Technologies
Revenues (US$mn) 189 180 162 4.9% 16.4% We expect HEX to post organic growth of 3% QoQ USD & including Mobiquity growth of 4.9% QoQ USD. We expect Mobiquity to contribute US$ 3.4mn in HEX revenues. We expect HEX to post CC growth of 5.1% QoQ with cross currency headwinds of 20bps. We expect EBIT margins to decline by ~28bps on account of visa costs & INR appreciation. We expect investor to focus on TCV of new deal wins, integration of Mobiquity, BFS vertical outlook, top client growth , higher attrition.
Revenues 13,310 12,640 10,490 5.3% 26.9%
EBITDA 2,063 1,930 1,719 6.9% 20.0%
EBITDA margin (%) 15.5% 15.3% 16.4% 23 bps -89 bps
EBIT margin (%) 13.5% 13.8% 14.1% -28 bps -59 bps
Adjusted net profit 1,443 1,385 1,343 4.2% 7.4%
EPS 4.8 4.6 4.5 4.2% 6.6% Larsen & Toubro Infotech
Revenues (US$mn) 357 354 309 1.0% 15.6% We expect flat revenue growth of 1% QoQ USD (1.2% CC QoQ) growth & cross currency headwind of ~20bps. We expect organic growth ~0.5% QoQ USD. Revenue growth is likely to be impacted mainly due to 1) pressure on top client in BFS based in US , 2) June is a seasonally weak quarter. We expect ~217bps decline in EBIT margins mainly due to 1) ~100 bps impact from H1B visa cost, 2) ~90 bps impact from investment in sales, 3) ~20-30 bps impact from INR appreciation. Margins will remain soft in Q2 also as its a wage hike quarter. We expect recovery in 2HFY20. We expect investor to focus on growth outlook of large client in BFS based in US, large deal momentum, implications of LTI-MTCL deal & demand environment in BFS in US.
Revenues 25,192 24,860 20,012 1.3% 25.9%
EBITDA 4,283 4,283 3,536 0.0% 21.1%
EBITDA margin (%) 17.0% 19.2% 17.7% -217 bps -67 bps
EBIT margin (%) 15.5% 17.7% 15.9% -217 bps -37 bps
Adjusted net profit 3,451 3,787 2,893 -8.9% 19.3%
EPS 19.7 21.7 16.5 -9.4% 19.2%

Information Technology
July 4, 2019 75
Company Q1FY20E Q4FY19 Q1FY19 QoQ gr. YoY gr. Comments
NIIT Technologies
Revenues (US$mn) 139 138 125 0.9% 11.5%
We expect USD revenue growth of 0.9% in Q1FY20E. We expect order intake to be at US$150mn.Organic growth will be led by insurance & travel vertical , BFS expected to remain tepid.
Revenues 9,823 9,722 8,249 1.0% 19.1%
EBITDA 1,621 1,707 1,307 -5.0% 24.0%
EBITDA margin (%) 16.5% 17.6% 15.8% -106 bps 66 bps
EBIT margin (%) 14.5% 14.9% 14.6% -40 bps -10 bps
Adjusted net profit 1,070 1,100 904 -2.7% 18.4%
EPS 16.8 17.2 13.9 -2.3% 20.9%
L&T Technology Services
Revenues (US$mn) 197 191 169 3.0% 16.7%
We expect USD revenues to increase by 3% QoQ despite the ~2.6% revenue impact from client specific ramp-down in the hi-tech vertical. We expect CC revenue growth of 3.3% with cross currency headwinds of 30 bps. We expect EBIT margin to decline by 25bps due to wage hike and INR appreciation.
Revenues 13,891 13,431 11,522 3.4% 20.6%
EBITDA 2,542 2,492 1,961 2.0% 29.6%
EBITDA margin (%) 18.3% 18.6% 17.0% -25 bps 128 bps
EBIT margin (%) 16.3% 16.5% 14.8% -25 bps 150 bps
Adjusted net profit 2,038 1,924 1,981 5.9% 2.9%
EPS 19.2 18.1 18.7 6.1% 2.7%
Cyient
Revenues (US$mn) 166 165 161 0.8% 3.5%
We expect just 0.8% USD QoQ growth from Cyient due to delays in deal ramp-ups in A&D & communication segments. We expect EBIT margin to decline ~91bps QoQ on account of wage hike, INR appreciation, investment in business.
Revenues 11,569 12,438 12,547 -7.0% -7.8%
EBITDA 1,631 1,751 1,316 -6.8% 24.0%
EBITDA margin (%) 14.1% 15.1% 12.2% -96 bps 191 bps
EBIT margin (%) 11.9% 12.8% 9.5% -91 bps 235 bps
Adjusted net profit 1,185 1,769 825 -34.4% 42.3%
EPS 10.5 15.7 7.3 -33.0% 43.7%
Persistent Systems
Revenues (US$mn) 122 118 124 3.2% -1.3%
We expect PSYS’ to post 3.2% QoQ USD revenue growth which will be mainly led by IP led business due to IBM seasonality. EBITDA margin in Q4FY19 adjusted for the Rs183mn provision related to IL&FS was 17.4%. We expect headwinds from wage hike, INR appreciation, visa cost on margins. We expect investors to focus on new CEO progress on outlined strategy.
Revenues 8,482 8,319 8,342 2.0% 1.7%
EBITDA 1,442 1,266 1,401 13.9% 2.9%
EBITDA margin (%) 17.0% 15.2% 16.8% 179 bps 21 bps
EBIT margin (%) 12.2% 10.7% 12.0% 152 bps 21 bps
Adjusted net profit 908 845 874 7.4% 3.9%
EPS 11.3 10.6 10.9 7.4% 3.9%
Zensar Technologies
Revenues (US$mn) 155 150 135 3.0% 14.5%
We expect Zensar to post USD revenue growth of 3% QoQ and 14.5% YoY. We expect margins to decline ~43bps on account of wage hike, onsite salary, visa cost & large deal transition cost.
Revenues 10,755 10,625 9,116 1.2% 18.0%
EBITDA 1,291 1,321 1,233 -2.3% 4.7%
EBITDA margin (%) 12.0% 12.4% 13.5% -43 bps -152 bps
EBIT margin (%) 10.0% 10.1% 11.5% -7 bps -150 bps
Adjusted net profit 791 829 822 -4.6% -3.8%
EPS 3.6 3.7 3.7 -2.9% -2.7%
Sonata Software
Revenues (US$mn) 45 44 38 3.0% 18.5%
We expect 3% USD revenue growth in Sonata.
Revenues 8,793 8,356 6,883 5.2% 27.7%
EBITDA 1,001 884 733 13.3% 36.5%
EBITDA margin (%) 11.4% 10.6% 10.7% 81 bps 73 bps
Adjusted net profit 731 654 574 11.8% 27.3%
EPS 7.0 6.3 5.6 11.8% 26.7%
TeamLease Services
Revenues (Rs) 12,223 11,634 10,213 5.1% 19.7%
We expect margins to improve by ~10bps during the quarter.
EBITDA 281 257 202 9.3% 39.3%
EBITDA margin (%) 2.3% 2.2% 2.0% 9 bps 32 bps
Adjusted net profit 265 260 218 1.9% 0 bps
EPS 15.5 15.2 12.8 1.9% 21.6%

Information Technology
July 4, 2019 76
Company Q1FY20E Q4FY19 Q1FY19 QoQ gr. YoY gr. Comments
Redington (India)
Revenues (US$mn) 1,068 1,115 980 -4.2% 9.0%
We expect Redington revenues at Rs123.6bn up 21% YoY. We expect consolidated EBIDTA margin at 1.6% down ~40bps QoQ.
Revenues 123,584 125,827 102,140 -1.8% 21.0%
EBITDA 1,940 2554 1663 -24.1% 16.6%
EBITDA margin (%) 1.6% 2.0% 1.6% -46 bps -6 bps
EBIT margin (%) 1.4% 1.9% 1.5% -48 bps -5 bps
Adjusted net profit 1,097 1,689 850 -35.1% 29.1%
EPS 2.8 4.3 2.2 -35.1% 29.1%
Source: Company, PL
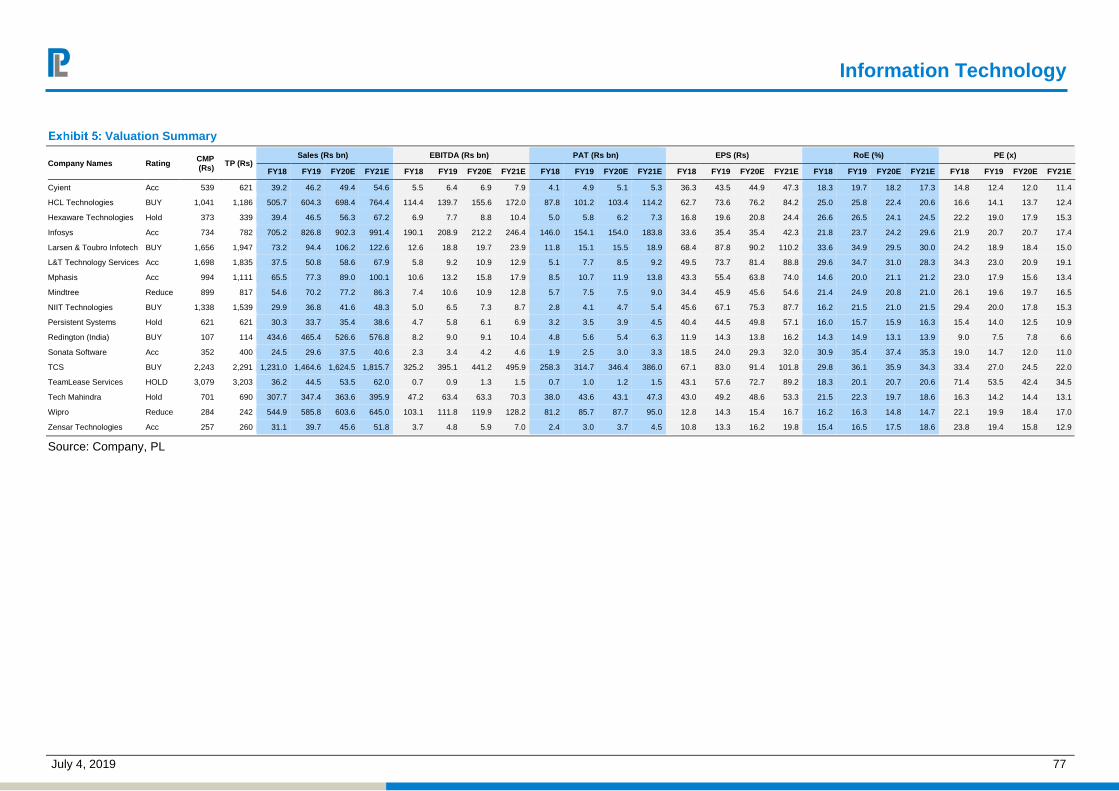
Information Technology
July 4, 2019 77
Valuation Summary
Company Names Rating CMP (Rs) TP (Rs)
Sales (Rs bn) EBITDA (Rs bn) PAT (Rs bn) EPS (Rs) RoE (%) PE (x)
FY18 FY19 FY20E FY21E FY18 FY19 FY20E FY21E FY18 FY19 FY20E FY21E FY18 FY19 FY20E FY21E FY18 FY19 FY20E FY21E FY18 FY19 FY20E FY21E
Cyient Acc 539 621 39.2 46.2 49.4 54.6 5.5 6.4 6.9 7.9 4.1 4.9 5.1 5.3 36.3 43.5 44.9 47.3 18.3 19.7 18.2 17.3 14.8 12.4 12.0 11.4
HCL Technologies BUY 1,041 1,186 505.7 604.3 698.4 764.4 114.4 139.7 155.6 172.0 87.8 101.2 103.4 114.2 62.7 73.6 76.2 84.2 25.0 25.8 22.4 20.6 16.6 14.1 13.7 12.4
Hexaware Technologies Hold 373 339 39.4 46.5 56.3 67.2 6.9 7.7 8.8 10.4 5.0 5.8 6.2 7.3 16.8 19.6 20.8 24.4 26.6 26.5 24.1 24.5 22.2 19.0 17.9 15.3
Infosys Acc 734 782 705.2 826.8 902.3 991.4 190.1 208.9 212.2 246.4 146.0 154.1 154.0 183.8 33.6 35.4 35.4 42.3 21.8 23.7 24.2 29.6 21.9 20.7 20.7 17.4
Larsen & Toubro Infotech BUY 1,656 1,947 73.2 94.4 106.2 122.6 12.6 18.8 19.7 23.9 11.8 15.1 15.5 18.9 68.4 87.8 90.2 110.2 33.6 34.9 29.5 30.0 24.2 18.9 18.4 15.0
L&T Technology Services Acc 1,698 1,835 37.5 50.8 58.6 67.9 5.8 9.2 10.9 12.9 5.1 7.7 8.5 9.2 49.5 73.7 81.4 88.8 29.6 34.7 31.0 28.3 34.3 23.0 20.9 19.1
Mphasis Acc 994 1,111 65.5 77.3 89.0 100.1 10.6 13.2 15.8 17.9 8.5 10.7 11.9 13.8 43.3 55.4 63.8 74.0 14.6 20.0 21.1 21.2 23.0 17.9 15.6 13.4
Mindtree Reduce 899 817 54.6 70.2 77.2 86.3 7.4 10.6 10.9 12.8 5.7 7.5 7.5 9.0 34.4 45.9 45.6 54.6 21.4 24.9 20.8 21.0 26.1 19.6 19.7 16.5
NIIT Technologies BUY 1,338 1,539 29.9 36.8 41.6 48.3 5.0 6.5 7.3 8.7 2.8 4.1 4.7 5.4 45.6 67.1 75.3 87.7 16.2 21.5 21.0 21.5 29.4 20.0 17.8 15.3
Persistent Systems Hold 621 621 30.3 33.7 35.4 38.6 4.7 5.8 6.1 6.9 3.2 3.5 3.9 4.5 40.4 44.5 49.8 57.1 16.0 15.7 15.9 16.3 15.4 14.0 12.5 10.9
Redington (India) BUY 107 114 434.6 465.4 526.6 576.8 8.2 9.0 9.1 10.4 4.8 5.6 5.4 6.3 11.9 14.3 13.8 16.2 14.3 14.9 13.1 13.9 9.0 7.5 7.8 6.6
Sonata Software Acc 352 400 24.5 29.6 37.5 40.6 2.3 3.4 4.2 4.6 1.9 2.5 3.0 3.3 18.5 24.0 29.3 32.0 30.9 35.4 37.4 35.3 19.0 14.7 12.0 11.0
TCS BUY 2,243 2,291 1,231.0 1,464.6 1,624.5 1,815.7 325.2 395.1 441.2 495.9 258.3 314.7 346.4 386.0 67.1 83.0 91.4 101.8 29.8 36.1 35.9 34.3 33.4 27.0 24.5 22.0
TeamLease Services HOLD 3,079 3,203 36.2 44.5 53.5 62.0 0.7 0.9 1.3 1.5 0.7 1.0 1.2 1.5 43.1 57.6 72.7 89.2 18.3 20.1 20.7 20.6 71.4 53.5 42.4 34.5
Tech Mahindra Hold 701 690 307.7 347.4 363.6 395.9 47.2 63.4 63.3 70.3 38.0 43.6 43.1 47.3 43.0 49.2 48.6 53.3 21.5 22.3 19.7 18.6 16.3 14.2 14.4 13.1
Wipro Reduce 284 242 544.9 585.8 603.6 645.0 103.1 111.8 119.9 128.2 81.2 85.7 87.7 95.0 12.8 14.3 15.4 16.7 16.2 16.3 14.8 14.7 22.1 19.9 18.4 17.0
Zensar Technologies Acc 257 260 31.1 39.7 45.6 51.8 3.7 4.8 5.9 7.0 2.4 3.0 3.7 4.5 10.8 13.3 16.2 19.8 15.4 16.5 17.5 18.6 23.8 19.4 15.8 12.9
Source: Company, PL

July 4, 2019 78
July 4, 2019
Jinesh Joshi [email protected] | 91-22-66322238
Media Apr-Jun’19 Earnings Preview
Radio space: For our coverage universe, we expect top-line growth to be subdued
(both inventory utilization & pricing are expected to remain flat) considering
advertising environment across BFSI, Auto, Retail, Real-estate and FMCG sectors
is muted. Additionally, government’s contribution is likely to be below expectations,
this quarter.
ENIL’s growth is projected to be higher than MBL considering its non-FCT business
exposure. Profit growth is expected to show meaningful improvement for ENIL due
to low base and incremental contribution from maturing batch 1 stations. However,
profit growth for Music Broadcast Ltd is expected to be in single digits.
Q1FY20 Result Preview
Company Name Q1FY20E Q1FY19 YoY gr. (%) Q4FY19 QoQ gr.
(%) Remark
Entertainment Network (India)
Sales 1,335 1,216 9.8 1,755 (23.9) The radio business is expected to report flattish growth as advertising environment across sectors like BFSI, auto, retail, real estate and FMCG is muted. However, rising contribution from non-FCT business is expected to drive top-line. Margin dilutive nature of the non-FCT business and losses from batch 2 stations is expected to offset operating leverage benefit from traditional radio business and result in only 50bps EBITDA margin expansion.
EBITDA 318 284 12.1 438 (27.4)
Margin (%) 23.8 23.3 24.9
Adj. PAT 127 92 37.7 198 (35.9)
Music Broadcast
Sales 764 757 1.0 819 (6.6) Top-line growth is expected to be flattish as advertising environment across sectors like BFSI, auto, retail, real estate and FMCG is muted. In addition, contribution from government has been below expectations. Operating leverage due to fixed cost nature of the business will aid in 100bps EBITDA margin expansion.
EBITDA 271 261 3.8 320 (15.4)
Margin (%) 35.4 34.4 39.0
Adj. PAT 145 135 7.4 184 (21.0)
Source: Company, PL

Media
July 4, 2019 79
Valuation Summary
Company Names Rating CMP (Rs) TP (Rs)
Sales (Rs m) EBITDA (Rs m) PAT (Rs m) EPS (Rs) RoE (%) PE (x)
FY18 FY19 FY20E FY21E FY18 FY19 FY20E FY21E FY18 FY19 FY20E FY21E FY18 FY19 FY20E FY21E FY18 FY19 FY20E FY21E FY18 FY19 FY20E FY21E
Entertainment Network (India)
Acc 424 645 5,371 6,205 6,967 7,890 1,166 1,398 1,749 1,980 352 539 765 896 7.4 11.3 16.1 18.8 4.0 5.8 7.6 8.2 57.5 37.5 26.4 22.5
Music Broadcast BUY 57 75 2,983 3,247 3,609 3,974 971 1,132 1,278 1,431 517 616 713 831 9.1 2.2 2.6 3.0 8.6 10.2 10.6 11.0 6.2 25.4 21.9 18.8
Source: Company, PL
PS: The EPS figure for MBL for FY18 is pre-split and hence not comparable with the ensuing years.

July 4, 2019 80
Metals & Mining Apr-Jun’19 Earnings Preview
China resumed back to excess production with record level of output. Chinese steel
production grew 11% YoY to 174mn tonnes (t) during Apr-May’19 due to relaxation
of restrictions on production cuts by local authorities. World steel production rose
5.9% YoY to 319mn t in during the period. RoW’s production remained flat YoY to
138mn t (v/s 1.5% YoY fall in Jan-Feb’19). Production in India rose 3.3% YoY to
18mn t on the back of firm demand and lower imports. South Korea’s production
grew by 1.8% YoY to 12.4mn t due to increase in domestic demand, partially
negated by weakness in exports. EU’s production continues to witness de-growth
with a fall in production by 3.5% YoY to 28.5mn t due to increased imports,
production cuts and sluggish demand. USA’s production grew by 6.3% YoY to
15.1mn t, led by increased domestic intensity and reduced imports.
Exhibit 1: Movement in Crude Steel Production
-10.0
-5.0
0.0
5.0
10.0
15.0
20.0
May
-16
Jul-1
6
Sep
-16
Nov
-16
Jan-
17
Mar
-17
May
-17
Jul-1
7
Sep
-17
Nov
-17
Jan-
18
Mar
-18
May
-18
Jul-1
8
Sep
-18
Nov
-18
Jan-
19
Mar
-19
May
-19
(%)
China World steel World steel ex China
Source: World Steel, PL
Average Chinese steel prices (including 17% VAT) rose by 2.7% QoQ or US$15/t
to US$579/t due to high iron ore prices.
Exhibit 2: China HRC Price
500
520
540
560
580
600
620
640
660
Jun-
18
Jul-1
8
Aug
-18
Sep
-18
Oct
-18
Nov
-18
Dec
-18
Jan-
19
Feb
-19
Mar
-19
Apr
-19
May
-19
Jun-
19
(US
$ /
ton
ne
)
Source: Bloomberg, PL
July 4, 2019
Kamlesh Bagmar [email protected] | 91-22-66322237
Amit Khimesra [email protected] | 91-22-66322244
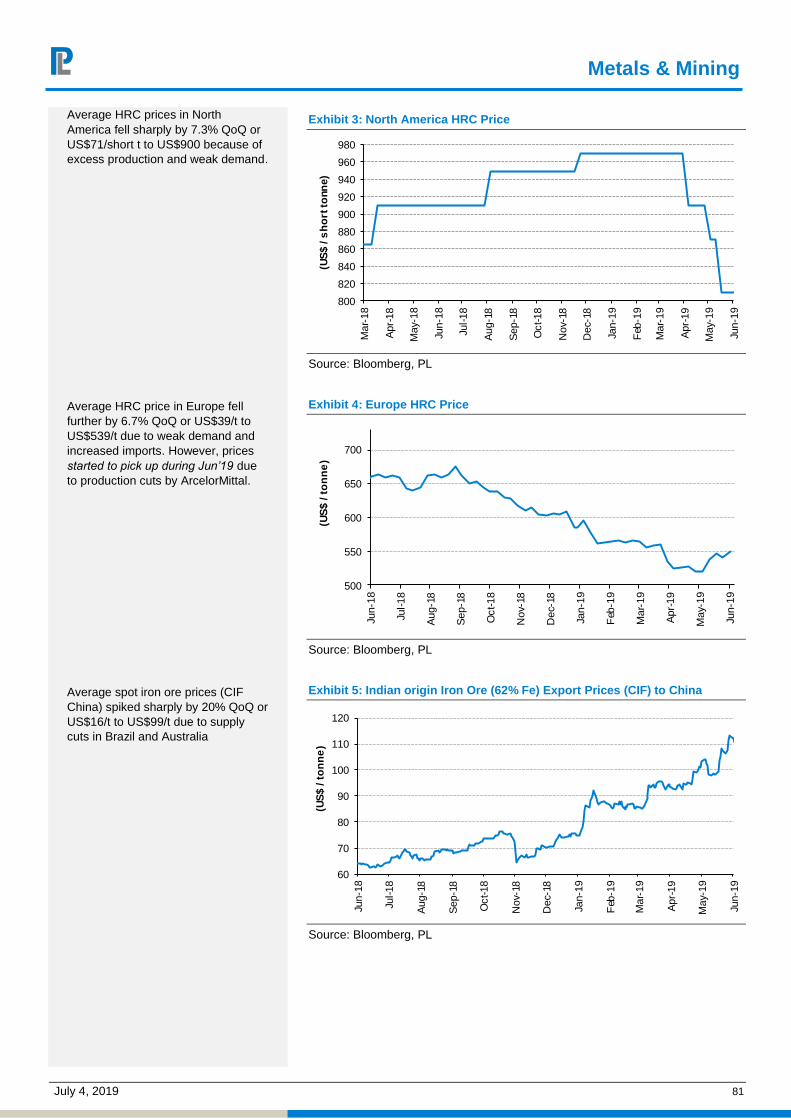
Metals & Mining
July 4, 2019 81
Exhibit 3: North America HRC Price
800
820
840
860
880
900
920
940
960
980
Mar
-18
Apr
-18
May
-18
Jun-
18
Jul-1
8
Aug
-18
Sep
-18
Oct
-18
Nov
-18
Dec
-18
Jan-
19
Feb
-19
Mar
-19
Apr
-19
May
-19
Jun-
19
(US
$ / s
ho
rt to
nne)
Source: Bloomberg, PL
Exhibit 4: Europe HRC Price
500
550
600
650
700
Jun-
18
Jul-1
8
Aug
-18
Sep
-18
Oct
-18
Nov
-18
Dec
-18
Jan-
19
Feb
-19
Mar
-19
Apr
-19
May
-19
Jun-
19
(US
$ / t
on
ne
)
Source: Bloomberg, PL
Exhibit 5: Indian origin Iron Ore (62% Fe) Export Prices (CIF) to China
60
70
80
90
100
110
120
Jun-
18
Jul-1
8
Aug
-18
Sep
-18
Oct
-18
Nov
-18
Dec
-18
Jan-
19
Feb
-19
Mar
-19
Apr
-19
May
-19
Jun-
19
(US
$ / t
on
ne
)
Source: Bloomberg, PL
Average HRC prices in North America fell sharply by 7.3% QoQ or US$71/short t to US$900 because of excess production and weak demand.
Average HRC price in Europe fell further by 6.7% QoQ or US$39/t to US$539/t due to weak demand and increased imports. However, prices started to pick up during Jun’19 due to production cuts by ArcelorMittal.
Average spot iron ore prices (CIF China) spiked sharply by 20% QoQ or US$16/t to US$99/t due to supply cuts in Brazil and Australia
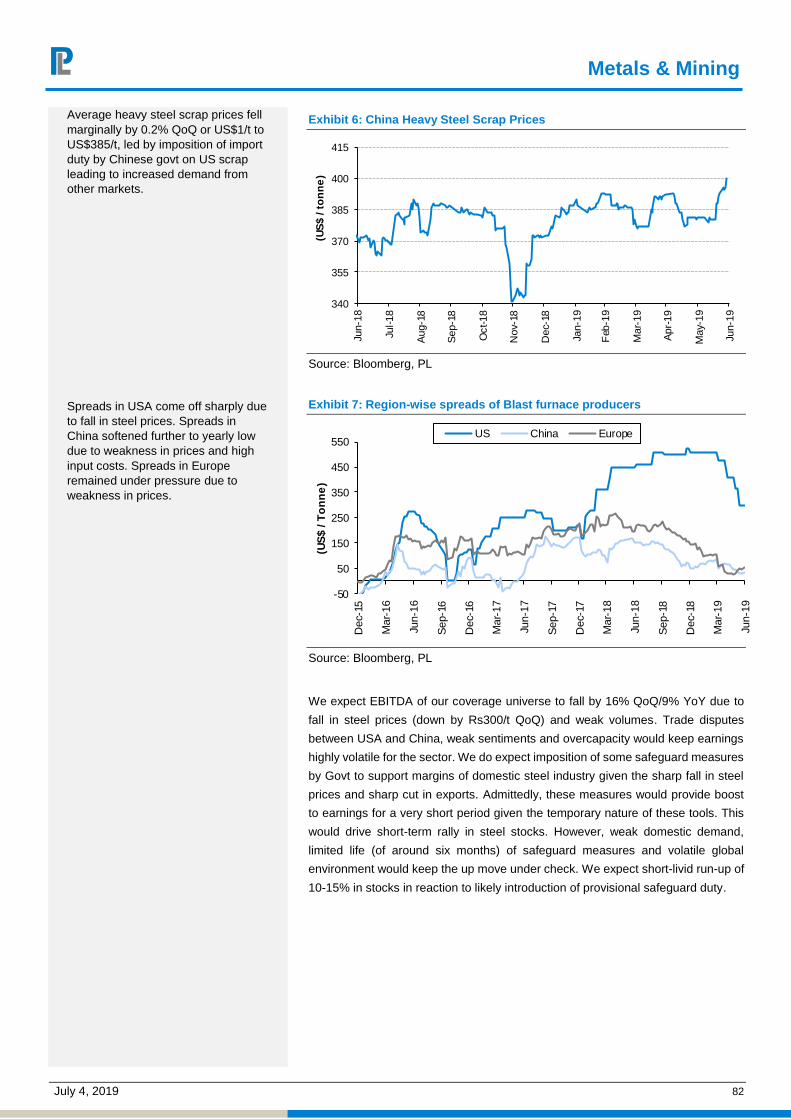
Metals & Mining
July 4, 2019 82
Exhibit 6: China Heavy Steel Scrap Prices
340
355
370
385
400
415
Jun-
18
Jul-1
8
Aug
-18
Sep
-18
Oct
-18
Nov
-18
Dec
-18
Jan-
19
Feb
-19
Mar
-19
Apr
-19
May
-19
Jun-
19
(US
$ / t
on
ne
)
Source: Bloomberg, PL
Exhibit 7: Region-wise spreads of Blast furnace producers
-50
50
150
250
350
450
550
Dec
-15
Mar
-16
Jun-
16
Sep
-16
Dec
-16
Mar
-17
Jun-
17
Sep
-17
Dec
-17
Mar
-18
Jun-
18
Sep
-18
Dec
-18
Mar
-19
Jun-
19
(US
$ / T
on
ne
)
US China Europe
Source: Bloomberg, PL
We expect EBITDA of our coverage universe to fall by 16% QoQ/9% YoY due to
fall in steel prices (down by Rs300/t QoQ) and weak volumes. Trade disputes
between USA and China, weak sentiments and overcapacity would keep earnings
highly volatile for the sector. We do expect imposition of some safeguard measures
by Govt to support margins of domestic steel industry given the sharp fall in steel
prices and sharp cut in exports. Admittedly, these measures would provide boost
to earnings for a very short period given the temporary nature of these tools. This
would drive short-term rally in steel stocks. However, weak domestic demand,
limited life (of around six months) of safeguard measures and volatile global
environment would keep the up move under check. We expect short-livid run-up of
10-15% in stocks in reaction to likely introduction of provisional safeguard duty.
Average heavy steel scrap prices fell marginally by 0.2% QoQ or US$1/t to US$385/t, led by imposition of import duty by Chinese govt on US scrap leading to increased demand from other markets.
Spreads in USA come off sharply due to fall in steel prices. Spreads in China softened further to yearly low due to weakness in prices and high input costs. Spreads in Europe remained under pressure due to weakness in prices.
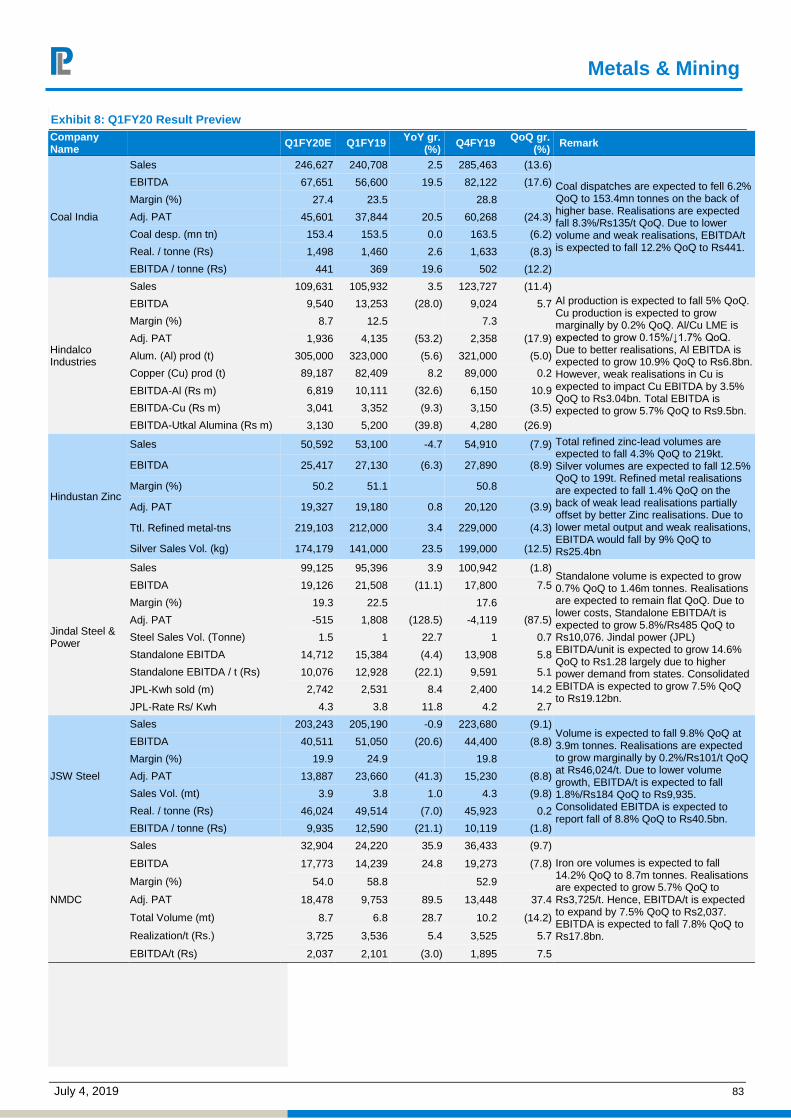
Metals & Mining
July 4, 2019 83
Exhibit 8: Q1FY20 Result Preview Company Name Q1FY20E Q1FY19 YoY gr.
(%) Q4FY19 QoQ gr.
(%) Remark
Coal India
Sales 246,627 240,708 2.5 285,463 (13.6)
Coal dispatches are expected to fell 6.2% QoQ to 153.4mn tonnes on the back of higher base. Realisations are expected fall 8.3%/Rs135/t QoQ. Due to lower volume and weak realisations, EBITDA/t is expected to fall 12.2% QoQ to Rs441.
EBITDA 67,651 56,600 19.5 82,122 (17.6)
Margin (%) 27.4 23.5 28.8
Adj. PAT 45,601 37,844 20.5 60,268 (24.3)
Coal desp. (mn tn) 153.4 153.5 0.0 163.5 (6.2)
Real. / tonne (Rs) 1,498 1,460 2.6 1,633 (8.3)
EBITDA / tonne (Rs) 441 369 19.6 502 (12.2)
Hindalco Industries
Sales 109,631 105,932 3.5 123,727 (11.4) Al production is expected to fall 5% QoQ. Cu production is expected to grow marginally by 0.2% QoQ. Al/Cu LME is expected to grow 0.15%/↓1.7% QoQ. Due to better realisations, Al EBITDA is expected to grow 10.9% QoQ to Rs6.8bn. However, weak realisations in Cu is expected to impact Cu EBITDA by 3.5% QoQ to Rs3.04bn. Total EBITDA is expected to grow 5.7% QoQ to Rs9.5bn.
EBITDA 9,540 13,253 (28.0) 9,024 5.7
Margin (%) 8.7 12.5 7.3
Adj. PAT 1,936 4,135 (53.2) 2,358 (17.9)
Alum. (Al) prod (t) 305,000 323,000 (5.6) 321,000 (5.0)
Copper (Cu) prod (t) 89,187 82,409 8.2 89,000 0.2
EBITDA‐Al (Rs m) 6,819 10,111 (32.6) 6,150 10.9
EBITDA‐Cu (Rs m) 3,041 3,352 (9.3) 3,150 (3.5)
EBITDA-Utkal Alumina (Rs m) 3,130 5,200 (39.8) 4,280 (26.9)
Hindustan Zinc
Sales 50,592 53,100 -4.7 54,910 (7.9) Total refined zinc‐lead volumes are expected to fall 4.3% QoQ to 219kt. Silver volumes are expected to fall 12.5% QoQ to 199t. Refined metal realisations are expected to fall 1.4% QoQ on the back of weak lead realisations partially offset by better Zinc realisations. Due to lower metal output and weak realisations, EBITDA would fall by 9% QoQ to Rs25.4bn
EBITDA 25,417 27,130 (6.3) 27,890 (8.9)
Margin (%) 50.2 51.1 50.8
Adj. PAT 19,327 19,180 0.8 20,120 (3.9)
Ttl. Refined metal‐tns 219,103 212,000 3.4 229,000 (4.3)
Silver Sales Vol. (kg) 174,179 141,000 23.5 199,000 (12.5)
Jindal Steel & Power
Sales 99,125 95,396 3.9 100,942 (1.8) Standalone volume is expected to grow 0.7% QoQ to 1.46m tonnes. Realisations are expected to remain flat QoQ. Due to lower costs, Standalone EBITDA/t is expected to grow 5.8%/Rs485 QoQ to Rs10,076. Jindal power (JPL) EBITDA/unit is expected to grow 14.6% QoQ to Rs1.28 largely due to higher power demand from states. Consolidated EBITDA is expected to grow 7.5% QoQ to Rs19.12bn.
EBITDA 19,126 21,508 (11.1) 17,800 7.5
Margin (%) 19.3 22.5 17.6
Adj. PAT -515 1,808 (128.5) -4,119 (87.5)
Steel Sales Vol. (Tonne) 1.5 1 22.7 1 0.7
Standalone EBITDA 14,712 15,384 (4.4) 13,908 5.8
Standalone EBITDA / t (Rs) 10,076 12,928 (22.1) 9,591 5.1
JPL‐Kwh sold (m) 2,742 2,531 8.4 2,400 14.2
JPL‐Rate Rs/ Kwh 4.3 3.8 11.8 4.2 2.7
JSW Steel
Sales 203,243 205,190 -0.9 223,680 (9.1) Volume is expected to fall 9.8% QoQ at 3.9m tonnes. Realisations are expected to grow marginally by 0.2%/Rs101/t QoQ at Rs46,024/t. Due to lower volume growth, EBITDA/t is expected to fall 1.8%/Rs184 QoQ to Rs9,935. Consolidated EBITDA is expected to report fall of 8.8% QoQ to Rs40.5bn.
EBITDA 40,511 51,050 (20.6) 44,400 (8.8)
Margin (%) 19.9 24.9 19.8
Adj. PAT 13,887 23,660 (41.3) 15,230 (8.8)
Sales Vol. (mt) 3.9 3.8 1.0 4.3 (9.8)
Real. / tonne (Rs) 46,024 49,514 (7.0) 45,923 0.2
EBITDA / tonne (Rs) 9,935 12,590 (21.1) 10,119 (1.8)
NMDC
Sales 32,904 24,220 35.9 36,433 (9.7)
Iron ore volumes is expected to fall 14.2% QoQ to 8.7m tonnes. Realisations are expected to grow 5.7% QoQ to Rs3,725/t. Hence, EBITDA/t is expected to expand by 7.5% QoQ to Rs2,037. EBITDA is expected to fall 7.8% QoQ to Rs17.8bn.
EBITDA 17,773 14,239 24.8 19,273 (7.8)
Margin (%) 54.0 58.8 52.9
Adj. PAT 18,478 9,753 89.5 13,448 37.4
Total Volume (mt) 8.7 6.8 28.7 10.2 (14.2)
Realization/t (Rs.) 3,725 3,536 5.4 3,525 5.7
EBITDA/t (Rs) 2,037 2,101 (3.0) 1,895 7.5

Metals & Mining
July 4, 2019 84
Company Name Q1FY20E Q1FY19 YoY gr.
(%) Q4FY19 QoQ gr.
(%) Remark
Steel Authority of India
Sales 150,508 159,072 -5.4 185,063 (18.7) Volumes are expected to fell 18.5% QoQ to 3.4m tonnes. Realisations are expected to fall marginally 0.3%/Rs122/t QoQ to Rs44,211/t. Due to higher costs and weak realisations, EBITDA/t is expected to fall 24.8%/Rs1,330 QoQ at Rs4,028. EBITDA is expected to fall 38.7% QoQ to Rs13.6bn.
EBITDA 13,575 25,764 (47.3) 22,145 (38.7)
Margin (%) 9.0 16.2 12.0
Adj. PAT -1,403 7,215 (119.4) 5,082 (127.6)
Sales Vol. (m tonnes) 3.4 3.3 3.0 4.1 (18.5)
Real. / Tonne (Rs) 44,211 48,130 (8.1) 44,333 (0.3)
EBITDA / Tonne (Rs) 4,028 7,877 (48.9) 5,358 (24.8)
Tata Steel - India
Sales 164,619 164,055 0.3 191,296 (13.9) Standalone volume is expected to fall 15.1% QoQ to 3m tonnes. Realisations are expected to grow 1.3% or Rs716/t QoQ to Rs54,151/t. Due to higher costs partially offset by increase in realisations, EBITDA/t is expected to fall 4.6%/Rs635 QoQ to Rs13,179.
EBITDA 40,064 50,719 (21.0) 49,455 (19.0)
Margin (%) 24.3 30.9 25.9
Adj. PAT 18,892 25,353 (25.5) 24,982 (24.4)
Sales Vol. (m tonnes) 3.0 3.0 2.4 3.6 (15.1)
Realization/t (Rs.) 54,151 55,237 (2.0) 53,434 1.3
EBITDA / Tonne (Rs) 13,179 17,077 (22.8) 13,814 (4.6)
Tata Steel - Consol
Sales 371,631 378,328 (1.8) 424,239 (12.4)
Tata Steel Europe (TSE) is expected to report 24% QoQ fall in EBITDA/t to US$50 due to weaker spreads and lower scale. Due to weak operating performance in European operations, we expect consolidated EBITDA to fall 24.2% QoQ to Rs56.9bn.
EBITDA 56,942 64,677 (12.0) 75,133 (24.2)
Margin (%) 15.3 17.1 17.7
Adj. PAT 10,769 22,976 (53.1) 24,235 (55.6)
SalesVol.‐Corus (mt) 2.5 2.5 2.0 2.6 (2.7)
EBITDA/Tn‐Corus (US$) 50 101 (50.7) 66 (24.2)
Sales Vol.‐South East (mt) - 0.6 (100.0) 0.6 -
EBITDA/Tn‐SEAN (US$) - 27.3 (100.0) - -
Source: Company, PL
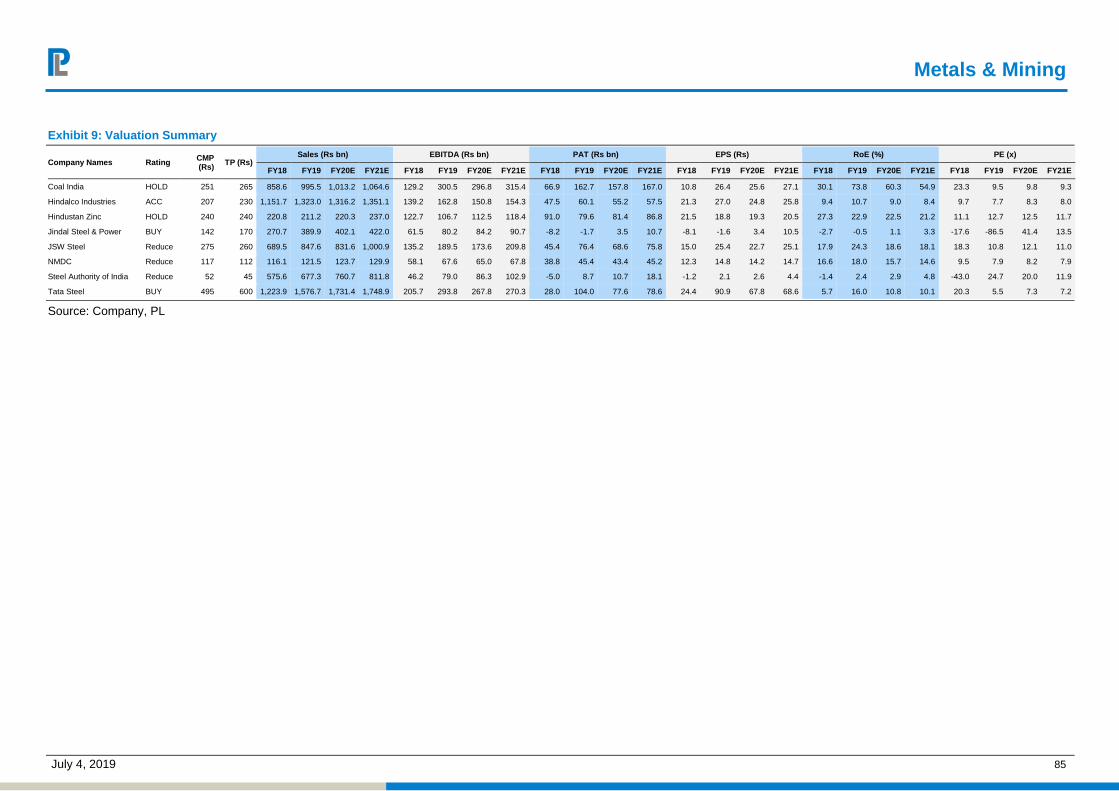
Metals & Mining
July 4, 2019 85
Exhibit 9: Valuation Summary
Company Names Rating CMP (Rs) TP (Rs)
Sales (Rs bn) EBITDA (Rs bn) PAT (Rs bn) EPS (Rs) RoE (%) PE (x)
FY18 FY19 FY20E FY21E FY18 FY19 FY20E FY21E FY18 FY19 FY20E FY21E FY18 FY19 FY20E FY21E FY18 FY19 FY20E FY21E FY18 FY19 FY20E FY21E
Coal India HOLD 251 265 858.6 995.5 1,013.2 1,064.6 129.2 300.5 296.8 315.4 66.9 162.7 157.8 167.0 10.8 26.4 25.6 27.1 30.1 73.8 60.3 54.9 23.3 9.5 9.8 9.3
Hindalco Industries ACC 207 230 1,151.7 1,323.0 1,316.2 1,351.1 139.2 162.8 150.8 154.3 47.5 60.1 55.2 57.5 21.3 27.0 24.8 25.8 9.4 10.7 9.0 8.4 9.7 7.7 8.3 8.0
Hindustan Zinc HOLD 240 240 220.8 211.2 220.3 237.0 122.7 106.7 112.5 118.4 91.0 79.6 81.4 86.8 21.5 18.8 19.3 20.5 27.3 22.9 22.5 21.2 11.1 12.7 12.5 11.7
Jindal Steel & Power BUY 142 170 270.7 389.9 402.1 422.0 61.5 80.2 84.2 90.7 -8.2 -1.7 3.5 10.7 -8.1 -1.6 3.4 10.5 -2.7 -0.5 1.1 3.3 -17.6 -86.5 41.4 13.5
JSW Steel Reduce 275 260 689.5 847.6 831.6 1,000.9 135.2 189.5 173.6 209.8 45.4 76.4 68.6 75.8 15.0 25.4 22.7 25.1 17.9 24.3 18.6 18.1 18.3 10.8 12.1 11.0
NMDC Reduce 117 112 116.1 121.5 123.7 129.9 58.1 67.6 65.0 67.8 38.8 45.4 43.4 45.2 12.3 14.8 14.2 14.7 16.6 18.0 15.7 14.6 9.5 7.9 8.2 7.9
Steel Authority of India Reduce 52 45 575.6 677.3 760.7 811.8 46.2 79.0 86.3 102.9 -5.0 8.7 10.7 18.1 -1.2 2.1 2.6 4.4 -1.4 2.4 2.9 4.8 -43.0 24.7 20.0 11.9
Tata Steel BUY 495 600 1,223.9 1,576.7 1,731.4 1,748.9 205.7 293.8 267.8 270.3 28.0 104.0 77.6 78.6 24.4 90.9 67.8 68.6 5.7 16.0 10.8 10.1 20.3 5.5 7.3 7.2
Source: Company, PL
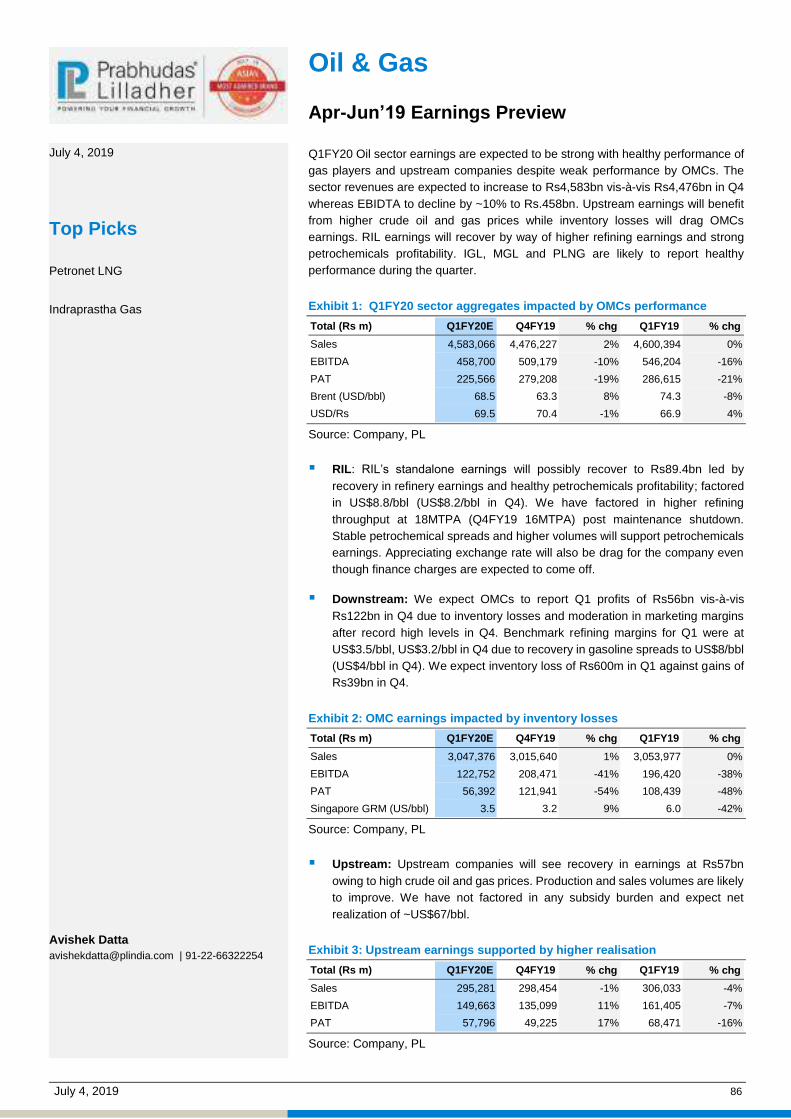
July 4, 2019 86
Oil & Gas Apr-Jun’19 Earnings Preview Q1FY20 Oil sector earnings are expected to be strong with healthy performance of gas players and upstream companies despite weak performance by OMCs. The sector revenues are expected to increase to Rs4,583bn vis-à-vis Rs4,476bn in Q4 whereas EBIDTA to decline by ~10% to Rs.458bn. Upstream earnings will benefit from higher crude oil and gas prices while inventory losses will drag OMCs earnings. RIL earnings will recover by way of higher refining earnings and strong petrochemicals profitability. IGL, MGL and PLNG are likely to report healthy performance during the quarter.
Exhibit 1: Q1FY20 sector aggregates impacted by OMCs performance
Total (Rs m) Q1FY20E Q4FY19 % chg Q1FY19 % chg
Sales 4,583,066 4,476,227 2% 4,600,394 0%
EBITDA 458,700 509,179 -10% 546,204 -16%
PAT 225,566 279,208 -19% 286,615 -21%
Brent (USD/bbl) 68.5 63.3 8% 74.3 -8%
USD/Rs 69.5 70.4 -1% 66.9 4%
Source: Company, PL
RIL: RIL’s standalone earnings will possibly recover to Rs89.4bn led by recovery in refinery earnings and healthy petrochemicals profitability; factored in US$8.8/bbl (US$8.2/bbl in Q4). We have factored in higher refining throughput at 18MTPA (Q4FY19 16MTPA) post maintenance shutdown. Stable petrochemical spreads and higher volumes will support petrochemicals earnings. Appreciating exchange rate will also be drag for the company even though finance charges are expected to come off.
Downstream: We expect OMCs to report Q1 profits of Rs56bn vis-à-vis Rs122bn in Q4 due to inventory losses and moderation in marketing margins after record high levels in Q4. Benchmark refining margins for Q1 were at US$3.5/bbl, US$3.2/bbl in Q4 due to recovery in gasoline spreads to US$8/bbl (US$4/bbl in Q4). We expect inventory loss of Rs600m in Q1 against gains of Rs39bn in Q4.
Exhibit 2: OMC earnings impacted by inventory losses
Total (Rs m) Q1FY20E Q4FY19 % chg Q1FY19 % chg
Sales 3,047,376 3,015,640 1% 3,053,977 0%
EBITDA 122,752 208,471 -41% 196,420 -38%
PAT 56,392 121,941 -54% 108,439 -48%
Singapore GRM (US/bbl) 3.5 3.2 9% 6.0 -42%
Source: Company, PL
Upstream: Upstream companies will see recovery in earnings at Rs57bn owing to high crude oil and gas prices. Production and sales volumes are likely to improve. We have not factored in any subsidy burden and expect net realization of ~US$67/bbl.
Exhibit 3: Upstream earnings supported by higher realisation
Total (Rs m) Q1FY20E Q4FY19 % chg Q1FY19 % chg
Sales 295,281 298,454 -1% 306,033 -4%
EBITDA 149,663 135,099 11% 161,405 -7%
PAT 57,796 49,225 17% 68,471 -16%
Source: Company, PL
July 4, 2019
Top Picks
Petronet LNG
Indraprastha Gas
Avishek Datta [email protected] | 91-22-66322254

Oil & Gas
July 4, 2019 87
Exhibit 4: Brent prices have come down in Q3
34.6
45.945.950.0
54.150.351.7
61.367.1
74.375.467.5
63.368.5
0.010.020.030.040.050.060.070.080.0
Q4F
Y16
Q1F
Y17
Q2F
Y17
Q3F
Y17
Q4F
Y17
Q1F
Y18
Q2F
Y18
Q3F
Y18
Q4F
Y18
Q1F
Y19
Q2F
Y19
Q3F
Y19
Q4F
Y19
Q1F
Y20
E
(US
$ / b
bl)
Source: Company, PL
Exhibit 5: Singapore GRMs have come down sequentially
7.8
5.0 5.1
6.7 6.4 6.4
8.3
7.3 7.1
6.0 6.1
4.3
3.2 3.5
0.01.02.03.04.05.06.07.08.09.0
Q4F
Y16
Q1F
Y17
Q2F
Y17
Q3F
Y17
Q4F
Y17
Q1F
Y18
Q2F
Y18
Q3F
Y18
Q4F
Y18
Q1F
Y19
Q2F
Y19
Q3F
Y19
Q4F
Y19
Q1F
Y20
E
(US
$ / b
bl)
Source: Company, PL
Exhibit 6: Q1FY20 Result Preview
Company Name Q1FY20E Q1FY19 YoY gr. (%)
Q4FY19 QoQ gr. (%)
Remark
Bharat Petroleum Corporation
Sales 760,473 716,967 6.1 739,904 2.8 BPCL earnings to decline sequentially due to inventory loss and muted GRMs. Improved marketing earnings and depreciating exchange rate provide downside support.
EBITDA 26,326 38,752 (32.1) 48,050 (45.2)
Margin (%) 3.5 5.4 6.5
Adj. PAT 14,298 22,933 (37.7) 31,249 (54.2)
GAIL (India)
Sales 187,049 172,986 8.1 187,639 (0.3) We expect improved earnings performance from GAIL due to higher LPG realisation. Transmission volumes will also remain healthy.
EBITDA 21,867 22,436 (2.5) 16,845 29.8
Margin (%) 11.7 13.0 9.0
Adj. PAT 12,485 12,593 (0.9) 11,227 11.2
Hindustan Petroleum Corporation
Sales 626,810 676,289 -7.3 679,381 (7.7) HPCL earnings to decline sequentially due to inventory loss and muted GRMs. Improved marketing earnings and depreciating exchange rate provide downside support.
EBITDA 26,069 31,907 (18.3) 51,662 (49.5)
Margin (%) 4.2 4.7 7.6
Adj. PAT 13,112 17,192 (23.7) 29,699 (55.9)
Indraprastha Gas
Sales 15,475 12,874 20.2 15,427 0.3 We expect IGL margins to be maintained led by price hikes in the quarter and soft spot LNG prices. Volume momentum will also be maintained.
EBITDA 3,453 2,951 17.0 3,312 4.3
Margin (%) 22.3 22.9 21.5
Adj. PAT 2,210 1,759 25.7 2,255 (2.0)
I.G. Petrochemicals
Sales 3,000 3,509 -14.5 3,131 (4.2) We expect earnings to remain sluggish given weak downstream demand and high cost inventory.
EBITDA 330 847 (61.1) 367 (10.1)
Margin (%) 11.0 24.1 11.7
Adj. PAT 169 402 (58.0) 182 (7.4)
Indian Oil Corporation
Sales 1,313,943 1,294,750 1.5 1,262,141 4.1 IOCL earnings to be impacted by lower inventory gains. Improved marketing earnings and depreciating exchange rate provide downside support.
EBITDA 70,357 125,761 (44.1) 108,759 (35.3)
Margin (%) 5.4 9.7 8.6
Adj. PAT 28,982 68,314 (57.6) 60,993 (52.5)
Mahanagar Gas
Sales 7,499 6,193 21.1 7,225 3.8 We expect MGL margins to improve led by price hikes in the quarter and soft spot LNG prices. CNG volumes to increase at ~7%YoY.
EBITDA 2,319 2,109 9.9 2,140 8.4
Margin (%) 30.9 34.1 29.6
Adj. PAT 1,466 1,284 14.2 1,335 9.8
NOCIL
Sales 2,400 2,681 -10.5 2,416 (0.7) We expect margins to come off from FY19 levels led by lower volumes and increased competitive intensity.
EBITDA 569 802 (29.1) 591 (3.7)
Margin (%) 23.7 29.9 24.5
Adj. PAT 351 508 (30.9) 358 (1.9)

Oil & Gas
July 4, 2019 88
Company Name Q1FY20E Q1FY19 YoY gr. (%) Q4FY19 QoQ gr.
(%) Remark
Oil India
Sales 31,951 33,905 -5.8 30,869 3.5
We have not factored in any subsidy burden on the company. Volume growth to be muted.
EBITDA 12,777 14,084 (9.3) 11,389 12.2
Margin (%) 40.0 41.5 36.9
Adj. PAT 6,283 7,032 (10.7) 19,047 (67.0)
Oil & Natural Gas Corporation
Sales 263,330 272,128 -3.2 267,585 (1.6) We have not factored in any subsidy burden on the company. Gas volumes will record growth.
EBITDA 136,886 147,321 (7.1) 123,710 10.7
Margin (%) 52.0 54.1 46.2
Adj. PAT 51,513 61,439 (16.2) 40,446 27.4
Petronet LNG
Sales 80,273 91,692 -12.5 83,832 (4.2)
We expect earnings to be healthy due to healthy demand traction.
EBITDA 8,729 9,344 (6.6) 6,272 39.2
Margin (%) 10.9 10.2 7.5
Adj. PAT 5,815 5,870 (0.9) 4,402 32.1
Reliance Industries
Sales 947,659 954,720 -0.7 865,720 9.5 Earnings to recover led by recovery in refining and continued strength in petrochemicals earnings.
EBITDA 149,917 151,540 (1.1) 137,040 9.4
Margin (%) 15.8 15.9 15.8
Adj. PAT 89,402 88,200 1.4 85,560 4.5
Source: Company, PL

Oil & Gas
July 4, 2019 89
Exhibit 7: Valuation Summary
Company Names Rating CMP (Rs)
TP (Rs)
Sales (Rs bn) EBITDA (Rs bn) PAT (Rs bn) EPS (Rs) RoE (%) PE (x)
FY18 FY19 FY20E FY21E FY18 FY19 FY20E FY21E FY18 FY19 FY20E FY21E FY18 FY19 FY20E FY21E FY18 FY19 FY20E FY21E FY18 FY19 FY20E FY21E
BPCL BUY 380 499 2,357.7 2,982.3 3,475.6 3,654.0 151.7 151.1 162.7 160.5 85.0 75.9 96.2 93.8 39.2 38.6 48.9 47.7 25.2 39.3 37.0 17.7 9.7 9.8 7.8 8.0
GAIL (India) BUY 308 482 536.6 683.1 812.7 918.6 76.3 103.7 113.8 119.2 45.9 66.0 74.8 79.5 20.4 29.3 33.2 35.3 11.7 15.6 16.2 15.7 15.1 10.5 9.3 8.7
HPCL BUY 289 326 2,195.1 2,754.7 3,234.1 3,526.4 107.1 115.7 123.3 131.5 72.2 66.9 45.5 50.3 47.4 43.9 29.9 33.0 31.0 23.9 14.1 13.9 6.1 6.6 9.7 8.7
Indraprastha Gas BUY 303 360 45.9 57.6 64.1 72.8 11.1 12.6 13.6 15.2 6.7 7.9 8.2 9.2 9.6 11.2 11.8 13.2 20.8 20.6 18.5 18.0 31.6 26.9 25.7 23.0
I.G. Petrochemicals BUY 257 477 11.4 13.0 14.2 18.4 2.7 2.3 2.2 2.8 1.5 1.3 1.2 1.5 47.6 40.9 37.7 48.4 31.8 21.8 16.9 18.2 5.4 6.3 6.8 5.3
Indian Oil Corporation BUY 157 207 4,214.9 5,281.5 6,004.8 6,561.0 415.9 352.2 351.9 399.1 208.0 145.1 192.9 228.2 21.9 15.8 19.9 23.5 23.2 27.8 26.5 15.9 7.1 9.9 7.9 6.7
Mahanagar Gas BUY 828 1,179 22.3 27.9 30.4 33.0 7.8 8.9 9.9 10.8 4.8 5.5 6.3 6.8 48.4 55.3 64.1 69.2 24.3 23.9 23.5 21.9 17.1 15.0 12.9 12.0
NOCIL BUY 117 221 9.7 10.4 12.0 15.0 2.6 2.9 2.8 3.7 1.7 1.8 1.8 2.4 10.3 11.2 10.9 14.7 17.4 16.7 14.6 17.5 11.4 10.5 10.7 8.0
Oil India Acc 178 236 106.6 134.1 141.8 150.6 41.9 52.2 51.4 50.6 26.7 31.3 29.8 26.8 23.5 27.6 26.3 23.6 9.4 11.7 11.5 9.9 7.6 6.4 6.8 7.5
ONGC BUY 167 223 3,622.5 2,053.6 2,051.5 2,227.2 643.3 792.7 710.1 772.3 258.2 338.3 261.9 280.1 20.1 26.4 20.4 21.8 13.0 14.5 9.7 9.7 8.3 6.3 8.2 7.7
Petronet LNG BUY 253 306 306.0 384.0 467.5 503.7 33.1 32.9 41.0 44.9 20.8 21.6 28.8 33.2 13.9 14.4 19.2 22.1 23.3 21.1 24.2 23.1 18.2 17.6 13.2 11.4
Reliance Industries Acc 1,284 1,406 2,900.4 3,664.9 4,002.0 4,284.7 517.4 596.0 659.4 710.5 336.1 366.1 412.5 462.1 53.1 57.8 65.1 72.9 11.1 11.5 12.7 13.8 24.2 22.2 19.7 17.6
Source: Company, PL
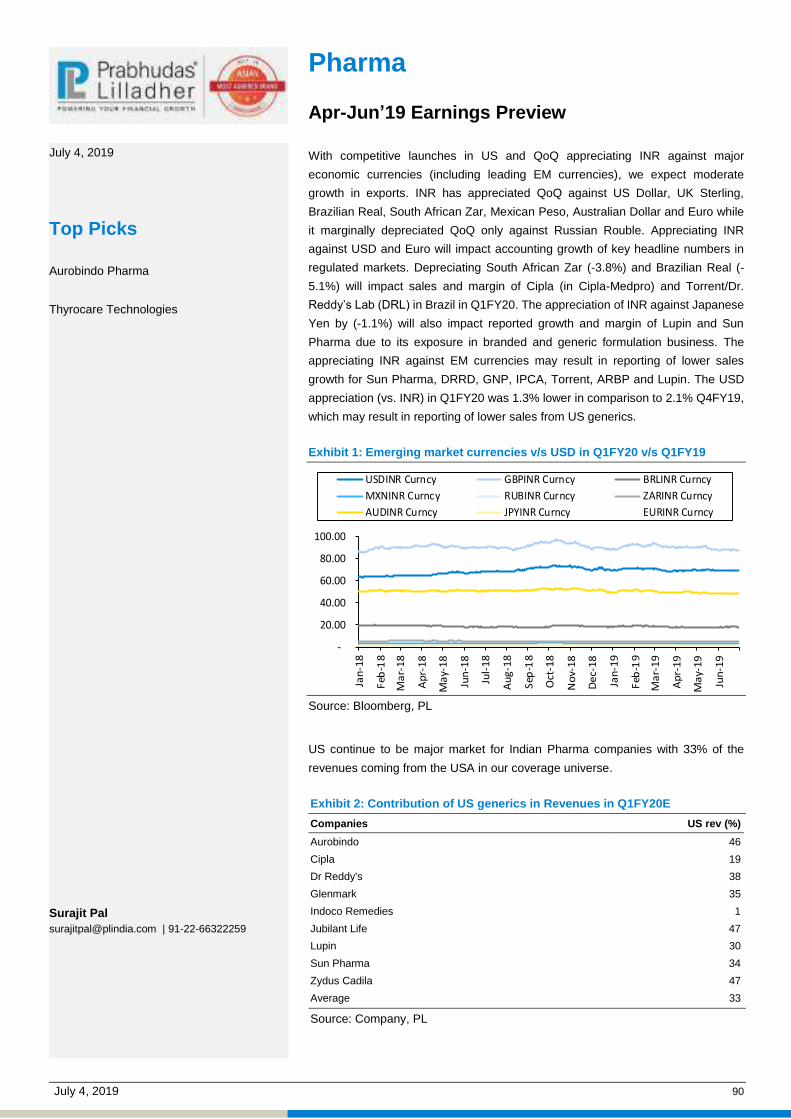
July 4, 2019 90
Pharma Apr-Jun’19 Earnings Preview With competitive launches in US and QoQ appreciating INR against major
economic currencies (including leading EM currencies), we expect moderate
growth in exports. INR has appreciated QoQ against US Dollar, UK Sterling,
Brazilian Real, South African Zar, Mexican Peso, Australian Dollar and Euro while
it marginally depreciated QoQ only against Russian Rouble. Appreciating INR
against USD and Euro will impact accounting growth of key headline numbers in
regulated markets. Depreciating South African Zar (-3.8%) and Brazilian Real (-
5.1%) will impact sales and margin of Cipla (in Cipla-Medpro) and Torrent/Dr.
Reddy’s Lab (DRL) in Brazil in Q1FY20. The appreciation of INR against Japanese
Yen by (-1.1%) will also impact reported growth and margin of Lupin and Sun
Pharma due to its exposure in branded and generic formulation business. The
appreciating INR against EM currencies may result in reporting of lower sales
growth for Sun Pharma, DRRD, GNP, IPCA, Torrent, ARBP and Lupin. The USD
appreciation (vs. INR) in Q1FY20 was 1.3% lower in comparison to 2.1% Q4FY19,
which may result in reporting of lower sales from US generics.
Exhibit 1: Emerging market currencies v/s USD in Q1FY20 v/s Q1FY19
-
20.00
40.00
60.00
80.00
100.00
Jan
-18
Feb
-18
Ma
r-1
8
Ap
r-1
8
Ma
y-1
8
Jun
-18
Jul-
18
Au
g-1
8
Sep
-18
Oct
-18
No
v-1
8
De
c-1
8
Jan
-19
Feb
-19
Ma
r-1
9
Ap
r-1
9
Ma
y-1
9
Jun
-19
USDINR Curncy GBPINR Curncy BRLINR Curncy
MXNINR Curncy RUBINR Curncy ZARINR Curncy
AUDINR Curncy JPYINR Curncy EURINR Curncy
Source: Bloomberg, PL
US continue to be major market for Indian Pharma companies with 33% of the
revenues coming from the USA in our coverage universe.
Exhibit 2: Contribution of US generics in Revenues in Q1FY20E
Companies US rev (%)
Aurobindo 46
Cipla 19
Dr Reddy's 38
Glenmark 35
Indoco Remedies 1
Jubilant Life 47
Lupin 30
Sun Pharma 34
Zydus Cadila 47
Average 33
Source: Company, PL
July 4, 2019
Top Picks
Aurobindo Pharma
Thyrocare Technologies
Surajit Pal [email protected] | 91-22-66322259

Pharma
July 4, 2019 91
Major approvals for Indian Peers: With significant improvement in the flow of
generic approvals for Indian peers in the US, companies with no major
manufacturing issues with USFDA will gain significant benefits. However, there
were very few approvals with limited competitive opportunity in Q1FY20. The new
approvals in Q4FY19 Levothyroxyn (Lupin) along with few ones in Q3FY19
(gInvanz Inj and gReyataz (both for Auro), gIsuprel (Cipla), gWelchol (Glenmark),
and gSuboxone (DRL)) will also draw benefits of full quarter sales. There will be
additional benefits from few drugs, which were launched at the fag end of Q3FY19,
such as gTreximet (Auro), gTruvada (Auro), gNuvigil (Auro) and gArixtra (Auro).
While there is a marginal growth in US for our coverage universe, we expect varied
growth for individual companies due to uneven distribution of competitive intensity
of individual products in US. We assume 1-3% QoQ price correction across the
companies in older US generics in Q1FY20. There were 69 and 65 ANDAs
approval given to Indian companies in Q1FY20 and Q4FY19 respectively, vis-à-vis
70 ANDAs in Q3FY19. The number of key approvals (with sizeable market size and
opportunity) remain far and few due to shrinking options of available molecules and
increase in number of approvals on the first day of genericisation.
Among key launches, we expect DRL to report gain of full quarter from the relaunch
of gSuboxone in the middle of Q4FY19 as it competes with three generics and one
authorized generic post vacation of the injunction order by the Appeal Court in US.
The initial earnings estimate from gSuboxone will most likely be moderated post
launch of other generics in comparison to the solo launch in Q2FY19. We believe
Aurobindo to benefit from the launch of gInvanz and gReyataz in Q4FY19 and
expect major benefit to receive in Q1FY20. Aurobindo’s surprising benefits in
gReyataz will be lower as Mylan and Cipla received approvals and launched the
drug in Q4FY19.
Exhibit 3: Movement of INR vs. major ROW currencies in Q1FY20
Foreign Exchange Rates vis-à-vis INR Q1FY20 (Avg) Q4FY19 (Avg) Growth (%)
Euro 78.14 80.04 2.4
GB Pound Sterling 89.39 91.71 2.5
Japanese Yen 0.63 0.64 1.1
Russian Rouble 1.08 1.07 (0.8)
South African Zar 4.84 5.03 3.8
Brazilian Real 17.74 18.69 5.1
USD 69.55 70.47 1.3
Mexican Peso 3.64 3.67 0.8
Source: Company, PL
With no major disruption of sales due to festivity and no benefits of lower base YoY,
we expect IPM growth to be 8-10% in Q1FY20. A vast majority of growth in Jan-
Mar 2019 was due to increase in price while significant fall in volume of older
products are noticed. We expect domestic formulation market will continue to be
challenging, especially for the companies which are highly dependent on acute
therapy drugs. It would be more challenging for large Indian Pharma companies
due to large base and strong restriction on churning out of new combination drugs.
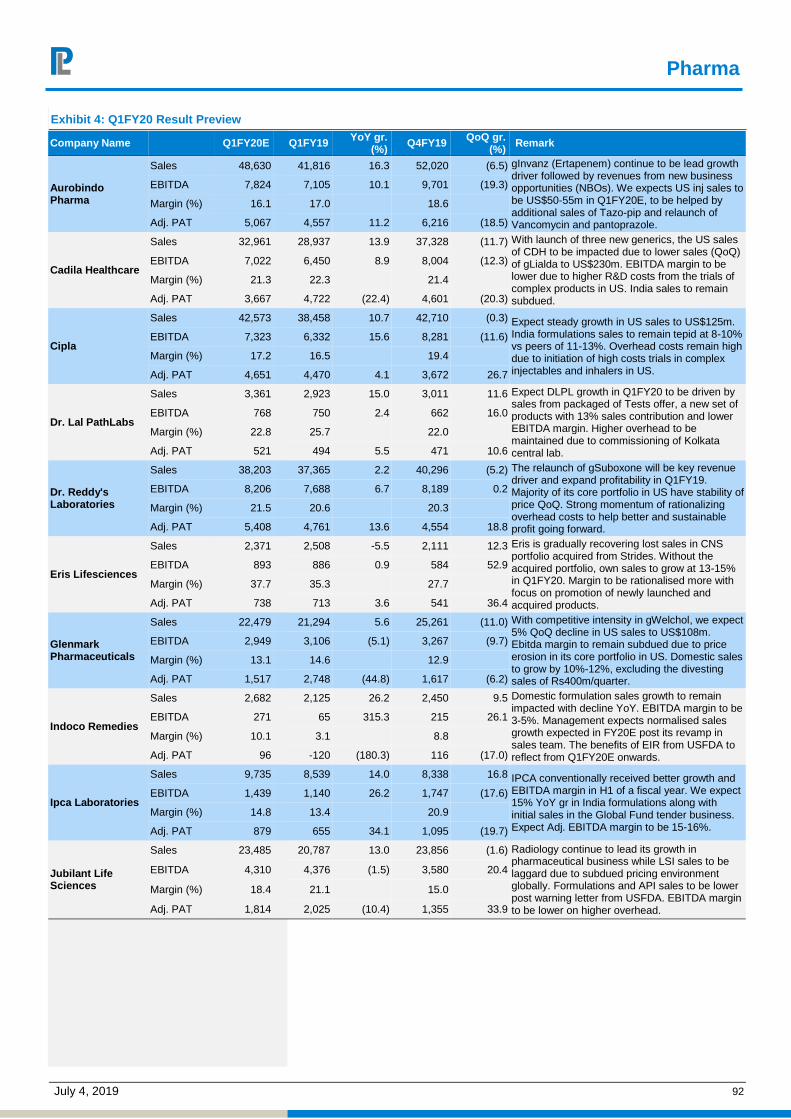
Pharma
July 4, 2019 92
Exhibit 4: Q1FY20 Result Preview
Company Name Q1FY20E Q1FY19 YoY gr. (%)
Q4FY19 QoQ gr. (%)
Remark
Aurobindo Pharma
Sales 48,630 41,816 16.3 52,020 (6.5) gInvanz (Ertapenem) continue to be lead growth driver followed by revenues from new business opportunities (NBOs). We expects US inj sales to be US$50-55m in Q1FY20E, to be helped by additional sales of Tazo-pip and relaunch of Vancomycin and pantoprazole.
EBITDA 7,824 7,105 10.1 9,701 (19.3)
Margin (%) 16.1 17.0 18.6
Adj. PAT 5,067 4,557 11.2 6,216 (18.5)
Cadila Healthcare
Sales 32,961 28,937 13.9 37,328 (11.7) With launch of three new generics, the US sales of CDH to be impacted due to lower sales (QoQ) of gLialda to US$230m. EBITDA margin to be lower due to higher R&D costs from the trials of complex products in US. India sales to remain subdued.
EBITDA 7,022 6,450 8.9 8,004 (12.3)
Margin (%) 21.3 22.3 21.4
Adj. PAT 3,667 4,722 (22.4) 4,601 (20.3)
Cipla
Sales 42,573 38,458 10.7 42,710 (0.3) Expect steady growth in US sales to US$125m. India formulations sales to remain tepid at 8-10% vs peers of 11-13%. Overhead costs remain high due to initiation of high costs trials in complex injectables and inhalers in US.
EBITDA 7,323 6,332 15.6 8,281 (11.6)
Margin (%) 17.2 16.5 19.4
Adj. PAT 4,651 4,470 4.1 3,672 26.7
Dr. Lal PathLabs
Sales 3,361 2,923 15.0 3,011 11.6 Expect DLPL growth in Q1FY20 to be driven by sales from packaged of Tests offer, a new set of products with 13% sales contribution and lower EBITDA margin. Higher overhead to be maintained due to commissioning of Kolkata central lab.
EBITDA 768 750 2.4 662 16.0
Margin (%) 22.8 25.7 22.0
Adj. PAT 521 494 5.5 471 10.6
Dr. Reddy's Laboratories
Sales 38,203 37,365 2.2 40,296 (5.2) The relaunch of gSuboxone will be key revenue driver and expand profitability in Q1FY19. Majority of its core portfolio in US have stability of price QoQ. Strong momentum of rationalizing overhead costs to help better and sustainable profit going forward.
EBITDA 8,206 7,688 6.7 8,189 0.2
Margin (%) 21.5 20.6 20.3
Adj. PAT 5,408 4,761 13.6 4,554 18.8
Eris Lifesciences
Sales 2,371 2,508 -5.5 2,111 12.3 Eris is gradually recovering lost sales in CNS portfolio acquired from Strides. Without the acquired portfolio, own sales to grow at 13-15% in Q1FY20. Margin to be rationalised more with focus on promotion of newly launched and acquired products.
EBITDA 893 886 0.9 584 52.9
Margin (%) 37.7 35.3 27.7
Adj. PAT 738 713 3.6 541 36.4
Glenmark Pharmaceuticals
Sales 22,479 21,294 5.6 25,261 (11.0) With competitive intensity in gWelchol, we expect 5% QoQ decline in US sales to US$108m. Ebitda margin to remain subdued due to price erosion in its core portfolio in US. Domestic sales to grow by 10%-12%, excluding the divesting sales of Rs400m/quarter.
EBITDA 2,949 3,106 (5.1) 3,267 (9.7)
Margin (%) 13.1 14.6 12.9
Adj. PAT 1,517 2,748 (44.8) 1,617 (6.2)
Indoco Remedies
Sales 2,682 2,125 26.2 2,450 9.5 Domestic formulation sales growth to remain impacted with decline YoY. EBITDA margin to be 3-5%. Management expects normalised sales growth expected in FY20E post its revamp in sales team. The benefits of EIR from USFDA to reflect from Q1FY20E onwards.
EBITDA 271 65 315.3 215 26.1
Margin (%) 10.1 3.1 8.8
Adj. PAT 96 -120 (180.3) 116 (17.0)
Ipca Laboratories
Sales 9,735 8,539 14.0 8,338 16.8 IPCA conventionally received better growth and EBITDA margin in H1 of a fiscal year. We expect 15% YoY gr in India formulations along with initial sales in the Global Fund tender business. Expect Adj. EBITDA margin to be 15-16%.
EBITDA 1,439 1,140 26.2 1,747 (17.6)
Margin (%) 14.8 13.4 20.9
Adj. PAT 879 655 34.1 1,095 (19.7)
Jubilant Life Sciences
Sales 23,485 20,787 13.0 23,856 (1.6) Radiology continue to lead its growth in pharmaceutical business while LSI sales to be laggard due to subdued pricing environment globally. Formulations and API sales to be lower post warning letter from USFDA. EBITDA margin to be lower on higher overhead.
EBITDA 4,310 4,376 (1.5) 3,580 20.4
Margin (%) 18.4 21.1 15.0
Adj. PAT 1,814 2,025 (10.4) 1,355 33.9
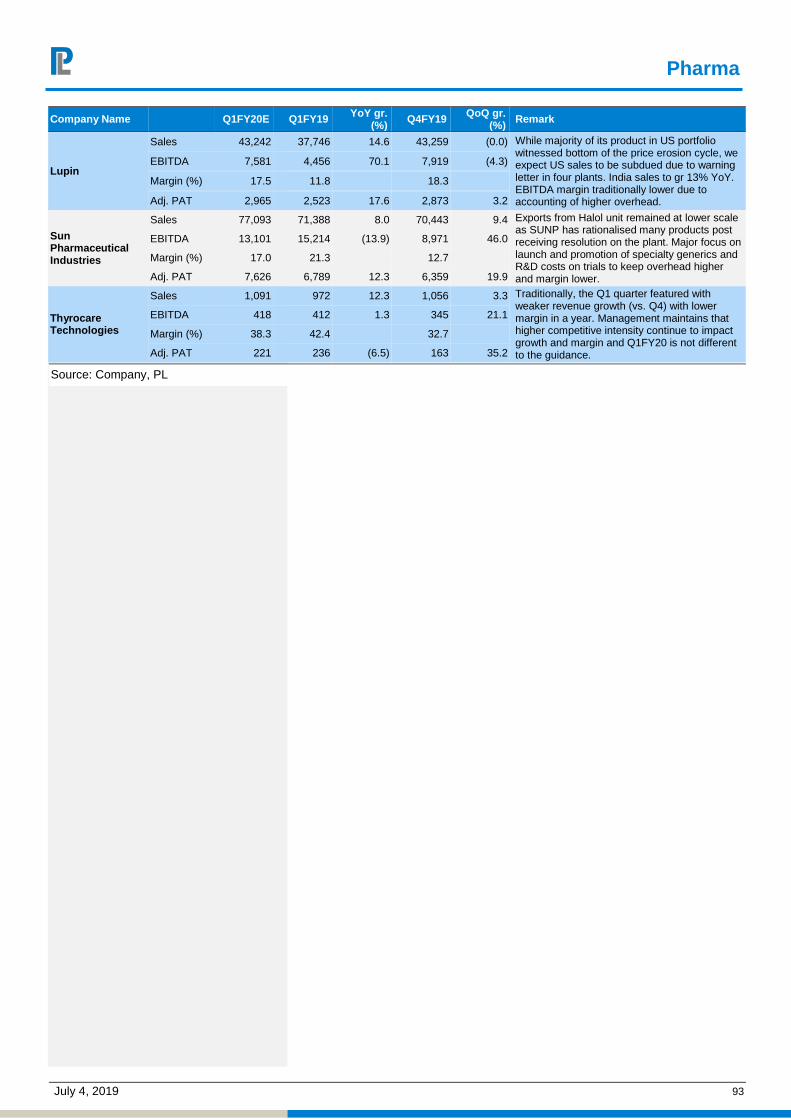
Pharma
July 4, 2019 93
Company Name Q1FY20E Q1FY19 YoY gr. (%)
Q4FY19 QoQ gr. (%)
Remark
Lupin
Sales 43,242 37,746 14.6 43,259 (0.0) While majority of its product in US portfolio witnessed bottom of the price erosion cycle, we expect US sales to be subdued due to warning letter in four plants. India sales to gr 13% YoY. EBITDA margin traditionally lower due to accounting of higher overhead.
EBITDA 7,581 4,456 70.1 7,919 (4.3)
Margin (%) 17.5 11.8 18.3
Adj. PAT 2,965 2,523 17.6 2,873 3.2
Sun Pharmaceutical Industries
Sales 77,093 71,388 8.0 70,443 9.4 Exports from Halol unit remained at lower scale as SUNP has rationalised many products post receiving resolution on the plant. Major focus on launch and promotion of specialty generics and R&D costs on trials to keep overhead higher and margin lower.
EBITDA 13,101 15,214 (13.9) 8,971 46.0
Margin (%) 17.0 21.3 12.7
Adj. PAT 7,626 6,789 12.3 6,359 19.9
Thyrocare Technologies
Sales 1,091 972 12.3 1,056 3.3 Traditionally, the Q1 quarter featured with weaker revenue growth (vs. Q4) with lower margin in a year. Management maintains that higher competitive intensity continue to impact growth and margin and Q1FY20 is not different to the guidance.
EBITDA 418 412 1.3 345 21.1
Margin (%) 38.3 42.4 32.7
Adj. PAT 221 236 (6.5) 163 35.2
Source: Company, PL

Pharma
July 4, 2019 94
Exhibit 5: Valuation Summary
Company Names Rating CMP (Rs) TP (Rs)
Sales (Rs bn) EBITDA (Rs bn) PAT (Rs bn) EPS (Rs) RoE (%) PE (x)
FY18 FY19 FY20E FY21E FY18 FY19 FY20E FY21E FY18 FY19 FY20E FY21E FY18 FY19 FY20E FY21E FY18 FY19 FY20E FY21E FY18 FY19 FY20E FY21E
Aurobindo Pharma BUY 605 932 162.3 192.9 212.8 227.7 35.2 37.2 42.6 49.6 24.0 24.5 30.0 34.1 40.9 41.8 51.2 58.2 22.8 19.1 19.6 18.8 14.8 14.5 11.8 10.4
Cadila Healthcare Acc 237 341 116.3 126.8 137.5 145.2 25.4 26.9 29.6 31.6 17.8 18.8 20.4 21.8 17.3 18.4 20.0 21.3 22.6 19.7 18.9 17.9 13.7 12.9 11.9 11.1
Cipla Reduce 552 470 147.5 156.7 170.4 185.3 27.6 24.7 30.3 33.5 18.1 14.9 17.3 18.9 22.5 18.5 21.5 23.5 13.5 10.2 11.0 10.9 24.5 29.8 25.7 23.5
Dr. Lal PathLabs Acc 1,077 1,120 10.6 12.0 14.7 16.9 2.6 2.9 3.5 4.1 1.7 2.0 2.5 2.9 20.5 23.9 29.8 34.7 24.6 22.9 24.5 24.2 52.5 45.0 36.1 31.0
Dr. Reddy's Laboratories Hold 2,602 2,997 142.8 154.5 169.8 189.8 23.5 31.8 39.9 46.5 9.5 19.5 23.6 27.6 57.0 117.5 142.2 166.5 7.6 14.7 15.6 15.8 45.6 22.2 18.3 15.6
Eris Lifesciences Acc 498 812 8.3 10.2 12.0 13.7 2.9 3.6 4.3 5.0 2.9 3.4 4.0 4.6 21.4 25.1 28.7 33.2 41.2 34.3 29.5 26.1 23.3 19.9 17.3 15.0
Glenmark Pharmaceuticals Reduce 440 589 89.7 99.4 109.5 117.0 14.8 16.9 18.9 20.8 8.4 9.9 7.5 11.9 29.8 35.0 26.6 42.1 17.4 18.3 12.6 17.3 14.8 12.6 16.5 10.5
Indoco Remedies HOLD 159 182 10.2 9.4 11.4 12.8 1.1 0.5 1.5 1.9 0.5 -0.0 0.7 1.0 5.1 -0.2 7.8 11.2 7.1 -0.3 10.4 13.4 31.0 -696.1 20.4 14.2
Ipca Laboratories BUY 949 908 32.8 37.7 43.3 49.6 4.5 6.8 8.1 9.6 2.4 4.3 5.4 6.5 19.0 33.6 42.5 51.2 9.3 14.6 15.8 16.3 50.0 28.2 22.3 18.5
Jubilant Life Sciences Reduce 496 648 74.6 90.0 96.9 103.7 14.3 16.3 17.9 19.3 6.4 5.7 9.2 10.3 41.3 36.1 57.7 64.9 17.1 12.9 17.5 16.8 12.0 13.8 8.6 7.6
Lupin Reduce 754 730 155.6 163.7 181.1 199.3 29.0 25.3 34.4 39.8 17.1 9.4 13.0 16.9 37.9 20.8 28.8 37.4 12.6 6.9 9.3 11.4 19.9 36.2 26.2 20.1
Sun Pharmaceutical Industries Reduce 392 396 260.7 281.1 304.7 321.8 51.8 60.4 67.0 70.6 18.7 29.8 45.5 47.6 7.8 12.4 18.9 19.8 5.0 7.5 11.3 11.7 50.2 31.5 20.7 19.8
Thyrocare Technologies BUY 466 595 3.6 4.0 4.6 5.2 1.4 1.5 1.6 1.9 0.9 0.9 1.0 1.1 17.4 16.1 18.6 20.6 21.9 19.4 21.7 22.1 26.8 28.9 25.0 22.6
Source: Company, PL

July 4, 2019 95
July 4, 2019
Jinesh Joshi [email protected] | 91-22-66322238
Others Apr-Jun’19 Earnings Preview
Q1FY20 Result Preview
Company Name Q1FY20E Q1FY19 YoY gr. (%) Q4FY19 QoQ gr.
(%) Remark
VIP Industries
Sales 6,317 5,178 22.0 4,350 45.2 We expect top-line growth to be upwards of 20% given upscaling visible at the mass end of the luggage industry post GST implementation & ensuing product premiumsation. However, gross margins are expected to remain under pressure due to adverse product mix.
EBITDA 847 962 (12.0) 396 113.9
Margin (%) 13.4 18.6 9.1
Adj. PAT 545 634 (13.9) 253 115.6
Source: Company, PL
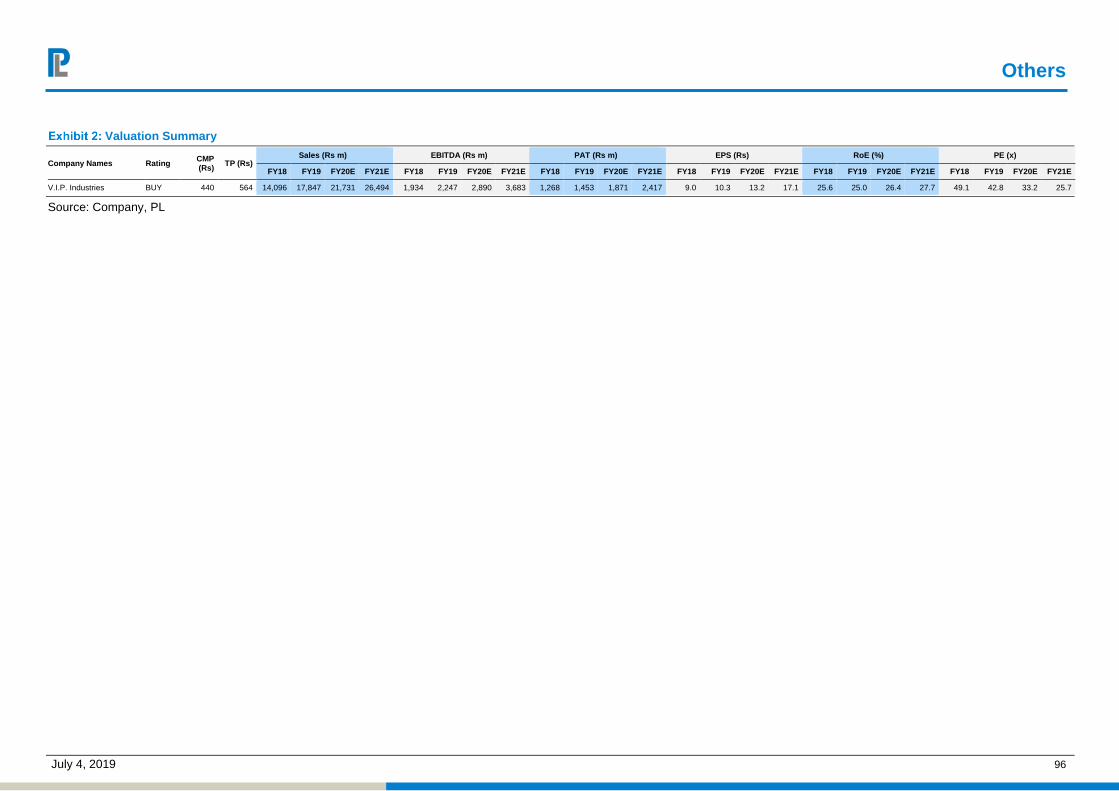
Others
July 4, 2019 96
Valuation Summary
Company Names Rating CMP (Rs) TP (Rs)
Sales (Rs m) EBITDA (Rs m) PAT (Rs m) EPS (Rs) RoE (%) PE (x)
FY18 FY19 FY20E FY21E FY18 FY19 FY20E FY21E FY18 FY19 FY20E FY21E FY18 FY19 FY20E FY21E FY18 FY19 FY20E FY21E FY18 FY19 FY20E FY21E
V.I.P. Industries BUY 440 564 14,096 17,847 21,731 26,494 1,934 2,247 2,890 3,683 1,268 1,453 1,871 2,417 9.0 10.3 13.2 17.1 25.6 25.0 26.4 27.7 49.1 42.8 33.2 25.7
Source: Company, PL

Apr-Jun ‘19 Earnings Preview
July 4, 2019 97
PL’s Recommendation Nomenclature (Absolute Performance)
Buy : > 15% Accumulate : 5% to 15% Hold : +5% to -5% Reduce : -5% to -15% Sell : < -15% Not Rated (NR) : No specific call on the stock Under Review (UR) : Rating likely to change shortly

Apr-Jun ‘19 Earnings Preview
July 4, 2019 98
ANALYST CERTIFICATION
(Indian Clients)
We/I, Mr. Amnish Aggarwal- MBA, CFA, Research Analysts, authors and the names subscribed to this report, hereby certify that all of the views expressed in this research report accurately reflect our views about the subject issuer(s) or securities. We also certify that no part of our compensation was, is, or will be directly or indirectly related to the specific recommendation(s) or view(s) in this report.
(US Clients)
The research analysts, with respect to each issuer and its securities covered by them in this research report, certify that: All of the views expressed in this research report accurately reflect his or her or their personal views about all of the issuers and their securities; and No part of his or her or their compensation was, is or will be directly related to the specific recommendation or views expressed in this research report.
DISCLAIMER
Indian Clients Prabhudas Lilladher Pvt. Ltd, Mumbai, India (hereinafter referred to as “PL”) is engaged in the business of Stock Broking, Portfolio Manager, Depository Participant and distribution for third party financial products. PL is a subsidiary of Prabhudas Lilladher Advisory Services Pvt Ltd. which has its various subsidiaries engaged in business of commodity broking, investment banking, financial services (margin funding) and distribution of third party financial/other products, details in respect of which are available at www.plindia.com.
This document has been prepared by the Research Division of PL and is meant for use by the recipient only as information and is not for circulation. This document is not to be reported or copied or made available to others without prior permission of PL. It should not be considered or taken as an offer to sell or a solicitation to buy or sell any security.
The information contained in this report has been obtained from sources that are considered to be reliable. However, PL has not independently verified the accuracy or completeness of the same. Neither PL nor any of its affiliates, its directors or its employees accepts any responsibility of whatsoever nature for the information, statements and opinion given, made available or expressed herein or for any omission therein.
Recipients of this report should be aware that past performance is not necessarily a guide to future performance and value of investments can go down as well. The suitability or otherwise of any investments will depend upon the recipient's particular circumstances and, in case of doubt, advice should be sought from an independent expert/advisor.
Either PL or its affiliates or its directors or its employees or its representatives or its clients or their relatives may have position(s), make market, act as principal or engage in transactions of securities of companies referred to in this report and they may have used the research material prior to publication.
PL may from time to time solicit or perform investment banking or other services for any company mentioned in this document.
PL is in the process of applying for certificate of registration as Research Analyst under Securities and Exchange Board of India (Research Analysts) Regulations, 2014
PL submits that no material disciplinary action has been taken on us by any Regulatory Authority impacting Equity Research Analysis activities.
PL or its research analysts or its associates or his relatives do not have any financial interest in the subject company.
PL or its research analysts or its associates or his relatives do not have actual/beneficial ownership of one per cent or more securities of the subject company at the end of the month immediately preceding the date of publication of the research report.
PL or its research analysts or its associates or his relatives do not have any material conflict of interest at the time of publication of the research report.
PL or its associates might have received compensation from the subject company in the past twelve months.
PL or its associates might have managed or co-managed public offering of securities for the subject company in the past twelve months or mandated by the subject company for any other assignment in the past twelve months.
PL or its associates might have received any compensation for investment banking or merchant banking or brokerage services from the subject company in the past twelve months.
PL or its associates might have received any compensation for products or services other than investment banking or merchant banking or brokerage services from the subject company in the past twelve months
PL or its associates might have received any compensation or other benefits from the subject company or third party in connection with the research report.
PL encourages independence in research report preparation and strives to minimize conflict in preparation of research report. PL or its analysts did not receive any compensation or other benefits from the subject Company or third party in connection with the preparation of the research report. PL or its Research Analysts do not have any material conflict of interest at the time of publication of this report.
It is confirmed that Mr. Amnish Aggarwal- MBA, CFA, Research Analysts of this report have not received any compensation from the companies mentioned in the report in the preceding twelve months
Compensation of our Research Analysts is not based on any specific merchant banking, investment banking or brokerage service transactions.
The Research analysts for this report certifies that all of the views expressed in this report accurately reflect his or her personal views about the subject company or companies and its or their securities, and no part of his or her compensation was, is or will be, directly or indirectly related to specific recommendations or views expressed in this report.
The research analysts for this report has not served as an officer, director or employee of the subject company PL or its research analysts have not engaged in market making activity for the subject company
Our sales people, traders, and other professionals or affiliates may provide oral or written market commentary or trading strategies to our clients that reflect opinions that are contrary to the opinions expressed herein, and our proprietary trading and investing businesses may make investment decisions that are inconsistent with the recommendations expressed herein. In reviewing these materials, you should be aware that any or all o the foregoing, among other things, may give rise to real or potential conflicts of interest.
PL and its associates, their directors and employees may (a) from time to time, have a long or short position in, and buy or sell the securities of the subject company or (b) be engaged in any other transaction involving such securities and earn brokerage or other compensation or act as a market maker in the financial instruments of the subject company or act as an advisor or lender/borrower to the subject company or may have any other potential conflict of interests with respect to any recommendation and other related information and opinions.
US Clients This research report is a product of Prabhudas Lilladher Pvt. Ltd., which is the employer of the research analyst(s) who has prepared the research report. The research analyst(s) preparing the research report is/are resident outside the United States (U.S.) and are not associated persons of any U.S. regulated broker-dealer and therefore the analyst(s) is/are not subject to supervision by a U.S. broker-dealer, and is/are not required to satisfy the regulatory licensing requirements of FINRA or required to otherwise comply with U.S. rules or regulations regarding, among other things, communications with a subject company, public appearances and trading securities held by a research analyst account.
This report is intended for distribution by Prabhudas Lilladher Pvt. Ltd. only to "Major Institutional Investors" as defined by Rule 15a-6(b)(4) of the U.S. Securities and Exchange Act, 1934 (the Exchange Act) and interpretations thereof by U.S. Securities and Exchange Commission (SEC) in reliance on Rule 15a 6(a)(2). If the recipient of this report is not a Major Institutional Investor as specified above, then it should not act upon this report and return the same to the sender. Further, this report may not be copied, duplicated and/or transmitted onward to any U.S. person, which is not the Major Institutional Investor.
In reliance on the exemption from registration provided by Rule 15a-6 of the Exchange Act and interpretations thereof by the SEC in order to conduct certain business with Major Institutional Investors, Prabhudas Lilladher Pvt. Ltd. has entered into an agreement with a U.S. registered broker-dealer, Marco Polo Securities Inc. ("Marco Polo").
Transactions in securities discussed in this research report should be effected through Marco Polo or another U.S. registered broker dealer.
Prabhudas Lilladher Pvt. Ltd. 3rd Floor, Sadhana House, 570, P. B. Marg, Worli, Mumbai-400 018, India | Tel: (91 22) 6632 2222 Fax: (91 22) 6632 2209
www.plindia.com | Bloomberg Research Page: PRLD <GO>

Apr-Jun ‘19 Earnings Preview
July 4, 2019 99
Notes

Apr-Jun ‘19 Earnings Preview
July 4, 2019 100
Report Archives


