
Application of Predictive Analytics for Better Alignment of Business
and IT Boris Zibitsker, PhD
July 25, 2014 Big Data Summit - Riga, Latvia

About the Presenter
• Boris Zibitsker started out as engineer at Computer Systems Research Institute working on modeling of computer systems and developing scheduling and storage management optimization algorithms
• Capacity management departments at Large Bank (FNBC) and Large Insurance company (CNA) • Founder, CTO and Chairman of BEZ Systems (1983), acquired by Compuware in 2010 • At BEZ Systems Boris managed development of the commercial capacity management tools
supporting multi-tier distributed parallel processing Teradata, Oracle, DB2 and SQL Server and J2EE Application servers
• Co-founder of Computer Systems Institute (1989) • Founder of BEZNext (2011) • Consulted many of Fortune 500 companies • Current focus is on applying predictive analytics, machine learning and queueing theory for
optimizing business and IT strategic, tactical and operational decisions • MS and PhD research at BSUIR and NIIEVM • Taught graduate courses on Modeling of Computer Systems, Queueing Theory with Computer
Applications, Computer Communication Systems Design and Analysis at DePaul University in Chicago
• Taught capacity management courses for the Relational Institute founded by pioneers of relational technology Dr. Ted Codd and Chris Date
• Presented many papers on modeling, workload characterization, performance management, workload management and capacity planning
Boris Zibitsker, All Rights Reserved 2

Abstract
• Business decisions changing business processes often done without knowing how it will affect IT.
• On the other hand, it is difficult to make effective IT decisions with limited information about business processes and how they will change demand for IT resources.
• Luck of information about change of demand for resources and uncertainty how it will affect performance make it difficult to justify IT decisions related to architecture, hardware, software and DBMS platforms and configurations, implementation of Big Data and other technologies.
• As a result it is difficult to set realistic service level goals and performance expectations.
• It causes an uncertainty, risk of performance surprises and disappointment with high cost of IT.
• In this presentation, we will review several case studies illustrating how predictive analytics and optimization enables better alignment of business and IT through justification of strategic, tactical and operational proactive IT actions and verification of results.
Boris Zibitsker, All Rights Reserved 3
Outline
• Introduction
• Methodology
• Data Collection
• Workload Characterization
• Workload Forecasting
• Performance Prediction
• Verification of Results
Boris Zibitsker, All Rights Reserved 4

INTRODUCTION
5
Boris Zibitsker, All Rights Reserved 5
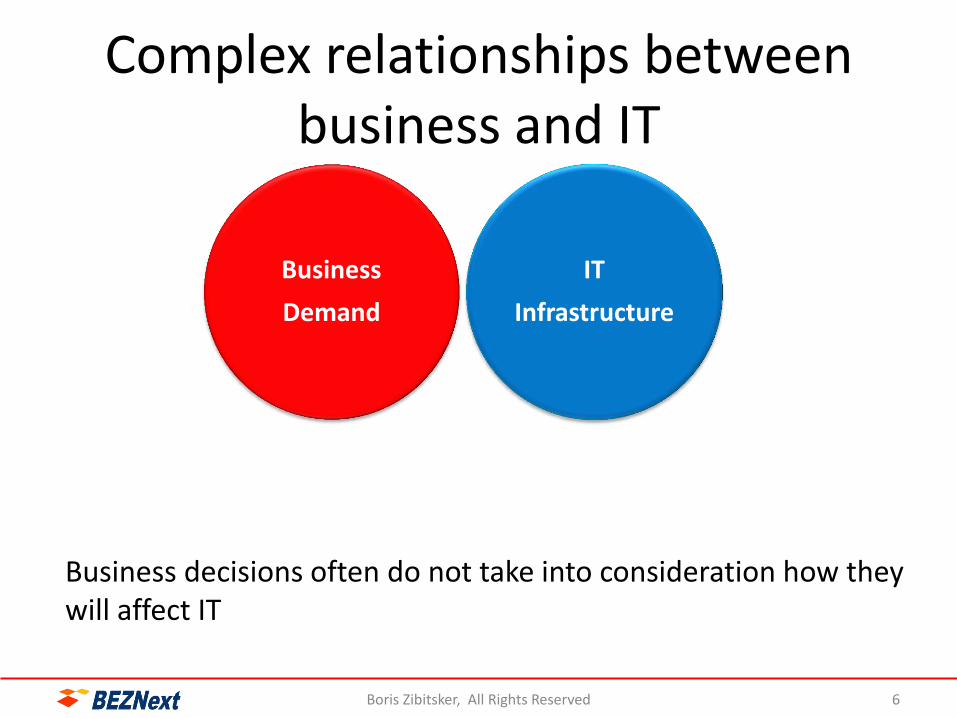
Complex relationships between business and IT
Boris Zibitsker, All Rights Reserved 6
Business
Demand
Big Data
IT
Infrastructure
Business decisions often do not take into consideration how they will affect IT

Role of Big Data Reduce Cost, Load and Access Different Data Faster
Apply Analytics to Make Better Decisions
Boris Zibitsker, All Rights Reserved 7
Business
Demand
Big Data
Predictive Analytics
IT
Infrastructure
Big data predictive analytics enables better alignment of business and IT

Business Demand is Constantly Changing
• Growth
• New Business Processes
• New Applications
• New Sources of Data – Business Process Models
– Enterprise Data Model
– Results of Testing
• Changing Business Plan
• Budget
Boris Zibitsker, All Rights Reserved 8
Resources
Pe
rfo
rma
nc
e

Big Data Hadoop Cluster is a Part of the IT Infrastructure
Boris Zibitsker, All Rights Reserved 9
MKT
VM
VM
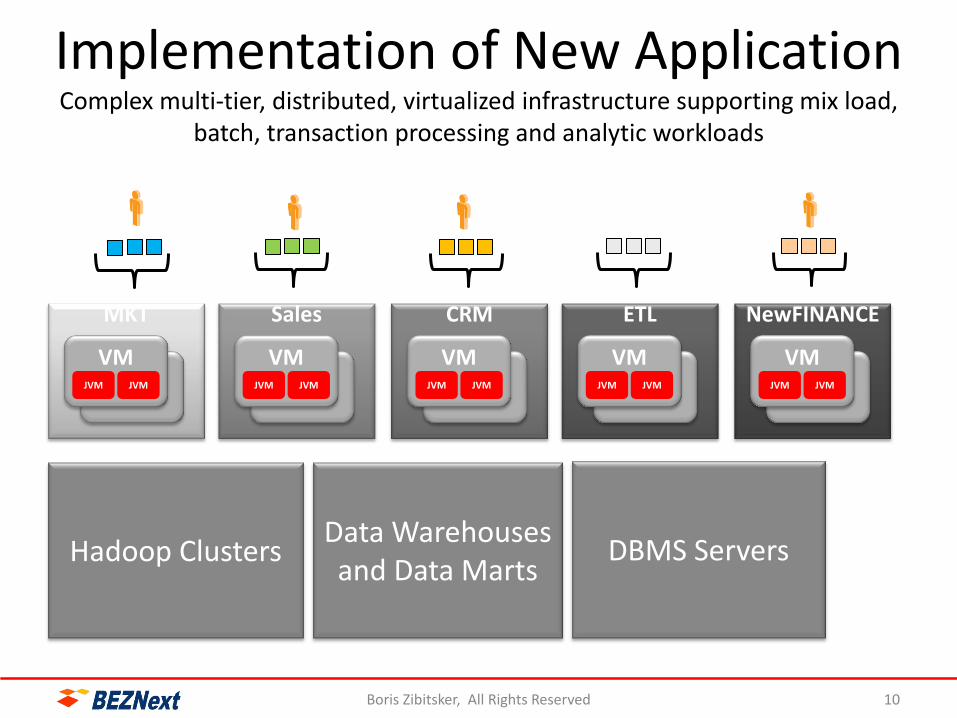
Implementation of New Application Complex multi-tier, distributed, virtualized infrastructure supporting mix load,
batch, transaction processing and analytic workloads
Boris Zibitsker, All Rights Reserved 10
Hadoop Clusters Data Warehouses and Data Marts
DBMS Servers
JVM JVM
Sales
VM
VM JVM JVM
CRM
VM
VM JVM JVM
ETL
VM
VM JVM JVM
NewFINANCE
VM
VM JVM JVM

METHODOLOGY
it is difficult to make effective IT decisions with limited information about business processes and how they will change demand for IT resources.
11
Boris Zibitsker, All Rights Reserved 11

Application of Predictive Analytics for Production and Test Environments
• Service Level Goals
• Data Collection
• Workload Characterization
• Workload Forecasting
• Building Models
• Predicting Impact of Moving New Application to Production Environment
• Justification of Architecture
• Capacity Management – Capacity Planning
– Performance Management
– Workload Management
• Setting expectations
• Verification
Boris Zibitsker, All Rights Reserved 12

Major Factors Affecting Performance and Service Level Goals
• Workload profile – Performance
– Usage of resources
– Usage of data
• Expected growth
• Architecture – Hardware
configuration
– Software configuration
– Virtual configuration
• Application design
• Design
Workload Growth
Resp
on
se T
ime
Service
Time (S)
Queueing
Time (Q)
DelayTime
(D)
SLG
Boris Zibitsker, All Rights Reserved 13
13 Boris Zibitsker, All Rights Reserved

Types of Workloads and SLGs
• Business Process – Applications
– Data
• Load – ETL/ELT
• Access – Transaction Processing
– Analytics / DSS
• Cost / Performance
• Load data on time
• Response Time and Throughput
Boris Zibitsker, All Rights Reserved 14

Wo
rklo
ad
s
SLGs
Action
Role of Modeling and Optimization in Justification of Decisions
Modeling
Optimization
CRM
HR
ETL
Sales
MKT
Decision
15 Boris Zibitsker, All Rights Reserved
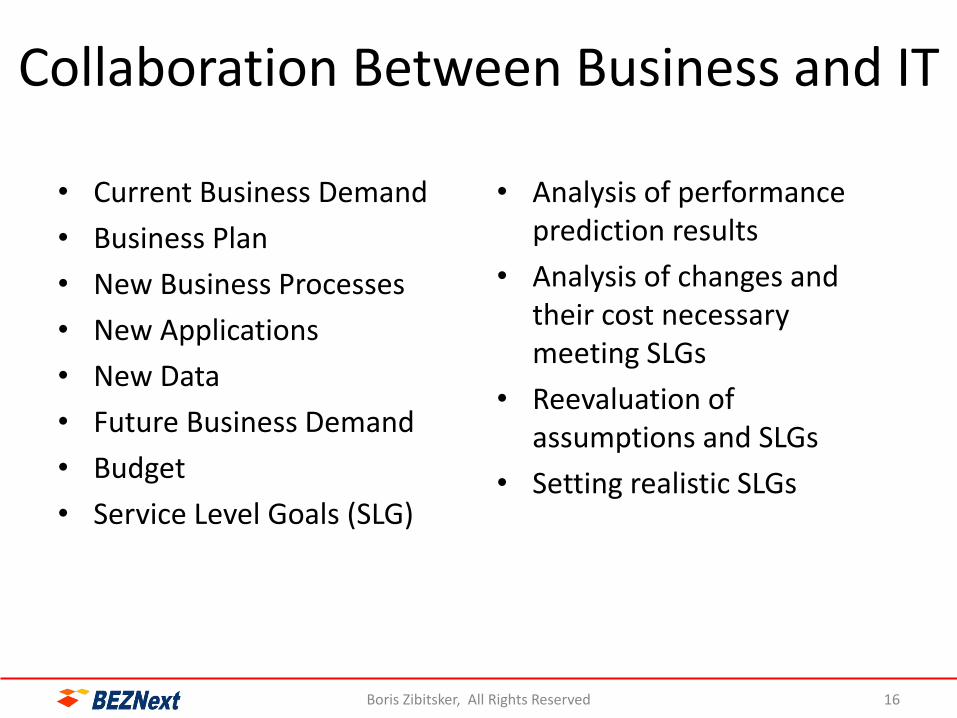
Collaboration Between Business and IT
• Current Business Demand
• Business Plan
• New Business Processes
• New Applications
• New Data
• Future Business Demand
• Budget
• Service Level Goals (SLG)
• Analysis of performance prediction results
• Analysis of changes and their cost necessary meeting SLGs
• Reevaluation of assumptions and SLGs
• Setting realistic SLGs
Boris Zibitsker, All Rights Reserved 16
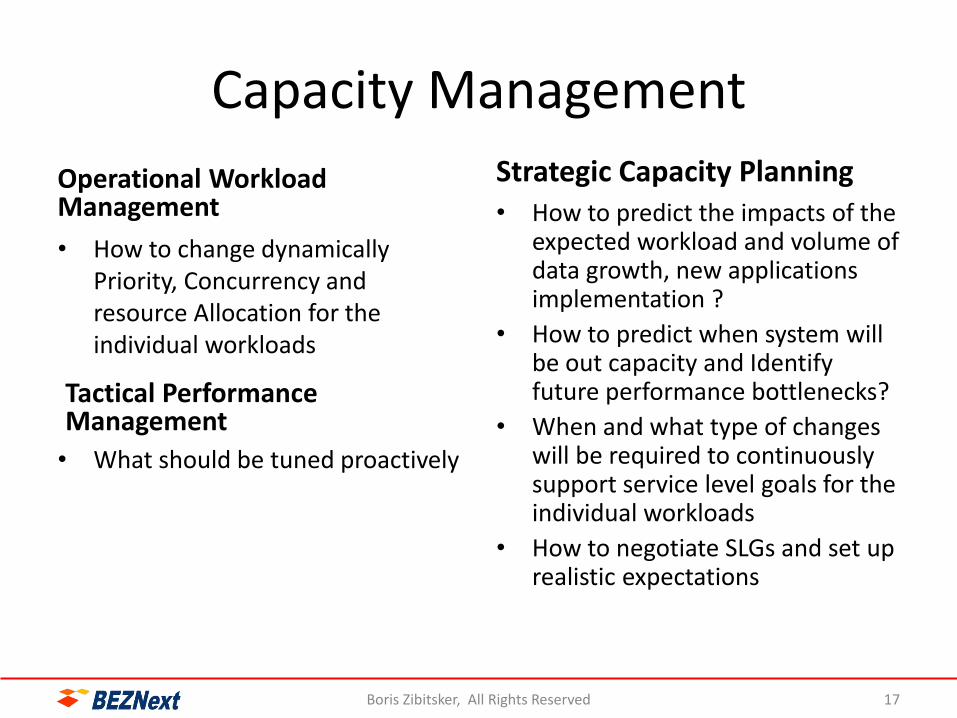
Capacity Management
Operational Workload Management
• How to change dynamically Priority, Concurrency and resource Allocation for the individual workloads
• What should be tuned proactively
Strategic Capacity Planning • How to predict the impacts of the
expected workload and volume of data growth, new applications implementation ?
• How to predict when system will be out capacity and Identify future performance bottlenecks?
• When and what type of changes will be required to continuously support service level goals for the individual workloads
• How to negotiate SLGs and set up realistic expectations
Boris Zibitsker, All Rights Reserved 17
Tactical Performance Management
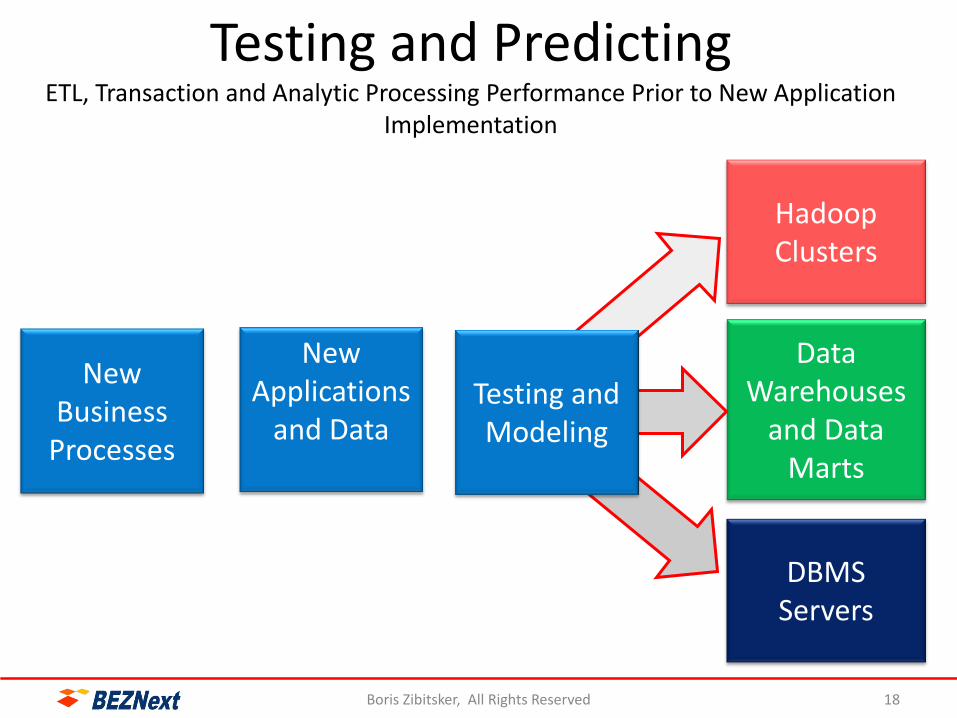
Testing and Predicting ETL, Transaction and Analytic Processing Performance Prior to New Application
Implementation
Boris Zibitsker, All Rights Reserved 18
Hadoop Clusters
New Applications
and Data DBMS
Servers
Data Warehouses
and Data Marts
Testing and Modeling
New Business
Processes

DATA COLLECTION
19
Boris Zibitsker, All Rights Reserved 19

Data Collection
• Configuration
• OS
• Application
• Frequency
• Overhead
• Data repository
Boris Zibitsker, All Rights Reserved 20

WORKLOAD CHARACTERIZATION
Workload aggregation
Workload characterization
Workload profiles
Performance analysis
21
Boris Zibitsker, All Rights Reserved 21
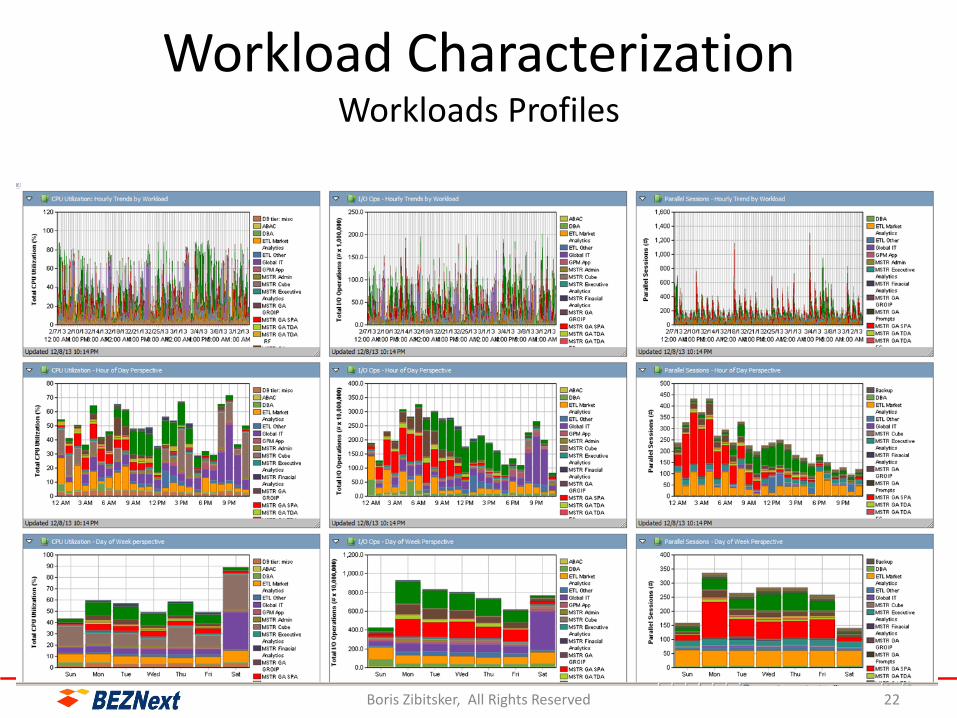
Workload Characterization Workloads Profiles
22 Boris Zibitsker, All Rights Reserved

ETL is a Most Resource Consuming Workload
Boris Zibitsker, All Rights Reserved 23

Boris Zibitsker, All Rights Reserved
The Largest Component of the ETL is Disk Wait Time
24
24
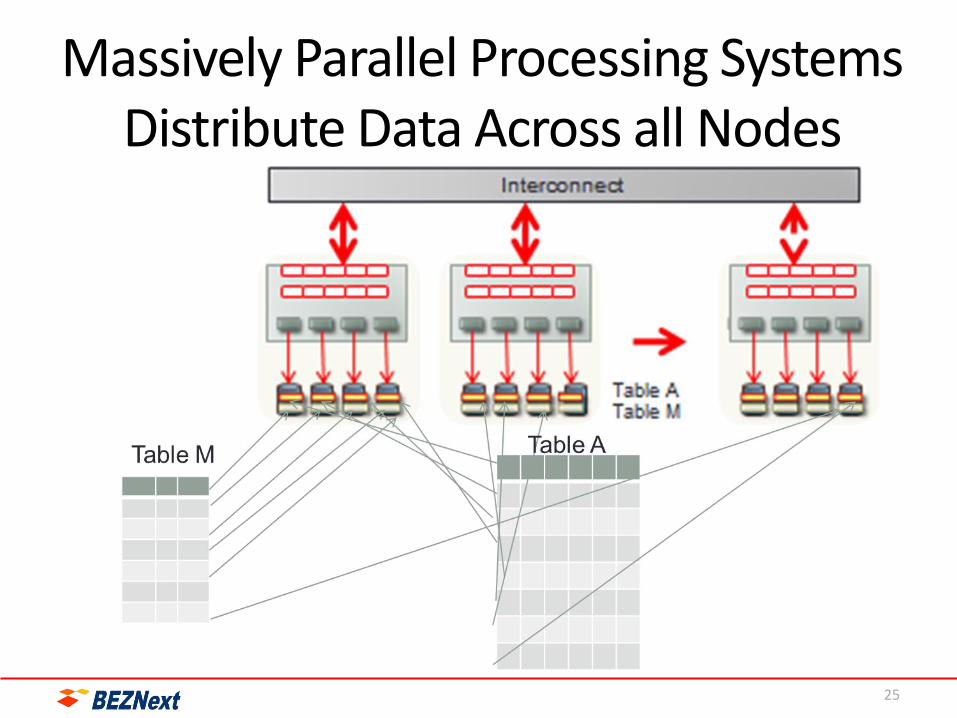
Massively Parallel Processing Systems Distribute Data Across all Nodes
25

Structured Data
Implementation Traditional ETL Processes Challenges
Long development and modification time
26 Boris Zibitsker, All Rights Reserved
ETL/ELT EDW ETL
DM
DM
Data Collection& Processing
Integration Business View
Data Collection& Processing
Business / Department Specific
No Visibility into transactional
data
EDW is used as an ETL tool with 100s of transient staging
Tables
Doesn’t scale High License
Cost
Takes a lot of time to understand source and define destination table
structure
High complexity of loosely
structured data

Boris Zibitsker, All Rights Reserved
Long ETL Time and Inconsistent Response Time in DW Environment
LOAD jobs wait for processing for several days
and some of them are finishing only during
weekends
27
27

One of the Advantages of Big Data Late Binding
• Do not map data before and during load time, instead map data during query time
dynamically!
28 Boris Zibitsker, All Rights Reserved

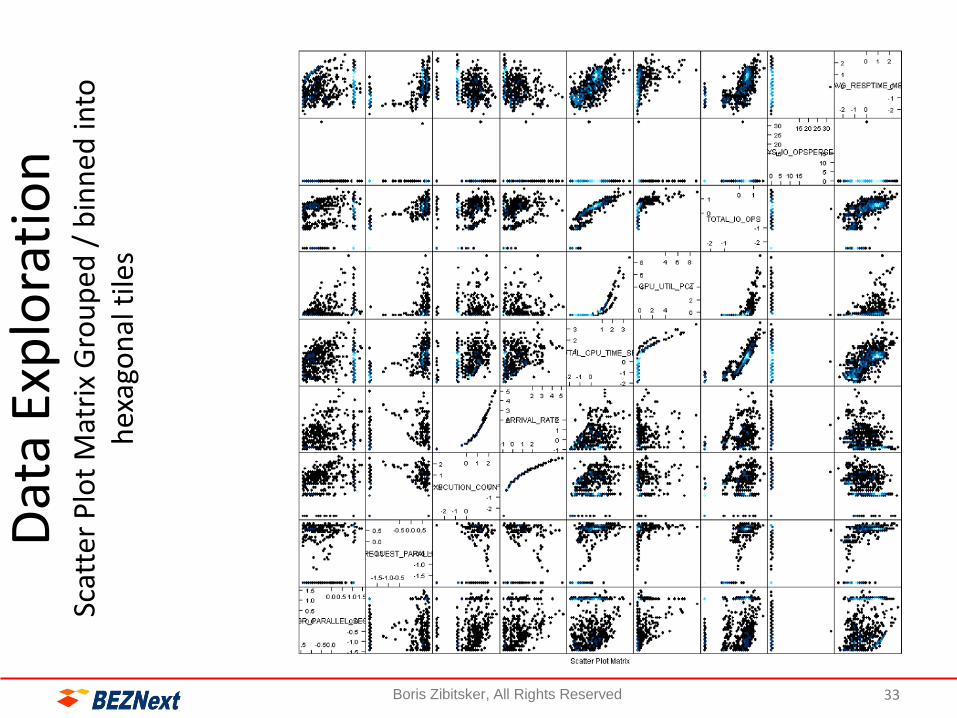
Data Exploration Cluster Analysis - Unsupervised learning
• Discover structure in collection of data
• Multi Variable Cluster Analysis Identifies Groups of Requests with Similar Performance and Resource Utilization Characteristics
• Often used for exploratory analysis
Boris Zibitsker, All Rights Reserved 29

Data Exploration K-mean Clusters - Total CPU, Avg RT and I/O
• k-means clustering partition n observations into k clusters in which each observation belongs to the cluster with the nearest mean, serving as a prototype of the cluster.
– Input: Points in an n-dimensional space and a
parameter k
– Output: Grouping of the points into k clusters
and a representative/central point for each
cluster
Boris Zibitsker, All Rights Reserved 30

Data Exploration - MClust Results Average Response Time vs Total CPU Time vs Total I/O
Boris Zibitsker, All Rights Reserved 31

Data Exploration Response Time Distribution by Workload and System
EDW Hadoop
Boris Zibitsker, All Rights Reserved 32
Boris Zibitsker, All Rights Reserved
Dat
a Ex
plo
rati
on
Sc
atte
r P
lot
Mat
rix
Gro
up
ed
/ b
inn
ed
into
h
exag
on
al t
iles
33
33

Boris Zibitsker, All Rights Reserved
Determining Significant Changes Statistical Process Control
RT, Throughput and Resource Utilization
34
34

Support Vector Machines Supervised Learning
– Linear and non linear classification segregates good tests from bad tests based on previous training
– Good performance vs performance anomaly
Boris Zibitsker, All Rights Reserved 35
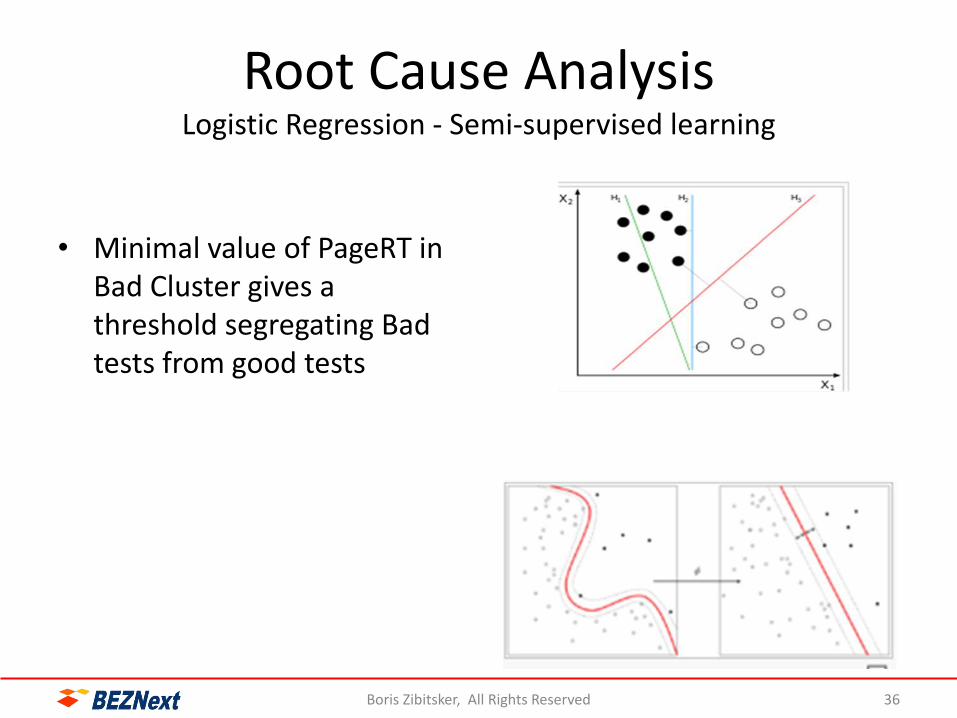
Root Cause Analysis Logistic Regression - Semi-supervised learning
• Minimal value of PageRT in Bad Cluster gives a threshold segregating Bad tests from good tests
Boris Zibitsker, All Rights Reserved 36

Root Cause Analysis Decision Tree - Leaf page and branches identify the cause
Boris Zibitsker, All Rights Reserved 37
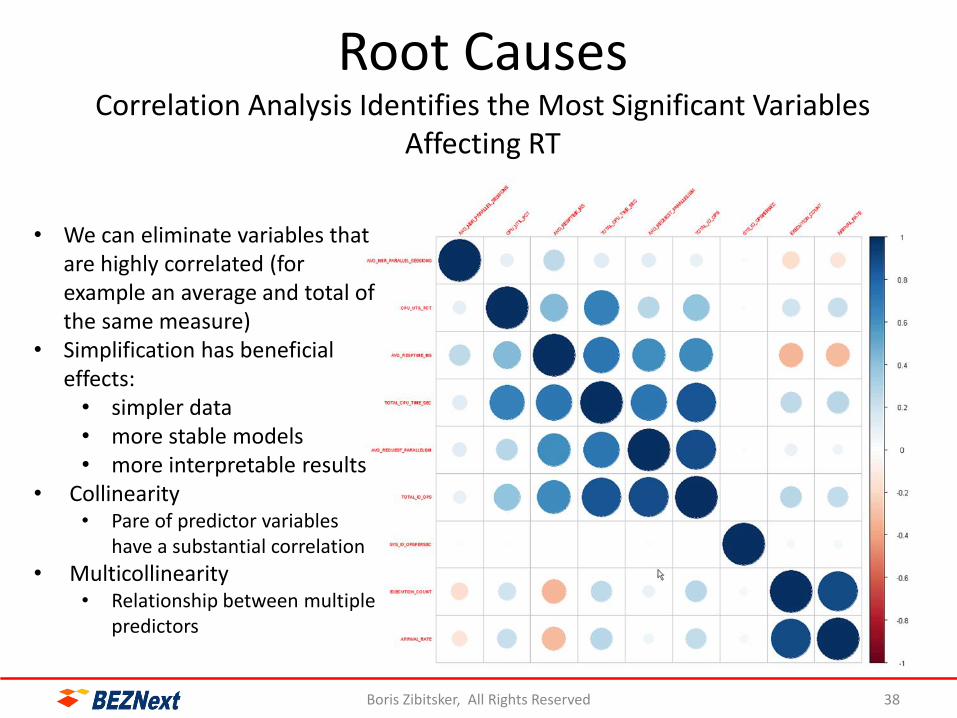
Root Causes Correlation Analysis Identifies the Most Significant Variables
Affecting RT
• We can eliminate variables that are highly correlated (for example an average and total of the same measure)
• Simplification has beneficial effects: • simpler data • more stable models • more interpretable results
• Collinearity • Pare of predictor variables
have a substantial correlation
• Multicollinearity • Relationship between multiple
predictors
Boris Zibitsker, All Rights Reserved 38
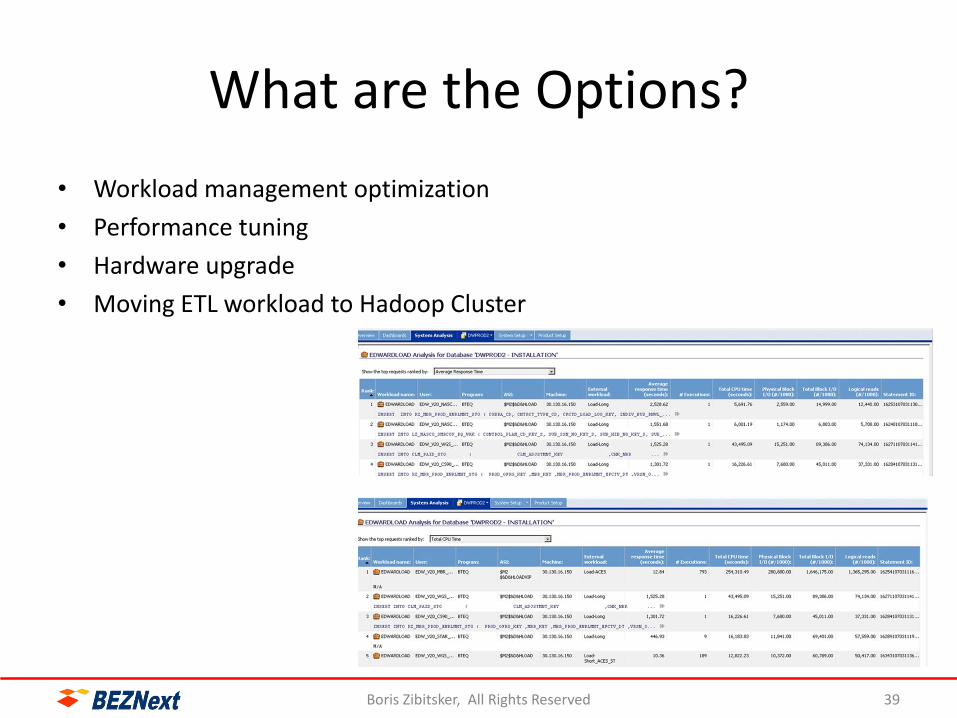
What are the Options?
• Workload management optimization
• Performance tuning
• Hardware upgrade
• Moving ETL workload to Hadoop Cluster
Boris Zibitsker, All Rights Reserved 39

WORKLOAD FORECASTING
Increase in number of users
Volume of data growth
New application implementation
40
Boris Zibitsker, All Rights Reserved 40

Workload Forecasting
Growth Factors
• Workload growth
• Volume of data growth
• Implementation of new applications
• Applications modification
Sources of Data
• Historical Trend - Regression analysis
• Business plan
• Application implementation plan
• Application modification plan
• Workload characterization on production and test platforms
Boris Zibitsker, All Rights Reserved 41

Boris Zibitsker, All Rights Reserved
Workload Forecasting Trend Analysis
Increase in Number of Requests
© Boris Zibitsker, All Rights Reserved 42
42

PERFORMANCE PREDICTION
• Workload and volume of data growth impact
• New application implementation impact
• Server consolidation impact
• How to predict how long will it take to run M/R job?
• How to change scheduling algorithm and adjust workload management parameters proactively?
• How to change dynamically virtual and physical configurations to meet SLGs for the individual workloads?
• Justification of decisions and Verification of results
43
Boris Zibitsker, All Rights Reserved 43

Performance Prediction Simplified Queueing Network Model
Boris Zibitsker, All Rights Reserved 44
Max?
1
2
n
CPU
Disk
Memory
Max?
1
2
n
CPU
Disk
Memory
Active
Sessions
Threads
or Active
Sessions
Rejected
Requests
Arriving
requests
No
Rejected
Requests Data Warehouse
Net Max?
75
1
2
n
CPU
Disk
Memory
Active
Sessions
Rejected
Requests
Users
Arriving
Requests
Network Discovery
Platform
Net
Client
200 125
75
60
15 50
25
25
Hadoop

Predicting Workload and Volume of Data Growth Impact on Response Time
• Prediction shows how workload and volume of data growth will increase contention for systems resources and how it will affect RT of each of workloads
• Find when RT will not meet SLO
45
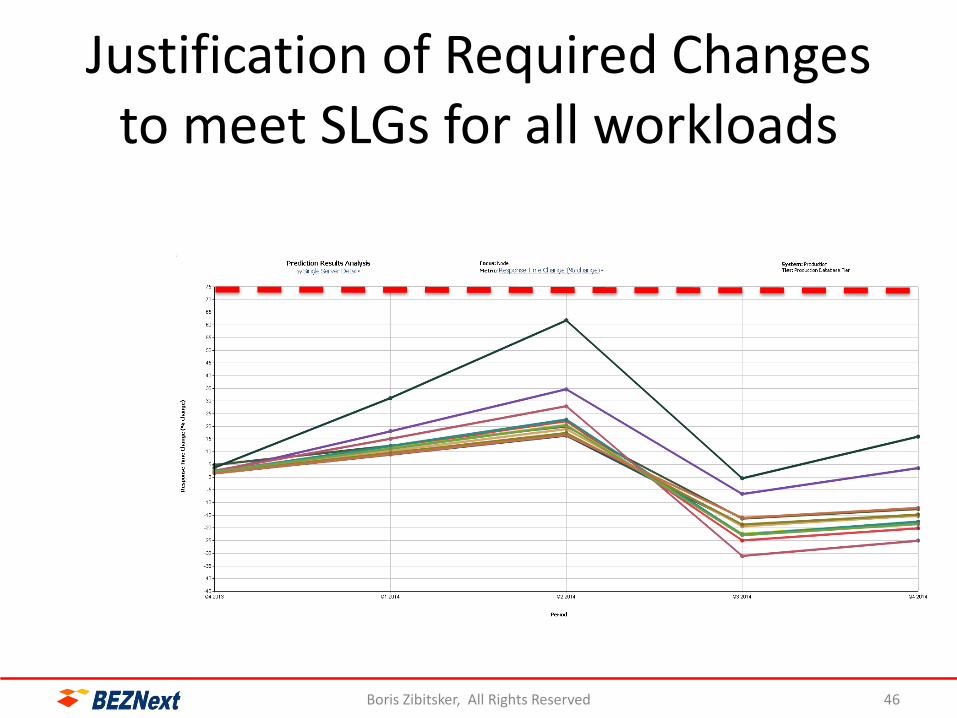
Justification of Required Changes to meet SLGs for all workloads
Boris Zibitsker, All Rights Reserved 46
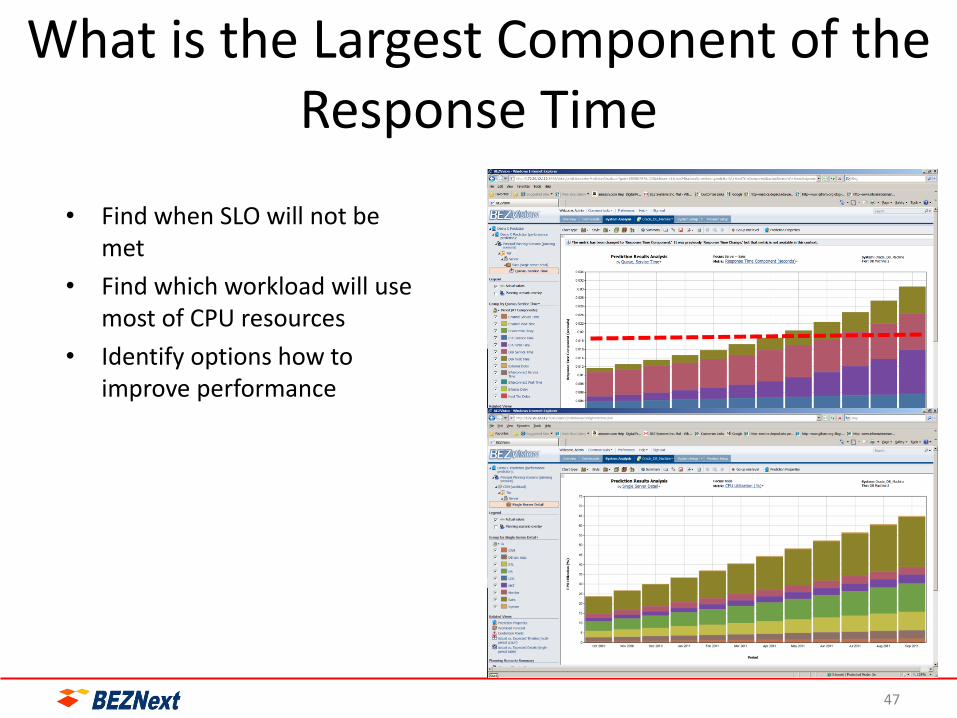
What is the Largest Component of the Response Time
• Find when SLO will not be met
• Find which workload will use most of CPU resources
• Identify options how to improve performance
47

Predicting How New Application Will Impact Existing Workloads
• Simulation of moving workloads from test to production system predict how new workload will affect performance of the existing workloads
• Model take into consideration differences between hardware and software platforms, differences in volume of data, etc.
• Set realistic expectations and justify what should be changed proactively
Predict how new application will affect
performance of existing applications
48

Predicting How Server Consolidation Will Affect Performance
• Prediction results evaluate the impact of planned server consolidation
• Shows when system will not meet SLOs
• Identify the minimum upgrade required to support SLOs
49

Predict Response Time and CPU Utilization After Consolidation
• Prediction results show how different workloads will perform after server consolidation and how it will affect CPU utilization
50

Limiting Concurrency Reduces Contention but Increases # of Requests
Waiting for the Thread • Limiting Concurrency for the workload
can reduce contention for resources
• Requests of the workload with limited concurrency will spend less time waiting for resources, but spend more time waiting for the thread
• Performance of the workload with limited concurrency might suffer, but other workloads can have significant performance gain
51

Predicting impact of lowering the level of concurrency for Load workload
• Data Load use a lot of resources, but satisfy SLO
• What if we limit Load concurrency starting Period #3?
• Load time will increase, but will be satisfactory
• Response time for other workloads will improve 0
0.2
0.4
0.6
0.8
1
1.2
1.4
1 2 3 4 5 6 7 8 9 10 11 12
Relative Response Time
Sales
Marketing
HR
Archive_1
ETL
52

What will be an impact of workload priority change?
• Increase Priority for the critical Workloads will Improve their performance but negatively affect others
• Prediction results evaluate different alternatives and provide valuable information to justify proactive decisions
0
0.2
0.4
0.6
0.8
1
1.2
1.4
1.6
1 2 3 4 5 6 7 8 9 10 11 12
Relative Response Time
Sales
Marketing
HR
Archive_1
ETL
53
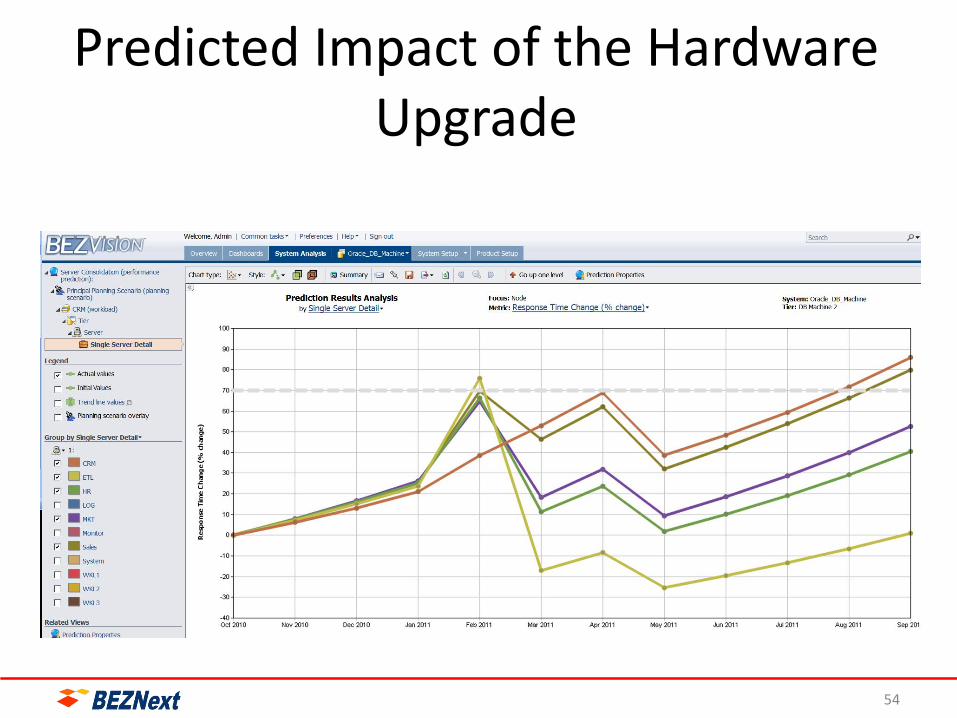
Predicted Impact of the Hardware Upgrade
54

Impact of Hardware Upgrade on CPU and Disk Utilization
• Hardware upgrade reduce contention and improve performance
55
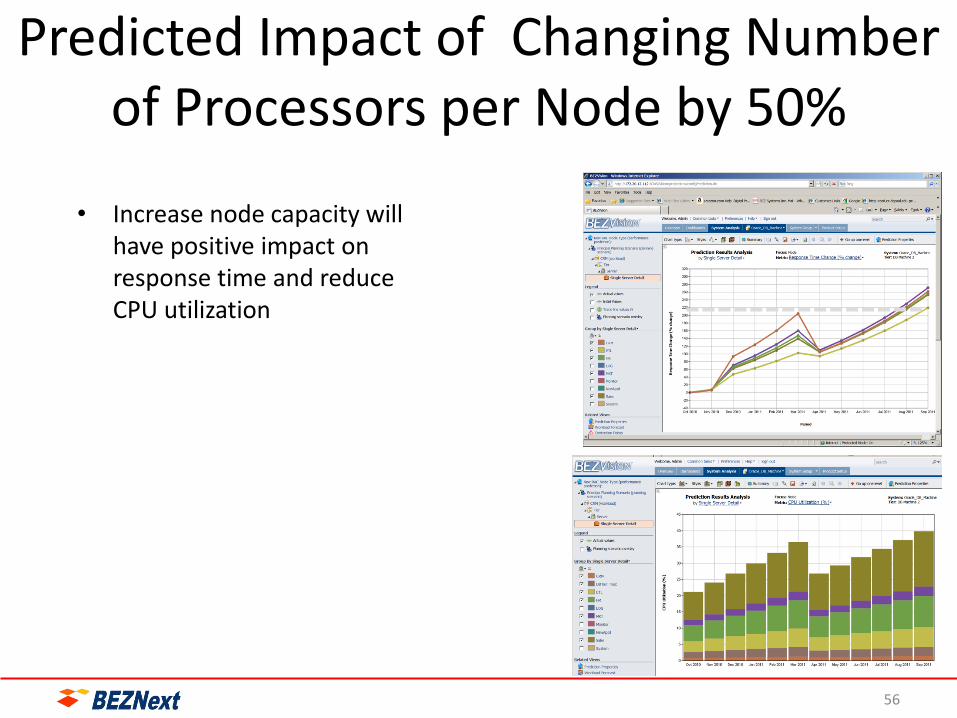
Predicted Impact of Changing Number of Processors per Node by 50%
• Increase node capacity will
have positive impact on response time and reduce CPU utilization
56

VERIFICATION
Comparing Actual Results with Expected
Boris Zibitsker, All Rights Reserved 57

Comparing Actual Measurement Results with Expected (A2E)
• Performance prediction results provide
– Justification of proactive actions
– Performance (RT and Throughout) and Resource Utilization (CPU, I/O, Internode Communication, etc) expectations for each workload as a result of expected growth and implementation of recommended changes
• Comparison of the actual results with expected verifies accuracy of predictions and validity of growth assumptions
• If difference is significant Root cause analysis identify the reason
• Foundation for organizing continuous capacity management process
• How can you manage if you do not know what to expect
Boris Zibitsker, All Rights Reserved 58

Verification of Results (cont) increase in complexity caused increase in CPU utilization and RT A2E
Response Time CPU Service Time
CPU Utilization I/O Operations/Request
Boris Zibitsker, All Rights Reserved 59
Summary
• We discussed application of Big Data and predictive analytics for organizing collaboration between business representatives and IT for
– evaluation options, justification and verification of decisions
– setting realistic service level goals and performance expectations
– to review assumptions, modeling results, justify actions and review the comparison between actual results and expected
• We reviewed methodology and case study illustrating typical steps of applying big data predictive analytics, including,
– Data Collection, Workload Characterization, Workload Forecasting, Performance Prediction and Verification of Results
• We reviewed how predictive analytics and optimization enables better alignment of business and IT
– through justification of strategic, tactical and operational IT actions
• We discussed how ML and predictive analytics can be used for organizing a collaborative environment between business representative, IT and management
Boris Zibitsker, All Rights Reserved 60


