APPENDIX
1. Member List of Study Team 2. Schedule of BD Team 3. List of Parties 4. Records of Discussions 5. Soft Component Programe 6. List of References 7-1. Social Survey Data
7-2. Data of Electric Exploration
7-3. Test Drilling
8. Minutes of Discussion

Appendix 1 List of Members No. Name Position Occupation 1 Mr. Tomiaki ITO Team Leader Senior Advisor to the Director General
Office of Design and Cost Estimation Financing Facilitation and Procurement Supervision Department
2 Mr. Shutaro SHIRAKI
Planning Management Water Resources Management Division II, Global Environmental Department, JICA
Mr. Toshio MURAKAMI
Water Supply Planning Regional Project Formulation Advisor, JICA Kenya Office
3 Mr. Masahiro YAMAGUCHI
Chief Engineer /Groundwater development
Senior Chief Engineer, Water Resources Management Division, CTI Engineering International Co.,Ltd
4 Mr. Ichiro TANAKA
Geophysical Survey 1 /Drilling 1/ Hydrogeological Survey 1
OYO International Corporation Chief Engineer
3 Mr. Shinichi ISEKI
Geophysical Survey 2 /Drilling 2/ Hydrogeological Survey 2
OYO International Corporation Manager
4 Mr. Minoru KIMISHIMA
Vice Chief/Facility Designing Planning/ Operation and Maintenance Planning 1
Deputy Chief Engineer, Water Resources Management Division, CTI Engineering International Co.,Ltd
5 Mr. Junichi ISONO
Construction and Equipment Procurement Planning/Cost Estimate
Water Resources Management Division, CTI Engineering International Co.,Ltd
5 Mr. Seimi MOCHIZUKI
Social Survey/ Operation and Maintenance Planning 2
International Development Associates Ltd.

Appendix 2
Tomiaki ITO Shutaro SHIRAKI Toshio MURAKAMI Masahiro YAMAGUCHI Ichiro TANAKA Shinichi ISEKI Minoru KIMISHIMA Junichro ISONO Seimi MOCHIZUKI
Team Leader
JICA
Project Officer(Planning
Management)
JICA
Water SupplyPlanning
Regional ProjectFormulation Advisor,
JICA Kenya Office
Chief Engr./GroundwaterDevelopment
GeophysicalExploration1/
Test Drilling1/hydrogeology 1
GeophysicalExploration2/Test Drilling2/hydrogeology 2
Vice Chief/Water Facility
Designing Planning/Operation and
Maintenance Planning1
Construction andEquipment
ProcurementPlanning/Cost
Estimate
SocialSurvey/Operationand Maintenance
Planning2
0 23-Jan Sun1 24-Jan Mon2 25-Jan Tue (Meeting)3 26-Jan Wed4 27-Jan Thu5 28-Jan Fri6 29-Jan Sat7 30-Jan Sun8 31-Jan Mon9 1-Feb Tue10 2-Feb Wed11 3-Feb Thu NRT NRT12 4-Feb Fri13 5-Feb Sat14 6-Feb Sun15 7-Feb Mon16 8-Feb Tue NRT17 9-Feb Wed NRB18 10-Feb Thu19 11-Feb Fri20 12-Feb Sat21 13-Feb Sun22 14-Feb Mon23 15-Feb Tue24 16-Feb Wed25 17-Feb Thu26 18-Feb Fri27 19-Feb Sat28 20-Feb Sun29 21-Feb Mon NRB30 22-Feb Tue NRT31 23-Feb Wed32 24-Feb Thu33 25-Feb Fri34 26-Feb Sat NRT35 27-Feb Sun NRB36 28-Feb Mon37 1-Mar Tue38 2-Mar Wed39 3-Mar Thu40 4-Mar Fri41 5-Mar Sat42 6-Mar Sun43 7-Mar Mon44 8-Mar Tue NRB45 9-Mar Wed NRT46 10-Mar Thu47 11-Mar Fri48 12-Mar Sat49 13-Mar Sun50 14-Mar Mon NRT51 15-Mar Tue NRB52 16-Mar Wed53 17-Mar Thu NRB54 18-Mar Fri NRT55 19-Mar Sat56 20-Mar Sun57 21-Mar Mon58 22-Mar Tue59 23-Mar Wed60 24-Mar Thu61 25-Mar Fri62 26-Mar Sat63 27-Mar Sun64 28-Mar Mon65 29-Mar Tue66 30-Mar Wed67 31-Mar Thu68 1-Apr Fri69 2-Apr Sat70 3-Apr Sun71 4-Apr Mon NRT NRT72 5-Apr Tue NRB NRB73 6-Apr Wed74 7-Apr Thu75 8-Apr Fri NRB76 9-Apr Sat NRT77 10-Apr Sun78 11-Apr Mon79 12-Apr Tue80 13-Apr Wed81 14-Apr Thu82 15-Apr Fri83 16-Apr Sat84 17-Apr Sun85 18-Apr Mon86 19-Apr Tue87 20-Apr Wed88 21-Apr Thu Report to EOJ, JICA Same as Chife Engr. Same as Chife Engr.89 22-Apr Fri NRB NRB NRB90 23-Apr Sat NRT NRT NRT
NRTNRB (Meeting)
Schedule of Study Team
No. Date Day
Moov to Rift Valley
NRTNRB (Meeting)
Meeting at JICA, Courtesy call to EOJ and Ministry of Water and Irrigation.
Discussion of MM with MWI and RV-WAB. ・Data Collection.・Discussion withCounterPart. ・Hydrogeological Survey
Discussion with Water Service Board of Rift Valley
for Site Minimize from 190 to 150.
・Data Collection・Hydorogecal Survey
・Indication of TestDrilling Point・Erectoric Logging
Survey and DataAnalysis
・Data Collection・Discussion・RVWB at Nakuru
・Site Survey.・Supervising ofLocal Surveyers.・Confirmation ofSurveyedReport andAnalyze.・Discussion
with RVWB forSoftconponent Program.・Survey forEnvironmentaland SocialConsiderations.・Confirmation ofProcedures and ScheduleforEnvironmentaland SocialSurvey.
・Confirmation of SitePopuration
・Site Survey
・Site Minimize from 150to 100 sites
・Confirmation of Point ofElectric Logging Survey.
・Confirmation of Pointof Existing Water
Sources.
・Confirmation of Water
Quality of ExistingWater Sources.
・Designing for WaterSupply Facilities.
・Confirmation ofExisting Water
Facilities.・Confirmation of
Power Sourcesfor Pumping Up.
・Confirmation of
Maintenance Programfor each Power Sources.
Data Collection for Water Supply Facilities and Maintenance
Collection of Costruction Dataand Quotaions
・Survey forProcurement.
・Survey for ProcuredEquipment.
・Survey for validityand necessity of theprocurement
・Survey for Planningof Construction.
・Survey of Land Usefor Project.
・HydorogecalSurvey
・Supervising of
Test Drilling
・Erectoric Logging
Survey and DataAnalysis
・Confirmation of Existing Water
Sources
・Confirmation of
Water Quality ofExisting Sources
・Confirmation of Existing WaterSources・Collection of Report for
Electric Logging Survey
・Confirmation of Result
of Electric Logging Survey
・Collection of Report for
Socio-Economic Surveywith Review
・Summarize of Outlineof Survey
・Discussion with RVWB,
Collection & Analyze of Hydrogeological Data.
Preparation of Contract with Local Firms on Site
Survey.
Site reconnaissance:Survey for Power Sorces for Pumping Up from Boreholes at Target Sites.Survey for power sources of Exisiting Water Facilities around Target Sites.Survey of Bonecharcor for Reducing FluorideSurvey for Solar System.
・Hydorogecal Survey
・Supervising of TestDrilling
・Erectoric Logging
Survey and DataAnalysis
・Confirmation of Existing WaterSources
・Confirmation of
Water Quality ofExisting Sources
・Confirmation of Existing WaterSources
Visit JICA, Ministry of Water and Irrigation
Leaving Nairobi for Nakuru and Baringo. Meeting with RV-WSB and District W Baringo.Field Survey
Leaving Nakuruto Nairobi. Meeting.
Signing the minutes Team Leader and MWI and RV-WSB
Report to JICA KENYA and EOJ. Courtesy call to GTZ
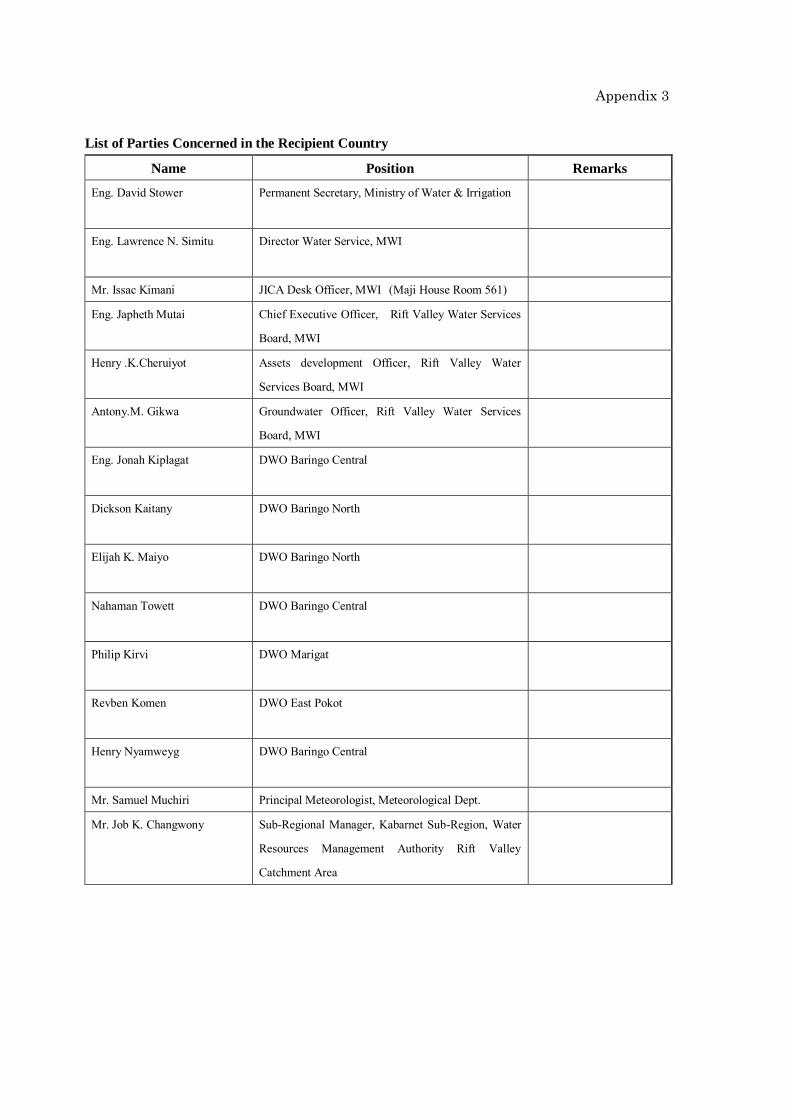
List of Parties Concerned in the Recipient Country
Name Position Remarks
Eng. David Stower
Permanent Secretary, Ministry of Water & Irrigation
Eng. Lawrence N. Simitu
Director Water Service, MWI
Mr. Issac Kimani JICA Desk Officer, MWI (Maji House Room 561)
Eng. Japheth Mutai Chief Executive Officer, Rift Valley Water Services
Board, MWI
Henry .K.Cheruiyot
Assets development Officer, Rift Valley Water
Services Board, MWI
Antony.M. Gikwa
Groundwater Officer, Rift Valley Water Services
Board, MWI
Eng. Jonah Kiplagat
DWO Baringo Central
Dickson Kaitany
DWO Baringo North
Elijah K. Maiyo
DWO Baringo North
Nahaman Towett
DWO Baringo Central
Philip Kirvi
DWO Marigat
Revben Komen
DWO East Pokot
Henry Nyamweyg
DWO Baringo Central
Mr. Samuel Muchiri Principal Meteorologist, Meteorological Dept.
Mr. Job K. Changwony Sub-Regional Manager, Kabarnet Sub-Region, Water
Resources Management Authority Rift Valley
Catchment Area
Appendix 3

Name Position Remarks
Mr. Joseph Wendot Regional water pollution and control Officer, WRMA
Mr. Evans K. Agesa Branch Business Head, Kabarnet, The Kenya Power
& Lighting Co., Ltd.
Isaac Y. Komen
Head Teacher
Daniel K. Keles Teacher
Samuel C. Cheboi Rifered Chief
James B. Kamuren Area Chief
Joseph O. Kimielict The Chairman Water Protect Kasutiei Loc.
Reuben Chebon Lake Kamnorok
Julius T. Tibino Assistant Chief Muchukwd YUB Location
Fred Chepluswo Assistant Chief Chemjro
James Kiptoo HIT Lemuyek Prysch
Reuben C. Komen District Water Officer
Reuben K. Kedireng Nursul officer
Christine Chelangat K. Head teacher
Wilson Lokobwa Chief
Anderson C. Chelvgo Chinicab officer yc.
Peter Chelelgo Assistant CH.EP
Andrew Rnmiwya
Kimayel Chief
James K. Yator Chief Sacho Sol
Benson Kngetich Belbon Chief
Willy T. Rutto Assistant Chief Kaptere
Esther Cheptumo Head teacher
Elud K. Chesire Chief Talat
Tobole S. Lokorio Chief
Name Position
Samson Kipkenei Head Teacher
Barnaba K. Kitilit Principal Ossen H. School
Wilson Kapuwang A/Chief Pemwat
Micah K. Chesire A/Chief Kiwananocge
Jonah Korir Assistant chief Nyalil-Buch

Chebii Kipsang
Assistant Chief
Jonah Chebieron Assistant Chief
Symon Cheraste Assistant Chief Keryo
Joseph T. CiiemiTei Chief Similo location
Agnes J. Chepkgithwt Assistant Chief
Mark Rono Head Teacher
Mark Chebon Kimaso Primary Headteacher
David T. Komen Head Teacher
Wilson Chepsgrgon Head Teacher
Jackson K. Chirclhr Assistant Teacher
Alfred K. Labon Public Health Officer
Justus Ohempakany Head Teacher
Mary Ngelich DHRIO
Michael Komen DHIT
Joseph K. Chepkiwha Head Teacher
Ceodwin Namenya
Database Admn
Grundfos Lifelink
Lars Laursen General Manager
Vishal Bhalla
Drilling Spares Services Director


Appendix 5
The Republic of Kenya
Ministry of Water and Irrigation
Rift Valley Water Service Board
The Republic of Kenya
Soft-Component Program
for
the Project
for
Rural Water Supply in Baringo County
in the Republic of Kenya
November 2011
JAPAN INTERNATIONAL COOPERATION AGENCY
CTI ENGINEERING INTERNATIONAL CO.,LTD.
OYO INTERNATIONAL CORPORATION


Contents
1. Background of Soft-component ..................................................................................... 1
2. Objective of the Soft Component Program ...................................................................... 4
3. Outcomes of the Soft Component .................................................................................. 4
4. Achievement Measures of Outcomes .............................................................................. 5
5. Activities (Plan of Operation) ................................................................................... 7
6. Procurement of Resources for implementation of Soft-component Activities ..................... 13
7. Implementation Schedule ............................................................................................ 14
8. Output of activities..................................................................................................... 15
9. Estimated Program Costs ............................................................................................ 15
10. Responsibilities of the Government of Kenya .............................................................. 15


1
1. Background of Soft-component
1-1. Overview of the Project
The project components that will be implemented within the scheme of grant aid
cooperation project are as outlined below.
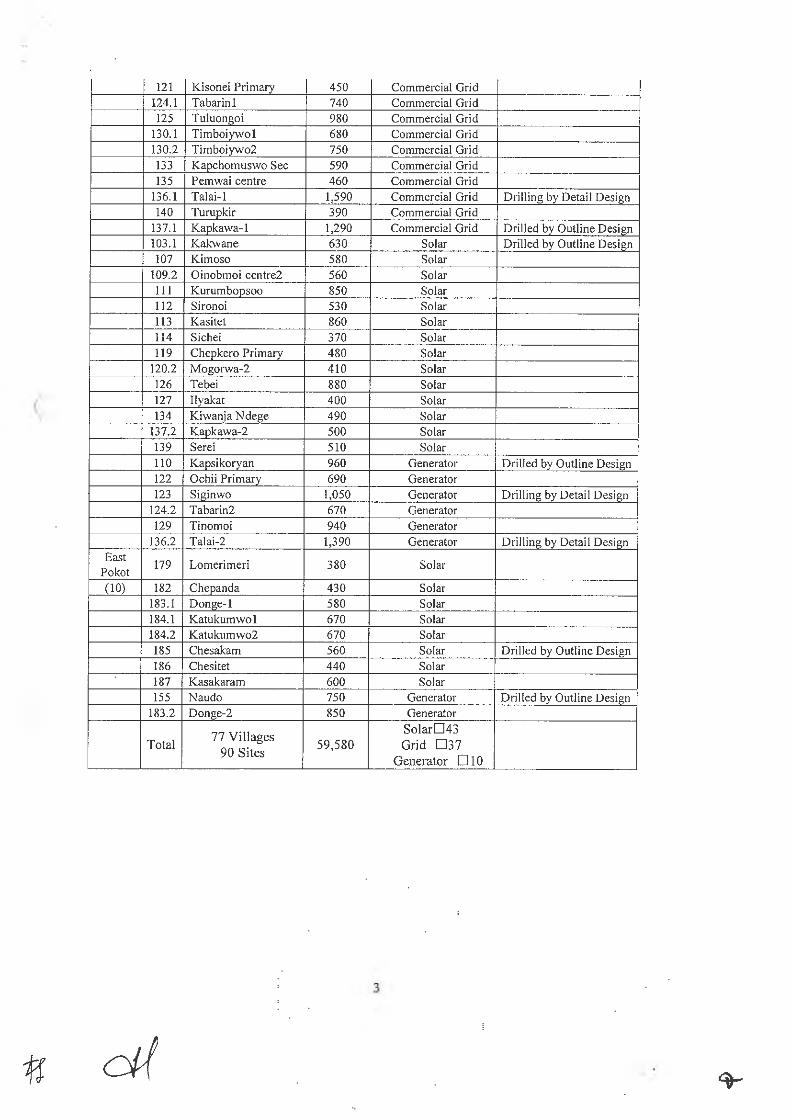
Table 1-1 Overview of the Project
Item Contents Overview
Construction
of facilities
Independent
water supply
facilities
90 sites*1 ( Borehole drilling, pumping
facilities, water storage tank, communal
faucets, transmission pipes and water trough
for livestock)
Procurement
of equipment
Procurement of
operation and
maintenance
1 Pick-up double cabin(4WD)
2 Motorbikes(175cc)
1 Computer and A3 printer
Soft
component
Capacity
building of
operation and
maintenance
・Training for DWO staff
・Establishment and training of water users
association at each community
・Production of manual and texts
1-2. The current situation of rural water supply
(1) Water supply in the target area
The water supply rates (rates of access to safe water) in four districts in Larger
Baringo are only 15 to 34%, which is lower than the average of 40% for rural areas
in Kenya, the region is severely suffering from lack of water. In addition, water
supply facilities in villages are not boreholes and communities do not have
experience on operation and maintenance of powered pumping water supply
facilities.
(2) The current situation of operation and maintenance
According to the water sector reform in Kenya by the new water law, operation and
maintenance of water supply facilities are implemented by a water service provider
abiding by the private business law (hereafter WSP). However, the WSP is not in
the position to sustainably operate due to the low profitability with smaller
populations of rural villages. Kenya as a whole established 122 WSPs (2009), among
which only 27% (depreciation is not taken into account) counts for the financially
viable business entities with cost and benefit ratio above 100%. Therefore,
2
minimum services are offered with support from the government. Similarly Larger
Baringo WSP (Baringo Water Supply and Sewerage Authority) is far from its
sustainability, where it is difficult to support rural areas.
In these circumstances, operation and maintenance of rural water supply facilities
in the Larger Baringo is undertaken by water users association (WUA) composed of
community members as before the reform. District water offices (DWO) in each
district (Baringo central, Baringo North, East Pokot, Marigat) are rendering
technical and financial services to WUAs. The WSP is supposed to perform
operation and maintenance by the system, yet as it does not function well, DWO
and the Local Government play a role in some part. Currently therefore, the
operational system and roles are unclear for the operation and maintenance.
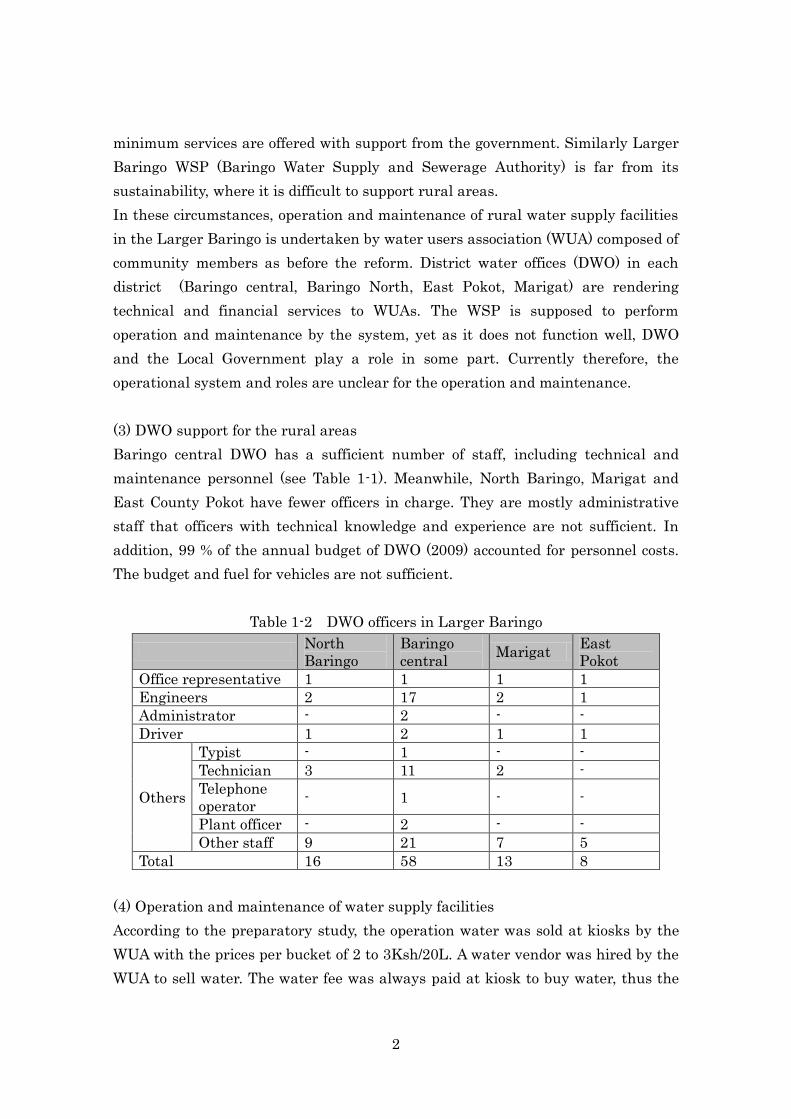
(3) DWO support for the rural areas
Baringo central DWO has a sufficient number of staff, including technical and
maintenance personnel (see Table 1-1). Meanwhile, North Baringo, Marigat and
East County Pokot have fewer officers in charge. They are mostly administrative
staff that officers with technical knowledge and experience are not sufficient. In
addition, 99 % of the annual budget of DWO (2009) accounted for personnel costs.
The budget and fuel for vehicles are not sufficient.
Table 1-2 DWO officers in Larger Baringo
North
Baringo
Baringo
central Marigat
East
Pokot
Office representative 1 1 1 1
Engineers 2 17 2 1
Administrator - 2 - -
Driver 1 2 1 1
Others
Typist - 1 - -
Technician 3 11 2 -
Telephone
operator - 1 - -
Plant officer - 2 - -
Other staff 9 21 7 5
Total 16 58 13 8
(4) Operation and maintenance of water supply facilities
According to the preparatory study, the operation water was sold at kiosks by the
WUA with the prices per bucket of 2 to 3Ksh/20L. A water vendor was hired by the
WUA to sell water. The water fee was always paid at kiosk to buy water, thus the

3
collection rate was 100%. The repair and maintenance was covered by the collected
water fees. On the other hand, hand pump systems adopted a monthly payment
system and WUA members collect money at each household. The reason being
unknown, the collection was not fully undertaken and broken hand pumps are seen
abandoned.
(5) Hygiene conditions of the target communities
Communities have not safe water sources. The people in target communities use
water from unhygienic water from ponds and rivers, hand-dug well since longtime
ago. The livestock also use the same water sources, it is plausible that the water is
highly contaminated by livestock manure. The results of social survey also show a
high infection rate of water borne diseases such as diarrhea and typhoid (7,197
patients in Central Baringo and 5,693 patients in North Baringo in 2010). There are
75 communities out of 150 without medical facilities.
1-3. Challenges of Operation and Maintenance
The following issues need to be addressed in this soft component Program
considering the current water supply in Baringo.
The operation and maintenance of rural water supply system is unclear
Lack of knowledge and experience with DWO to support the operation and
maintenance Communities have not established water users associations
Communities have no water supply facilities that they have no experience on
operation and maintenance.
Communities have insufficient knowledge about water hygiene
1-4. Need for a Social Intervention Program (Soft-component)
The communities have no water supply facilities that community members have no
or scarce experience in operation and maintenance. Thus, support for operation and
maintenance for water supply facilities is essential. However, as the budget for its
activities in Kenya is limited to ensure maintenance and comprehensive support for
communities, as rural water supply facilities are scattered in wide areas. Thus, it is
necessary to strengthen community initiative and administrative capacity through
implementation of the soft component Program.
The following figure shows an implementation framework of the operation and
maintenance in the target area.
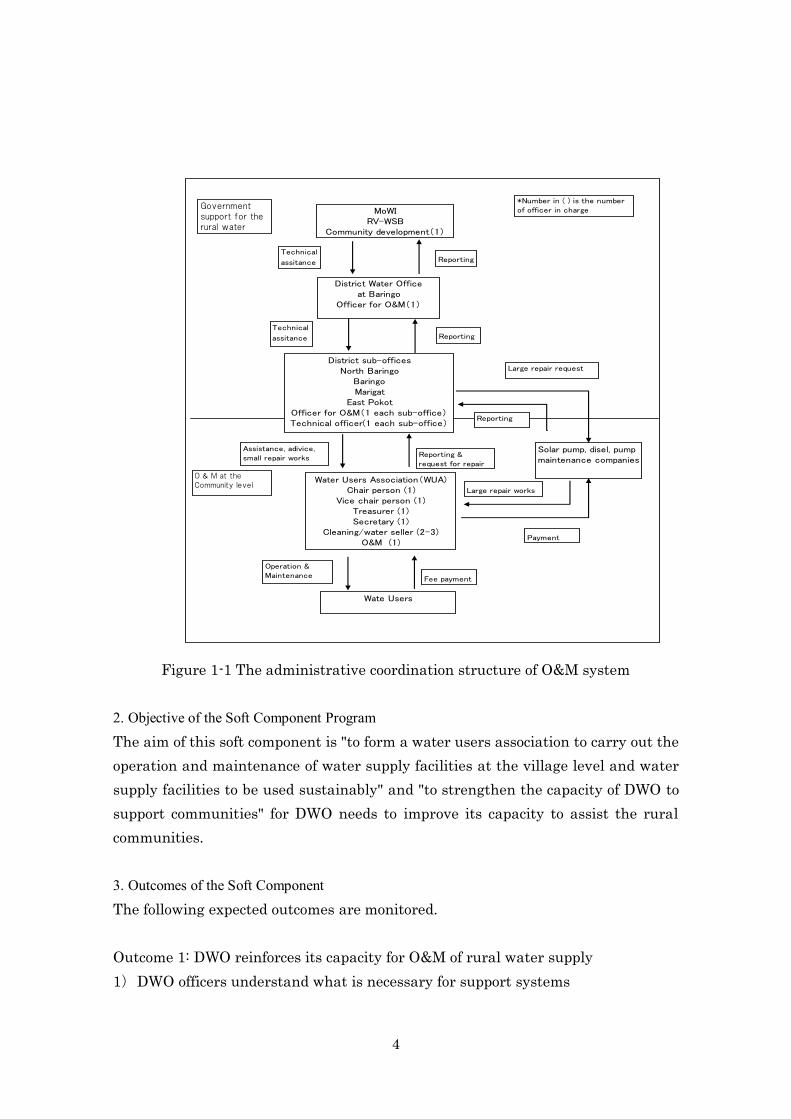
4
Figure 1-1 The administrative coordination structure of O&M system
2. Objective of the Soft Component Program
The aim of this soft component is "to form a water users association to carry out the
operation and maintenance of water supply facilities at the village level and water
supply facilities to be used sustainably" and "to strengthen the capacity of DWO to
support communities" for DWO needs to improve its capacity to assist the rural
communities.
3. Outcomes of the Soft Component
The following expected outcomes are monitored.
Outcome 1: DWO reinforces its capacity for O&M of rural water supply
1) DWO officers understand what is necessary for support systems
Wate Users
Fee payment
Operation &Maintenance
Payment
Governmentsupport for therural water
MoWIRV-WSB
Community development(1)
District Water Officeat Baringo
Officer for O&M(1)
District sub-officesNorth Baringo
BaringoMarigat
East PokotOfficer for O&M(1 each sub-office)Technical officer(1 each sub-office)
Solar pump, disel, pumpmaintenance companies
O & M at theCommunity level
ReportingTechnical
assitance
ReportingTechnical
assitance
Reporting &request for repair
Assistance, adivice,small repair works
Reporting
Large repair request
Large repair works
*Number in ( ) is the numberof officer in charge
Water Users Association(WUA)Chair person (1)
Vice chair person (1)Treasurer (1)Secretary (1)
Cleaning/water seller (2-3)O&M (1)
5
2) DWO officers make an implementation plan to support the soft-component
activities
Outcome 2: WUAs are formed and O&M activities for the water supply facilities get
implemented
1) Community members understand needs of water users association and its role
and activities
2) Communities establish water users association
3) Educational activities will be conducted for communities as to sustainable use of
water supply facilities by the water users association.
4) Water users associations conduct operation and maintenance of water supply
facilities
Outcome 3: Community members hygienically use water
1) Communities learn water hygiene
2) Water supply facilities are kept clean by the communities
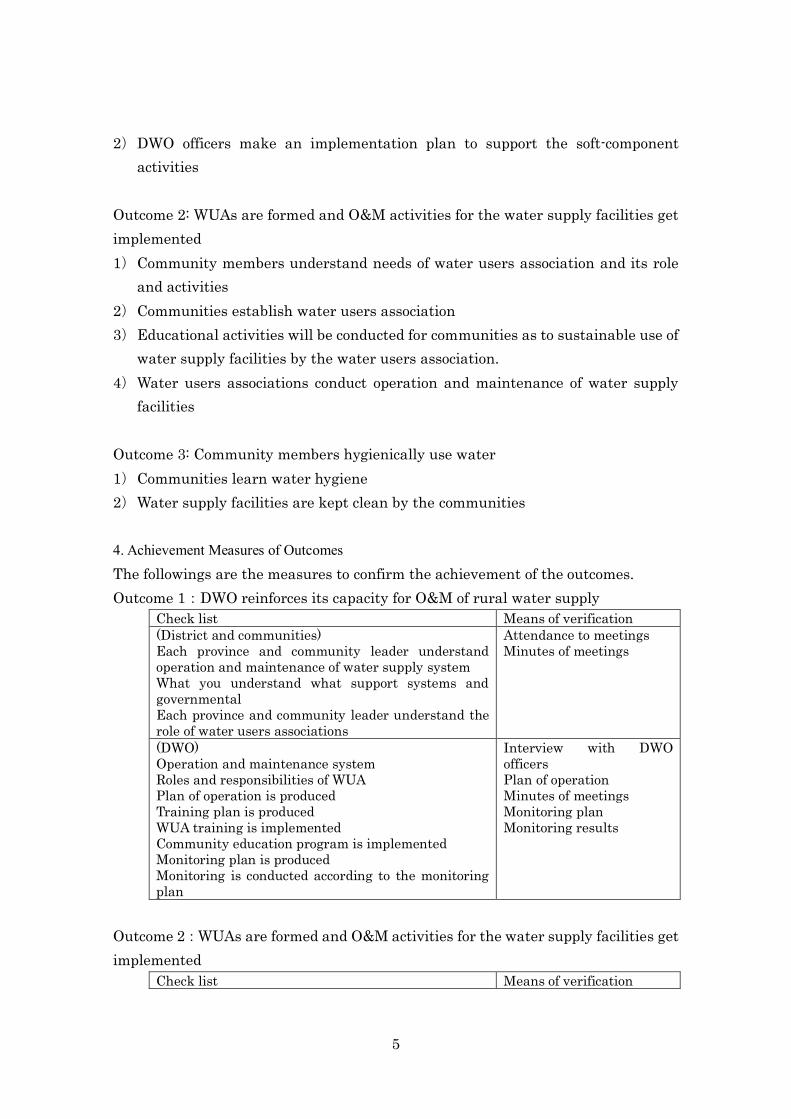
4. Achievement Measures of Outcomes
The followings are the measures to confirm the achievement of the outcomes.
Outcome 1:DWO reinforces its capacity for O&M of rural water supply
Check list Means of verification
(District and communities)
Each province and community leader understand
operation and maintenance of water supply system
What you understand what support systems and
governmental
Each province and community leader understand the
role of water users associations
Attendance to meetings
Minutes of meetings
(DWO)
Operation and maintenance system
Roles and responsibilities of WUA
Plan of operation is produced
Training plan is produced
WUA training is implemented
Community education program is implemented
Monitoring plan is produced
Monitoring is conducted according to the monitoring
plan
Interview with DWO
officers
Plan of operation
Minutes of meetings
Monitoring plan
Monitoring results
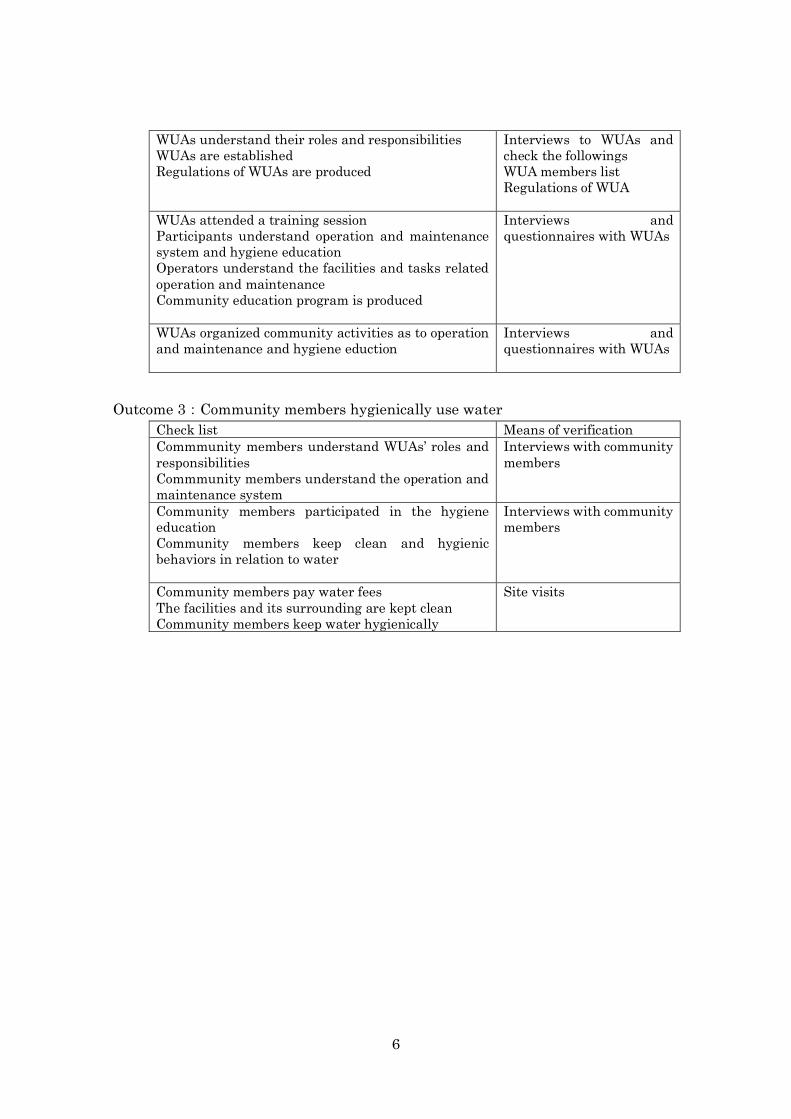
Outcome 2:WUAs are formed and O&M activities for the water supply facilities get
implemented
Check list Means of verification
6
WUAs understand their roles and responsibilities
WUAs are established
Regulations of WUAs are produced
Interviews to WUAs and
check the followings
WUA members list
Regulations of WUA
WUAs attended a training session
Participants understand operation and maintenance
system and hygiene education
Operators understand the facilities and tasks related
operation and maintenance
Community education program is produced
Interviews and
questionnaires with WUAs
WUAs organized community activities as to operation
and maintenance and hygiene eduction
Interviews and
questionnaires with WUAs
Outcome 3:Community members hygienically use water
Check list Means of verification
Commmunity members understand WUAs’ roles and
responsibilities
Commmunity members understand the operation and
maintenance system
Interviews with community
members
Community members participated in the hygiene
education
Community members keep clean and hygienic
behaviors in relation to water
Interviews with community
members
Community members pay water fees
The facilities and its surrounding are kept clean
Community members keep water hygienically
Site visits

7
5. A
ctiv
ities
(P
lan
of O
pera
tion)
O
utc
om
e
Act
ivit
y
Days
Con
ten
ts o
f A
ctiv
ity
Main
Act
or
Peri
od
Ou
tpu
t
Targ
et
Ou
tcom
e
1
1-1
P
lan
nin
g
work
sh
op
on
so
ft-c
om
pon
en
t
imple
men
tati
on
1
Dis
cussi
on
on
th
e c
on
ten
ts o
f W
UA
tra
inin
g
Dis
cussi
on
on
deta
ils
abou
t O
&M
an
d W
UA
su
pp
ort
ing
syst
em
Pla
n o
f op
era
tion
DW
O
off
icer,
L
oca
l
con
su
ltan
t,
Jap
an
ese c
on
su
ltan
t
Pre
con
stru
ctio
n
Work
sh
op
rep
ort
Cert
ific
ate
1-2
W
UA
han
dbook
/hygie
ne
ed
uca
tion
m
ate
rials
dis
cuss
ion
work
sh
op
2
Dis
cussi
on
on
WU
A h
an
dbook
con
ten
ts
Dis
cussi
on
on
h
ygie
ne
an
d
san
itati
on
m
ate
rials
con
ten
ts
DW
O
off
icer,
L
oca
l
con
su
ltan
t,
Jap
an
ese
con
su
ltan
t
Pre
con
stru
ctio
n
Work
sh
op
rep
ort
Cert
ific
ate
Ou
tcom
e
2
2-1
P
roje
ct
bri
efi
ng
to
the d
istr
ict
off
ices
4 d
ays
(1
day /
each
dis
tric
t)
Pro
gra
m bri
efi
ng an
d re
qu
est
fo
r co
opera
tion
to
th
e
Pro
gra
m
Exp
lan
ati
on
on
WU
A e
stabli
sh
men
t
Pro
gra
m s
ched
ule
DW
O
off
icer,
Jap
an
ese c
on
su
ltan
t
Du
rin
g
the
con
stru
ctio
n
Min
ute
s
Ou
tcom
e
2
Ou
tcom
e
3
2-1
P
roje
ct
bri
efi
ng
to
the d
istr
ict
off
ices
2-2
P
roje
ct
bri
efi
ng
to
com
mu
nit
y l
ead
ers
4 d
ays
(1
day
/
dis
tric
t)
10
Pro
gra
m bri
efi
ng an
d re
qu
est
fo
r co
opera
tion
to
th
e
Pro
gra
m
Exp
lan
ati
on
on
WU
A e
stabli
sh
men
t
Pro
gra
m s
ched
ule
Pro
gra
m b
riefi
ng a
nd
requ
est
for
involv
em
en
t to
th
e
Pro
gra
m
Sele
ctio
n o
f W
UA
mem
bers
WU
A e
stabli
sh
men
t
Pro
gra
m s
ched
ule
Loca
l adm
inis
trati
on
D
uri
ng
the
con
stru
ctio
n
Du
rin
g
the
con
stru
ctio
n
Min
ute
s
Min
ute
s
DW
O
off
icer,
L
oca
l
con
su
ltan
t,
Jap
an
ese
con
su
ltan
t
2-2
P
roje
ct
bri
efi
ng
to
com
mu
nit
y l
ead
ers
2-3
Tra
inin
g f
or
WU
A
10
4
days
x
20ti
mes=
80d
ays
(on
ce
a
mon
th)
Pro
gra
m b
riefi
ng a
nd
requ
est
for
involv
em
en
t to
th
e
Pro
gra
m
Sele
ctio
n o
f W
UA
mem
bers
WU
A e
stabli
sh
men
t
Pro
gra
m s
ched
ule
Pro
gra
m b
riefi
ng a
nd r
equ
est
for
coopera
tion
WU
A r
egu
lati
on
s
Tre
asu
rers
book
, w
ate
r fe
e
sett
ing
for
hu
man
an
d
an
imal
con
su
mp
tion
Pla
nn
ing f
or
healt
h a
nd s
an
itati
on
tra
inin
g
Opera
tion
an
d m
ain
ten
an
ce o
f th
e f
aci
liti
es
Com
mu
nit
y h
ead
s D
uri
ng
the
con
stru
ctio
n
Du
rin
g
the
con
stru
ctio
n
Min
ute
s
Tra
inin
g
Pro
gra
m
Min
ute
s
Regu
lati
on
s
Qu
esti
on
nair
e
DW
O o
ffic
er
Jap
an
ese
con
su
ltan
t
2-3
Tra
inin
g f
or
WU
A
2-4
T
rain
ing
for
com
mu
nit
y m
em
bers
4
days
x
20ti
mes=
80d
ays
(on
ce
a
mon
th)
Pro
gra
m b
riefi
ng a
nd r
equ
est
for
coopera
tion
WU
A r
egu
lati
on
s
Tre
asu
rers
book
, w
ate
r fe
e
sett
ing
for
hu
man
an
d
an
imal
con
su
mp
tion
Pla
nn
ing f
or
healt
h a
nd s
an
itati
on
tra
inin
g
Loca
l govern
men
t D
uri
ng
the
con
stru
ctio
n
At
the
inau
gu
rati
on
Tra
inin
g
Pro
gra
m
Min
ute
s
Regu
lati
on
s
Qu
esti
on
nair
DW
O o
ffic
er
Jap
an
ese
con
su
ltan
t

8
90
days
(1
day
/each
sit
e)
Opera
tion
an
d m
ain
ten
an
ce o
f th
e f
aci
liti
es
Pro
ject
bri
efi
ng
Exp
lan
ati
on
on
O&
M s
yste
m b
y W
UA
WU
A e
stabli
sh
men
t ce
rtif
icate
Rep
air
s an
d r
eh
abil
itati
on
e
Act
ivit
y
rep
ort
Qu
esti
on
nair
e
2-4
T
rain
ing
for
com
mu
nit
y m
em
bers
2-5
Mon
itori
ng
90
days
(1
day/
sit
e)
390
sit
es/
day
3
sit
es=
30
days
Pro
ject
bri
efi
ng
Exp
lan
ati
on
on
O&
M s
yste
m b
y W
UA
WU
A e
stabli
sh
men
t ce
rtif
icate
Rep
air
s an
d r
eh
abil
itati
on
O&
M a
nd W
UA
fu
nct
ion
mon
itori
ng
Inte
rvie
w o
n t
he a
ctiv
ity p
rogre
ss
Foll
ow
-up
if
WU
A i
s n
ot
fun
ctio
nin
g
Com
mu
nit
y l
ead
ers
A
t th
e
inau
gu
rati
on
Post
con
stru
ctio
n
Act
ivit
y
rep
ort
Qu
esti
on
nair
e
Mon
itori
ng
sh
eet
DW
O
off
icer
Loca
l
con
su
ltan
t
2-5
Mon
itori
ng
3-1
H
ygie
ne
ed
uca
tion
for
com
mu
nit
y p
eople
3sit
es/
da
y
=30
days
Con
du
ct
wit
h 2
-4
O&
M a
nd W
UA
fu
nct
ion
mon
itori
ng
Inte
rvie
w o
n t
he a
ctiv
ity p
rogre
ss
Foll
ow
-up
if
WU
A i
s n
ot
fun
ctio
nin
g
Pre
para
tion
of
hygie
ne c
am
paig
n
Hygie
ne e
du
cati
on
fo
r co
mm
un
ity p
eop
le
Gu
idan
ce o
n c
lean
ing
Com
mu
nit
y p
eop
le
WU
A
Post
con
stru
ctio
n
Post
con
stru
ctio
n
Mon
itori
ng
sh
eet
Pla
n
of
act
ivti
es
Act
ivit
y
rep
ort
DW
O o
ffic
er
Ou
tcom
e
3
3-1
H
ygie
ne
ed
uca
tion
for
com
mu
nit
y p
eople
Con
du
ct
wit
h 2
-4
Pre
para
tion
of
hygie
ne c
am
paig
n
Hygie
ne e
du
cati
on
fo
r co
mm
un
ity p
eop
le
Gu
idan
ce o
n c
lean
ing
Com
mu
nit
y p
eop
le
WU
A
Post
con
stru
ctio
n
Pla
n
of
act
ivti
es
Act
ivit
y
rep
ort

9
Details of each activity are elaborated below.
Activity 1-1 Planning workshop on soft-component implementation
Contents Overview of the soft-component Program
The contents of the WUA training are discussed including: roles and
responsibilities of WUA, overview of the facilities, water fee setting
and collection of water, bookkeeping, repair and maintenance
system, operation hours
Formulate a Program for WUA training
A draft of WUA regulations
Remuneration for operators and water vendors
Scheduling and implementation system
Actor Local consultant (3 persons)
DWO officer (O&M) (1 person)
Japanese consultant (1 person)
Target Same as the actors
Duration 1 day
Timing Pre-construction
Activity 1-2 WUA handbook/hygiene education materials discussion workshop
Contents Discuss on the contents of WUA handbook
Planning on WUA training using WUA handbook
Discuss on the contents of hygiene education materials
Actor Local consultant (3 persons)
DWO officer (O&M) (1-2 persons)
Japanese consultant (1 person)
Target Same as the actors
Duration 2 days
Timing Pre-construction
Table 1-3 Workshop Program
Workshop Program Participant
1. WUA management Local consultant
1-1 Overview of operation and maintenance
system
DWO officer
1-2 WUA formation Japanese consultant
1-3 Roles and responsibilities
2. WUA handbook

10
2-1 Structure of water supply facilities, functions,
power pump
2-2 Daily operation and maintenance
2-3 Repair and rehabilitation
2-4 Regulations on WUA
2-5 Water fee collection and saving
3. Hygiene education
3-1 Water borne disease and hygiene
3-2 Water contamination and prevention
3-3 Hygiene advantage of safe water
Activity 2-1 Project briefing to the district governments
Contents Explain the contents of operation and maintenance Program to
North Baringo, Baringo, Marigat and East Pokot districts.
Actor DWO officer (1 person)
Japanese consultant (1 person)
Target North Baringo, Baringo, Marigat and East Pokot districts
Duration 4 days
Timing Pre-construction
Activity 2-2 Project briefing to community leaders
Contents Explanation on soft-component Program to the community leaders
Request for responsibilities of communities (access path to the
community)
Request for establishment of WUA
Request for cooperation for training and activities
Actor DWO officer (1 person)
Local consultant (1 person)
Japanese consultant (1 person)
Target Community leaders
(10-20 villages together)
Duration 10 days
Timing During construction
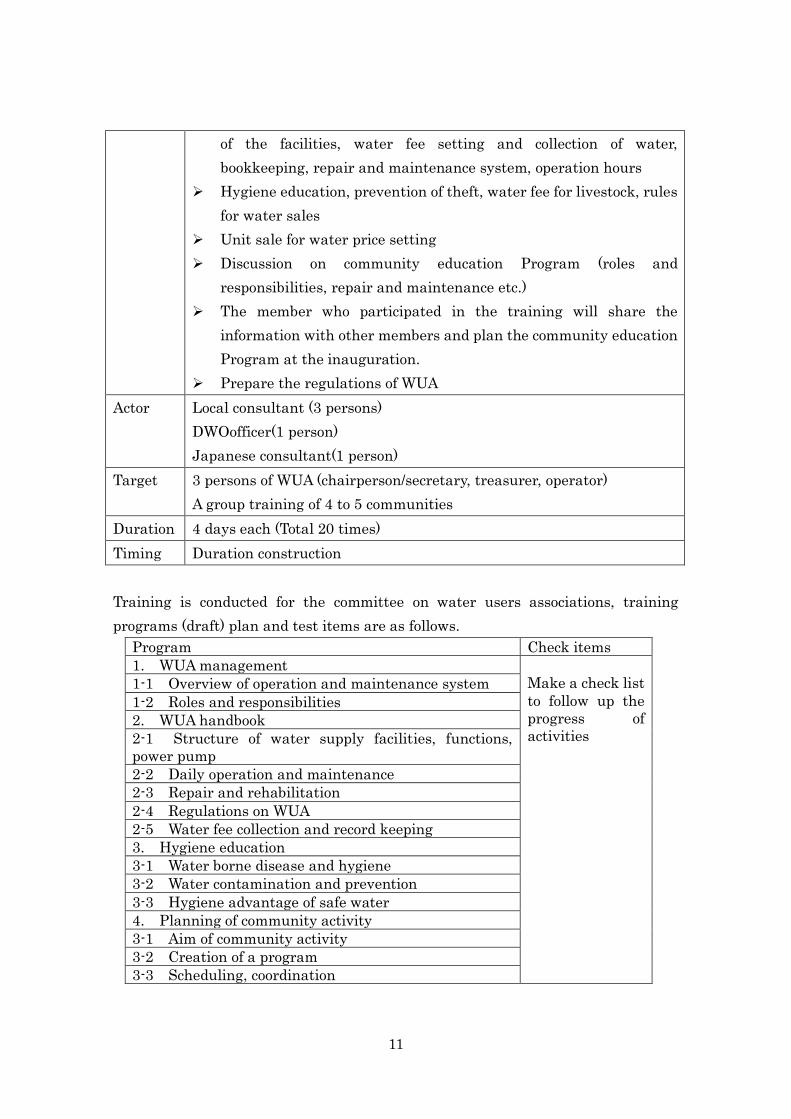
Activity 2-3 Training for WUA
Contents Organize training for Chair/secretary, treasurer, operator of WUAs
of a successful borehole either in Marigat or Kabarnet
The training includes: roles and responsibilities of WUA, overview
11
of the facilities, water fee setting and collection of water,
bookkeeping, repair and maintenance system, operation hours
Hygiene education, prevention of theft, water fee for livestock, rules
for water sales
Unit sale for water price setting
Discussion on community education Program (roles and
responsibilities, repair and maintenance etc.)
The member who participated in the training will share the
information with other members and plan the community education
Program at the inauguration.
Prepare the regulations of WUA
Actor Local consultant (3 persons)
DWOofficer(1 person)
Japanese consultant(1 person)
Target 3 persons of WUA (chairperson/secretary, treasurer, operator)
A group training of 4 to 5 communities
Duration 4 days each (Total 20 times)
Timing Duration construction
Training is conducted for the committee on water users associations, training
programs (draft) plan and test items are as follows.
Program Check items
1. WUA management
Make a check list
to follow up the
progress of
activities
1-1 Overview of operation and maintenance system
1-2 Roles and responsibilities
2. WUA handbook
2-1 Structure of water supply facilities, functions,
power pump
2-2 Daily operation and maintenance
2-3 Repair and rehabilitation
2-4 Regulations on WUA
2-5 Water fee collection and record keeping
3. Hygiene education
3-1 Water borne disease and hygiene
3-2 Water contamination and prevention
3-3 Hygiene advantage of safe water
4. Planning of community activity
3-1 Aim of community activity
3-2 Creation of a program
3-3 Scheduling, coordination
12
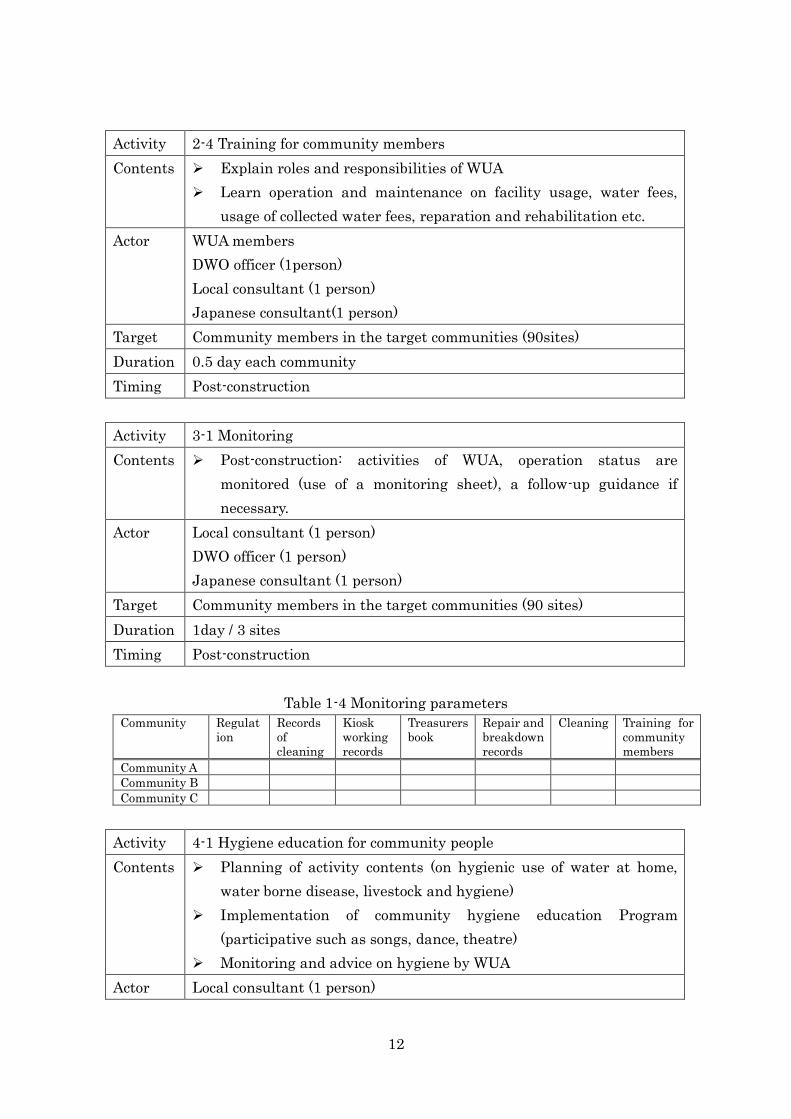
Activity 2-4 Training for community members
Contents Explain roles and responsibilities of WUA
Learn operation and maintenance on facility usage, water fees,
usage of collected water fees, reparation and rehabilitation etc.
Actor WUA members
DWO officer (1person)
Local consultant (1 person)
Japanese consultant(1 person)
Target Community members in the target communities (90sites)
Duration 0.5 day each community
Timing Post-construction
Activity 3-1 Monitoring
Contents Post-construction: activities of WUA, operation status are
monitored (use of a monitoring sheet), a follow-up guidance if
necessary.
Actor Local consultant (1 person)
DWO officer (1 person)
Japanese consultant (1 person)
Target Community members in the target communities (90 sites)
Duration 1day / 3 sites
Timing Post-construction
Table 1-4 Monitoring parameters
Community Regulat
ion
Records
of
cleaning
Kiosk
working
records
Treasurers
book
Repair and
breakdown
records
Cleaning Training for
community
members
Community A
Community B
Community C
Activity 4-1 Hygiene education for community people
Contents Planning of activity contents (on hygienic use of water at home,
water borne disease, livestock and hygiene)
Implementation of community hygiene education Program
(participative such as songs, dance, theatre)
Monitoring and advice on hygiene by WUA
Actor Local consultant (1 person)
13
WUA and community members
DWO officer (1 person)
Target Community members in the target communities (90 sites)
Duration At the occasion of 2-4
Timing Post-construction
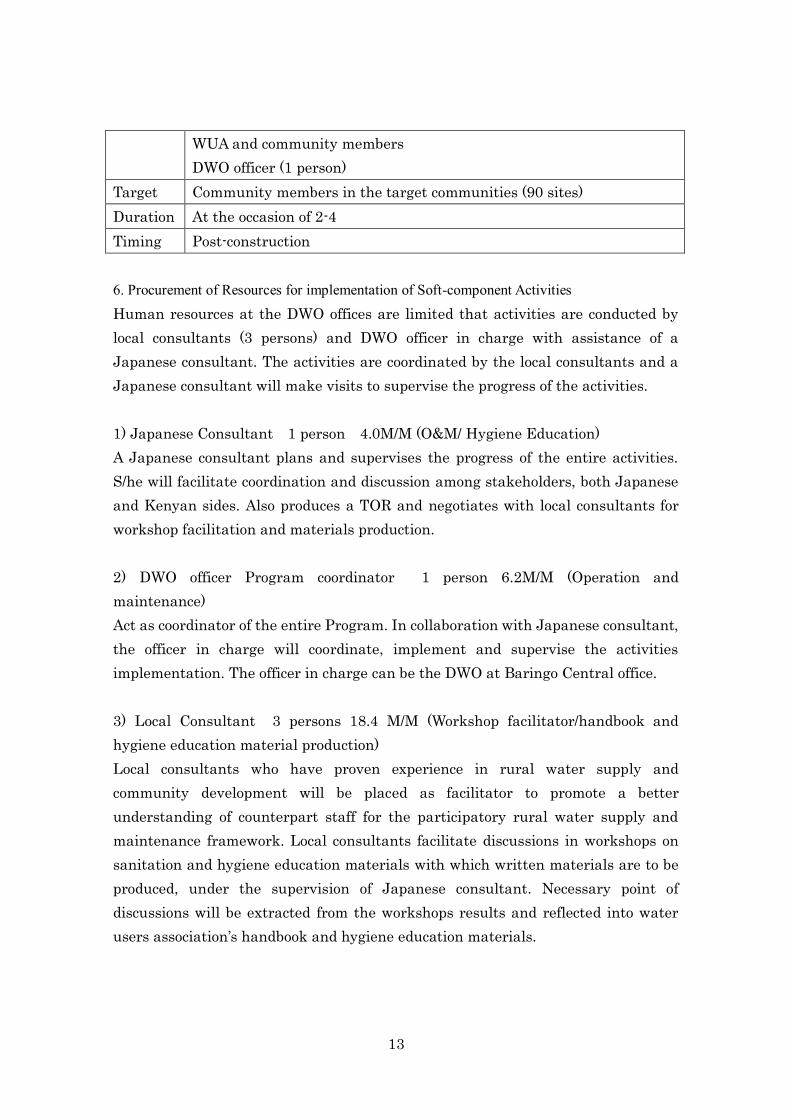
6. Procurement of Resources for implementation of Soft-component Activities
Human resources at the DWO offices are limited that activities are conducted by
local consultants (3 persons) and DWO officer in charge with assistance of a
Japanese consultant. The activities are coordinated by the local consultants and a
Japanese consultant will make visits to supervise the progress of the activities.
1) Japanese Consultant 1 person 4.0M/M (O&M/ Hygiene Education)
A Japanese consultant plans and supervises the progress of the entire activities.
S/he will facilitate coordination and discussion among stakeholders, both Japanese
and Kenyan sides. Also produces a TOR and negotiates with local consultants for
workshop facilitation and materials production.
2) DWO officer Program coordinator 1 person 6.2M/M (Operation and
maintenance)
Act as coordinator of the entire Program. In collaboration with Japanese consultant,
the officer in charge will coordinate, implement and supervise the activities
implementation. The officer in charge can be the DWO at Baringo Central office.
3) Local Consultant 3 persons 18.4 M/M (Workshop facilitator/handbook and
hygiene education material production)
Local consultants who have proven experience in rural water supply and
community development will be placed as facilitator to promote a better
understanding of counterpart staff for the participatory rural water supply and
maintenance framework. Local consultants facilitate discussions in workshops on
sanitation and hygiene education materials with which written materials are to be
produced, under the supervision of Japanese consultant. Necessary point of
discussions will be extracted from the workshops results and reflected into water
users association’s handbook and hygiene education materials.

14
7. Im
plem
enta
tion
Sche
dule
12
45
67
89
1011
121
24
56
78
910
1112
12
Soft
-com
pone
nt a
ctiv
ities
Days
CP
1-1
Wor
ksho
p on
ope
ratio
n an
d m
aint
enan
ce1
1
22
44
2-2
Trai
ning
for
com
mun
ity le
ader
s10
10
2-3
WUA
tra
inin
g80
32
2-4
Com
mun
ity E
duca
tion
9045
3-1
Mon
itorin
g on
O &
M45
30
9045
Oth
ers
(rep
ortin
g, d
ispl
acem
ent)
DDIm
p.M
Msu
mVi
sit
Japa
nese
con
sulta
nts
(O &
M/h
ygie
ne e
duca
tion)
4.0
4.0
3Lo
cal c
onsu
tlant
s (3
per
sons
)18
.418
.4
Keny
a of
ficer
(ope
ratio
n an
d m
aint
enan
ce)
6.2
6.2
MM
P e r s o n
n e lImpl
emen
tatio
n Pl
an:R
ural
Wat
er S
uppl
y in
Bar
ingo
Cou
nty
in t
he R
epub
lic o
f Ken
ya S
oft
Com
pone
nt P
rogr
amm
e
S o f t | c o m p o n e n t
1-2
Wor
ksho
p on
WUA
han
dboo
k an
dhy
gien
e ed
ucat
ion
2-1E
xpla
natio
n to
dis
tric
t of
fices
4-1H
ygie
ne E
duca
tion
�
3Ite
ms
Mon
th3
3
Jap.
1 2 4 10 20 12 6 12 12
Com
men
cem
ent
of S
oft
Prog
ress
Com
plet
ion

15
8. Output of activities
The following items are expected outputs produced through Soft component
activities.
1) Handbook for water users association
2) Agreement for water users association establishment (members’ list, regulations,
treasurer’s book)
3) Hygiene and sanitation educational materials
4) Monitoring report on operation and maintenance
5) Completion report
9. Estimated Program Costs
The cost of the program activities to be covered by Kenya: 558,000 Ksh
10. Responsibilities of the Government of Kenya
The followings are the commitments of Kenya to implement a soft-component
Program and to sustain the project outcomes.
1) To place necessary personnel to implement the Program (1 person per district).
2) To bear necessary expenditures (transport, allowance) in relation to 1).
3) To make office spaces and meeting rooms available for meetings and training.
4) To make information and documents available for project implementation.
5) To coordinate and report to related agents, offices, administration, and
communities.
6) To support an establishment of WUAs.
7) To conduct operation and maintenance and hygiene assistance activities to
communities.
8) To monitor the WUAs activities in relation to water supply, keep track records
and assist them if necessary after handing over of the facilities.

1
Appendix 6
Nr. Title Form:
Document/Book/ Video/Map/Photo
Original/ Copy
Publisher Year
1 The National Water Services Strategy (NWSS) (2007-2015) Document Copy
Ministry Of Water and Irrigation 2007/9
2 National Development Plan 2002-2008 Document Copy
Ministry of Planning 2004
3 Baringo District Development Plan 2002-2008 Document Copy
Ministry of Finance and Planning 2004
4 East Pokot District Development Plan 2008-2012 Document Copy
Ministry of State for Planning National Development and Vision 2030
2010/6
5 The Kenya gazette Book Original Authority of the Republic of Kenya 2010
6 Baringo District Development Plan 2005-2010 Document Copy
National Coordination Agency for Population and Development
2005
7 Practical Manual For Water Supply Services In Kenya File Copy Ministry of Water
and Irrigation 2005/10
8 The National Water Resources Management Strategy 1st Ed. (NWRMS) (2007-2009)
Document Original Ministry of Water and Irrigation 2007/1
9 2009 Kenya Population and Housing Census Volume IB (Population Distribution by Political Unites)
Document Original Kenya National Bureau of Statistics 2010/8
10
2009 Kenya Population and Housing Census Volume II (Population and Household Distribution by Socio-Economic Characteristics)
Document Original Kenya National Bureau of Statistics 2010/8
11
2009 Kenya Population and Housing Census Volume IC (Population Distribution by Age, Sex and Administrative Unites)
Document Original Kenya National Bureau of Statistics 2010/8
12 Demographic and Health Survey Document Original Kenya National Bureau of Statistics 2008/9
13
2009 Kenya Population and Housing Census Volume IA (Population Distribution by Administrative Unites)
Document Original Kenya National Bureau of Statistics 2010/8
14 A Socio-Economic Profile (WELL-BEING IN KENYA) Document Original Kenya National
Bureau of Statistics 2008/6
15 Basic Report (Kenya Integrated Household Budget Survey 2005/06) Document Original Kenya National
Bureau of Statistics 2007/8
16 Map of Kenya 76/1~4、77/1・3、90/1~4、91/1~4、104/1~4、105/1~4、118/1・2
Map Original Government of United Kingdom 1982
17 Kenya Administrative Boundary Map Map Original Survey of Kenya 1998
18
The project for groundwater development in rural districts under Japanese grant aid, A Trainer’s Manual
Book Original Ministry of Environment and Natural Resources
1999

NO
Site
/Villa
ge N
ame
Pop
.S
erve
d
villa
gePo
pula
tion
Site
Popu
latio
n
Ethn
icTr
ibe
Villa
geTy
peM
edic
alfa
cilit
ies
Publ
icM
TGpl
ace
Day
scho
olst
uden
ts
Boar
ding
scho
olst
uden
ts
% o
fsc
hool
child
ren
Aver
age
nr o
fC
attle
spe
rho
useh
old
Aver
age
nr o
fSh
eep
per
hous
ehol
d
Wat
er s
ourc
eD
iarr
hea
%po
pula
tion
ratio
Typh
oid
%po
pula
tion
ratio
Dry
seas
onD
ista
nce
to w
ater
(km
)
Vehi
cle
acce
ssib
ilit
y (D
rySe
ason
)
Vehi
cle
acce
ssib
ilit
y (R
ain
Seas
on)
Elec
trici
tyD
ista
nce
toel
ectri
city
(m)
Tran
sfor
me
rD
ista
nce
totra
nsfo
rmer
(m)
Publ
ictra
nspo
rtM
obile
ante
nne
Prim
ary
indu
stry
Aver
age
hous
ehol
dm
onth
lyin
com
e(k
sh)
Wat
erco
nsum
ptio
n発
電機
Will
ingn
ess
to jo
inW
SP/R
VW
SB
Will
ingn
ess
to fo
rmVH
WC
Paym
ent
met
hod
pref
erab
le
Dai
ly w
ater
paya
ble
for
dom
estic
Use
Pric
e of
Wat
ar p
er20
litte
rs b
ysu
rvey
CD
FAv
aila
bilit
yof
wat
erco
mm
ittee
Avai
labi
lity
ofre
pairm
an
Activ
ities
of N
GO
sfo
r wat
ersu
pply
1K
atib
orok
350
850
450
Tuge
nR
ural
Dis
pens
ary
V. o
ffice
520
080
2030
Riv
er20
023
.510
.01.
21
No
Goo
dN
o G
ood
Non
1000
Non
mor
e th
an 6
00N
onN
o G
ood
vest
ock/
Agric
ultu
1000
015
YY
per B
ucke
t75
20Av
aila
ble
Avai
labl
eN
oN
on
2K
onoo
450
2,72
745
0Tu
gen
Rur
alN
onV.
offi
ce25
20
5020
40R
iver
180
6.6
40.0
1.5
0.2
Goo
dN
o G
ood
Non
mor
e th
an 1
000
Non
Non
No
Goo
dve
stoc
k/Ag
ricul
tu10
000
30Y
Ype
r Buc
ket
7520
Avai
labl
eAv
aila
ble
No
Exis
tent
3K
orm
or30
02,
727
300
Rur
alN
onV.
offi
ce35
00
7010
30R
iver
301.
140
.01.
51
Goo
dN
o G
ood
Non
mor
e th
an 1
000
Non
Non
Goo
dLi
vest
ock
1200
018
YY
per B
ucke
t95
20-3
0Av
aila
ble
Avai
labl
eN
oN
on
5K
ibul
iak
650
1,54
067
0Tu
gen
Rur
alD
ispe
nsar
yFi
eld
772
067
1530
Riv
er30
1.9
3.0
0.2
1N
o G
ood
Impo
ssib
leSi
ngle
Ph
500
Exis
tent
600
Non
No
Goo
dve
stoc
k/Ag
ricul
tu10
000
20-
Ype
r Mon
th14
020
Avai
labl
eAv
aila
ble
Avai
labl
eN
on
6K
apna
rok
360
2,55
936
0Tu
gen
Rur
alN
on36
00
3820
40R
iver
250
9.8
7.0
0.3
5G
ood
No
Goo
dN
onm
ore
than
100
0N
onN
onN
o G
ood
Live
stoc
k12
000
36Y
Ype
r Buc
ket
7520
Non
Avai
labl
eN
oEx
iste
nt
7C
hem
ondo
i28
01,
660
280
Tuge
nR
ural
Dis
pens
ary
Fiel
d56
70
7040
40R
iver
804.
860
.03.
63
No
Goo
dIm
poss
ible
Non
mor
e th
an 1
000
Non
mor
e th
an 6
00N
onG
ood
Live
stoc
k12
000
18Y
Ype
r Buc
ket
7520
Avai
labl
eN
o-
Non
10M
oigu
two
340
4,22
634
0Tu
gen
Rur
alD
ispe
nsar
yFi
eld
740
090
4040
Riv
er80
1.9
60.0
1.4
3G
ood
No
Goo
dN
onN
onN
o G
ood
vest
ock/
Agric
ultu
1000
016
YY
per B
ucke
t30
030
-40
Avai
labl
eAv
aila
ble
No
Non
11K
atik
it28
01,
407
280
Tuge
nR
ural
Dis
pens
ary
Fiel
d0
093
2040
Riv
er10
07.
125
.01.
83
No
Goo
dIm
poss
ible
Non
mor
e th
an 1
000
Non
mor
e th
an 6
00N
onG
ood
Live
stoc
k12
000
16-
Ype
r Buc
ket
7510
-20
Avai
labl
eN
o-
Non
12A
yatia
340
636
340
Tuge
nR
ural
Dis
pens
ary
Fiel
d30
00
8320
40R
iver
200
31.4
25.0
3.9
mor
e th
an 5
No
Goo
dIm
poss
ible
Non
mor
e th
an 1
000
Non
mor
e th
an 6
00N
onG
ood
Live
stoc
k12
000
37-
Ype
r Buc
ket
7520
Avai
labl
eN
o-
Non
13M
arig
ut60
01,
407
430
Tuge
nR
ural
Dis
pens
ary
Fiel
d46
30
9320
40R
iver
100
7.1
30.0
2.1
5N
o G
ood
Impo
ssib
leN
onm
ore
than
100
0N
onm
ore
than
600
Non
Goo
dLi
vest
ock
1200
050
-Y
per B
ucke
t11
020
Avai
labl
eN
o-
Non
14C
hesa
ngic
h35
048
035
0Tu
gen
Rur
alN
onFi
eld
330
085
2040
Riv
er70
14.6
20.0
4.2
0.2
No
Goo
dN
o G
ood
Non
mor
e th
an 1
000
Non
mor
e th
an 6
00N
onG
ood
Live
stoc
k12
000
50-
Ype
r Buc
ket
9050
Non
Avai
labl
eN
o
15K
apam
in29
01,
492
690
Tuge
nSe
mi u
rban
Dis
pens
ary
Scho
ol51
50
715
Riv
er60
4.0
35.0
2.3
0.2
Goo
dN
o G
ood
Thre
e Ph
1000
Exis
tent
600
Non
No
Goo
dAg
ricul
ture
8000
7-
Ype
r Buc
ket
170
20Av
aila
ble
No
-N
on
16K
apko
mbe
550
1,40
01,
000
Tuge
nSe
mi u
rban
Dis
pens
ary
V. o
ffice
280
088
57
Riv
er60
4.3
35.0
2.5
1G
ood
No
Goo
dTh
ree
Ph10
00Ex
iste
nt60
0N
onG
ood
Agric
ultu
re80
008
-Y
per B
ucke
t12
020
Non
Avai
labl
e-
Non
17C
ham
bai P
rimar
y65
077
565
0Tu
gen
Rur
alN
onSc
hool
400
090
720
Riv
er60
7.7
35.0
4.5
2N
o G
ood
No
Goo
dTh
ree
Ph10
00Ex
iste
ntm
ore
than
600
Non
No
Goo
dAg
ricul
ture
8000
8-
Ype
r Buc
ket
230
20Av
aila
ble
No
-N
on
19B
arke
tieu
Prim
ary
390
1,80
040
0Tu
gen
Rur
alD
ispe
nsar
yV.
offi
ce72
036
23
Riv
er42
923
.812
0.0
6.7
1N
o G
ood
Impo
ssib
leN
on50
0Ex
iste
nt60
0PS
VG
ood
Agric
ultu
re80
008
-Y
per M
onth
7010
-20
No
-Ex
iste
nt
24To
boro
i90
02,
200
600
Tuge
nR
ural
Non
Fiel
d91
051
055
4040
Dug
wel
l80
3.6
60.0
2.7
3N
o G
ood
No
Goo
dN
onN
o G
ood
Live
stoc
k12
000
22Y
Ype
r Buc
ket
260
30-4
0Av
aila
ble
Avai
labl
eN
oN
on
25Li
ngok
280
2,50
028
0P
okot
Rur
alN
onV.
offi
ce36
00
8022
40R
iver
219
8.8
312.
012
.52
No
Goo
dIm
poss
ible
Non
mor
e th
an 1
000
Non
mor
e th
an 6
00M
oto/
occa
sion
Goo
dLi
vest
ock/
Agric
ultu
re10
000
24Y
Ype
r Buc
ket
6020
-30
Avai
labl
eAv
aila
ble
No
Exis
tent
26B
arki
lach
300
1,50
040
0Tu
gen
Rur
alD
ispe
nsar
yV.
offi
ce0
061
1533
Riv
er0.
00.
02
Impo
ssib
leIm
poss
ible
Non
mor
e th
an 1
000
Non
mor
e th
an 6
00PS
VN
o G
ood
Live
stoc
k12
000
20-
Ype
r Buc
ket
2520
Avai
labl
eN
oEx
iste
nt
27U
suon
in27
02,
000
300
Pok
otR
ural
Dis
pens
ary
V. o
ffice
670
074
67
Riv
er21
911
.031
2.0
15.6
1N
o G
ood
Impo
ssib
leN
onm
ore
than
100
0N
onm
ore
than
600
PSV
No
Goo
dLi
vest
ock
1200
020
-Y
per B
ucke
t25
25-3
0Av
aila
ble
Avai
labl
eAv
aila
ble
Exis
tent
28K
olon
gotw
o35
02,
732
420
Tuge
nR
ural
Dis
pens
ary
V. o
ffice
00
6510
13D
ugw
ell
300
11.0
300.
011
.02
No
Goo
dN
o G
ood
Non
mor
e th
an 1
000
Non
PSV
Goo
dLi
vest
ock
1200
050
-Y
per B
ucke
t25
20Av
aila
ble
--
Exis
tent
29K
oiba
war
e21
03,
500
210
Tuge
nR
ural
Dis
pens
ary
V. o
ffice
1090
098
4011
0D
ugw
ell
180
5.1
140.
04.
02
No
Goo
dN
o G
ood
Non
mor
e th
an 1
000
Non
mor
e th
an 6
00PS
VG
ood
Live
stoc
k12
000
30-
Ype
r Buc
ket
2520
Avai
labl
e-
-Ex
iste
nt
30C
hepk
ewel
350
4,17
235
0Tu
gen
Rur
alD
ispe
nsar
yV.
offi
ce20
00
9010
10R
iver
802.
360
.01.
71
No
Goo
dN
o G
ood
Non
mor
e th
an 1
000
Non
mor
e th
an 6
00PS
VG
ood
Live
stoc
k12
000
25-
Ype
r Buc
ket
2520
Avai
labl
e-
-Ex
iste
nt
31C
hem
oron
gion
420
3,09
035
0Tu
gen
Rur
alD
ispe
nsar
yN
on60
00
8033
40R
iver
300
9.7
300.
09.
73
Goo
dN
o G
ood
Non
mor
e th
an 1
000
Non
mor
e th
an 6
00PS
VG
ood
Live
stoc
k12
000
13-
Ype
r Buc
ket
2525
-30
Avai
labl
eAv
aila
ble
No
Non
32K
aptu
ro46
02,
400
460
Tuge
nR
ural
Dis
pens
aryc
hurc
h/sc
h60
00
707
11R
iver
803.
360
.02.
52
No
Goo
dN
o G
ood
Non
Non
No
Goo
dLi
vest
ock
1200
017
YY
per B
ucke
t33
030
-50
Avai
labl
eAv
aila
ble
-N
on
33R
ondi
nir
400
1,40
040
0Tu
gen
Rur
alD
ispe
nsar
yV.
offi
ce40
00
615
15R
iver
219
15.6
229.
016
.42
Impo
ssib
leIm
poss
ible
Non
mor
e th
an 1
000
Non
mor
e th
an 6
00N
o G
ood
Live
stoc
k12
000
35-
Ype
r Buc
ket
2520
Avai
labl
e-
Exis
tent
35C
hem
oe45
073
955
0Tu
gen
Rur
alN
onV.
offi
ce12
50
4220
40D
ugw
ell
250
33.8
50.0
6.8
2G
ood
No
Goo
dSi
ngle
Ph
1000
Exis
tent
mor
e th
an 6
00PS
VG
ood
vest
ock/
Agric
ultu
1000
047
-Y
per B
ucke
t25
5-18
-N
o
36B
arw
essa
800
3,04
780
0Tu
gen
Rur
alH
ealth
Cen
teV.
offi
ce63
010
080
2040
Riv
er20
06.
630
.01.
03
Goo
dN
onm
ore
than
100
0N
onm
ore
than
600
Non
Goo
dLi
vest
ock
1200
013
YY
per B
ucke
t75
20Av
aila
ble
No
Exis
tent
38Li
kwon
450
1,65
547
0Tu
gen
Rur
alD
ispe
nsar
yFi
eld
340
120
657
10R
iver
400
24.2
220.
013
.31
No
Goo
dN
o G
ood
Non
5300
0N
on47
000
Non
Goo
dLi
vest
ock
1200
050
YY
per B
ucke
t12
525
Avai
labl
eN
o-
Exis
tent
39S
erem
wo
400
1,04
440
0Tu
gen
Rur
alN
onFi
eld
220
080
713
Dug
wel
l62
5.9
0.0
0.2
Oth
ers
Oth
ers
Non
mor
e th
an 1
000
Non
mor
e th
an 6
00N
onN
o G
ood
Agric
ultu
re80
0013
-Y
per B
ucke
t18
020
Avai
labl
eN
o-
Non
40K
apki
rwok
600
1,03
160
0Tu
gen
Rur
alN
onFi
eld
350
570
787
11D
ugw
ell
424.
10.
03
Oth
ers
Oth
ers
Sing
le P
h10
00Ex
iste
ntm
ore
than
600
PSV
No
Goo
dAg
ricul
ture
8000
13-
Ype
r Buc
ket
290
20N
oN
oN
on
41K
apko
mol
300
931
300
Tuge
nR
ural
Non
Fiel
d35
00
905
1350
0053
7.1
0.0
1Im
poss
ible
Impo
ssib
leN
onm
ore
than
100
0N
onm
ore
than
600
Non
No
Goo
dAg
ricul
ture
8000
13Y
Ype
r Buc
ket
250
20Av
aila
ble
No
No
Non
42K
apch
epko
r90
03,
600
930
Tuge
nSe
mi u
rban
Non
V. o
ffice
680
370
277
5R
iver
0.0
0.0
0.2
No
Goo
dN
o G
ood
Thre
e Ph
500
Exis
tent
600
Non
No
Goo
dAg
ricul
ture
8000
6Y
Ype
r Buc
ket
100
10-2
0Av
aila
ble
Avai
labl
eAv
aila
ble
Non
43K
apte
re80
02,
300
800
Tuge
nSe
mi u
rban
Dis
pens
ary
Non
1050
420
805
3R
iver
0.0
0.0
3G
ood
No
Goo
dSi
ngle
Ph
500
Exis
tent
600
PSV
Goo
dAg
ricul
ture
8000
38Y
Ype
r Mon
th15
020
-30
Non
No
Non
44B
oin
410
550
400
Tuge
nSe
mi u
rban
Non
Fiel
d20
00
907
7R
iver
0.0
0.0
1G
ood
No
Goo
dTh
ree
Ph10
0Ex
iste
nt10
0N
onG
ood
Agric
ultu
re80
0011
YY
per B
ucke
t20
010
Avai
labl
eAv
aila
ble
No
Non
45Ti
riond
onin
450
2,01
045
0Tu
gen
Sem
i urb
anN
onV.
offi
ce56
045
066
711
Riv
er/S
prin
g50
0024
8.8
0.0
0.2
Goo
dN
o G
ood
Thre
e Ph
100
Exis
tent
600
Non
No
Goo
dve
stoc
k/Ag
ricul
tu10
000
4Y
Ype
r Buc
ket
9010
-40
Avai
labl
eAv
aila
ble
Avai
labl
eN
on
46K
aptu
m90
03,
521
620
Rur
alea
lth C
ente
Fiel
d11
3045
06
750
0014
2.0
0.0
1Im
poss
ible
Impo
ssib
leSi
ngle
Ph
500
Exis
tent
600
Mot
oFa
irAg
ricul
ture
8000
11Y
Ype
r Buc
ket
230
20Av
aila
ble
Avai
labl
eN
oN
on
47O
ssen
For
est s
tatio
n74
03,
021
890
Tuge
nR
ural
Hea
lth C
ente
Fiel
d12
4045
074
612
0.0
0.0
2Im
poss
ible
Impo
ssib
leSi
ngle
Ph
100
Exis
tent
600
Mot
oFa
irAg
ricul
ture
8000
8Y
Ype
r Buc
ket
130
10-2
0Av
aila
ble
Avai
labl
eN
oN
on
48K
aptu
min
600
2,70
01,
200
Tuge
nR
ural
Dis
pens
arys
ch/c
hu/fi
e35
00
987
14R
iver
/Spr
ing
0.0
0.0
2G
ood
No
Goo
dTh
ree
Ph50
0Ex
iste
nt60
0PS
VG
ood
Agric
ultu
re80
008
YY
per B
ucke
t26
020
-30
Avai
labl
e-
Avai
labl
eN
on
49K
ures
chun
600
2,00
01,
500
Tuge
nSe
mi u
rban
Non
scho
ol28
00
957
7R
iver
/Spr
ing
0.0
0.0
1G
ood
No
Goo
dTh
ree
Ph10
00Ex
iste
ntm
ore
than
600
PSV
Goo
dve
stoc
k/Ag
ricul
tu10
000
10-
Ype
r Buc
ket
300
20-3
0-
-N
on
50K
ipko
kom
500
2,00
01,
000
Tuge
nR
ural
Non
scho
ol40
00
957
5R
iver
/Spr
ing
250
12.5
70.0
3.5
2G
ood
No
Goo
dN
onm
ore
than
100
0N
onm
ore
than
600
Goo
dAg
ricul
ture
8000
5-
Ype
r Buc
ket
110
10-2
0Av
aila
ble
--
Non
51K
amag
onge
450
1,14
645
0Tu
gen
Rur
alN
onN
on0
450
8010
30C
omm
unal
fau
2766
241.
417
.01.
51
No
Goo
dIm
poss
ible
Non
500
Non
PSV
Goo
dO
ther
s10
000
45-
YD
on't
like
topa
y75
20N
on-
-Ex
iste
nt
53K
apsa
mso
n45
04,
393
450
Tuge
nR
ural
Non
Non
640
049
1516
Riv
er27
6663
.017
.00.
43
No
Goo
dIm
poss
ible
Non
1000
Non
mor
e th
an 6
00N
onG
ood
Oth
ers
1000
047
-Y
per B
ucke
t34
016
-20
Non
Non
-Ex
iste
nt
54S
iriny
o34
01,
700
340
Tuge
nR
ural
Non
Non
00
802
10R
iver
0.0
0.0
3N
o G
ood
Impo
ssib
leN
onm
ore
than
100
0N
onm
ore
than
600
Non
Goo
dN
one
1000
028
-Y
per B
ucke
t90
30Av
aila
ble
Non
-N
on
56K
amim
ba45
01,
146
450
Tuge
nR
ural
Non
Non
810
735
20R
iver
0.0
0.0
1N
o G
ood
Impo
ssib
leN
on10
00N
onm
ore
than
600
Non
Goo
dO
ther
s10
000
50-
YD
on't
like
topa
y36
010
Avai
labl
eN
on-
Non
58C
atho
lic28
04,
593
390
Kis
iiSe
mi u
rban
Dis
pens
ary
Aids
MTG
296
023
715
Sprin
g/Pi
ped
491.
133
.00.
70.
2G
ood
Goo
dN
on10
0Ex
iste
nt60
0M
oto
Goo
dO
ther
s10
000
50Y
Ype
r Buc
ket
705-
10N
onN
onN
oN
on
60N
dam
bul
380
2,01
538
0Tu
gen
Rur
alN
onW
ater
offi
ce77
00
665
5Sp
ring/
Com
mua
l fau
cet
0.0
0.0
1G
ood
No
Goo
dN
on10
0N
onm
ore
than
600
Boda
bod
aG
ood
Non
e10
000
48Y
Ype
r Buc
ket
140
3-20
Avai
labl
eAv
aila
ble
Avai
labl
eEx
iste
nt
61A
bori
370
709
370
Jem
psR
ural
Non
Fiel
d39
00
927
15R
iver
709.
910
.01.
43
Sing
le P
hN
onm
ore
than
600
Non
Goo
dLi
vest
ock
1200
0Y
YAv
aila
ble
Avai
labl
eAv
aila
ble
Non
62Ilc
hura
i26
068
926
0Je
mps
Rur
alN
onV.
offi
ce23
50
8510
25D
ugw
ell
0.0
0.0
Goo
dG
ood
Non
1000
Non
mor
e th
an 6
00PS
VG
ood
vest
ock/
Agric
ultu
1000
025
-Y
per B
ucke
t15
-20
Non
-Ex
iste
nt
63E
ldum
e ce
ntre
620
2,63
862
0R
ural
Non
V. o
ffice
490
3065
320
Riv
er0.
00.
03
No
Goo
dIm
poss
ible
Sing
le P
h50
0Ex
iste
nt60
0M
oto/
regu
larly
Goo
dLi
vest
ock
1200
0-
YN
onN
on-
Non
64Lo
ngiro
n49
070
949
0Je
mps
Rur
alN
onN
on22
40
807
25R
iver
2766
390.
117
.02.
41
No
Goo
dIm
poss
ible
Non
mor
e th
an 1
000
Non
mor
e th
an 6
00M
oto/
50%
Goo
d10
000
50-
Ype
r Buc
ket
100
5-20
Non
Non
-Ex
iste
nt
65M
arti
460
1,93
746
0Je
mps
Rur
alN
onN
on61
20
7922
33R
iver
0.0
0.0
5Im
poss
ible
Impo
ssib
leN
on50
0Ex
iste
nt60
0M
oto/
50%
Agric
ultu
re80
0050
-Y
per B
ucke
t25
5N
onN
on-
Non
66K
ampi
ya
Sam
aki
1,30
01,
840
1,30
0Tu
gen
Rur
alD
ispe
nsar
yV.
offi
ce0
070
725
Riv
er0.
00.
02
No
Goo
dIm
poss
ible
Non
mor
e th
an 1
000
Non
mor
e th
an 6
00M
oto
No
Goo
dLi
vest
ock
1200
021
-Y
per B
ucke
t16
020
Avai
labl
eN
on-
Non
67Le
suuw
a35
01,
800
187
Jem
psR
ural
Non
Fiel
d73
097
4313
5R
iver
150
8.3
80.0
4.4
2G
ood
Impo
ssib
leN
onN
onG
ood
vest
ock/
Agric
ultu
1000
0Y
YAv
aila
ble
Avai
labl
eAv
aila
ble
Non
68K
ipch
emei
380
1,36
638
0Tu
gen
Rur
alD
ispe
nsar
yV.
offi
ce39
00
6911
50R
iver
0.0
0.0
2G
ood
Goo
dN
onM
oto
No
Goo
dLi
vest
ock
1200
0Y
Y20
Arid
Lan
dsAv
aila
ble
Avai
labl
eEx
iste
nt
69K
apke
chii
290
4,26
029
0Tu
gen
Rur
alD
ispe
nsar
yV.
offi
ce39
50
2022
90R
iver
0.0
500.
011
.72
Goo
dN
o G
ood
Non
Mot
oN
o G
ood
Live
stoc
k12
000
50-
Ype
r Buc
ket
500
20Av
aila
ble
Non
-Ex
iste
nt
70Lo
ropi
l37
02,
388
370
Jem
psR
ural
Non
Non
539
083
423
428
17.9
0.0
1N
o G
ood
Impo
ssib
leN
onm
ore
than
100
0N
onm
ore
than
600
Non
Goo
dN
one
1000
050
-Y
per B
ucke
t33
050
Latif
fN
on-
Exis
tent
72K
imal
el H
ospi
tal
380
969
380
Tuge
nSe
mi u
rbanH
ealth
Cen
teV.
offi
ce0
078
433
Riv
er/D
ugw
el0.
00.
01
Goo
dG
ood
Non
mor
e th
an 1
000
Tus
Goo
dLi
vest
ock
1200
050
YY
per B
ucke
t75
3-5
Avai
labl
eN
onAv
aila
ble
Non
73K
isam
ison
chun
300
969
300
Tuge
nR
ural
Non
V. o
ffice
408
069
340
0.0
0.0
Goo
dN
o G
ood
Non
Non
No
Goo
dLi
vest
ock
1200
050
-Y
per B
ucke
t50
03-
4Av
aila
ble
Non
-Ex
iste
nt
74Lo
koiw
opso
nchu
n27
096
927
0Tu
gen
Rur
alN
onN
on20
00
657
40R
iver
0.0
0.0
1G
ood
No
Goo
dN
onN
onN
o G
ood
Live
stoc
k12
000
50-
Ype
r Buc
ket
500
5-20
Non
-N
on
75K
inya
ch32
01,
366
320
Tuge
nR
ural
Non
Non
356
085
1140
Riv
er0.
050
0.0
36.6
2G
ood
No
Goo
dN
onN
onG
ood
Live
stoc
k12
000
50Y
Ype
r Buc
ket
500
3N
onAv
aila
ble
Avai
labl
eN
on
77Ti
rng'
ongw
onin
350
1,14
635
0Tu
gen
Rur
alN
onV.
offi
ce12
50
4111
100
Riv
er0.
00.
02
Goo
dN
o G
ood
Non
Mot
oN
o G
ood
Live
stoc
k12
000
50-
- pe
r Buc
ket
500
25N
on-
Exis
tent
78K
ibin
gor
450
695
450
Tuge
nSe
mi u
rban
Non
V. o
ffice
240
097
740
Riv
er0.
00.
02
Goo
dN
o G
ood
Non
100
Mot
oN
o G
ood
Live
stoc
k12
000
50Y
Ype
r Mon
th50
0La
tiff
Avai
labl
eN
o
79W
oker
ben
400
689
450
Tuge
nSe
mi u
rban
Non
V. o
ffice
120
086
1530
Riv
er0.
00.
01
Goo
dN
o G
ood
Non
500
Non
600
Mot
oN
o G
ood
Live
stoc
k12
000
50Y
Ype
r Mon
th50
0La
tiff
Avai
labl
eN
o
81K
abus
a60
079
460
0Tu
gen
Rur
alN
onV.
offi
ce27
90
9040
190
Riv
er0.
00.
01
Goo
dN
o G
ood
Non
Mot
oN
o G
ood
Live
stoc
k12
000
-Y
per B
ucke
t20
Non
-Ex
iste
nt
82B
arse
moi
500
1,36
650
0Tu
gen
Rur
alV.
offi
ce15
90
808
330.
00.
01
Goo
dN
o G
ood
Non
Mot
oLi
vest
ock
1200
050
YY
per B
ucke
t50
020
Latif
fAv
aila
ble
-Ex
iste
nt
83K
iwan
ja N
dege
340
1,05
934
0E
ndor
ois
Rur
al11
00
5020
75R
iver
605.
70.
01
Thre
e Ph
1000
Non
mor
e th
an 6
00G
ood
--
--
84C
hela
ba46
01,
086
400
End
oroi
sR
ural
Non
Fiel
d45
050
8525
22R
iver
0.0
0.0
2N
o G
ood
No
Goo
dN
onm
ore
than
100
0N
onm
ore
than
600
Mot
o/re
gula
rlyG
ood
vest
ock/
Agric
ultu
1000
045
YY
Avai
labl
eAv
aila
ble
No
Non
85C
hepk
otoi
yan
370
1,30
037
0E
ndor
ois
Rur
alN
onFi
eld
192
095
1040
Riv
er0.
00.
05
Goo
dN
o G
ood
Non
100
Exis
tent
100
Mot
oN
o G
ood
vest
ock/
Agric
ultu
1000
050
YY
per B
ucke
t75
20Av
aila
ble
Avai
labl
eAv
aila
ble
Exis
tent
86S
amur
an45
01,
300
450
End
oroi
sR
ural
Non
Non
140
080
730
Riv
er40
3.1
20.0
1.5
5G
ood
No
Goo
dN
onm
ore
than
100
0N
onm
ore
than
600
Non
Goo
dve
stoc
k/Ag
ricul
tu10
000
25-
Ype
r Buc
ket
100
20Av
aila
ble
Non
-N
on
87M
osur
o34
057
834
0Tu
gen
Rur
alN
onV.
offi
ce31
00
9115
18R
iver
0.0
0.0
1G
ood
Goo
dN
onm
ore
than
100
0N
onm
ore
than
600
PSV
Goo
dLi
vest
ock
1000
040
-Y
per M
onth
6020
Non
-N
on
88Lo
gum
gum
340
3,00
090
0Je
mps
Rur
alN
onN
on0
098
69
Riv
er0.
00.
0m
ore
than
5N
o G
ood
Impo
ssib
leN
onm
ore
than
100
0N
onm
ore
than
600
Goo
dO
ther
s10
000
40-
Ype
r Buc
ket
250
22N
onN
on-
Non
89M
ocho
ngoi
cen
tre65
01,
552
402
Tuge
nR
ural
Dis
pens
ary
V. o
ffice
432
087
1013
Riv
er0.
0##
###
64.4
0.2
Goo
dG
ood
Non
mor
e th
an 1
000
Non
mor
e th
an 6
00PS
VG
ood
vest
ock/
Agric
ultu
1000
050
-Y
per B
ucke
t25
2Av
aila
ble
Non
-Ex
iste
nt
90K
apke
chir
600
4,26
064
0Tu
gen
Rur
alD
ispe
nsar
yV.
offi
ce77
30
8423
35R
iver
249
5.8
0.0
0.2
Goo
dG
ood
Non
mor
e th
an 1
000
Non
mor
e th
an 6
00PS
VG
ood
Live
stoc
k12
000
40-
-pe
r Buc
ket
252
Avai
labl
eN
on-
Exis
tent
92K
ipka
ndul
e50
01,
278
500
Tuge
nR
ural
Dis
pens
ary
Non
420
085
4060
Dug
wel
l15
712
.30.
01
Goo
dN
o G
ood
Non
mor
e th
an 1
000
Non
mor
e th
an 6
00PS
VN
o G
ood
vest
ock/
Agric
ultu
1000
050
YY
per B
ucke
t25
1-2
Avai
labl
eAv
aila
ble
Avai
labl
eEx
iste
nt
94S
amba
ka35
03,
794
450
Tuge
nR
ural
Hea
lth C
ente
Fiel
d28
70
9633
50R
iver
551
14.5
0.0
0.2
Non
mor
e th
an 1
000
Non
mor
e th
an 6
00PS
VG
ood
vest
ock/
Agric
ultu
1000
050
-Y
per B
ucke
t25
2Av
aila
ble
Non
-Ex
iste
nt
95N
yalilb
uch
280
1,94
251
8Tu
gen
Rur
alN
onC
hief
219
195
3720
50R
iver
592
30.5
0.0
1Im
poss
ible
Impo
ssib
leN
onm
ore
than
100
0N
onm
ore
than
600
PSV
Goo
dLi
vest
ock
1200
050
-Y
per B
ucke
t34
02
Non
Non
-
96S
okon
in27
02,
853
270
Tuge
nR
ural
Dis
pens
ary
V. o
ffice
612
086
1550
Riv
er48
216
.90.
01
No
Goo
dN
o G
ood
Non
mor
e th
an 1
000
Non
mor
e th
an 6
00PS
VG
ood
Live
stoc
k12
000
50-
Ype
r Buc
ket
252
Avai
labl
eAv
aila
ble
-Ex
iste
nt
Soc
ial S
urve
y
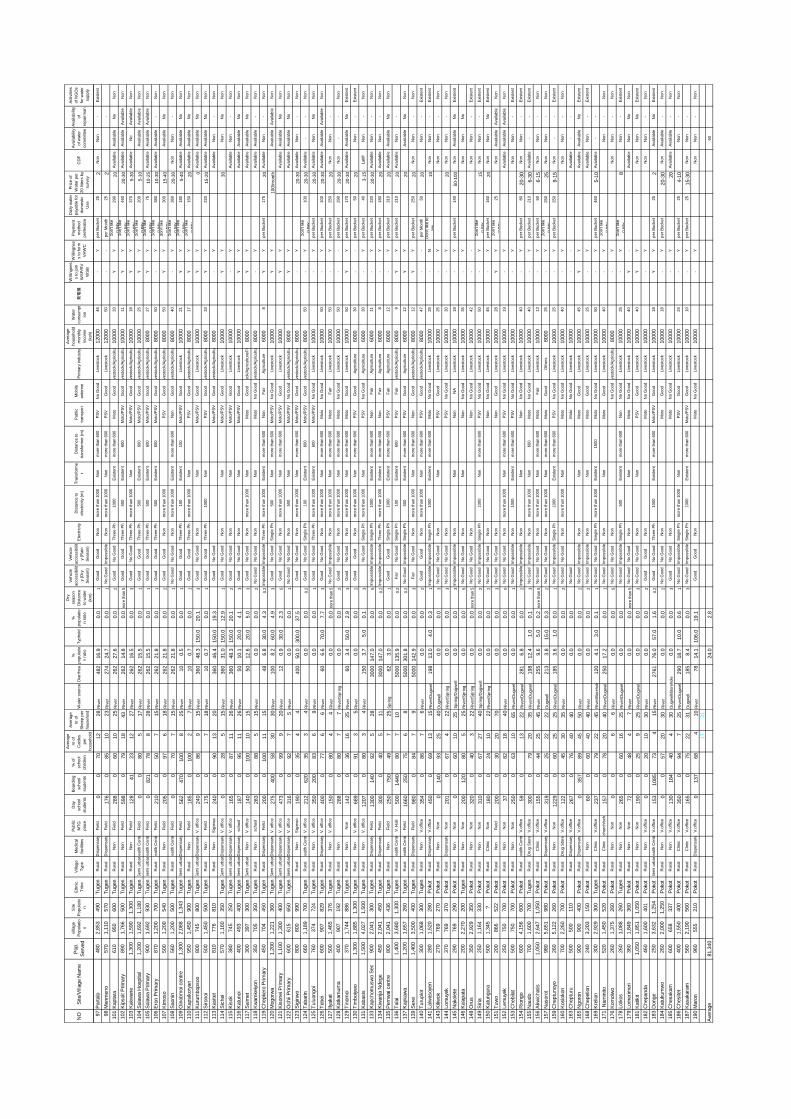
NO
Site
/Villa
ge N
ame
Pop
.S
erve
d
villa
gePo
pula
tion
Site
Popu
latio
n
Ethn
icTr
ibe
Villa
geTy
peM
edic
alfa
cilit
ies
Publ
icM
TGpl
ace
Day
scho
olst
uden
ts
Boar
ding
scho
olst
uden
ts
% o
fsc
hool
child
ren
Aver
age
nr o
fC
attle
spe
rho
useh
old
Aver
age
nr o
fSh
eep
per
hous
ehol
d
Wat
er s
ourc
eD
iarr
hea
%po
pula
tion
ratio
Typh
oid
%po
pula
tion
ratio
Dry
seas
onD
ista
nce
to w
ater
(km
)
Vehi
cle
acce
ssib
ilit
y (D
rySe
ason
)
Vehi
cle
acce
ssib
ilit
y (R
ain
Seas
on)
Elec
trici
tyD
ista
nce
toel
ectri
city
(m)
Tran
sfor
me
rD
ista
nce
totra
nsfo
rmer
(m)
Publ
ictra
nspo
rtM
obile
ante
nne
Prim
ary
indu
stry
Aver
age
hous
ehol
dm
onth
lyin
com
e(k
sh)
Wat
erco
nsum
ptio
n発
電機
Will
ingn
ess
to jo
inW
SP/R
VW
SB
Will
ingn
ess
to fo
rmVH
WC
Paym
ent
met
hod
pref
erab
le
Dai
ly w
ater
paya
ble
for
dom
estic
Use
Pric
e of
Wat
ar p
er20
litte
rs b
ysu
rvey
CD
FAv
aila
bilit
yof
wat
erco
mm
ittee
Avai
labi
lity
ofre
pairm
an
Activ
ities
of N
GO
sfo
r wat
ersu
pply
97P
arta
lo48
02,
853
490
Tuge
nR
ural
Dis
pens
ary
Fiel
d0
070
1228
Riv
er48
216
.90.
01
Goo
dG
ood
Non
mor
e th
an 1
000
Non
mor
e th
an 6
00PS
VN
o G
ood
Live
stoc
k12
000
46-
Ype
r Buc
ket
252
Non
Non
-Ex
iste
nt
98M
enm
eno
570
1,11
057
0Tu
gen
Rur
alD
ispe
nsar
yFi
eld
176
085
1023
Riv
er27
424
.70.
01
No
Goo
dIm
poss
ible
Non
mor
e th
an 1
000
Non
mor
e th
an 6
00PS
VG
ood
Live
stoc
k12
000
50-
-pe
r Mon
th25
2-
101
Kap
tara
610
950
600
Tuge
nR
ural
Non
Fiel
d28
80
6010
25R
iver
262
27.6
0.0
2G
ood
No
Goo
dTh
ree
Ph10
00Ex
iste
ntm
ore
than
600
Mot
oG
ood
vest
ock/
Agric
ultu
1000
033
YY
Don
't lik
eto
pay
290
20Av
aila
ble
Avai
labl
eN
oN
on
102
Kip
soit
Prim
ary
890
1,76
650
0Tu
gen
Rur
alN
onFi
eld
598
079
1843
Riv
er26
214
.80.
0m
ore
than
5G
ood
Goo
dTh
ree
Ph50
0Ex
iste
nt60
0M
oto/
PSV
Goo
dve
stoc
k/Ag
ricul
tu10
000
11Y
YD
on't
like
topa
y46
020
-30
Avai
labl
eAv
aila
ble
Avai
labl
eN
on
103
Kak
wan
e1,
300
1,59
01,
300
Tuge
nR
ural
Non
Fiel
d12
841
2312
27R
iver
262
16.5
0.0
3G
ood
No
Goo
dTh
ree
Phm
ore
than
100
0N
onM
oto/
PSV
Goo
dve
stoc
k/Ag
ricul
tu10
000
18Y
YD
on't
like
topa
y37
05-
30Av
aila
ble
No
Avai
labl
eN
on
104
Sal
awa
Hos
pita
l1,
200
1,69
21,
180
Tuge
nSe
mi u
rbanH
ealth
Cen
teFi
eld
00
805
17R
iver
262
15.5
0.0
1G
ood
Goo
dTh
ree
Ph50
0Ex
iste
nt60
0M
oto/
PSV
Goo
dve
stoc
k/Ag
ricul
tu10
000
25Y
YD
on't
like
topa
y20
05-
10Av
aila
ble
Avai
labl
eN
on
105
Sal
awa
Prim
ary
900
1,69
293
0Tu
gen
Sem
i urb
anHea
lth C
ente
Fiel
d0
821
788
28R
iver
262
15.5
0.0
1G
ood
Goo
dTh
ree
Ph50
0Ex
iste
nt60
0M
oto/
PSV
Goo
dve
stoc
k/Ag
ricul
tu80
0027
YY
Don
't lik
eto
pay
7510
-25
Avai
labl
eAv
aila
ble
Avai
labl
eN
on
106
Ero
n P
rimar
y87
01,
200
700
Tuge
nR
ural
Hea
lth C
ente
Fiel
d21
00
507
15R
iver
262
21.8
0.0
1G
ood
Goo
dTh
ree
Ph50
0Ex
iste
nt60
0M
oto/
PSV
Goo
dve
stoc
k/Ag
ricul
tu80
0050
-Y
Don
't lik
eto
pay
380
10-3
0Av
aila
ble
Avai
labl
e-
Non
107
Kim
oso
500
1,20
054
0Tu
gen
Rur
alN
onFi
eld
205
097
618
Riv
er26
221
.80.
02
Goo
dG
ood
Non
mor
e th
an 1
000
PSV
Goo
dve
stoc
k/Ag
ricul
tu80
0050
YY
don'
t lik
eto
pay
300
15-4
0Av
aila
ble
No
Non
108
Sao
nin
560
1,20
050
0Tu
gen
Rur
alH
ealth
Cen
teFi
eld
00
707
15R
iver
262
21.8
0.0
1N
o G
ood
No
Goo
dN
onm
ore
than
100
0Ex
iste
ntm
ore
than
600
Non
Goo
dve
stoc
k/Ag
ricul
tu80
0040
-Y
Don
't lik
eto
pay
360
20-3
0N
onN
on-
Non
109
Oin
obm
oi c
entre
1,30
02,
088
1,34
3Tu
gen
Sem
i urb
anD
ispe
nsar
yFi
eld
562
470
100
825
Riv
er10
0.5
0.0
1G
ood
Goo
dTh
ree
Ph10
0Ex
iste
nt10
0M
oto/
PSV
Goo
dLi
vest
ock
1000
021
YY
Don
't lik
eto
pay
180
5-40
Avai
labl
eAv
aila
ble
No
Non
110
Kap
siko
ryan
950
1,45
090
0Tu
gen
Rur
alN
onFi
eld
185
010
02
7R
iver
100.
70.
01
Goo
dG
ood
Thre
e Ph
mor
e th
an 1
000
Non
PSV
Goo
dve
stoc
k/Ag
ricul
tu80
0017
YY
Don
't lik
eto
pay
150
20Av
aila
ble
Avai
labl
eN
oN
on
111
Kur
umbo
psoo
800
745
800
Tuge
nSe
mi u
rban
Dis
pens
ary
V. o
ffice
240
086
915
Riv
er36
048
.315
0.0
20.1
3G
ood
No
Goo
dN
onN
onM
oto/
PSV
Goo
dLi
vest
ock
1000
0Y
Y0
Avai
labl
eAv
aila
ble
No
Non
112
Siro
noi
500
1,45
050
0Tu
gen
Rur
alN
onFi
eld
175
07
18R
iver
100.
70.
01
Goo
dG
ood
Thre
e Ph
1000
Non
PSV
Goo
dve
stoc
k/Ag
ricul
tu80
0033
YY
220
15-2
0Av
aila
ble
Avai
labl
eN
oN
on
113
Kas
itet
810
776
810
Rur
alN
onSi
ginw
a24
00
9013
2036
046
.415
0.0
19.3
Goo
dN
o G
ood
Mot
o/PS
VG
ood
vest
ock/
Agric
ultu
8000
-Y
Avai
labl
eN
on-
Non
114
Sic
hei
570
1,16
035
0Tu
gen
Sem
i urb
anD
ispe
nsar
yV.
offi
ce0
028
515
Riv
er36
031
.015
0.0
12.9
1G
ood
No
Goo
dN
onN
onM
oto/
PSV
Goo
dLi
vest
ock
1000
0Y
Y30
Non
No
Non
115
Kis
ok38
074
525
0Tu
gen
Sem
i urb
anD
ispe
nsar
yV.
offi
ce16
50
8711
26R
iver
360
48.3
150.
020
.12
Goo
dN
o G
ood
Non
Non
Mot
o/PS
VG
ood
Live
stoc
k10
000
-Y
Avai
labl
eN
on-
Non
116
Kat
unoi
400
493
400
Tuge
nSe
mi u
rban
Dis
pens
ary
scho
ol18
70
9511
26R
iver
5010
.120
.04.
13
Goo
dN
o G
ood
Non
Non
Mot
o/PS
VG
ood
Live
stoc
k10
000
YY
Avai
labl
eAv
aila
ble
No
Non
117
Sai
met
300
397
300
Tuge
nSe
mi u
rban
Non
V. o
ffice
140
010
010
1550
12.6
20.0
5.0
3G
ood
No
Goo
dN
onm
ore
than
100
0N
onM
oto
Goo
doc
k/Ag
ricul
ture
/Fo
8000
YY
Avai
labl
eAv
aila
ble
No
Non
118
Kw
amke
iyon
350
705
350
Tuge
nR
ural
Non
scho
ol28
30
885
15R
iver
0.0
0.0
2N
o G
ood
No
Goo
dN
onN
onM
oto
No
Goo
dve
stoc
k/Ag
ricul
tu80
00-
YAv
aila
ble
Avai
labl
e-
Non
119
Che
pker
o P
rimar
y45
070
445
0Tu
gen
Rur
alD
ispe
nsar
yFi
eld
200
010
011
1548
6.8
30.0
4.3
0.2
Impo
ssib
leIm
poss
ible
Thre
e Ph
mor
e th
an 1
000
Exis
tent
mor
e th
an 6
00N
onFa
irAg
ricul
ture
6000
8Y
Ype
r Buc
ket
175
20Av
aila
ble
Non
-N
on
120
Mog
orw
a1,
200
1,22
136
0Tu
gen
Sem
i urb
anD
ispe
nsar
yV.
offi
ce27
540
058
3030
Riv
er10
08.
260
.04.
93
Goo
dN
o G
ood
Sing
le P
h50
0N
onm
ore
than
600
Mot
o/PS
VN
o G
ood
Live
stoc
k10
000
YY
100/
mon
thAv
aila
ble
Avai
labl
eN
on
121
Kis
onei
Prim
ary
1,10
01,
300
400
Tuge
nSe
mi u
rban
Dis
pens
ary
V. o
ffice
473
099
920
Riv
er12
0.9
30.0
2.3
5G
ood
No
Goo
dN
onm
ore
than
100
0N
onm
ore
than
600
Mot
o/PS
VG
ood
Live
stoc
k10
000
YY
Avai
labl
eAv
aila
ble
No
Non
122
Och
ii P
rimar
y60
061
565
0Tu
gen
Sem
i urb
anD
ispe
nsar
yV.
offi
ce31
60
927
5R
iver
0.0
0.0
1N
o G
ood
No
Goo
dN
on50
0N
onM
oto/
PSV
No
Goo
dve
stoc
k/Ag
ricul
tu80
00Y
YAv
aila
ble
Avai
labl
eN
oN
on
123
Sig
inw
o80
080
099
0R
ural
Non
Sigi
nwo
190
035
44
400
50.0
300.
037
.5G
ood
No
Goo
dN
onm
ore
than
100
0N
onm
ore
than
600
Mot
o/PS
VG
ood
vest
ock/
Agric
ultu
8000
-Y
20-3
0Av
aila
ble
Non
-N
on
124
Taba
rin66
01,
189
700
Tuge
nR
ural
Hea
lth C
ente
V. o
ffice
212
620
353
4R
iver
0.0
0.0
0.2
Goo
dN
o G
ood
Sing
le P
h10
0Ex
iste
nt60
0M
oto/
PSV
Goo
dve
stoc
k/Ag
ricul
tu80
0050
-Y
Don
't lik
eto
pay
100
20-3
0Av
aila
ble
--
Non
125
Tulu
ongo
i76
037
472
4Tu
gen
Rur
alN
onV.
offi
ce35
020
083
69
Riv
er0.
00.
01
Goo
dN
o G
ood
Thre
e Ph
mor
e th
an 1
000
Exis
tent
600
Mot
o/PS
VN
o G
ood
Live
stoc
k10
000
-Y
per B
ucke
t20
-30
Avai
labl
eN
onN
oN
on
126
Tebe
i60
090
782
9Tu
gen
Rur
alD
ispe
nsar
yV.
offi
ce40
00
776
6R
iver
606.
670
.07.
73
Goo
dN
o G
ood
Non
mor
e th
an 1
000
Non
mor
e th
an 6
00M
oto
No
Goo
dLi
vest
ock
1000
050
-Y
per B
ucke
t10
020
-30
Avai
labl
eAv
aila
ble
Avai
labl
eN
on
127
Ilyak
at50
01,
465
376
Tuge
nR
ural
Non
V. o
ffice
150
080
44
Riv
er0.
00.
0m
ore
than
5N
o G
ood
Impo
ssib
leN
onm
ore
than
100
0N
onm
ore
than
600
Mot
oFa
irLi
vest
ock
1000
050
-Y
per B
ucke
t25
020
Non
Non
-
128
Kat
kam
uma
400
907
192
Tuge
nR
ural
Non
288
080
77
Riv
er/S
prin
g0.
00.
02
Goo
dN
o G
ood
Non
mor
e th
an 1
000
Non
mor
e th
an 6
00M
oto
No
Goo
dLi
vest
ock
1000
050
--
per B
ucke
t29
020
-30
Non
--
Non
129
Tino
moi
370
1,74
488
6Tu
gen
Rur
alN
onN
on14
20
3616
25R
iver
603.
450
.02.
93
Goo
dN
o G
ood
Non
mor
e th
an 1
000
Non
mor
e th
an 6
00M
oto
Goo
dLi
vest
ock
1000
050
YY
per B
ucke
t17
020
-30
Avai
labl
eAv
aila
ble
No
Exis
tent
130
Tim
boiy
wo
1,30
01,
885
1,30
0Tu
gen
Rur
alN
onV.
offi
ce68
90
913
5R
iver
0.0
0.0
2G
ood
Goo
dN
onm
ore
than
100
0N
onm
ore
than
600
PSV
Goo
dAg
ricul
ture
6000
30-
-pe
r Buc
ket
5020
Non
-Ex
iste
nt
131
Kab
asis
1,50
04,
027
1,50
0Tu
gen
Rur
alN
onV.
offi
ce12
070
803
4R
iver
150
3.7
5.0
0.1
3N
o G
ood
Sing
le P
hm
ore
than
100
0N
onPS
VN
o G
ood
Agric
ultu
re60
0030
-Y
per B
ucke
t40
3-15
Latif
fN
on-
Non
133
Kap
chom
usw
o S
ec90
02,
041
300
Tuge
nR
ural
Dis
pens
ary
Fiel
d13
0014
092
528
3000
147.
00.
05
Impo
ssib
leIm
poss
ible
Sing
le P
h10
00Ex
iste
ntm
ore
than
600
Non
Fair
Agric
ultu
re60
0011
-Y
per B
ucke
t22
020
-30
Avai
labl
eN
on-
Non
134
Kiw
anja
Nde
ge45
02,
041
450
Tuge
nR
ural
Dis
pens
ary
Fiel
d30
00
405
1130
0014
7.0
0.0
0.2
Impo
ssib
leIm
poss
ible
Thre
e Ph
mor
e th
an 1
000
Exis
tent
mor
e th
an 6
00N
onFa
irAg
ricul
ture
6000
8-
Ype
r Buc
ket
180
20Av
aila
ble
Non
-N
on
135
Pem
wai
cen
tre80
02,
041
436
Tuge
nR
ural
Non
Fiel
d25
075
049
725
Sprin
g62
3.0
0.0
1G
ood
Goo
dSi
ngle
Ph
1000
Exis
tent
mor
e th
an 6
00PS
VFa
irAg
ricul
ture
6000
12-
Ype
r Buc
ket
310
20Av
aila
ble
Avai
labl
eN
oN
on
136
Tala
i1,
400
3,68
01,
300
Tuge
nR
ural
Hea
lth C
ente
V. H
all
500
1440
807
1050
0013
5.9
0.0
0.2
Fair
No
Goo
dSi
ngle
Ph
100
Exis
tent
600
PSV
Fair
vest
ock/
Agric
ultu
8000
9Y
Ype
r Buc
ket
210
20Av
aila
ble
Non
-
137
Kap
kaw
a1,
200
1,65
726
0Tu
gen
Rur
alH
ealth
Cen
teFi
eld
1660
250
756
850
0030
1.8
0.0
0.2
No
Goo
dIm
poss
ible
Sing
le P
h50
0Ex
iste
ntm
ore
than
600
PSV
Goo
dAg
ricul
ture
6000
12Y
Y20
Avai
labl
eN
oN
on
139
Ser
ei1,
400
3,50
040
0Tu
gen
Rur
alD
ispe
nsar
yFi
eld
980
084
79
5000
142.
90.
03
Fair
No
Goo
dN
onm
ore
than
100
0N
onm
ore
than
600
Non
Goo
dve
stoc
k/Ag
ricul
tu80
0012
YY
per B
ucke
t25
020
Non
Non
-N
on
140
Turu
pkir
300
1,06
830
0Tu
gen
Rur
alN
onV.
offic
e35
40
867
6R
iver
0.0
0.0
2G
ood
Goo
dN
onm
ore
than
100
0N
onm
ore
than
600
PSV
Goo
dve
stoc
k/Ag
ricul
tu80
0047
--
per M
onth
5020
Non
-Ex
iste
nt
141
Lalw
asoy
en28
01,
520
280
Pok
otR
ural
Dis
pens
ary
V.of
fice
450
069
1315
Riv
er/D
ugw
el19
813
.04.
00.
31
Impo
ssib
leIm
poss
ible
Sing
le P
h10
00Ex
iste
ntm
ore
than
600
Mot
oN
o G
ood
Live
stoc
k10
000
25-
ND
on't
like
topa
y10
Non
Non
-Ex
iste
nt
143
Kiliw
ok27
076
927
0P
okot
Rur
alN
onN
on0
140
9325
40D
ugw
ell
0.0
0.0
3N
o G
ood
No
Goo
dN
onN
onPS
VG
ood
Live
stoc
k10
000
25-
YN
onN
on-
Non
144
Lom
uyek
370
769
370
Pok
otR
ural
Dis
pens
ary
Non
201
067
422
Riv
er/S
prin
g0.
00.
03
No
Goo
dN
o G
ood
Non
PSV
No
Goo
dLi
vest
ock
1000
030
-Y
20N
onN
on-
Non
145
Nak
olet
e29
076
929
0P
okot
Rur
alN
onN
on0
060
1025
Sprin
g/D
ugw
ell
0.0
0.0
3Im
poss
ible
Impo
ssib
leN
onN
onN
onN
ALi
vest
ock
1000
018
-Y
per B
ucke
t14
050
-100
Non
Avai
labl
eN
oEx
iste
nt
146
Kal
apat
a20
02,
270
200
Tuge
nR
ural
Non
Non
200
120
805
25R
iver
/Spr
ing
0.0
0.0
5N
o G
ood
No
Goo
dN
onN
onN
onN
o G
ood
Live
stoc
k10
000
35-
YN
onN
onN
o
148
Oru
s35
02,
929
350
Pok
otR
ural
Non
Non
320
040
322
Riv
er/S
prin
g0.
00.
0m
ore
than
5N
o G
ood
No
Goo
dN
onN
onN
o G
ood
Live
stoc
k10
000
42-
-N
onN
on-
Exis
tent
149
Siri
a25
01,
164
330
Pok
otR
ural
Non
Non
310
067
2740
Sprin
g/D
ugw
ell
0.0
0.0
2N
o G
ood
Impo
ssib
leSi
ngle
Ph
1000
Non
mor
e th
an 6
00PS
VN
o G
ood
Live
stoc
k10
000
50-
YD
on't
like
topa
y15
Non
Non
-Ex
iste
nt
150
Kat
ungu
ra50
01,
345
?P
okot
Rur
alC
linic
Non
180
024
1022
Riv
er/S
prin
g0.
00.
02
No
Goo
dN
o G
ood
Non
Non
No
Goo
dLi
vest
ock
1000
045
-Y
per B
ucke
t16
020
Non
Non
No
Exis
tent
151
Tuw
o20
086
652
2P
okot
Rur
alN
onFi
eld
200
030
2070
0.0
0.0
3N
o G
ood
No
Goo
dN
onN
onG
ood
Live
stoc
k10
000
28Y
YD
on't
like
topa
y25
Non
Avai
labl
eAv
aila
ble
Non
152
Lem
uyek
250
750
700
Pok
otR
ural
Non
Non
370
8218
40R
iver
0.0
0.0
0N
o G
ood
No
Goo
dN
onm
ore
than
100
0N
onm
ore
than
600
PSV
No
Goo
dLi
vest
ock
1000
019
-Y
Avai
labl
eAv
aila
ble
Avai
labl
eN
on
153
Che
bila
t50
075
070
0P
okot
Rur
alN
onN
on25
00
6310
65R
iver
/Dug
wel
0.0
0.0
1N
o G
ood
Impo
ssib
leN
on10
00Ex
iste
ntm
ore
than
600
PSV
No
Goo
dLi
vest
ock
1000
0-
YN
onN
on-
Exis
tent
154
Rio
ngo
600
4,15
660
0P
okot
Rur
alH
ealth
Cen
teV.
offic
e59
013
22R
iver
/Dug
wel
281
6.8
0.0
2Im
poss
ible
Impo
ssib
leN
onN
onN
onN
o G
ood
Live
stoc
k10
000
40-
Ype
r Buc
ket
8020
-30
Non
Non
-Ex
iste
nt
155
Nau
do70
01,
600
700
Tuge
nR
ural
Dru
g St
ore
V.of
fice
300
079
2035
Riv
er/D
ugw
el19
812
.41.
00.
13
No
Goo
dIm
poss
ible
Non
mor
e th
an 1
000
Non
600
Mot
oN
o G
ood
Live
stoc
k10
000
40-
Ype
r Buc
ket
210
6-30
Avai
labl
e-
-Ex
iste
nt
156
Akw
icha
tis1,
050
2,64
71,
050
Pok
otR
ural
Clin
icV.
offic
e15
50
4425
45R
iver
255
9.6
5.0
0.2
mor
e th
an 5
No
Goo
dN
o G
ood
Non
mor
e th
an 1
000
Non
mor
e th
an 6
00M
oto
Fair
Live
stoc
k10
000
13-
Ype
r Buc
ket
606-
15N
onN
on-
Non
157
Nas
orot
980
5,65
198
0P
okot
Rur
alD
ispe
nsar
yV.
offic
e31
90
2522
22D
ugw
ell
213
3.8
15.0
0.3
2N
o G
ood
No
Goo
dN
onm
ore
than
100
0N
onm
ore
than
600
Mot
oG
ood
Oth
ers
8000
25-
YD
on't
like
topa
y25
025
Non
Non
-N
on
159
Che
ptun
oyo
260
5,12
226
0P
okot
Rur
alN
onN
on12
290
6025
25R
iver
/Dug
wel
185
3.6
1.0
0.0
1N
o G
ood
Impo
ssib
leSi
ngle
Ph
1000
Exis
tent
mor
e th
an 6
00PS
VN
o G
ood
Live
stoc
k10
000
25-
Ype
r Buc
ket
250
9-15
Non
--
Exis
tent
160
Kos
ioko
n70
02,
260
700
Pok
otR
ural
Dru
g St
ore
V.of
fice
122
045
3035
Riv
er0.
00.
02
No
Goo
dN
o G
ood
Non
mor
e th
an 1
000
Non
Mot
oN
o G
ood
Live
stoc
k10
000
40-
YN
onN
on-
Non
163
Che
ptur
u50
050
011
0R
ural
Dis
pens
ary
V.of
fice
267
076
4040
0.0
0.0
No
Goo
dM
oto
No
Goo
dLi
vest
ock
1000
0-
-Av
aila
ble
--
165
Ngo
ron
900
900
400
Pok
otR
ural
Dis
pens
ary
V.of
fice
035
789
4550
Riv
er0.
00.
02
No
Goo
dIm
poss
ible
Non
Non
Mot
oG
ood
Live
stoc
k10
000
45Y
YAv
aila
ble
Avai
labl
eN
oEx
iste
nt
168
Che
pelio
n24
03,
203
150
Pok
otR
ural
Non
600
6040
40R
iver
0.0
0.0
2N
o G
ood
Impo
ssib
leN
onN
onM
oto
Goo
dLi
vest
ock
1000
025
-Y
Avai
labl
eN
on-
Exis
tent
169
Kre
lion
300
2,92
930
0Tu
gen
Rur
alC
linic
V.of
fice
237
079
2245
Riv
er/B
oreh
ole
120
4.1
3.0
0.1
1N
o G
ood
No
Goo
dSi
ngle
Ph
mor
e th
an 1
000
Exis
tent
1500
Mot
oN
o G
ood
Live
stoc
k10
000
50-
Ype
r Buc
ket
460
5-10
Avai
labl
e-
-
171
Nam
inito
520
1,45
052
0P
okot
Rur
alC
linic
chur
ch/s
ch15
70
7820
40R
iver
/Dug
wel
250
17.2
0.0
1N
o G
ood
Impo
ssib
leN
onN
onM
oto
Goo
dLi
vest
ock
1000
040
-Y
Don
't lik
eto
pay
Non
-N
on
176
Kom
olw
o26
01,
375
260
Pok
otR
ural
Non
Non
00
66
Riv
er0.
00.
05
No
Goo
dN
o G
ood
Non
No
Goo
dve
stoc
k/Ag
ricul
tu80
00-
YN
onN
on-
Non
178
Lolk
os26
01,
088
260
Tuge
nR
ural
Non
Non
265
060
1625
Riv
er/D
ugw
el0.
00.
0N
o G
ood
Impo
ssib
leSi
ngle
Ph
500
Exis
tent
mor
e th
an 6
00N
onN
o G
ood
Live
stoc
k10
000
25-
YD
on't
like
topa
y8
Non
-Ex
iste
nt
179
Lom
erim
eri
360
1,84
936
0P
okot
Rur
alN
onN
on72
048
47
Riv
er0.
00.
0m
ore
than
5N
o G
ood
No
Goo
dN
onN
onM
oto
No
Goo
dLi
vest
ock
1000
040
Y-
Avai
labl
eN
onN
oN
on
181
Kat
ikit
1,05
01,
851
1,05
0P
okot
Rur
alN
onN
on19
00
259
25R
iver
/Dug
wel
0.0
0.0
3N
o G
ood
No
Goo
dN
onN
onPS
VG
ood
Live
stoc
k10
000
40Y
YN
onN
onN
oEx
iste
nt
182
Che
pand
a46
01,
600
401
Pok
otR
ural
Non
V.of
fice
00
2010
30R
iver
0.0
0.0
2G
ood
Goo
dN
onM
oto
No
Goo
dLi
vest
ock
1000
0-
YN
onN
on-
Non
183
Don
ge25
03,
632
1,25
4P
okot
Sem
i urb
anHea
lth C
ente
V.of
fice
153
1085
734
15R
iver
2761
76.0
57.0
1.6
0.2
Goo
dN
o G
ood
Thre
e Ph
1000
Exis
tent
mor
e th
an 6
00M
oto/
PSV
Goo
dLi
vest
ock
1000
018
YY
per B
ucke
t25
2Av
aila
ble
No
Exis
tent
184
Kat
ukum
wo
260
2,00
01,
250
Pok
otR
ural
Non
V.of
fice
00
5720
30R
iver
0.0
0.0
2N
o G
ood
No
Goo
dN
onM
oto
Goo
dLi
vest
ock
1000
018
-Y
per B
ucke
t20
-30
Non
Avai
labl
e-
Non
185
Che
saka
m60
065
833
7P
okot
Rur
alN
onV.
offic
e13
018
440
430
Dug
wel
l/Bor
ehol
e0.
00.
03
Goo
dN
o G
ood
Non
Mot
oN
o G
ood
Live
stoc
k10
000
-Y
20Av
aila
ble
Avai
labl
e-
Non
186
Che
site
t40
01,
550
400
Pok
otR
ural
Clin
icV.
offic
e35
00
947
25R
iver
/Dug
wel
290
18.7
10.0
0.6
1N
o G
ood
Impo
ssib
leSi
ngle
Ph
mor
e th
an 1
000
Non
PSV
Goo
dLi
vest
ock
1000
024
-Y
per B
ucke
t25
4-10
Non
-N
on
187
Kas
akar
am56
02,
190
560
Pok
otR
ural
Clin
icV.
offic
e16
50
7522
31D
ugw
ell
185
8.4
0.0
3N
o G
ood
Impo
ssib
leSi
ngle
Ph
1000
Exis
tent
mor
e th
an 6
00M
oto/
PSV
Goo
dLi
vest
ock
1000
010
-Y
per B
ucke
t25
15-3
0N
onN
on-
190
Mar
on96
055
521
0P
okot
Rur
alD
ispe
nsar
yV.
offic
e0
137
684
10R
iver
7814
.110
6.0
19.1
Goo
dG
ood
Non
Mot
oN
o G
ood
Live
stoc
k10
000
-Y
Non
Non
-N
on
1731
81,3
4024
.02.
860
Ave
rage
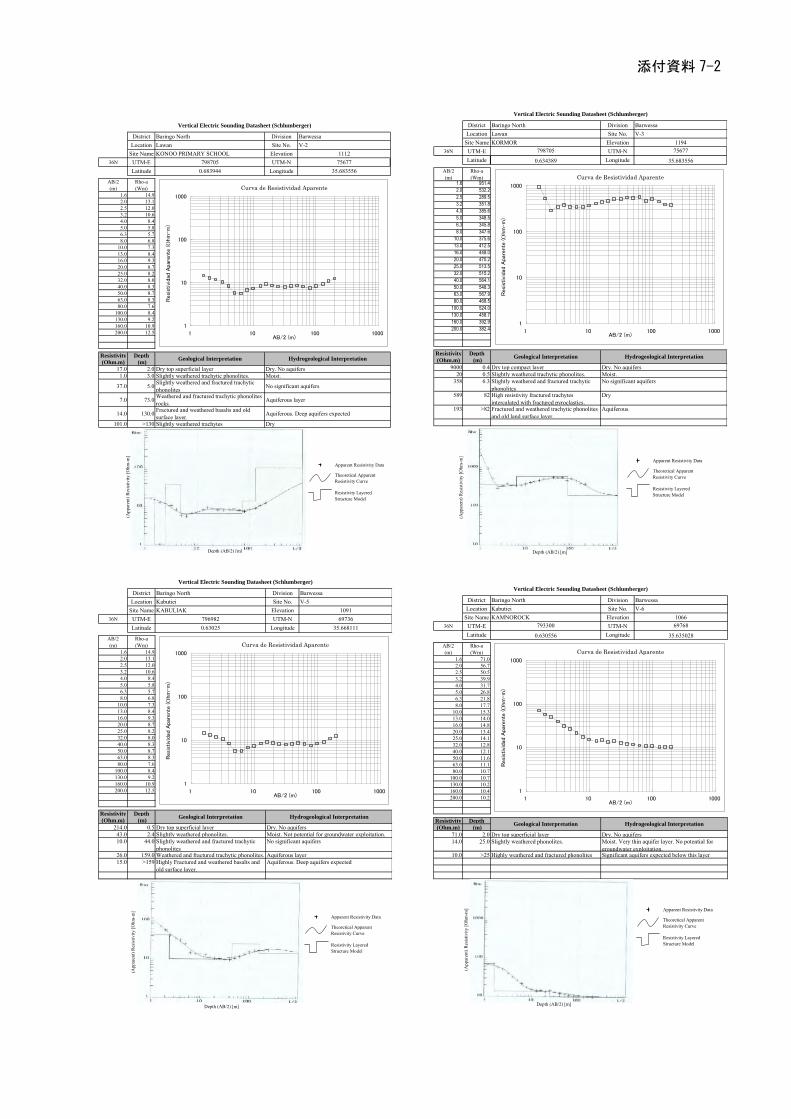
District Baringo North Division BarwessaLocation Lawan Site No. V-2
Site Name KONOO PRIMARY SCHOOL Elevation 111236N UTM-E 798705 UTM-N 75677
Latitude 0.683944 Longitude 35.683556
AB/2(m)
Rho-a(Wm)
1.6 14.9 2.0 13.1 2.5 12.0 3.2 10.6 4.0 8.4 5.0 5.8 6.3 5.7 8.0 6.8
10.0 7.3 13.0 8.4 16.0 9.3 20.0 8.7 25.0 8.2 32.0 8.0 40.0 8.3 50.0 8.7 63.0 8.3 80.0 7.6
100.0 8.4 130.0 9.2 160.0 10.9 200.0 12.5
Resistivity Depth
(Ohm.m) (m)
17.0 2.0 Dry top superficial layer Dry. No aquifers 1.0 3.0 Slightly weathered trachytic phonolites. Moist.
37.0 5.0 Slightly weathered and fractured trachytic phonolites No significant aquifers
7.0 73.0 Weathered and fractured trachytic phonolites rocks. Aquiferous layer
14.0 130.0 Fractured and weathered basalts and old surface layer. Aquiferous. Deep aquifers expected
101.0 >130 Slightly weathered trachytes Dry
Vertical Electric Sounding Datasheet (Schlumberger)
Geological Interpretation Hydrogeological Interpretation
Curva de Resistividad Aparente
1
10
100
1000
1 10 100 1000AB/2 (m)
Resi
stiv
idad
Apa
rente
(O
hm
-m
)
(App
aren
t) R
esis
tivity
[Ohm
-m]
Depth (AB/2) [m]
Apparent Resistivity Data
Theoretical Apparent Resistivity Curve
Resistivity Layered Structure Model
District Baringo North Division BarwessaLocation Lawan Site No. V-3
Site Name KORMOR Elevation 119436N UTM-E 798705 UTM-N 75677
Latitude 0.634389 Longitude 35.683556
AB/2(m)
Rho-a(Wm)
1.6 951.4
2.0 532.2
2.5 289.5
3.2 351.8
4.0 385.6
5.0 348.5
6.3 345.8
8.0 347.6
10.0 375.6
13.0 412.5
16.0 448.0
20.0 470.2
25.0 513.5
32.0 515.2
40.0 564.1
50.0 548.3
63.0 567.9
80.0 468.5
100.0 524.0
130.0 458.7
160.0 392.9
200.0 382.4
Resistivity Depth
(Ohm.m) (m)
9000 0.4 Dry top compact layer Dry. No aquifers 20 0.5 Slightly weathered trachytic phonolites. Moist.
358 6.3 Slightly weathered and fractured trachytic phonolites
No significant aquifers
589 82 High resistivity fractured trachytes intercalated with fractured pyroclastics.
Dry
193 >82 Fractured and weathered trachytic phonolites and old land surface layer.
Aquiferous.
Vertical Electric Sounding Datasheet (Schlumberger)
Geological Interpretation Hydrogeological Interpretation
Curva de Resistividad Aparente
1
10
100
1000
1 10 100 1000AB/2 (m)
Resi
stiv
idad
Apar
ente
(O
hm
-m
)
(App
aren
t) R
esis
tivity
[Ohm
-m]
Depth (AB/2) [m]
Apparent Resistivity Data
Theoretical Apparent Resistivity Curve
Resistivity Layered Structure Model
District Baringo North Division BarwessaLocation Kabutiei Site No. V-5
Site Name KABULIAK Elevation 109136N UTM-E 796982 UTM-N 69736
Latitude 0.63025 Longitude 35.668111
AB/2(m)
Rho-a(Wm)
1.6 14.9 2.0 13.1 2.5 12.0 3.2 10.6 4.0 8.4 5.0 5.8 6.3 5.7 8.0 6.8
10.0 7.3 13.0 8.4 16.0 9.3 20.0 8.7 25.0 8.2 32.0 8.0 40.0 8.3 50.0 8.7 63.0 8.3 80.0 7.6
100.0 8.4 130.0 9.2 160.0 10.9 200.0 12.5
Resistivity Depth
(Ohm.m) (m)
214.0 0.5 Dry top superficial layer Dry. No aquifers 43.0 2.4 Slightly weathered phonolites. Moist. Not potential for groundwater exploitation.10.0 44.0 Slightly weathered and fractured trachytic
phonolites No significant aquifers
26.0 159.0 Weathered and fractured trachytic phonolites. Aquiferous layer15.0 >159 Highly Fractured and weathered basalts and
old surface layer.Aquiferous. Deep aquifers expected
Vertical Electric Sounding Datasheet (Schlumberger)
Geological Interpretation Hydrogeological Interpretation
Curva de Resistividad Aparente
1
10
100
1000
1 10 100 1000AB/2 (m)
Res
istivi
dad
Apa
rent
e ( O
hm-m
)
(App
aren
t) R
esis
tivity
[Ohm
-m]
Depth (AB/2) [m]
Apparent Resistivity Data
Theoretical Apparent Resistivity Curve
Resistivity Layered Structure Model
District Baringo North Division BarwessaLocation Kabutiei Site No. V-6
Site Name KAMNOROCK Elevation 106636N UTM-E 793300 UTM-N 69768
Latitude 0.630556 Longitude 35.635028
AB/2(m)
Rho-a(Wm)
1.6 71.02.0 56.72.5 50.53.2 39.94.0 31.75.0 26.86.3 21.88.0 17.7
10.0 15.313.0 14.016.0 14.820.0 13.425.0 14.132.0 12.840.0 12.150.0 11.663.0 11.180.0 10.7
100.0 10.7130.0 10.2160.0 10.4200.0 10.2
Resistivity Depth
(Ohm.m) (m)
71.0 2.0 Dry top superficial layer Dry. No aquifers 14.0 25.0 Slightly weathered phonolites.
10.0 >25 Highly weathered and fractured phonolites Significant aquifers expected below this layer
Vertical Electric Sounding Datasheet (Schlumberger)
Geological Interpretation Hydrogeological Interpretation
Moist. Very thin aquifer layer. No potential for groundwater exploitation.
Curva de Resistividad Aparente
1
10
100
1000
1 10 100 1000AB/2 (m)
Resi
stiv
idad
Apa
rente
(O
hm
-m
)
(App
aren
t) R
esis
tivity
[Ohm
-m]
Depth (AB/2) [m]
Apparent Resistivity Data
Theoretical Apparent Resistivity Curve
Resistivity Layered Structure Model
添付資料 7-2

District Baringo North Division KipsaramanLocation Kaboskei Site No. V-7
Site Name CHIMODOI Elevation 169336N UTM-E 810450 UTM-N 88345
Latitude 0.798333 Longitude 35.789111
AB/2(m)
Rho-a(Wm)
1.6 150.32.0 96.82.5 79.23.2 74.14.0 74.85.0 68.16.3 63.58.0 61.2
10.0 59.013.0 57.616.0 55.420.0 61.925.0 76.632.0 105.640.0 99.750.0 94.163.0 80.880.0 72.1
100.0 74.8130.0 92.4160.0 98.4200.0 95.9250.0 92.2
Resistivity Depth
(Ohm.m) (m)2835.0 0.3 Dry and compacted top superficial layer Dry. No aquifers
75.0 4.5 Slightly weathered phonolites. Moist.16.0 7.0 Slightly weathered and fractured phonolites No significant aquifers
717.0 11.0 Fresh phonolites rocks Dry. No aquifers15.0 25.0 Fractured and weathered phonolites and old land
surface layer.Aquiferous. Shallow aquifers expected
257.0 130.0 Fresh phonolite rocks Dry. No aquifers18.0 >130 Highly weathered and fractured basalt rocks. Aquiferous layer. Water strikes expected in this layer.
Vertical Electric Sounding Datasheet (Schlumberger)
Geological Interpretation Hydrogeological Interpretation
Curva de Resistividad Aparente
1
10
100
1000
1 10 100 1000AB/2 (m)
Res
istivi
dad
Apa
rent
e ( O
hm-m
)
(App
aren
t) R
esis
tivity
[Ohm
-m]
Depth (AB/2) [m]
Apparent Resistivity Data
Theoretical Apparent Resistivity Curve
Resistivity Layered Structure Model
District Baringo North Division KipsaramanLocation Kaboskei Site No. V-10
Site Name MOIGUTWA Elevation 171336N UTM-E 811929 UTM-N 86084
Latitude 0.777917 Longitude 35.802361
AB/2(m)
Rho-a(Wm)
1.6 49.02.0 45.42.5 43.23.2 38.94.0 38.95.0 34.96.3 34.58.0 26.6
10.0 17.213.0 14.816.0 12.120.0 12.625.0 13.732.0 16.140.0 16.550.0 16.063.0 16.380.0 17.0
100.0 17.2130.0 17.3160.0 18.2200.0 19.4250.0 20.9
Resistivity Depth
(Ohm.m) (m)93 0.3 Dry top superficial layer Dry. No aquifers 44 4 Slightly weathered pyroclastics mainly tuffs. Moist. Very thin aquifer layer.
2.5 6 Slightly weathered and fractured phonolites No significant aquifers18 85 Highly weathered and fractured phonolites. Aquiferous layer43 >85 Fractured and weathered phonolites and old
surface layer.Aquiferous. Deep aquifers expected
Vertical Electric Sounding Datasheet (Schlumberger)
Geological Interpretation Hydrogeological Interpretation
Curva de Resistividad Aparente
1
10
100
1000
1 10 100 1000AB/2 (m)
Res
istivi
dad
Apa
rent
e ( O
hm-m
)
(App
aren
t) R
esis
tivity
[Ohm
-m]
Depth (AB/2) [m]
Apparent Resistivity Data
Theoretical Apparent Resistivity Curve
Resistivity Layered Structure Model
District Baringo North Division BarwessaLocation Kaboskei Kerio Site No. V-11
Site Name KAPTIGIT Elevation 103536N UTM-E 796072 UTM-N 93193
Latitude 0.842222 Longitude 35.660028
AB/2(m)
Rho-a(Wm)
1.6 36.52.0 33.82.5 27.23.2 26.24.0 24.35.0 22.86.3 21.28.0 20.3
10.0 16.713.0 14.016.0 11.320.0 12.125.0 13.132.0 12.840.0 12.350.0 11.463.0 11.480.0 8.2
100.0 10.6130.0 9.9160.0 11.1200.0 11.6
Resistivity Depth
(Ohm.m) (m)
70 0.5 Dry top superficial layer Dry. No aquifers
25 6 Slightly weathered pyroclastic mainly the tuffs Moist. No potential for groundwater exploitation.
2 8 Clay layers No significant aquifers
38 15 Slightly weathered and fractured phonolites No significant aquifers7 130 Fractured and weathered basalts and old surface
layer.Aquiferous.
658 >130 Fresh compact basalts Dry.
Vertical Electric Sounding Datasheet (Schlumberger)
Geological Interpretation Hydrogeological Interpretation
Curva de Resistividad Aparente
1
10
100
1000
1 10 100 1000AB/2 (m)
Res
istivi
dad
Apa
rent
e ( O
hm-m
)
(App
aren
t) R
esis
tivity
[Ohm
-m]
Depth (AB/2) [m]
Apparent Resistivity Data
Theoretical Apparent Resistivity Curve
Resistivity Layered Structure Model
District Baringo North Division BarwessaLocation Kaboskei Kerio Site No. V-12
Site Name AYATIA PRIMARY SCHOOL Elevation 104436N UTM-E 795847 UTM-N 98470
Latitude 0.889917 Longitude 35.658056
AB/2(m)
Rho-a(Wm)
1.6 34.02.0 27.62.5 21.33.2 19.84.0 13.25.0 10.26.3 10.28.0 9.6
10.0 8.713.0 10.616.0 10.820.0 12.225.0 13.632.0 17.540.0 21.750.0 28.363.0 34.280.0 44.0
100.0 50.3130.0 51.2160.0 48.0200.0 42.7
Resistivity Depth
(Ohm.m) (m)42 1.2 Dry top superficial layer Dry. No aquifers
8 13 Slightly weathered tuffs. Moist.150 70 Compact basalts Shallow aquifer expected in this zone
15 >70 Highly weathered basaltic rocks. Aquiferous layer
Vertical Electric Sounding Datasheet (Schlumberger)
Geological Interpretation Hydrogeological Interpretation
Curva de Resistividad Aparente
1
10
100
1000
1 10 100 1000AB/2 (m)
Resi
stiv
idad
Apar
ente
(O
hm
-m
)
(App
aren
t) R
esis
tivity
[Ohm
-m]
Depth (AB/2) [m]
Apparent Resistivity Data
Theoretical Apparent Resistivity Curve
Resistivity Layered Structure Model
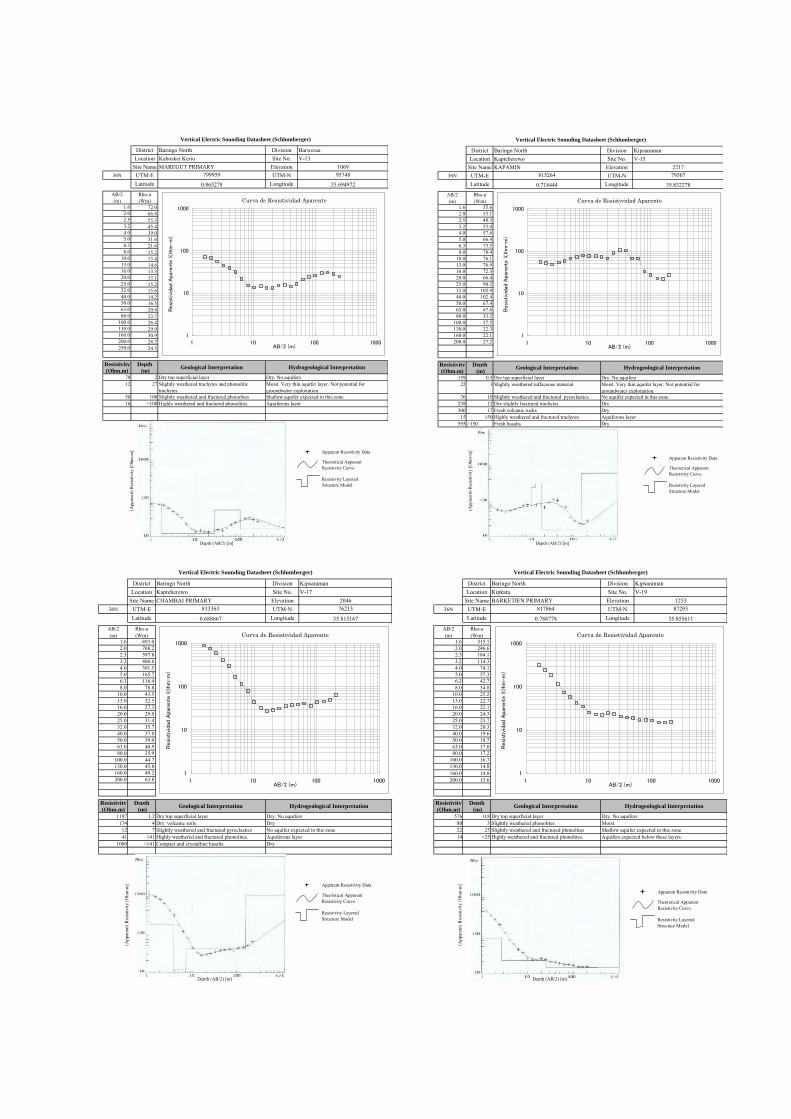
District Baringo North Division BarwessaLocation Kaboskei Kerio Site No. V-13
Site Name MAREGUT PRIMARY Elevation 106936N UTM-E 799959 UTM-N 95748
Latitude 0.865278 Longitude 35.694972
AB/2(m)
Rho-a(Wm)
1.6 72.02.0 66.82.5 55.33.2 45.44.0 39.05.0 31.66.3 21.68.0 15.2
10.0 13.413.0 14.616.0 13.320.0 13.125.0 15.232.0 15.640.0 14.250.0 16.563.0 20.880.0 23.7
100.0 26.4130.0 29.9160.0 30.9200.0 28.2250.0 24.5
Resistivity Depth
(Ohm.m) (m)78 2 Dry top superficial layer Dry. No aquifers12 27 Slightly weathered trachytes and phonolitic
trachytes.50 100 Slightly weathered and fractured phonolites Shallow aquifer expected in this zone16 >100 Highly weathered and fractured phonolites. Aquiferous layer
Vertical Electric Sounding Datasheet (Schlumberger)
Geological Interpretation Hydrogeological Interpretation
Moist. Very thin aquifer layer. Not potential for groundwater exploitation.
Curva de Resistividad Aparente
1
10
100
1000
1 10 100 1000AB/2 (m)
Res
istivi
dad
Apa
rent
e ( O
hm-m
)
(App
aren
t) R
esis
tivity
[Ohm
-m]
Depth (AB/2) [m]
Apparent Resistivity Data
Theoretical Apparent Resistivity Curve
Resistivity Layered Structure Model
District Baringo North Division KipsaramanLocation Kapteberewo Site No. V-15
Site Name KAPAMIN Elevation 221736N UTM-E 815264 UTM-N 79507
Latitude 0.718444 Longitude 35.832278
AB/2(m)
Rho-a(Wm)
1.6 55.62.0 53.12.5 48.33.2 53.44.0 57.65.0 66.46.3 73.58.0 78.4
10.0 76.113.0 76.916.0 72.320.0 66.425.0 90.232.0 105.940.0 102.450.0 67.463.0 67.680.0 33.2
100.0 27.5130.0 22.3160.0 22.1200.0 27.2
Resistivity Depth
(Ohm.m) (m)159 0.5 Dry top superficial layer Dry. No aquifers
22 1 Slightly weathered tuffaceous material
76 10 Slightly weathered and fractured pyroclastics No aquifer expected in this zone238 12 Dry slightly fractured trachytes Dry300 17 Fresh volcanic rocks Dry
15 150 Highly weathered and fractured trachytes Aquiferous layer595 >150 Fresh basalts Dry
Vertical Electric Sounding Datasheet (Schlumberger)
Geological Interpretation Hydrogeological Interpretation
Moist. Very thin aquifer layer. Not potential for groundwater exploitation.
Curva de Resistividad Aparente
1
10
100
1000
1 10 100 1000AB/2 (m)
Res
istivi
dad
Apa
rent
e ( O
hm-m
)
(App
aren
t) R
esis
tivity
[Ohm
-m]
Depth (AB/2) [m]
Apparent Resistivity Data
Theoretical Apparent Resistivity Curve
Resistivity Layered Structure Model
District Baringo North Division KipsaramanLocation Kapteberewo Site No. V-17
Site Name CHAMBAI PRIMARY Elevation 204636N UTM-E 813363 UTM-N 76213
Latitude 0.688667 Longitude 35.815167
AB/2(m)
Rho-a(Wm)
1.6 893.02.0 768.22.5 597.83.2 406.64.0 301.55.0 165.76.3 116.48.0 78.8
10.0 43.513.0 32.516.0 27.320.0 29.025.0 31.432.0 35.740.0 37.050.0 39.063.0 40.980.0 35.9
100.0 44.7130.0 45.8160.0 49.2200.0 63.8
Resistivity Depth
(Ohm.m) (m)1197 1.2 Dry top superficial layer Dry. No aquifers
174 4 Dry volcanic soils Dry12 7 Slightly weathered and fractured pyroclastics No aquifer expected in this zone41 141 Highly weathered and fractured phonolites. Aquiferous layer
1000 >141 Compact and crystalline basalts Dry
Vertical Electric Sounding Datasheet (Schlumberger)
Geological Interpretation Hydrogeological Interpretation
Curva de Resistividad Aparente
1
10
100
1000
1 10 100 1000AB/2 (m)
Res
istivi
dad
Apa
rent
e ( O
hm-m
)
(App
aren
t) R
esis
tivity
[Ohm
-m]
Depth (AB/2) [m]
Apparent Resistivity Data
Theoretical Apparent Resistivity Curve
Resistivity Layered Structure Model
District Baringo North Division KipsaramanLocation Kipkata Site No. V-19
Site Name BARKETIEN PRIMARY Elevation 125336N UTM-E 817864 UTM-N 87293
Latitude 0.788778 Longitude 35.855611
AB/2(m)
Rho-a(Wm)
1.6 315.12.0 246.62.5 184.13.2 114.34.0 74.15.0 57.36.3 42.78.0 34.8
10.0 25.213.0 22.716.0 22.120.0 24.325.0 23.732.0 20.340.0 19.650.0 18.763.0 17.080.0 17.2
100.0 16.7130.0 14.8160.0 14.8200.0 15.6
Resistivity Depth
(Ohm.m) (m)576 0.8 Dry top superficial layer Dry. No aquifers
80 3 Slightly weathered phonolites. Moist.22 25 Slightly weathered and fractured phonolites Shallow aquifer expected in this zone14 >25 Highly weathered and fractured phonolites. Aquifers expected below these layers.
Vertical Electric Sounding Datasheet (Schlumberger)
Geological Interpretation Hydrogeological Interpretation
Curva de Resistividad Aparente
1
10
100
1000
1 10 100 1000AB/2 (m)
Res
istivi
dad
Apa
rent
e ( O
hm-m
)
(App
aren
t) R
esis
tivity
[Ohm
-m]
Depth (AB/2) [m]
Apparent Resistivity Data
Theoretical Apparent Resistivity Curve
Resistivity Layered Structure Model

District Baringo North Division BartabwaLocation Kinyach Site No. HEP-24-1
Site Name TOBOROI Elevation 1453Start Point Latitude 0.882611 Longitude 35.794083End Point Latitude 0.882611 Longitude 35.794083
Distance(m)
Rho-a(Wm)
0 82.9410 92.7520 93.3830 82.0740 77.4150 82.9560 66.6170 65.3580 51.7890 47.25
100 42.35110 36.82120 30.16130 21.99140 16.21150 18.47160 22.25170 17.59180 17.34190 19.1
Location Kinyach Site No. HEP-24-2Site Name TOBOROI Elevation 1453
Start Point Latitude 0.876778 Longitude 35.800861End Point Latitude 0.877750 Longitude 35.799417
Distance(m)
Rho-a(Wm)
0 16.7110 23.1220 26.7730 30.1640 2350 26.3960 26.5170 28.1580 33.5690 33.68
100 27.02110 23.13120 30.29130 32140 27.02150 21.99160 24.6170 32.68180 42.73190 37.07
Horizontal Electric Profiling Datasheet (Wenner)
Curva de Resistividad Aparente
0
20
40
60
80
100
120
140
160
180
200
0 50 100 150 200Distance (m)
Res
istivi
dad
Apa
rent
e ( O
hm-m
)
Curva de Resistividad Aparente
0
20
40
60
80
100
120
140
160
180
200
0 50 100 150 200Distance (m)
Res
istivi
dad
Apa
rent
e ( O
hm-m
)
V-24-1
V-24-2
District Baringo North Division BartabwaLocation Kinyach Site No. V-24-1
Site Name TOBOROI Elevation 145736N UTM-E 810957 UTM-N 97805
Latitude 0.884083 Longitude 35.793639
AB/2(m)
Rho-a(Wm)
1.6 61.852 68.79
2.5 72.383.2 77.24
4 78.955 80.36
6.3 77.58 69.4
10 50.0813 42.9316 30.5120 18.925 23.5232 19.3240 28.6550 30.663 35.180 41.04
100 41.57130 37.91160 36.21200 33.42
Resistivity Depth
(Ohm.m) (m)49 0.9 Dry top superficial layer
132 4 Slightly weathered and fractured trachyphonolites Dry9 14 Highly weathered and fractured trachyphonolites
and basalts rocks.Dry
102 46 Slightly weathered / fractured trachyphonolites /basalts
No aquifers
20 >46 Highly weathered/fractured trachyphonolites/basalts
Aquiferous
Vertical Electric Sounding Datasheet (Schlumberger)
Geological Interpretation Hydrogeological Interpretation
Dry. No aquifers
Curva de Resistividad Aparente
1
10
100
1000
1 10 100 1000AB/2 (m)
Res
istivi
dad
Apa
rent
e ( O
hm-m
)
(App
aren
t) R
esis
tivity
[Ohm
-m]
Depth (AB/2) [m]
Apparent Resistivity Data
Theoretical Apparent Resistivity Curve
Resistivity Layered Structure Model
District Baringo North Division BartabwaLocation Kinyach Site No. V-24-2
Site Name TOBOROI Elevation36N UTM-E 811662 UTM-N 97097
Latitude 0.877417 Longitude 35.800028
AB/2(m)
Rho-a(Wm)
1.6 61.422 60.18
2.5 62.63.2 66.88
4 74.35 82.94
6.3 90.528 96.6
10 86.3913 77.1916 78.1320 58.5925 35.4832 22.2240 19.0950 16.6663 13.8180 11.87
100 10.08130 9.08160 6.9200 5.64250 4.52
Resistivity Depth
(Ohm.m) (m)56 2.3 Thin dry top superficial layer Dry.
340 4.4 Slightly weathered and fractured trachyphonolites Moist. 14 69 Weathered/fractured trachyphonolites and basalts 3 >69 Clays/highly decomposed trachyphonolites /
pyroclasticsAquiferous
Vertical Electric Sounding Datasheet (Schlumberger)
Geological Interpretation Hydrogeological Interpretation
Shallow aquiferous layer
Curva de Resistividad Aparente
1
10
100
1000
1 10 100 1000AB/2 (m)
Resi
stiv
idad
Apa
rente
(O
hm
-m
)
(App
aren
t) R
esis
tivity
[Ohm
-m]
Depth (AB/2) [m]
Apparent Resistivity Data
Theoretical Apparent Resistivity Curve
Resistivity Layered Structure Model
District Baringo North Division BartabwaLocation Kinyach Site No. V-24-3
Site Name TOBOROI Elevation36N UTM-E 812516 UTM-N 96262
Latitude 0.869861 Longitude 35.807694
AB/2(m)
Rho-a(Wm)
1.6 46.392 42.71
2.5 40.993.2 39.25
4 34.555 30.71
6.3 27.658 23.28
10 18.7113 16.1116 16.1820 16.225 16.1332 16.5840 16.8150 17.7263 18.7180 18.22
100 19.11130 21160 23.44200 29.34250 36.1
Resistivity Depth
(Ohm.m) (m)46 0.9 Dry top superficial layer48 2.3 Volcanic soils No aquifer16 108 Highly weathered and fractured trachyphonolites
500 >108 Compact trachyphonolites/pyroclastics No aquifer expectedAquiferous
Vertical Electric Sounding Datasheet (Schlumberger)
Geological Interpretation Hydrogeological Interpretation
Dry. No aquifers
Curva de Resistividad Aparente
1
10
100
1000
1 10 100 1000AB/2 (m)
Res
istivi
dad
Apa
rent
e ( O
hm-m
)
(App
aren
t) R
esis
tivity
[Ohm
-m]
Depth (AB/2) [m]
Apparent Resistivity Data
Theoretical Apparent Resistivity Curve
Resistivity Layered Structure Model

District Baringo North Division KabartonjoLocation Bartum Site No. V-25
Site Name LINGOK Elevation 116836N UTM-E 827152 UTM-N 64086
Latitude 0.579028 Longitude 35.938889
AB/2(m)
Rho-a(Wm)
1.6 10.02.0 11.22.5 12.43.2 13.94.0 16.55.0 18.56.3 18.08.0 17.2
10.0 14.013.0 12.016.0 11.120.0 10.525.0 9.932.0 10.140.0 10.450.0 11.063.0 12.280.0 12.9
100.0 13.3130.0 15.8160.0 20.0200.0 25.2
Resistivity Depth
(Ohm.m) (m)6 0.8 Dry top superficial layer Dry. No aquifers
65 2 Slightly weathered phonolites. Moist.9 50 Highly weathered and fractured phonolites Shallow aquifer expected in this zone
18 100 Slightly weathered and fractured phonolites Aquiferous layer2000 >100 Fresh compact basalts Dry
Vertical Electric Sounding Datasheet (Schlumberger)
Geological Interpretation Hydrogeological Interpretation
Curva de Resistividad Aparente
1
10
100
1000
1 10 100 1000AB/2 (m)
Res
istivi
dad
Apa
rent
e ( O
hm-m
)
(App
aren
t) R
esis
tivity
[Ohm
-m]
Depth (AB/2) [m]
Apparent Resistivity Data
Theoretical Apparent Resistivity Curve
Resistivity Layered Structure Model
District Baringo North Division KabartonjoLocation Bartum Site No. V-26
Site Name BARKILACH Elevation 132336N UTM-E 824472 UTM-N 71328
Latitude 0.644500 Longitude 35.914861
AB/2(m)
Rho-a(Wm)
1.6 27.02.0 24.72.5 24.83.2 23.24.0 24.65.0 24.26.3 23.58.0 22.7
10.0 20.413.0 16.616.0 16.620.0 17.625.0 16.332.0 15.240.0 15.550.0 15.063.0 15.480.0 16.0
100.0 17.1130.0 20.5160.0 23.2200.0 28.2
Resistivity Depth
(Ohm.m) (m)72 0.3 Dry top soil. Superficial alluvial material Dry. No aquifers24 5 Dry soils with layer fractured vesicular basalts
intercalated with the pyroclasticsDry
14 102 Fractured , slightly weathered to highly weathered basaltic layer
Aquiferous
507 >102 Fresh compact basalts Dry
Vertical Electric Sounding Datasheet (Schlumberger)
Geological Interpretation Hydrogeological Interpretation
Curva de Resistividad Aparente
1
10
100
1000
1 10 100 1000AB/2 (m)
Res
istivi
dad
Apa
rent
e ( O
hm-m
)
(App
aren
t) R
esis
tivity
[Ohm
-m]
Depth (AB/2) [m]
Apparent Resistivity Data
Theoretical Apparent Resistivity Curve
Resistivity Layered Structure Model
District Baringo North Division KabartonjoLocation Bartum Site No. V-27
Site Name USWONIN Elevation 135736N UTM-E 820157 UTM-N 67533
Latitude 0.610250 Longitude 35.876111
AB/2(m)
Rho-a(Wm)
1.6 130.12.0 124.52.5 123.43.2 114.64.0 113.85.0 105.06.3 96.28.0 94.4
10.0 92.013.0 80.616.0 69.020.0 49.125.0 33.532.0 16.840.0 15.350.0 14.863.0 15.380.0 18.0
100.0 21.5130.0 26.1160.0 39.3
Resistivity Depth
(Ohm.m) (m)137 2 Dry top soil. Superficial alluvial material Dry. No aquifers
77 4 Dry soils with layered fractured vesicular trachytes intercalated with tuffs.
Dry.
204 7 Compact trachytic layer Moist no significant aquifers8 40 Highly fractured and weathered trachytes
intercalated with fractured pyroclastics.Shallow aquifers expected
2000 >40 Fresh compact Volcanic rocks Dry
Vertical Electric Sounding Datasheet (Schlumberger)
Geological Interpretation Hydrogeological Interpretation
Curva de Resistividad Aparente
1
10
100
1000
1 10 100 1000AB/2 (m)
Res
istivi
dad
Apa
rent
e ( O
hm-m
)
(App
aren
t) R
esis
tivity
[Ohm
-m]
Depth (AB/2) [m]
Apparent Resistivity Data
Theoretical Apparent Resistivity Curve
Resistivity Layered Structure Model
District Baringo North Division KipsaramanLocation Sibilo Site No. V-28
Site Name KOLONGOTWO Elevation 106836N UTM-E 822177 UTM-N 80801
Latitude 0.730083 Longitude 35.894306
AB/2(m)
Rho-a(Wm)
1.6 244.02.0 162.82.5 112.93.2 64.74.0 51.55.0 43.76.3 40.68.0 39.0
10.0 38.713.0 31.316.0 22.020.0 17.425.0 12.732.0 11.640.0 7.250.0 6.963.0 6.080.0 7.5
100.0 9.5130.0 11.4160.0 15.3200.0 17.6
Resistivity Depth
(Ohm.m) (m)569 0.8 Dry top soil. Superficial compact material Dry. No aquifers
20 1.9 Dry soils with layer fractured pyroclastics Dry 42 9 Fractured , slightly weathered phonolitic layer Moist no significant aquifers
5 62 Fractured phonolites intercalated with fractured pyroclastics.
Shallow expected aquifers
500 >500 Fresh compact Volcanic rocks Dry
Vertical Electric Sounding Datasheet (Schlumberger)
Geological Interpretation Hydrogeological Interpretation
Curva de Resistividad Aparente
1
10
100
1000
1 10 100 1000AB/2 (m)
Res
istivi
dad
Apa
rent
e ( O
hm-m
)
(App
aren
t) R
esis
tivity
[Ohm
-m]
Depth (AB/2) [m]
Apparent Resistivity Data
Theoretical Apparent Resistivity Curve
Resistivity Layered Structure Model

District Baringo North Division KipsaramanLocation Sibilo Site No. V-29
Site Name KOIBOWALE Elevation 111336N UTM-E 822908 UTM-N 76402
Latitude 0.690333 Longitude 35.900861
AB/2(m)
Rho-a(Wm)
1.6 20.02.0 17.42.5 16.23.2 15.04.0 14.15.0 13.16.3 12.28.0 12.5
10.0 13.713.0 14.816.0 16.520.0 21.025.0 26.732.0 36.640.0 34.350.0 31.863.0 23.580.0 25.7
100.0 27.0130.0 30.6160.0 32.5200.0 36.4250.0 41.7
Resistivity Depth
(Ohm.m) (m)20 2 Dry top soil. Superficial alluvial material Dry. No aquifers
8 6 Dry soils with layer fractured trachytes basalts Dry 175 13 Fractured , slightly weathered basaltic layer Moist. No significant aquifers
5 27 Fractured basalt intercalated with fractured pyroclastics.
No significant aquifers expected in this layer
50 140 Highly weathered pyroclastics and old land surface.
Aquiferous900 >140 Fresh compact Basalts rocks Dry
Vertical Electric Sounding Datasheet (Schlumberger)
Geological Interpretation Hydrogeological Interpretation
Curva de Resistividad Aparente
1
10
100
1000
1 10 100 1000AB/2 (m)
Res
istivi
dad
Apa
rent
e ( O
hm-m
)
(App
aren
t) R
esis
tivity
[Ohm
-m]
Depth (AB/2) [m]
Apparent Resistivity Data
Theoretical Apparent Resistivity Curve
Resistivity Layered Structure Model
District Baringo North Division KipsaramanLocation Sibilo Site No. V-31
Site Name KIPCHEMOI Elevation 100936N UTM-E 825531 UTM-N 81818
Latitude 0.739250 Longitude 35.924417
AB/2(m)
Rho-a(Wm)
1.6 23.42.0 20.42.5 18.73.2 19.24.0 20.45.0 20.86.3 22.08.0 25.9
10.0 25.613.0 24.016.0 24.620.0 25.325.0 24.732.0 23.240.0 22.750.0 20.763.0 20.380.0 16.0
100.0 14.9130.0 13.3160.0 12.7200.0 12.3
Resistivity Depth
(Ohm.m) (m)
55 0.5 Dry top soil. Superficial alluvial material Dry. No aquifers11 1.3 Dry soils with layer fractured vesicular phonolites Dry
26 29 Fractured , slightly weathered basaltic layer Moist 11 >29 Highly weathered basalts. Aquiferous
Vertical Electric Sounding Datasheet (Schlumberger)
Geological Interpretation Hydrogeological Interpretation
Curva de Resistividad Aparente
1
10
100
1000
1 10 100 1000AB/2 (m)
Res
istivi
dad
Apa
rent
e ( O
hm-m
)
(App
aren
t) R
esis
tivity
[Ohm
-m]
Depth (AB/2) [m]
Apparent Resistivity Data
Theoretical Apparent Resistivity Curve
Resistivity Layered Structure Model
District Baringo North Division BartabwaLocation Ng'orora Site No. V-32
Site Name KAPTURO Elevation 136436N UTM-E 814718 UTM-N 100533
Latitude 0.908444 Longitude 35.827500
AB/2(m)
Rho-a(Wm)
1.6 342.02.02.5 290.13.2 255.14.0 219.35.0 172.66.3 127.58.0 91.3
10.0 61.313.0 46.416.0 40.520.0 41.525.0 49.632.0 54.640.0 68.550.0 78.563.0 81.480.0 75.5
100.0 68.7130.0 61.5160.0 57.2200.0 52.2
Resistivity Depth
(Ohm.m) (m)
327 3 Dry top superficial layer Dry. No aquifers 27 11 Slightly weathered tuffs.
120 50 Slightly weathered and fractured trachyte Shallow aquifer expected in this zone37 >50 Highly weathered and fractured trachytes rocks. Aquiferous layer
Vertical Electric Sounding Datasheet (Schlumberger)
Geological Interpretation Hydrogeological Interpretation
Moist. Very thin aquifer layer. Not potential for groundwater exploitation.
Curva de Resistividad Aparente
1
10
100
1000
1 10 100 1000AB/2 (m)
Res
istivi
dad
Apa
rent
e ( O
hm-m
)
(App
aren
t) R
esis
tivity
[Ohm
-m]
Depth (AB/2) [m]
Apparent Resistivity Data
Theoretical Apparent Resistivity Curve
Resistivity Layered Structure Model
District Baringo North Division BartabwaLocation Ng'orora Site No. V-33
Site Name RONDININ (Chepkesin) Elevation 113236N UTM-E 819659 UTM-N 82054
Latitude 0.741417 Longitude 35.871722
AB/2(m)
Rho-a(Wm)
1.6 8.22.0 8.02.5 8.03.2 8.34.0 8.75.0 10.16.3 11.28.0 12.4
10.0 13.013.0 12.616.0 10.320.0 8.525.0 8.632.0 12.240.0 10.550.0 11.463.0 10.980.0 10.4
100.0 8.5130.0 14.7160.0 13.3200.0 12.6250.0 11.4
Resistivity Depth
(Ohm.m) (m)
11 0.8 Dry top superficial layer Dry. No aquifers 3 2 Moist to dry volcanic soils Moist. No aquifers are expected
36 4 Volcanic ashes and sediments Dry. No aquifers are expected2 7.5 Highly weathered volcanic ashes Moist. Not potential for groundwater exploitation
31 15 Slightly weathered trachytes Moist. Very thin aquifer layer. 6 23 Slightly weathered and fractured phonolites Shallow aquifer expected in this zone
16 100 Highly weathered and fractured phonolites. Aquiferous layer9 >100 Fractured and weathered basalts and old surface
layer.Aquiferous. Deep aquifers expected
Vertical Electric Sounding Datasheet (Schlumberger)
Geological Interpretation Hydrogeological Interpretation
Curva de Resistividad Aparente
1
10
100
1000
1 10 100 1000AB/2 (m)
Res
istivi
dad
Apa
rent
e ( O
hm-m
)
(App
aren
t) R
esis
tivity
[Ohm
-m]
Depth (AB/2) [m]
Apparent Resistivity Data
Theoretical Apparent Resistivity Curve
Resistivity Layered Structure Model
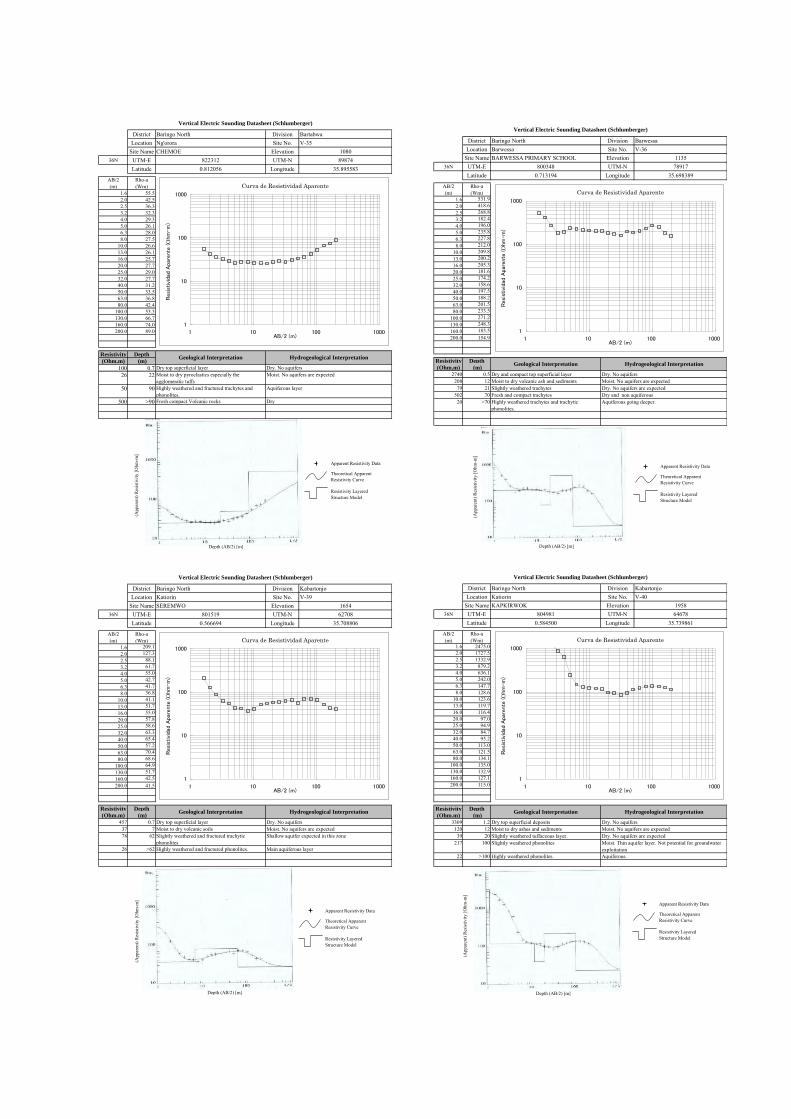
District Baringo North Division BartabwaLocation Ng'orora Site No. V-35
Site Name CHEMOE Elevation 108036N UTM-E 822312 UTM-N 89874
Latitude 0.812056 Longitude 35.895583
AB/2(m)
Rho-a(Wm)
1.6 55.52.0 42.52.5 36.33.2 32.34.0 29.35.0 26.16.3 28.08.0 27.5
10.0 26.613.0 26.116.0 25.720.0 27.725.0 29.032.0 27.740.0 31.250.0 33.563.0 36.880.0 42.4
100.0 53.3130.0 66.7160.0 74.0200.0 89.0
Resistivity Depth
(Ohm.m) (m)
100 0.7 Dry top superficial layer Dry. No aquifers 26 22 Moist to dry pyroclastics especially the
agglomeratic tuffsMoist. No aquifers are expected
50 90 Highly weathered and fractured trachytes and phonolites.
Aquiferous layer
500 >90 Fresh compact Volcanic rocks Dry
Vertical Electric Sounding Datasheet (Schlumberger)
Geological Interpretation Hydrogeological Interpretation
Curva de Resistividad Aparente
1
10
100
1000
1 10 100 1000AB/2 (m)
Res
istivi
dad
Apa
rent
e ( O
hm-m
)
(App
aren
t) R
esis
tivity
[Ohm
-m]
Depth (AB/2) [m]
Apparent Resistivity Data
Theoretical Apparent Resistivity Curve
Resistivity Layered Structure Model
District Baringo North Division BarwessaLocation Barwessa Site No. V-36
Site Name BARWESSA PRIMARY SCHOOL Elevation 113536N UTM-E 800348 UTM-N 78917
Latitude 0.713194 Longitude 35.698389
AB/2(m)
Rho-a(Wm)
1.6 531.92.0 418.62.5 268.83.2 182.44.0 196.05.0 235.86.3 227.88.0 212.0
10.0 209.813.0 200.216.0 205.320.0 181.625.0 174.232.0 158.640.0 197.550.0 188.263.0 201.580.0 233.5
100.0 271.2130.0 248.3160.0 183.5200.0 154.9
Resistivity Depth
(Ohm.m) (m)2740 0.5 Dry and compact top superficial layer Dry. No aquifers
208 12 Moist to dry volcanic ash and sediments Moist. No aquifers are expected79 21 Slightly weathered trachytes Dry. No aquifers are expected
502 70 Fresh and compact trachytes Dry and non aquiferous20 >70 Highly weathered trachytes and trachytic
phonolites.Aquiferous going deeper.
Vertical Electric Sounding Datasheet (Schlumberger)
Geological Interpretation Hydrogeological Interpretation
Curva de Resistividad Aparente
1
10
100
1000
1 10 100 1000AB/2 (m)
Res
istivi
dad
Apa
rent
e ( O
hm-m
)
(App
aren
t) R
esis
tivity
[Ohm
-m]
Depth (AB/2) [m]
Apparent Resistivity Data
Theoretical Apparent Resistivity Curve
Resistivity Layered Structure Model
District Baringo North Division KabartonjoLocation Katiorin Site No. V-39
Site Name SEREMWO Elevation 165436N UTM-E 801519 UTM-N 62708
Latitude 0.566694 Longitude 35.708806
AB/2(m)
Rho-a(Wm)
1.6 209.12.0 127.32.5 88.13.2 61.74.0 55.05.0 42.76.3 41.78.0 36.8
10.0 41.113.0 51.716.0 55.020.0 57.825.0 58.632.0 63.340.0 65.450.0 57.263.0 70.480.0 68.6
100.0 64.9130.0 51.7160.0 42.5200.0 41.5
Resistivity Depth
(Ohm.m) (m)457 0.7 Dry top superficial layer Dry. No aquifers
37 7 Moist to dry volcanic soils Moist. No aquifers are expected78 62 Slightly weathered and fractured trachytic
phonolites Shallow aquifer expected in this zone
26 >62 Highly weathered and fractured phonolites. Main aquiferous layer
Vertical Electric Sounding Datasheet (Schlumberger)
Geological Interpretation Hydrogeological Interpretation
Curva de Resistividad Aparente
1
10
100
1000
1 10 100 1000AB/2 (m)
Res
istivi
dad
Apa
rent
e ( O
hm-m
)
(App
aren
t) R
esis
tivity
[Ohm
-m]
Depth (AB/2) [m]
Apparent Resistivity Data
Theoretical Apparent Resistivity Curve
Resistivity Layered Structure Model
District Baringo North Division KabartonjoLocation Katiorin Site No. V-40
Site Name KAPKIRWOK Elevation 195836N UTM-E 804981 UTM-N 64678
Latitude 0.584500 Longitude 35.739861
AB/2(m)
Rho-a(Wm)
1.6 2475.02.0 1727.52.5 1332.93.2 879.24.0 636.15.0 242.06.3 147.78.0 128.6
10.0 123.613.0 119.716.0 116.420.0 97.025.0 94.932.0 84.740.0 95.250.0 113.063.0 121.580.0 134.1
100.0 135.0130.0 132.9160.0 127.1200.0 115.0
Resistivity Depth
(Ohm.m) (m)3309 1.2 Dry top superficial deposits Dry. No aquifers
120 12 Moist to dry ashes and sediments Moist. No aquifers are expected39 20 Slightly weathered tuffaceous layer. Dry. No aquifers are expected
217 100 Slightly weathered phonolites
22 >100 Highly weathered phonolites. Aquiferous.
Vertical Electric Sounding Datasheet (Schlumberger)
Geological Interpretation Hydrogeological Interpretation
Moist. Thin aquifer layer. Not potential for groundwater exploitation
Curva de Resistividad Aparente
1
10
100
1000
1 10 100 1000AB/2 (m)
Resi
stiv
idad
Apa
rent
e (O
hm-m
)
(App
aren
t) R
esis
tivity
[Ohm
-m]
Depth (AB/2) [m]
Apparent Resistivity Data
Theoretical Apparent Resistivity Curve
Resistivity Layered Structure Model

District Baringo North Division KabartonjoLocation Saimo Mosop Site No. V-42
Site Name KAPCHEPKOR Elevation 216336N UTM-E 813844 UTM-N 70018
Latitude 0.632694 Longitude 35.819472
AB/2(m)
Rho-a(Wm)
1.6 2439.62.0 1558.42.5 675.83.2 490.84.0 407.15.0 343.06.3 295.08.0 225.7
10.0 175.313.0 149.016.0 123.520.0 105.825.0 86.632.0 83.740.0 86.250.0 63.663.0 56.580.0 51.5
100.0 50.1130.0 54.4160.0 57.6200.0 62.8
Resistivity Depth
(Ohm.m) (m)1359 0.5 Dry top superficial deposits Dry. No aquifers
420 4 Dry to moist Volcanic ashes and sediments Moist. No aquifers are expected101 20 Slightly weathered pyroclastics Dry. No aquifers are expected
42 105 Highly weathered trachytes Shallow aquifer layer expected in this layer.100 >105 Slightly weathered trachytes and phonolites Aquiferous.
Vertical Electric Sounding Datasheet (Schlumberger)
Geological Interpretation Hydrogeological Interpretation
Curva de Resistividad Aparente
10
100
1000
10000
1 10 100 1000AB/2 (m)
Resi
stiv
idad
Apar
ente
(O
hm
-m
)
(App
aren
t) R
esis
tivity
[Ohm
-m]
Depth (AB/2) [m]
Apparent Resistivity Data
Theoretical Apparent Resistivity Curve
Resistivity Layered Structure Model
District Baringo North Division KabartonjoLocation Saimo Mosop Site No. V-43
Site Name KAPTERE Elevation 224736N UTM-E 812038 UTM-N 68531
Latitude 0.619306 Longitude 35.803250
AB/2(m)
Rho-a(Wm)
1.6 226.62.0 252.42.5 259.23.2 231.54.0 210.75.0 207.86.3 219.18.0 204.3
10.0 198.713.0 152.616.0 126.120.0 99.325.0 75.932.0 62.840.0 54.250.0 48.763.0 44.880.0 39.8
100.0 36.6130.0 40.1160.0 36.0200.0 32.0
Resistivity Depth
(Ohm.m) (m)266 0.6 Dry top superficial deposits Dry. 226 3 Compact Volcanic ashes and sediments Moist. No aquifers are expected250 7 Compact pyroclastics Dry.
49 36 Highly weathered trachytes Moist. Thin aquifer layer. 33 >36 Slightly weathered trachytes and phonolites Aquiferous
Vertical Electric Sounding Datasheet (Schlumberger)
Geological Interpretation Hydrogeological Interpretation
Curva de Resistividad Aparente
1
10
100
1000
1 10 100 1000AB/2 (m)
Res
istivi
dad
Apa
rent
e ( O
hm-m
)
(App
aren
t) R
esis
tivity
[Ohm
-m]
Depth (AB/2) [m]
Apparent Resistivity Data
Theoretical Apparent Resistivity Curve
Resistivity Layered Structure Model
District Baringo North Division KabartonjoLocation Saimo Mosop Site No. V-44
Site Name BOINO Elevation 213836N UTM-E 813237 UTM-N 71271
Latitude 0.644000 Longitude 35.814000
AB/2(m)
Rho-a(Wm)
1.6 1616.42.0 1425.82.5 956.43.2 618.94.0 811.85.0 591.36.3 404.28.0 256.6
10.0 159.913.0 115.016.0 94.820.0 89.025.0 65.132.0 61.540.0 62.550.0 69.463.0 72.380.0 67.1
100.0 57.1130.0 50.3160.0 48.9200.0 51.0
Resistivity Depth
(Ohm.m) (m)6322 0.5 Dry top superficial deposits Dry. No aquifers
845 3 Dry to moist Volcanic ashes and sediments Moist. No aquifers are expected68 34 Slightly weathered pyroclastics Dry. No aquifers are expected78 53 Highly weathered trachytes
37 87 Slightly weathered trachytes and phonolites Shallow aquifer layer. 63 >87 Fractured and weathered phonolites Deep aquifers expected in this zone
Moist. Thin aquifer layer. Not potential for groundwater exploitation
Vertical Electric Sounding Datasheet (Schlumberger)
Geological Interpretation Hydrogeological Interpretation
Curva de Resistividad Aparente
1
10
100
1000
1 10 100 1000AB/2 (m)
Res
istivi
dad
Apa
rent
e ( O
hm-m
)
(App
aren
t) R
esis
tivity
[Ohm
-m]
Depth (AB/2) [m]
Apparent Resistivity Data
Theoretical Apparent Resistivity Curve
Resistivity Layered Structure Model
District Baringo North Division KabartonjoLocation Ossen Site No. V-45
Site Name TIRIONDONIN Elevation 200536N UTM-E 807874 UTM-N 71212
Latitude 0.643528 Longitude 35.765889
AB/2(m)
Rho-a(Wm)
1.6 136.52.0 139.22.5 139.83.2 131.14.0 108.95.0 78.56.3 70.28.0 66.0
10.0 65.113.0 72.616.0 88.320.0 92.925.0 89.932.0 86.940.0 84.250.0 83.463.0 78.880.0 74.7
100.0 59.0130.0 45.0160.0 24.0200.0 19.0250.0 17.8
Resistivity Depth
(Ohm.m) (m)159 2 Dry top superficial deposits Dry.
18 3 Moist Volcanic soils and sediments Moist. No aquifers are expected114 31 Slightly weathered phonolites Dry.
56 63 Fractured and weathered phonolites Shallow aquifer layer expected in this layer. 11 >63 Highly weathered phonolites Aquiferous
Vertical Electric Sounding Datasheet (Schlumberger)
Geological Interpretation Hydrogeological Interpretation
Curva de Resistividad Aparente
1
10
100
1000
1 10 100 1000AB/2 (m)
Resi
stiv
idad
Apa
rent
e (O
hm-m
)
(App
aren
t) R
esis
tivity
[Ohm
-m]
Depth (AB/2) [m]
Apparent Resistivity Data
Theoretical Apparent Resistivity Curve
Resistivity Layered Structure Model
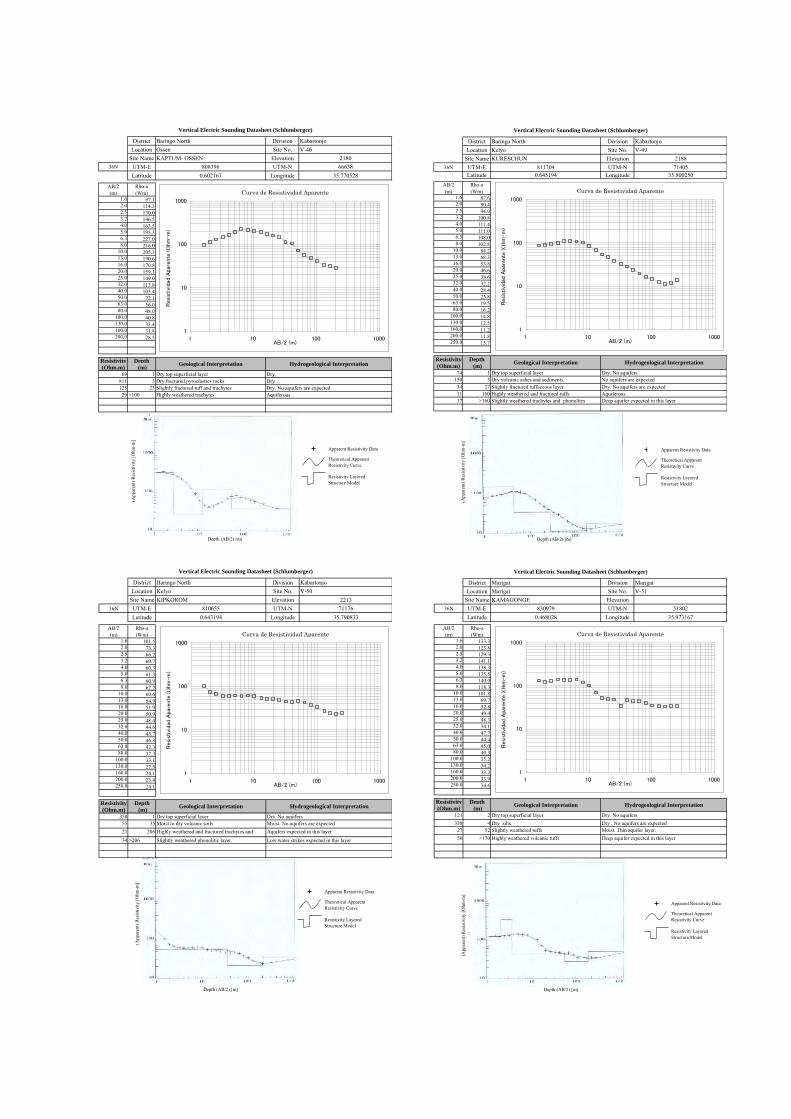
District Baringo North Division KabartonjoLocation Ossen Site No. V-46
Site Name KAPTUM- OSSEN Elevation 218036N UTM-E 808396 UTM-N 66638
Latitude 0.602167 Longitude 35.770528
AB/2(m)
Rho-a(Wm)
1.6 97.12.0 114.32.5 130.03.2 146.54.0 163.55.0 195.36.3 227.08.0 216.0
10.0 205.313.0 190.616.0 170.820.0 159.125.0 149.032.0 113.840.0 105.450.0 72.163.0 56.080.0 48.0
100.0 40.8130.0 33.4160.0 31.8200.0 28.5
Resistivity Depth
(Ohm.m) (m)69 1 Dry top superficial layer Dry.
811 3 Dry fractured pyroclastics rocks Dry125 23 Slightly fractured tuff and trachytes Dry. No aquifers are expected
29 >100 Highly weathered trachytes Aquiferous
Vertical Electric Sounding Datasheet (Schlumberger)
Geological Interpretation Hydrogeological Interpretation
Curva de Resistividad Aparente
1
10
100
1000
1 10 100 1000AB/2 (m)
Res
istivi
dad
Apa
rent
e ( O
hm-m
)
(App
aren
t) R
esis
tivity
[Ohm
-m]
Depth (AB/2) [m]
Apparent Resistivity Data
Theoretical Apparent Resistivity Curve
Resistivity Layered Structure Model
District Baringo North Division KabartonjoLocation Kelyo Site No. V-49
Site Name KURESCHUN Elevation 218836N UTM-E 811704 UTM-N 71405
Latitude 0.645194 Longitude 35.800250AB/2(m)
Rho-a(Wm)
1.6 87.62.0 90.42.5 94.93.2 100.84.0 111.45.0 111.06.3 108.08.0 102.8
10.0 84.213.0 68.316.0 53.820.0 46.625.0 38.632.0 32.240.0 28.450.0 23.863.0 19.580.0 16.2
100.0 14.8130.0 12.5160.0 11.2200.0 11.8250.0 13.7
Resistivity Depth
(Ohm.m) (m)74 1 Dry top superficial layer Dry. No aquifers
150 5 Dry volcanic ashes and sediments. No aquifers are expected34 27 Slightly fractured tuffaceous layer Dry. No aquifers are expected11 160 Highly weathered and fractured tuffs Aquiferous17 >160 Slightly weathered trachytes and phonolites Deep aquifer expected in this layer
Vertical Electric Sounding Datasheet (Schlumberger)
Geological Interpretation Hydrogeological Interpretation
Curva de Resistividad Aparente
1
10
100
1000
1 10 100 1000AB/2 (m)
Res
istivi
dad
Apa
rent
e ( O
hm-m
)
(App
aren
t) R
esis
tivity
[Ohm
-m]
Depth (AB/2) [m]
Apparent Resistivity Data
Theoretical Apparent Resistivity Curve
Resistivity Layered Structure Model
District Baringo North Division KabartonjoLocation Kelyo Site No. V-50
Site Name KIPKOROM Elevation 221336N UTM-E 810655 UTM-N 71176
Latitude 0.643194 Longitude 35.790833
AB/2(m)
Rho-a(Wm)
1.6 101.52.0 73.32.5 66.23.2 60.74.0 60.35.0 61.36.3 60.98.0 62.2
10.0 60.613.0 54.916.0 51.920.0 50.925.0 48.432.0 44.640.0 43.750.0 46.863.0 42.380.0 37.3
100.0 33.1130.0 27.5160.0 24.1200.0 23.4250.0 24.1
Resistivity Depth
(Ohm.m) (m)350 1 Dry top superficial layer Dry. No aquifers
55 35 Moist to dry volcanic soils Moist. No aquifers are expected21 206 Highly weathered and fractured trachytes and
phonolites.Aquifers expected in this layer
34 >206 Slightly weathered phonolitic layer. Low water strikes expected in this layer
Vertical Electric Sounding Datasheet (Schlumberger)
Geological Interpretation Hydrogeological Interpretation
Curva de Resistividad Aparente
1
10
100
1000
1 10 100 1000AB/2 (m)
Resi
stiv
idad
Apar
ente
(O
hm
-m
)
(App
aren
t) R
esis
tivity
[Ohm
-m]
Depth (AB/2) [m]
Apparent Resistivity Data
Theoretical Apparent Resistivity Curve
Resistivity Layered Structure Model
District Marigat Division MarigatLocation Marigat Site No. V-51
Site Name KAMAGONGE Elevation36N UTM-E 830979 UTM-N 51802
Latitude 0.468028 Longitude 35.973167
AB/2(m)
Rho-a(Wm)
1.6 133.32.0 123.82.5 129.33.2 141.14.0 138.35.0 135.56.3 140.08.0 118.3
10.0 101.813.0 69.716.0 52.820.0 49.425.0 48.332.0 34.140.0 47.750.0 44.463.0 45.080.0 40.3
100.0 35.2130.0 34.2160.0 33.2200.0 33.9250.0 34.6
Resistivity Depth
(Ohm.m) (m)121 2 Dry top superficial layer Dry. No aquifers 338 4 Dry silts Dry , No aquifers are expected
27 52 Slightly weathered tuffs Moist. Thin aquifer layer. 50 >170 Highly weathered volcanic tuffs Deep aquifer expected in this layer
Vertical Electric Sounding Datasheet (Schlumberger)
Geological Interpretation Hydrogeological Interpretation
Curva de Resistividad Aparente
1
10
100
1000
1 10 100 1000AB/2 (m)
Res
istivi
dad
Apa
rent
e ( O
hm-m
)
(App
aren
t) R
esis
tivity
[Ohm
-m]
Depth (AB/2) [m]
Apparent Resistivity Data
Theoretical Apparent Resistivity Curve
Resistivity Layered Structure Model
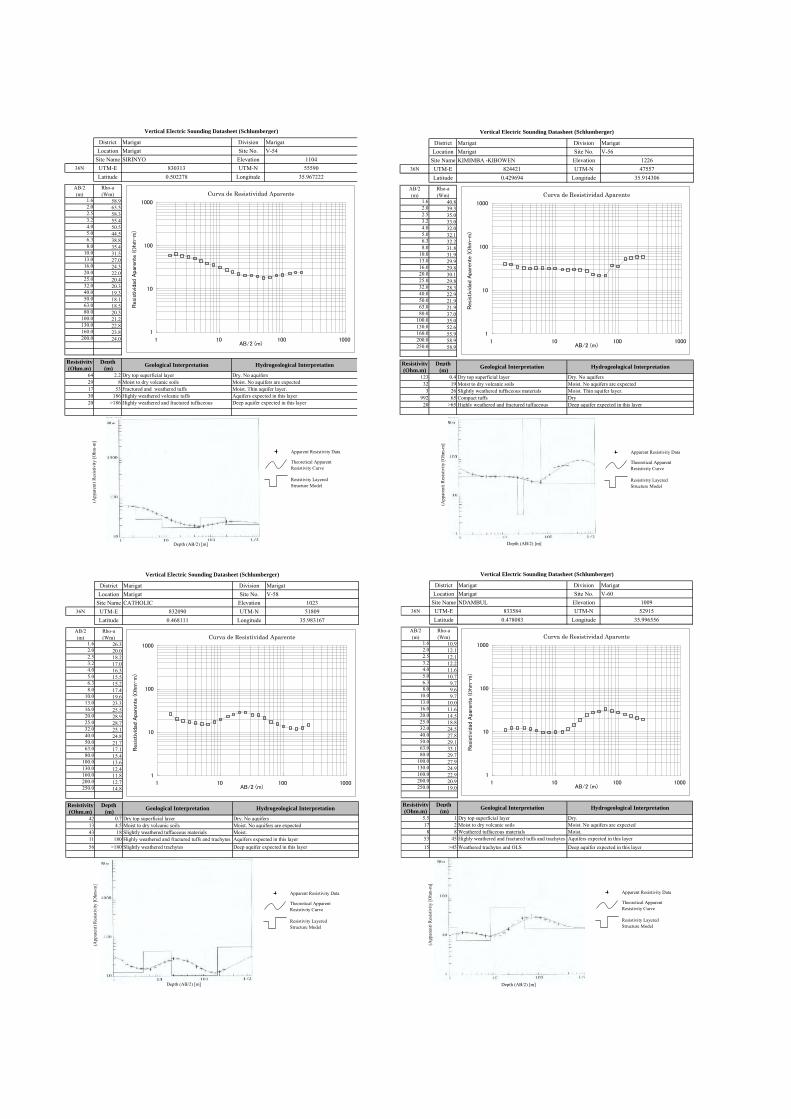
District Marigat Division MarigatLocation Marigat Site No. V-54
Site Name SIRINYO Elevation 110436N UTM-E 830313 UTM-N 55590
Latitude 0.502278 Longitude 35.967222
AB/2(m)
Rho-a(Wm)
1.6 58.92.0 63.52.5 58.33.2 55.44.0 50.55.0 44.56.3 38.88.0 35.4
10.0 31.513.0 27.016.0 24.320.0 22.025.0 20.432.0 20.340.0 19.350.0 18.163.0 18.580.0 20.3
100.0 21.2130.0 22.8160.0 23.8200.0 24.0
Resistivity Depth
(Ohm.m) (m)64 2.2 Dry top superficial layer Dry. No aquifers 29 8 Moist to dry volcanic soils Moist. No aquifers are expected17 53 Fractured and weathered tuffs Moist. Thin aquifer layer. 30 186 Highly weathered volcanic tuffs Aquifers expected in this layer20 >186 Highly weathered and fractured tuffaceous
materialsDeep aquifer expected in this layer
Vertical Electric Sounding Datasheet (Schlumberger)
Geological Interpretation Hydrogeological Interpretation
Curva de Resistividad Aparente
1
10
100
1000
1 10 100 1000AB/2 (m)
Res
istivi
dad
Apa
rent
e ( O
hm-m
)
(App
aren
t) R
esis
tivity
[Ohm
-m]
Depth (AB/2) [m]
Apparent Resistivity Data
Theoretical Apparent Resistivity Curve
Resistivity Layered Structure Model
District Marigat Division MarigatLocation Marigat Site No. V-56
Site Name KIMIMBA -KIBOWEN Elevation 122636N UTM-E 824421 UTM-N 47557
Latitude 0.429694 Longitude 35.914306
AB/2(m)
Rho-a(Wm)
1.6 40.82.0 39.32.5 35.03.2 33.04.0 32.05.0 32.16.3 32.28.0 31.8
10.0 31.913.0 29.916.0 29.820.0 30.125.0 29.832.0 28.340.0 22.950.0 21.963.0 21.980.0 37.0
100.0 35.0130.0 52.6160.0 55.9200.0 58.9250.0 58.9
Resistivity Depth
(Ohm.m) (m)123 0.4 Dry top superficial layer Dry. No aquifers
32 19 Moist to dry volcanic soils Moist. No aquifers are expected3 26 Slightly weathered tuffaceous materials Moist. Thin aquifer layer.
992 65 Compact tuffs Dry20 >65 Highly weathered and fractured tuffaceous Deep aquifer expected in this layer
Vertical Electric Sounding Datasheet (Schlumberger)
Geological Interpretation Hydrogeological Interpretation
Curva de Resistividad Aparente
1
10
100
1000
1 10 100 1000AB/2 (m)
Resi
stiv
idad
Apar
ente
(O
hm
-m
)
(App
aren
t) R
esis
tivity
[Ohm
-m]
Depth (AB/2) [m]
Apparent Resistivity Data
Theoretical Apparent Resistivity Curve
Resistivity Layered Structure Model
District Marigat Division MarigatLocation Marigat Site No. V-58
Site Name CATHOLIC Elevation 102336N UTM-E 832090 UTM-N 51809
Latitude 0.468111 Longitude 35.983167
AB/2(m)
Rho-a(Wm)
1.6 26.32.0 20.02.5 18.23.2 17.04.0 16.35.0 15.56.3 15.28.0 17.4
10.0 19.613.0 23.316.0 25.520.0 28.925.0 28.732.0 25.140.0 24.850.0 21.763.0 17.180.0 15.4
100.0 13.6130.0 12.4160.0 11.8200.0 12.7250.0 14.8
Resistivity Depth
(Ohm.m) (m)42 0.7 Dry top superficial layer Dry. No aquifers 13 4.5 Moist to dry volcanic soils Moist. No aquifers are expected43 18 Slightly weathered tuffaceous materials Moist. 11 180 Highly weathered and fractured tuffs and trachytes Aquifers expected in this layer56 >180 Slightly weathered trachytes Deep aquifer expected in this layer
Vertical Electric Sounding Datasheet (Schlumberger)
Geological Interpretation Hydrogeological Interpretation
Curva de Resistividad Aparente
1
10
100
1000
1 10 100 1000AB/2 (m)
Res
istivi
dad
Apa
rent
e ( O
hm-m
)
(App
aren
t) R
esis
tivity
[Ohm
-m]
Depth (AB/2) [m]
Apparent Resistivity Data
Theoretical Apparent Resistivity Curve
Resistivity Layered Structure Model
District Marigat Division MarigatLocation Marigat Site No. V-60
Site Name NDAMBUL Elevation 100936N UTM-E 833584 UTM-N 52915
Latitude 0.478083 Longitude 35.996556
AB/2(m)
Rho-a(Wm)
1.6 10.92.0 12.12.5 12.13.2 12.24.0 11.65.0 10.76.3 9.78.0 9.6
10.0 9.713.0 10.016.0 11.620.0 14.525.0 18.832.0 24.540.0 27.850.0 29.163.0 33.180.0 29.7
100.0 27.9130.0 24.9160.0 22.9200.0 20.9250.0 19.0
Resistivity Depth
(Ohm.m) (m)5.5 1 Dry top superficial layer Dry. 17 2 Moist to dry volcanic soils Moist. No aquifers are expected
8 8 Weathered tuffaceous materials Moist. 53 45 Highly weathered and fractured tuffs and trachytes Aquifers expected in this layer15 >45 Weathered trachytes and OLS Deep aquifer expected in this layer
Vertical Electric Sounding Datasheet (Schlumberger)
Geological Interpretation Hydrogeological Interpretation
Curva de Resistividad Aparente
1
10
100
1000
1 10 100 1000AB/2 (m)
Resi
stiv
idad
Apa
rente
(O
hm
-m
)
(App
aren
t) R
esis
tivity
[Ohm
-m]
Depth (AB/2) [m]
Apparent Resistivity Data
Theoretical Apparent Resistivity Curve
Resistivity Layered Structure Model
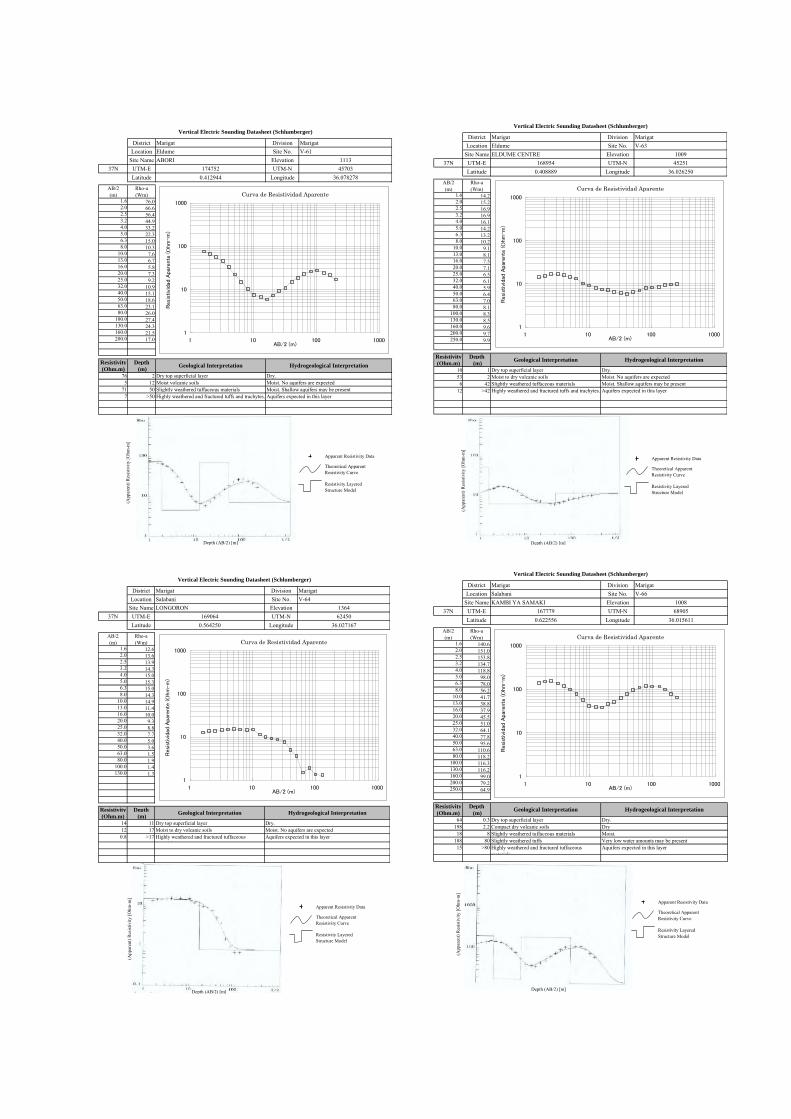
District Marigat Division MarigatLocation Eldume Site No. V-61
Site Name ABORI Elevation 111337N UTM-E 174752 UTM-N 45703
Latitude 0.412944 Longitude 36.078278
AB/2(m)
Rho-a(Wm)
1.6 76.02.0 66.62.5 56.43.2 44.94.0 33.25.0 22.36.3 15.08.0 10.3
10.0 7.613.0 6.716.0 5.820.0 7.325.0 9.232.0 10.940.0 15.150.0 18.663.0 23.180.0 26.0
100.0 27.4130.0 24.3160.0 21.5200.0 17.0
Resistivity Depth
(Ohm.m) (m)76 2 Dry top superficial layer Dry.
5 12 Moist volcanic soils Moist. No aquifers are expected71 50 Slightly weathered tuffaceous materials Moist. Shallow aquifers may be present
7 >50 Highly weathered and fractured tuffs and trachytes. Aquifers expected in this layer
Vertical Electric Sounding Datasheet (Schlumberger)
Geological Interpretation Hydrogeological Interpretation
Curva de Resistividad Aparente
1
10
100
1000
1 10 100 1000AB/2 (m)
Res
istivi
dad
Apa
rent
e ( O
hm-m
)
(App
aren
t) R
esis
tivity
[Ohm
-m]
Depth (AB/2) [m]
Apparent Resistivity Data
Theoretical Apparent Resistivity Curve
Resistivity Layered Structure Model
District Marigat Division MarigatLocation Eldume Site No. V-63
Site Name ELDUME CENTRE Elevation 100937N UTM-E 168954 UTM-N 45251
Latitude 0.408889 Longitude 36.026250
AB/2(m)
Rho-a(Wm)
1.6 14.22.0 15.22.5 16.93.2 16.94.0 16.15.0 14.26.3 13.28.0 10.2
10.0 9.113.0 8.116.0 7.520.0 7.125.0 6.532.0 6.140.0 5.950.0 6.463.0 7.080.0 8.1
100.0 8.3130.0 8.5160.0 9.6200.0 9.7250.0 9.9
Resistivity Depth
(Ohm.m) (m)10 1 Dry top superficial layer Dry. 53 2 Moist to dry volcanic soils Moist. No aquifers are expected
6 42 Slightly weathered tuffaceous materials Moist. Shallow aquifers may be present12 >42 Highly weathered and fractured tuffs and trachytes. Aquifers expected in this layer
Vertical Electric Sounding Datasheet (Schlumberger)
Geological Interpretation Hydrogeological Interpretation
Curva de Resistividad Aparente
1
10
100
1000
1 10 100 1000AB/2 (m)
Res
istivi
dad
Apa
rent
e ( O
hm-m
)
(App
aren
t) R
esis
tivity
[Ohm
-m]
Depth (AB/2) [m]
Apparent Resistivity Data
Theoretical Apparent Resistivity Curve
Resistivity Layered Structure Model
District Marigat Division MarigatLocation Salabani Site No. V-64
Site Name LONGORON Elevation 136437N UTM-E 169064 UTM-N 62450
Latitude 0.564250 Longitude 36.027167
AB/2(m)
Rho-a(Wm)
1.6 12.62.0 13.62.5 13.93.2 14.34.0 15.05.0 15.36.3 15.08.0 14.3
10.0 14.913.0 11.416.0 10.020.0 9.325.0 8.832.0 7.740.0 5.050.0 3.663.0 1.580.0 1.9
100.0 1.4130.0 1.3
Resistivity Depth
(Ohm.m) (m)14 11 Dry top superficial layer Dry. 12 17 Moist to dry volcanic soils Moist. No aquifers are expected
0.8 >17 Highly weathered and fractured tuffaceous materials
Aquifers expected in this layer
Vertical Electric Sounding Datasheet (Schlumberger)
Geological Interpretation Hydrogeological Interpretation
Curva de Resistividad Aparente
1
10
100
1000
1 10 100 1000AB/2 (m)
Resi
stiv
idad
Apa
rente
(O
hm
-m
)
(App
aren
t) R
esis
tivity
[Ohm
-m]
Depth (AB/2) [m]
Apparent Resistivity Data
Theoretical Apparent Resistivity Curve
Resistivity Layered Structure Model
District Marigat Division MarigatLocation Salabani Site No. V-66
Site Name KAMBI YA SAMAKI Elevation 100837N UTM-E 167779 UTM-N 68905
Latitude 0.622556 Longitude 36.015611
AB/2(m)
Rho-a(Wm)
1.6 140.62.0 151.02.5 153.83.2 134.74.0 118.85.0 98.06.3 78.08.0 56.2
10.0 41.713.0 38.816.0 37.920.0 45.525.0 51.032.0 64.140.0 77.850.0 95.663.0 110.680.0 118.2
100.0 116.3130.0 116.2160.0 99.0200.0 79.2250.0 64.9
Resistivity Depth
(Ohm.m) (m)64 0.3 Dry top superficial layer Dry.
198 2.2 Compact dry volcanic soils Dry18 8 Slightly weathered tuffaceous materials Moist.
188 80 Slightly weathered tuffs Very low water amounts may be present15 >80 Highly weathered and fractured tuffaceous
materialsAquifers expected in this layer
Vertical Electric Sounding Datasheet (Schlumberger)
Geological Interpretation Hydrogeological Interpretation
Curva de Resistividad Aparente
1
10
100
1000
1 10 100 1000AB/2 (m)
Resi
stiv
idad
Apar
ente
(O
hm
-m
)
(App
aren
t) R
esis
tivity
[Ohm
-m]
Depth (AB/2) [m]
Apparent Resistivity Data
Theoretical Apparent Resistivity Curve
Resistivity Layered Structure Model

District Marigat Division MarigatLocation Ng'ambo Site No. V-67-1
Site Name LESUUWA Elevation 99137N UTM-E 174145 UTM-N 52638
Latitude 0.475611 Longitude 36.072806
AB/2(m)
Rho-a(Wm)
1.6 17.852 20.33
2.5 20.33.2 19.95
4 20.545 21.93
6.3 21.828 21.68
10 22.1213 23.3716 22.420 20.1725 15.6840 13.9750 12.9863 11.6480 8.98
100 7.98130 7.98160 10200 10.98
Resistivity Depth
(Ohm.m) (m)11.3 0 -0.3 Dry top superficial layer/ fractured tuff.
22 0.3-4.3 Weathered and fractured basalts rocks. Dry.28 4.3-11 Slightly weathered and fractured basalt Moist12 11-45 Weathered and fractured basalts rocks. Aquiferous4 45-100 Highly weathered basalts/pyroclastics/clays Aquiferous
500 >100 Slightly weathered basalt Aquiferous
Vertical Electric Sounding Datasheet (Schlumberger)
Geological Interpretation Hydrogeological Interpretation
Dry. No aquifers
Curva de Resistividad Aparente
1
10
100
1000
1 10 100 1000AB/2 (m)
Res
istivi
dad
Apa
rent
e ( O
hm-m
)
(App
aren
t) R
esis
tivity
[Ohm
-m]
Depth (AB/2) [m]
Apparent Resistivity Data
Theoretical Apparent Resistivity Curve
Resistivity Layered Structure Model
District Marigat Division MarigatLocation Ng'ambo Site No. V-67-2
Site Name LESUUWA Elevation 98537N UTM-E 174327 UTM-N 52841
Latitude 0.477444 Longitude 36.074444
AB/2(m)
Rho-a(Wm)
1.6 22.142 26.67
2.5 30.413.2 37.584 40.545 40.07
6.3 28.158 25.94
10 20.9113 14.3116 10.9620 8.2425 4.8632 4.140 350 2.4563 2.0680 1.96
100 2.22130 3.15160 3.6200 5250 6.66
Resistivity Depth
(Ohm.m) (m)8 0 -0.4 Thin dry top superficial layer Dry.
12 0.4-2 Slightly weathered and fractured basalt7 16-2 Weathered and fractured basalts rocks. Moist
1.2 16-63 Highly weathered basalts/pyroclastics/clays Aquiferous523 >63 Slightly weathered basalt Aquiferous
Vertical Electric Sounding Datasheet (Schlumberger)
Geological Interpretation Hydrogeological Interpretation
Dry. No aquifers
Curva de Resistividad Aparente
1
10
100
1000
1 10 100 1000AB/2 (m)
Res
istivi
dad
Apa
rent
e ( O
hm-m
)
(App
aren
t) R
esis
tivity
[Ohm
-m]
Depth (AB/2) [m]
Apparent Resistivity Data
Theoretical Apparent Resistivity Curve
Resistivity Layered Structure Model
District Marigat Division MarigatLocation Ng'ambo Site No. V-67-3
Site Name LESUUWA Elevation 98237N UTM-E 174489 UTM-N 52789
Latitude 0.476972 Longitude 36.075889
AB/2(m)
Rho-a(Wm)
1.6 73.182 66.08
2.5 58.093.2 52.284 40.695 37.42
6.3 27.2813 17.0716 11.5420 7.7725 532 3.5440 2.7250 2.1863 1.8380 1.38
100 0.63
Resistivity Depth
(Ohm.m) (m)59 0 - 0.1 Dry top superficial layer/topo soil66 0.1-2.5 Alluvial sediments/soils11 2.5-15 Fine to medium grained sediments Moist1 >15 Clays/ lacustrine sediments
Dry. No aquifers
Aquiferous. Clays/ saline water saturated
Vertical Electric Sounding Datasheet (Schlumberger)
Geological Interpretation Hydrogeological Interpretation
Dry. No aquifers
Curva de Resistividad Aparente
0
1
10
100
1 10 100 1000AB/2 (m)
Resi
stiv
idad
Apa
rente
(O
hm
-m
)
(App
aren
t) R
esis
tivity
[Ohm
-m]
Depth (AB/2) [m]
Apparent Resistivity Data
Theoretical Apparent Resistivity Curve
Resistivity Layered Structure Model
District Marigat Division MarigatLocation Kimalel Site No. V-69
Site Name KAPKECHII Elevation 136536N UTM-E 818701 UTM-N 46467
Latitude 0.419861 Longitude 35.862972
AB/2(m)
Rho-a(Wm)
1.6 8.82.0 9.62.5 9.13.2 9.24.0 8.85.0 8.46.3 8.18.0 8.4
10.0 9.413.0 12.016.0 12.320.0 15.225.0 18.032.0 22.240.0 24.050.0 27.463.0 30.180.0 35.2
100.0 47.2130.0 53.9160.0 61.2200.0 69.0250.0 71.0
Resistivity Depth
(Ohm.m) (m)9 10 Dry top superficial layer Dry.
56 25 Compact dry volcanic soils Dry44 42 Slightly weathered tuffs Moist.
128 >42 Highly weathered and fractured tuffs Aquifers expected in this layer
Vertical Electric Sounding Datasheet (Schlumberger)
Geological Interpretation Hydrogeological Interpretation
Curva de Resistividad Aparente
1
10
100
1000
1 10 100 1000AB/2 (m)
Resi
stiv
idad
Apa
rente
(O
hm
-m
)
(App
aren
t) R
esis
tivity
[Ohm
-m]
Depth (AB/2) [m]
Apparent Resistivity Data
Theoretical Apparent Resistivity Curve
Resistivity Layered Structure Model

District Marigat Division MarigatLocation Kimalel Site No. V-70
Site Name NGEMBOWARE (Loropil) Elevation 134636N UTM-E 822506 UTM-N 51622
Latitude 0.466444 Longitude 35.897139
AB/2(m)
Rho-a(Wm)
1.6 141.32.0 142.22.5 135.53.2 144.14.0 152.15.0 115.56.3 128.48.0 147.0
10.0 137.713.0 159.416.0 153.920.0 142.425.0 126.432.0 90.440.0 73.650.0 62.563.0 53.280.0 45.9
100.0 40.0130.0 41.4160.0 43.9200.0 46.2250.0 52.1
Resistivity Depth
(Ohm.m) (m)146 17.4 Dry top superficial layer Dry.
35 150 Highly weathered and fractured tuffaceous materials
Aquifers expected in this layer
165 >150 Compact trachytic-phonolites Dry
Vertical Electric Sounding Datasheet (Schlumberger)
Geological Interpretation Hydrogeological Interpretation
Curva de Resistividad Aparente
10
100
1000
10000
1 10 100 1000AB/2 (m)
Res
istivi
dad
Apa
rent
e ( O
hm-m
)
(App
aren
t) R
esis
tivity
[Ohm
-m]
Depth (AB/2) [m]
Apparent Resistivity Data
Theoretical Apparent Resistivity Curve
Resistivity Layered Structure Model
District Marigat Division MarigatLocation Kimalel Site No. V-73
Site Name BARSIBET-KISAMISONCHUN Elevation 224736N UTM-E 821256 UTM-N 45144
Latitude 0.407917 Longitude 35.885889
AB/2(m)
Rho-a(Wm)
1.6 60.52.0 57.62.5 50.23.2 44.64.0 41.05.0 38.06.3 34.58.0 32.6
10.0 32.713.0 33.016.0 34.920.0 37.925.0 42.032.0 49.440.0 51.050.0 45.163.0 46.380.0 47.0
100.0 47.3130.0 39.6160.0 45.7
Resistivity Depth
(Ohm.m) (m)66 1.4 Dry top superficial layer Dry. 29 13 Moist to dry volcanic soils Moist
193 21 Compact tuffaceous materials Moist. 17 49 Slightly weathered tuffs Shallow aquifer may be present71 >49 Highly weathered and fractured tuffs and trachytes Aquifers expected in this layer
Vertical Electric Sounding Datasheet (Schlumberger)
Geological Interpretation Hydrogeological Interpretation
Curva de Resistividad Aparente
1
10
100
1000
1 10 100 1000AB/2 (m)
Resi
stiv
idad
Apa
rente
(O
hm
-m
)
(App
aren
t) R
esis
tivity
[Ohm
-m]
Depth (AB/2) [m]
Apparent Resistivity Data
Theoretical Apparent Resistivity Curve
Resistivity Layered Structure Model
District Marigat Division MarigatLocation Kimalel Site No. V-74
Site Name LOKOIWOPSONCHUN Elevation 133636N UTM-E 818662 UTM-N 51184
Latitude 0.462528 Longitude 35.862639
AB/2(m)
Rho-a(Wm)
1.6 10.72.0 10.92.5 11.53.2 11.04.0 11.85.0 11.16.3 10.88.0 11.6
10.0 11.913.0 13.416.0 13.620.0 15.225.0 18.532.0 23.540.0 25.250.0 26.163.0 28.180.0 31.2
100.0 36.9130.0 40.9160.0 40.6200.0 40.0250.0 38.9
Resistivity Depth
(Ohm.m) (m)9.3 0.6 Dry top superficial layer Dry. 12 3.3 Moist to dry volcanic soils Moist
8 8 Slightly weathered tuffaceous materials Moist. 38 52 Slightly weathered trachytic phonolites Shallow aquifer may be present
101 95 Slightly weathered and fractured tuffs and trachytes
Shallow aquifers expected in this layer20 >95 Highly weathered and fractured tuffs and trachytes Aquifers expected in this layer
Vertical Electric Sounding Datasheet (Schlumberger)
Geological Interpretation Hydrogeological Interpretation
Curva de Resistividad Aparente
1
10
100
1000
1 10 100 1000AB/2 (m)
Res
istivi
dad
Apa
rent
e ( O
hm-m
)
(App
aren
t) R
esis
tivity
[Ohm
-m]
Depth (AB/2) [m]
Apparent Resistivity Data
Theoretical Apparent Resistivity Curve
Resistivity Layered Structure Model
District Marigat Division MarigatLocation Kimalel Site No. V-75
Site Name KINYOCH Elevation 133936N UTM-E 823214 UTM-N 50298
Latitude 0.454472 Longitude 35.903472
AB/2(m)
Rho-a(Wm)
1.6 61.12.0 41.72.5 39.73.2 43.04.0 45.35.0 46.56.3 50.78.0 56.8
10.0 62.113.0 84.116.0 78.920.0 87.925.0 100.932.0 119.540.0 114.450.0 101.763.0 80.180.0 51.6
100.0 29.5130.0 18.8160.0 12.1200.0 11.0250.0 12.1
Resistivity Depth
(Ohm.m) (m)
2267 0.2 Exposed tuffaceous outcrops Dry. 38 5 Moist to dry volcanic soils Moist
380 14 Slightly weathered phonolitic materials Moist. 8 180 Highly weathered and fractured tuffs and trachytes Aquifers present in this layer
50 >180 Slightly weathered and fractured and trachytes Deep aquifers expected .
Vertical Electric Sounding Datasheet (Schlumberger)
Geological Interpretation Hydrogeological Interpretation
Curva de Resistividad Aparente
1
10
100
1000
1 10 100 1000AB/2 (m)
Res
istivi
dad
Apa
rent
e ( O
hm-m
)
(App
aren
t) R
esis
tivity
[Ohm
-m]
Depth (AB/2) [m]
Apparent Resistivity Data
Theoretical Apparent Resistivity Curve
Resistivity Layered Structure Model
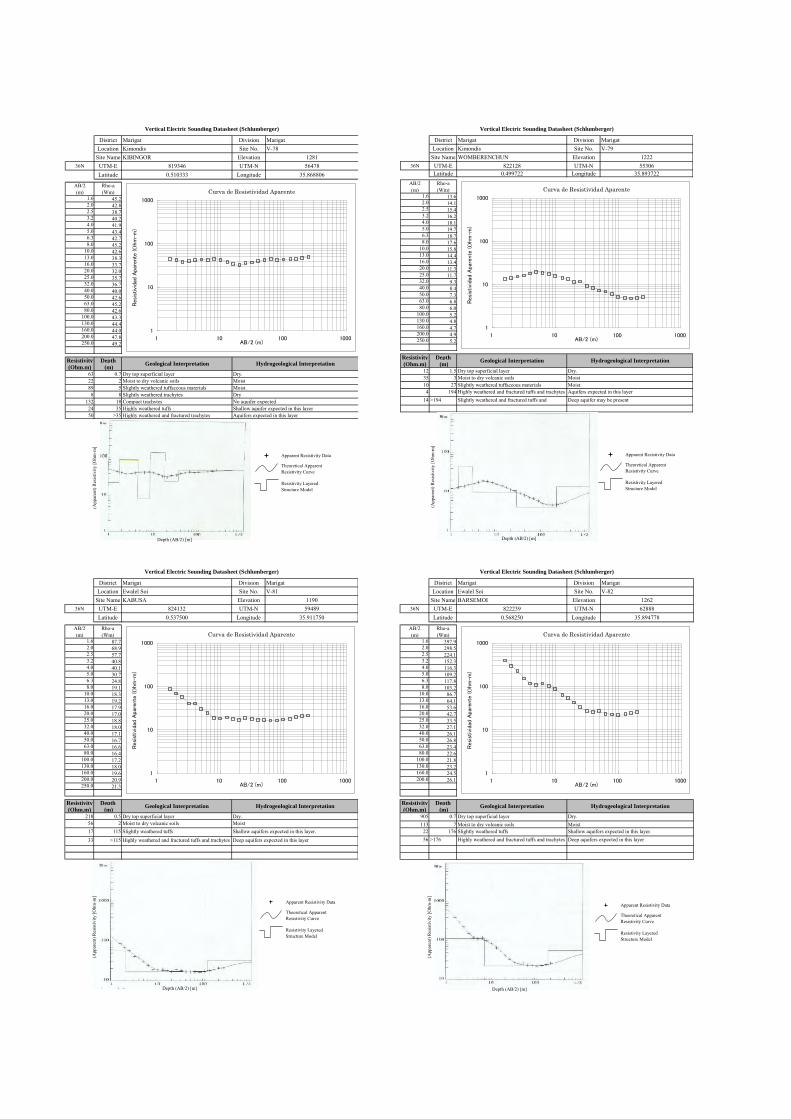
District Marigat Division MarigatLocation Kimondis Site No. V-78
Site Name KIBINGOR Elevation 128136N UTM-E 819346 UTM-N 56478
Latitude 0.510333 Longitude 35.868806
AB/2(m)
Rho-a(Wm)
1.6 45.22.0 42.82.5 38.73.2 40.24.0 41.95.0 43.46.3 42.78.0 45.2
10.0 42.613.0 38.316.0 33.720.0 32.025.0 35.732.0 36.740.0 40.050.0 42.663.0 45.280.0 42.6
100.0 43.3130.0 44.4160.0 44.0200.0 47.8250.0 49.2
Resistivity Depth
(Ohm.m) (m)63 0.7 Dry top superficial layer Dry. 22 2 Moist to dry volcanic soils Moist89 5 Slightly weathered tuffaceous materials Moist.
8 8 Slightly weathered trachytes Dry132 18 Compact trachytes No aquifer expected
24 35 Highly weathered tuffs Shallow aquifer expected in this layer50 >35 Highly weathered and fractured trachytes Aquifers expected in this layer
Vertical Electric Sounding Datasheet (Schlumberger)
Geological Interpretation Hydrogeological Interpretation
Curva de Resistividad Aparente
1
10
100
1000
1 10 100 1000AB/2 (m)
Resi
stiv
idad
Apa
rente
(O
hm
-m
)
(App
aren
t) R
esis
tivity
[Ohm
-m]
Depth (AB/2) [m]
Apparent Resistivity Data
Theoretical Apparent Resistivity Curve
Resistivity Layered Structure Model
District Marigat Division MarigatLocation Kimondis Site No. V-79
Site Name WOMBERENCHUN Elevation 122236N UTM-E 822128 UTM-N 55306
Latitude 0.499722 Longitude 35.893722AB/2(m)
Rho-a(Wm)
1.6 13.62.0 14.12.5 15.43.2 16.24.0 18.15.0 19.76.3 18.78.0 17.6
10.0 15.813.0 14.416.0 13.420.0 11.325.0 11.732.0 9.340.0 8.450.0 7.363.0 6.880.0 6.0
100.0 5.2130.0 4.8160.0 4.7200.0 4.9250.0 5.2
Resistivity Depth
(Ohm.m) (m)12 1.5 Dry top superficial layer Dry. 35 3 Moist to dry volcanic soils Moist10 27 Slightly weathered tuffaceous materials Moist.
4 194 Highly weathered and fractured tuffs and trachytes Aquifers expected in this layer14 >194 Slightly weathered and fractured tuffs and
trachytesDeep aquifer may be present
Vertical Electric Sounding Datasheet (Schlumberger)
Geological Interpretation Hydrogeological Interpretation
Curva de Resistividad Aparente
1
10
100
1000
1 10 100 1000AB/2 (m)
Res
istivi
dad
Apa
rent
e ( O
hm-m
)
(App
aren
t) R
esis
tivity
[Ohm
-m]
Depth (AB/2) [m]
Apparent Resistivity Data
Theoretical Apparent Resistivity Curve
Resistivity Layered Structure Model
District Marigat Division MarigatLocation Ewalel Soi Site No. V-81
Site Name KABUSA Elevation 119036N UTM-E 824132 UTM-N 59489
Latitude 0.537500 Longitude 35.911750
AB/2(m)
Rho-a(Wm)
1.6 87.72.0 68.92.5 57.73.2 40.84.0 40.15.0 30.76.3 24.88.0 19.1
10.0 18.313.0 19.216.0 17.920.0 17.025.0 18.832.0 18.040.0 17.150.0 16.763.0 16.680.0 16.4
100.0 17.2130.0 18.0160.0 19.6200.0 20.9250.0 21.3
Resistivity Depth
(Ohm.m) (m)218 0.5 Dry top superficial layer Dry.
56 2 Moist to dry volcanic soils Moist17 115 Slightly weathered tuffs Shallow aquifers expected in this layer. 33 >115 Highly weathered and fractured tuffs and trachytes Deep aquifers expected in this layer
Vertical Electric Sounding Datasheet (Schlumberger)
Geological Interpretation Hydrogeological Interpretation
Curva de Resistividad Aparente
1
10
100
1000
1 10 100 1000AB/2 (m)
Res
istivi
dad
Apa
rent
e ( O
hm-m
)
(App
aren
t) R
esis
tivity
[Ohm
-m]
Depth (AB/2) [m]
Apparent Resistivity Data
Theoretical Apparent Resistivity Curve
Resistivity Layered Structure Model
District Marigat Division MarigatLocation Ewalel Soi Site No. V-82
Site Name BARSEMOI Elevation 126236N UTM-E 822239 UTM-N 62888
Latitude 0.568250 Longitude 35.894778
AB/2(m)
Rho-a(Wm)
1.6 397.92.0 298.52.5 224.13.2 152.34.0 116.35.0 109.26.3 117.88.0 103.2
10.0 86.713.0 64.116.0 53.620.0 42.725.0 33.532.0 27.140.0 26.150.0 26.863.0 23.480.0 22.6
100.0 21.8130.0 23.2160.0 24.5200.0 26.1
Resistivity Depth
(Ohm.m) (m)905 0.7 Dry top superficial layer Dry. 113 7 Moist to dry volcanic soils Moist
22 176 Slightly weathered tuffs Shallow aquifers expected in this layer. 56 >176 Highly weathered and fractured tuffs and trachytes Deep aquifers expected in this layer
Vertical Electric Sounding Datasheet (Schlumberger)
Geological Interpretation Hydrogeological Interpretation
Curva de Resistividad Aparente
1
10
100
1000
1 10 100 1000AB/2 (m)
Res
istivi
dad
Apa
rent
e ( O
hm-m
)
(App
aren
t) R
esis
tivity
[Ohm
-m]
Depth (AB/2) [m]
Apparent Resistivity Data
Theoretical Apparent Resistivity Curve
Resistivity Layered Structure Model
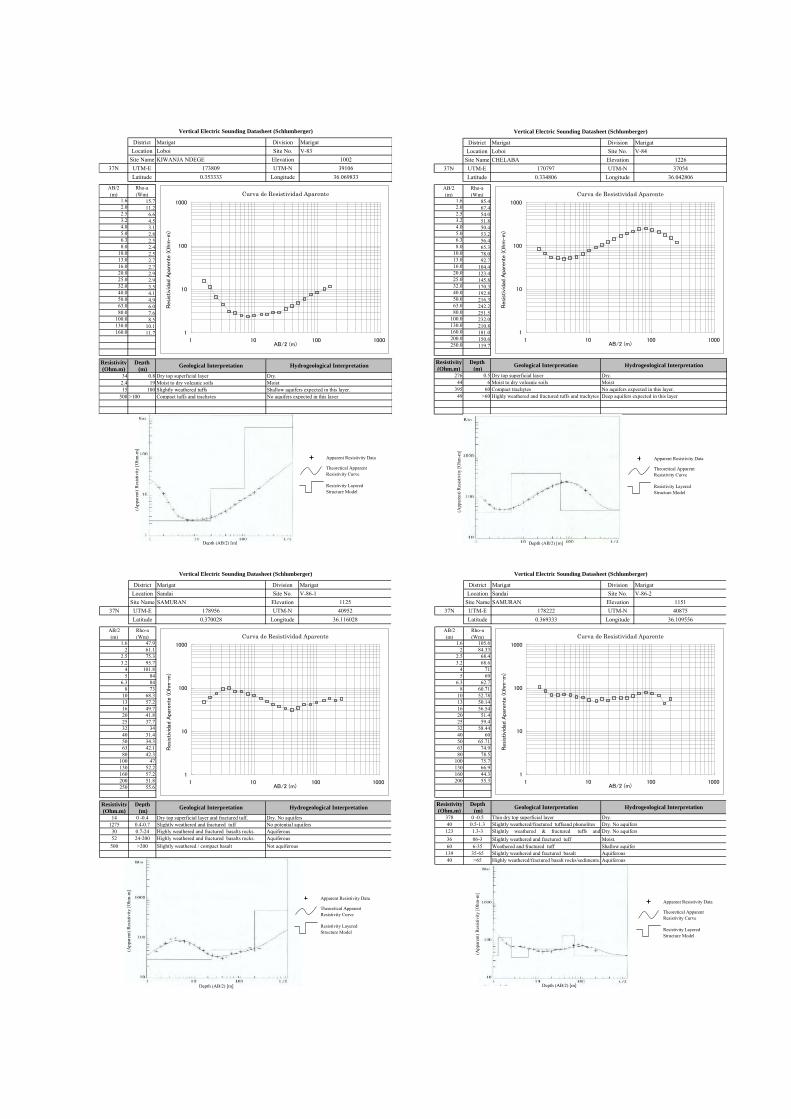
District Marigat Division MarigatLocation Loboi Site No. V-83
Site Name KIWANJA NDEGE Elevation 100237N UTM-E 173809 UTM-N 39106
Latitude 0.353333 Longitude 36.069833
AB/2(m)
Rho-a(Wm)
1.6 15.72.0 11.22.5 6.63.2 4.54.0 3.15.0 2.86.3 2.58.0 2.4
10.0 2.513.0 2.716.0 2.720.0 2.925.0 2.932.0 3.540.0 4.150.0 4.963.0 6.080.0 7.6
100.0 8.5130.0 10.1160.0 11.7
Resistivity Depth
(Ohm.m) (m)34 0.8 Dry top superficial layer Dry.
2.4 19 Moist to dry volcanic soils Moist15 100 Slightly weathered tuffs Shallow aquifers expected in this layer.
500 >100 Compact tuffs and trachytes No aquifers expected in this layer
Vertical Electric Sounding Datasheet (Schlumberger)
Geological Interpretation Hydrogeological Interpretation
Curva de Resistividad Aparente
1
10
100
1000
1 10 100 1000AB/2 (m)
Res
istivi
dad
Apa
rent
e ( O
hm-m
)
(App
aren
t) R
esis
tivity
[Ohm
-m]
Depth (AB/2) [m]
Apparent Resistivity Data
Theoretical Apparent Resistivity Curve
Resistivity Layered Structure Model
District Marigat Division MarigatLocation Loboi Site No. V-84
Site Name CHELABA Elevation 122637N UTM-E 170797 UTM-N 37054
Latitude 0.334806 Longitude 36.042806
AB/2(m)
Rho-a(Wm)
1.6 85.42.0 67.42.5 54.03.2 51.84.0 50.45.0 53.26.3 56.48.0 65.3
10.0 78.013.0 92.716.0 104.420.0 123.425.0 145.832.0 170.340.0 192.850.0 216.363.0 242.280.0 251.5
100.0 232.0130.0 210.8160.0 181.0200.0 150.6250.0 119.7
Resistivity Depth
(Ohm.m) (m)276 0.5 Dry top superficial layer Dry.
44 6 Moist to dry volcanic soils Moist395 60 Compact trachytes No aquifers expected in this layer.
49 >60 Highly weathered and fractured tuffs and trachytes Deep aquifers expected in this layer
Vertical Electric Sounding Datasheet (Schlumberger)
Geological Interpretation Hydrogeological Interpretation
Curva de Resistividad Aparente
1
10
100
1000
1 10 100 1000AB/2 (m)
Res
istivi
dad
Apa
rent
e ( O
hm-m
)
(App
aren
t) R
esis
tivity
[Ohm
-m]
Depth (AB/2) [m]
Apparent Resistivity Data
Theoretical Apparent Resistivity Curve
Resistivity Layered Structure Model
District Marigat Division MarigatLocation Sandai Site No. V-86-1
Site Name SAMURAN Elevation 112537N UTM-E 178956 UTM-N 40952
Latitude 0.370028 Longitude 36.116028
AB/2(m)
Rho-a(Wm)
1.6 47.92 61.1
2.5 75.33.2 95.7
4 101.85 84
6.3 848 73
10 68.313 57.216 49.720 41.825 37.732 3440 31.450 34.363 42.180 42.3
100 47130 52.2160 57.2200 51.8250 55.6
Resistivity Depth
(Ohm.m) (m)14 0 -0.4 Dry top superficial layer and fractured tuff.
1275 0.4-0.7 Slightly weathered and fractured tuff 30 0.7-24 Highly weathered and fractured basalts rocks. Aquiferous52 24-200 Highly weathered and fractured basalts rocks. Aquiferous
500 >200 Slightly weathered / compact basalt Not aquiferous
Vertical Electric Sounding Datasheet (Schlumberger)
Geological Interpretation Hydrogeological Interpretation
No potential aquifersDry. No aquifers
Curva de Resistividad Aparente
1
10
100
1000
1 10 100 1000AB/2 (m)
Resi
stiv
idad
Apa
rente
(O
hm
-m
)
(App
aren
t) R
esis
tivity
[Ohm
-m]
Depth (AB/2) [m]
Apparent Resistivity Data
Theoretical Apparent Resistivity Curve
Resistivity Layered Structure Model
District Marigat Division MarigatLocation Sandai Site No. V-86-2
Site Name SAMURAN Elevation 115137N UTM-E 178222 UTM-N 40875
Latitude 0.369333 Longitude 36.109556
AB/2(m)
Rho-a(Wm)
1.6 105.62 84.33
2.5 68.43.2 68.6
4 715 69
6.3 62.78 60.71
10 52.7813 50.1416 56.5420 51.425 59.432 58.4440 6050 65.7163 74.980 78.5
100 75.7130 66.9160 44.3200 55.3
Resistivity Depth
(Ohm.m) (m)378 0 -0.5 Thin dry top superficial layer Dry. 40 0.5-1.3 Slightly weathered/fractured tuffsand phonolites Dry. No aquifers
123 1.3-3 Slightly weathered & fractured tuffs andphonolites
Dry. No aquifers36 06-3 Slightly weathered and fractured tuff Moist. 60 6-35 Weathered and fractured tuff Shallow aquifer
139 35-65 Slightly weathered and fractured basalt Aquiferous40 >65 Highly weathered/fractured basalt rocks/sediments. Aquiferous
Vertical Electric Sounding Datasheet (Schlumberger)
Geological Interpretation Hydrogeological Interpretation
Curva de Resistividad Aparente
1
10
100
1000
1 10 100 1000AB/2 (m)
Resi
stiv
idad
Apa
rente
(O
hm
-m
)
(App
aren
t) R
esis
tivity
[Ohm
-m]
Depth (AB/2) [m]
Apparent Resistivity Data
Theoretical Apparent Resistivity Curve
Resistivity Layered Structure Model
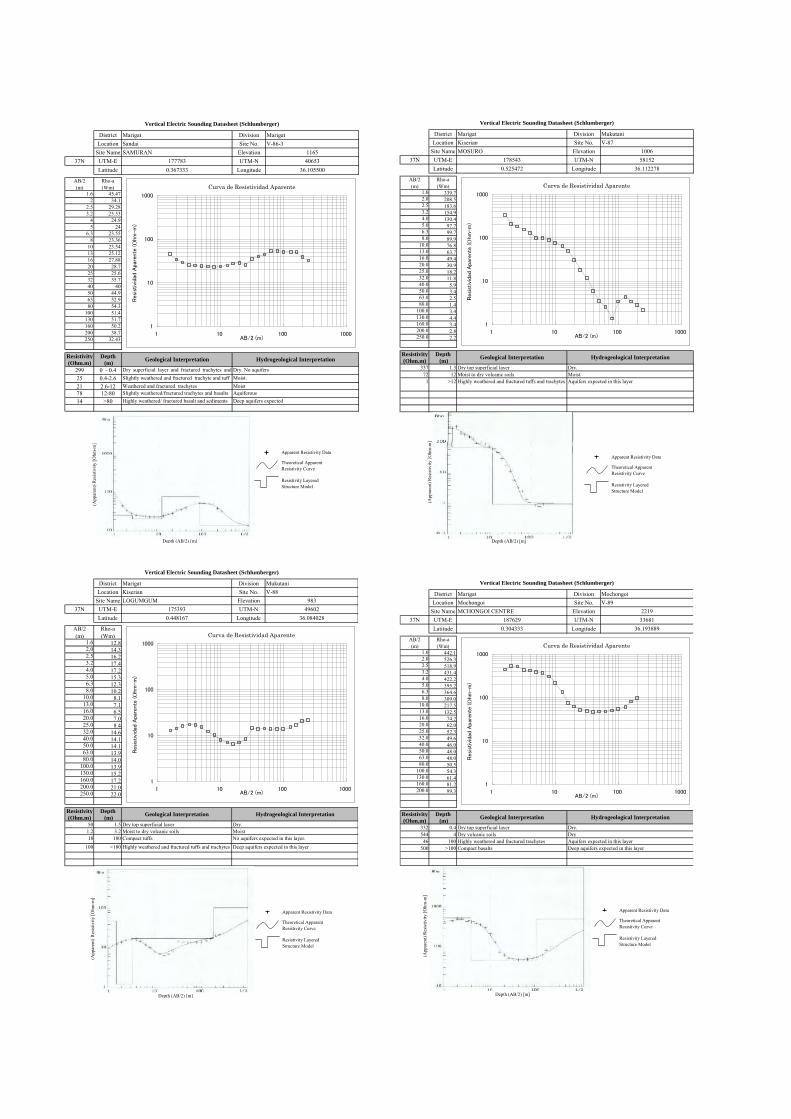
District Marigat Division MarigatLocation Sandai Site No. V-86-3
Site Name SAMURAN Elevation 116537N UTM-E 177783 UTM-N 40653
Latitude 0.367333 Longitude 36.105500
AB/2(m)
Rho-a(Wm)
1.6 45.472 34.1
2.5 29.283.2 25.53
4 24.95 24
6.3 23.558 23.36
10 23.5413 25.1216 27.8820 28.725 25.632 35.740 4050 44.963 52.980 54.3
100 51.4130 51.7160 50.2200 38.7250 32.43
Resistivity Depth
(Ohm.m) (m)
299 0 - 0.4 Dry superficial layer and fractured trachytes andtuff
Dry. No aquifers25 0.4-2.6 Slightly weathered and fractured trachyte and tuff Moist. 21 2.6-12 Weathered and fractured trachytes Moist78 12-80 Slightly weathered/fractured trachytes and basalts Aquiferous14 >80 Highly weathered/ fractured basalt and sediments Deep aquifers expected
Vertical Electric Sounding Datasheet (Schlumberger)
Geological Interpretation Hydrogeological Interpretation
Curva de Resistividad Aparente
1
10
100
1000
1 10 100 1000AB/2 (m)
Resi
stiv
idad
Apar
ente
(O
hm
-m
)
(App
aren
t) R
esis
tivity
[Ohm
-m]
Depth (AB/2) [m]
Apparent Resistivity Data
Theoretical Apparent Resistivity Curve
Resistivity Layered Structure Model
District Marigat Division MukutaniLocation Kiserian Site No. V-87
Site Name MOSURO Elevation 100637N UTM-E 178543 UTM-N 58152
Latitude 0.525472 Longitude 36.112278
AB/2(m)
Rho-a(Wm)
1.6 339.72.0 208.52.5 183.63.2 154.94.0 130.45.0 97.76.3 99.78.0 89.9
10.0 76.813.0 63.716.0 49.420.0 30.925.0 18.232.0 11.840.0 5.950.0 3.463.0 2.580.0 1.4
100.0 3.4130.0 4.4160.0 3.4200.0 2.8250.0 2.2
Resistivity Depth
(Ohm.m) (m)337 1.3 Dry top superficial layer Dry.
72 12 Moist to dry volcanic soils Moist1 >12 Highly weathered and fractured tuffs and trachytes Aquifers expected in this layer
Vertical Electric Sounding Datasheet (Schlumberger)
Geological Interpretation Hydrogeological Interpretation
Curva de Resistividad Aparente
1
10
100
1000
1 10 100 1000AB/2 (m)
Resi
stiv
idad
Apa
rente
(O
hm
-m
)
(App
aren
t) R
esis
tivity
[Ohm
-m]
Depth (AB/2) [m]
Apparent Resistivity Data
Theoretical Apparent Resistivity Curve
Resistivity Layered Structure Model
District Marigat Division MukutaniLocation Kiserian Site No. V-88
Site Name LOGUMGUM Elevation 98337N UTM-E 175393 UTM-N 49602
Latitude 0.448167 Longitude 36.084028
AB/2(m)
Rho-a(Wm)
1.6 12.82.0 14.32.5 16.23.2 17.44.0 17.25.0 15.36.3 12.38.0 10.2
10.0 8.113.0 7.116.0 6.520.0 7.025.0 8.432.0 14.640.0 14.150.0 14.163.0 13.980.0 14.0
100.0 13.9130.0 15.2160.0 17.2200.0 21.0250.0 22.0
Resistivity Depth
(Ohm.m) (m)50 1.5 Dry top superficial layer Dry.
1.2 3.2 Moist to dry volcanic soils Moist18 180 Compact tuffs No aquifers expected in this layer.
100 >180 Highly weathered and fractured tuffs and trachytes Deep aquifers expected in this layer
Vertical Electric Sounding Datasheet (Schlumberger)
Geological Interpretation Hydrogeological Interpretation
Curva de Resistividad Aparente
1
10
100
1000
1 10 100 1000AB/2 (m)
Res
istivi
dad
Apa
rent
e ( O
hm-m
)
(App
aren
t) R
esis
tivity
[Ohm
-m]
Depth (AB/2) [m]
Apparent Resistivity Data
Theoretical Apparent Resistivity Curve
Resistivity Layered Structure Model
District Marigat Division MochongoiLocation Mochongoi Site No. V-89
Site Name MCHONGOI CENTRE Elevation 221937N UTM-E 187629 UTM-N 33681
Latitude 0.304333 Longitude 36.193889
AB/2(m)
Rho-a(Wm)
1.6 442.12.0 526.32.5 518.93.2 431.44.0 422.25.0 395.26.3 364.68.0 309.0
10.0 217.513.0 132.516.0 74.220.0 62.025.0 52.332.0 49.640.0 46.050.0 48.063.0 48.080.0 50.5
100.0 54.3130.0 61.4160.0 81.2200.0 99.3
Resistivity Depth
(Ohm.m) (m)332 0.4 Dry top superficial layer Dry. 544 4 Dry volcanic soils Dry
46 100 Highly weathered and fractured trachytes Aquifers expected in this layer500 >100 Compact basalts Deep aquifers expected in this layer
Vertical Electric Sounding Datasheet (Schlumberger)
Geological Interpretation Hydrogeological Interpretation
Curva de Resistividad Aparente
1
10
100
1000
1 10 100 1000AB/2 (m)
Res
istivi
dad
Apa
rent
e ( O
hm-m
)
(App
aren
t) R
esis
tivity
[Ohm
-m]
Depth (AB/2) [m]
Apparent Resistivity Data
Theoretical Apparent Resistivity Curve
Resistivity Layered Structure Model

District Marigat Division MochongoiLocation Mochongoi Site No. V-92
Site Name KIPKANDULE Elevation 225137N UTM-E 189380 UTM-N 31397
Latitude 0.283639 Longitude 36.209611
AB/2(m)
Rho-a(Wm)
1.6 148.82.0 146.02.5 144.23.2 146.64.0 130.75.0 128.56.3 99.28.0 83.2
10.0 66.713.0 60.416.0 58.620.0 48.925.0 44.132.0 45.440.0 45.250.0 46.863.0 53.080.0 54.1
100.0 64.1130.0 72.4160.0 76.4200.0 83.0250.0 82.7
Resistivity Depth
(Ohm.m) (m)153 3.3 Dry top superficial layer Dry.
43 54 Moist to dry volcanic soils Moist200 150 Compact tuffs No aquifers expected in this layer.
20 >150 Highly weathered and fractured tuffs and trachytes Deep aquifers expected in this layer
Vertical Electric Sounding Datasheet (Schlumberger)
Geological Interpretation Hydrogeological Interpretation
Curva de Resistividad Aparente
1
10
100
1000
1 10 100 1000AB/2 (m)
Resi
stiv
idad
Apa
rente
(O
hm
-m
)
(App
aren
t) R
esis
tivity
[Ohm
-m]
Depth (AB/2) [m]
Apparent Resistivity Data
Theoretical Apparent Resistivity Curve
Resistivity Layered Structure Model
District Marigat Division MochongoiLocation Chebinyiny Site No. V-94
Site Name SAMBAKA Elevation 98537N UTM-E 183733 UTM-N 33303
Latitude 0.300917 Longitude 36.158944
AB/2(m)
Rho-a(Wm)
1.6 23.62.0 20.52.5 14.93.2 13.74.0 11.65.0 11.06.3 8.98.0 8.6
10.0 8.113.0 7.816.0 7.320.0 6.625.0 5.932.0 5.840.0 4.750.0 4.663.0 5.080.0 6.1
100.0 7.6130.0 12.0160.0 14.1200.0 15.6250.0 16.4
Resistivity Depth
(Ohm.m) (m)30 1 Dry top superficial layer Dry.
8 16 Dry volcanic soils Dry1 27 Loose volcanic soils No aquifers expected in this layer
646 85 Compact trachytes and tuffs No aquifers expected in this layer20 250 Highly weathered and fractured tuffs and trachytes Aquiferous
152 >250 Slightly weathered and fractured trachytes Not aquiferous
Vertical Electric Sounding Datasheet (Schlumberger)
Geological Interpretation Hydrogeological Interpretation
Curva de Resistividad Aparente
1
10
100
1000
1 10 100 1000AB/2 (m)
Resi
stiv
idad
Apa
rente
(O
hm
-m
)
(App
aren
t) R
esis
tivity
[Ohm
-m]
Depth (AB/2) [m]
Apparent Resistivity Data
Theoretical Apparent Resistivity Curve
Resistivity Layered Structure Model
District Marigat Division MochongoiLocation Arabal Site No. V-96
Site Name SOKONIN Elevation 98237N UTM-E 191702 UTM-N 59303
Latitude 0.535917 Longitude 36.230361
AB/2(m)
Rho-a(Wm)
1.6 136.72.0 102.82.5 88.23.2 82.34.0 81.05.0 82.96.3 91.98.0 98.2
10.0 93.613.0 84.216.0 76.020.0 72.325.0 74.032.0 89.540.0 91.550.0 93.563.0 91.780.0 91.3
100.0 70.9130.0 51.3160.0 37.2200.0 32.3250.0 31.1
Resistivity Depth
(Ohm.m) (m)444 0.5 Exposed trachytes Dry.
60 2.2 Loose volcanic soils Dry165 4.5 Dry volcanic soils Dry
41 9 Slightly weathered and fractured tuffs Shallow aquifer expected109 56 Compact trachytes and tuffs Dry
20 >56 Highly weathered trachytes Aquiferous
Vertical Electric Sounding Datasheet (Schlumberger)
Geological Interpretation Hydrogeological Interpretation
Curva de Resistividad Aparente
1
10
100
1000
1 10 100 1000AB/2 (m)
Resi
stiv
idad
Apa
rente
(O
hm
-m
)
(App
aren
t) R
esis
tivity
[Ohm
-m]
Depth (AB/2) [m]
Apparent Resistivity Data
Theoretical Apparent Resistivity Curve
Resistivity Layered Structure Model
District Marigat Division MochongoiLocation Arabal Site No. V-97
Site Name PARTALO Elevation 111037N UTM-E 182477 UTM-N 59043
Latitude 0.533500 Longitude 36.147556
AB/2(m)
Rho-a(Wm)
1.6 9.62.0 10.32.5 11.33.2 11.94.0 10.25.0 8.56.3 8.28.0 9.1
10.0 11.513.0 13.016.0 15.220.0 16.925.0 19.032.0 25.240.0 27.950.0 32.163.0 35.280.0 38.3
100.0 45.0130.0 56.0160.0 67.0200.0 78.0250.0 85.0
Resistivity Depth
(Ohm.m) (m)4.8 0.4 Dry top superficial layer Dry. 29 1.2 Dry volcanic soils Dry
3 3.2 Loose volcanic soils Dry51 80 Highly weathered and fractured trachytes Shallow aquifer expected
434 >80 Compact trachytes Deep aquifer expected
Vertical Electric Sounding Datasheet (Schlumberger)
Geological Interpretation Hydrogeological Interpretation
Curva de Resistividad Aparente
1
10
100
1000
1 10 100 1000AB/2 (m)
Res
istivi
dad
Apa
rent
e ( O
hm-m
)
(App
aren
t) R
esis
tivity
[Ohm
-m]
Depth (AB/2) [m]
Apparent Resistivity Data
Theoretical Apparent Resistivity Curve
Resistivity Layered Structure Model

District Marigat Division MochongoiLocation Arabal Site No. V-98
Site Name MENMENO Elevation 133337N UTM-E 189076 UTM-N 51048
Latitude 0.461306 Longitude 36.206833
AB/2(m)
Rho-a(Wm)
1.6 73.42.0 70.82.5 70.13.2 71.94.0 76.05.0 69.46.3 62.58.0 61.8
10.0 50.013.0 42.016.0 37.020.0 30.425.0 25.332.0 23.540.0 15.850.0 12.363.0 9.580.0 7.0
100.0 5.8130.0 5.1160.0 4.1200.0 4.2250.0 5.0
Resistivity Depth
(Ohm.m) (m)73 5.7 Dry top superficial layer Dry. 22 28 Moist to dry volcanic soils Moist
3.5 200 Highly weathered and fractured tuffs Major aquifers expected in this layer. 50 >200 Slightly weathered and fractured tuffs and
trachytesDeep aquifers expected in this layer
Vertical Electric Sounding Datasheet (Schlumberger)
Geological Interpretation Hydrogeological Interpretation
Curva de Resistividad Aparente
1
10
100
1000
1 10 100 1000AB/2 (m)
Res
istivi
dad
Apa
rent
e ( O
hm-m
)
(App
aren
t) R
esis
tivity
[Ohm
-m]
Depth (AB/2) [m]
Apparent Resistivity Data
Theoretical Apparent Resistivity Curve
Resistivity Layered Structure Model
District Baringo Division SalawaLocation Lelmen Site No. V-101
Site Name KAPTARA Elevation 109336N UTM-E 794804 UTM-N 60861
Latitude 0.550028 Longitude 35.648500
AB/2(m)
Rho-a(Wm)
1.6 211.32.0 144.92.5 92.93.2 67.24.0 46.75.0 46.06.3 25.08.0 17.0
10.0 15.813.0 15.816.0 16.520.0 18.625.0 18.932.0 21.340.0 19.850.0 20.363.0 21.180.0 22.6
100.0 25.8130.0 29.8160.0 31.0200.0 30.9250.0 27.4
Resistivity Depth
(Ohm.m) (m)1138 0.5 Exposed trachytes Dry.
95 2.2 Dry volcanic soils Dry13 10 Moist to dry volcanic soils Moist23 53 Slightly weathered and fractured phonolites Aquiferous layer45 150 Fractured and weathered basalts Aquiferous.15 >150 Highly fractured and weathered basalts and old
surface layerDeep aquifer expected in this layer
Vertical Electric Sounding Datasheet (Schlumberger)
Geological Interpretation Hydrogeological Interpretation
Curva de Resistividad Aparente
1
10
100
1000
1 10 100 1000AB/2 (m)
Res
istivi
dad
Apa
rent
e ( O
hm-m
)
(App
aren
t) R
esis
tivity
[Ohm
-m]
Depth (AB/2) [m]
Apparent Resistivity Data
Theoretical Apparent Resistivity Curve
Resistivity Layered Structure Model
District Baringo Division SalawaLocation Lelmen Site No. V-103-1
Site Name KAKWANE Elevation 110436N UTM-E 791863 UTM-N 57313
Latitude 0.517972 Longitude 35.622083
AB/2(m)
Rho-a(Wm)
1.6 53.572.0 39.292.5 32.433.2 25.524.0 20.695.0 18.676.3 16.178.0 14.1
10.0 13.0513.0 13.2516.0 13.2520.0 12.7325.0 13.7232.0 17.3940.0 17.450.0 18.3263.0 18.2980.0 20.79
100.0 19.91130.0 20.79160.0 21.78200.0 23.08250.0 24.88
Resistivity Depth
(Ohm.m) (m)60 0 -1.1 Dry top superficial layer and fractured trachytes. Dry. No aquifers 13 1.1-16 Slightly weathered and fractured trachyphonolites No aquifers22 16-231 Medium to coarse grained sediments, pyroclastics &
basaltsAquiferous layer
90 >231 Highly weathered and fractured basalts rocks. Aquiferous
Vertical Electric Sounding Datasheet (Schlumberger)
Geological Interpretation Hydrogeological Interpretation
Curva de Resistividad Aparente
1
10
100
1000
1 10 100 1000AB/2 (m)
Res
istivi
dad
Apa
rent
e ( O
hm-m
)
(App
aren
t) R
esis
tivity
[Ohm
-m]
Depth (AB/2) [m]
Apparent Resistivity Data
Theoretical Apparent Resistivity Curve
Resistivity Layered Structure Model
District Baringo Division SalawaLocation Lelmen Site No. V-103-2
Site Name KAKWANE Elevation 111736N UTM-E 792561 UTM-N 57498
Latitude 0.519639 Longitude 35.628361
AB/2(m)
Rho-a(Wm)
1.6 28.892.0 24.992.5 21.993.2 20.984.0 19.95.0 19.996.3 19.728.0 20.2
10.0 20.2813.0 20.4616.0 21.7620.0 22.1825.0 24.8932.0 30.9740.0 37.8950.0 41.863.0 40.9880.0 42.9
100.0 44.91130.0 49.74160.0 54.8200.0 56.69250.0 59.94
Resistivity Depth
(Ohm.m) (m)54 0 -0.54 Thin dry top superficial layer Dry. No aquifers 19 0.54-15 Slightly weathered and fractured trachyphonolites Moist. 85 15-32 Dry sediments, pyroclastics No aquifers layer46 32-118 Coarse sediments/highly weathered pyroclastics/ basalts Aquiferous
100 >118 Weathered basalt Aquiferous
Vertical Electric Sounding Datasheet (Schlumberger)
Geological Interpretation Hydrogeological Interpretation
Curva de Resistividad Aparente
1
10
100
1000
1 10 100 1000AB/2 (m)
Res
istivi
dad
Apa
rent
e ( O
hm-m
)
(App
aren
t) R
esis
tivity
[Ohm
-m]
Depth (AB/2) [m]
Apparent Resistivity Data
Theoretical Apparent Resistivity Curve
Resistivity Layered Structure Model
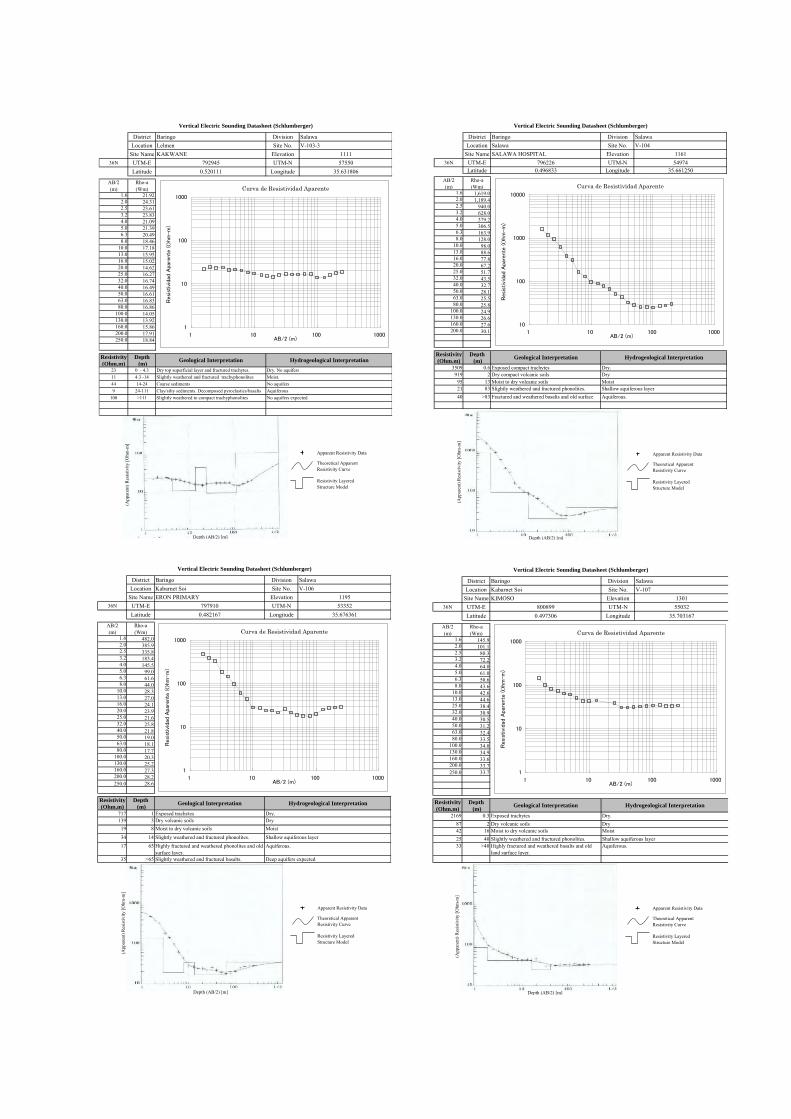
District Baringo Division SalawaLocation Lelmen Site No. V-103-3
Site Name KAKWANE Elevation 111136N UTM-E 792945 UTM-N 57550
Latitude 0.520111 Longitude 35.631806
AB/2(m)
Rho-a(Wm)
1.6 21.922.0 24.312.5 23.613.2 23.834.0 21.095.0 21.396.3 20.498.0 18.46
10.0 17.1813.0 15.9516.0 15.0220.0 14.6225.0 16.2732.0 16.7440.0 16.4950.0 16.6163.0 16.8380.0 16.86
100.0 14.05130.0 13.92160.0 15.86200.0 17.91250.0 18.84
Resistivity Depth
(Ohm.m) (m)23 0 - 4.3 Dry top superficial layer and fractured trachytes. Dry. No aquifers11 4.3 -14 Slightly weathered and fractured trachyphonolites Moist. 44 14-24 Coarse sediments No aquifers9 24-111 Clay/silty sediments. Decomposed pyroclastics/basalts Aquiferous
100 >111 Slightly weathered to compact trachyphonolites No aquifers expected
Vertical Electric Sounding Datasheet (Schlumberger)
Geological Interpretation Hydrogeological Interpretation
Curva de Resistividad Aparente
1
10
100
1000
1 10 100 1000AB/2 (m)
Resi
stiv
idad
Apa
rente
(O
hm
-m
)
(App
aren
t) R
esis
tivity
[Ohm
-m]
Depth (AB/2) [m]
Apparent Resistivity Data
Theoretical Apparent Resistivity Curve
Resistivity Layered Structure Model
District Baringo Division SalawaLocation Salawa Site No. V-104
Site Name SALAWA HOSPITAL Elevation 116136N UTM-E 796226 UTM-N 54974
Latitude 0.496833 Longitude 35.661250AB/2(m)
Rho-a(Wm)
1.6 1,619.0 2.0 1,189.4 2.5 940.0 3.2 628.0 4.0 379.2 5.0 306.5 6.3 163.9 8.0 128.0 10.0 98.0 13.0 88.6 16.0 77.8 20.0 67.2 25.0 51.7 32.0 43.5 40.0 32.7 50.0 28.1 63.0 25.5 80.0 25.8 100.0 24.9 130.0 26.6 160.0 27.6 200.0 30.1
Resistivity Depth
(Ohm.m) (m)3509 0.6 Exposed compact trachytes Dry.
919 2 Dry compact volcanic soils Dry95 13 Moist to dry volcanic soils Moist21 83 Slightly weathered and fractured phonolites. Shallow aquiferous layer40 >83 Fractured and weathered basalts and old surface
layer.Aquiferous.
Vertical Electric Sounding Datasheet (Schlumberger)
Geological Interpretation Hydrogeological Interpretation
Curva de Resistividad Aparente
10
100
1000
10000
1 10 100 1000AB/2 (m)
Res
istivi
dad
Apa
rent
e ( O
hm-m
)
(App
aren
t) R
esis
tivity
[Ohm
-m]
Depth (AB/2) [m]
Apparent Resistivity Data
Theoretical Apparent Resistivity Curve
Resistivity Layered Structure Model
District Baringo Division SalawaLocation Kabarnet Soi Site No. V-106
Site Name ERON PRIMARY Elevation 119536N UTM-E 797910 UTM-N 53352
Latitude 0.482167 Longitude 35.676361
AB/2(m)
Rho-a(Wm)
1.6 482.0 2.0 385.9 2.5 335.8 3.2 183.4 4.0 145.5 5.0 99.0 6.3 61.6 8.0 44.0 10.0 28.3 13.0 27.0 16.0 24.1 20.0 23.9 25.0 21.6 32.0 25.8 40.0 21.8 50.0 19.0 63.0 18.1 80.0 17.7 100.0 20.3 130.0 25.2 160.0 27.3 200.0 28.2 250.0 28.6
Resistivity Depth
(Ohm.m) (m)717 1 Exposed trachytes Dry. 139 3 Dry volcanic soils Dry
19 8 Moist to dry volcanic soils Moist34 14 Slightly weathered and fractured phonolites. Shallow aquiferous layer17 65 Highly fractured and weathered phonolites and old
surface layer.Aquiferous.
35 >65 Slightly weathered and fractured basalts. Deep aquifers expected
Vertical Electric Sounding Datasheet (Schlumberger)
Geological Interpretation Hydrogeological Interpretation
Curva de Resistividad Aparente
1
10
100
1000
1 10 100 1000AB/2 (m)
Resi
stiv
idad
Apa
rente
(O
hm
-m
)
(App
aren
t) R
esis
tivity
[Ohm
-m]
Depth (AB/2) [m]
Apparent Resistivity Data
Theoretical Apparent Resistivity Curve
Resistivity Layered Structure Model
District Baringo Division SalawaLocation Kabarnet Soi Site No. V-107
Site Name KIMOSO Elevation 130136N UTM-E 800899 UTM-N 55032
Latitude 0.497306 Longitude 35.703167
AB/2(m)
Rho-a(Wm)
1.6 145.9 2.0 101.1 2.5 80.3 3.2 72.2 4.0 64.0 5.0 61.0 6.3 50.6 8.0 43.6 10.0 42.6 13.0 44.6 25.0 38.4 32.0 30.9 40.0 30.5 50.0 31.2 63.0 32.4 80.0 33.5 100.0 34.0 130.0 34.9 160.0 33.6 200.0 33.7 250.0 33.7
Resistivity Depth
(Ohm.m) (m)2169 0.3 Exposed trachytes Dry.
87 2 Dry volcanic soils Dry42 16 Moist to dry volcanic soils Moist25 40 Slightly weathered and fractured phonolites. Shallow aquiferous layer33 >40 Highly fractured and weathered basalts and old
land surface layer.Aquiferous.
Vertical Electric Sounding Datasheet (Schlumberger)
Geological Interpretation Hydrogeological Interpretation
Curva de Resistividad Aparente
1
10
100
1000
1 10 100 1000AB/2 (m)
Res
istivi
dad
Apa
rent
e ( O
hm-m
)
(App
aren
t) R
esis
tivity
[Ohm
-m]
Depth (AB/2) [m]
Apparent Resistivity Data
Theoretical Apparent Resistivity Curve
Resistivity Layered Structure Model

District Baringo Division SalawaLocation Kiboino Site No. V-109
Site Name OINOBMOI Elevation 125736N UTM-E 796835 UTM-N 51058
Latitude 0.461417 Longitude 35.666694
AB/2(m)
Rho-a(Wm)
1.6 60.2 2.0 70.3 2.5 85.6 3.2 98.1 4.0 111.0 5.0 130.0 6.3 129.4 8.0 122.6 10.0 110.0 13.0 100.0 16.0 90.0 20.0 81.1 25.0 86.4 32.0 75.9 40.0 73.8 50.0 90.7 63.0 103.4 80.0 108.1 100.0 112.8 130.0 125.3 160.0 150.4 200.0 188.0
Resistivity Depth
(Ohm.m) (m)21 0.5 Dry top superficial layer Dry.
566 1.6 Dry volcanic soils Dry51 16 Slightly weathered trachytes Dry
131 125 Highly weathered and fractured tuffs and trachytes Shallow aquifer expected3676 >125 Fresh compact trachytes No aquifers expected
Vertical Electric Sounding Datasheet (Schlumberger)
Geological Interpretation Hydrogeological Interpretation
Curva de Resistividad Aparente
1
10
100
1000
1 10 100 1000AB/2 (m)
Res
istivi
dad
Apa
rent
e ( O
hm-m
)
(App
aren
t) R
esis
tivity
[Ohm
-m]
Depth (AB/2) [m]
Apparent Resistivity Data
Theoretical Apparent Resistivity Curve
Resistivity Layered Structure Model
District Baringo Division SalawaLocation Kiboino Site No. HEP-110-1
Site Name KAPSIKORYAN Elevation 1676Start Point Latitude 0.486917 Longitude 35.706639End Point Latitude 0.486778 Longitude 35.708111
Distance(m)
Rho-a(Wm)
0 151.5710 144.5320 145.6630 157.2340 196.5650 179.0960 179.870 150.0880 136.990 159.9
100 110.47110 114.62120 191.66130 133.59140 123.29150 138.73160 161.78170 140.08180 171.98190 208.9200 222.72
Location Kiboino Site No. HEP-110-1Site Name KAPSIKORYAN Elevation 1678
Start Point Latitude 0.486306 Elevation 35.71108333End Point Latitude 0.485972 Longitude 35.712139
Distance(m)
Rho-a(Wm)
0 88.9810 76.6620 73.5230 91.8740 72.9850 55.6760 60.4570 73.8980 88.6190 97.5
100 103.72110 95.1120 78.29130 73.41140 98.45150 117.89160 133.91170 127.96180 124.41190 132.82200 155.88
Horizontal Electric Profiling Datasheet (Wenner)
Curva de Resistividad Aparente
0
20
40
60
80
100
120
140
160
180
200
220
240
260
280
300
0 50 100 150 200 250Distance (m)
Res
istivi
dad
Apa
rent
e ( O
hm-m
)
Curva de Resistividad Aparente
0
20
40
60
80
100
120
140
160
180
200
0 50 100 150 200 250Distance (m)
Res
istivi
dad
Apa
rent
e ( O
hm-m
)
V-110-1
District Baringo Division SalawaLocation Kiboino Site No. V-110-1
Site Name KAPSIKORYAN Elevation 168236N UTM-E 801371 UTM-N 53867
Latitude 0.486806 Longitude 35.707417
AB/2(m)
Rho-a(Wm)
1.6 72.62.0 85.22.5 96.883.2 109.94.0 88.655.0 88.686.3 88.788.0 100.4
10.0 112.813.0 146.2816.0 199.1420.0 250.3625.0 279.1232.0 290.0840.0 259.8550.0 150.0763.0 139.8680.0 137.94
100.0 135.42130.0 139.45160.0 170.51200.0 231.11250.0 312.83
Resistivity Depth
(Ohm.m) (m)32 0 -0.3 Dry top superficial layer Dry. No aquifers
177 0.3-1.1 Slightly weathered trachyphonolites Dry. No aquifer30 1.1 – 2.4 Highly weathered trachyphonolites No aquifer
729 2.4 – 8.3 Compact hard trachyphonolites No aquifer
120 8.3 - 130 Slightly weathered/ fractured trachyphonolites Aquifer10000 >130 Compact fresh trachyphonolites No aquifer
Vertical Electric Sounding Datasheet (Schlumberger)
Geological Interpretation Hydrogeological Interpretation
Curva de Resistividad Aparente
1
10
100
1000
1 10 100 1000AB/2 (m)
Res
istivi
dad
Apa
rent
e ( O
hm-m
)
(App
aren
t) R
esis
tivity
[Ohm
-m]
Depth (AB/2) [m]
Apparent Resistivity Data
Theoretical Apparent Resistivity Curve
Resistivity Layered Structure Model
District Baringo Division SalawaLocation Kiboino Site No. V-110-2
Site Name KAPSIKORYAN Elevation36N UTM-E 801822 UTM-N 53783
Latitude 0.486056 Longitude 35.711472
AB/2(m)
Rho-a(Wm)
1.6 272.252 187.85
2.5 121.073.2 112.72
4 81.875 69.24
6.3 76.888 83.6
10 108.2913 160.5916 189.520 302.425 401.832 611.840 57850 727.1363 868.280 1046.7
100 1022.8130 1211.6160 1312.2200 1130.12
Resistivity Depth
(Ohm.m) (m)392 0 - 1 Dry top superficial layer Dry. No aquifers 24 1 – 2.7 Slightly weathered trachyphonolites Moist.
5437 2.7 - 80 Compact hard trachyphonolites No aquifer79 >80 Highly weathered/fractured trachyphonolites Aquiferous layer
Vertical Electric Sounding Datasheet (Schlumberger)
Geological Interpretation Hydrogeological Interpretation
Curva de Resistividad Aparente
10
100
1000
10000
1 10 100 1000AB/2 (m)
Resi
stiv
idad
Apa
rente
(O
hm
-m
)
(App
aren
t) R
esis
tivity
[Ohm
-m]
Depth (AB/2) [m]
Apparent Resistivity Data
Theoretical Apparent Resistivity Curve
Resistivity Layered Structure Model

District Baringo Division SalawaLocation Kiboino Site No. V-111
Site Name KOROMBOPSOO Elevation 125836N UTM-E 799674 UTM-N 46946
Latitude 0.424250 Longitude 35.692167
AB/2(m)
Rho-a(Wm)
1.6 94.7 2.0 95.1 2.5 90.4 3.2 82.9 4.0 83.2 5.0 80.5 6.3 75.0 8.0 72.8 10.0 70.7 13.0 67.4 16.0 59.4 20.0 62.0 25.0 55.0 32.0 52.3 40.0 49.2 50.0 47.0 63.0 50.2 80.0 53.9 100.0 61.7 130.0 67.8 160.0 79.0 200.0 92.7 250.0 109.4
Resistivity Depth
(Ohm.m) (m)88 5.3 Dry top superficial layer Dry. 47 88 Slightly weathered phonolites Shallow aquiferous layer
431 >88 Compact basalts No aquifers expected in this layer.
Vertical Electric Sounding Datasheet (Schlumberger)
Geological Interpretation Hydrogeological Interpretation
Curva de Resistividad Aparente
1
10
100
1000
1 10 100 1000AB/2 (m)
Res
istivi
dad
Apa
rent
e ( O
hm-m
)
(App
aren
t) R
esis
tivity
[Ohm
-m]
Depth (AB/2) [m]
Apparent Resistivity Data
Theoretical Apparent Resistivity Curve
Resistivity Layered Structure Model
District Baringo Division SalawaLocation Kiboino Site No. V-112
Site Name SIRUNDI PRIMARY SCHOOL Elevation36N UTM-E 801275 UTM-N 51958
Latitude 0.469556 Longitude 35.706556
AB/2(m)
Rho-a(Wm)
1.6 100.0 2.0 110.0 2.5 109.2 3.2 120.2 4.0 131.0 5.0 140.0 6.3 130.0 8.0 120.0 10.0 100.0 13.0 80.0 16.0 75.0 20.0 70.0 25.0 71.0 32.0 90.0 40.0 102.3 50.0 121.3 63.0 140.1 80.0 161.0 100.0 198.9 130.0 207.4 160.0 246.3 200.0 265.2
Resistivity Depth
(Ohm.m) (m)91 1.7 Dry top superficial layer Dry.
1244 2.2 Compact phonolitic rocks Dry12 6 Moist loose volcanic soils Dry
418 50 Slightly weathered trachytes Shallow aquifer expected218 120 Highly weathered and fractured tuffs and trachytes Deep aquifer expected
1000 >120 Compact basalts Not aquiferous
Vertical Electric Sounding Datasheet (Schlumberger)
Geological Interpretation Hydrogeological Interpretation
Curva de Resistividad Aparente
1
10
100
1000
1 10 100 1000AB/2 (m)
Res
istivi
dad
Apa
rent
e ( O
hm-m
)
(App
aren
t) R
esis
tivity
[Ohm
-m]
Depth (AB/2) [m]
Apparent Resistivity Data
Theoretical Apparent Resistivity Curve
Resistivity Layered Structure Model
District Baringo Division SalawaLocation Kapropita Soi Site No. V-114
Site Name SICHET PRIMARY Elevation 121736N UTM-E 803658 UTM-N 45280
Latitude 0.402889 Longitude 35.727917
AB/2(m)
Rho-a(Wm)
1.6 53.3 2.0 55.2 2.5 61.2 3.2 87.1 4.0 83.9 5.0 96.4 6.3 110.6 8.0 128.0 10.0 140.0 13.0 151.0 16.0 149.0 20.0 142.0 25.0 123.0 32.0 103.0 40.0 82.4 50.0 63.1 63.0 57.4 80.0 66.1 100.0 77.8 130.0 97.8 160.0 117.1 200.0 147.0
Resistivity Depth
(Ohm.m) (m)45 1.6 Dry top superficial layer Dry.
326 7 Dry volcanic soils Dry46 70 Highly weathered and fractured tuffs and trachytes Shallow aquifer expected
5000 >70 Compact trachytes Not aquiferous
Vertical Electric Sounding Datasheet (Schlumberger)
Geological Interpretation Hydrogeological Interpretation
Curva de Resistividad Aparente
1
10
100
1000
1 10 100 1000AB/2 (m)
Res
istivi
dad
Apa
rent
e ( O
hm-m
)
(App
aren
t) R
esis
tivity
[Ohm
-m]
Depth (AB/2) [m]
Apparent Resistivity Data
Theoretical Apparent Resistivity Curve
Resistivity Layered Structure Model
District Baringo Division SalawaLocation Kapropita Soi Site No. V-115
Site Name KIKOK SOSPEI CHURCH Elevation36N UTM-E 801291 UTM-N 44592
Latitude 0.402972 Longitude 35.706639
AB/2(m)
Rho-a(Wm)
1.6 101.3 2.0 102.8 2.5 103.2 3.2 99.9 4.0 112.8 5.0 88.1 6.3 108.8 8.0 118.0 10.0 114.0 13.0 107.0 16.0 102.0 20.0 74.5 25.0 60.5 32.0 46.0 40.0 32.2 50.0 26.2 63.0 22.2 80.0 19.2 100.0 17.0 130.0 17.4 160.0 20.1 200.0 26.1 250.0 32.2
Resistivity Depth
(Ohm.m) (m)
107 13 Dry top superficial layer Dry. 15 129 Highly weathered and fractured tuffs and trachytes Aquifer expected in this layer
500 >129 Compact trachytes Not aquiferous
Vertical Electric Sounding Datasheet (Schlumberger)
Geological Interpretation Hydrogeological Interpretation
Curva de Resistividad Aparente
1
10
100
1000
1 10 100 1000AB/2 (m)
Res
istivi
dad
Apa
rent
e ( O
hm-m
)
(App
aren
t) R
esis
tivity
[Ohm
-m]
Depth (AB/2) [m]
Apparent Resistivity Data
Theoretical Apparent Resistivity Curve
Resistivity Layered Structure Model
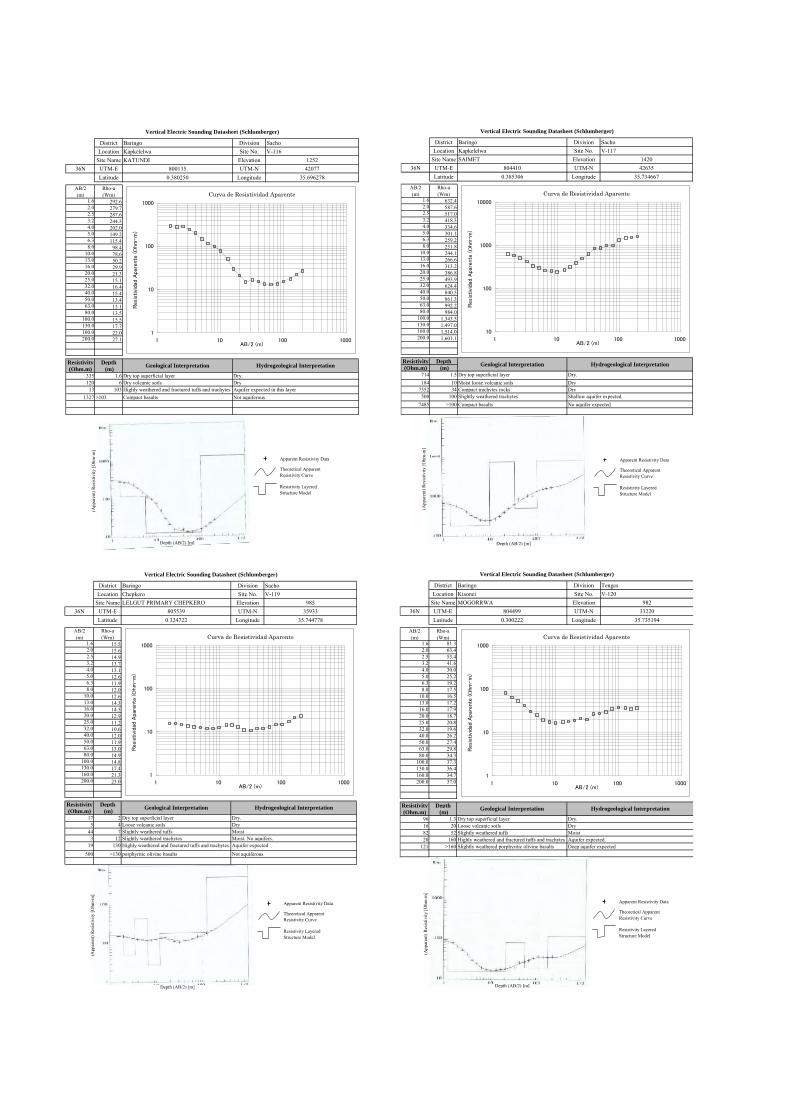
District Baringo Division SachoLocation Kapkelelwa Site No. V-116
Site Name KATUNDI Elevation 125236N UTM-E 800135 UTM-N 42077
Latitude 0.380250 Longitude 35.696278
AB/2(m)
Rho-a(Wm)
1.6 292.6 2.0 279.7 2.5 287.6 3.2 244.3 4.0 202.0 5.0 149.2 6.3 115.4 8.0 98.4 10.0 78.6 13.0 50.2 16.0 29.9 20.0 21.3 25.0 15.1 32.0 16.4 40.0 15.4 50.0 13.4 63.0 13.1 80.0 13.5 100.0 15.5 130.0 17.7 160.0 22.0 200.0 27.1
Resistivity Depth
(Ohm.m) (m)335 1.6 Dry top superficial layer Dry. 120 6 Dry volcanic soils Dry
13 103 Highly weathered and fractured tuffs and trachytes Aquifer expected in this layer1327 >103 Compact basalts Not aquiferous
Vertical Electric Sounding Datasheet (Schlumberger)
Geological Interpretation Hydrogeological Interpretation
Curva de Resistividad Aparente
1
10
100
1000
1 10 100 1000AB/2 (m)
Res
istivi
dad
Apa
rent
e ( O
hm-m
)
(App
aren
t) R
esis
tivity
[Ohm
-m]
Depth (AB/2) [m]
Apparent Resistivity Data
Theoretical Apparent Resistivity Curve
Resistivity Layered Structure Model
District Baringo Division SachoLocation Kapkelelwa Site No. V-117
Site Name SAIMET Elevation 142036N UTM-E 804410 UTM-N 42635
Latitude 0.385306 Longitude 35.734667
AB/2(m)
Rho-a(Wm)
1.6 632.4 2.0 587.6 2.5 517.0 3.2 418.3 4.0 334.6 5.0 301.1 6.3 259.2 8.0 251.8 10.0 244.1 13.0 266.6 16.0 313.2 20.0 386.8 25.0 493.9 32.0 624.4 40.0 840.5 50.0 861.3 63.0 992.2 80.0 984.0 100.0 1,343.5 130.0 1,497.0 160.0 1,514.0 200.0 1,601.1
Resistivity Depth
(Ohm.m) (m)714 1.5 Dry top superficial layer Dry. 184 10 Moist loose volcanic soils Dry
7352 34 Compact trachytes rocks Dry500 100 Slightly weathered trachytes Shallow aquifer expected
7485 >100 Compact basalts No aquifer expected
Vertical Electric Sounding Datasheet (Schlumberger)
Geological Interpretation Hydrogeological Interpretation
Curva de Resistividad Aparente
10
100
1000
10000
1 10 100 1000AB/2 (m)
Resi
stiv
idad
Apa
rente
(O
hm
-m
)
(App
aren
t) R
esis
tivity
[Ohm
-m]
Depth (AB/2) [m]
Apparent Resistivity Data
Theoretical Apparent Resistivity Curve
Resistivity Layered Structure Model
District Baringo Division SachoLocation Chepkero Site No. V-119
Site Name LELGUT PRIMARY CHEPKERO Elevation 98536N UTM-E 805539 UTM-N 35933
Latitude 0.324722 Longitude 35.744778
AB/2(m)
Rho-a(Wm)
1.6 15.5 2.0 15.6 2.5 14.9 3.2 13.7 4.0 13.1 5.0 12.6 6.3 11.9 8.0 12.0 10.0 12.6 13.0 14.3 16.0 14.5 20.0 12.9 25.0 11.2 32.0 10.6 40.0 12.0 50.0 11.9 63.0 13.0 80.0 14.9 100.0 14.8 130.0 17.4 160.0 21.3 200.0 23.0
Resistivity Depth
(Ohm.m) (m)17 2 Dry top superficial layer Dry.
5 4 Loose volcanic soils Dry44 7 Slightly weathered tuffs Moist
3 12 Slightly weathered trachytes Moist. No aquifers.19 130 Highly weathered and fractured tuffs and trachytes Aquifer expected
500 >130 porphyritic olivine basalts Not aquiferous
Vertical Electric Sounding Datasheet (Schlumberger)
Geological Interpretation Hydrogeological Interpretation
Curva de Resistividad Aparente
1
10
100
1000
1 10 100 1000AB/2 (m)
Resi
stiv
idad
Apa
rente
(O
hm
-m
)
(App
aren
t) R
esis
tivity
[Ohm
-m]
Depth (AB/2) [m]
Apparent Resistivity Data
Theoretical Apparent Resistivity Curve
Resistivity Layered Structure Model
District Baringo Division TengesLocation Kisonei Site No. V-120
Site Name MOGORRWA Elevation 98236N UTM-E 804499 UTM-N 33220
Latitude 0.300222 Longitude 35.735194
AB/2(m)
Rho-a(Wm)
1.6 81.3 2.0 63.4 2.5 53.4 3.2 41.6 4.0 30.0 5.0 25.2 6.3 19.2 8.0 17.5 10.0 16.5 13.0 17.2 16.0 17.9 20.0 18.7 25.0 20.8 32.0 19.6 40.0 26.2 50.0 27.4 63.0 29.8 80.0 34.3 100.0 37.3 130.0 36.4 160.0 34.7 200.0 37.0
Resistivity Depth
(Ohm.m) (m)96 1.3 Dry top superficial layer Dry. 16 20 Loose volcanic soils Dry82 52 Slightly weathered tuffs Moist20 160 Highly weathered and fractured tuffs and trachytes Aquifer expected.
121 >160 Slightly weathered porphyritic olivine basalts Deep aquifer expected
Vertical Electric Sounding Datasheet (Schlumberger)
Geological Interpretation Hydrogeological Interpretation
Curva de Resistividad Aparente
1
10
100
1000
1 10 100 1000AB/2 (m)
Resi
stiv
idad
Apa
rente
(O
hm
-m
)
(App
aren
t) R
esis
tivity
[Ohm
-m]
Depth (AB/2) [m]
Apparent Resistivity Data
Theoretical Apparent Resistivity Curve
Resistivity Layered Structure Model

District Baringo Division TengesLocation Kisonei Site No. V-121
Site Name KISONEI PRIMARY Elevation 159736N UTM-E 802659 UTM-N 28270
Latitude 0.255472 Longitude 35.718972
AB/2(m)
Rho-a(Wm)
1.6 54.0 2.0 40.4 2.5 28.9 3.2 25.4 4.0 24.5 5.0 23.3 6.3 22.7 8.0 24.2 10.0 26.1 13.0 28.3 16.0 29.0 20.0 30.2 25.0 33.5 32.0 32.2 40.0 33.4 50.0 33.3 63.0 34.4 80.0 36.7 100.0 33.7 130.0 36.7 160.0 42.6 200.0 54.1
Resistivity Depth
(Ohm.m) (m)154 0.6 Dry top superficial layer Dry.
21 5 Loose volcanic soils Dry34 132 Highly weathered and fractured tuffs and trachytes Aquifer expected
509 >132 porphyritic olivine basalts No aquifers.
Vertical Electric Sounding Datasheet (Schlumberger)
Geological Interpretation Hydrogeological Interpretation
Curva de Resistividad Aparente
1
10
100
1000
1 10 100 1000AB/2 (m)
Res
istivi
dad
Apa
rent
e ( O
hm-m
)
(App
aren
t) R
esis
tivity
[Ohm
-m]
Depth (AB/2) [m]
Apparent Resistivity Data
Theoretical Apparent Resistivity Curve
Resistivity Layered Structure Model
District Baringo Division TengesLocation Ochii Site No. V-122
Site Name OCHII PRIMARY Elevation 165736N UTM-E 808651 UTM-N 33305
Latitude 0.300944 Longitude 35.772694
AB/2(m)
Rho-a(Wm)
1.6 8.0 2.0 8.4 2.5 7.4 3.2 7.2 4.0 7.2 5.0 6.3 6.3 6.6 10.0 6.0 13.0 7.6 16.0 8.2 20.0 9.2 25.0 10.2 32.0 10.3 40.0 10.9 50.0 12.4 63.0 14.1 80.0 16.2 100.0 16.5 130.0 15.3 160.0 12.7 200.0 10.0
Resistivity Depth
(Ohm.m) (m)9 1.4 Dry top superficial layer Dry. 6 10.3 Loose volcanic soils Dry
22 70 Slightly weathered tuffs Shallow aquifer may be present5 >70 Highly weathered and fractured tuffs and trachytes Aquifer expected.
Vertical Electric Sounding Datasheet (Schlumberger)
Geological Interpretation Hydrogeological Interpretation
Curva de Resistividad Aparente
1
10
100
1000
1 10 100 1000AB/2 (m)
Resi
stiv
idad
Apa
rente
(O
hm
-m
)
(App
aren
t) R
esis
tivity
[Ohm
-m]
Depth (AB/2) [m]
Apparent Resistivity Data
Theoretical Apparent Resistivity Curve
Resistivity Layered Structure Model
District Baringo Division TengesLocation Tenges Site No. V-123
Site Name SIGINWO Elevation 194336N UTM-E 813555 UTM-N 34611
Latitude 0.312778 Longitude 35.816750
AB/2(m)
Rho-a(Wm)
1.6 77.3 2.0 46.0 2.5 38.5 3.2 32.8 4.0 25.4 5.0 23.6 6.3 22.6 8.0 22.3 10.0 23.5 13.0 26.2 16.0 29.6 20.0 32.9 25.0 41.2 32.0 52.2 40.0 61.3 50.0 62.9 63.0 65.9 80.0 67.4 100.0 62.2 130.0 51.7 160.0 46.5 200.0 42.3
Resistivity Depth
(Ohm.m) (m)118 0.8 Dry top superficial layer Dry.
19 8 Loose volcanic soils Dry89 63 Slightly weathered tuffs Shallow aquifer may be present25 >63 Highly weathered and fractured tuffs and trachytes Aquifer expected.
Vertical Electric Sounding Datasheet (Schlumberger)
Geological Interpretation Hydrogeological Interpretation
Curva de Resistividad Aparente
1
10
100
1000
1 10 100 1000AB/2 (m)
Res
istivi
dad
Apa
rent
e ( O
hm-m
)
(App
aren
t) R
esis
tivity
[Ohm
-m]
Depth (AB/2) [m]
Apparent Resistivity Data
Theoretical Apparent Resistivity Curve
Resistivity Layered Structure Model
District Baringo Division TengesLocation Tenges Site No. V-124
Site Name TABARIN Elevation 184936N UTM-E 813133 UTM-N 37460
Latitude 0.324778 Longitude 35.802250
AB/2(m)
Rho-a(Wm)
1.6 202.8 2.0 145.8 2.5 117.4 3.2 93.6 4.0 68.4 5.0 45.5 6.3 31.7 8.0 22.0 10.0 18.3 13.0 16.4 16.0 14.5 32.0 10.5 40.0 10.5 50.0 11.1 63.0 11.9 80.0 14.4 100.0 14.8 130.0 15.2 160.0 15.1 200.0 15.0 250.0 12.8 320.0 11.3
Resistivity Depth
(Ohm.m) (m)20 1.2 Dry top superficial layer Dry. 15 24 Loose volcanic soils Dry
447 >24 Highly weathered and fractured tuffs and trachytes Shallow aquifer may be present
Vertical Electric Sounding Datasheet (Schlumberger)
Geological Interpretation Hydrogeological Interpretation
Curva de Resistividad Aparente
1
10
100
1000
1 10 100 1000AB/2 (m)
Res
istivi
dad
Apa
rent
e ( O
hm-m
)
(App
aren
t) R
esis
tivity
[Ohm
-m]
Depth (AB/2) [m]
Apparent Resistivity Data
Theoretical Apparent Resistivity Curve
Resistivity Layered Structure Model
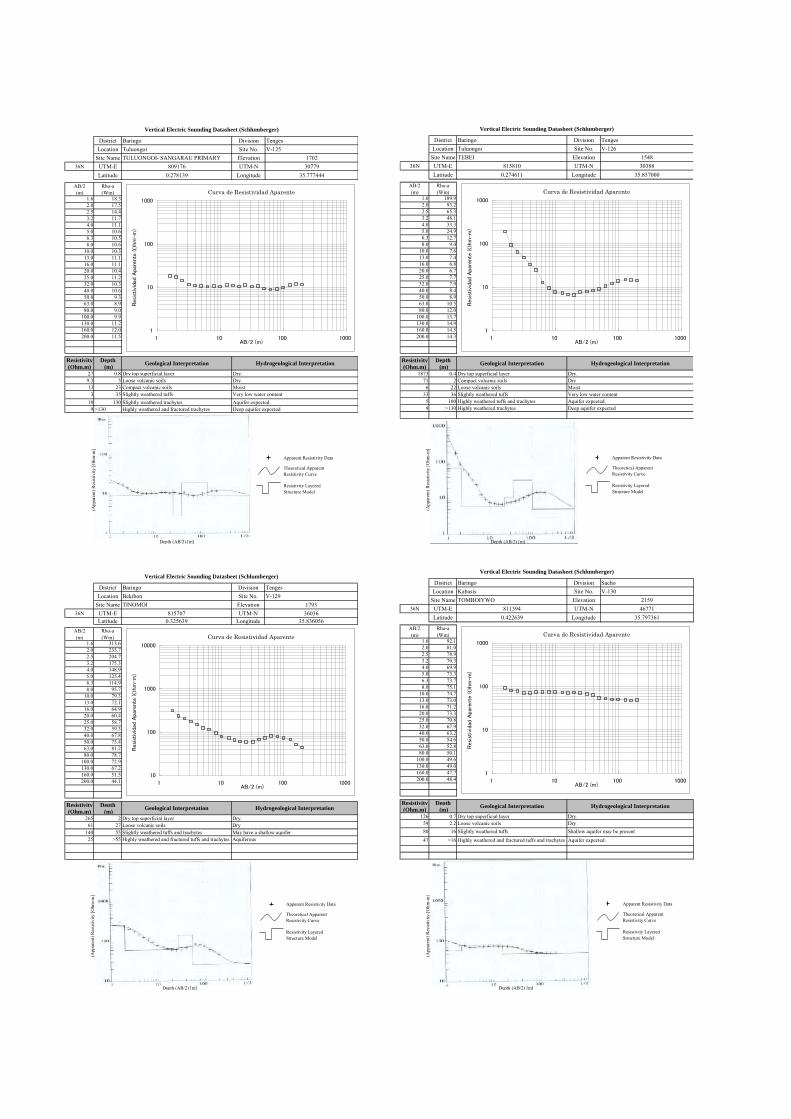
District Baringo Division TengesLocation Tuluongoi Site No. V-125
Site Name TULUONGOI- SANGARAU PRIMARY Elevation 170236N UTM-E 809176 UTM-N 30779
Latitude 0.278139 Longitude 35.777444
AB/2(m)
Rho-a(Wm)
1.6 18.3 2.0 17.5 2.5 14.4 3.2 11.7 4.0 11.1 5.0 10.6 6.3 10.5 8.0 10.6 10.0 10.3 13.0 11.1 16.0 11.1 20.0 10.4 25.0 11.2 32.0 10.3 40.0 10.6 50.0 9.3 63.0 8.9 80.0 9.0 100.0 9.9 130.0 11.2 160.0 12.0 200.0 11.5
Resistivity Depth
(Ohm.m) (m)27 0.8 Dry top superficial layer Dry.
9.3 5 Loose volcanic soils Dry13 23 Compact volcanic soils Moist
3 35 Slightly weathered tuffs Very low water content19 130 Slightly weathered trachytes Aquifer expected.
9 >130 Highly weathered and fractured trachytes Deep aquifer expected
Vertical Electric Sounding Datasheet (Schlumberger)
Geological Interpretation Hydrogeological Interpretation
Curva de Resistividad Aparente
1
10
100
1000
1 10 100 1000AB/2 (m)
Res
istivi
dad
Apa
rent
e ( O
hm-m
)
(App
aren
t) R
esis
tivity
[Ohm
-m]
Depth (AB/2) [m]
Apparent Resistivity Data
Theoretical Apparent Resistivity Curve
Resistivity Layered Structure Model
District Baringo Division TengesLocation Tuluongoi Site No. V-126
Site Name TEBEI Elevation 154836N UTM-E 815810 UTM-N 30388
Latitude 0.274611 Longitude 35.837000
AB/2(m)
Rho-a(Wm)
1.6 189.9 2.0 93.2 2.5 65.3 3.2 48.1 4.0 33.3 5.0 24.9 6.3 12.7 8.0 9.4 10.0 7.6 13.0 7.4 16.0 6.8 20.0 6.7 25.0 7.7 32.0 7.9 40.0 8.4 50.0 8.9 63.0 10.5 80.0 12.0 100.0 13.7 130.0 14.9 160.0 14.5 200.0 14.3
Resistivity Depth
(Ohm.m) (m)1873 0.4 Dry top superficial layer Dry.
71 2 Compact volcanic soils Dry6 22 Loose volcanic soils Moist
33 36 Slightly weathered tuffs Very low water content5 100 Highly weathered tuffs and trachytes Aquifer expected.9 >130 Highly weathered trachytes Deep aquifer expected
Vertical Electric Sounding Datasheet (Schlumberger)
Geological Interpretation Hydrogeological Interpretation
Curva de Resistividad Aparente
1
10
100
1000
1 10 100 1000AB/2 (m)
Resi
stiv
idad
Apa
rente
(O
hm
-m
)
(App
aren
t) R
esis
tivity
[Ohm
-m]
Depth (AB/2) [m]
Apparent Resistivity Data
Theoretical Apparent Resistivity Curve
Resistivity Layered Structure Model
District Baringo Division TengesLocation Bekibon Site No. V-129
Site Name TINOMOI Elevation 179336N UTM-E 815707 UTM-N 36036
Latitude 0.325639 Longitude 35.836056AB/2(m)
Rho-a(Wm)
1.6 313.6 2.0 233.7 2.5 204.7 3.2 175.3 4.0 148.9 5.0 125.4 6.3 114.9 8.0 95.7 10.0 79.3 13.0 72.1 16.0 64.9 20.0 60.4 25.0 58.7 32.0 59.3 40.0 67.8 50.0 73.4 63.0 81.2 80.0 78.7 100.0 72.9 130.0 67.2 160.0 51.5 200.0 44.1
Resistivity Depth
(Ohm.m) (m)265 2 Dry top superficial layer Dry.
61 27 Loose volcanic soils Dry140 55 Slightly weathered tuffs and trachytes May have a shallow aquifer
25 >55 Highly weathered and fractured tuffs and trachytes Aquiferous
Vertical Electric Sounding Datasheet (Schlumberger)
Geological Interpretation Hydrogeological Interpretation
Curva de Resistividad Aparente
10
100
1000
10000
1 10 100 1000AB/2 (m)
Res
istivi
dad
Apa
rent
e ( O
hm-m
)
(App
aren
t) R
esis
tivity
[Ohm
-m]
Depth (AB/2) [m]
Apparent Resistivity Data
Theoretical Apparent Resistivity Curve
Resistivity Layered Structure Model
District Baringo Division SachoLocation Kabasis Site No. V-130
Site Name TOMBOIYWO Elevation 215936N UTM-E 811394 UTM-N 46771
Latitude 0.422639 Longitude 35.797361
AB/2(m)
Rho-a(Wm)
1.6 92.1 2.0 81.0 2.5 78.9 3.2 70.3 4.0 69.9 5.0 73.3 6.3 73.7 8.0 75.1 10.0 74.7 13.0 73.0 16.0 71.2 20.0 73.3 25.0 70.8 32.0 67.9 40.0 63.2 50.0 54.6 63.0 52.8 80.0 50.1 100.0 49.6 130.0 49.0 160.0 47.7 200.0 48.4
Resistivity Depth
(Ohm.m) (m)126 0.7 Dry top superficial layer Dry.
59 2.2 Loose volcanic soils Dry80 16 Slightly weathered tuffs Shallow aquifer may be present47 >16 Highly weathered and fractured tuffs and trachytes Aquifer expected.
Vertical Electric Sounding Datasheet (Schlumberger)
Geological Interpretation Hydrogeological Interpretation
Curva de Resistividad Aparente
1
10
100
1000
1 10 100 1000AB/2 (m)
Res
istivi
dad
Apa
rent
e ( O
hm-m
)
(App
aren
t) R
esis
tivity
[Ohm
-m]
Depth (AB/2) [m]
Apparent Resistivity Data
Theoretical Apparent Resistivity Curve
Resistivity Layered Structure Model
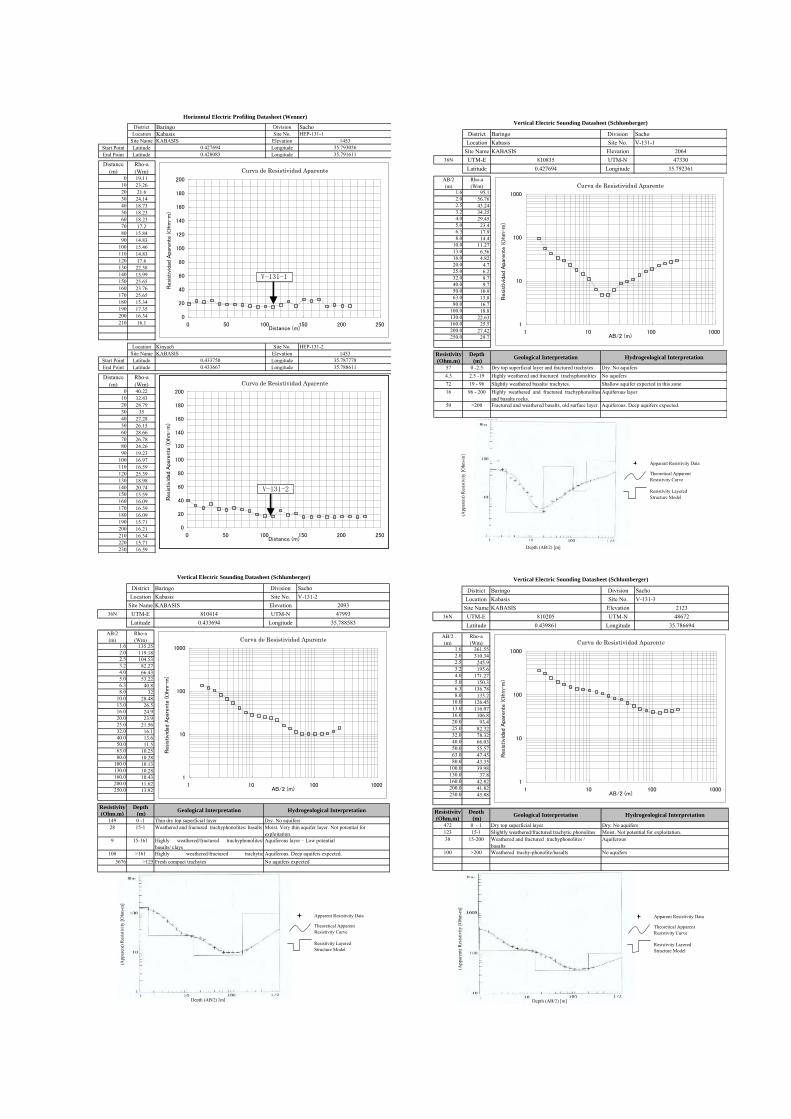
District Baringo Division SachoLocation Kabasis Site No. HEP-131-1
Site Name KABASIS Elevation 1453Start Point Latitude 0.427694 Longitude 35.793056End Point Latitude 0.428083 Longitude 35.791611
Distance(m)
Rho-a(Wm)
0 19.1110 23.2620 21.630 24.1440 18.7350 18.2360 18.2370 17.280 15.8490 14.83
100 15.46110 14.83120 17.6130 22.38140 15.99150 25.65160 23.76170 25.65180 15.34190 17.35200 16.34210 16.1
Location Kinyach Site No. HEP-131-2Site Name KABASIS Elevation 1453
Start Point Latitude 0.433750 Longitude 35.787778End Point Latitude 0.433667 Longitude 35.788611
Distance(m)
Rho-a(Wm)
0 40.2210 32.4320 28.7930 3540 27.2850 26.1560 28.6670 26.7880 24.2690 19.23
100 16.97110 16.59120 25.39130 18.98140 20.74150 15.59160 16.09170 16.59180 16.09190 15.71200 16.21210 16.34220 15.71230 16.59
Horizontal Electric Profiling Datasheet (Wenner)
Curva de Resistividad Aparente
0
20
40
60
80
100
120
140
160
180
200
0 50 100 150 200 250Distance (m)
Res
istivi
dad
Apa
rent
e ( O
hm-m
)
Curva de Resistividad Aparente
0
20
40
60
80
100
120
140
160
180
200
0 50 100 150 200 250Distance (m)
Res
istivi
dad
Apa
rent
e ( O
hm-m
)
V-131-1
V-131-2
District Baringo Division SachoLocation Kabasis Site No. V-131-1
Site Name KABASIS Elevation 206436N UTM-E 810835 UTM-N 47330
Latitude 0.427694 Longitude 35.792361
AB/2(m)
Rho-a(Wm)
1.6 95.1 2.0 56.76 2.5 43.24 3.2 34.25 4.0 29.45 5.0 23.4 6.3 17.9 8.0 14.4 10.0 11.27 13.0 6.36 16.0 4.82 20.0 4.7 25.0 6.2 32.0 8.7 40.0 9.7 50.0 10.9 63.0 13.8 80.0 16.7 100.0 18.8 130.0 22.63 160.0 25.5 200.0 27.42 250.0 29.7
Resistivity Depth
(Ohm.m) (m)57 0 -2.5 Dry top superficial layer and fractured trachytes. Dry. No aquifers 4.3 2.5 -19 Highly weathered and fractured trachyphonolites No aquifers72 19 - 96 Slightly weathered basalts/ trachytes. Shallow aquifer expected in this zone16 96 - 200 Highly weathered and fractured trachyphonolites
and basalts rocks.Aquiferous layer
50 >200 Fractured and weathered basalts, old surface layer. Aquiferous. Deep aquifers expected.
Vertical Electric Sounding Datasheet (Schlumberger)
Geological Interpretation Hydrogeological Interpretation
Curva de Resistividad Aparente
1
10
100
1000
1 10 100 1000AB/2 (m)
Resi
stiv
idad
Apa
rente
(O
hm
-m
)
(App
aren
t) R
esis
tivity
[Ohm
-m]
Depth (AB/2) [m]
Apparent Resistivity Data
Theoretical Apparent Resistivity Curve
Resistivity Layered Structure Model
District Baringo Division SachoLocation Kabasis Site No. V-131-2
Site Name KABASIS Elevation 209336N UTM-E 810414 UTM-N 47993
Latitude 0.433694 Longitude 35.788583
AB/2(m)
Rho-a(Wm)
1.6 135.25 2.0 119.18 2.5 104.53 3.2 82.27 4.0 66.43 5.0 53.22 6.3 40.8 8.0 32 10.0 28.48 13.0 26.5 16.0 24.9 20.0 23.9 25.0 21.56 32.0 16.1 40.0 13.6 50.0 11.5 63.0 10.25 80.0 10.28 100.0 10.13 130.0 10.28 160.0 10.43 200.0 11.62 250.0 13.92
Resistivity Depth
(Ohm.m) (m)149 0 -1 Thin dry top superficial layer Dry. No aquifers 28 15-1 Weathered and fractured trachyphonolites/ basalts
9 15-161 Highly weathered/fractured trachyphonolites/basalts/ clays
Aquiferous layer – Low potential
100 >161 Highly weathered/fractured trachyticphonolites/basalts
Aquiferous. Deep aquifers expected.3676 >125 Fresh compact trachytes No aquifers expected
Vertical Electric Sounding Datasheet (Schlumberger)
Geological Interpretation Hydrogeological Interpretation
Moist. Very thin aquifer layer. Not potential for exploitation.
Curva de Resistividad Aparente
1
10
100
1000
1 10 100 1000AB/2 (m)
Resi
stiv
idad
Apa
rente
(O
hm
-m
)
(App
aren
t) R
esis
tivity
[Ohm
-m]
Depth (AB/2) [m]
Apparent Resistivity Data
Theoretical Apparent Resistivity Curve
Resistivity Layered Structure Model
District Baringo Division SachoLocation Kabasis Site No. V-131-3
Site Name KABASIS Elevation 212336N UTM-E 810205 UTM-N 48672
Latitude 0.439861 Longitude 35.786694
AB/2(m)
Rho-a(Wm)
1.6 361.55 2.0 310.34 2.5 245.9 3.2 195.6 4.0 171.27 5.0 150.3 6.3 136.78 8.0 133.2 10.0 126.45 13.0 116.07 16.0 106.8 20.0 93.4 25.0 82.32 32.0 78.32 40.0 66.03 50.0 55.57 63.0 47.45 80.0 43.35 100.0 39.98 130.0 37.8 160.0 42.82 200.0 41.82 250.0 45.88
Resistivity Depth
(Ohm.m) (m)472 0 - 1 Dry top superficial layer Dry. No aquifers123 15-1 Slightly weathered/fractured trachytic phonolites Moist. Not potential for exploitation.38 15-200 Weathered and fractured trachyphonolites /
basalts Aquiferous
100 >200 Weathered trachy-phonolite/basalts No aquifers
Vertical Electric Sounding Datasheet (Schlumberger)
Geological Interpretation Hydrogeological Interpretation
Curva de Resistividad Aparente
1
10
100
1000
1 10 100 1000AB/2 (m)
Res
istivi
dad
Apa
rent
e ( O
hm-m
)
(App
aren
t) R
esis
tivity
[Ohm
-m]
Depth (AB/2) [m]
Apparent Resistivity Data
Theoretical Apparent Resistivity Curve
Resistivity Layered Structure Model

District Baringo Division KabarnetLocation Orokwo Site No. V-133
Site Name KAPCHOMUSWO Elevation 199936N UTM-E 805378 UTM-N 59489
Latitude 0.537611 Longitude 35.743444
AB/2(m)
Rho-a(Wm)
1.6 617.0 2.0 495.6 2.5 357.2 3.2 247.2 4.0 168.8 5.0 135.0 6.3 92.5 8.0 70.6 10.0 56.2 13.0 47.8 16.0 43.2 20.0 41.3 25.0 39.6 32.0 41.6 40.0 39.3 50.0 33.4 63.0 27.7 80.0 21.6 100.0 23.4
Resistivity Depth
(Ohm.m) (m)1092 0.8 Exposed trachytic outcrops Dry.
201 3 Compact volcanic soils Dry43 25 Slightly weathered tuffs Shallow aquifer may be present20 >25 Highly weathered and fractured tuffs and trachytes Aquifer expected.
Vertical Electric Sounding Datasheet (Schlumberger)
Geological Interpretation Hydrogeological Interpretation
Curva de Resistividad Aparente
10
100
1000
10000
1 10 100 1000AB/2 (m)
Resi
stiv
idad
Apa
rente
(O
hm
-m
)
(App
aren
t) R
esis
tivity
[Ohm
-m]
Depth (AB/2) [m]
Apparent Resistivity Data
Theoretical Apparent Resistivity Curve
Resistivity Layered Structure Model
District Baringo Division KabarnetLocation Orokwo Site No. V-134
Site Name KIWANJA NDEGE KABARNET Elevation 188236N UTM-E 803592 UTM-N 59000
Latitude 0.533222 Longitude 35.727389
AB/2(m)
Rho-a(Wm)
1.6 881.4 2.0 827.2 2.5 748.0 3.2 602.0 4.0 439.0 5.0 324.0 6.3 178.0 8.0 157.6 10.0 97.7 13.0 59.4 16.0 52.4 20.0 47.1 25.0 39.8 32.0 36.9 40.0 33.1 50.0 36.0 63.0 34.7 80.0 37.8 100.0 39.8 130.0 41.0 160.0 37.4 200.0 32.4
Resistivity Depth
(Ohm.m) (m)990 1.8 Dry top superficial layer Dry. 114 6 Compact volcanic soils Dry
33 39 Loose volcanic soils Moist46 120 Slightly weathered tuffs and trachytes Very low water content20 >120 Highly weathered and fractured trachytes Aquifer expected.
Vertical Electric Sounding Datasheet (Schlumberger)
Geological Interpretation Hydrogeological Interpretation
Curva de Resistividad Aparente
1
10
100
1000
1 10 100 1000AB/2 (m)
Resi
stiv
idad
Apa
rente
(O
hm
-m
)
(App
aren
t) R
esis
tivity
[Ohm
-m]
Depth (AB/2) [m]
Apparent Resistivity Data
Theoretical Apparent Resistivity Curve
Resistivity Layered Structure Model
District Baringo Division KabarnetLocation Orokwo Site No. V-135
Site Name PEMWAI CENTRE Elevation 223136N UTM-E 808480 UTM-N 63186
Latitude 0.571000 Longitude 35.771278
AB/2(m)
Rho-a(Wm)
1.6 104.1 2.0 76.0 2.5 59.2 3.2 52.2 4.0 54.3 5.0 53.7 6.3 56.9 8.0 64.8 10.0 72.3 13.0 69.4 16.0 53.0 20.0 44.1 25.0 35.3 32.0 38.6 40.0 33.8 50.0 30.5 63.0 31.9 80.0 30.9 100.0 26.5 130.0 26.2 160.0 23.0 200.0 22.2 250.0 21.9
Resistivity Depth
(Ohm.m) (m)228 0.7 Dry top superficial deposits Dry. No aquifers
11 1.3 Loose volcanic soils Moist. No aquifers are expected201 3 Dry Volcanic ashes and sediments Dry. No aquifers are expected
30 63 Slightly weathered volcanic ashes Shallow aquifer layer expected in this layer.19 >105 Highly weathered trachytic phonolites. Aquiferous.
Vertical Electric Sounding Datasheet (Schlumberger)
Geological Interpretation Hydrogeological Interpretation
Curva de Resistividad Aparente
1
10
100
1000
1 10 100 1000AB/2 (m)
Res
istivi
dad
Apa
rent
e ( O
hm-m
)
(App
aren
t) R
esis
tivity
[Ohm
-m]
Depth (AB/2) [m]
Apparent Resistivity Data
Theoretical Apparent Resistivity Curve
Resistivity Layered Structure Model
District Baringo Division KabarnetLocation Ewalel Site No. V-136
Site Name TULEI PRIMARY SCHOOL Elevation 224036N UTM-E 813093 UTM-N 64689
Latitude 0.584556 Longitude 35.812694
AB/2(m)
Rho-a(Wm)
1.6 200.4 2.0 211.3 2.5 220.0 3.2 205.7 4.0 217.8 5.0 198.4 6.3 185.1 8.0 185.8 10.0 214.7 13.0 221.0 16.0 212.0 20.0 207.6 25.0 197.2 32.0 162.0 40.0 105.3 50.0 99.6 63.0 98.3 80.0 90.9 100.0 85.6 130.0 77.8 160.0 57.5 200.0 47.4
Resistivity Depth
(Ohm.m) (m)217 3 Dry top superficial deposits Dry. No aquifers
86 4 Loose volcanic soils Moist. No aquifers are expected512 9 Dry Volcanic ashes and sediments Dry. No aquifers are expected
36 13 Slightly weathered volcanic ashes Moist91 80 Highly weathered trachytes and trachy phonolites. Shallow aquiferous
30 >80 Highly weathered and fractured phonolites Deep aquifer expected
Vertical Electric Sounding Datasheet (Schlumberger)
Geological Interpretation Hydrogeological Interpretation
Curva de Resistividad Aparente
1
10
100
1000
1 10 100 1000AB/2 (m)
Resi
stiv
idad
Apa
rente
(O
hm
-m
)
(App
aren
t) R
esis
tivity
[Ohm
-m]
Depth (AB/2) [m]
Apparent Resistivity Data
Theoretical Apparent Resistivity Curve
Resistivity Layered Structure Model

District Baringo Division KabarnetLocation Ewalel Site No. HEP-137-1
Site Name KAPKAWA Elevation 2124Start Point Latitude 0.568444 Longitude 35.778722End Point Latitude 0.567667 Longitude 35.781750
Distance(m)
Rho-a(Wm)
0 55.310 61.5820 52.7930 55.5540 58.750 61.4560 71.2670 63.3480 57.0690 60.86
100 61.58110 65.9120 75.7130 74.9140 70.13150 81.06160 76.66170 74.65180 101.8190 125.7200 101.9210 80.4220 100.3230 122.16240 114.99250 97.5260 82.9270 72.46280 75.04290 76.98
Location Ewalel Site No. HEP-137-2Site Name KAPKAWA Elevation 2099
Start Point Latitude 0.563444 Longitude 35.778472End Point Latitude 0.565306 Longitude 35.779750
Distance(m)
Rho-a(Wm)
0 58.1910 51.1520 46.3730 52.7940 54.2950 54.6760 51.1570 45.2480 51.7890 58.31
100 60.5110 54.04120 46.75130 47.25140 61.45150 67.36160 55.67170 50.64180 53.16190 54.29200 52.65210 55.8
Horizontal Electric Profiling Datasheet (Wenner)
Curva de Resistividad Aparente
0
20
40
60
80
100
120
140
160
180
200
0 50 100 150 200 250 300 350Distance (m)
Res
istivi
dad
Apa
rent
e ( O
hm-m
)
Curva de Resistividad Aparente
0
20
40
60
80
100
120
140
160
180
200
0 50 100 150 200 250Distance (m)
Res
istivi
dad
Apa
rent
e ( O
hm-m
)
V-137-1
V-137-2
District Baringo Division KabarnetLocation Ewalel Site No. V-137-1
Site Name KAPKAWA Elevation 223736N UTM-E 809609 UTM-N 62840
Latitude 0.567861 Longitude 35.781417
AB/2(m)
Rho-a(Wm)
1.6 258.46 2.0 250.16 2.5 246.28 3.2 254.65 4.0 261.86 5.0 287.86 6.3 319.92 8.0 322 10.0 352.28 13.0 200.92 16.0 162.2 20.0 131.04 25.0 88.2 32.0 67.62 40.0 67.4 50.0 63.68 63.0 56.72 80.0 49.58 100.0 42.89 130.0 36.29 160.0 32.04 200.0 30.78 250.0 29.48
Resistivity Depth
(Ohm.m) (m)284 0 -7.7 Dry top superficial layer and fractured trachytes. Dry. No aquifers57 7.7-54 Slightly weathered and fractured trachyphonolites No aquifers26 >54 Highly weathered/fractured trachyphonolites &
basaltsAquiferous layer
Vertical Electric Sounding Datasheet (Schlumberger)
Geological Interpretation Hydrogeological Interpretation
Curva de Resistividad Aparente
1
10
100
1000
1 10 100 1000AB/2 (m)
Resi
stiv
idad
Apa
rente
(O
hm
-m
)
(App
aren
t) R
esis
tivity
[Ohm
-m]
Depth (AB/2) [m]
Apparent Resistivity Data
Theoretical Apparent Resistivity Curve
Resistivity Layered Structure Model
District Baringo Division KabarnetLocation Ewalel Site No. V-137-2
Site Name KAPKAWA Elevation 209136N UTM-E 809345 UTM-N 62472
Latitude 0.564528 Longitude 35.779056
AB/2(m)
Rho-a(Wm)
1.6 211.27 2.0 130.9 2.5 115.8 3.2 92.63 4.0 92.07 5.0 82.47 6.3 76.76 8.0 70.6 10.0 59.78 13.0 57.77 16.0 48.98 20.0 46.62 25.0 43.12 32.0 40.8 40.0 36.7 50.0 35.97 63.0 33.5 80.0 26.92 100.0 20.5 130.0 19.54 160.0 16.49 200.0 10.32 250.0 10.84
Resistivity Depth
(Ohm.m) (m)156 0 -1.9 Thin dry top superficial layer Dry. No aquifers48 1.9-38 Slightly weathered and fractured trachyphonolites Moist.11 >38 Highly weathered/fractured trachyphonolites
&basaltsAquiferous layer/ Clayey
Vertical Electric Sounding Datasheet (Schlumberger)
Geological Interpretation Hydrogeological Interpretation
Curva de Resistividad Aparente
1
10
100
1000
1 10 100 1000AB/2 (m)
Resi
stiv
idad
Apa
rente
(O
hm
-m
)
(App
aren
t) R
esis
tivity
[Ohm
-m]
Depth (AB/2) [m]
Apparent Resistivity Data
Theoretical Apparent Resistivity Curve
Resistivity Layered Structure Model
District Baringo Division KabarnetLocation Ewalel Site No. V-137-3
Site Name KAPKAWA Elevation 209436N UTM-E 810343 UTM-N 61279
Latitude 0.553750 Longitude 35.788000
AB/2(m)
Rho-a(Wm)
1.6 241.76 2.0 238.36 2.5 227.48 3.2 216.66 4.0 201.96 5.0 185.94 6.3 168.52 8.0 127.8 10.0 104.54 13.0 89.04 16.0 81.1 20.0 78.28 25.0 84.28 32.0 80.5 40.0 61.33 50.0 37.65 63.0 44.24 80.0 40.4 100.0 38.53 130.0 39.69 160.0 38.76 200.0 34.96 250.0 32.12
Resistivity Depth
(Ohm.m) (m)250 0 - 2.7 Dry top superficial layer and fractured trachytes. Dry. No aquifers82 2.7 -23 Slightly weathered and fractured trachyphonolites Moist. No aquifers34 >23 Weathered & ractured trachyphonolites Aquiferous
Vertical Electric Sounding Datasheet (Schlumberger)
Geological Interpretation Hydrogeological Interpretation
Curva de Resistividad Aparente
1
10
100
1000
1 10 100 1000AB/2 (m)
Resi
stiv
idad
Apa
rente
(O
hm
-m
)
(App
aren
t) R
esis
tivity
[Ohm
-m]
Depth (AB/2) [m]
Apparent Resistivity Data
Theoretical Apparent Resistivity Curve
Resistivity Layered Structure Model
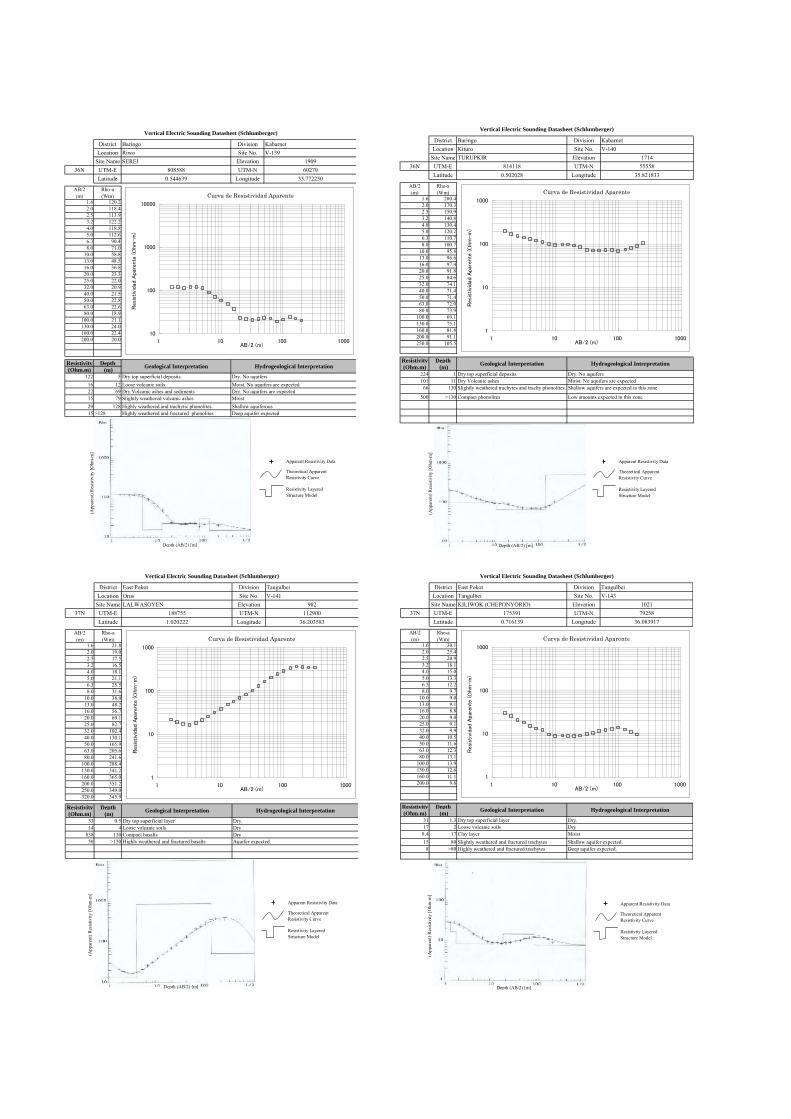
District Baringo Division KabarnetLocation Riwo Site No. V-139
Site Name SEREI Elevation 190936N UTM-E 808588 UTM-N 60270
Latitude 0.544639 Longitude 35.772250
AB/2(m)
Rho-a(Wm)
1.6 120.2 2.0 118.4 2.5 113.9 3.2 122.2 4.0 118.8 5.0 112.6 6.3 90.4 8.0 71.0 10.0 58.8 13.0 48.5 16.0 36.8 20.0 23.3 25.0 22.0 32.0 20.9 40.0 21.5 50.0 22.8 63.0 22.6 80.0 18.9 100.0 21.1 130.0 24.0 160.0 22.4 200.0 20.0
Resistivity Depth
(Ohm.m) (m)122 5 Dry top superficial deposits Dry. No aquifers
16 12 Loose volcanic soils Moist. No aquifers are expected22 69 Dry Volcanic ashes and sediments Dry. No aquifers are expected15 79 Slightly weathered volcanic ashes Moist29 128 Highly weathered and trachytic phonolites. Shallow aquiferous15 >128 Highly weathered and fractured phonolites Deep aquifer expected
Vertical Electric Sounding Datasheet (Schlumberger)
Geological Interpretation Hydrogeological Interpretation
Curva de Resistividad Aparente
10
100
1000
10000
1 10 100 1000AB/2 (m)
Resi
stiv
idad
Apa
rente
(O
hm
-m
)
(App
aren
t) R
esis
tivity
[Ohm
-m]
Depth (AB/2) [m]
Apparent Resistivity Data
Theoretical Apparent Resistivity Curve
Resistivity Layered Structure Model
District Baringo Division KabarnetLocation Kituro Site No. V-140
Site Name TURUPKIR Elevation 171436N UTM-E 814118 UTM-N 55558
Latitude 0.502028 Longitude 35.821833
AB/2(m)
Rho-a(Wm)
1.6 200.4 2.0 170.3 2.5 150.9 3.2 140.8 4.0 130.4 5.0 120.2 6.3 110.7 8.0 100.7 10.0 95.8 13.0 96.6 16.0 97.4 20.0 91.8 25.0 84.6 32.0 74.1 40.0 71.4 50.0 71.4 63.0 72.0 80.0 73.9 100.0 69.1 130.0 75.1 160.0 81.8 200.0 91.1 250.0 105.5
Resistivity Depth
(Ohm.m) (m)224 1 Dry top superficial deposits Dry. No aquifers101 11 Dry Volcanic ashes Moist. No aquifers are expected
66 130 Slightly weathered trachytes and trachy phonolites. Shallow aquifers are expected in this zone
500 >130 Compact phonolites Low amounts expected in this zone
Vertical Electric Sounding Datasheet (Schlumberger)
Geological Interpretation Hydrogeological Interpretation
Curva de Resistividad Aparente
1
10
100
1000
1 10 100 1000AB/2 (m)
Resi
stiv
idad
Apa
rente
(O
hm
-m
)
(App
aren
t) R
esis
tivity
[Ohm
-m]
Depth (AB/2) [m]
Apparent Resistivity Data
Theoretical Apparent Resistivity Curve
Resistivity Layered Structure Model
District East Pokot Division TangulbeiLocation Orus Site No. V-141
Site Name LALWASOYEN Elevation 98237N UTM-E 188755 UTM-N 112900
Latitude 1.020222 Longitude 36.203583
AB/2(m)
Rho-a(Wm)
1.6 21.8 2.0 19.0 2.5 17.5 3.2 16.5 4.0 18.1 5.0 21.1 6.3 25.5 8.0 31.6 10.0 38.0 13.0 48.2 16.0 56.7 20.0 69.1 25.0 82.7 32.0 102.4 40.0 130.1 50.0 165.9 63.0 205.6 80.0 241.6 100.0 288.4 130.0 341.2 160.0 365.0 200.0 351.2 250.0 349.0 320.0 345.9
Resistivity Depth
(Ohm.m) (m)53 0.5 Dry top superficial layer Dry. 14 4 Loose volcanic soils Dry
838 130 Compact basalts Dry50 >130 Highly weathered and fractured basalts Aquifer expected.
Vertical Electric Sounding Datasheet (Schlumberger)
Geological Interpretation Hydrogeological Interpretation
Curva de Resistividad Aparente
1
10
100
1000
1 10 100 1000AB/2 (m)
Res
istivi
dad
Apa
rent
e ( O
hm-m
)
(App
aren
t) R
esis
tivity
[Ohm
-m]
Depth (AB/2) [m]
Apparent Resistivity Data
Theoretical Apparent Resistivity Curve
Resistivity Layered Structure Model
District East Pokot Division TangulbeiLocation Tangulbei Site No. V-143
Site Name KILIWOK (CHEPONYORIO) Elevation 102137N UTM-E 175391 UTM-N 79258
Latitude 0.716139 Longitude 36.083917
AB/2(m)
Rho-a(Wm)
1.6 30.1 2.0 25.4 2.5 20.9 3.2 18.1 4.0 15.0 5.0 13.3 6.3 12.2 8.0 9.7 10.0 9.0 13.0 9.1 16.0 8.8 20.0 9.0 25.0 9.1 32.0 9.9 40.0 10.5 50.0 11.6 63.0 12.3 80.0 13.1 100.0 13.9 130.0 12.6 160.0 11.1 200.0 9.6
Resistivity Depth
(Ohm.m) (m)31 1.3 Dry top superficial layer Dry. 17 2 Loose volcanic soils Dry
8.4 17 Clay layer Moist15 80 Slightly weathered and fractured trachytes Shallow aquifer expected.
8 >80 Highly weathered and fractured trachytes Deep aquifer expected.
Vertical Electric Sounding Datasheet (Schlumberger)
Geological Interpretation Hydrogeological Interpretation
Curva de Resistividad Aparente
1
10
100
1000
1 10 100 1000AB/2 (m)
Res
istivi
dad
Apa
rent
e ( O
hm-m
)
(App
aren
t) R
esis
tivity
[Ohm
-m]
Depth (AB/2) [m]
Apparent Resistivity Data
Theoretical Apparent Resistivity Curve
Resistivity Layered Structure Model
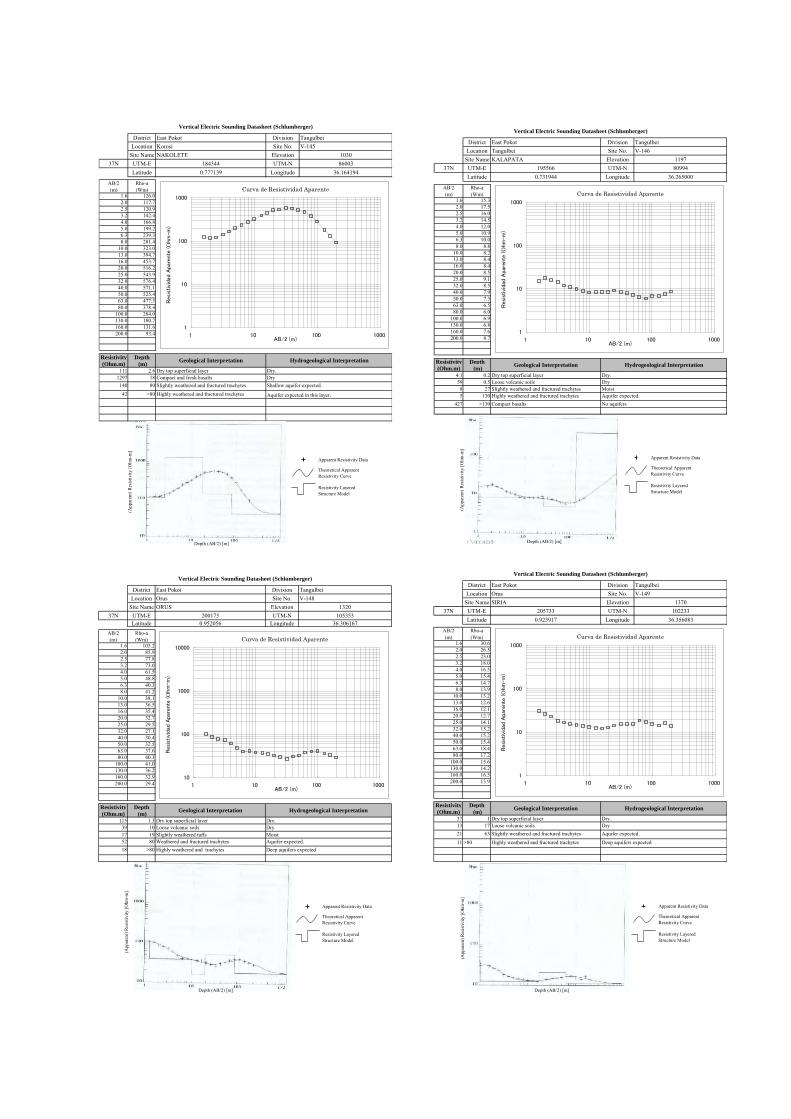
District East Pokot Division TangulbeiLocation Korosi Site No. V-145
Site Name NAKOLETE Elevation 103037N UTM-E 184344 UTM-N 86003
Latitude 0.777139 Longitude 36.164194
AB/2(m)
Rho-a(Wm)
1.6 126.0 2.0 117.7 2.5 120.9 3.2 142.4 4.0 166.8 5.0 199.2 6.3 239.3 8.0 281.4 10.0 323.0 13.0 394.7 16.0 453.7 20.0 516.2 25.0 543.9 32.0 576.4 40.0 571.1 50.0 525.4 63.0 477.3 80.0 378.4 100.0 284.0 130.0 180.7 160.0 131.6 200.0 93.4
Resistivity Depth
(Ohm.m) (m)111 2.6 Dry top superficial layer Dry.
1297 18 Compact and fresh basalts Dry140 80 Slightly weathered and fractured trachytes Shallow aquifer expected.
42 >80 Highly weathered and fractured trachytes Aquifer expected in this layer.
Vertical Electric Sounding Datasheet (Schlumberger)
Geological Interpretation Hydrogeological Interpretation
Curva de Resistividad Aparente
1
10
100
1000
1 10 100 1000AB/2 (m)
Res
istivi
dad
Apa
rent
e ( O
hm-m
)
(App
aren
t) R
esis
tivity
[Ohm
-m]
Depth (AB/2) [m]
Apparent Resistivity Data
Theoretical Apparent Resistivity Curve
Resistivity Layered Structure Model
District East Pokot Division TangulbeiLocation Tangulbei Site No. V-146
Site Name KALAPATA Elevation 119737N UTM-E 195566 UTM-N 80994
Latitude 0.731944 Longitude 36.265000
AB/2(m)
Rho-a(Wm)
1.6 15.3 2.0 17.5 2.5 16.0 3.2 14.5 4.0 12.0 5.0 10.9 6.3 10.0 8.0 8.8 10.0 8.2 13.0 8.4 16.0 8.4 20.0 8.5 25.0 9.1 32.0 8.5 40.0 7.9 50.0 7.3 63.0 6.5 80.0 6.0 100.0 6.9 130.0 6.8 160.0 7.6 200.0 8.7
Resistivity Depth
(Ohm.m) (m)4.1 0.2 Dry top superficial layer Dry. 59 0.5 Loose volcanic soils Dry
8 27 Slightly weathered and fractured trachytes Moist5 130 Highly weathered and fractured trachytes Aquifer expected.
427 >130 Compact basalts No aquifers
Vertical Electric Sounding Datasheet (Schlumberger)
Geological Interpretation Hydrogeological Interpretation
Curva de Resistividad Aparente
1
10
100
1000
1 10 100 1000AB/2 (m)
Res
istivi
dad
Apa
rent
e ( O
hm-m
)
(App
aren
t) R
esis
tivity
[Ohm
-m]
Depth (AB/2) [m]
Apparent Resistivity Data
Theoretical Apparent Resistivity Curve
Resistivity Layered Structure Model
District East Pokot Division TangulbeiLocation Orus Site No. V-148
Site Name ORUS Elevation 132037N UTM-E 200175 UTM-N 105353
Latitude 0.952056 Longitude 36.306167AB/2(m)
Rho-a(Wm)
1.6 103.2 2.0 85.9 2.5 77.8 3.2 73.0 4.0 61.5 5.0 48.8 6.3 40.3 8.0 41.2 10.0 38.1 13.0 36.5 16.0 35.4 20.0 32.7 25.0 29.5 32.0 27.1 40.0 30.4 50.0 32.5 63.0 37.6 80.0 40.3 100.0 41.0 130.0 36.2 160.0 32.9 200.0 29.4
Resistivity Depth
(Ohm.m) (m)115 1.3 Dry top superficial layer Dry.
39 10 Loose volcanic soils Dry17 19 Slightly weathered tuffs Moist52 80 Weathered and fractured trachytes Aquifer expected.18 >80 Highly weathered and trachytes Deep aquifers expected
Vertical Electric Sounding Datasheet (Schlumberger)
Geological Interpretation Hydrogeological Interpretation
Curva de Resistividad Aparente
10
100
1000
10000
1 10 100 1000AB/2 (m)
Res
istivi
dad
Apa
rent
e ( O
hm-m
)
(App
aren
t) R
esis
tivity
[Ohm
-m]
Depth (AB/2) [m]
Apparent Resistivity Data
Theoretical Apparent Resistivity Curve
Resistivity Layered Structure Model
District East Pokot Division TangulbeiLocation Orus Site No. V-149
Site Name SIRIA Elevation 137037N UTM-E 205733 UTM-N 102233
Latitude 0.923917 Longitude 36.356083
AB/2(m)
Rho-a(Wm)
1.6 30.6 2.0 26.5 2.5 23.0 3.2 18.0 4.0 16.5 5.0 15.4 6.3 14.7 8.0 13.9 10.0 13.2 13.0 12.6 16.0 12.1 20.0 12.7 25.0 14.1 32.0 15.2 40.0 15.2 50.0 15.4 63.0 18.4 80.0 17.2 100.0 15.6 130.0 14.2 160.0 16.5 200.0 13.9
Resistivity Depth
(Ohm.m) (m)37 1 Dry top superficial layer Dry. 13 17 Loose volcanic soils Dry21 63 Slightly weathered and fractured trachytes Aquifer expected.11 >80 Highly weathered and fractured trachytes Deep aquifers expected
Vertical Electric Sounding Datasheet (Schlumberger)
Geological Interpretation Hydrogeological Interpretation
Curva de Resistividad Aparente
1
10
100
1000
1 10 100 1000AB/2 (m)
Res
istivi
dad
Apa
rent
e ( O
hm-m
)
(App
aren
t) R
esis
tivity
[Ohm
-m]
Depth (AB/2) [m]
Apparent Resistivity Data
Theoretical Apparent Resistivity Curve
Resistivity Layered Structure Model

District East Pokot Division TangulbeiLocation Kokwototo Site No. V-150
Site Name KAUNGURA Elevation 102437N UTM-E 195589 UTM-N 99225
Latitude 0.896667 Longitude 36.265056
AB/2(m)
Rho-a(Wm)
1.6 18.1 2.0 15.5 2.5 14.9 3.2 14.9 4.0 15.0 5.0 17.0 6.3 16.8 8.0 18.9 10.0 20.2 13.0 22.7 16.0 27.4 20.0 34.9 25.0 36.7 32.0 43.4 40.0 56.9 50.0 68.6 63.0 74.8 80.0 82.7 100.0 82.7 130.0 73.8 160.0 66.2 200.0 55.7
Resistivity Depth
(Ohm.m) (m)566 0.3 Dry top superficial layer Dry.
14 7 Loose volcanic soils Dry119 80 Slightly weathered and fractured trachytes Shallow aquifer expected.
20 >80 Weathered and fractured basalts and trachytes Deep aquifers expected
Vertical Electric Sounding Datasheet (Schlumberger)
Geological Interpretation Hydrogeological Interpretation
Curva de Resistividad Aparente
1
10
100
1000
1 10 100 1000AB/2 (m)
Res
istivi
dad
Apa
rent
e ( O
hm-m
)
(App
aren
t) R
esis
tivity
[Ohm
-m]
Depth (AB/2) [m]
Apparent Resistivity Data
Theoretical Apparent Resistivity Curve
Resistivity Layered Structure Model
District East Pokot Division MondiLocation Loruk Site No. V-151
Site Name TUWO Elevation 92137N UTM-E 172175 UTM-N 89789
Latitude 0.811278 Longitude 36.054944
AB/2(m)
Rho-a(Wm)
1.6 38.8 2.0 39.1 2.5 34.0 3.2 29.5 4.0 30.4 5.0 30.1 6.3 30.5 8.0 31.8 10.0 33.1 13.0 34.9 16.0 36.7 20.0 35.9 25.0 40.6 32.0 44.8 40.0 50.3 50.0 55.2 63.0 63.5 80.0 71.4 100.0 78.1 130.0 62.3 160.0 86.4 200.0 90.0 250.0 80.4
Resistivity Depth
(Ohm.m) (m)48 1.1 Dry top superficial layer Dry. 19 2.2 Loose volcanic soils Dry36 21 Slightly weathered and fractured tuffs moist
131 150 Weathered and fractured trachytes Shallow aquifer expected.17 >150 Highly weathered and fractured trachytes Deep aquifer expected.
Vertical Electric Sounding Datasheet (Schlumberger)
Geological Interpretation Hydrogeological Interpretation
Curva de Resistividad Aparente
1
10
100
1000
1 10 100 1000AB/2 (m)
Resi
stiv
idad
Apa
rente
(O
hm
-m
)
(App
aren
t) R
esis
tivity
[Ohm
-m]
Depth (AB/2) [m]
Apparent Resistivity Data
Theoretical Apparent Resistivity Curve
Resistivity Layered Structure Model
District East Pokot Division MondiLocation Loruk Site No. V-153-1
Site Name CHEBILAT Elevation37N UTM-E 169611 UTM-N 81365
Latitude 0.735139 Longitude 36.031972
AB/2(m)
Rho-a(Wm)
1.6 53.24 2.0 42.83 2.5 40.04 3.2 45.18 4.0 49.94 5.0 50.73 6.3 47.12 8.0 55.8 10.0 60.97 13.0 69.43 16.0 73.39 20.0 85.93 25.0 95.15 32.0 103.04 40.0 115.25 50.0 131.2 63.0 153.37 80.0 177.68 100.0 195.07 130.0 214.01 160.0 225.2 200.0 234.5 250.0 233.47
Resistivity Depth
(Ohm.m) (m)106 0-0.4 Dry top superficial layer and fractured tuff. Dry. No aquifers 37 0.4-2 Slightly weathered and fractured tuff Moist. 61 04-2 Highly weathered/ fractured basalts rocks. Moist42 06-4 Highly weathered and fractured basalts Aquiferous
134 6-33 Weathered/ fractured basalt & trachytes Aquiferous 480 33-112 Slightly weathered and fractured basalt Aquiferous 102 >112 Highly weathered basalts & pyroclastics Deep aquiferous Expected
Vertical Electric Sounding Datasheet (Schlumberger)
Geological Interpretation Hydrogeological Interpretation
Curva de Resistividad Aparente
1
10
100
1000
1 10 100 1000AB/2 (m)
Res
istivi
dad
Apa
rent
e ( O
hm-m
)
(App
aren
t) R
esis
tivity
[Ohm
-m]
Depth (AB/2) [m]
Apparent Resistivity Data
Theoretical Apparent Resistivity Curve
Resistivity Layered Structure Model
District East Pokot Division MondiLocation Loruk Site No. V-153-2
Site Name CHEBILAT Elevation 101837N UTM-E 169986 UTM-N 82622
Latitude 0.746500 Longitude 36.035333
AB/2(m)
Rho-a(Wm)
1.6 75.14 2.0 82.95 2.5 81.59 3.2 84.78 4.0 94.15 5.0 104.72 6.3 110.61 8.0 127.4 10.0 141.16 13.0 140.98 16.0 146.23 20.0 149.94 25.0 151.9 32.0 163.89 40.0 165.84 50.0 178.33 63.0 198.21 80.0 221.5 100.0 248.51 130.0 274.6 160.0 290.45 200.0 292.69 250.0 288.92
Resistivity Depth
(Ohm.m) (m)75 0-2.6 Dry top superficial layer and fractured tuffs. Dry. No aquifers
263 2.6-5.4 Slightly weathered and fractured Basalt Moist137 5.4-32 Weathered and fractured basalt Moist493 32-162 Slightly weathered and fractured Basalt Aquiferous
39 >162 Highly weathered pyroclastic rock Deep aquiferous Expected
Vertical Electric Sounding Datasheet (Schlumberger)
Geological Interpretation Hydrogeological Interpretation
Curva de Resistividad Aparente
1
10
100
1000
1 10 100 1000AB/2 (m)
Res
istivi
dad
Apa
rent
e ( O
hm-m
)
(App
aren
t) R
esis
tivity
[Ohm
-m]
Depth (AB/2) [m]
Apparent Resistivity Data
Theoretical Apparent Resistivity Curve
Resistivity Layered Structure Model
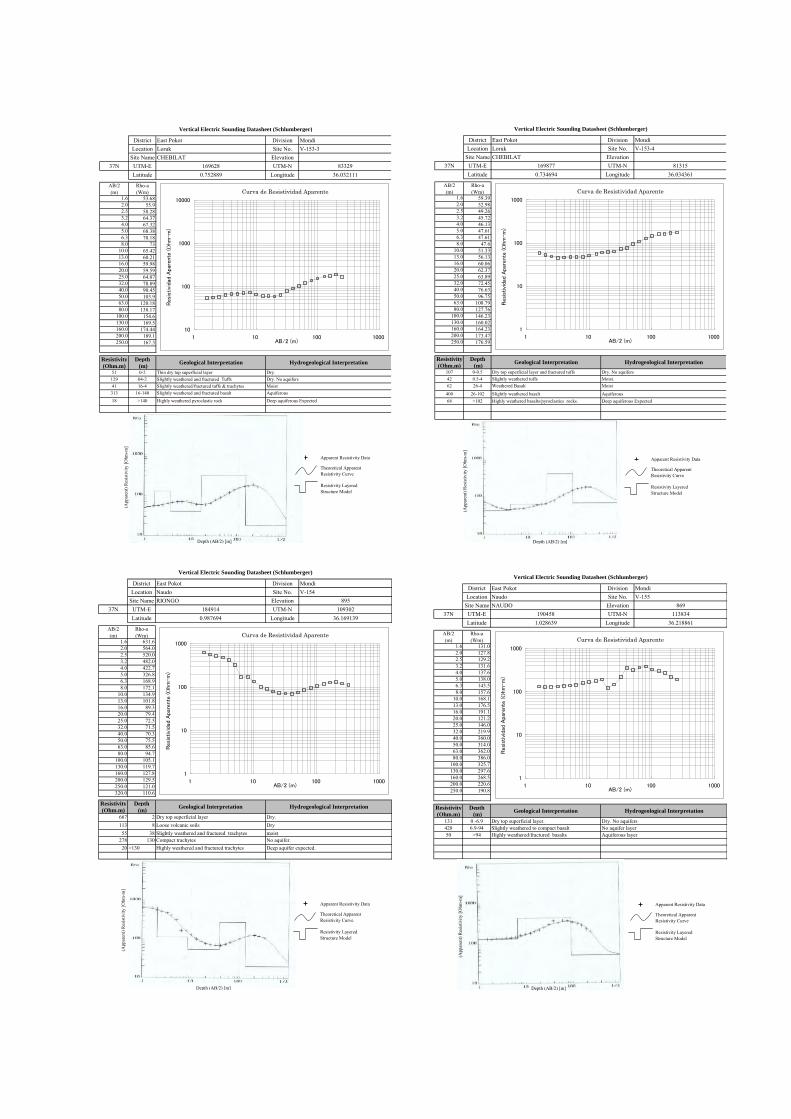
District East Pokot Division MondiLocation Loruk Site No. V-153-3
Site Name CHEBILAT Elevation37N UTM-E 169628 UTM-N 83329
Latitude 0.752889 Longitude 36.032111
AB/2(m)
Rho-a(Wm)
1.6 53.68 2.0 55.9 2.5 58.28 3.2 64.37 4.0 67.32 5.0 68.38 6.3 70.18 8.0 73 10.0 65.42 13.0 60.21 16.0 59.98 20.0 59.59 25.0 64.07 32.0 78.89 40.0 90.45 50.0 103.9 63.0 120.18 80.0 138.17 100.0 154.6 130.0 169.5 160.0 174.44 200.0 189.1 250.0 167.3
Resistivity Depth
(Ohm.m) (m)51 0-2 Thin dry top superficial layer Dry.
129 04-2 Slightly weathered and fractured Tuffs Dry. No aquifers41 16-4 Slightly weathered/fractured tuffs & trachytes Moist
313 16-140 Slightly weathered and fractured basalt Aquiferous 18 >140 Highly weathered pyroclastic rock Deep aquiferous Expected
Vertical Electric Sounding Datasheet (Schlumberger)
Geological Interpretation Hydrogeological Interpretation
Curva de Resistividad Aparente
10
100
1000
10000
1 10 100 1000AB/2 (m)
Resi
stiv
idad
Apa
rente
(O
hm
-m
)
(App
aren
t) R
esis
tivity
[Ohm
-m]
Depth (AB/2) [m]
Apparent Resistivity Data
Theoretical Apparent Resistivity Curve
Resistivity Layered Structure Model
District East Pokot Division MondiLocation Loruk Site No. V-153-4
Site Name CHEBILAT Elevation37N UTM-E 169877 UTM-N 81315
Latitude 0.734694 Longitude 36.034361
AB/2(m)
Rho-a(Wm)
1.6 59.39 2.0 52.98 2.5 49.26 3.2 45.72 4.0 46.13 5.0 47.61 6.3 47.61 8.0 47.6 10.0 51.33 13.0 56.13 16.0 60.06 20.0 62.37 25.0 63.89 32.0 72.45 40.0 76.63 50.0 96.75 63.0 108.79 80.0 127.76 100.0 146.23 130.0 160.02 160.0 164.23 200.0 173.47 250.0 176.59
Resistivity Depth
(Ohm.m) (m)107 0-0.5 Dry top superficial layer and fractured tuffs Dry. No aquifers42 0.5-4 Slightly weathered tuffs Moist. 62 26-4 Weathered Basalt Moist
400 26-102 Slightly weathered basalt Aquiferous68 >102 Highly weathered basalts/pyroclastics rocks. Deep aquiferous Expected
Vertical Electric Sounding Datasheet (Schlumberger)
Geological Interpretation Hydrogeological Interpretation
Curva de Resistividad Aparente
1
10
100
1000
1 10 100 1000AB/2 (m)
Resi
stiv
idad
Apa
rente
(O
hm
-m
)
(App
aren
t) R
esis
tivity
[Ohm
-m]
Depth (AB/2) [m]
Apparent Resistivity Data
Theoretical Apparent Resistivity Curve
Resistivity Layered Structure Model
District East Pokot Division MondiLocation Naudo Site No. V-154
Site Name RIONGO Elevation 89537N UTM-E 184914 UTM-N 109302
Latitude 0.987694 Longitude 36.169139
AB/2(m)
Rho-a(Wm)
1.6 631.6 2.0 564.0 2.5 520.0 3.2 482.0 4.0 422.7 5.0 326.8 6.3 168.9 8.0 172.1 10.0 134.9 13.0 101.8 16.0 89.3 20.0 79.4 25.0 72.5 32.0 71.5 40.0 70.3 50.0 75.5 63.0 85.6 80.0 94.7 100.0 105.1 130.0 119.7 160.0 127.8 200.0 129.5 250.0 121.0 320.0 110.6
Resistivity Depth
(Ohm.m) (m)667 2 Dry top superficial layer Dry. 113 8 Loose volcanic soils Dry
55 38 Slightly weathered and fractured trachytes moist278 130 Compact trachytes No aquifer.
20 >130 Highly weathered and fractured trachytes Deep aquifer expected.
Vertical Electric Sounding Datasheet (Schlumberger)
Geological Interpretation Hydrogeological Interpretation
Curva de Resistividad Aparente
1
10
100
1000
1 10 100 1000AB/2 (m)
Res
istivi
dad
Apa
rent
e ( O
hm-m
)
(App
aren
t) R
esis
tivity
[Ohm
-m]
Depth (AB/2) [m]
Apparent Resistivity Data
Theoretical Apparent Resistivity Curve
Resistivity Layered Structure Model
District East Pokot Division MondiLocation Naudo Site No. V-155
Site Name NAUDO Elevation 86937N UTM-E 190458 UTM-N 113834
Latitude 1.028639 Longitude 36.218861
AB/2(m)
Rho-a(Wm)
1.6 131.0 2.0 127.8 2.5 129.2 3.2 131.6 4.0 137.6 5.0 138.0 6.3 143.5 8.0 157.6 10.0 168.1 13.0 176.5 16.0 191.1 20.0 121.2 25.0 146.0 32.0 219.9 40.0 360.0 50.0 314.0 63.0 362.0 80.0 386.0 100.0 325.7 130.0 297.6 160.0 268.5 200.0 220.6 250.0 190.8
Resistivity Depth
(Ohm.m) (m)131 0 -6.9 Dry top superficial layer. Dry. No aquifers428 6.9-94 Slightly weathered to compact basalt No aquifer layer50 >94 Highly weathered/fractured basalts Aquiferous layer
Vertical Electric Sounding Datasheet (Schlumberger)
Geological Interpretation Hydrogeological Interpretation
Curva de Resistividad Aparente
1
10
100
1000
1 10 100 1000AB/2 (m)
Res
istivi
dad
Apa
rent
e ( O
hm-m
)
(App
aren
t) R
esis
tivity
[Ohm
-m]
Depth (AB/2) [m]
Apparent Resistivity Data
Theoretical Apparent Resistivity Curve
Resistivity Layered Structure Model

District East Pokot Division MondiLocation Naudo Site No. V-156
Site Name AKWICHATIS Elevation 99737N UTM-E 202141 UTM-N 114568
Latitude 1.035361 Longitude 36.323778
AB/2(m)
Rho-a(Wm)
1.6 28.0 2.0 26.4 2.5 22.3 3.2 18.9 4.0 20.0 5.0 16.3 6.3 14.1 8.0 11.5 10.0 11.9 13.0 11.4 16.0 12.2 20.0 12.5 25.0 13.3 32.0 14.3 40.0 14.9 50.0 14.8 63.0 13.8 80.0 13.7 100.0 13.4 130.0 11.2 160.0 10.2 200.0 9.5
Resistivity Depth
(Ohm.m) (m)28.5 1.8 Dry top superficial layer Dry.
9 8 Loose volcanic soils Dry16 55 Slightly weathered and fractured trachytes Shallow aquifer expected.
8 >55 Highly weathered and fractured trachytes Deep aquifer expected.
Vertical Electric Sounding Datasheet (Schlumberger)
Geological Interpretation Hydrogeological Interpretation
Curva de Resistividad Aparente
1
10
100
1000
1 10 100 1000AB/2 (m)
Resi
stiv
idad
Apa
rente
(O
hm
-m
)
(App
aren
t) R
esis
tivity
[Ohm
-m]
Depth (AB/2) [m]
Apparent Resistivity Data
Theoretical Apparent Resistivity Curve
Resistivity Layered Structure Model
District East Pokot Division MondiLocation Naudo Site No. V-157
Site Name NASOROT Elevation 93037N UTM-E 206484 UTM-N 130447
Latitude 1.178944 Longitude 36.362639
AB/2(m)
Rho-a(Wm)
1.6 17.5 2.0 16.7 2.5 15.8 3.2 11.8 4.0 10.3 5.0 7.7 6.3 6.3 8.0 5.6 10.0 5.0 13.0 5.0 16.0 6.4 20.0 4.8 25.0 5.9 32.0 7.6 40.0 8.6 50.0 9.0 63.0 11.6 80.0 15.2 100.0 15.5 130.0 16.5 160.0 14.9 200.0 12.5 250.0 11.3
Resistivity Depth
(Ohm.m) (m)19.4 1.7 Dry top superficial layer Dry.
4 16 Slightly weathered and fractured trachytes moist33 80 Highly weathered and fractured trachytes Aquifer expected
Vertical Electric Sounding Datasheet (Schlumberger)
Geological Interpretation Hydrogeological Interpretation
Curva de Resistividad Aparente
1
10
100
1000
1 10 100 1000AB/2 (m)
Resi
stiv
idad
Apa
rente
(O
hm
-m
)
(App
aren
t) R
esis
tivity
[Ohm
-m]
Depth (AB/2) [m]
Apparent Resistivity Data
Theoretical Apparent Resistivity Curve
Resistivity Layered Structure Model
District East Pokot Division MondiLocation Silale Site No. V-159
Site Name CHEPTUNOYO Elevation 83537N UTM-E 167982 UTM-N 107169
Latitude 0.968278 Longitude 36.017167
AB/2(m)
Rho-a(Wm)
1.6 1.7 2.0 1.7 2.5 1.7 3.2 1.8 4.0 2.0 5.0 2.3 6.3 2.7 8.0 3.5 10.0 4.9 13.0 6.0 16.0 7.6 20.0 9.5 25.0 10.2 32.0 15.4 40.0 15.0 50.0 17.3 63.0 24.8 80.0 30.5 100.0 35.5 130.0 43.5 160.0 46.2 200.0 46.0 250.0 53.9
Resistivity Depth
(Ohm.m) (m)1.5 3.3 Dry top superficial layer Dry.
137 100 Slightly weathered and fractured trachytes moist26 >100 Weathered and fractured trachytes Aquifer expected in this zone.
Vertical Electric Sounding Datasheet (Schlumberger)
Geological Interpretation Hydrogeological Interpretation
Curva de Resistividad Aparente
1
10
100
1000
1 10 100 1000AB/2 (m)
Resi
stiv
idad
Apa
rente
(O
hm
-m
)
(App
aren
t) R
esis
tivity
[Ohm
-m]
Depth (AB/2) [m]
Apparent Resistivity Data
Theoretical Apparent Resistivity Curve
Resistivity Layered Structure Model
District East Pokot Division MondiLocation Loyamorok Site No. V-160
Site Name KASIOKON Elevation 87536N UTM-E 832265 UTM-N 94457
Latitude 0.853417 Longitude 35.984944
AB/2(m)
Rho-a(Wm)
1.6 21.5 2.0 20.6 2.5 20.6 3.2 24.1 4.0 24.1 5.0 24.1 6.3 23.9 8.0 26.0 10.0 26.6 13.0 28.6 16.0 28.9 20.0 29.0 25.0 29.4 32.0 25.8 40.0 22.5 50.0 19.4 63.0 15.6 80.0 12.3 100.0 10.4 130.0 9.8 160.0 9.8 200.0 10.5 250.0 11.5
Resistivity Depth
(Ohm.m) (m)21.5 3.5 Dry top superficial layer Dry.
36 21 Loose volcanic soils Dry8 200 Slightly weathered and fractured trachytes Shallow aquifer expected.
282 >200 Compact trachytes No aquifer expected.
Vertical Electric Sounding Datasheet (Schlumberger)
Geological Interpretation Hydrogeological Interpretation
Curva de Resistividad Aparente
10
100
1000
10000
1 10 100 1000AB/2 (m)
Resi
stiv
idad
Apa
rente
(O
hm
-m
)
(App
aren
t) R
esis
tivity
[Ohm
-m]
Depth (AB/2) [m]
Apparent Resistivity Data
Theoretical Apparent Resistivity Curve
Resistivity Layered Structure Model

District East Pokot Division KolowaLocation Kolowa Site No. V-163
Site Name CHEPTURU Elevation 104036N UTM-E 813109 UTM-N 130015
Latitude 1.174861 Longitude 35.813278
AB/2(m)
Rho-a(Wm)
1.6 72.6 2.0 58.8 2.5 51.5 3.2 47.0 4.0 40.7 5.0 38.0 6.3 42.0 8.0 37.5 10.0 34.2 13.0 31.1 16.0 30.0 20.0 30.0 25.0 30.5 32.0 32.6 40.0 34.1 50.0 37.6 63.0 43.3 80.0 46.3 100.0 50.4 130.0 57.1 160.0 67.2 200.0 76.1 250.0 89.2
Resistivity Depth
(Ohm.m) (m)71.9 1.4 Dry top superficial layer Dry.
31 21 Loose volcanic soils Dry50 120 Slightly weathered and fractured trachytes Shallow aquifer expected.
500 >120 Highly weathered and fractured trachytes Deep aquifer expected.
Vertical Electric Sounding Datasheet (Schlumberger)
Geological Interpretation Hydrogeological Interpretation
Curva de Resistividad Aparente
1
10
100
1000
1 10 100 1000AB/2 (m)
Resi
stiv
idad
Apa
rente
(O
hm
-m
)
(App
aren
t) R
esis
tivity
[Ohm
-m]
Depth (AB/2) [m]
Apparent Resistivity Data
Theoretical Apparent Resistivity Curve
Resistivity Layered Structure Model
District East Pokot Division KolowaLocation Ng'oron Site No. V-165
Site Name NGORON Elevation 99236N UTM-E 810040 UTM-N 142481
Latitude 1.287528 Longitude 35.785833
AB/2(m)
Rho-a(Wm)
1.6 69.0 2.0 59.1 2.5 54.3 3.2 55.8 4.0 55.6 5.0 52.6 6.3 49.8 8.0 50.6 10.0 46.5 13.0 41.3 16.0 45.0 20.0 48.0 25.0 54.9 32.0 64.6 40.0 74.2 50.0 81.9 63.0 99.7 80.0 106.8 100.0 129.3 130.0 132.2 160.0 174.7 200.0 201.0 250.0 230.7
Resistivity Depth
(Ohm.m) (m)60.6 3.6 Dry top superficial layer Dry.
31 12 Loose volcanic soils Dry136 65 Slightly weathered and fractured trachytes Shallow aquifer expected.500 >65 Highly weathered and fractured trachytes Deep aquifer expected.
Vertical Electric Sounding Datasheet (Schlumberger)
Geological Interpretation Hydrogeological Interpretation
Curva de Resistividad Aparente
1
10
100
1000
1 10 100 1000AB/2 (m)
Res
istivi
dad
Apa
rent
e ( O
hm-m
)
(App
aren
t) R
esis
tivity
[Ohm
-m]
Depth (AB/2) [m]
Apparent Resistivity Data
Theoretical Apparent Resistivity Curve
Resistivity Layered Structure Model
District East Pokot Division KolowaLocation Loiwat Site No. V-168
Site Name CHEPELION Elevation 102236N UTM-E 804322 UTM-N 117721
Latitude 1.063833 Longitude 35.734278
AB/2(m)
Rho-a(Wm)
1.6 46.2 2.0 45.8 2.5 40.3 3.2 38.8 4.0 36.4 5.0 34.8 6.3 32.8 8.0 31.3 10.0 29.1 13.0 27.9 16.0 26.5 20.0 26.5 25.0 18.5 32.0 16.2 40.0 14.4 50.0 14.2 63.0 17.6 80.0 20.2 100.0 23.1 130.0 21.2 160.0 16.0 200.0 14.0
Resistivity Depth
(Ohm.m) (m)55.6 0.8 Dry top superficial layer Dry.
33 10 Loose volcanic soils Dry9 26 Slightly weathered and fractured trachytes moist
46 60 Weathered and fractured trachytes Shallow aquifer expected.8 >60 Highly weathered and fractured trachytes Deep aquifer expected.
Vertical Electric Sounding Datasheet (Schlumberger)
Geological Interpretation Hydrogeological Interpretation
Curva de Resistividad Aparente
1
10
100
1000
1 10 100 1000AB/2 (m)
Res
istivi
dad
Apa
rent
e ( O
hm-m
)
(App
aren
t) R
esis
tivity
[Ohm
-m]
Depth (AB/2) [m]
Apparent Resistivity Data
Theoretical Apparent Resistivity Curve
Resistivity Layered Structure Model
District East Pokot Division KolowaLocation Kipnai Site No. V-169
Site Name KERELON Elevation 130836N UTM-E 816079 UTM-N 115969
Latitude 1.047917 Longitude 35.839833
AB/2(m)
Rho-a(Wm)
1.6 33.1 2.0 28.9 2.5 27.5 3.2 26.6 4.0 25.9 5.0 25.8 6.3 26.7 8.0 28.4 10.0 29.4 13.0 32.3 16.0 38.3 20.0 50.2 25.0 53.6 32.0 44.2 40.0 53.0 50.0 66.1 63.0 87.8 80.0 106.8 100.0 139.9 130.0 174.1 160.0 179.0 200.0 190.0 250.0 180.0
Resistivity Depth
(Ohm.m) (m)94 0.4 Dry top superficial layer Dry. 24 4 Loose volcanic soils Dry37 22 Slightly weathered and fractured trachytes Shallow aquifer expected.
874 100 Fresh trachytic formations No aquifers expected20 >100 Highly weathered and fractured trachytes Deep aquifer expected.
Vertical Electric Sounding Datasheet (Schlumberger)
Geological Interpretation Hydrogeological Interpretation
Curva de Resistividad Aparente
1
10
100
1000
1 10 100 1000AB/2 (m)
Res
istivi
dad
Apa
rent
e ( O
hm-m
)
(App
aren
t) R
esis
tivity
[Ohm
-m]
Depth (AB/2) [m]
Apparent Resistivity Data
Theoretical Apparent Resistivity Curve
Resistivity Layered Structure Model
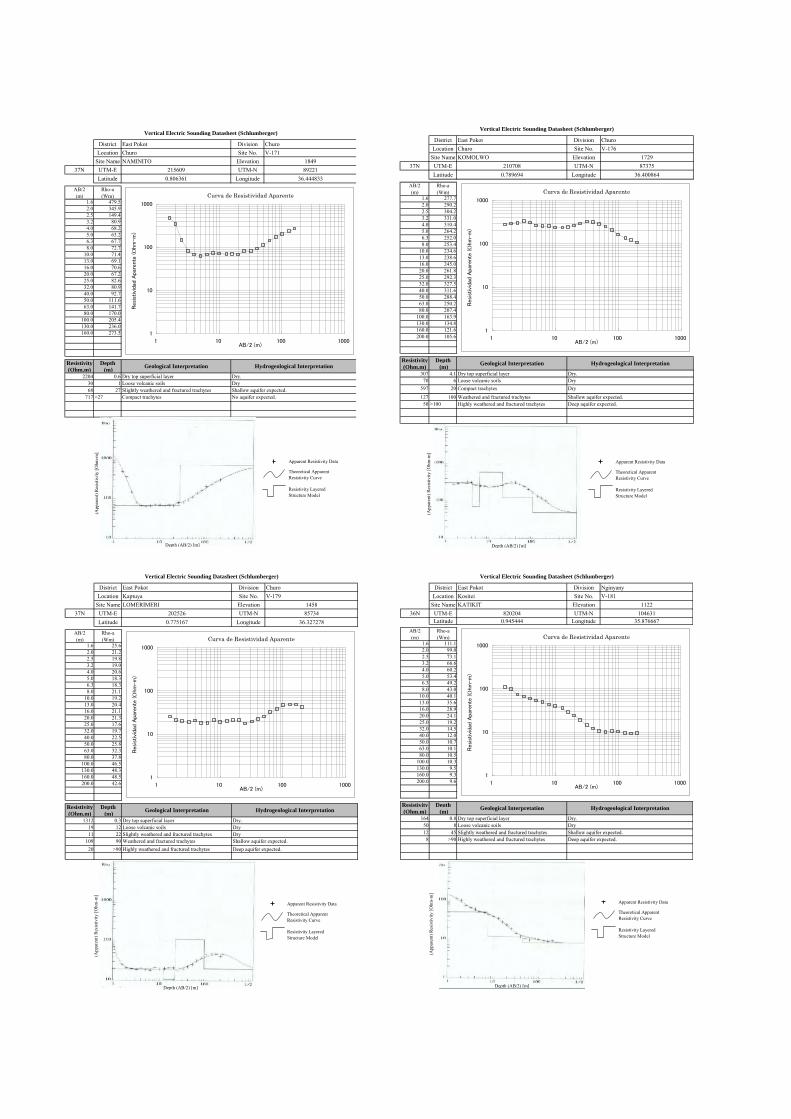
District East Pokot Division ChuroLocation Churo Site No. V-171
Site Name NAMINITO Elevation 184937N UTM-E 215609 UTM-N 89221
Latitude 0.806361 Longitude 36.444833
AB/2(m)
Rho-a(Wm)
1.6 479.5 2.0 345.9 2.5 149.4 3.2 80.9 4.0 68.2 5.0 63.2 6.3 67.7 8.0 72.7 10.0 71.4 13.0 69.1 16.0 70.6 20.0 67.2 25.0 82.6 32.0 80.9 40.0 92.7 50.0 111.6 63.0 141.7 80.0 170.0 100.0 205.4 130.0 236.0 160.0 273.5
Resistivity Depth
(Ohm.m) (m)2204 0.6 Dry top superficial layer Dry.
30 1 Loose volcanic soils Dry68 27 Slightly weathered and fractured trachytes Shallow aquifer expected.
717 >27 Compact trachytes No aquifer expected.
Vertical Electric Sounding Datasheet (Schlumberger)
Geological Interpretation Hydrogeological Interpretation
Curva de Resistividad Aparente
1
10
100
1000
1 10 100 1000AB/2 (m)
Res
istivi
dad
Apa
rent
e ( O
hm-m
)
(App
aren
t) R
esis
tivity
[Ohm
-m]
Depth (AB/2) [m]
Apparent Resistivity Data
Theoretical Apparent Resistivity Curve
Resistivity Layered Structure Model
District East Pokot Division ChuroLocation Churo Site No. V-176
Site Name KOMOLWO Elevation 172937N UTM-E 210708 UTM-N 87375
Latitude 0.789694 Longitude 36.400864
AB/2(m)
Rho-a(Wm)
1.6 277.7 2.0 290.2 2.5 304.2 3.2 331.0 4.0 310.4 5.0 264.2 6.3 252.0 8.0 253.4 10.0 234.6 13.0 238.6 16.0 245.0 20.0 261.8 25.0 292.3 32.0 327.5 40.0 311.6 50.0 288.4 63.0 250.2 80.0 207.4 100.0 163.9 130.0 134.8 160.0 121.6 200.0 105.6
Resistivity Depth
(Ohm.m) (m)307 4.1 Dry top superficial layer Dry.
70 6 Loose volcanic soils Dry597 20 Compact trachytes Dry127 100 Weathered and fractured trachytes Shallow aquifer expected.
50 >100 Highly weathered and fractured trachytes Deep aquifer expected.
Vertical Electric Sounding Datasheet (Schlumberger)
Geological Interpretation Hydrogeological Interpretation
Curva de Resistividad Aparente
1
10
100
1000
1 10 100 1000AB/2 (m)
Resi
stiv
idad
Apa
rente
(O
hm
-m
)
(App
aren
t) R
esis
tivity
[Ohm
-m]
Depth (AB/2) [m]
Apparent Resistivity Data
Theoretical Apparent Resistivity Curve
Resistivity Layered Structure Model
District East Pokot Division ChuroLocation Kaptuya Site No. V-179
Site Name LOMERIMERI Elevation 145837N UTM-E 202526 UTM-N 85734
Latitude 0.775167 Longitude 36.327278
AB/2(m)
Rho-a(Wm)
1.6 25.6 2.0 21.2 2.5 19.8 3.2 19.0 4.0 20.6 5.0 18.3 6.3 18.3 8.0 21.1 10.0 19.2 13.0 20.4 16.0 21.1 20.0 21.3 25.0 17.6 32.0 19.7 40.0 22.5 50.0 25.8 63.0 32.3 80.0 37.8 100.0 46.5 130.0 48.3 160.0 48.5 200.0 42.6
Resistivity Depth
(Ohm.m) (m)1312 0.3 Dry top superficial layer Dry.
19 12 Loose volcanic soils Dry11 22 Slightly weathered and fractured trachytes Dry
109 90 Weathered and fractured trachytes Shallow aquifer expected.20 >90 Highly weathered and fractured trachytes Deep aquifer expected.
Vertical Electric Sounding Datasheet (Schlumberger)
Geological Interpretation Hydrogeological Interpretation
Curva de Resistividad Aparente
1
10
100
1000
1 10 100 1000AB/2 (m)
Res
istivi
dad
Apa
rent
e ( O
hm-m
)
(App
aren
t) R
esis
tivity
[Ohm
-m]
Depth (AB/2) [m]
Apparent Resistivity Data
Theoretical Apparent Resistivity Curve
Resistivity Layered Structure Model
District East Pokot Division NginyanyLocation Kositei Site No. V-181
Site Name KATIKIT Elevation 112236N UTM-E 820204 UTM-N 104631
Latitude 0.945444 Longitude 35.876667AB/2(m)
Rho-a(Wm)
1.6 111.1 2.0 99.0 2.5 73.1 3.2 66.6 4.0 60.2 5.0 53.4 6.3 49.2 8.0 43.0 10.0 40.1 13.0 35.6 16.0 28.9 20.0 24.1 25.0 19.2 32.0 14.5 40.0 12.0 50.0 10.7 63.0 10.1 80.0 10.5 100.0 10.3 130.0 9.5 160.0 9.3 200.0 9.6
Resistivity Depth
(Ohm.m) (m)164 0.8 Dry top superficial layer Dry.
50 8 Loose volcanic soils Dry12 45 Slightly weathered and fractured trachytes Shallow aquifer expected.
8 >90 Highly weathered and fractured trachytes Deep aquifer expected.
Vertical Electric Sounding Datasheet (Schlumberger)
Geological Interpretation Hydrogeological Interpretation
Curva de Resistividad Aparente
1
10
100
1000
1 10 100 1000AB/2 (m)
Res
istivi
dad
Apa
rent
e ( O
hm-m
)
(App
aren
t) R
esis
tivity
[Ohm
-m]
Depth (AB/2) [m]
Apparent Resistivity Data
Theoretical Apparent Resistivity Curve
Resistivity Layered Structure Model
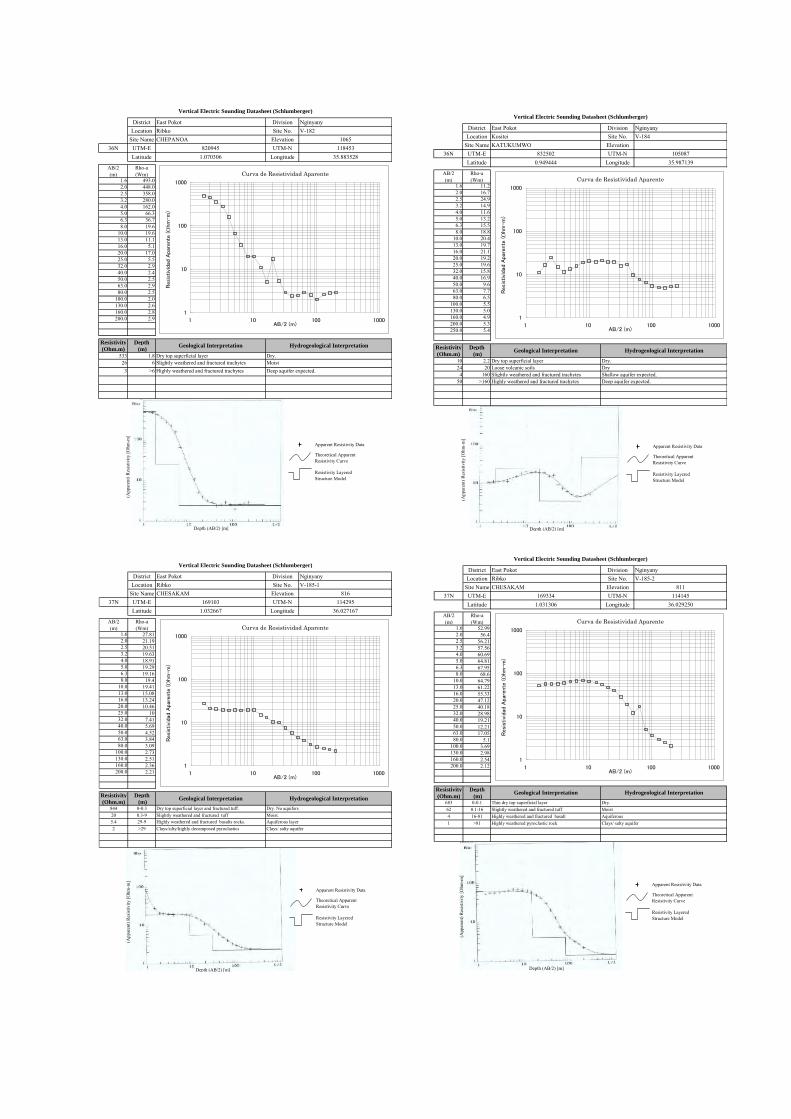
District East Pokot Division NginyanyLocation Ribko Site No. V-182
Site Name CHEPANOA Elevation 106536N UTM-E 820945 UTM-N 118453
Latitude 1.070306 Longitude 35.883528
AB/2(m)
Rho-a(Wm)
1.6 493.0 2.0 448.0 2.5 358.0 3.2 280.0 4.0 162.0 5.0 66.3 6.3 36.7 8.0 19.6 10.0 19.6 13.0 11.1 16.0 5.1 20.0 17.0 25.0 5.5 32.0 2.9 40.0 2.4 50.0 2.5 63.0 2.9 80.0 2.5 100.0 2.0 130.0 2.6 160.0 2.8 200.0 2.9
Resistivity Depth
(Ohm.m) (m)533 1.8 Dry top superficial layer Dry.
26 6 Slightly weathered and fractured trachytes Moist3 >6 Highly weathered and fractured trachytes Deep aquifer expected.
Vertical Electric Sounding Datasheet (Schlumberger)
Geological Interpretation Hydrogeological Interpretation
Curva de Resistividad Aparente
1
10
100
1000
1 10 100 1000AB/2 (m)
Res
istivi
dad
Apa
rent
e ( O
hm-m
)
(App
aren
t) R
esis
tivity
[Ohm
-m]
Depth (AB/2) [m]
Apparent Resistivity Data
Theoretical Apparent Resistivity Curve
Resistivity Layered Structure Model
District East Pokot Division NginyanyLocation Kositei Site No. V-184
Site Name KATUKUMWO Elevation36N UTM-E 832502 UTM-N 105087
Latitude 0.949444 Longitude 35.987139
AB/2(m)
Rho-a(Wm)
1.6 11.2 2.0 16.7 2.5 24.9 3.2 14.9 4.0 11.6 5.0 13.2 6.3 15.5 8.0 18.8 10.0 20.4 13.0 19.7 16.0 21.1 20.0 19.2 25.0 19.6 32.0 15.8 40.0 16.9 50.0 9.6 63.0 7.7 80.0 6.5 100.0 5.5 130.0 5.0 160.0 4.9 200.0 5.3 250.0 5.4
Resistivity Depth
(Ohm.m) (m)10 2.2 Dry top superficial layer Dry. 24 20 Loose volcanic soils Dry
4 160 Slightly weathered and fractured trachytes Shallow aquifer expected.50 >160 Highly weathered and fractured trachytes Deep aquifer expected.
Vertical Electric Sounding Datasheet (Schlumberger)
Geological Interpretation Hydrogeological Interpretation
Curva de Resistividad Aparente
1
10
100
1000
1 10 100 1000AB/2 (m)
Res
istivi
dad
Apa
rent
e ( O
hm-m
)
(App
aren
t) R
esis
tivity
[Ohm
-m]
Depth (AB/2) [m]
Apparent Resistivity Data
Theoretical Apparent Resistivity Curve
Resistivity Layered Structure Model
District East Pokot Division NginyanyLocation Ribko Site No. V-185-1
Site Name CHESAKAM Elevation 81637N UTM-E 169103 UTM-N 114295
Latitude 1.032667 Longitude 36.027167
AB/2(m)
Rho-a(Wm)
1.6 27.81 2.0 21.19 2.5 20.51 3.2 19.63 4.0 18.91 5.0 19.29 6.3 19.16 8.0 19.4 10.0 19.41 13.0 15.08 16.0 13.24 20.0 10.46 25.0 10 32.0 7.41 40.0 5.69 50.0 4.52 63.0 3.84 80.0 3.09 100.0 2.73 130.0 2.51 160.0 2.36 200.0 2.21
Resistivity Depth
(Ohm.m) (m)844 0-0.3 Dry top superficial layer and fractured tuff. Dry. No aquifers 20 0.3-9 Slightly weathered and fractured tuff Moist. 5.4 29-9 Highly weathered and fractured basalts rocks. Aquiferous layer2 >29 Clays/silty/highly decomposed pyroclastics Clays/ salty aquifer
Vertical Electric Sounding Datasheet (Schlumberger)
Geological Interpretation Hydrogeological Interpretation
Curva de Resistividad Aparente
1
10
100
1000
1 10 100 1000AB/2 (m)
Res
istivi
dad
Apa
rent
e ( O
hm-m
)
(App
aren
t) R
esis
tivity
[Ohm
-m]
Depth (AB/2) [m]
Apparent Resistivity Data
Theoretical Apparent Resistivity Curve
Resistivity Layered Structure Model
District East Pokot Division NginyanyLocation Ribko Site No. V-185-2
Site Name CHESAKAM Elevation 81137N UTM-E 169334 UTM-N 114145
Latitude 1.031306 Longitude 36.029250
AB/2(m)
Rho-a(Wm)
1.6 52.99 2.0 56.4 2.5 56.21 3.2 57.56 4.0 60.69 5.0 64.81 6.3 67.95 8.0 68.6 10.0 64.79 13.0 61.22 16.0 55.33 20.0 47.12 25.0 40.18 32.0 28.98 40.0 19.21 50.0 12.21 63.0 17.05 80.0 5.1 100.0 3.69 130.0 2.98 160.0 2.54 200.0 2.12
Resistivity Depth
(Ohm.m) (m)683 0-0.1 Thin dry top superficial layer Dry. 62 0.1-16 Slightly weathered and fractured tuff Moist4 16-81 Highly weathered and fractured basalt Aquiferous1 >81 Highly weathered pyroclastic rock Clays/ salty aquifer
Vertical Electric Sounding Datasheet (Schlumberger)
Geological Interpretation Hydrogeological Interpretation
Curva de Resistividad Aparente
1
10
100
1000
1 10 100 1000AB/2 (m)
Res
istivi
dad
Apa
rent
e ( O
hm-m
)
(App
aren
t) R
esis
tivity
[Ohm
-m]
Depth (AB/2) [m]
Apparent Resistivity Data
Theoretical Apparent Resistivity Curve
Resistivity Layered Structure Model
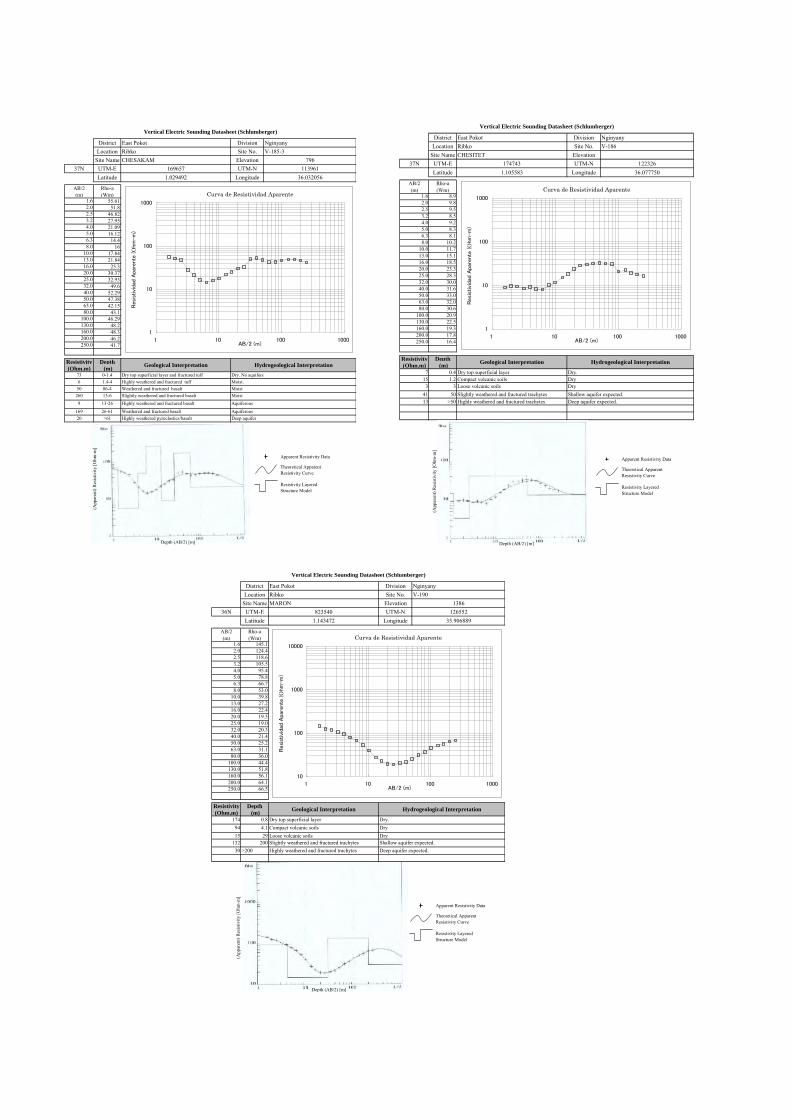
District East Pokot Division NginyanyLocation Ribko Site No. V-185-3
Site Name CHESAKAM Elevation 79637N UTM-E 169657 UTM-N 113961
Latitude 1.029492 Longitude 36.032056
AB/2(m)
Rho-a(Wm)
1.6 55.61 2.0 51.8 2.5 46.82 3.2 27.95 4.0 21.09 5.0 16.12 6.3 14.4 8.0 16 10.0 17.84 13.0 21.84 16.0 25.3 20.0 30.37 25.0 32.93 32.0 49.6 40.0 52.29 50.0 47.38 63.0 42.15 80.0 43.1 100.0 46.29 130.0 48.2 160.0 48.3 200.0 46.2 250.0 41.7
Resistivity Depth
(Ohm.m) (m)73 0-1.4 Dry top superficial layer and fractured tuff Dry. No aquifers6 1.4-4 Highly weathered and fractured tuff Moist.
50 06-4 Weathered and fractured basalt Moist260 13-6 Slightly weathered and fractured basalt Moist
9 13-26 Highly weathered and fractured basalt Aquiferous
169 26-61 Weathered and fractured basalt Aquiferous20 >61 Highly weathered pyroclastics/basalt Deep aquifer
Vertical Electric Sounding Datasheet (Schlumberger)
Geological Interpretation Hydrogeological Interpretation
Curva de Resistividad Aparente
1
10
100
1000
1 10 100 1000AB/2 (m)
Resi
stiv
idad
Apa
rente
(O
hm
-m
)
(App
aren
t) R
esis
tivity
[Ohm
-m]
Depth (AB/2) [m]
Apparent Resistivity Data
Theoretical Apparent Resistivity Curve
Resistivity Layered Structure Model
District East Pokot Division NginyanyLocation Ribko Site No. V-186
Site Name CHESITET Elevation37N UTM-E 174743 UTM-N 122326
Latitude 1.105583 Longitude 36.077750
AB/2(m)
Rho-a(Wm)
1.6 8.9 2.0 9.8 2.5 9.5 3.2 8.5 4.0 9.2 5.0 8.3 6.3 8.1 8.0 10.2 10.0 11.7 13.0 15.1 16.0 18.5 20.0 23.3 25.0 28.3 32.0 30.0 40.0 31.6 50.0 33.0 63.0 32.0 80.0 30.6 100.0 20.9 130.0 22.5 160.0 19.3 200.0 17.8 250.0 16.4
Resistivity Depth
(Ohm.m) (m)7 0.4 Dry top superficial layer Dry.
15 1.2 Compact volcanic soils Dry3 3 Loose volcanic soils Dry
41 50 Slightly weathered and fractured trachytes Shallow aquifer expected.13 >50 Highly weathered and fractured trachytes Deep aquifer expected.
Vertical Electric Sounding Datasheet (Schlumberger)
Geological Interpretation Hydrogeological Interpretation
Curva de Resistividad Aparente
1
10
100
1000
1 10 100 1000AB/2 (m)
Resi
stiv
idad
Apar
ente
(O
hm
-m
)
(App
aren
t) R
esis
tivity
[Ohm
-m]
Depth (AB/2) [m]
Apparent Resistivity Data
Theoretical Apparent Resistivity Curve
Resistivity Layered Structure Model
District East Pokot Division NginyanyLocation Ribko Site No. V-190
Site Name MARON Elevation 138636N UTM-E 823540 UTM-N 126552
Latitude 1.143472 Longitude 35.906889
AB/2(m)
Rho-a(Wm)
1.6 145.1 2.0 124.4 2.5 118.6 3.2 105.5 4.0 95.4 5.0 78.8 6.3 66.7 8.0 53.0 10.0 39.8 13.0 27.2 16.0 22.4 20.0 19.5 25.0 19.0 32.0 20.3 40.0 21.4 50.0 25.2 63.0 31.1 80.0 36.0 100.0 44.4 130.0 51.8 160.0 56.1 200.0 64.1 250.0 66.5
Resistivity Depth
(Ohm.m) (m)174 0.8 Dry top superficial layer Dry.
94 4.1 Compact volcanic soils Dry15 29 Loose volcanic soils Dry
132 200 Slightly weathered and fractured trachytes Shallow aquifer expected.30 >200 Highly weathered and fractured trachytes Deep aquifer expected.
Vertical Electric Sounding Datasheet (Schlumberger)
Geological Interpretation Hydrogeological Interpretation
Curva de Resistividad Aparente
10
100
1000
10000
1 10 100 1000AB/2 (m)
Res
istivi
dad
Apa
rent
e ( O
hm-m
)
(App
aren
t) R
esis
tivity
[Ohm
-m]
Depth (AB/2) [m]
Apparent Resistivity Data
Theoretical Apparent Resistivity Curve
Resistivity Layered Structure Model
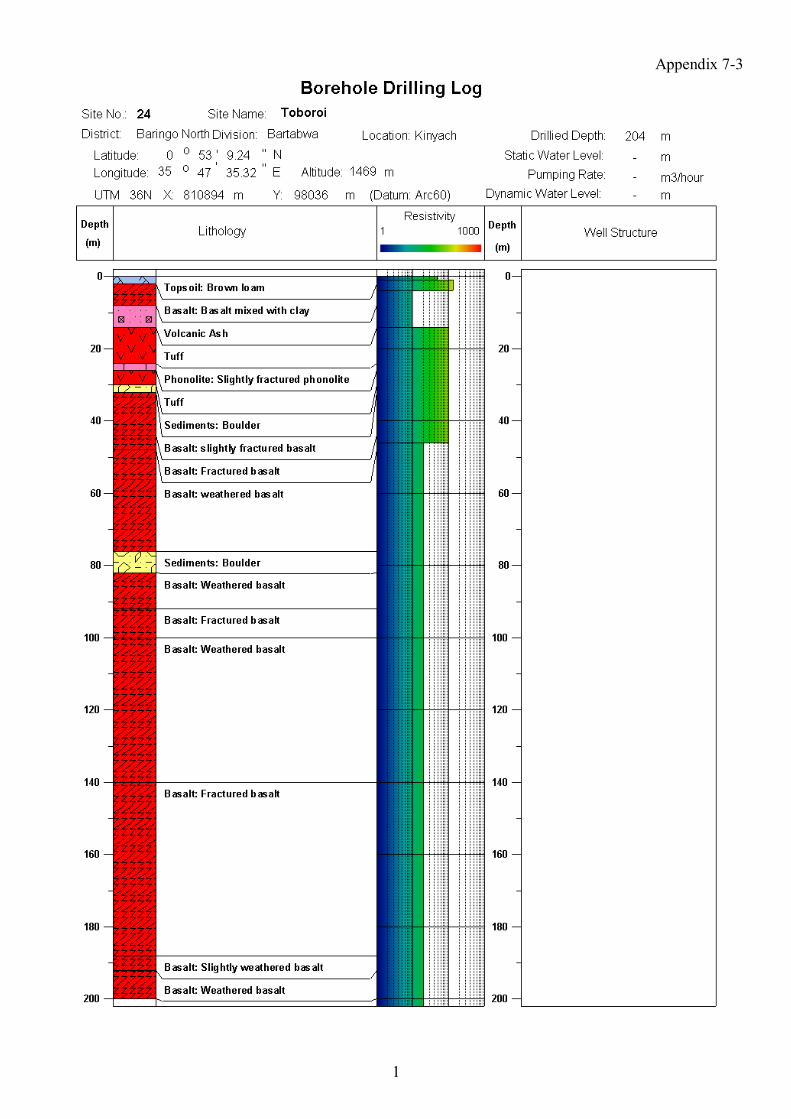
1
Appendix 7-3
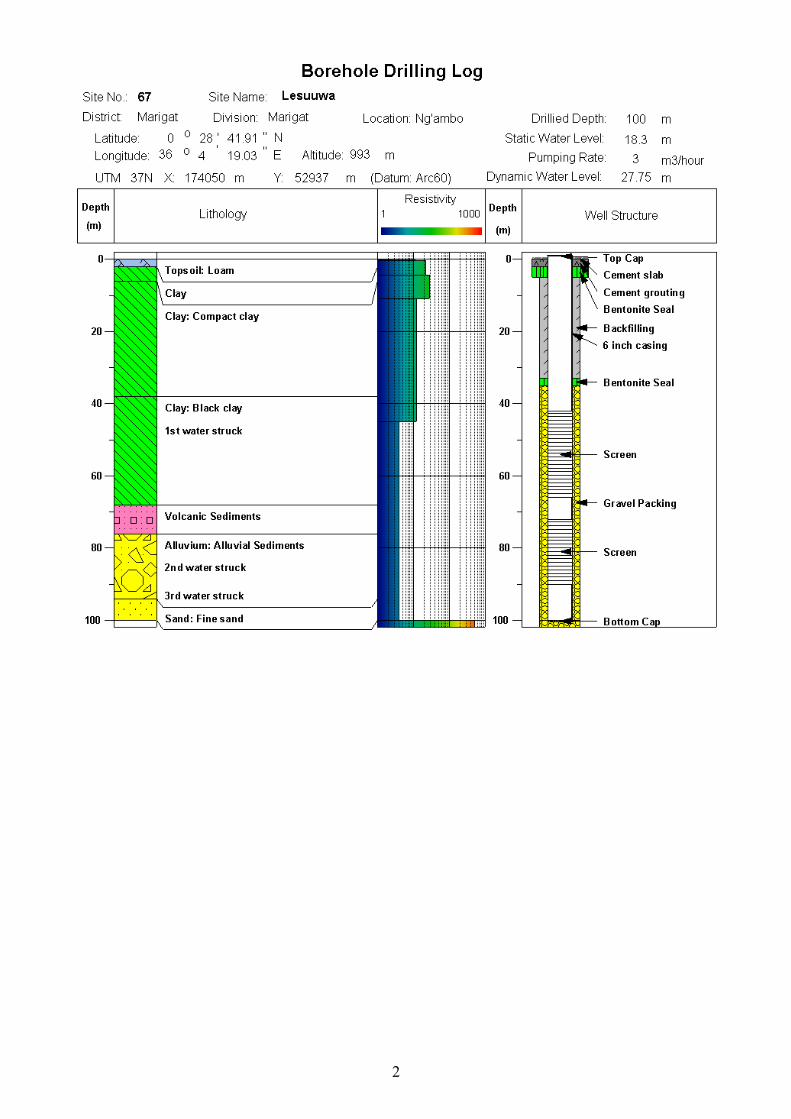
2

3
Critical Yield 4.00 m3/hSafe Yield 3.20 m3/h
s=BQ+CQ2
B= 2.1034C= 0.1431
Q: 3.02 m3/h Q: 3.02 m3/hDs 1.8 m Ds 5.0 mt0 0.0023 min
Transmissivity = 0.307081 m2/h Transmissivity = 0.110549 m2/hStorage Coefficient = 0.002649
Pumping Test Analysis for Lesuuwa (67) Borehole
Drawdown Curve of Step Test
0
10
20
30
40
50
0 60 120 180 240 300Time (min)D
raw
dow
n (m
)
Step Test Analysis
y = 0.1431x2 + 2.1034x
R2 = 0.9807
0
10
20
30
40
50
0 2 4 6 8 10 12 14Discharge (m3/h)
Dra
wdo
wn
(m)
Drawdown Curve of Constant Rate & Recovery Test
0
2
4
6
8
10
12
0 120 240 360 480 600 720 840 960 1080 1200 1320 1440Time (min)
Dra
w D
own
(m)
Constant Rate Test Analysis
0
2
4
6
8
10
12
0.001 0.01 0.1 1 10 100 1000Time (min)
Dra
w D
own
(m)
Recovery Test Analysis
0
1
2
3
4
5
6
7
8
9
10
1 10 100 1000 10000t/t'
Dra
w D
own
(m)
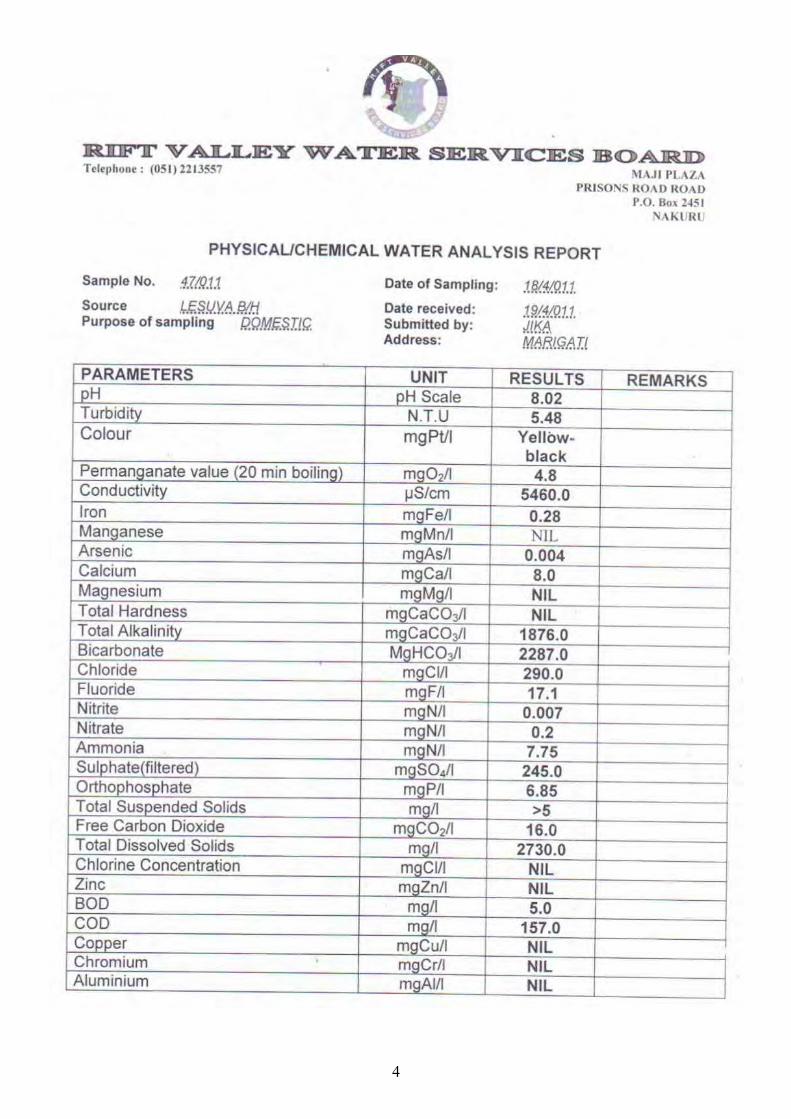
4
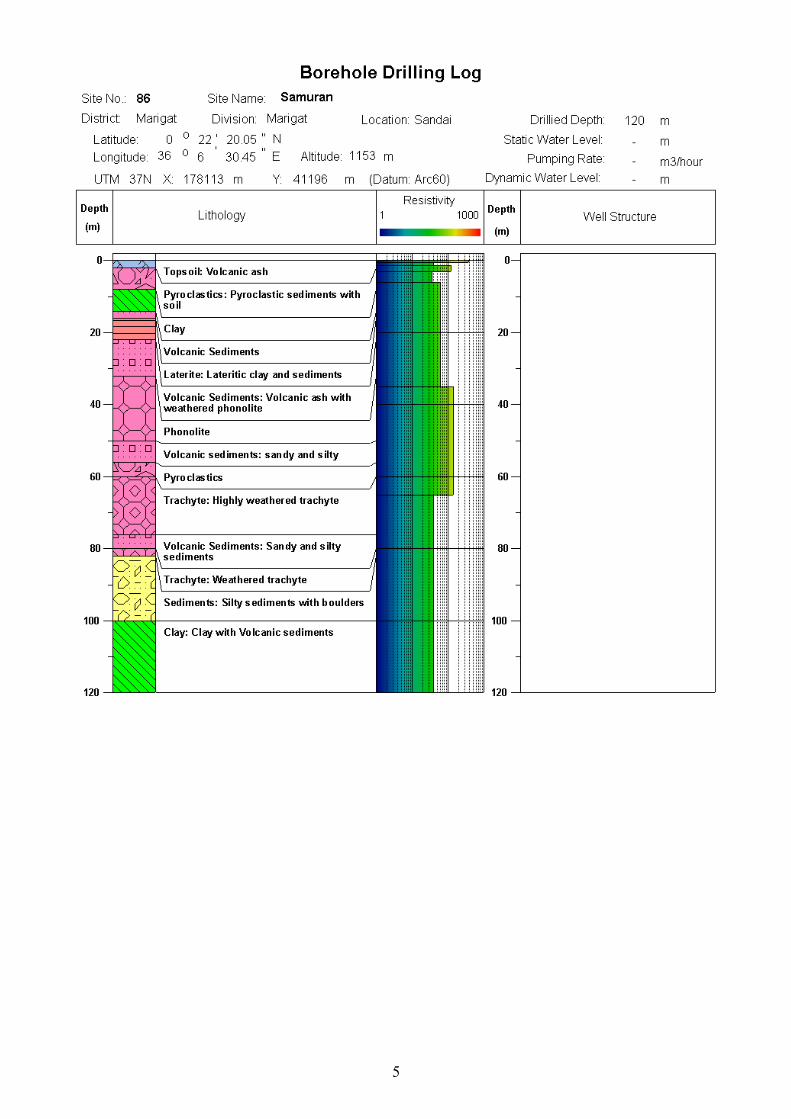
5

6
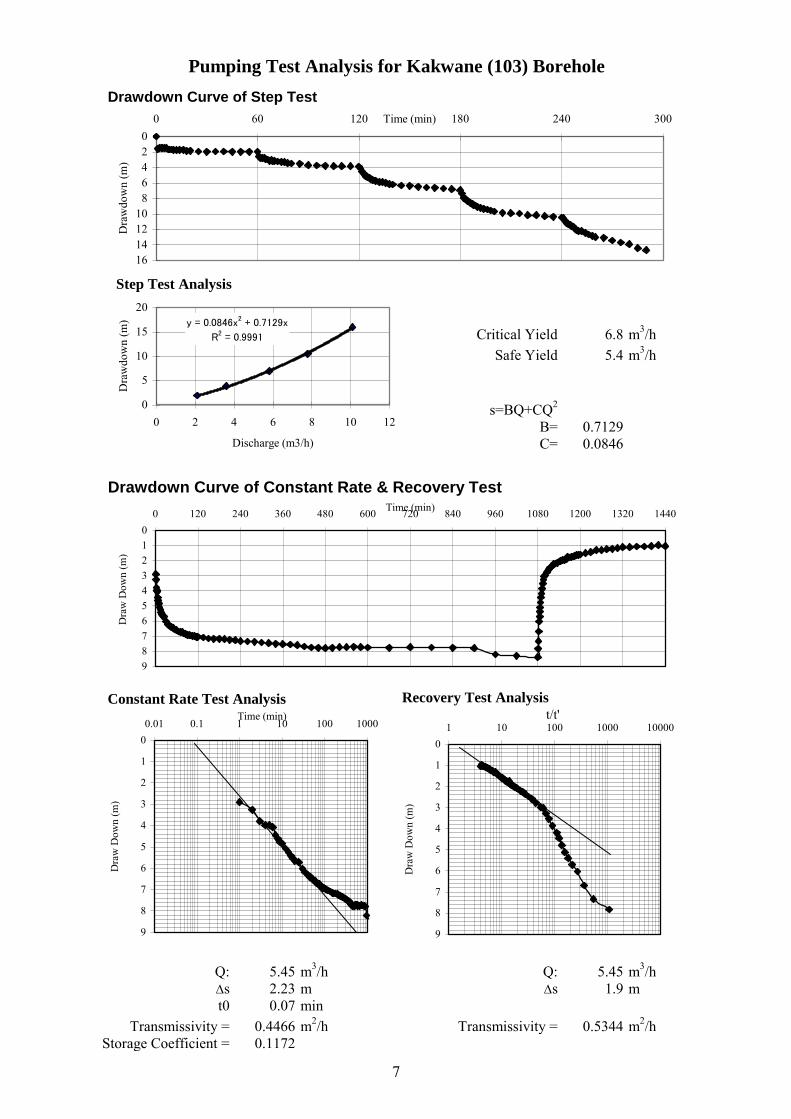
7
Critical Yield 6.8 m3/hSafe Yield 5.4 m3/h
s=BQ+CQ2
B= 0.7129C= 0.0846
Q: 5.45 m3/h Q: 5.45 m3/hDs 2.23 m Ds 1.9 mt0 0.07 min
Transmissivity = 0.4466 m2/h Transmissivity = 0.5344 m2/hStorage Coefficient = 0.1172
Pumping Test Analysis for Kakwane (103) Borehole
Step Test Analysis
y = 0.0846x2 + 0.7129x
R2 = 0.9991
0
5
10
15
20
0 2 4 6 8 10 12
Discharge (m3/h)
Dra
wdo
wn
(m)
Drawdown Curve of Constant Rate & Recovery Test
0123456789
0 120 240 360 480 600 720 840 960 1080 1200 1320 1440Time (min)
Dra
w D
own
(m)
Constant Rate Test Analysis
0
1
2
3
4
5
6
7
8
9
0.01 0.1 1 10 100 1000Time (min)
Dra
w D
own
(m)
Recovery Test Analysis
0
1
2
3
4
5
6
7
8
9
1 10 100 1000 10000t/t'
Dra
w D
own
(m)
Drawdown Curve of Step Test
02468
10121416
0 60 120 180 240 300Time (min)D
raw
dow
n (m
)

8
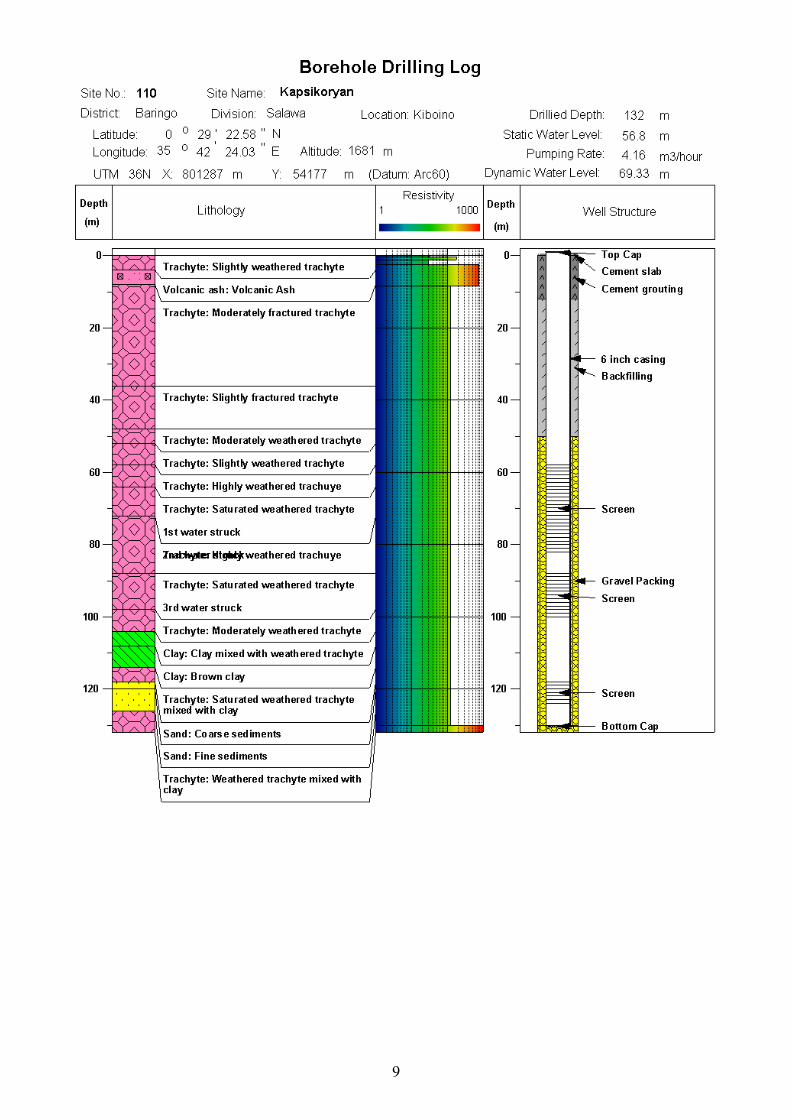
9

10
Critical Yield: 5.20 m3/hSafe Yield: 4.16 m3/h
s=BQ+CQ2
B= 0.515C= 0.0754
Q: 3.6 m3/h Q: 3.6 m3/hDs 7.5 m Ds 21.25 mt0 9 min
Transmissivity = 0.0879 m2/h Transmissivity = 0.0310 m2/hStorage Coefficient = 2.9651
Pumping Test Analysis for Kapsikoryan (110) Borehole
Step Test Analysis
y = 0.0754x2 + 0.5154x
R2 = 0.9934
02468
1012
14
0 2 4 6 8 10 12Discharge (m3/h)
Dra
wdo
wn
(m)
Drawdown Curve of Constant Rate & Recovery Test
05
1015202530354045
0 120 240 360 480 600 720 840 960 1080 1200 1320 1440Time (min)
Dra
w D
own
(m)
Constant Rate Test Analysis
0
2
4
6
8
10
12
14
1 10 100 1000Time (min)
Dra
w D
own
(m)
Recovery Test Analysis
05
1015202530354045
1 10 100 1000 10000t/t'
Dra
w D
own
(m)
Drawdown Curve of Step Test
0
2
4
6
8
10
12
14
0 60 120 180 240 300Time (min)D
raw
dow
n (m
)
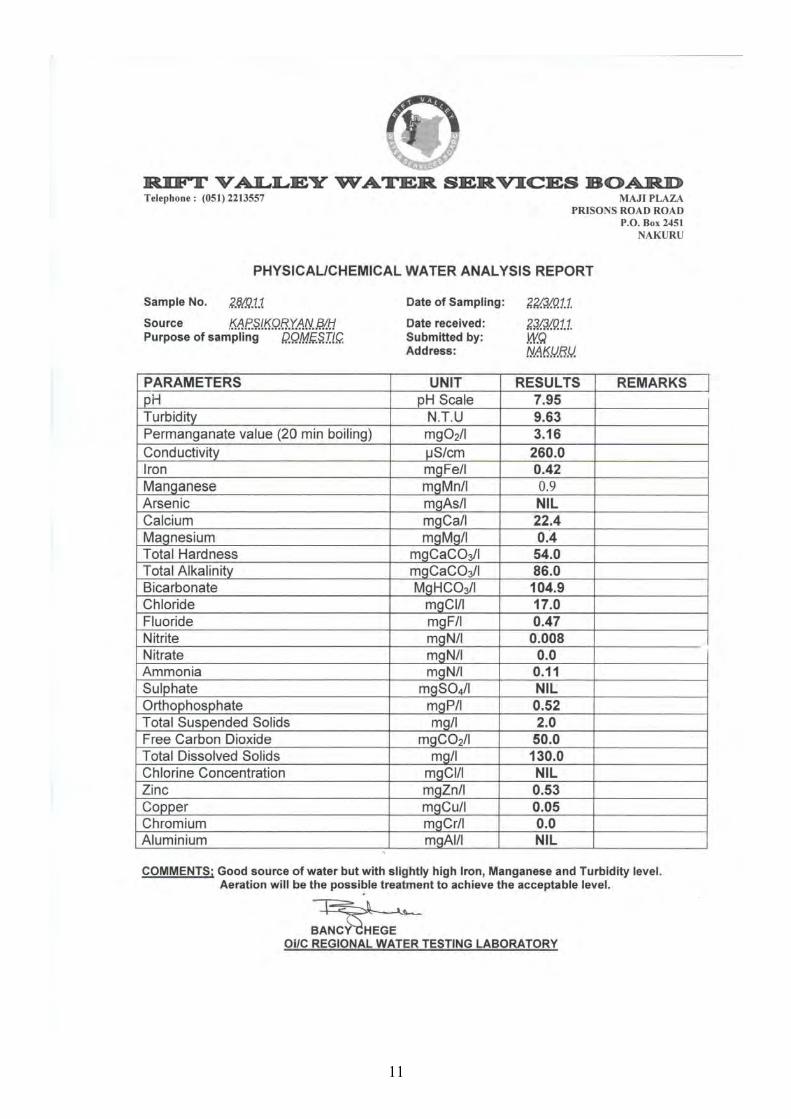
11

12

13

14
Critical Yield 24.2 m3/hSafe Yield 19.4 m3/h
s=BQ+CQ2
B= 0.6425C= 0.0099
Q: 20.2 m3/h Q: 20.2 m3/hDs 4.8 m Ds 5.5 mt0 0.05 min
Transmissivity = 0.7756 m2/h Transmissivity = 0.6722 m2/hStorage Coefficient = 0.1454
Pumping Test Analysis for Kapkawa (137) Borehole
Step Test Analysis
y = 0.0099x2 + 0.6425x
R2 = 0.992
0
5
10
15
20
25
0 5 10 15 20 25 30
Discharge (m3/h)
Dra
wdo
wn
(m)
Drawdown Curve of Constant Rate & Recovery Test
0
5
10
15
20
25
0 120 240 360 480 600 720 840 960 1080 1200 1320 1440Time (min)
Dra
w D
own
(m)
Constant Rate Test Analysis
0
5
10
15
20
25
0.01 0.1 1 10 100 1000Time (min)
Dra
w D
own
(m)
Recovery Test Analysis
0
5
10
15
20
25
1 10 100 1000 10000t/t'
Dra
w D
ow
n (
m)
Drawdown Curve of Step Test
0
5
10
15
20
25
0 60 120 180 240 300Time (min)D
raw
dow
n (m
)

15
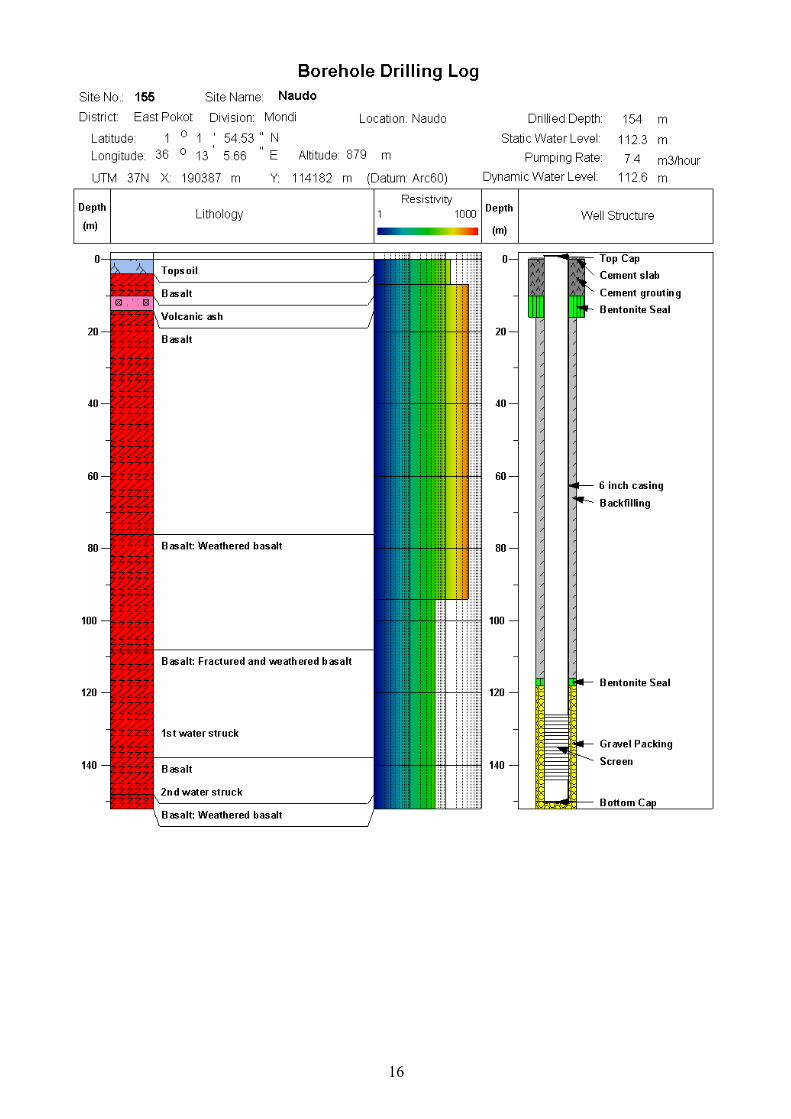
16
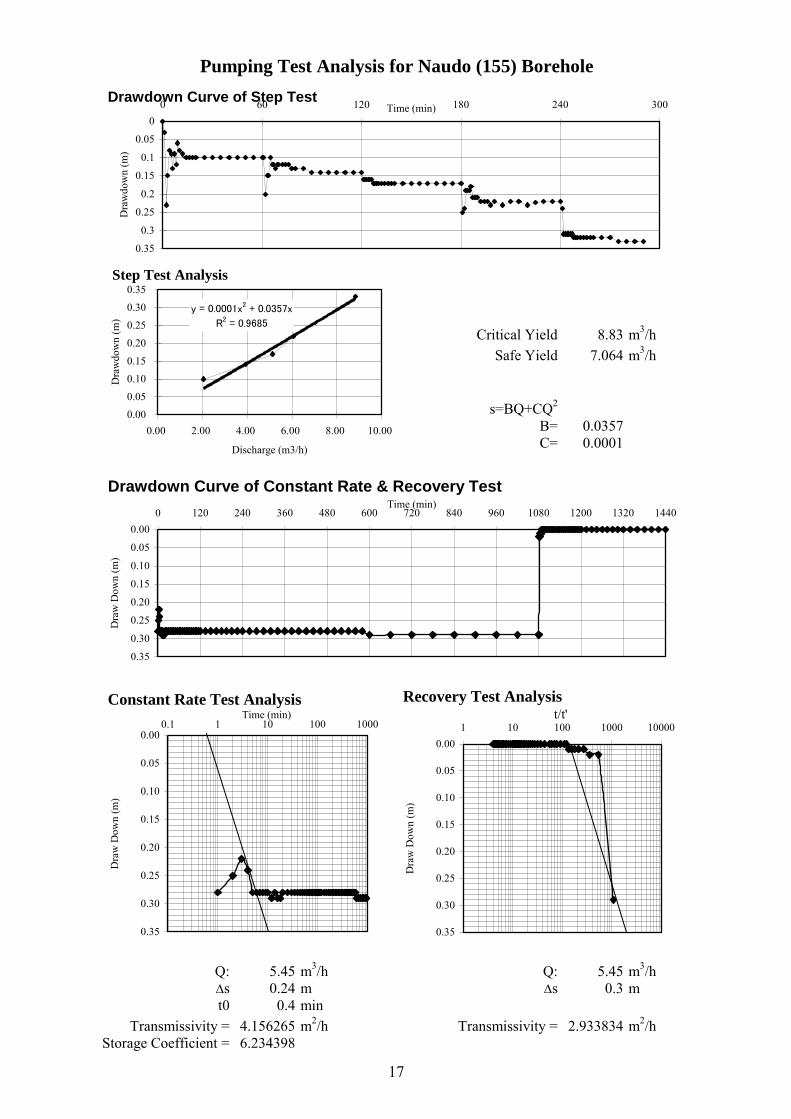
17
Critical Yield 8.83 m3/hSafe Yield 7.064 m3/h
s=BQ+CQ2
B= 0.0357C= 0.0001
Q: 5.45 m3/h Q: 5.45 m3/hDs 0.24 m Ds 0.3 mt0 0.4 min
Transmissivity = 4.156265 m2/h Transmissivity = 2.933834 m2/hStorage Coefficient = 6.234398
Pumping Test Analysis for Naudo (155) Borehole
Step Test Analysis
y = 0.0001x2 + 0.0357x
R2 = 0.9685
0.00
0.05
0.10
0.15
0.20
0.25
0.30
0.35
0.00 2.00 4.00 6.00 8.00 10.00
Discharge (m3/h)
Dra
wdo
wn
(m)
Drawdown Curve of Constant Rate & Recovery Test
0.00
0.05
0.10
0.15
0.20
0.25
0.30
0.35
0 120 240 360 480 600 720 840 960 1080 1200 1320 1440Time (min)
Dra
w D
own
(m)
Constant Rate Test Analysis
0.00
0.05
0.10
0.15
0.20
0.25
0.30
0.35
0.1 1 10 100 1000Time (min)
Dra
w D
own
(m)
Recovery Test Analysis
0.00
0.05
0.10
0.15
0.20
0.25
0.30
0.35
1 10 100 1000 10000t/t'
Dra
w D
own
(m)
Drawdown Curve of Step Test
0
0.05
0.1
0.15
0.2
0.25
0.3
0.35
0 60 120 180 240 300Time (min)D
raw
dow
n (m
)
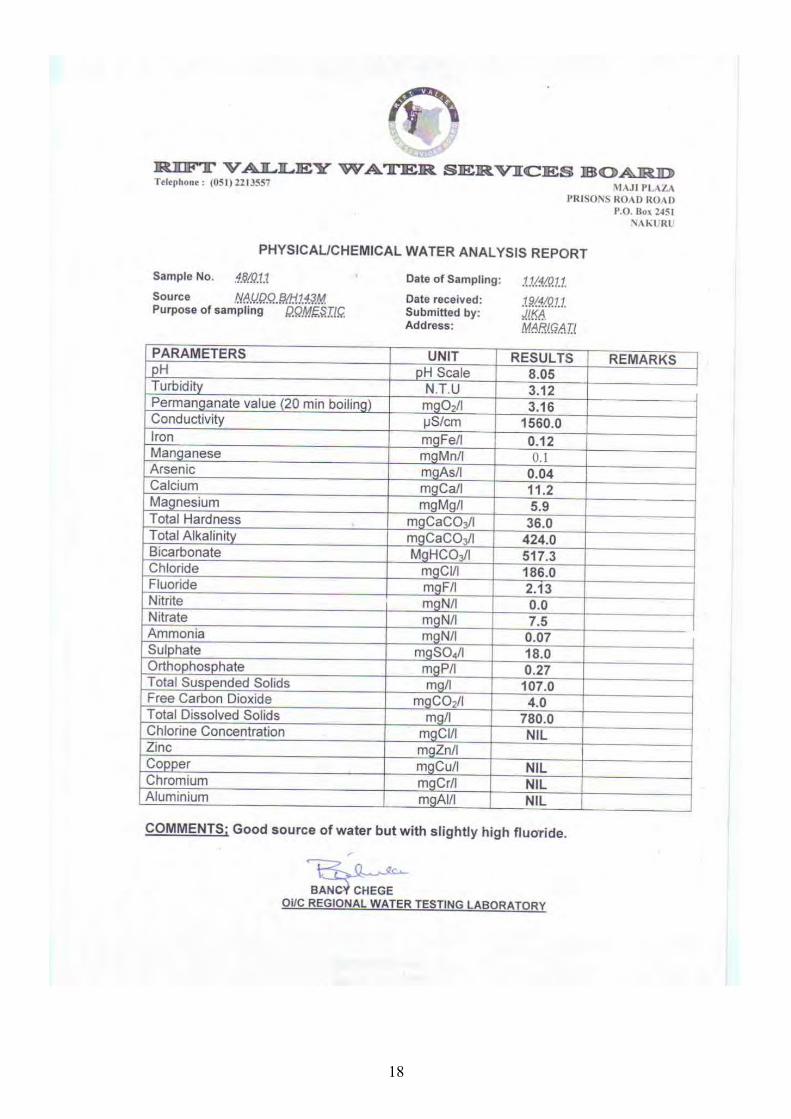
18

19
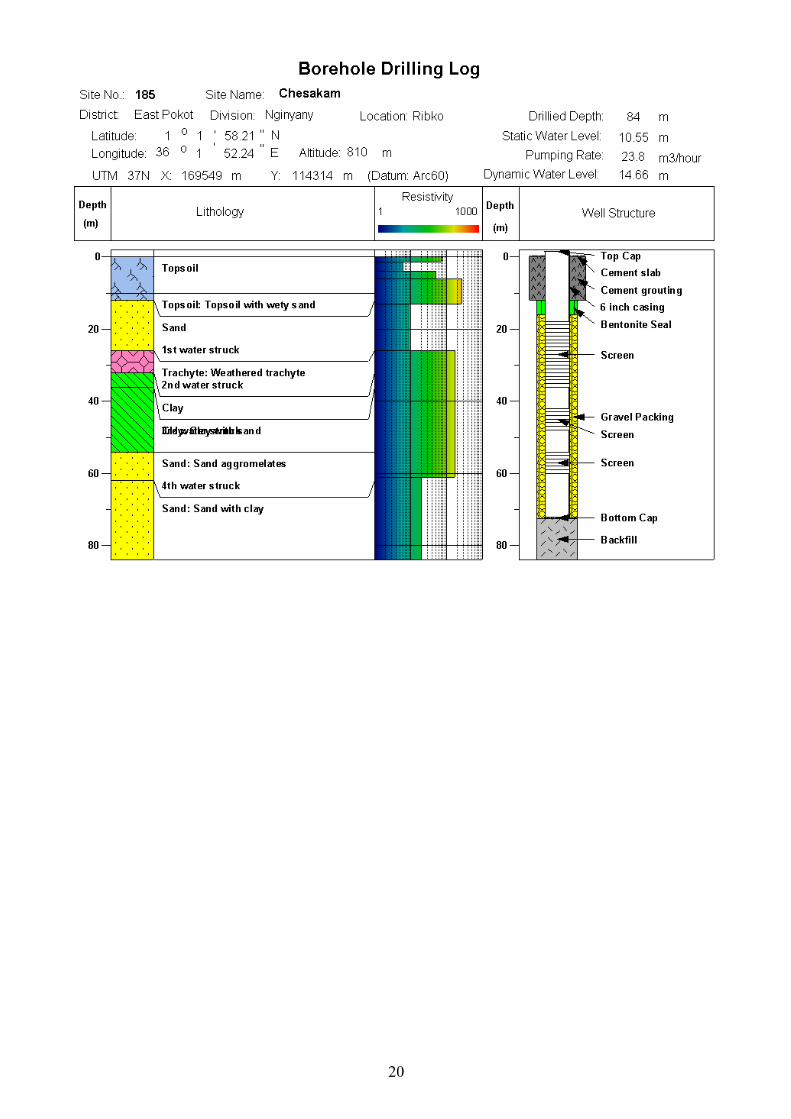
20
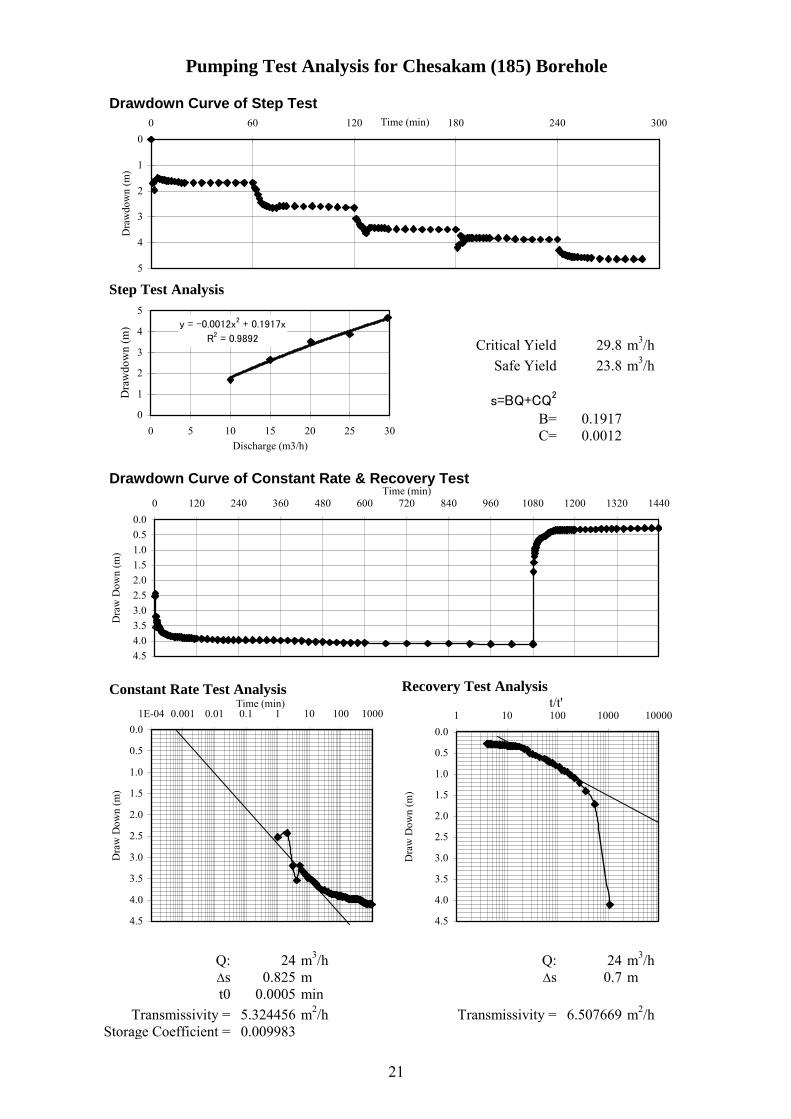
21
Critical Yield 29.8 m3/hSafe Yield 23.8 m3/h
s=BQ+CQ2
B= 0.1917C= 0.0012
Q: 24 m3/h Q: 24 m3/hDs 0.825 m Ds 0.7 mt0 0.0005 min
Transmissivity = 5.324456 m2/h Transmissivity = 6.507669 m2/hStorage Coefficient = 0.009983
Pumping Test Analysis for Chesakam (185) Borehole
Step Test Analysis
y = -0.0012x2 + 0.1917x
R2 = 0.9892
0
1
2
3
4
5
0 5 10 15 20 25 30Discharge (m3/h)
Dra
wdo
wn
(m)
Drawdown Curve of Constant Rate & Recovery Test
0.00.51.01.52.02.53.03.54.04.5
0 120 240 360 480 600 720 840 960 1080 1200 1320 1440Time (min)
Dra
w D
own
(m)
Constant Rate Test Analysis
0.0
0.5
1.0
1.5
2.0
2.5
3.0
3.5
4.0
4.5
1E-04 0.001 0.01 0.1 1 10 100 1000Time (min)
Dra
w D
own
(m)
Recovery Test Analysis
0.0
0.5
1.0
1.5
2.0
2.5
3.0
3.5
4.0
4.5
1 10 100 1000 10000t/t'
Dra
w D
own
(m)
Drawdown Curve of Step Test
0
1
2
3
4
5
0 60 120 180 240 300Time (min)D
raw
dow
n (m
)
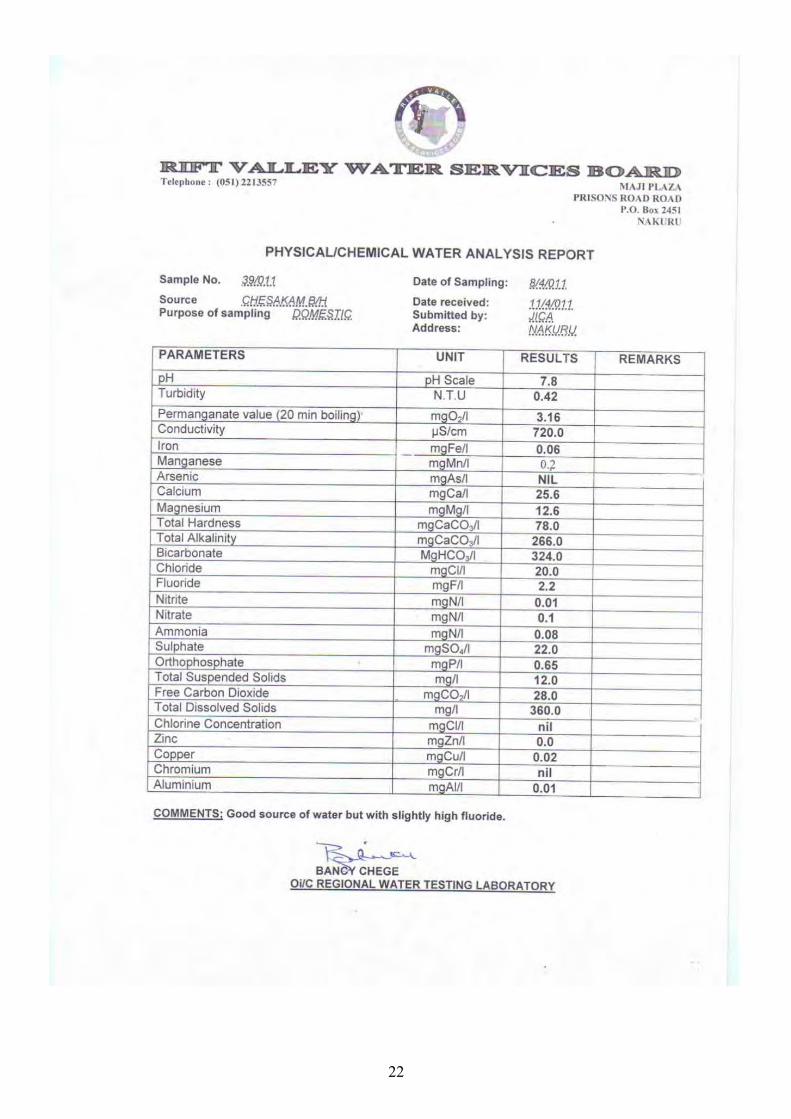
22