APPENDIX E
SOIL THERMAL RESISTIVITY TESTING

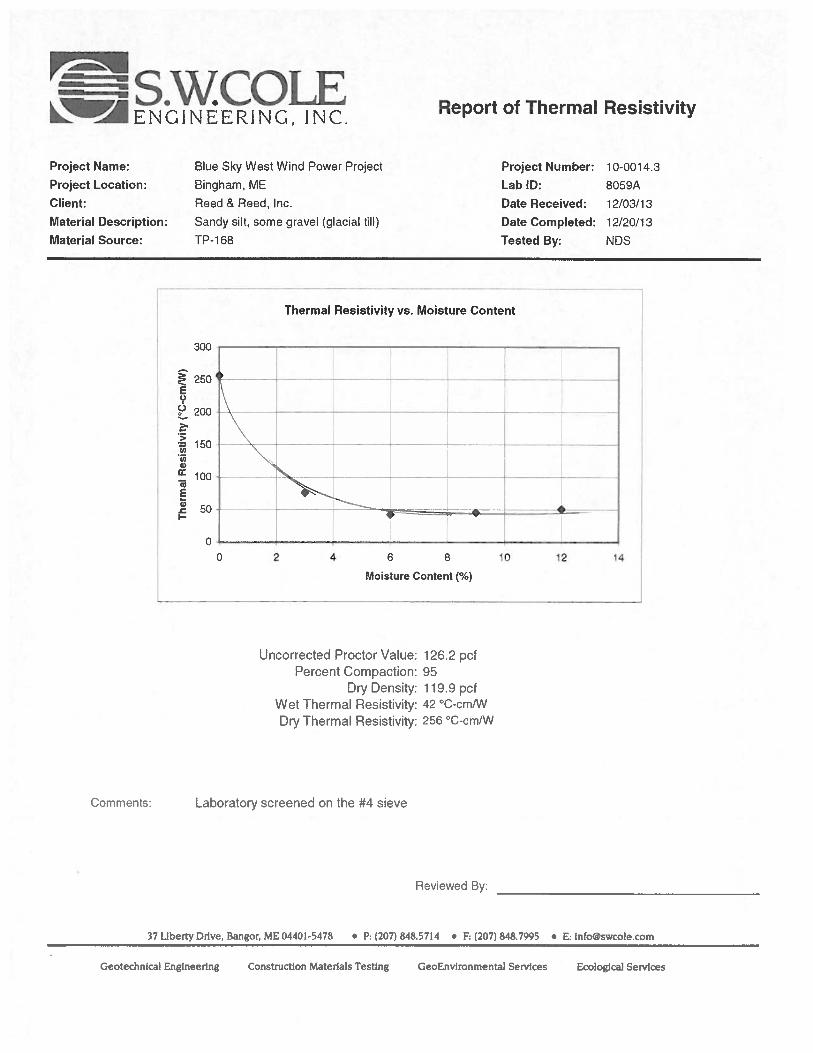
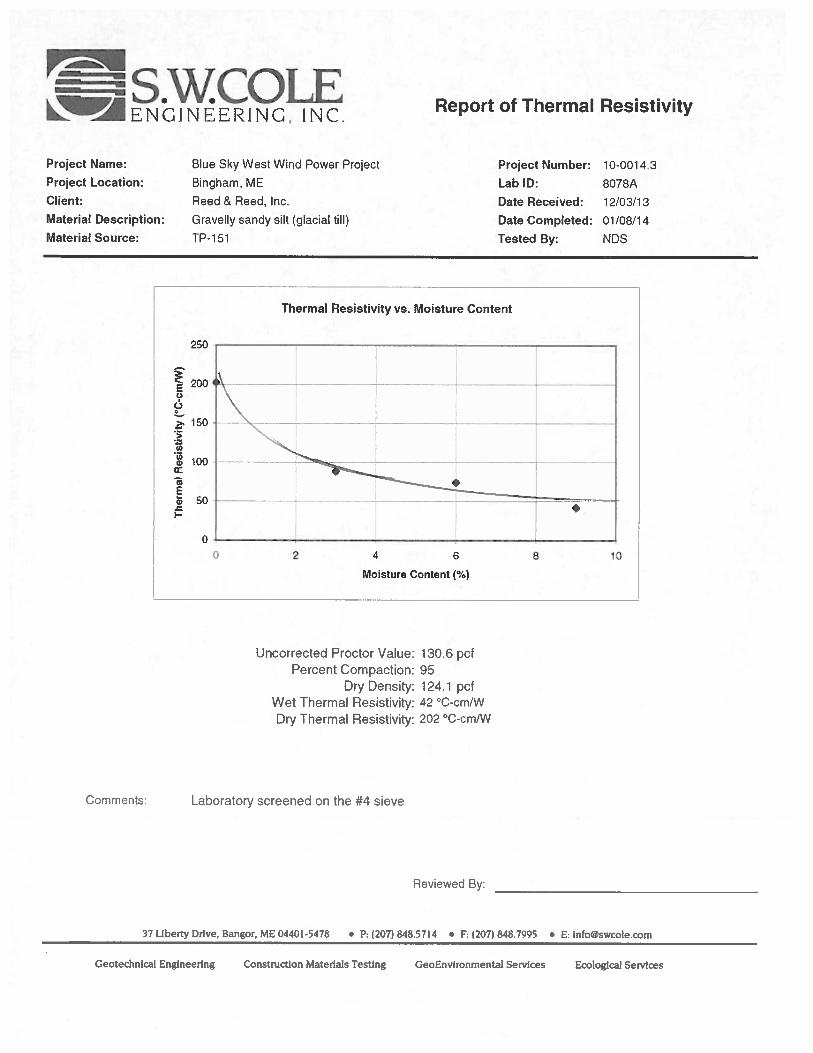
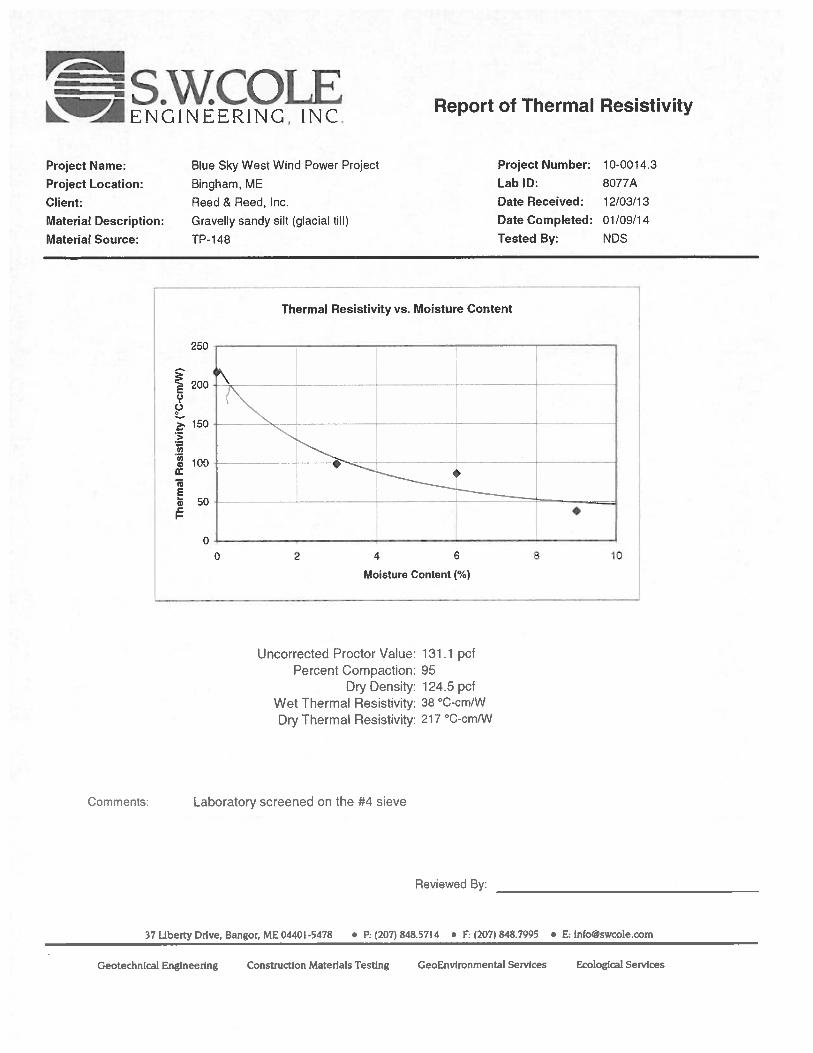
10-0014.3 - BLUE SKY WEST WIND POWER PROJECTTHERMAL RESISTIVITY TESTING SUMMARY
2013 - FIELD LAB TEST RESULTS
rho Depth Density Moisture Temp(0) Density Moisture Density Moisture°C·cm/W (ft) (dry pcf) (%) °C Wet Dry (dry pcf) (%) Wet Dry (dry pcf) (%)
G-TP101 45 1.9 115.1 17 7.83 G-TP101G-TP105 40 3.5 119.1 12.9 9.72 G-TP105 47 169 120 10G-TP107 45 3.1 117.2 11.3 8.47 G-TP107G-TP109 61 2.2 108.9 19.7 7.37 G-TP109G-TP114 39 3.3 118.8 11.2 8.37 G-TP114G-TP120 66 2.8 122.6 4.2 6.25 G-TP120 44 119 133 7G-TP123 53 1.9 112.2 13.4 7.46 G-TP123G-TP126 45 3.5 124.4 14.1 9.55 G-TP126G-TP128 46 2.3 108.1 15.9 6.2 G-TP128 49 171 114 13G-TP129 G-TP129 53 173 125 7G-TP133 48 2.5 122.1 10.5 8.03 G-TP133G-TP137 46 3.1 111.4 12.5 7.72 G-TP137 52 230 121.1 9G-TP141 47 2.2 112 17.3 7.49 G-TP141 49 165 123 10G-TP144 39 3.5 133.1 12.7 7.53 G-TP144 47 162 123 9G-TP146 48 2.8 121.6 11.1 7.56 G-TP146G-TP148 43 3 123.8 11.2 7.35 G-TP148 38 217 124.5 9G-TP151 38 3.4 126 12.9 7.65 G-TP151 42 202 124.1 9G-TP154 G-TP154 48 148 127 8G-TP159 44 2.3 113.7 16.7 6.32 G-TP159 47 135 131 9G-TP154 G-TP154 42 150 126 9G-TP162 37 3.2 120.3 15 7.37 G-TP162G-TP165 43 2.7 122.1 13.3 7.57 G-TP165G-TP167 39 2.2 115.5 15.9 6.52 G-TP167G-TP168 62 2.2 97.2 28.8 8.07 G-TP168 42 256 119.9 12G-TP174 21 3.6 120.1 14.5 7.84 G-TP175 36 248 126.7 6G-TP178 50 1.9 91.2 27.7 6.32 G-TP178 51 170 125 9
Sample ID
FIELD Geotherm Bangorrho -°C·cm/W rho -°C·cm/W
Sample ID
Thermal Resistivity Summary APPENDIX E
COOL SOLUTIONS FOR UNDERGROUND POWER CABLES THERMAL SURVEYS, CORRECTIVE BACKFILLS & INSTRUMENTATION
Serving the electric power industry since 1978
6354 Clark Ave. Dublin, CA 94568 Tel: 925-999-9232 Fax: 925-999-8837 [email protected] http://www.geotherm.net
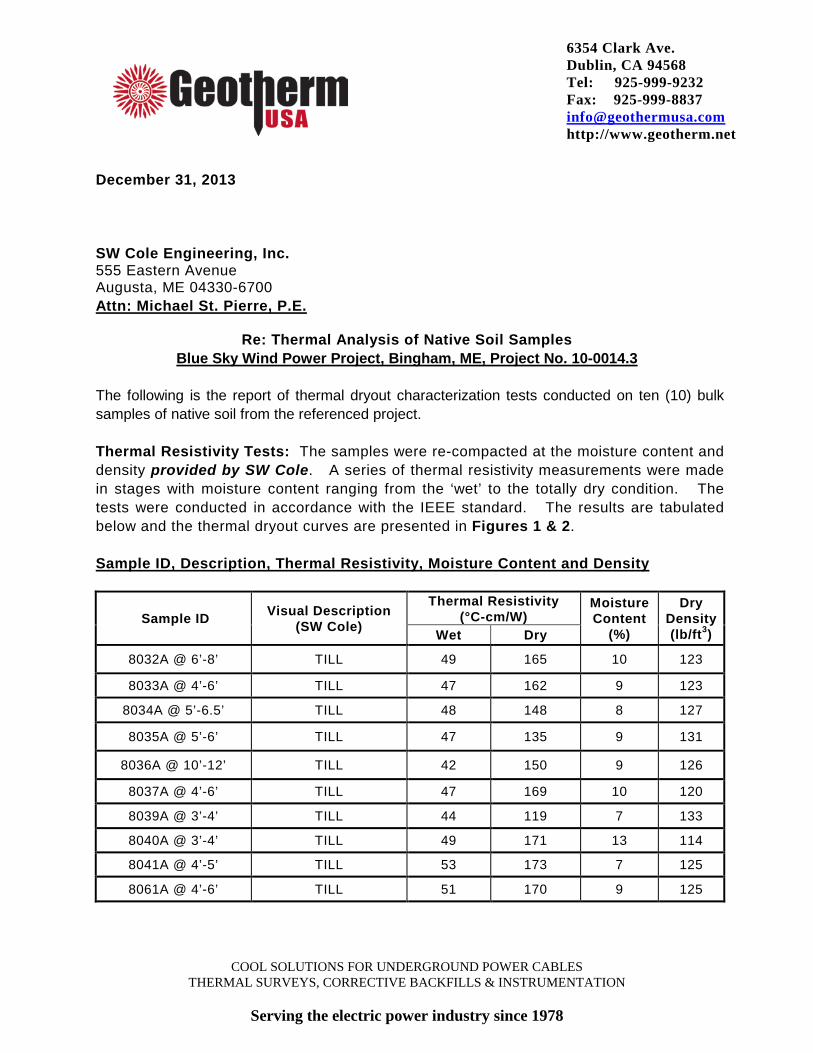
December 31, 2013 SW Cole Engineering, Inc. 555 Eastern Avenue Augusta, ME 04330-6700 Attn: Michael St. Pierre, P.E.
Re: Thermal Analysis of Native Soil Samples Blue Sky Wind Power Project, Bingham, ME, Project No. 10-0014.3
The following is the report of thermal dryout characterization tests conducted on ten (10) bulk samples of native soil from the referenced project. Thermal Resistivity Tests: The samples were re-compacted at the moisture content and density provided by SW Cole. A series of thermal resistivity measurements were made in stages with moisture content ranging from the ‘wet’ to the totally dry condition. The tests were conducted in accordance with the IEEE standard. The results are tabulated below and the thermal dryout curves are presented in Figures 1 & 2. Sample ID, Description, Thermal Resistivity, Moisture Content and Density
Sample ID Visual Description (SW Cole)
Thermal Resistivity (°C-cm/W)
Moisture Content
(%)
Dry Density (lb/ft3) Wet Dry
8032A @ 6’-8’ TILL 49 165 10 123
8033A @ 4’-6’ TILL 47 162 9 123
8034A @ 5’-6.5’ TILL 48 148 8 127
8035A @ 5’-6’ TILL 47 135 9 131
8036A @ 10’-12’ TILL 42 150 9 126
8037A @ 4’-6’ TILL 47 169 10 120
8039A @ 3’-4’ TILL 44 119 7 133
8040A @ 3’-4’ TILL 49 171 13 114
8041A @ 4’-5’ TILL 53 173 7 125
8061A @ 4’-6’ TILL 51 170 9 125

2
Comments: The thermal characteristic depicted in the dryout curves apply for the soils at their respective test dry density. Please contact us if you have any questions or require additional information. Geotherm USA LLC Deepak Parmar

3

4
COOL SOLUTIONS FOR UNDERGROUND POWER CABLES
THERMAL SURVEYS, CORRECTIVE BACKFILLS & INSTRUMENTATION
Serving the electric power industry since 1978
6354 Clark Ave.
Dublin, CA 94568
Tel: 925-999-9232
Fax: 925-999-8837
December 10, 2012 SW Cole Engineering, Inc. 286 Portland Road Gary, ME 04039 Attn: Paul F. Kohler, P.E.
Re: Thermal Analysis of Native Soil Samples Blue Sky West Wind Project
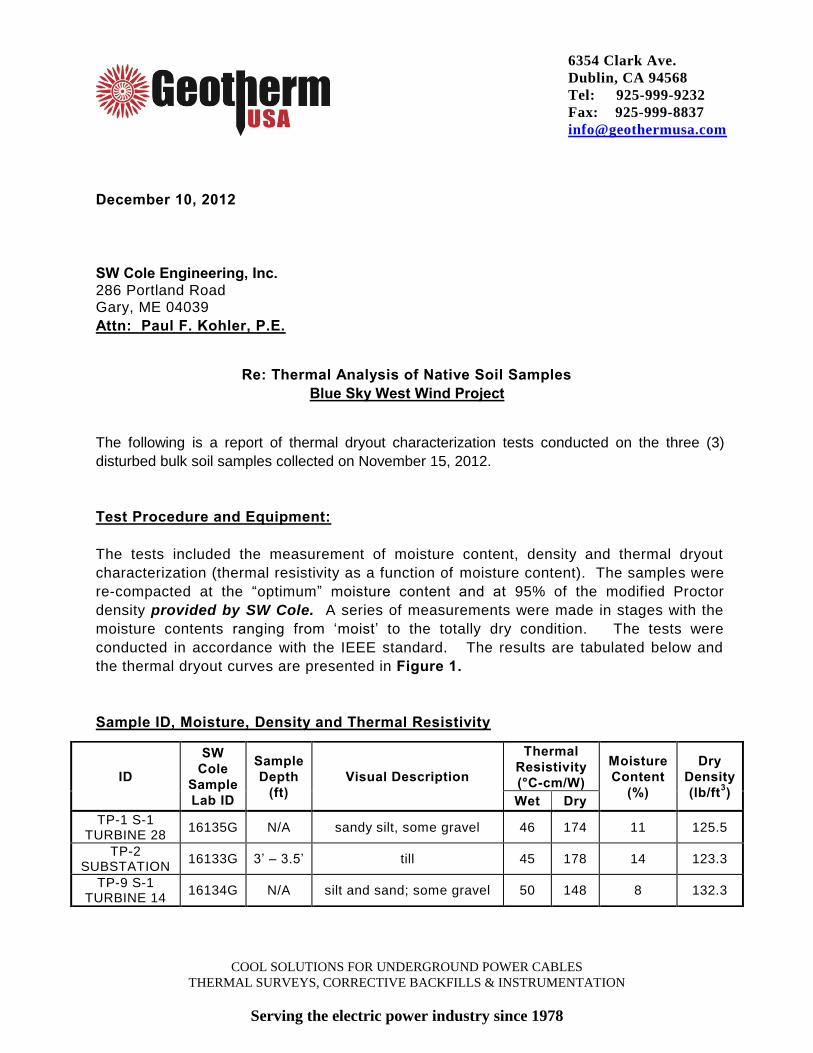
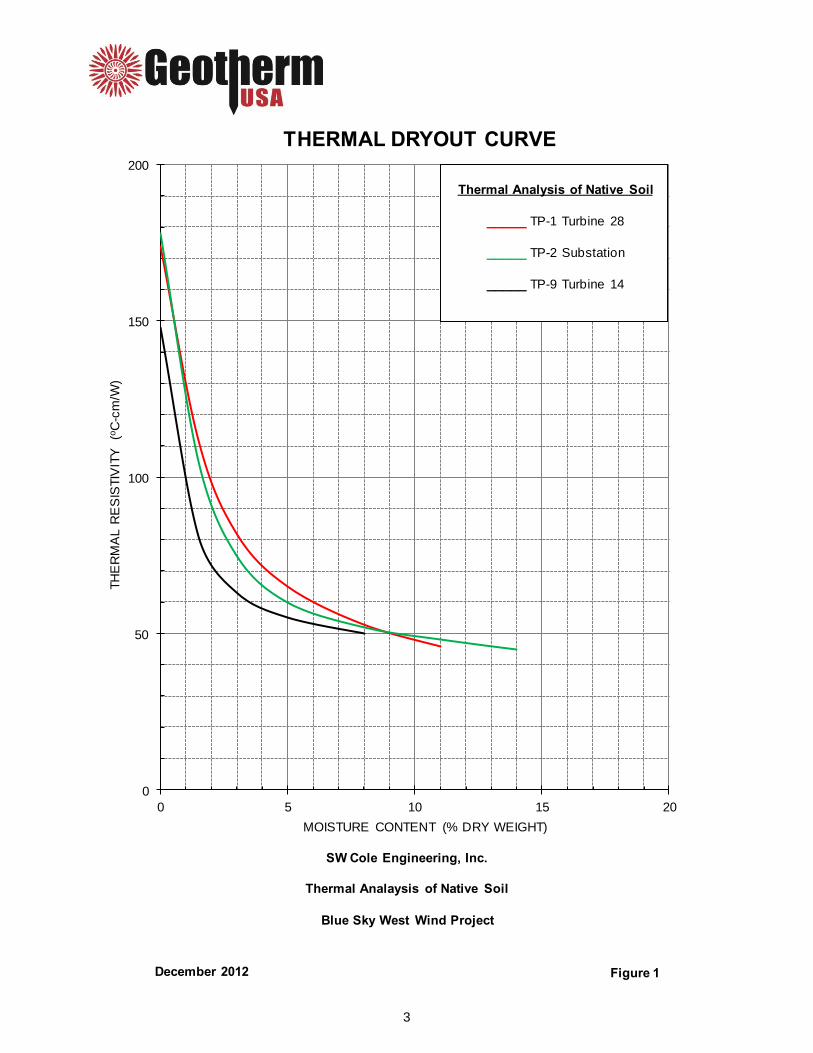
The following is a report of thermal dryout characterization tests conducted on the three (3) disturbed bulk soil samples collected on November 15, 2012. Test Procedure and Equipment: The tests included the measurement of moisture content, density and thermal dryout characterization (thermal resistivity as a function of moisture content). The samples were re-compacted at the “optimum” moisture content and at 95% of the modified Proctor density provided by SW Cole. A series of measurements were made in stages with the moisture contents ranging from ‘moist’ to the totally dry condition. The tests were conducted in accordance with the IEEE standard. The results are tabulated below and the thermal dryout curves are presented in Figure 1. Sample ID, Moisture, Density and Thermal Resistivity
ID
SW Cole
Sample Lab ID
Sample Depth
(ft) Visual Description
Thermal Resistivity (°C-cm/W)
Moisture Content
(%)
Dry Density (lb/ft3) Wet Dry
TP-1 S-1 TURBINE 28 16135G N/A sandy silt, some gravel 46 174 11 125.5
TP-2 SUBSTATION 16133G 3’ – 3.5’ till 45 178 14 123.3
TP-9 S-1 TURBINE 14 16134G N/A silt and sand; some gravel 50 148 8 132.3
2
Comments: Please contact us if you have any questions, wish to discuss any part of this report or if we can be of further assistance. Geotherm USA
Nimesh Patel Please Note: Samples will be disposed of after 5 days from date of report
3
0
50
100
150
200
0 5 10 15 20
THE
RM
AL
RE
SIS
TIV
ITY
(o C
-cm
/W)
MOISTURE CONTENT (% DRY WEIGHT)
THERMAL DRYOUT CURVE
SW Cole Engineering, Inc.
December 2012 Figure 1
Thermal Analaysis of Native Soil
Blue Sky West Wind Project
Thermal Analysis of Native Soil
_____ TP-1 Turbine 28
_____ TP-2 Substation
_____ TP-9 Turbine 14