Download - Appendix E - Geotechnical Investigation

DUNLOP STREET MUNICIPAL CLASS CENVIRONMENTAL ASSESSMENT – GEOTECHNICALREPORT
Project No.: 0BM-18-8036
Prepared for:
City of Barrie70 Collier StreetBarrie, ONL4M 1G8
Prepared by:
McIntosh Perry Consulting Engineers Ltd.1-1329 Gardiners RoadKingston, OntarioK7P 0L8
January 23rd, 2020

Dunlop Street Municipal Class C Environmental Assessment –Geotechnical Report 0BM-18-8036
TABLE OF CONTENTS
1.0 INTRODUCTION ...................................................................................................................................... 1
2.0 BACKGROUND ........................................................................................................................................ 1
Traffic Data ...................................................................................................................................................... 2
3.0 FIELD INVESTIGATION............................................................................................................................. 2
4.0 LABORATORY TESTING ........................................................................................................................... 2
5.0 EXISTING CONDITIONS ........................................................................................................................... 3
Pavement Condition.......................................................................................................................................... 3
Asphalt Cores .................................................................................................................................................... 3
Granular Base ................................................................................................................................................... 3
Granular Subbase ............................................................................................................................................. 3
Subgrade .......................................................................................................................................................... 4
5.5.1 Sand and Silty Sand ................................................................................................................................... 4
5.5.2 Silt and Sandy Silt ...................................................................................................................................... 4
5.5.3 Clay and Silty Clay ..................................................................................................................................... 4
Groundwater .................................................................................................................................................... 4
6.0 PRELIMINARY RECOMMENDATIONS ...................................................................................................... 4
Pavement Design .............................................................................................................................................. 4
6.1.1 New Pavement Construction ..................................................................................................................... 5
6.1.2 Pavement Rehabilitation ........................................................................................................................... 5
6.1.3 Additional Paving Considerations .............................................................................................................. 6
Open Cut Excavations ....................................................................................................................................... 6
6.2.1 Excavations ............................................................................................................................................... 6
6.2.2 Bedding .................................................................................................................................................... 6
6.2.3 Backfill ...................................................................................................................................................... 6
6.2.4 Groundwater Control ................................................................................................................................ 7
6.2.5 OHSA Soil Classification ............................................................................................................................. 7
Soil Chemical Analysis for Excavated Materials ................................................................................................. 7
Soil Corrosivity Potential and Recommendations on Cement Type ..................................................................... 7
Dunlop Street Municipal Class C Environmental Assessment –Geotechnical Report 0BM-18-8036
Future Investigations for Detailed Design .......................................................................................................... 8
7.0 CLOSURE ................................................................................................................................................. 9
8.0 REFERENCES ......................................................................................................................................... 11
Appendices
Appendix A Key Plans and Borehole LocationsAppendix B Asphalt Core Logs and PhotographsAppendix C Borehole Plots and LogsAppendix D Aggregate and Soil Geotechnical Laboratory ResultsAppendix E Soil Chemical Testing Results

Dunlop Street Municipal Class C Environmental Assessment –Geotechnical Report 0BM-18-8036
1
1.0 INTRODUCTIONThe City of Barrie has retained McIntosh Perry Consulting Engineers (MP) to complete a Municipal ClassEnvironmental Assessment study for Dunlop Street West, from 150 m west of Ferndale Drive North to CedarPoint Drive and from the Highway 400 E/W-N ramp to 150 m east of Anne Street North. The geotechnicalcomponent of this assignment includes a review of background documentation, field investigations, materialstesting and the preparation of a Geotechnical Investigation Report including design alternatives forimprovements on Dunlop Street West, and the extension of Hart Drive. It is understood that the City of Barrieenvisions these improvements to include the widening of Dunlop Street West from 4 lanes to 6 lanes.
Figure 1 - Project Key Map
2.0 BACKGROUNDWithin the project limits, Dunlop street is a multi-lane urban roadway, consisting of two main lanes in bothdirections and with a continuous left-turn lane in the section west of Highway 400. Dunlop street forms aconnection between Downtown Barrie and Highway 400, and eventually becomes County Road 90 to the westof the city. The traffic volumes on Dunlop Street were estimated to be approximately 28,800 AADT in 2017,with a projected increase to 56,700 in 2040.
According to The Physiography of Southern Ontario (Chapman and Putnam, 1984), the project limits lie withinthe Simcoe Lowlands physiographic region, characterized by sand plains with intermittent beach forms anddeposits of peat and muck. The underlying bedrock in the area is typically Ordovician sedimentary formations,such as the Simcoe Group, consisting of limestones, dolostones, shales and sandstones1.

Dunlop Street Municipal Class C Environmental Assessment –Geotechnical Report 0BM-18-8036
2
Traffic Data
Table 1 summarizes the traffic data for both directions in 2017 and the projected volumes over a 20-yearperiod. For the purposes of design, a conservative 2% growth rate was estimated.
Table 1 - Dunlop Street Projected Traffic Volumes
Dunlop Street
Dir. 2017 2020 2030 2040
AADTE 12400 13500 18100 24300W 16400 17900 24100 32400
Total 28800 31400 42200 56700%COM 6%
3.0 FIELD INVESTIGATIONSubsequent to appropriate health and safety preparation, utility clearances, implementation of proper trafficcontrol and notification of road authorities, a geotechnical field investigation was carried out in May 2019during approved hours for lane closures. The purpose of the field investigation was to establish the pavementstructure, subgrade conditions and frost susceptibility, and presence of groundwater to aid in the preliminarydesign recommendations.
The field investigation program consisted of the advancement of boreholes using direct push method, to adepth of 5.18 m. The drilling was carried out by Tri-Phase Group under the supervision of MP field staff. Tubeand grab samples were recovered, logged and placed into sealed plastic bags for laboratory testing. Boreholeswere decommissioned as per O.Reg. 903 and its amendments. Borehole locations were referenced to UTMZone 17N to sub-metre accuracy and input into gINT borehole logs.
4.0 LABORATORY TESTINGThe recovered samples from the sample tubes were visually analyzed and submitted for soils and analyticalchemical testing. The following tests were completed:
· Grain Size Analysis (Sieve);· Grain Size Analysis (Hydrometer);· Moisture Content;· Atterberg Limits;· Metals & Inorganics; and· Corrosivity Package.
Results of the testing are discussed in the following sections; full testing results are included in Appendix D andAppendix E.

Dunlop Street Municipal Class C Environmental Assessment –Geotechnical Report 0BM-18-8036
3
5.0 EXISTING CONDITIONS
Pavement Condition
The pavement between Cedar Point Drive and Ferndale Drive is generally in fair to good condition, exhibitingmoderate centreline cracking throughout, intermittent transverse cracking, and few midlane longitudinalcracks.
The pavement on Dunlop Street between the Hwy 400 E/W-N ramp and Anne Street is in relatively poorcondition, exhibiting frequent moderate transverse cracking with slight alligatoring and frequent moderate tosevere longitudinal cracking.
Detailed descriptions of the subsurface conditions are included in the borehole logs, in Appendix C. In general,the pavement structure consisted of 148 mm of asphalt, 422 mm granular base and 1072 mm granular subbase,over silty sand to clay subgrade.
Asphalt Cores
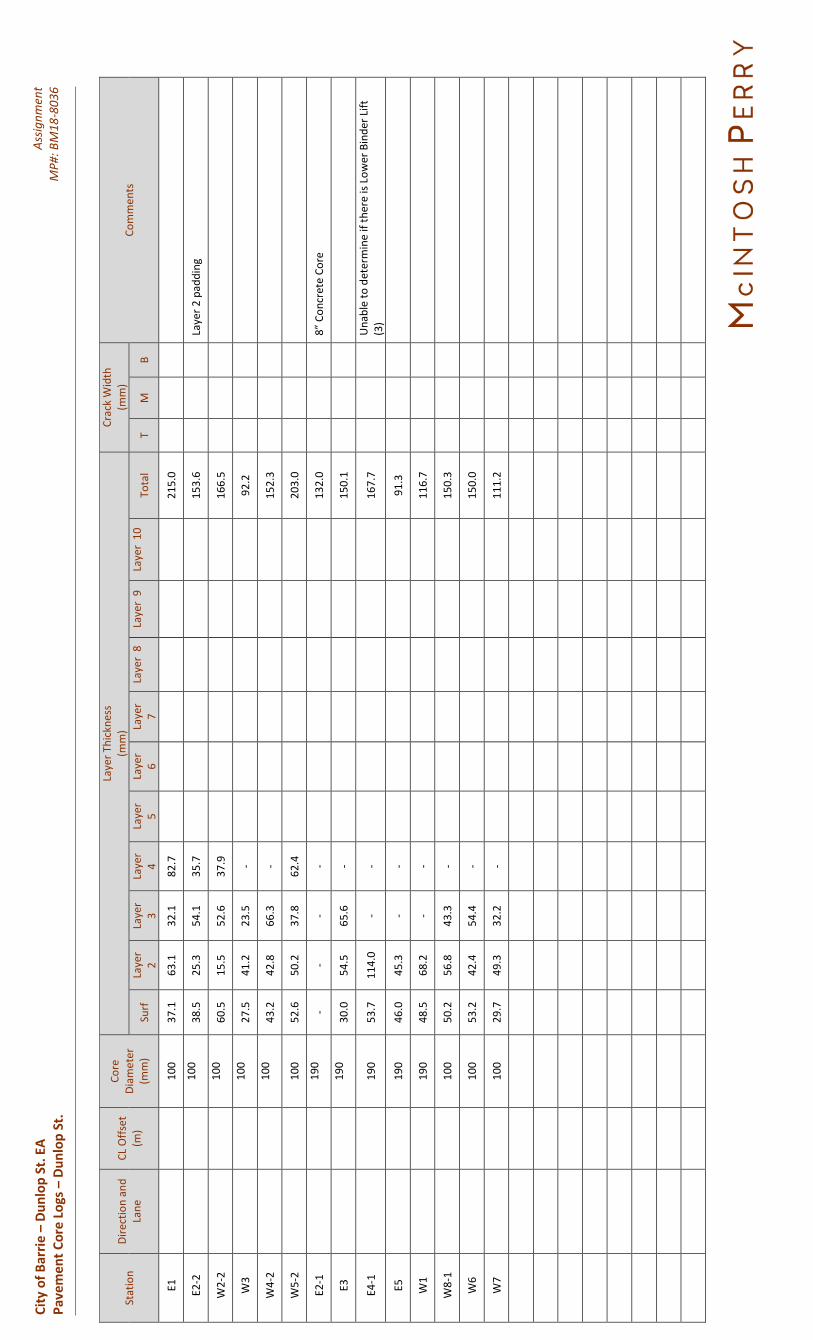
Thirteen (13) asphalt cores and one (1) concrete core were taken within the project limits. In general, theasphalt cores consisted of 2-4 lifts and averaged 148 mm in overall thickness. Lift thickness ranged from 30 mmto 80 mm. Asphalt core logs and photographs are found in Appendix B.
Granular Base
The granular base material generally consists of Sand, with Gravel, some Silt. Grain size analysis testing onsamples collected during the field investigations indicated that the material does not meet the criteria forGranular A, but generally passes on the Granular B Type I criteria. However, the granular base appears to beperforming adequately, as performance issues of the asphalt do not appear to be due to structural deficiencies.The granular base was 333 mm in average thickness east of Hwy 400 and 486 mm in thickness west of Hwy400. Moisture content testing performed on select samples of granular base indicated the moisture contentranged from approximately 4 – 9%.
Granular Subbase
The granular subbase was variable, though was generally composed of sand, some gravel, some silt. Grain sizeanalysis testing indicated that the material does not meet the criteria for Granular B Type I, due to excess finespassing the 0.075 mm sieve. Performance issues on Dunlop Street do not appear to be indicative of structuralinsufficiencies and the material appears to be performing adequately. Moisture content testing conducted onselect samples indicated that the moisture content was generally moist to wet with a water content ofapproximately 11.5%.

Dunlop Street Municipal Class C Environmental Assessment –Geotechnical Report 0BM-18-8036
4
Subgrade
5.5.1 Sand and Silty Sand
Sand and silty sand subgrade material was encountered in all boreholes except W1. The materials were of lowfrost susceptibility and were generally moist to wet, with water contents between 4 and 19% where tested.The sandy subgrade material was saturated in boreholes W2-1 and E4-1, at depths of 2.9 m and 3.8 m,respectively.
5.5.2 Silt and Sandy Silt
Silt and sandy silt subgrade materials were also encountered in Borehole E4-1 and W2-1. Grain size analysistesting on a sample taken from Borehole E4-1 indicated a highly frost susceptible material, and material testedfrom borehole W2-1 displayed low susceptibility to frost heaving.
5.5.3 Clay and Silty Clay
Clay and silty clay subgrade materials were also encountered in boreholes W1, W4-1 and W5-1 at depthsranging from 1.2 – 5.1 m. The clay was generally noted to be wet and ranged from soft to dense. The clay inborehole W1 was noted to be saturated at a depth of 1.2 m. Moisture content testing on sample SS-6 indicateda water content of 18.2%.
Groundwater
Groundwater was encountered in three (3) boreholes, E4-1, W2-1, and W-1 at an average depth of 2.65 m.
6.0 PRELIMINARY RECOMMENDATIONS
Pavement Design
For the purposes of pavement design for this assignment, AASHTO 1993 methodology was used to determinethe required structural capacity of the pavement and evaluate preliminary designs. It is noted that a detaileddesign of a paving alternative would generally require a more thorough geotechnical field investigation thanwhat was completed for this assignment.
The following AASHTO 1993 design criteria have been selected:
Dunlop Street Municipal Class C Environmental Assessment –Geotechnical Report 0BM-18-8036
5
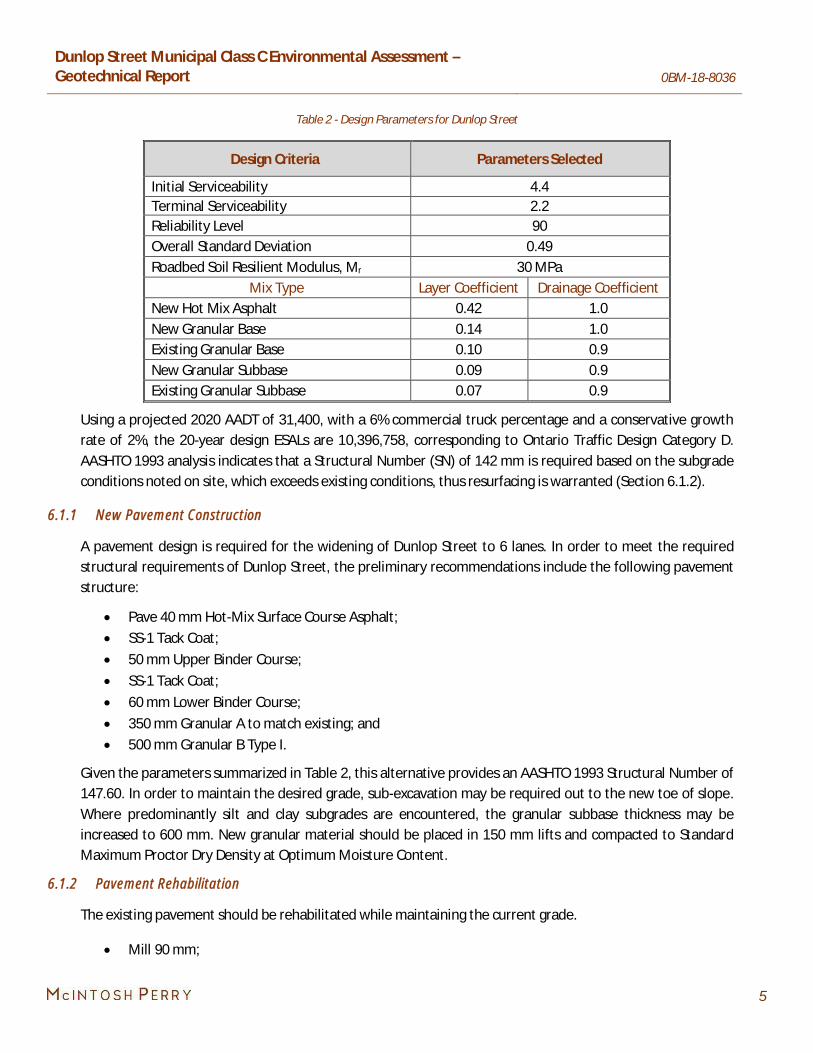
Table 2 - Design Parameters for Dunlop Street
Design Criteria Parameters Selected
Initial Serviceability 4.4Terminal Serviceability 2.2Reliability Level 90Overall Standard Deviation 0.49Roadbed Soil Resilient Modulus, Mr 30 MPa
Mix Type Layer Coefficient Drainage CoefficientNew Hot Mix Asphalt 0.42 1.0New Granular Base 0.14 1.0Existing Granular Base 0.10 0.9New Granular Subbase 0.09 0.9Existing Granular Subbase 0.07 0.9
Using a projected 2020 AADT of 31,400, with a 6% commercial truck percentage and a conservative growthrate of 2%, the 20-year design ESALs are 10,396,758, corresponding to Ontario Traffic Design Category D.AASHTO 1993 analysis indicates that a Structural Number (SN) of 142 mm is required based on the subgradeconditions noted on site, which exceeds existing conditions, thus resurfacing is warranted (Section 6.1.2).
6.1.1 New Pavement Construction
A pavement design is required for the widening of Dunlop Street to 6 lanes. In order to meet the requiredstructural requirements of Dunlop Street, the preliminary recommendations include the following pavementstructure:
· Pave 40 mm Hot-Mix Surface Course Asphalt;· SS-1 Tack Coat;· 50 mm Upper Binder Course;· SS-1 Tack Coat;· 60 mm Lower Binder Course;· 350 mm Granular A to match existing; and· 500 mm Granular B Type I.
Given the parameters summarized in Table 2, this alternative provides an AASHTO 1993 Structural Number of147.60. In order to maintain the desired grade, sub-excavation may be required out to the new toe of slope.Where predominantly silt and clay subgrades are encountered, the granular subbase thickness may beincreased to 600 mm. New granular material should be placed in 150 mm lifts and compacted to StandardMaximum Proctor Dry Density at Optimum Moisture Content.
6.1.2 Pavement Rehabilitation
The existing pavement should be rehabilitated while maintaining the current grade.
· Mill 90 mm;

Dunlop Street Municipal Class C Environmental Assessment –Geotechnical Report 0BM-18-8036
6
· Pave 40 mm Hot-Mix Surface Course Asphalt, over;· SS-1 Tack Coat, over;· 50 mm Hot-Mix Binder Course Asphalt, over;· SS-1 Tack Coat.
6.1.3 Additional Paving Considerations
It is noted that the Hwy 400/Dunlop Street I/C will be realigned and constructed with new asphalt. It issuggested that the friction course of the hot-mix surface course asphalt used on Dunlop Street paving be thesame as that of the Hwy 400 Ramps.
Open Cut Excavations
6.2.1 Excavations
Excavations must be carried out in accordance with current Occupational Health and Safety Act (OHSA) ofOntario, local regulations and OPSS 401. The soils present within the project limits are generally consideredsuitable for excavation using excavation and trenching equipment, in accordance with Type 3 soil regulations.Very loose sands were encountered in three (3) boreholes within anticipated excavation depths. Cobbles werenoted to be present within some subgrade sands. Boulders are not anticipated to be encountered frequently.If groundwater is encountered during excavations soils should be treated as Type 4 as per the OccupationalHealth and Safety Regulation for Construction Projects. Deep (>6 m) excavations may require additionalfoundations design, including temporary retaining systems. The detailed excavation recommendations will beconfirmed once utility pipe elevations are established.
6.2.2 Bedding
Sewer and watermain bedding materials must conform to the requirements laid out in OPSD 802.010 forflexible pipes and to OPSD 802.030, 802.031 and 802.032, as appropriate, for rigid pipes. The undisturbedsubgrade material is generally suitable to support the installation of sewer and watermain in conjunction withthe use of granular bedding material; however, there are localized areas where poor material exists withinpotential excavation depths. Where saturated sands, or soft silts and clays are encountered within the desiredexcavation depth, the material should be removed in accordance with O.Reg. 153 Table 3 guidelines, andreplaced with Granular A. Bedding and cover for pipe installations shall be Granular A or well-graded GranularB Type I, as available. The detailed bedding recommendations will be confirmed once utility pipe elevations areestablished.
6.2.3 Backfill
The native materials encountered during the investigation are generally suitable for reuse as backfill. Materialthat contains excess topsoil, organics, water or other deleterious materials should not be used as backfill.Backfill materials shall be compacted in accordance with OPSS 501.
Dunlop Street Municipal Class C Environmental Assessment –Geotechnical Report 0BM-18-8036
7
6.2.4 Groundwater Control
Groundwater may be encountered during trenching for pipes at depths greater than approximately 2.6 m.Where groundwater is encountered, the implementation of dewatering provisions will be required to maintaindry excavations. Field testing and detailed analyses for the dewatering requirements are covered underHydrogeological Site Assessment Report Section 3.2.3 Dewatering Volumes (inflow to excavation). Thedewatering requirements will be finalized for detailed design subsequent to determining the size and depthsof excavations.
6.2.5 OHSA Soil Classification
For the purposes of excavations, OHSA delineates four classifications of soils based on strength and moistureproperties. The soils encountered within the project limits, including silty sands, sandy silts and clayey sandsand silts can be classified as Type 3 soils above the water table and Type 4 soils below the water table.
Soil Chemical Analysis for Excavated Materials
Selected materials were submitted to ALS Environmental in Waterloo for Metals & Inorganics testing todetermine their suitability for re-use or disposal. The chemical testing results are included in Appendix E. Thetesting results therein represent the properties only for the soils tested; soil conditions other than those testedmay be generated during construction.
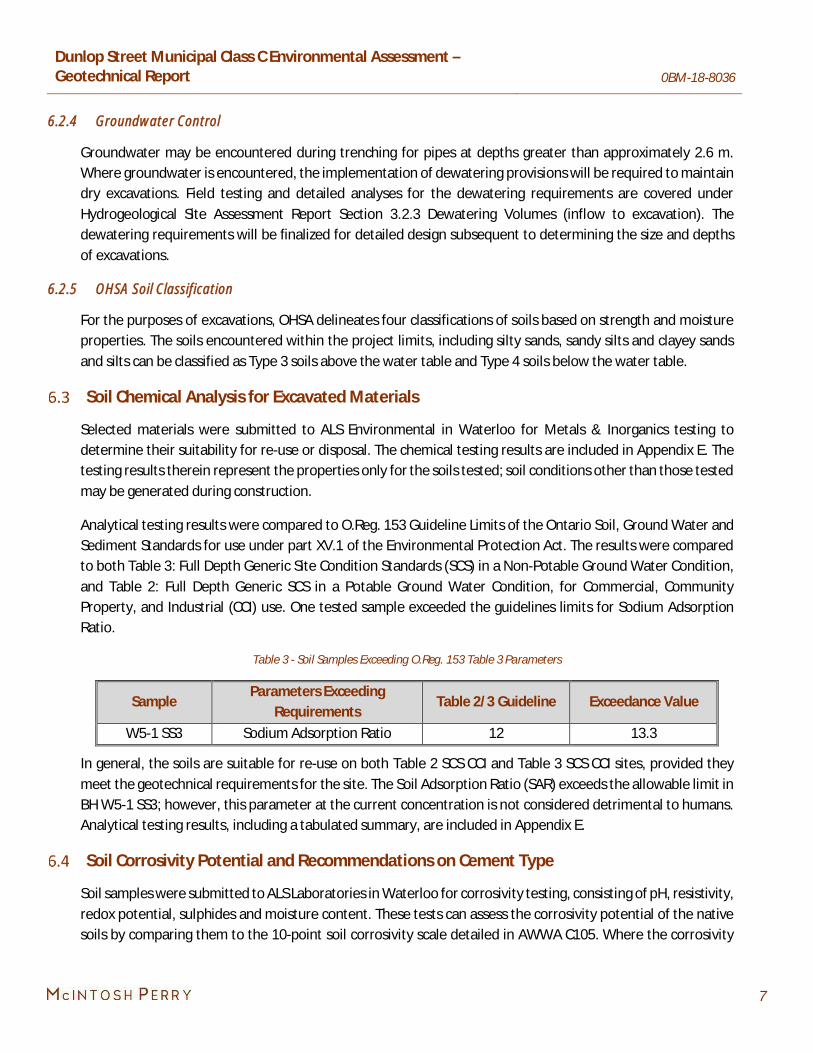
Analytical testing results were compared to O.Reg. 153 Guideline Limits of the Ontario Soil, Ground Water andSediment Standards for use under part XV.1 of the Environmental Protection Act. The results were comparedto both Table 3: Full Depth Generic Site Condition Standards (SCS) in a Non-Potable Ground Water Condition,and Table 2: Full Depth Generic SCS in a Potable Ground Water Condition, for Commercial, CommunityProperty, and Industrial (CCI) use. One tested sample exceeded the guidelines limits for Sodium AdsorptionRatio.
Table 3 - Soil Samples Exceeding O.Reg. 153 Table 3 Parameters
SampleParameters Exceeding
RequirementsTable 2/3 Guideline Exceedance Value
W5-1 SS3 Sodium Adsorption Ratio 12 13.3
In general, the soils are suitable for re-use on both Table 2 SCS CCI and Table 3 SCS CCI sites, provided theymeet the geotechnical requirements for the site. The Soil Adsorption Ratio (SAR) exceeds the allowable limit inBH W5-1 SS3; however, this parameter at the current concentration is not considered detrimental to humans.Analytical testing results, including a tabulated summary, are included in Appendix E.
Soil Corrosivity Potential and Recommendations on Cement Type
Soil samples were submitted to ALS Laboratories in Waterloo for corrosivity testing, consisting of pH, resistivity,redox potential, sulphides and moisture content. These tests can assess the corrosivity potential of the nativesoils by comparing them to the 10-point soil corrosivity scale detailed in AWWA C105. Where the corrosivity

Dunlop Street Municipal Class C Environmental Assessment –Geotechnical Report 0BM-18-8036
8
potential exceeds a 10 on the corrosivity scale, the soil is considered to be a corrosion risk to ductile iron pipesand warrants protection measures. Table 4 outlines the severity ranking of the tested soil’s corrosivitypotential.
Table 4 - Corrosion Severity Based on AWWA C105 10-point scale
Sample ID E4-1 SS5 (Scale Points) W5-1 SS6 (Scale Points)
Resistivity(ohm/cm)
716 (8) 2360 (0)
pH 7.87 (0) 7.73 (0)Redox Potential
(mV)187 (0) 139 (0)
Sulphides Trace (2) Trace (2)Moisture (%) 12 (1) 18.2 (1)
Severity 11 3
Future Investigations for Detailed Design
The discussion and recommendations within this report are for the purposes of preliminary design and arebased on factual data obtained during the field investigation; conditions beyond those which were encounteredin this investigation may exist within the project limits. The elevations of buried water/sewer infrastructureshould be established to confirm recommendations with regards to trenches, bedding, backfilling anddewatering, and to determine the need for more detailed investigations to establish a more precise andrigorous understanding of the pavement structure, subgrade conditions and water table.

Dunlop Street Municipal Class C Environmental Assessment –Geotechnical Report 0BM-18-8036
9
7.0 CLOSUREConditions other than those noted in this report may exist within the site and cannot be extrapolatedextensively away from the sample locations. If differing site conditions are encountered, or if the City of Barriebecomes aware of any additional information that differs from or is relevant to the McIntosh Perry ConsultingEngineers (McIntosh Perry) findings, the City of Barrie agrees to immediately advise McIntosh Perry so that theinformation presented in this report may be re-evaluated.
Under no circumstances shall the liability of McIntosh Perry for any claim in contract or in tort, related to theservices provided and/or the content and recommendations in this memorandum, exceed the extent that suchliability is covered by such professional liability insurance from time to time in effect including the deductibletherein, and which is available to indemnify McIntosh Perry. Such errors and omissions policies are availablefor inspection by the Client at all times upon request, and if the City of Barrie desires to obtain further insuranceto protect it against any risks beyond the coverage provided by such policies, McIntosh Perry will co-operatewith the City of Barrie to obtain such insurance.
McIntosh Perry prepared this report for the exclusive use of the City of Barrie for Assignment No. 0BM-18-8036. Any use which a third party makes of this report, or any reliance on or decision to be made based on it,are the responsibility of such third parties. McIntosh Perry accepts no responsibility and will not be liable fordamages, if any, suffered by any third party as a result of decisions made or actions taken based on this report.
We trust the attached information meets your needs at this time and should you have any questions orconcerns, please do not hesitate to contact our office.


Dunlop Street Municipal Class C Environmental Assessment –Geotechnical Report 0BM-18-8036
11
8.0 REFERENCES1. Chapman and Putnam. Physiography of Southern Ontario; Ontario Geological Survey, 1984.
2. Hajek, Jerry, MTO November 1995. Procedures for Estimating Traffic Loads for Pavement Design inOntario (Updated 1998).
3. Ministry of Transportation. MTO Pavement Design and Rehabilitation Manual, 2013 (Second Edition).
4. City of Barrie Engineering Department. Transportation Design Manual, 2017.
5. Ontario Regulation (O.Reg). 153/04 (as amended).

DUNLOP STREET MUNICIPAL CLASS EAGEOTECHNICAL REPORT
APPENDIX A: KEY PLANS AND BOREHOLE LOCATIONS

Lake
Sim
coe
West
Stud
y Area
Townsh
ip of
Innisfi
lDU
NLOP
STRE
ET R
EHAB
ILITA
TION
TITLE
:
PROJ
ECT:
STUD
Y ARE
A KEY
MAP
East
Stud
y Area
Townsh
ip of
Vespra
Dunlo
p Stre
et West
Ferndale Drive North
Anne Street South
Edge
hill D
rive
500
050
025
0
Scale
1:15
,000
Metre
s

CEDA
R POINTE DRIVE
FERNDALE DRIVE NORTH
DUNLOP STREET WEST
SARJEANTDRIVE
ELLIOTT AVENUE
LENNOX DRIVE
BH W1
BH W2-1
BH W3BH W4-1
BH W5BH W6
BH W7BH W8-1
MW W4-2MW W5-2
MW W8-2
Source: Esri, DigitalGlobe, GeoEye, Earthstar Geographics, CNES/AirbusDS, USDA, USGS, AeroGRID, IGN, and the GIS User Community
LEGEND
WEST LIMIT BOREHOLE LOCATIONS
2FIGURE:
Jul., 11, 2019LCSK
TITLE:
CLIENT:
PROJECT:
H:\01
Proj
ect -
Prop
osals
\2018
Jobs
\BM\0B
M-18
-8036
City
of B
arrie
EA D
unlop
\GIS\
mxd\G
eotec
h\BM-
18-80
36_0
2Bore
holeL
ocati
os_W
estLi
mitV2
.mxd
REFERENCEGIS data provided by ESRI, Digital Globe, GeoEye, Earthstar Geographics,CNES/Airbus DS, USDA, USGS, AeroGRID, IGN and the GIS User Community, 2019
PROJECT NO: DateGISChecked By
115 Walgreen Road, RR3, Carp, ON K0A1L0Tel: 613-836-2184 Fax: 613-836-3742
www.mcintoshperry.com
Metres
150 0 15075
Scale 1:5,000
GEOTECHNICAL STUDYDUNLOP STREET
CITY OF BARRIE
BM-18-8036
Borehole Location
West Study Limits
ANNE STREET SOUTH
DUNLOP STREET WEST
BOYS STREET NORTHHENRY STREETDONALDST
REET
GEORGE STREET
HART DRIVE
BH E1
BH E2-1
BH E3
BH E4-1
BH E-5
MW E2-2
MW E4-2
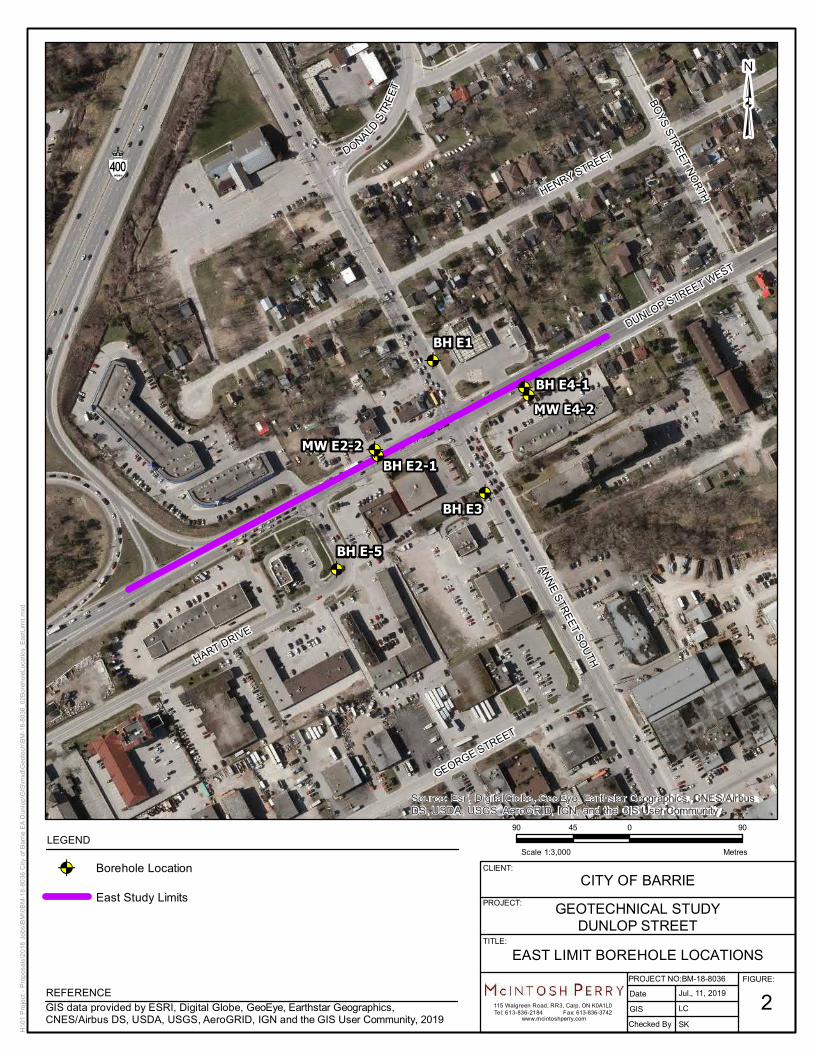
Source: Esri, DigitalGlobe, GeoEye, Earthstar Geographics, CNES/AirbusDS, USDA, USGS, AeroGRID, IGN, and the GIS User Community
LEGEND
EAST LIMIT BOREHOLE LOCATIONS
2FIGURE:
Jul., 11, 2019LCSK
TITLE:
CLIENT:
PROJECT:
H:\01
Proj
ect -
Prop
osals
\2018
Jobs
\BM\0B
M-18
-8036
City
of B
arrie
EA D
unlop
\GIS\
mxd\G
eotec
h\BM-
18-80
36_0
2Bore
holeL
ocati
os_E
astLi
mit.m
xd
REFERENCEGIS data provided by ESRI, Digital Globe, GeoEye, Earthstar Geographics,CNES/Airbus DS, USDA, USGS, AeroGRID, IGN and the GIS User Community, 2019
PROJECT NO: DateGISChecked By
115 Walgreen Road, RR3, Carp, ON K0A1L0Tel: 613-836-2184 Fax: 613-836-3742
www.mcintoshperry.com
Metres
90 0 9045
Scale 1:3,000
GEOTECHNICAL STUDYDUNLOP STREET
CITY OF BARRIE
BM-18-8036
Borehole Location
East Study Limits
DUNLOP STREET MUNICIPAL CLASS EAGEOTECHNICAL REPORT
APPENDIX B: ASPHALT CORE LOGS AND PHOTOGRAPHS
Cit
y o
f B
arri
e –
Du
nlo
p S
t. E
A
Pav
eme
nt
Co
re L
ogs
– D
un
lop
St.
Ass
ign
men
t
MP
#: B
M1
8-8
03
6
Stat
ion
D
irec
tio
n a
nd
La
ne
CL
Off
set
(m)
Co
re
Dia
met
er
(mm
)
Laye
r Th
ickn
ess
(mm
) C
rack
Wid
th
(mm
) C
om
men
ts
Surf
La
yer
2
La
yer
3
La
yer
4
La
yer
5
La
yer
6
La
yer
7
La
yer
8
Laye
r 9
La
yer
10
To
tal
T M
B
E1
10
0
37
.1
63
.1
32
.1
82
.7
21
5.0
E2-2
1
00
3
8.5
2
5.3
5
4.1
3
5.7
1
53
.6
La
yer
2 p
add
ing
W2
-2
10
0
60
.5
15
.5
52
.6
37
.9
16
6.5
W3
1
00
2
7.5
4
1.2
2
3.5
-
92
.2
W4
-2
10
0
43
.2
42
.8
66
.3
-
1
52
.3
W5
-2
10
0
52
.6
50
.2
37
.8
62
.4
20
3.0
E2-1
1
90
-
- -
-
1
32
.0
8
” C
on
cret
e C
ore
E3
19
0
30
.0
54
.5
65
.6
-
1
50
.1
E4-1
1
90
5
3.7
1
14
.0
- -
16
7.7
Un
able
to
det
erm
ine
if t
her
e is
Lo
wer
Bin
der
Lif
t (3
)
E5
19
0
46
.0
45
.3
- -
91
.3
W1
1
90
4
8.5
6
8.2
-
-
1
16
.7
W8
-1
10
0
50
.2
56
.8
43
.3
-
1
50
.3
W6
1
00
5
3.2
4
2.4
5
4.4
-
15
0.0
W7
1
00
2
9.7
4
9.3
3
2.2
-
11
1.2
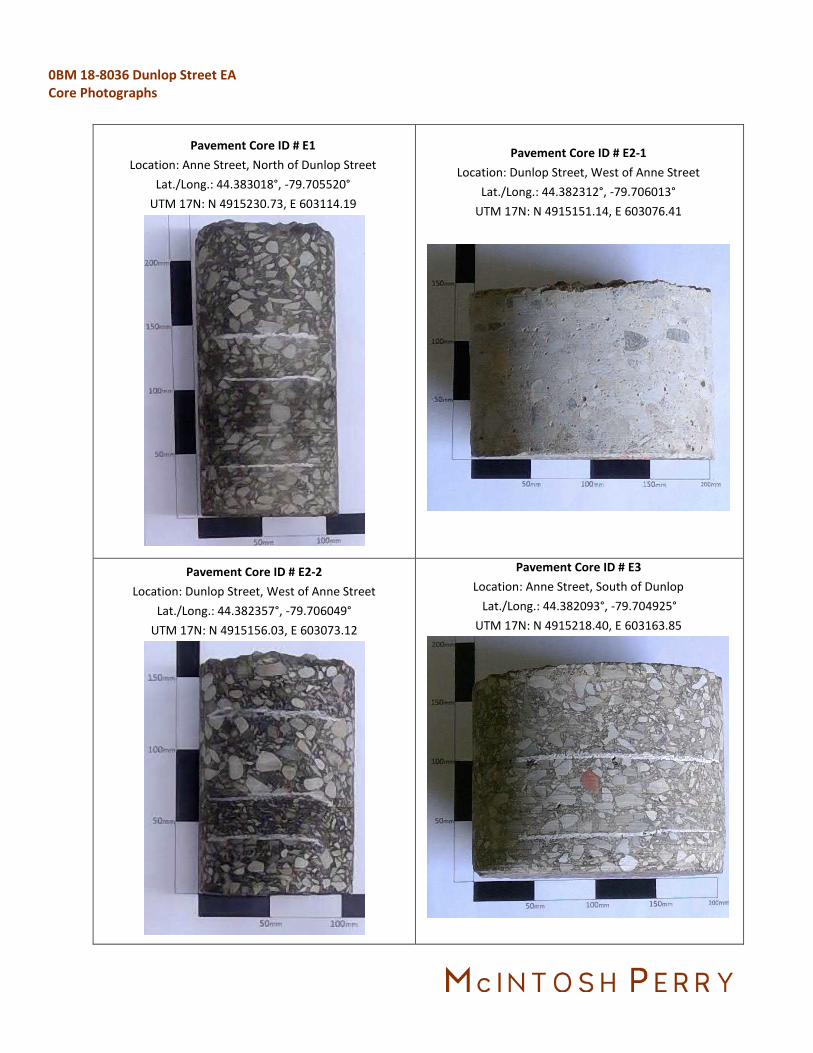
0BM 18-8036 Dunlop Street EA Core Photographs
Pavement Core ID # E1
Location: Anne Street, North of Dunlop Street
Lat./Long.: 44.383018°, -79.705520°
UTM 17N: N 4915230.73, E 603114.19
Pavement Core ID # E2-1
Location: Dunlop Street, West of Anne Street
Lat./Long.: 44.382312°, -79.706013°
UTM 17N: N 4915151.14, E 603076.41
Pavement Core ID # E2-2
Location: Dunlop Street, West of Anne Street
Lat./Long.: 44.382357°, -79.706049°
UTM 17N: N 4915156.03, E 603073.12
Pavement Core ID # E3
Location: Anne Street, South of Dunlop
Lat./Long.: 44.382093°, -79.704925°
UTM 17N: N 4915218.40, E 603163.85

0BM 18-8036 Dunlop Street EA Core Photographs
Pavement Core ID # E4-1
Location: Dunlop Street, East of Anne Street
Lat./Long.: 44.382863°, -79.704594°
UTM 17N: N 4915214.56, E 603188.24
Pavement Core ID # EW-5
Location: Hart Drive, South of Dunlop Street
Lat./Long.: 44.381488°, -79.706357°
UTM 17N: N 4915059.15, E 603050.98
Pavement Core ID # W1
Location: Cedar Point Drive, North of Dunlop Street
Lat./Long.: 44.379449°, -79.713997°
UTM 17N: N 4914823.59, E 602445.53
Pavement Core ID # W2-1
Location: Dunlop Street, West of Cedar Point
Lat./Long.: 44.378493°, -79.714645°
UTM 17N: N 4914716.26, E 602395.00

0BM 18-8036 Dunlop Street EA Core Photographs
Pavement Core ID # W3
Location: Sarjeant Drive, South of Dunlop
Lat./Long.: 44.377097°, -79.716207°
UTM 17N: N 4914559.29, E 602273.56
Pavement Core ID # W4-1
Location: Dunlop Street, West of Sarjeant Drive
Lat./Long.: 44.377244°, -79.717271°
UTM 17N: N 4914574.71, E 502188.70
Pavement Core ID # W5-1
Location: Dunlop Street, East of Ferndale
Lat./Long.: 44.376553°, -79.719043°
UTM 17N: N 4914495.56, E 602048.98
Pavement Core ID # W6
Location: Ferndale Road, North of Dunlop
Lat./Long.: 44.376496°, -79.720413°
UTM 17N: N 4914487.26, E 601939.77

0BM 18-8036 Dunlop Street EA Core Photographs
Pavement Core ID # W7
Location: Ferndale Road, South of Dunlop
Lat./Long.: 44.375553°, -79.719781°
UTM 17N: N 4914383.58, E 601991.53
Pavement Core ID # W8-1
Location: Dunlop Street, West of Ferndale
Lat./Long.: 44.375690°, -79.720794°
UTM 17N: N 4914397.89, E 601910.01
DUNLOP STREET MUNICIPAL CLASS EAGEOTECHNICAL REPORT
APPENDIX C: BOREHOLE PLOTS AND LOGS

Asphalt
Sand and Gravel, trace Silt
END OF BOREHOLE
Refusal at 0.6 mBottom of borehole at 0.6 m.
GBSS-1
NOTES
GROUND ELEVATION 229.78 m
LOGGED BY ND
DRILLING METHOD Hand Dig
HOLE SIZE 150 mm
DRILLING CONTRACTOR Tri Phase GROUND WATER LEVELS:
CHECKED BY HA
DATE STARTED 19-5-7 COMPLETED 19-5-7
AT TIME OF DRILLING ---
AT END OF DRILLING ---
AFTER DRILLING ---
FINES CONTENT (%) 20 40 60 80
20 40 60 80
PL LLMCMATERIAL DESCRIPTION
SA
MP
LE T
YP
EN
UM
BE
R
RE
CO
VE
RY
%(R
QD
)
BLO
WC
OU
NT
S(N
VA
LUE
)
SPT N VALUE 20 40 60 80
GR
AP
HIC
LOG
DE
PT
H(m
)
0
DR
Y U
NIT
WT
.(p
cf)
PO
CK
ET
PE
N.
(tsf
)
PAGE 1 OF 1BORING NUMBER E1
PROJECT NAME Dunlop Street EA
PROJECT LOCATION Dunlop Street @ Highway 400
CLIENT City of Barrie
PROJECT NUMBER 0BM-18-8036
GE
OT
EC
H B
H P
LOT
S -
GIN
T S
TD
CA
NA
DA
LA
B.G
DT
- 1
9-7-
19
14:0
6 -
Z:\0
1 P
RO
JEC
T -
PR
OP
OS
ALS
\201
8 JO
BS
\BM
\0B
M-1
8-80
36_
CIT
Y O
F B
AR
RIE
_EA
_DU
NLO
P S
T\8
GE
OT
EC
H\2
FIE
LD IN
VE
ST
IGA
TIO
N &
FIN
DIN
GS
\2 B
OR
EH
OLE
S L
OG
S\G
INT
\DU
NLO
P S
TR
EE
T G
INT
.GP
J

Asphalt
Sand, some Gravel, some Silt, Grey
Sand, with Silt, some Clay, trace Gravel, Brown
Sand, some Silt, trace Clay, trace Gravel, Light Brown
Sand, Brown, Moist
Sand, Brown, Wet
Sand, some Silt, some Clay, trace Gravel, Brown
Bottom of borehole at 5.2 m.
SPTSS-1
SPTSS-2
SPTSS-3
SPTSS-4
SPTSS-5
SPTSS-6
SPTSS-7
0-13-14-12/0"
2-3-4-5/0"
7-12-11-11/0"
8-13-15-16/0"
6-14-20-23/0"
11-12-14-20/0"
18-19-14-20/0"
NOTES
GROUND ELEVATION 230.14 m
LOGGED BY ND
DRILLING METHOD Conventional
HOLE SIZE 150 mm
DRILLING CONTRACTOR Tri Phase GROUND WATER LEVELS:
CHECKED BY HA
DATE STARTED 19-5-7 COMPLETED 19-5-7
AT TIME OF DRILLING ---
AT END OF DRILLING ---
AFTER DRILLING ---
FINES CONTENT (%) 20 40 60 80
20 40 60 80
PL LLMCMATERIAL DESCRIPTION
SA
MP
LE T
YP
EN
UM
BE
R
RE
CO
VE
RY
%(R
QD
)
BLO
WC
OU
NT
S(N
VA
LUE
)
SPT N VALUE 20 40 60 80
GR
AP
HIC
LOG
DE
PT
H(m
)
0
1
2
3
4
5
DR
Y U
NIT
WT
.(p
cf)
PO
CK
ET
PE
N.
(tsf
)
PAGE 1 OF 1BORING NUMBER E2-1
PROJECT NAME Dunlop Street EA
PROJECT LOCATION Dunlop Street @ Highway 400
CLIENT City of Barrie
PROJECT NUMBER 0BM-18-8036
GE
OT
EC
H B
H P
LOT
S -
GIN
T S
TD
CA
NA
DA
LA
B.G
DT
- 1
9-7-
19
14:0
6 -
Z:\0
1 P
RO
JEC
T -
PR
OP
OS
ALS
\201
8 JO
BS
\BM
\0B
M-1
8-80
36_
CIT
Y O
F B
AR
RIE
_EA
_DU
NLO
P S
T\8
GE
OT
EC
H\2
FIE
LD IN
VE
ST
IGA
TIO
N &
FIN
DIN
GS
\2 B
OR
EH
OLE
S L
OG
S\G
INT
\DU
NLO
P S
TR
EE
T G
INT
.GP
J
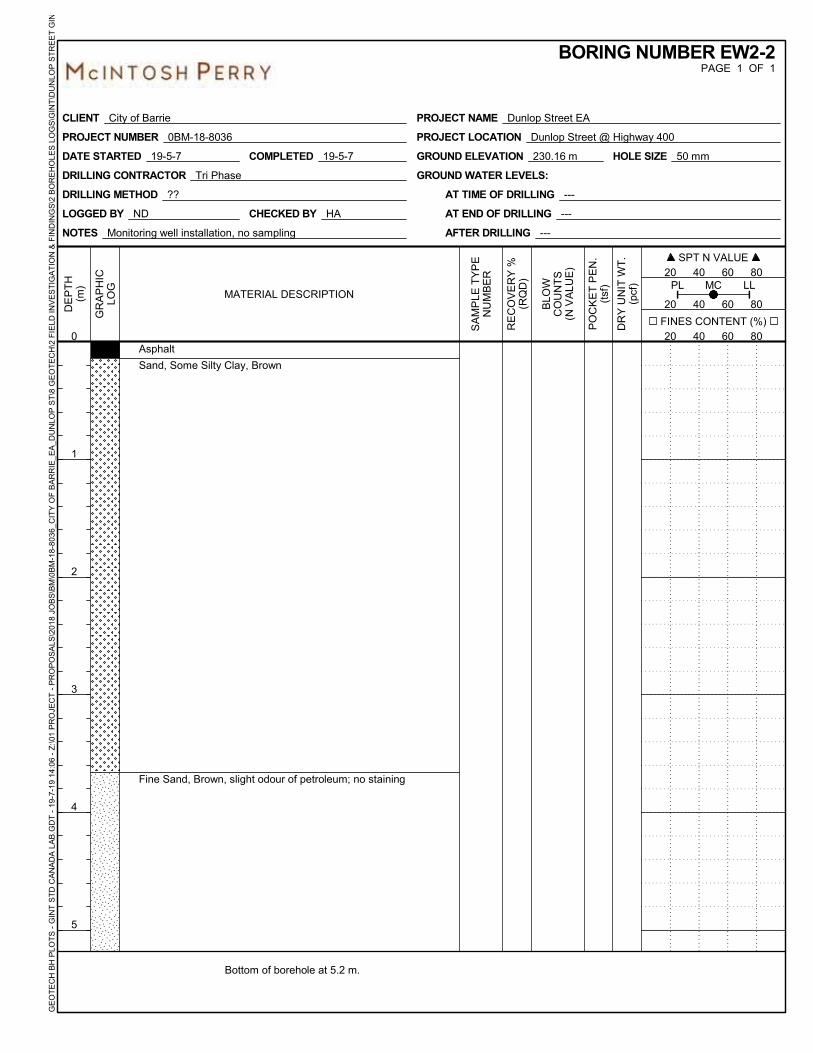
Asphalt
Sand, Some Silty Clay, Brown
Fine Sand, Brown, slight odour of petroleum; no staining
Bottom of borehole at 5.2 m.
NOTES Monitoring well installation, no sampling
GROUND ELEVATION 230.16 m
LOGGED BY ND
DRILLING METHOD ??
HOLE SIZE 50 mm
DRILLING CONTRACTOR Tri Phase GROUND WATER LEVELS:
CHECKED BY HA
DATE STARTED 19-5-7 COMPLETED 19-5-7
AT TIME OF DRILLING ---
AT END OF DRILLING ---
AFTER DRILLING ---
FINES CONTENT (%) 20 40 60 80
20 40 60 80
PL LLMCMATERIAL DESCRIPTION
SA
MP
LE T
YP
EN
UM
BE
R
RE
CO
VE
RY
%(R
QD
)
BLO
WC
OU
NT
S(N
VA
LUE
)
SPT N VALUE 20 40 60 80
GR
AP
HIC
LOG
DE
PT
H(m
)
0
1
2
3
4
5
DR
Y U
NIT
WT
.(p
cf)
PO
CK
ET
PE
N.
(tsf
)
PAGE 1 OF 1BORING NUMBER EW2-2
PROJECT NAME Dunlop Street EA
PROJECT LOCATION Dunlop Street @ Highway 400
CLIENT City of Barrie
PROJECT NUMBER 0BM-18-8036
GE
OT
EC
H B
H P
LOT
S -
GIN
T S
TD
CA
NA
DA
LA
B.G
DT
- 1
9-7-
19
14:0
6 -
Z:\0
1 P
RO
JEC
T -
PR
OP
OS
ALS
\201
8 JO
BS
\BM
\0B
M-1
8-80
36_
CIT
Y O
F B
AR
RIE
_EA
_DU
NLO
P S
T\8
GE
OT
EC
H\2
FIE
LD IN
VE
ST
IGA
TIO
N &
FIN
DIN
GS
\2 B
OR
EH
OLE
S L
OG
S\G
INT
\DU
NLO
P S
TR
EE
T G
INT
.GP
J
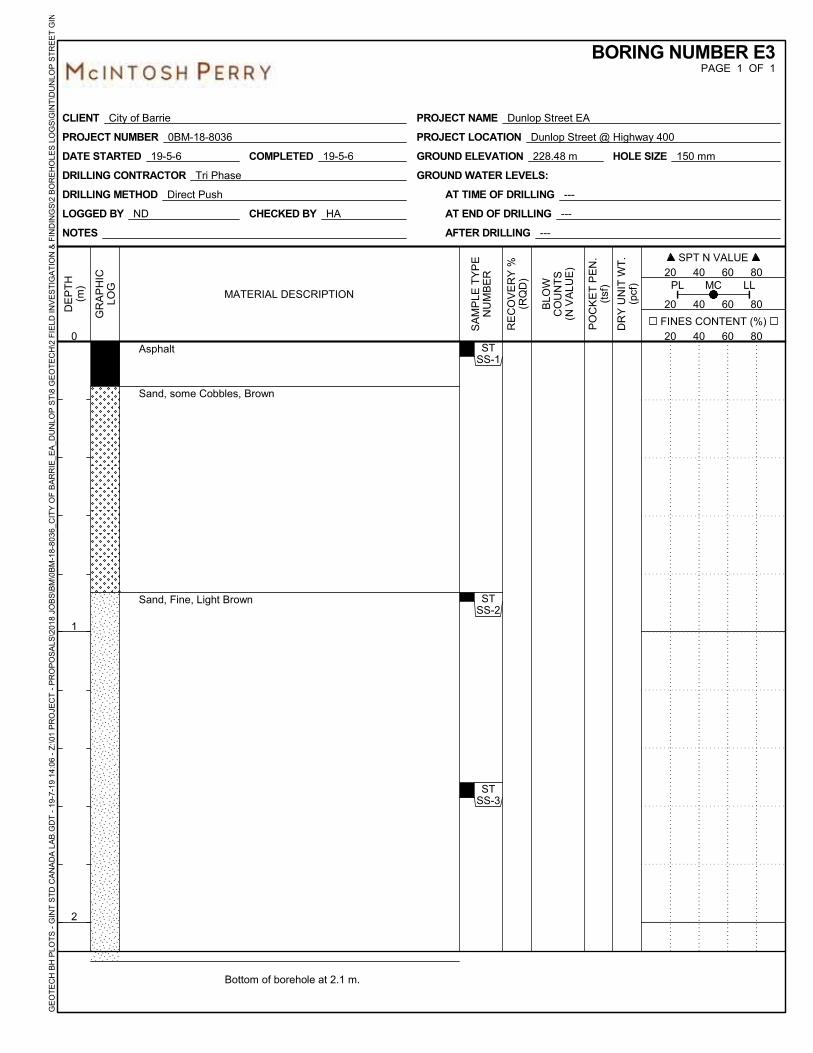
Asphalt
Sand, some Cobbles, Brown
Sand, Fine, Light Brown
Bottom of borehole at 2.1 m.
STSS-1
STSS-2
STSS-3
NOTES
GROUND ELEVATION 228.48 m
LOGGED BY ND
DRILLING METHOD Direct Push
HOLE SIZE 150 mm
DRILLING CONTRACTOR Tri Phase GROUND WATER LEVELS:
CHECKED BY HA
DATE STARTED 19-5-6 COMPLETED 19-5-6
AT TIME OF DRILLING ---
AT END OF DRILLING ---
AFTER DRILLING ---
FINES CONTENT (%) 20 40 60 80
20 40 60 80
PL LLMCMATERIAL DESCRIPTION
SA
MP
LE T
YP
EN
UM
BE
R
RE
CO
VE
RY
%(R
QD
)
BLO
WC
OU
NT
S(N
VA
LUE
)
SPT N VALUE 20 40 60 80
GR
AP
HIC
LOG
DE
PT
H(m
)
0
1
2
DR
Y U
NIT
WT
.(p
cf)
PO
CK
ET
PE
N.
(tsf
)
PAGE 1 OF 1BORING NUMBER E3
PROJECT NAME Dunlop Street EA
PROJECT LOCATION Dunlop Street @ Highway 400
CLIENT City of Barrie
PROJECT NUMBER 0BM-18-8036
GE
OT
EC
H B
H P
LOT
S -
GIN
T S
TD
CA
NA
DA
LA
B.G
DT
- 1
9-7-
19
14:0
6 -
Z:\0
1 P
RO
JEC
T -
PR
OP
OS
ALS
\201
8 JO
BS
\BM
\0B
M-1
8-80
36_
CIT
Y O
F B
AR
RIE
_EA
_DU
NLO
P S
T\8
GE
OT
EC
H\2
FIE
LD IN
VE
ST
IGA
TIO
N &
FIN
DIN
GS
\2 B
OR
EH
OLE
S L
OG
S\G
INT
\DU
NLO
P S
TR
EE
T G
INT
.GP
J
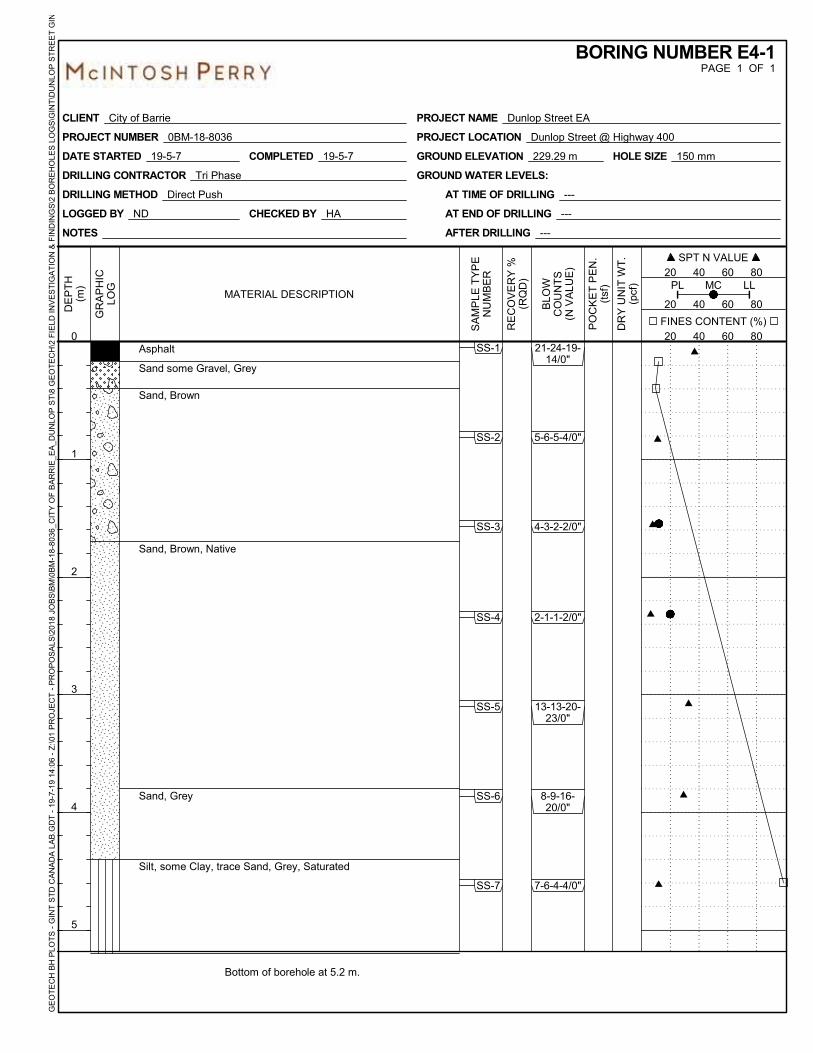
Asphalt
Sand some Gravel, Grey
Sand, Brown
Sand, Brown, Native
Sand, Grey
Silt, some Clay, trace Sand, Grey, Saturated
Bottom of borehole at 5.2 m.
SS-1
SS-2
SS-3
SS-4
SS-5
SS-6
SS-7
21-24-19-14/0"
5-6-5-4/0"
4-3-2-2/0"
2-1-1-2/0"
13-13-20-23/0"
8-9-16-20/0"
7-6-4-4/0"
NOTES
GROUND ELEVATION 229.29 m
LOGGED BY ND
DRILLING METHOD Direct Push
HOLE SIZE 150 mm
DRILLING CONTRACTOR Tri Phase GROUND WATER LEVELS:
CHECKED BY HA
DATE STARTED 19-5-7 COMPLETED 19-5-7
AT TIME OF DRILLING ---
AT END OF DRILLING ---
AFTER DRILLING ---
FINES CONTENT (%) 20 40 60 80
20 40 60 80
PL LLMCMATERIAL DESCRIPTION
SA
MP
LE T
YP
EN
UM
BE
R
RE
CO
VE
RY
%(R
QD
)
BLO
WC
OU
NT
S(N
VA
LUE
)
SPT N VALUE 20 40 60 80
GR
AP
HIC
LOG
DE
PT
H(m
)
0
1
2
3
4
5
DR
Y U
NIT
WT
.(p
cf)
PO
CK
ET
PE
N.
(tsf
)
PAGE 1 OF 1BORING NUMBER E4-1
PROJECT NAME Dunlop Street EA
PROJECT LOCATION Dunlop Street @ Highway 400
CLIENT City of Barrie
PROJECT NUMBER 0BM-18-8036
GE
OT
EC
H B
H P
LOT
S -
GIN
T S
TD
CA
NA
DA
LA
B.G
DT
- 1
9-7-
19
14:0
6 -
Z:\0
1 P
RO
JEC
T -
PR
OP
OS
ALS
\201
8 JO
BS
\BM
\0B
M-1
8-80
36_
CIT
Y O
F B
AR
RIE
_EA
_DU
NLO
P S
T\8
GE
OT
EC
H\2
FIE
LD IN
VE
ST
IGA
TIO
N &
FIN
DIN
GS
\2 B
OR
EH
OLE
S L
OG
S\G
INT
\DU
NLO
P S
TR
EE
T G
INT
.GP
J

Monitoring Well Installation
Bottom of borehole at 5.2 m.
NOTES Monitoring well installation, no sampling
GROUND ELEVATION 229.54 m
LOGGED BY ND
DRILLING METHOD Conventional
HOLE SIZE 50 mm
DRILLING CONTRACTOR Tri Phase GROUND WATER LEVELS:
CHECKED BY HA
DATE STARTED 19-5-7 COMPLETED 19-5-7
AT TIME OF DRILLING ---
AT END OF DRILLING ---
AFTER DRILLING ---
FINES CONTENT (%) 20 40 60 80
20 40 60 80
PL LLMCMATERIAL DESCRIPTION
SA
MP
LE T
YP
EN
UM
BE
R
RE
CO
VE
RY
%(R
QD
)
BLO
WC
OU
NT
S(N
VA
LUE
)
SPT N VALUE 20 40 60 80
GR
AP
HIC
LOG
DE
PT
H(m
)
0
1
2
3
4
5
DR
Y U
NIT
WT
.(p
cf)
PO
CK
ET
PE
N.
(tsf
)
PAGE 1 OF 1BORING NUMBER EW4-2
PROJECT NAME Dunlop Street EA
PROJECT LOCATION Dunlop Street @ Highway 400
CLIENT City of Barrie
PROJECT NUMBER 0BM-18-8036
GE
OT
EC
H B
H P
LOT
S -
GIN
T S
TD
CA
NA
DA
LA
B.G
DT
- 1
9-7-
19
14:0
6 -
Z:\0
1 P
RO
JEC
T -
PR
OP
OS
ALS
\201
8 JO
BS
\BM
\0B
M-1
8-80
36_
CIT
Y O
F B
AR
RIE
_EA
_DU
NLO
P S
T\8
GE
OT
EC
H\2
FIE
LD IN
VE
ST
IGA
TIO
N &
FIN
DIN
GS
\2 B
OR
EH
OLE
S L
OG
S\G
INT
\DU
NLO
P S
TR
EE
T G
INT
.GP
J

Asphalt
Sand and Gravel, trace Silt, Brown
Sand with Gravel, trace Silt, Brown
Sand, trace Silt, Brown
Bottom of borehole at 2.1 m.
STSS-1
STSS-2
STSS-3
NOTES
GROUND ELEVATION 229.65 m
LOGGED BY ND
DRILLING METHOD Direct Push
HOLE SIZE 150
DRILLING CONTRACTOR Tri Phase GROUND WATER LEVELS:
CHECKED BY HA
DATE STARTED 19-5-6 COMPLETED 19-5-6
AT TIME OF DRILLING ---
AT END OF DRILLING ---
AFTER DRILLING ---
FINES CONTENT (%) 20 40 60 80
20 40 60 80
PL LLMCMATERIAL DESCRIPTION
SA
MP
LE T
YP
EN
UM
BE
R
RE
CO
VE
RY
%(R
QD
)
BLO
WC
OU
NT
S(N
VA
LUE
)
SPT N VALUE 20 40 60 80
GR
AP
HIC
LOG
DE
PT
H(m
)
0
1
2
DR
Y U
NIT
WT
.(p
cf)
PO
CK
ET
PE
N.
(tsf
)
PAGE 1 OF 1BORING NUMBER EW-5
PROJECT NAME Dunlop Street EA
PROJECT LOCATION Dunlop Street @ Highway 400
CLIENT City of Barrie
PROJECT NUMBER 0BM-18-8036
GE
OT
EC
H B
H P
LOT
S -
GIN
T S
TD
CA
NA
DA
LA
B.G
DT
- 1
9-7-
19
14:0
6 -
Z:\0
1 P
RO
JEC
T -
PR
OP
OS
ALS
\201
8 JO
BS
\BM
\0B
M-1
8-80
36_
CIT
Y O
F B
AR
RIE
_EA
_DU
NLO
P S
T\8
GE
OT
EC
H\2
FIE
LD IN
VE
ST
IGA
TIO
N &
FIN
DIN
GS
\2 B
OR
EH
OLE
S L
OG
S\G
INT
\DU
NLO
P S
TR
EE
T G
INT
.GP
J

ASPHALT
Sand and Gravel, trace Silt, Brown
Silty Clay, Grey, Moist
Bottom of borehole at 1.8 m.
STSS-1
STSS-2
NOTES
GROUND ELEVATION 231.59 m
LOGGED BY ND
DRILLING METHOD Direct Push
HOLE SIZE 150 mm
DRILLING CONTRACTOR Tri Phase GROUND WATER LEVELS:
CHECKED BY HA
DATE STARTED 19-5-7 COMPLETED 19-5-7
AT TIME OF DRILLING ---
AT END OF DRILLING ---
AFTER DRILLING ---
FINES CONTENT (%) 20 40 60 80
20 40 60 80
PL LLMCMATERIAL DESCRIPTION
SA
MP
LE T
YP
EN
UM
BE
R
RE
CO
VE
RY
%(R
QD
)
BLO
WC
OU
NT
S(N
VA
LUE
)
SPT N VALUE 20 40 60 80
GR
AP
HIC
LOG
DE
PT
H(m
)
0
1
DR
Y U
NIT
WT
.(p
cf)
PO
CK
ET
PE
N.
(tsf
)
PAGE 1 OF 1BORING NUMBER W1
PROJECT NAME Dunlop Street EA
PROJECT LOCATION Dunlop Street @ Highway 400
CLIENT City of Barrie
PROJECT NUMBER 0BM-18-8036
GE
OT
EC
H B
H P
LOT
S -
GIN
T S
TD
CA
NA
DA
LA
B.G
DT
- 1
9-7-
19
14:0
6 -
Z:\0
1 P
RO
JEC
T -
PR
OP
OS
ALS
\201
8 JO
BS
\BM
\0B
M-1
8-80
36_
CIT
Y O
F B
AR
RIE
_EA
_DU
NLO
P S
T\8
GE
OT
EC
H\2
FIE
LD IN
VE
ST
IGA
TIO
N &
FIN
DIN
GS
\2 B
OR
EH
OLE
S L
OG
S\G
INT
\DU
NLO
P S
TR
EE
T G
INT
.GP
J

ASPHALTSand and Gravel, trace Silt, Brown
Sand with Gravel, trace Silt, Brown
Sand and Gravel, trace Silt, Brown
Sand with Gravel, trace Silt, trace Cobbles, Dark Brown
Silt, Grey, Damp
Sand, Grey, Saturated
Silt, Grey
Silty Sand, Grey, Saturated
Sand, Grey, Saturated
Bottom of borehole at 5.2 m.
SPTSS-1
SPTN/A
SPTSS-2
SPTSS-3
SPTSS-4
SPTSS-5
SPTSS-6
6-8-9(14)
1-1-1-3/0"
2-6-8-7/0"
7-6-8-10/0"
2-3-5-5/0"
2-2-2-3/0"
NOTES
GROUND ELEVATION 232.12 m
LOGGED BY ND
DRILLING METHOD Conventional
HOLE SIZE 150 mm
DRILLING CONTRACTOR Tri Phase GROUND WATER LEVELS:
CHECKED BY HA
DATE STARTED 19-5-8 COMPLETED 19-5-8
AT TIME OF DRILLING ---
AT END OF DRILLING ---
AFTER DRILLING ---
FINES CONTENT (%) 20 40 60 80
20 40 60 80
PL LLMCMATERIAL DESCRIPTION
SA
MP
LE T
YP
EN
UM
BE
R
RE
CO
VE
RY
%(R
QD
)
BLO
WC
OU
NT
S(N
VA
LUE
)
SPT N VALUE 20 40 60 80
GR
AP
HIC
LOG
DE
PT
H(m
)
0
1
2
3
4
5
DR
Y U
NIT
WT
.(p
cf)
PO
CK
ET
PE
N.
(tsf
)
PAGE 1 OF 1BORING NUMBER W2-1
PROJECT NAME Dunlop Street EA
PROJECT LOCATION Dunlop Street @ Highway 400
CLIENT City of Barrie
PROJECT NUMBER 0BM-18-8036
GE
OT
EC
H B
H P
LOT
S -
GIN
T S
TD
CA
NA
DA
LA
B.G
DT
- 1
9-7-
19
14:0
6 -
Z:\0
1 P
RO
JEC
T -
PR
OP
OS
ALS
\201
8 JO
BS
\BM
\0B
M-1
8-80
36_
CIT
Y O
F B
AR
RIE
_EA
_DU
NLO
P S
T\8
GE
OT
EC
H\2
FIE
LD IN
VE
ST
IGA
TIO
N &
FIN
DIN
GS
\2 B
OR
EH
OLE
S L
OG
S\G
INT
\DU
NLO
P S
TR
EE
T G
INT
.GP
J
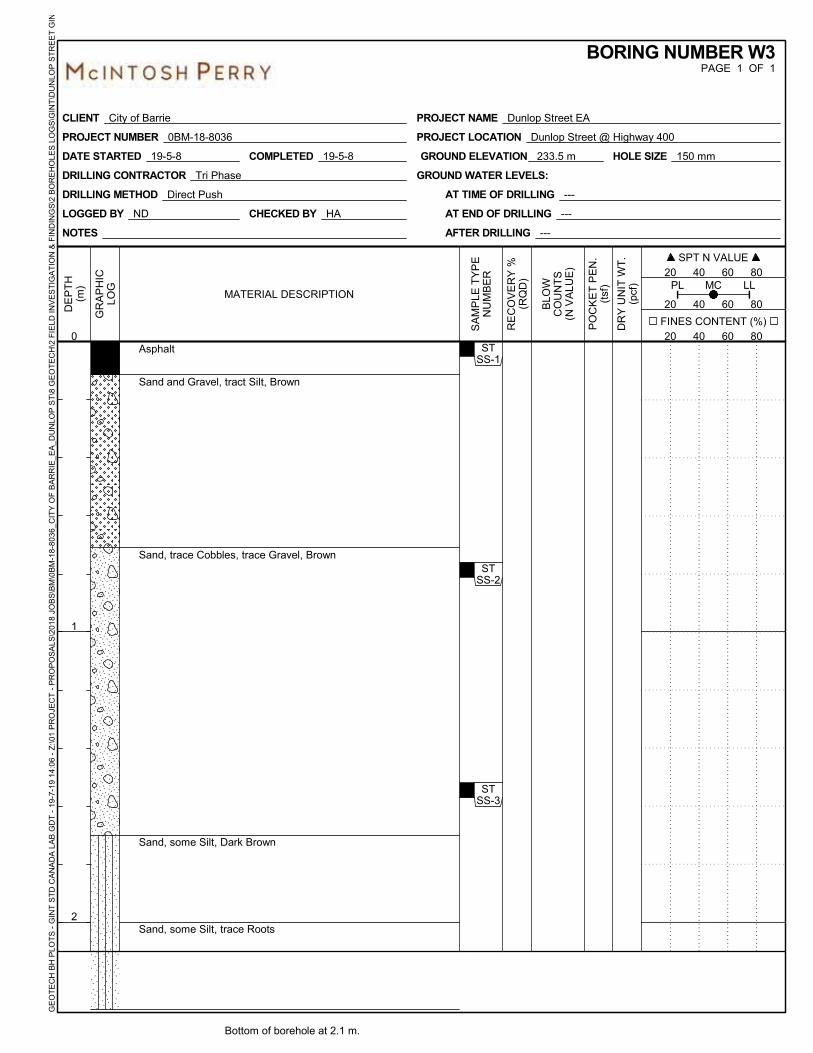
Asphalt
Sand and Gravel, tract Silt, Brown
Sand, trace Cobbles, trace Gravel, Brown
Sand, some Silt, Dark Brown
Sand, some Silt, trace Roots
Bottom of borehole at 2.1 m.
STSS-1
STSS-2
STSS-3
NOTES
GROUND ELEVATION 233.5 m
LOGGED BY ND
DRILLING METHOD Direct Push
HOLE SIZE 150 mm
DRILLING CONTRACTOR Tri Phase GROUND WATER LEVELS:
CHECKED BY HA
DATE STARTED 19-5-8 COMPLETED 19-5-8
AT TIME OF DRILLING ---
AT END OF DRILLING ---
AFTER DRILLING ---
FINES CONTENT (%) 20 40 60 80
20 40 60 80
PL LLMCMATERIAL DESCRIPTION
SA
MP
LE T
YP
EN
UM
BE
R
RE
CO
VE
RY
%(R
QD
)
BLO
WC
OU
NT
S(N
VA
LUE
)
SPT N VALUE 20 40 60 80
GR
AP
HIC
LOG
DE
PT
H(m
)
0
1
2
DR
Y U
NIT
WT
.(p
cf)
PO
CK
ET
PE
N.
(tsf
)
PAGE 1 OF 1BORING NUMBER W3
PROJECT NAME Dunlop Street EA
PROJECT LOCATION Dunlop Street @ Highway 400
CLIENT City of Barrie
PROJECT NUMBER 0BM-18-8036
GE
OT
EC
H B
H P
LOT
S -
GIN
T S
TD
CA
NA
DA
LA
B.G
DT
- 1
9-7-
19
14:0
6 -
Z:\0
1 P
RO
JEC
T -
PR
OP
OS
ALS
\201
8 JO
BS
\BM
\0B
M-1
8-80
36_
CIT
Y O
F B
AR
RIE
_EA
_DU
NLO
P S
T\8
GE
OT
EC
H\2
FIE
LD IN
VE
ST
IGA
TIO
N &
FIN
DIN
GS
\2 B
OR
EH
OLE
S L
OG
S\G
INT
\DU
NLO
P S
TR
EE
T G
INT
.GP
J

Asphalt
Sand and Gravel, trace Silt, Brown
Sand, trace Gravel
Fine-Coarse Sand, some Gravel, Brown-Grey, Wet
Coarse Sand, Some Gravel, Brown-Grey, Wet
Clay, Grey, Wet, Soft
Bottom of borehole at 5.2 m.
SPTSS-1
SPTSS-2
SPTSS-3
SPTSS-4
SPTSS-5
SPTSS-6
SPTSS-7
30-23-10-7/0"
3-6-10-12/0"
3-2-3-3/0"
1-2-8-12/0"
5-6-9-10/0"
5-10-13-12/0"
1-5-5-5/0"
NOTES
GROUND ELEVATION 234.52 m
LOGGED BY ND
DRILLING METHOD Conventional
HOLE SIZE 150 mm
DRILLING CONTRACTOR Tri Phase GROUND WATER LEVELS:
CHECKED BY HA
DATE STARTED 19-5-8 COMPLETED 19-5-8
AT TIME OF DRILLING ---
AT END OF DRILLING ---
AFTER DRILLING ---
FINES CONTENT (%) 20 40 60 80
20 40 60 80
PL LLMCMATERIAL DESCRIPTION
SA
MP
LE T
YP
EN
UM
BE
R
RE
CO
VE
RY
%(R
QD
)
BLO
WC
OU
NT
S(N
VA
LUE
)
SPT N VALUE 20 40 60 80
GR
AP
HIC
LOG
DE
PT
H(m
)
0
1
2
3
4
5
DR
Y U
NIT
WT
.(p
cf)
PO
CK
ET
PE
N.
(tsf
)
PAGE 1 OF 1BORING NUMBER W4-1
PROJECT NAME Dunlop Street EA
PROJECT LOCATION Dunlop Street @ Highway 400
CLIENT City of Barrie
PROJECT NUMBER 0BM-18-8036
GE
OT
EC
H B
H P
LOT
S -
GIN
T S
TD
CA
NA
DA
LA
B.G
DT
- 1
9-7-
19
14:0
6 -
Z:\0
1 P
RO
JEC
T -
PR
OP
OS
ALS
\201
8 JO
BS
\BM
\0B
M-1
8-80
36_
CIT
Y O
F B
AR
RIE
_EA
_DU
NLO
P S
T\8
GE
OT
EC
H\2
FIE
LD IN
VE
ST
IGA
TIO
N &
FIN
DIN
GS
\2 B
OR
EH
OLE
S L
OG
S\G
INT
\DU
NLO
P S
TR
EE
T G
INT
.GP
J
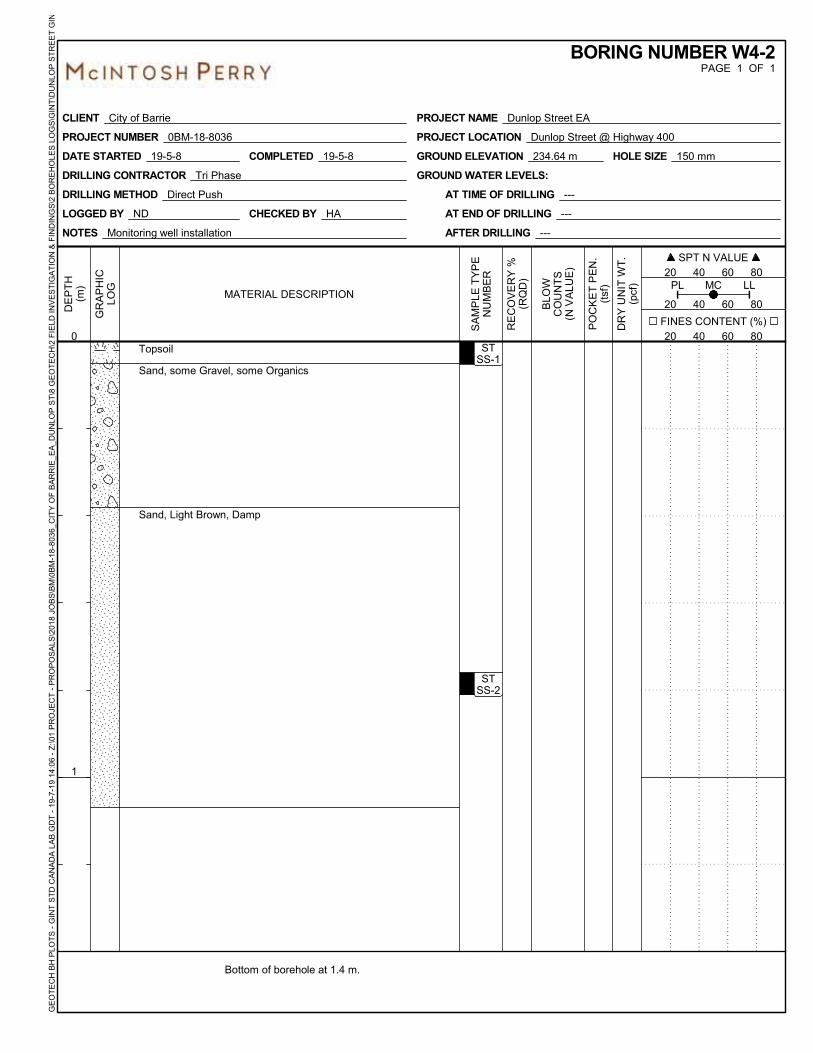
Topsoil
Sand, some Gravel, some Organics
Sand, Light Brown, Damp
Bottom of borehole at 1.4 m.
STSS-1
STSS-2
NOTES Monitoring well installation
GROUND ELEVATION 234.64 m
LOGGED BY ND
DRILLING METHOD Direct Push
HOLE SIZE 150 mm
DRILLING CONTRACTOR Tri Phase GROUND WATER LEVELS:
CHECKED BY HA
DATE STARTED 19-5-8 COMPLETED 19-5-8
AT TIME OF DRILLING ---
AT END OF DRILLING ---
AFTER DRILLING ---
FINES CONTENT (%) 20 40 60 80
20 40 60 80
PL LLMCMATERIAL DESCRIPTION
SA
MP
LE T
YP
EN
UM
BE
R
RE
CO
VE
RY
%(R
QD
)
BLO
WC
OU
NT
S(N
VA
LUE
)
SPT N VALUE 20 40 60 80
GR
AP
HIC
LOG
DE
PT
H(m
)
0
1
DR
Y U
NIT
WT
.(p
cf)
PO
CK
ET
PE
N.
(tsf
)
PAGE 1 OF 1BORING NUMBER W4-2
PROJECT NAME Dunlop Street EA
PROJECT LOCATION Dunlop Street @ Highway 400
CLIENT City of Barrie
PROJECT NUMBER 0BM-18-8036
GE
OT
EC
H B
H P
LOT
S -
GIN
T S
TD
CA
NA
DA
LA
B.G
DT
- 1
9-7-
19
14:0
6 -
Z:\0
1 P
RO
JEC
T -
PR
OP
OS
ALS
\201
8 JO
BS
\BM
\0B
M-1
8-80
36_
CIT
Y O
F B
AR
RIE
_EA
_DU
NLO
P S
T\8
GE
OT
EC
H\2
FIE
LD IN
VE
ST
IGA
TIO
N &
FIN
DIN
GS
\2 B
OR
EH
OLE
S L
OG
S\G
INT
\DU
NLO
P S
TR
EE
T G
INT
.GP
J

Asphalt
Sand, with Gravel, trace Silt, Brown
Sand, some Gravel, some Silt, Brown
Sand, trace Gravel, trace Silt, Brown-Grey
Clay, Grey, Dense, Wet
Bottom of borehole at 5.2 m.
SPTSS-1
SPTSS-2
SPTSS-3
SPTSS-4
SPTSS-5
SPTSS-6
SPTSS-7
8-16-20-17/0"
9-6-4-4/0"
1-1-2-3/0"
1-2-2-1/0"
3-1-1-1/0"
3-5-5-11/0"
8-11-10-13/0"
NOTES
GROUND ELEVATION 235.19 m
LOGGED BY ND
DRILLING METHOD Conventional
HOLE SIZE 150 mm
DRILLING CONTRACTOR Tri Phase GROUND WATER LEVELS:
CHECKED BY HA
DATE STARTED 19-5-9 COMPLETED 19-5-9
AT TIME OF DRILLING ---
AT END OF DRILLING ---
AFTER DRILLING ---
FINES CONTENT (%) 20 40 60 80
20 40 60 80
PL LLMCMATERIAL DESCRIPTION
SA
MP
LE T
YP
EN
UM
BE
R
RE
CO
VE
RY
%(R
QD
)
BLO
WC
OU
NT
S(N
VA
LUE
)
SPT N VALUE 20 40 60 80
GR
AP
HIC
LOG
DE
PT
H(m
)
0
1
2
3
4
5
DR
Y U
NIT
WT
.(p
cf)
PO
CK
ET
PE
N.
(tsf
)
PAGE 1 OF 1BORING NUMBER W5-1
PROJECT NAME Dunlop Street EA
PROJECT LOCATION Dunlop Street @ Highway 400
CLIENT City of Barrie
PROJECT NUMBER 0BM-18-8036
GE
OT
EC
H B
H P
LOT
S -
GIN
T S
TD
CA
NA
DA
LA
B.G
DT
- 1
9-7-
19
14:0
6 -
Z:\0
1 P
RO
JEC
T -
PR
OP
OS
ALS
\201
8 JO
BS
\BM
\0B
M-1
8-80
36_
CIT
Y O
F B
AR
RIE
_EA
_DU
NLO
P S
T\8
GE
OT
EC
H\2
FIE
LD IN
VE
ST
IGA
TIO
N &
FIN
DIN
GS
\2 B
OR
EH
OLE
S L
OG
S\G
INT
\DU
NLO
P S
TR
EE
T G
INT
.GP
J

TopsoilSand and Gravel, trace Silt, Brown
Sand, some Silt, Grey, Wet
Clay, Grey, Wet
Bottom of borehole at 4.6 m.
GB
GB
NOTES Monitoring well installation, no sampling
GROUND ELEVATION 234.75 m
LOGGED BY ND
DRILLING METHOD Conventional
HOLE SIZE 150 mm
DRILLING CONTRACTOR Tri Phase GROUND WATER LEVELS:
CHECKED BY HA
DATE STARTED 19-5-8 COMPLETED 19-5-8
AT TIME OF DRILLING ---
AT END OF DRILLING ---
AFTER DRILLING ---
FINES CONTENT (%) 20 40 60 80
20 40 60 80
PL LLMCMATERIAL DESCRIPTION
SA
MP
LE T
YP
EN
UM
BE
R
RE
CO
VE
RY
%(R
QD
)
BLO
WC
OU
NT
S(N
VA
LUE
)
SPT N VALUE 20 40 60 80
GR
AP
HIC
LOG
DE
PT
H(m
)
0
1
2
3
4
DR
Y U
NIT
WT
.(p
cf)
PO
CK
ET
PE
N.
(tsf
)
PAGE 1 OF 1BORING NUMBER W5-2
PROJECT NAME Dunlop Street EA
PROJECT LOCATION Dunlop Street @ Highway 400
CLIENT City of Barrie
PROJECT NUMBER 0BM-18-8036
GE
OT
EC
H B
H P
LOT
S -
GIN
T S
TD
CA
NA
DA
LA
B.G
DT
- 1
9-7-
19
14:2
3 -
Z:\0
1 P
RO
JEC
T -
PR
OP
OS
ALS
\201
8 JO
BS
\BM
\0B
M-1
8-80
36_
CIT
Y O
F B
AR
RIE
_EA
_DU
NLO
P S
T\8
GE
OT
EC
H\2
FIE
LD IN
VE
ST
IGA
TIO
N &
FIN
DIN
GS
\2 B
OR
EH
OLE
S L
OG
S\G
INT
\DU
NLO
P S
TR
EE
T G
INT
.GP
J

Asphalt
Sand and Gravel, Some Cobbles
Sand, Brown
Sand, Grey
Sand, some Gravel, some Cobbles, Grey
Bottom of borehole at 2.1 m.
STSS-1
STSS-1
STSS-2
NOTES
GROUND ELEVATION 235.1 m
LOGGED BY ND
DRILLING METHOD Direct Push
HOLE SIZE 150 mm
DRILLING CONTRACTOR Tri Phase GROUND WATER LEVELS:
CHECKED BY HA
DATE STARTED 19-5-9 COMPLETED 19-5-9
AT TIME OF DRILLING ---
AT END OF DRILLING ---
AFTER DRILLING ---
FINES CONTENT (%) 20 40 60 80
20 40 60 80
PL LLMCMATERIAL DESCRIPTION
SA
MP
LE T
YP
EN
UM
BE
R
RE
CO
VE
RY
%(R
QD
)
BLO
WC
OU
NT
S(N
VA
LUE
)
SPT N VALUE 20 40 60 80
GR
AP
HIC
LOG
DE
PT
H(m
)
0
1
2
DR
Y U
NIT
WT
.(p
cf)
PO
CK
ET
PE
N.
(tsf
)
PAGE 1 OF 1BORING NUMBER W6
PROJECT NAME Dunlop Street EA
PROJECT LOCATION Dunlop Street @ Highway 400
CLIENT City of Barrie
PROJECT NUMBER 0BM-18-8036
GE
OT
EC
H B
H P
LOT
S -
GIN
T S
TD
CA
NA
DA
LA
B.G
DT
- 1
9-7-
19
14:0
6 -
Z:\0
1 P
RO
JEC
T -
PR
OP
OS
ALS
\201
8 JO
BS
\BM
\0B
M-1
8-80
36_
CIT
Y O
F B
AR
RIE
_EA
_DU
NLO
P S
T\8
GE
OT
EC
H\2
FIE
LD IN
VE
ST
IGA
TIO
N &
FIN
DIN
GS
\2 B
OR
EH
OLE
S L
OG
S\G
INT
\DU
NLO
P S
TR
EE
T G
INT
.GP
J

Asphalt
Sand, some Gravel, some Cobbles, Grey
Sand, Brown
Silty Sand, Wet
Bottom of borehole at 2.1 m.
STSS-1
STSS-2
STSS-3
NOTES
GROUND ELEVATION 234.27 m
LOGGED BY ND
DRILLING METHOD Direct Push
HOLE SIZE 150 mm
DRILLING CONTRACTOR Tri Phase GROUND WATER LEVELS:
CHECKED BY HA
DATE STARTED 19-5-9 COMPLETED 19-5-9
AT TIME OF DRILLING ---
AT END OF DRILLING ---
AFTER DRILLING ---
FINES CONTENT (%) 20 40 60 80
20 40 60 80
PL LLMCMATERIAL DESCRIPTION
SA
MP
LE T
YP
EN
UM
BE
R
RE
CO
VE
RY
%(R
QD
)
BLO
WC
OU
NT
S(N
VA
LUE
)
SPT N VALUE 20 40 60 80
GR
AP
HIC
LOG
DE
PT
H(m
)
0
1
2
DR
Y U
NIT
WT
.(p
cf)
PO
CK
ET
PE
N.
(tsf
)
PAGE 1 OF 1BORING NUMBER W7
PROJECT NAME Dunlop Street EA
PROJECT LOCATION Dunlop Street @ Highway 400
CLIENT City of Barrie
PROJECT NUMBER 0BM-18-8036
GE
OT
EC
H B
H P
LOT
S -
GIN
T S
TD
CA
NA
DA
LA
B.G
DT
- 1
9-7-
19
14:0
6 -
Z:\0
1 P
RO
JEC
T -
PR
OP
OS
ALS
\201
8 JO
BS
\BM
\0B
M-1
8-80
36_
CIT
Y O
F B
AR
RIE
_EA
_DU
NLO
P S
T\8
GE
OT
EC
H\2
FIE
LD IN
VE
ST
IGA
TIO
N &
FIN
DIN
GS
\2 B
OR
EH
OLE
S L
OG
S\G
INT
\DU
NLO
P S
TR
EE
T G
INT
.GP
J

Asphalt
Sand, some Gravel, Brown
Sand, Brown-Grey, Wet
Unable to Collect Sample
Sand, some Silt, trace Gravel, Brown-Grey, Native
Clay, Grey, Wet, Dense
Sand, Grey-Brown, Wet
Clay, Grey, Dense
Bottom of borehole at 5.2 m.
SPTSS-1
SPTSS-2
SPTSS-3
SPTSS-4
SPTSS-5
SPTSS-6
SPTSS-7
9-14-20-18/0"
8-7-5-6/0"
1-4-6-8/0"
2-4-6-3/0"
1-3-2-4/0"
2-7-6-7/0"
4-11-5-5/0"
NOTES
GROUND ELEVATION 235.03 m
LOGGED BY ND
DRILLING METHOD Conventional
HOLE SIZE 150 mm
DRILLING CONTRACTOR Tri Phase GROUND WATER LEVELS:
CHECKED BY HA
DATE STARTED 19-5-10 COMPLETED 19-5-10
AT TIME OF DRILLING ---
AT END OF DRILLING ---
AFTER DRILLING ---
FINES CONTENT (%) 20 40 60 80
20 40 60 80
PL LLMCMATERIAL DESCRIPTION
SA
MP
LE T
YP
EN
UM
BE
R
RE
CO
VE
RY
%(R
QD
)
BLO
WC
OU
NT
S(N
VA
LUE
)
SPT N VALUE 20 40 60 80
GR
AP
HIC
LOG
DE
PT
H(m
)
0
1
2
3
4
5
DR
Y U
NIT
WT
.(p
cf)
PO
CK
ET
PE
N.
(tsf
)
PAGE 1 OF 1BORING NUMBER W8-1
PROJECT NAME Dunlop Street EA
PROJECT LOCATION Dunlop Street @ Highway 400
CLIENT City of Barrie
PROJECT NUMBER 0BM-18-8036
GE
OT
EC
H B
H P
LOT
S -
GIN
T S
TD
CA
NA
DA
LA
B.G
DT
- 1
9-7-
19
14:0
6 -
Z:\0
1 P
RO
JEC
T -
PR
OP
OS
ALS
\201
8 JO
BS
\BM
\0B
M-1
8-80
36_
CIT
Y O
F B
AR
RIE
_EA
_DU
NLO
P S
T\8
GE
OT
EC
H\2
FIE
LD IN
VE
ST
IGA
TIO
N &
FIN
DIN
GS
\2 B
OR
EH
OLE
S L
OG
S\G
INT
\DU
NLO
P S
TR
EE
T G
INT
.GP
J
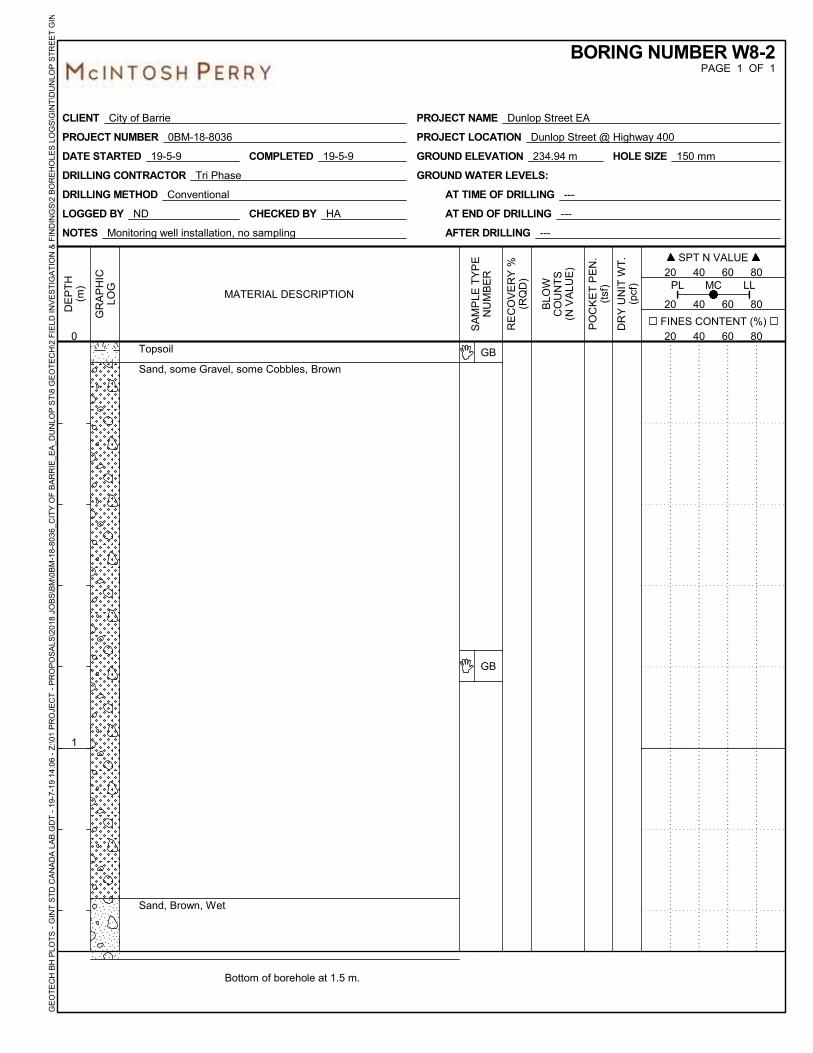
Topsoil
Sand, some Gravel, some Cobbles, Brown
Sand, Brown, Wet
Bottom of borehole at 1.5 m.
GB
GB
NOTES Monitoring well installation, no sampling
GROUND ELEVATION 234.94 m
LOGGED BY ND
DRILLING METHOD Conventional
HOLE SIZE 150 mm
DRILLING CONTRACTOR Tri Phase GROUND WATER LEVELS:
CHECKED BY HA
DATE STARTED 19-5-9 COMPLETED 19-5-9
AT TIME OF DRILLING ---
AT END OF DRILLING ---
AFTER DRILLING ---
FINES CONTENT (%) 20 40 60 80
20 40 60 80
PL LLMCMATERIAL DESCRIPTION
SA
MP
LE T
YP
EN
UM
BE
R
RE
CO
VE
RY
%(R
QD
)
BLO
WC
OU
NT
S(N
VA
LUE
)
SPT N VALUE 20 40 60 80
GR
AP
HIC
LOG
DE
PT
H(m
)
0
1
DR
Y U
NIT
WT
.(p
cf)
PO
CK
ET
PE
N.
(tsf
)
PAGE 1 OF 1BORING NUMBER W8-2
PROJECT NAME Dunlop Street EA
PROJECT LOCATION Dunlop Street @ Highway 400
CLIENT City of Barrie
PROJECT NUMBER 0BM-18-8036
GE
OT
EC
H B
H P
LOT
S -
GIN
T S
TD
CA
NA
DA
LA
B.G
DT
- 1
9-7-
19
14:0
6 -
Z:\0
1 P
RO
JEC
T -
PR
OP
OS
ALS
\201
8 JO
BS
\BM
\0B
M-1
8-80
36_
CIT
Y O
F B
AR
RIE
_EA
_DU
NLO
P S
T\8
GE
OT
EC
H\2
FIE
LD IN
VE
ST
IGA
TIO
N &
FIN
DIN
GS
\2 B
OR
EH
OLE
S L
OG
S\G
INT
\DU
NLO
P S
TR
EE
T G
INT
.GP
J

1
City of Barrie Dunlop Street EA MP 0BM 18-8036, Borehole Logs
Dunlop Street EA
Site Investigation: May 2019
Logged By: Bradley Trinh
Checked By: Scott Keeley
BH E1
Lat./Long. 44.383018°, -79.705520°
UTM 17N N 4915230.73, E 603114.19
Location: Anne St, North of Dunlop
0 - 215 Asph
215 - 305 Br Sa Some Gr Some Si
305 NFP Hand Dig
BH E2-1
Lat./Long. 44.382312°, -79.706013°
UTM 17N N 4915151.4, E 603076.41
Location: Dunlop, West of Anne
0 - 152 Asph
152 - 280 Gry Sa Some Gr Some Si
(SS-1A)
Percent Passing
16.0 mm = 100%
13.2 mm = 96.5%
9.5 mm = 90.2%
4.75 mm = 81.8%
1.18 mm = 69.5%
0.300 mm = 49.5%
0.075 mm = 12.7%
w = 9.27%
280 - 736 Br Sa W Si Some Cl Tr Gr
(SS-1B)
Percent Passing
19.0 mm = 100%
13.2 mm = 98.5%
9.5 mm = 97.6%
4.75 mm = 97.5%
0.075 mm = 36.5%
0.005 mm = 15.7%
0.002 mm = 11.9%
w = 11.5%
736 - 3.66 Lt Br Sa Some Si Tr Cl Tr Gr
(Native)
(SS-3)
(SS-4)
Percent Passing
9.5 mm = 100%
4.75 mm = 99.4%
0.075 mm = 10.2%
0.005 mm = 3.6%
0.002 mm = 3.1%
w = 4.38%
(SS-5)
3.66 - 4.42 Br Sa (Moist) (SS-6)
4.42 - 5.1 Br Sa (Wet)
5.1 - 5.2 Br Sa Some Si Some Cl Tr Gr
(SS-7)
Percent Passing
9.5 mm = 100%
4.75 mm = 98.5%
0.075 mm = 25.4%
0.005 mm = 15.5%
0.002 mm = 11.9%
w = 12.52%
BH E2-2
Lat./Long. 44.382357°, -79.706049°
UTM 17N N 4915156.03, E 603073.12
Location Dunlop, West of Anne
0 - 140 Asph
140 - 5.2 Monitoring Well
BH E3
Lat./Long. 44.382093°, -79.704925°
UTM 17N N 4915128.40, E 603163.85
Location: Anne, South of Dunlop
0 - 155 Asph
155 - 865 Br Sa W Gr Some Si (SS-1)
865 - 2.1 Lt Br F Sa (SS-2) (SS-3)

2
City of Barrie Dunlop Street EA MP 0BM 18-8036, Borehole Logs
BH E4-1
Lat./Long. 44.382863°, -79.704594°
UTM 17N N 4915214.56, E 603188.24
Location: Dunlop, East of Anne
0 - 165 Asph
165 - 395 Gry Sa W Gr Some Si (SS-1)
Percent Passing
26.5 mm = 100%
19.0 mm = 96.2%
13.2 mm = 89.8%
9.5 mm = 84.4%
4.75 mm = 73.5%
1.18 mm = 58.8%
0.300 mm = 30.1%
0.075 mm = 12.3%
Not Accept Gran A
Not Accept Gran B1
395 - 1.7 Br Sa Some Si Tr Gr (SS-2)
Percent Passing
9.5 mm = 100%
4.75 mm = 99.8%
1.18 mm = 98.4%
0.300 mm = 72.4%
0.075 mm = 10.4%
Not Accept Gran A
Not Accept Gran B1
1.7 - 2.3 Br Sa (Native) (SS-3)
w = 12.31%
2.3 - 3.0 Br Sa (Native) (SS-4)
w = 19.72%
3.0 - 4.0 Dk Br Sa (Native) (SS-5)
w = 12.0%
pH = 7.87
Resistivity = 716 ohm*cm
Redox Potential = 187 mV
Sulphides = <20 mg/kg
3.8 - 4.4 Gry Sa (Sat) (SS-6)
4.4 - 5.2 Gry Si Some Cl Tr Sa (Sat)
(SS-7)
Percent Passing
0.425 mm = 100%
0.075 mm = 99.0%
0.005 mm = 31.9%
0.002 mm = 20.1%
HSFH
Not Accept Gran A
Not Accept Gran B1
BH EW4-2
Lat./Long. 44.382808°, -79.704545°
UTM 17N N 4915208.67, E 603192.12
Location: Dunlop, East of Anne
0 - 5.2 Monitoring Well
BH EW-5
Lat./Long. 44.381488°, -79.706357°
UTM 17N N 4915059.15, E 603050.98
Location: Hart, South of Dunlop
0 - 102 Asph
102 - 610 Br Sa W Gr Some Si (SS-1)
610 - 1.7 Br Sa Some Gr Some Si (SS-2)
1.7 - 2.1 Br Sa Tr Si (SS-3)
BH W1
Lat./Long. 44.379449°, -79.713997°
UTM 17N N 4914823.59, E 602445.53
Location: Cedar Point, North of Dunlop
0 - 115 Asph
115 - 600 Br Sa and Gr Tr Si (SS-1)
600 - 1.22 Sa Some Gr Some Cob
1.22 - 1.8 Gry Si(y) Cl (Moist) (SS-2)

3
City of Barrie Dunlop Street EA MP 0BM 18-8036, Borehole Logs
BH W2-1
Lat./Long. 44.378493°, -79.714645°
UTM 17N N 4914716.26, E 602395.00
Location: Dunlop, West of Cedar Point
0 - 120 Asph
110 - 480 Br Sa and Gr Tr Si (SS-1)
w = 4.06%
480 - 1.5 Br Sa W Gr Tr Si
1.5 - 1.9 Br Sa and Gr Tr Si (SS-2)
w = 14.91%
1.9 - 2.6 Drk Br Sa W Gr Tr Si Tr Cob
(SS-3)
2.6 - 2.9 Gry Si (Damp) (SS-3)
2.9 - 3.4 Gry Sa (Saturated) (SS-4)
3.4 - 3.7 Gry Si (Saturated)
3.7 - 4.4 Gry Si(y) Sa (Saturated) (SS-5)
4.4 - 5.2 Gry Sa (Saturated)
BH W3
Lat./Long. 44.377097°, -79.716207°
UTM 17N N 4914559.29, E 602273.56
Location: Sarjeant, South of Dunlop
0 - 115 Asph
115 - 710 Br Sa and Gr Tr Si (SS-1)
710 - 1.7 Br Sa Tr Cob Tr Gr (SS-2)
1.7 - 2.0 Drk Br Sa Some Si (SS-3)
2.0 - 2.3 Sa Some Si Tr Roots
BH W4-1
Lat./Long. 44.377244°, -79.717271°
UTM 17N N 4914574.71, E 602188.70
Location: Dunlop, West of Sarjeant
0 - 155 Asph
155 - 610 Br Sa and Gr Tr Si (SS-1)
610 - 1.7 Br Sa Tr Gr (SS-2)
1.7 - 2.9 Br-Gry F-Co Sa Some Gr (Wet)
(SS-3)
(SS-4)
2.9 - 4.6 Br-Gry Co Sa Some Gr (Wet)
(SS-5)
(SS-6)
4.6 - 5.2 Gr Cl (Wet) (Soft) (SS-7)
BH W4-2
Lat./Long. 44.377243°, -79.717171°
UTM 17N N 4914567.47, E 602196.94
Location: Dunlop, West of Sarjeant
0 - 50 Topsoil
50 - 380 Br Sa Some Gr Some Org
380 - 1.1 Lt Br Sa (Damp)
*Monitoring Well Installation
BH W5-1
Lat./Long. 44.376553°, -79.719043°
UTM 17N N 4914495.56, E 602048.98
Location: Dunlop, East of Ferndale
0 - 205 Asph
205 - 500 Br Sa W Gr Some Si (SS-1)
Percent Passing
26.5 mm = 100%
19.0 mm = 97.1%
13.2 mm = 92.1%
9.5 mm = 86.1%
4.75 mm = 75.0%
1.18 mm = 57.5%
0.300 mm = 28.7%
0.075 mm = 13.0%
Not Accept Gran A
Not Accept Gran B1
500 - 1.1 Br Sa Some Gr Some Si (SS-2)
Percent Passing
26.5 mm = 93.2%
19.0 mm = 90.1%
13.2 mm = 88.2%
9.5 mm = 86.7%
4.75 mm = 81.4%
1.18 mm = 68.3%
0.300 mm = 43.6%
0.075 mm = 17.7%
Not Accept Gran A
Not Accept Gran B1
1.1 - 3.7 Br-Gry Sa Tr Gr Tr Si (Wet)
(SS-3) (SS-4) (SS-5)
Percent Passing
13.2 mm = 100%
9.5 mm = 98.8%

4
City of Barrie Dunlop Street EA MP 0BM 18-8036, Borehole Logs
4.75 mm = 94.3%
0.075 mm = 9.4%
0.005 mm = 3.9%
0.002 mm = 3.3%
3.7 - 5.2 Gry Cl (Dense) (SS-6)
w = 18.2%
pH = 7.73
Resistivity = 2360 ohm*cm
Redox Potential = 139 mV
Sulphides = <20 mg/kg
BH W5-2
Lat./Long. 44.376608°, -79.719155°
UTM 17N N 4914501.65, E 602038.94
Location: Dunlop, East of Ferndale
0 - 50 Topsoil
50 - 600 Br Sa and Gr Tr Si
600 - 3.1 Gry Sa Some Si (Wet)
3.1 - 4.6 Gry Cl (Wet)
*Monitoring Well Installation
BH W6
Lat./Long. 44.376496°, -79.720413°
UTM 17N N 4914487.26, E 601939.77
Location: Ferndale, North of Dunlop
0 - 150 Asph
150 - 830 Br Sa and Gr Some Cob (SS-1A)
830 - 1.1 Br Sa Tr Si (SS-1B)
1.1 - 1.7 Gry Sa Tr Si
1.7 - 2.2 Gry Sa Some Gr and Cob (SS-2)
BH W7
Lat./Long. 44.375553°, -79.719781°
UTM 17N N 4914383.58, E 601991.53
Location: Ferndale, South of Dunlop
0 - 125 Asph
125 - 660 Br Sa Some Gr Some Cob
(SS-1)
660 - 1.8 Br Sa Tr Si (SS-1B)
1.8 - 2.1 Si(y) Sa (Wet) (SS-3)
BH W8-1
Lat./Long. 44.375690°, -79.720794°
UTM 17N N 4914397.89, E 601910.01
Location: Dunlop, West of Ferndale
0 - 150 Asph
150 - 1.5 Br Gr(y) Sa Tr Si (SS-1)
Percent Passing
19.0 mm = 100%
13.2 mm = 95.2%
9.5 mm = 87.4%
4.75 mm = 67.9%
1.18 mm = 40.9%
0.300 mm = 17.2%
0.075 mm = 6.6%
Not Accept Gran A
Accept Gran B1
(SS-2)
1.5 - 2.1 Br-Gry Sa (Wet) (SS-3)
2.1 - 2.9 No Sample (SS-4)
2.9 - 4.0 Br-Gry Sa Some Si Tr Gr
(Native) (SS-5)
4.0 - 5.1 Gry-Br Sa (Wet) (SS-6)
5.1 - 5.2 Gry Cl (Dense) (SS-7)
BH W8-2
Lat./Long. 44.375636°, -79.720745°
UTM 17N N 4914391.18, E 601914.45
Location: Dunlop, West of Ferndale
0 - 50 Topsoil
50 - 1.4 Br Sa Some Gr Some Cob
1.4 - 1.5 Br Sa (Wet)
*Monitoring Well Installation

DUNLOP STREET MUNICIPAL CLASS EAGEOTECHNICAL REPORT
APPENDIX D: SOIL AND AGGREGATE GEOTECHNICAL LABORATORYRESULTS

ASTM D 2216
Depth Sample
Taken ( m )
Sample
Container I.D.
Wet Sample +
Tare (A)
Dry Sample +
Tare (B)Tare (C)
Mass of
Sample (D)
(B-C)
% Moisture
(A-B)/Dx100
0.15-0.30 Tr.213 446.09 421.36 154.47 266.89 9.27
0.30-0.61 Tr.102 651.74 598.68 137.43 461.25 11.50
2.30-2.90 Tr.137 541.71 524.57 132.92 391.65 4.38
4.60-5.20 Tr.209 1140.10 1033.68 183.59 850.09 12.52
1.52-2.13 Tr.61 161.34 149.46 52.89 96.57 12.31
2.29-2.90 Tr.90 205.98 180.78 52.97 127.81 19.72
0.00-0.61 Tr.75 152.79 148.90 53.18 95.72 4.06
1.52-2.13 Tr.169 756.98 676.05 133.42 542.63 14.91
1.52-2.13 Tr.161 416.18 375.40 133.42 241.98 16.85
2.29-2.90 Tr.47 212.26 188.16 52.88 135.28 17.81
2.29-2.90 Tr.23 223.39 200.62 53.34 147.28 15.46
3.05-3.66 Tr.71 218.77 196.01 52.80 143.21 15.89
0.00-0.70 Tr.120 635.31 617.06 132.04 485.02 3.76
0.76-1.37 Tr.202 672.68 596.37 196.09 400.28 19.06
1.52-2.14 Tr.89 248.29 226.22 53.20 173.02 12.76
3.81-4.42 Tr.68 241.48 221.69 52.75 168.94 11.71
4.57-5.20 Tr.167 904.74 771.15 132.98 638.17 20.93
0.00-0.61 Tr.104 652.71 640.28 132.95 507.33 2.45
0.76-1.37 Tr.210 552.75 524.16 180.34 343.82 8.32
2.29-2.90 Tr.7 216.87 191.39 53.48 137.91 18.48
3.05-3.66 Tr.121 395.02 368.92 189.34 179.58 14.53
4.57-5.18 Tr.8 185.06 161.82 53.25 108.57 21.41
0.00-0.61 Tr.212 933.10 899.90 182.41 717.49 4.63
0.76-1.37 Tr.203 947.80 909.49 153.28 756.21 5.07
3.05-3.66 Tr.94 193.27 171.71 53.89 117.82 18.30
3.81-4.42 Tr.199 771.38 664.00 128.70 535.30 20.06
4.57-5.20 Tr.22 219.84 195.07 53.49 141.58 17.50
W8-1 SS5
W2-1 SS1
W5-1 SS4
Non-Comformance's from Test Procedure: N/A
Comments:
Checked by: H.S. Signature:
W4-1 SS2
W4-1 SS4
W4-1 SS6
W4-1 SS7
W5-1 SS1
W5-1 SS2
W5-1 SS5
W5-1 SS7
W8-1SS1
W8-1 SS2
W8-1 SS6B
W8-1 SS7
W2-1 SS3
W2-1 SS3B
W2-1 SS5
W4-1 SS1
E4-1 SS3
E4-1 SS4
W2-1 SS2A
W2-1 SS2B
E2 SS1A
E2 SS1B
E2 SS4
E2 SS7
Project Name/Location: City of Barrie - Dunlop St. EA Study Date Tested: 05/22/19
Material Type: Soils Lab Sample No.: OL-19023
Borehole No.
Dunlop St.
Project No.: BM18-8036 Date Received: 05/10/19
WATER CONTENT DETERMINATION
Test Method Utilized MTO LS-701 AASHTO T-265

ASTM D 2216
Depth Sample
Taken ( m )
Sample
Container I.D.
Wet Sample +
Tare (A)
Dry Sample +
Tare (B)Tare (C)
Mass of
Sample (D)
(B-C)
% Moisture
(A-B)/Dx100
0.00-0.70 Tr.46 215.64 212.20 52.90 159.30 2.16
0.76-1.37 Tr.41 154.58 151.76 53.01 98.75 2.86
1.52-2.14 Tr.48 158.28 155.05 53.53 101.52 3.18
0.00-0.70 Tr.56 153.71 150.04 53.19 96.85 3.79
0.76-1.37 Tr.81 161.68 157.24 53.47 103.77 4.28
1.52-2.14 Tr.51 148.87 143.53 53.60 89.93 5.94
0.00-1.22 Tr.52 201.64 187.01 52.68 134.33 10.89
1.22-1.83 Tr.43 205.48 180.11 52.98 127.13 19.96
0.00-0.70 Tr.65 173.97 164.59 53.57 111.02 8.45
0.76-1.37 Tr.13 166.89 156.52 53.24 103.28 10.04
1.52-2.14 Tr.67 189.75 154.58 52.49 102.09 34.45
0.00-0.70 Tr.28 167.59 164.23 52.95 111.28 3.02
0.76-1.37 Tr.87 190.08 177.26 53.20 124.06 10.33
1.52-2.14 Tr.92 210.86 190.87 52.82 138.05 14.48
0.00-0.70 Tr.85 194.79 183.70 52.80 130.90 8.47
0.76-1.37 Tr.66 195.71 174.49 54.04 120.45 17.62
1.52-2.14 Tr.9 187.65 164.43 53.14 111.29 20.86
Comments:
Checked by: H.S. Signature:
Non-Comformance's from Test Procedure: N/A
Ferndale Dr.
W6 SS1A
W6 SS1B
W6 SS2
W7 SS1A
W7 SS1B
Sarjeant Dr.
W3 SS1
W3 SS2
W3 SS3
W7 SS2
E5 SS2
E5 SS3
Cedar Point Dr.
W1 SS1
W1 SS2
WATER CONTENT DETERMINATION
Test Method Utilized MTO LS-701 AASHTO T-265
Project No.: BM18-8036 Date Received: 05/10/19
E5 SS1
Project Name/Location: City of Barrie - Dunlop St. EA Study Date Tested: 05/22/19
Material Type: Soils Lab Sample No.: OL-19023
Borehole No.
Anne St.
E3 SS1
E3 SS2
E3 SS3
Hart Dr.

Th
ese
re
su
lts a
re fo
r th
e e
xclu
siv
e u
se
of th
e c
lien
t fo
r w
ho
m th
ey w
ere
ob
tain
ed
.
Checked By: H.Smith
Client:
Project:
Project No.: Figure
City of Barrie
Dunlop St. Environmental Assessment
BM18-8036 1 of 3
SYMBOL SOURCESAMPLE DEPTH
Material Description USCSNO. (ft.)
SOIL DATA
PE
RC
EN
T F
INE
R
0
10
20
30
40
50
60
70
80
90
100
PE
RC
EN
T C
OA
RS
ER
100
90
80
70
60
50
40
30
20
10
0
GRAIN SIZE - mm.
0.0010.010.1110100
% CobblesCoarse
% Gravel
Fine Coarse Medium
% Sand
Fine Silt
% Fines
Clay
0.0 0.0 18.2 8.4 16.0 44.7 12.7
0.0 0.0 2.5 0.4 7.4 53.2 24.3 12.2
0.0 0.0 0.6 0.2 5.8 83.2 7.1 3.1
0.0 0.0 1.5 4.4 25.2 43.5 16.1 9.3
0.0 3.4 5.5 1.7 13.7 49.8 17.7 8.2
6 in.
3 in.
2 in.
1½
in.
1 in.
¾ in.
½ in.
3/8
in.
#4
#10
#20
#30
#40
#60
#100
#140
#200
Particle Size Distribution Report
Dunlop St. E2SS1A 0.15-0.30 Sand some Gravel some Silt
Dunlop St. E2SS1B 0.30-0.61 Sand with Silt some Clay trace Gravel
Dunlop St. E2SS4 2.30-2.90 Sand trace Silt trace Clay trace Gravel
Dunlop St. E2SS7 4.60-5.20 Sand some Silt trace Clay trace Gravel
Dunlop St. W2-2SS2A 1.52-2.13 Sand some Silt trace Gravel trace Clay

McIntosh Perry
GRAIN SIZE DISTRIBUTION TEST DATA 2019-05-31
Client: City of BarrieProject: Dunlop St. Environmental AssessmentProject Number: BM18-8036Location: Dunlop St.Depth: 0.15-0.30 Sample Number: E2SS1AMaterial Description: Sand some Gravel some SiltChecked by: H.Smith
Sieve Test Data
DrySample
and Tare(grams)
Tare(grams)
CumulativePan
Tare Weight(grams)
SieveOpening
Size
CumulativeWeight
Retained(grams)
PercentFiner
PercentRetained
266.89 0.00 0.00 16.0mm 0.00 100.0 0.0
13.2mm 9.31 96.5 3.5
9.5mm 26.19 90.2 9.8
4.75mm 48.48 81.8 18.2
2.36mm 67.31 74.8 25.2
1.18mm 81.27 69.5 30.5
0.600mm 99.32 62.8 37.2
0.300mm 134.80 49.5 50.5
0.150mm 192.68 27.8 72.2
0.075mm 233.00 12.7 87.3
Fractional Components
Cobbles
0.0
Gravel
Coarse
0.0
Fine
18.2
Total
18.2
Sand
Coarse
8.4
Medium
16.0
Fine
44.7
Total
69.1
Fines
Silt Clay Total
12.7
D5 D10 D15
0.0849
D20
0.1091
D30
0.1617
D40
0.2206
D50
0.3056
D60
0.4940
D80
3.9770
D85
6.4872
D90
9.3971
D95
12.2136
FinenessModulus
2.44

McIntosh Perry
GRAIN SIZE DISTRIBUTION TEST DATA 2019-05-31
Client: City of BarrieProject: Dunlop St. Environmental AssessmentProject Number: BM18-8036Location: Dunlop St.Depth: 0.30-0.61 Sample Number: E2SS1BMaterial Description: Sand with Silt some Clay trace GravelChecked by: H.Smith
Sieve Test Data
DrySample
and Tare(grams)
Tare(grams)
CumulativePan
Tare Weight(grams)
SieveOpening
Size
CumulativeWeight
Retained(grams)
PercentFiner
PercentRetained
461.25 0.00 0.00 19.0mm 0.00 100.0 0.0
16.0mm 7.04 98.5 1.5
13.2mm 7.04 98.5 1.5
9.5mm 11.07 97.6 2.4
4.75mm 11.60 97.5 2.5
2.0mm 13.16 97.1 2.9
105.18 0.00 0.00 0.850mm 1.57 95.7 4.3
0.425mm 8.02 89.7 10.3
0.250mm 21.25 77.5 22.5
0.106mm 56.73 44.7 55.3
0.075mm 65.63 36.5 63.5
Hydrometer Test Data
Hydrometer test uses material passing #10Percent passing #10 based upon complete sample = 97.1Weight of hydrometer sample =105.18Automatic temperature correction Composite correction (fluid density and meniscus height) at 20 deg. C = -5.0Meniscus correction only = -1.0Specific gravity of solids = 2.718Hydrometer type = 152H Hydrometer effective depth equation: L = 16.4047 - 0.190 x Rm
ElapsedTime (min.)
Temp.(deg. C.)
ActualReading
CorrectedReading K Rm
Eff.Depth
Diameter(mm.)
PercentFiner
PercentRetained
1.00 21.7 39.0 34.3 0.0131 38.0 9.2 0.0397 31.2 68.8
2.00 21.7 36.0 31.3 0.0131 35.0 9.8 0.0289 28.5 71.5
5.00 21.7 33.0 28.3 0.0131 32.0 10.3 0.0188 25.8 74.2
15.00 21.7 29.0 24.3 0.0131 28.0 11.1 0.0113 22.1 77.9
30.00 21.7 26.0 21.3 0.0131 25.0 11.7 0.0082 19.4 80.6
60.00 21.7 23.0 18.3 0.0131 22.0 12.2 0.0059 16.7 83.3
250.00 21.7 19.5 14.8 0.0131 18.5 12.9 0.0030 13.5 86.5
1440.00 21.7 16.5 11.8 0.0131 15.5 13.5 0.0013 10.8 89.2

McIntosh Perry
Fractional Components
Cobbles
0.0
Gravel
Coarse
0.0
Fine
2.5
Total
2.5
Sand
Coarse
0.4
Medium
7.4
Fine
53.2
Total
61.0
Fines
Silt
24.3
Clay
12.2
Total
36.5
D5 D10 D15
0.0044
D20
0.0087
D30
0.0343
D40
0.0893
D50
0.1234
D60
0.1588
D80
0.2709
D85
0.3290
D90
0.4325
D95
0.7313
FinenessModulus
0.77

McIntosh Perry
GRAIN SIZE DISTRIBUTION TEST DATA 2019-05-31
Client: City of BarrieProject: Dunlop St. Environmental AssessmentProject Number: BM18-8036Location: Dunlop St.Depth: 2.30-2.90 Sample Number: E2SS4Material Description: Sand trace Silt trace Clay trace GravelChecked by: H.Smith
Sieve Test Data
DrySample
and Tare(grams)
Tare(grams)
CumulativePan
Tare Weight(grams)
SieveOpening
Size
CumulativeWeight
Retained(grams)
PercentFiner
PercentRetained
391.65 0.00 0.00 9.5mm 0.00 100.0 0.0
4.75mm 2.46 99.4 0.6
2.00mm 3.24 99.2 0.8
122.78 0.00 0.00 0.850mm 0.80 98.5 1.5
0.425mm 7.11 93.4 6.6
0.250mm 33.50 72.1 27.9
0.106mm 99.40 18.9 81.1
0.075mm 110.18 10.2 89.8
Hydrometer Test Data
Hydrometer test uses material passing #10Percent passing #10 based upon complete sample = 99.2Weight of hydrometer sample =122.78Automatic temperature correction Composite correction (fluid density and meniscus height) at 20 deg. C = -1.0Meniscus correction only = -1.0Specific gravity of solids = 2.710Hydrometer type = 152H Hydrometer effective depth equation: L = 16.8007 - 0.186 x Rm
ElapsedTime (min.)
Temp.(deg. C.)
ActualReading
CorrectedReading K Rm
Eff.Depth
Diameter(mm.)
PercentFiner
PercentRetained
1.00 21.7 8.0 7.3 0.0131 7.0 15.5 0.0517 5.8 94.2
2.00 21.7 7.5 6.8 0.0131 6.5 15.6 0.0366 5.4 94.6
5.00 21.7 7.0 6.3 0.0131 6.0 15.7 0.0232 5.1 94.9
15.00 21.7 6.5 5.8 0.0131 5.5 15.8 0.0135 4.7 95.3
30.00 21.7 6.0 5.3 0.0131 5.0 15.9 0.0095 4.3 95.7
60.00 21.7 5.5 4.8 0.0131 4.5 16.0 0.0068 3.9 96.1
250.00 21.7 5.0 4.3 0.0131 4.0 16.1 0.0033 3.5 96.5
1440.00 20.8 4.5 3.6 0.0133 3.5 16.1 0.0014 2.9 97.1

McIntosh Perry
Fractional Components
Cobbles
0.0
Gravel
Coarse
0.0
Fine
0.6
Total
0.6
Sand
Coarse
0.2
Medium
5.8
Fine
83.2
Total
89.2
Fines
Silt
7.1
Clay
3.1
Total
10.2
D5
0.0221
D10
0.0742
D15
0.0944
D20
0.1089
D30
0.1322
D40
0.1547
D50
0.1789
D60
0.2067
D80
0.2899
D85
0.3246
D90
0.3736
D95
0.4601
FinenessModulus
0.85
Cu
2.79
Cc
1.14

McIntosh Perry
GRAIN SIZE DISTRIBUTION TEST DATA 2019-05-31
Client: City of BarrieProject: Dunlop St. Environmental AssessmentProject Number: BM18-8036Location: Dunlop St.Depth: 4.60-5.20 Sample Number: E2SS7Material Description: Sand some Silt trace Clay trace GravelChecked by: H.Smith
Sieve Test Data
DrySample
and Tare(grams)
Tare(grams)
CumulativePan
Tare Weight(grams)
SieveOpening
Size
CumulativeWeight
Retained(grams)
PercentFiner
PercentRetained
850.09 0.00 0.00 9.5mm 0.00 100.0 0.0
4.75mm 12.84 98.5 1.5
2.00mm 50.06 94.1 5.9
100.39 0.00 0.00 0.850mm 9.56 85.1 14.9
0.425mm 26.88 68.9 31.1
0.250mm 48.05 49.1 50.9
0.106mm 69.45 29.0 71.0
0.075mm 73.34 25.4 74.6
Hydrometer Test Data
Hydrometer test uses material passing #10Percent passing #10 based upon complete sample = 94.1Weight of hydrometer sample =100.39Automatic temperature correction Composite correction (fluid density and meniscus height) at 20 deg. C = -5.0Meniscus correction only = -1.0Specific gravity of solids = 2.715Hydrometer type = 152H Hydrometer effective depth equation: L = 16.4047 - 0.190 x Rm
ElapsedTime (min.)
Temp.(deg. C.)
ActualReading
CorrectedReading K Rm
Eff.Depth
Diameter(mm.)
PercentFiner
PercentRetained
1.00 21.7 30.0 25.3 0.0131 29.0 10.9 0.0433 23.4 76.6
2.00 21.7 29.0 24.3 0.0131 28.0 11.1 0.0309 22.5 77.5
5.00 21.7 25.5 20.8 0.0131 24.5 11.7 0.0201 19.3 80.7
15.00 21.7 23.0 18.3 0.0131 22.0 12.2 0.0118 16.9 83.1
30.00 21.7 21.0 16.3 0.0131 20.0 12.6 0.0085 15.1 84.9
60.00 21.7 20.0 15.3 0.0131 19.0 12.8 0.0061 14.2 85.8
250.00 21.7 16.5 11.8 0.0131 15.5 13.5 0.0030 10.9 89.1
1440.00 21.7 13.5 8.8 0.0131 12.5 14.0 0.0013 8.2 91.8
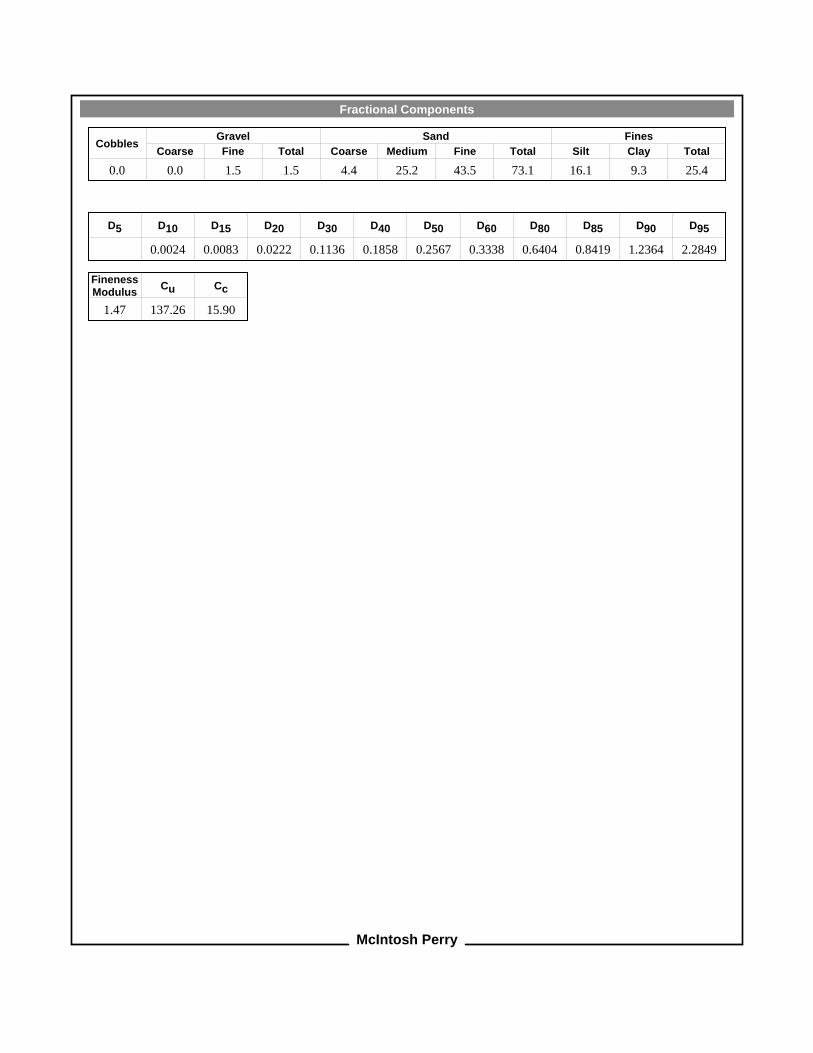
McIntosh Perry
Fractional Components
Cobbles
0.0
Gravel
Coarse
0.0
Fine
1.5
Total
1.5
Sand
Coarse
4.4
Medium
25.2
Fine
43.5
Total
73.1
Fines
Silt
16.1
Clay
9.3
Total
25.4
D5 D10
0.0024
D15
0.0083
D20
0.0222
D30
0.1136
D40
0.1858
D50
0.2567
D60
0.3338
D80
0.6404
D85
0.8419
D90
1.2364
D95
2.2849
FinenessModulus
1.47
Cu
137.26
Cc
15.90

McIntosh Perry
GRAIN SIZE DISTRIBUTION TEST DATA 2019-05-31
Client: City of BarrieProject: Dunlop St. Environmental AssessmentProject Number: BM18-8036Location: Dunlop St.Depth: 1.52-2.13 Sample Number: W2-2SS2AMaterial Description: Sand some Silt trace Gravel trace ClayChecked by: H.Smith
Sieve Test Data
DrySample
and Tare(grams)
Tare(grams)
CumulativePan
Tare Weight(grams)
SieveOpening
Size
CumulativeWeight
Retained(grams)
PercentFiner
PercentRetained
542.63 0.00 0.00 26.5mm 0.00 100.0 0.0
19.0mm 18.73 96.5 3.5
16.0mm 26.30 95.2 4.8
13.2mm 26.30 95.2 4.8
9.5mm 36.89 93.2 6.8
4.75mm 48.19 91.1 8.9
2.0mm 57.66 89.4 10.6
74.88 0.00 0.00 0.850mm 2.82 86.0 14.0
0.425mm 11.43 75.7 24.3
0.250mm 26.30 58.0 42.0
0.106mm 48.87 31.0 69.0
0.075mm 53.21 25.9 74.1
Hydrometer Test Data
Hydrometer test uses material passing #10Percent passing #10 based upon complete sample = 89.4Weight of hydrometer sample =74.88Automatic temperature correction Composite correction (fluid density and meniscus height) at 20 deg. C = -5.0Meniscus correction only = -1.0Specific gravity of solids = 2.720Hydrometer type = 152H Hydrometer effective depth equation: L = 16.4047 - 0.190 x Rm
ElapsedTime (min.)
Temp.(deg. C.)
ActualReading
CorrectedReading K Rm
Eff.Depth
Diameter(mm.)
PercentFiner
PercentRetained
1.00 21.7 22.0 17.3 0.0131 21.0 12.4 0.0461 20.4 79.6
2.00 21.7 20.0 15.3 0.0131 19.0 12.8 0.0331 18.0 82.0
5.00 21.7 18.0 13.3 0.0131 17.0 13.2 0.0212 15.7 84.3
15.00 21.7 16.0 11.3 0.0131 15.0 13.6 0.0124 13.3 86.7
30.00 21.7 14.5 9.8 0.0131 13.5 13.8 0.0089 11.6 88.4
60.00 21.7 14.0 9.3 0.0131 13.0 13.9 0.0063 11.0 89.0
250.00 21.7 12.0 7.3 0.0131 11.0 14.3 0.0031 8.6 91.4
1440.00 20.8 11.5 6.6 0.0132 10.5 14.4 0.0013 7.8 92.2

McIntosh Perry
Fractional Components
Cobbles
0.0
Gravel
Coarse
3.4
Fine
5.5
Total
8.9
Sand
Coarse
1.7
Medium
13.7
Fine
49.8
Total
65.2
Fines
Silt
17.7
Clay
8.2
Total
25.9
D5 D10
0.0046
D15
0.0181
D20
0.0441
D30
0.1002
D40
0.1499
D50
0.2013
D60
0.2639
D80
0.5153
D85
0.7504
D90
2.6313
D95
12.4059
FinenessModulus
1.54
Cu
57.91
Cc
8.35

Th
ese
re
su
lts a
re fo
r th
e e
xclu
siv
e u
se
of th
e c
lien
t fo
r w
ho
m th
ey w
ere
ob
tain
ed
.
Checked By: H.Smith
Client:
Project:
Project No.: Figure
City of Barrie
Dunlop St. Environmental Assessment
BM18-8036 2 of 3
SYMBOL SOURCESAMPLE DEPTH
Material Description USCSNO. (ft.)
SOIL DATA
PE
RC
EN
T F
INE
R
0
10
20
30
40
50
60
70
80
90
100
PE
RC
EN
T C
OA
RS
ER
100
90
80
70
60
50
40
30
20
10
0
GRAIN SIZE - mm.
0.0010.010.1110100
% CobblesCoarse
% Gravel
Fine Coarse Medium
% Sand
Fine Silt
% Fines
Clay
0.0 0.0 6.2 2.0 13.5 51.3 19.0 8.0
0.0 3.8 22.7 9.0 25.2 27.0 12.3
0.0 0.0 0.2 0.6 11.9 76.9 10.4
0.0 0.0 0.0 0.0 0.0 1.0 78.1 20.9
0.0 2.8 22.2 10.8 27.8 23.4 13.0
6 in.
3 in.
2 in.
1½
in.
1 in.
¾ in.
½ in.
3/8
in.
#4
#10
#20
#30
#40
#60
#100
#140
#200
Particle Size Distribution Report
Dunlop St. W2-2SS2B 1.52-2.13 Sand with Silt trace Clay trace Gravel
Dunlop St. W4-1SS1 0.00-0.70 Sand with Gravel some Silt
Dunlop St. W4-1SS2 0.76-1.37 Sand some Silt trace Gravel
Dunlop St. W4-1SS7 4.57-5.20 Silt with Clay trace Sand ML
Dunlop St. W5-1SS1 0.00-0.61 Sand with Gravel some Silt

McIntosh Perry
GRAIN SIZE DISTRIBUTION TEST DATA 2019-05-31
Client: City of BarrieProject: Dunlop St. Environmental AssessmentProject Number: BM18-8036Location: Dunlop St.Depth: 1.52-2.13 Sample Number: W2-2SS2BMaterial Description: Sand with Silt trace Clay trace GravelChecked by: H.Smith
Sieve Test Data
DrySample
and Tare(grams)
Tare(grams)
CumulativePan
Tare Weight(grams)
SieveOpening
Size
CumulativeWeight
Retained(grams)
PercentFiner
PercentRetained
241.98 0.00 0.00 19.0mm 0.00 100.0 0.0
16.0mm 9.44 96.1 3.9
13.2mm 9.44 96.1 3.9
9.5mm 9.44 96.1 3.9
4.75mm 14.93 93.8 6.2
2.0mm 19.76 91.8 8.2
104.66 0.00 0.00 0.850mm 3.60 88.7 11.3
0.425mm 15.47 78.3 21.7
0.250mm 36.38 59.9 40.1
0.106mm 67.91 32.2 67.8
0.075mm 73.85 27.0 73.0
Hydrometer Test Data
Hydrometer test uses material passing #10Percent passing #10 based upon complete sample = 91.8Weight of hydrometer sample =104.66Automatic temperature correction Composite correction (fluid density and meniscus height) at 20 deg. C = -5.0Meniscus correction only = -1.0Specific gravity of solids = 2.715Hydrometer type = 152H Hydrometer effective depth equation: L = 16.4047 - 0.190 x Rm
ElapsedTime (min.)
Temp.(deg. C.)
ActualReading
CorrectedReading K Rm
Eff.Depth
Diameter(mm.)
PercentFiner
PercentRetained
1.00 21.7 28.0 23.3 0.0131 27.0 11.3 0.0440 20.2 79.8
2.00 21.7 25.0 20.3 0.0131 24.0 11.8 0.0319 17.6 82.4
5.00 21.7 22.5 17.8 0.0131 21.5 12.3 0.0206 15.4 84.6
15.00 21.7 20.0 15.3 0.0131 19.0 12.8 0.0121 13.3 86.7
30.00 21.7 17.5 12.8 0.0131 16.5 13.3 0.0087 11.1 88.9
60.00 21.7 16.5 11.8 0.0131 15.5 13.5 0.0062 10.2 89.8
250.00 21.7 15.0 10.3 0.0131 14.0 13.7 0.0031 8.9 91.1
1440.00 20.8 13.0 8.1 0.0133 12.0 14.1 0.0013 7.0 93.0

McIntosh Perry
Fractional Components
Cobbles
0.0
Gravel
Coarse
0.0
Fine
6.2
Total
6.2
Sand
Coarse
2.0
Medium
13.5
Fine
51.3
Total
66.8
Fines
Silt
19.0
Clay
8.0
Total
27.0
D5 D10
0.0053
D15
0.0182
D20
0.0432
D30
0.0931
D40
0.1435
D50
0.1925
D60
0.2506
D80
0.4554
D85
0.5942
D90
1.0640
D95
6.6692
FinenessModulus
1.34
Cu
46.99
Cc
6.49

McIntosh Perry
GRAIN SIZE DISTRIBUTION TEST DATA 2019-05-31
Client: City of BarrieProject: Dunlop St. Environmental AssessmentProject Number: BM18-8036Location: Dunlop St.Depth: 0.00-0.70 Sample Number: W4-1SS1Material Description: Sand with Gravel some SiltChecked by: H.Smith
Sieve Test Data
DrySample
and Tare(grams)
Tare(grams)
CumulativePan
Tare Weight(grams)
SieveOpening
Size
CumulativeWeight
Retained(grams)
PercentFiner
PercentRetained
485.02 0.00 0.00 26.5mm 0.00 100.0 0.0
19.0mm 18.61 96.2 3.8
16.0mm 25.68 94.7 5.3
13.2mm 49.63 89.8 10.2
9.5mm 75.85 84.4 15.6
4.75mm 128.51 73.5 26.5
2.36mm 164.48 66.1 33.9
1.18mm 199.67 58.8 41.2
0.600mm 251.79 48.1 51.9
0.300mm 339.23 30.1 69.9
0.150mm 397.70 18.0 82.0
0.075mm 425.24 12.3 87.7
Fractional Components
Cobbles
0.0
Gravel
Coarse
3.8
Fine
22.7
Total
26.5
Sand
Coarse
9.0
Medium
25.2
Fine
27.0
Total
61.2
Fines
Silt Clay Total
12.3
D5 D10 D15
0.1098
D20
0.1755
D30
0.2993
D40
0.4366
D50
0.6566
D60
1.3048
D80
7.1397
D85
9.9754
D90
13.3192
D95
16.3040
FinenessModulus
3.25
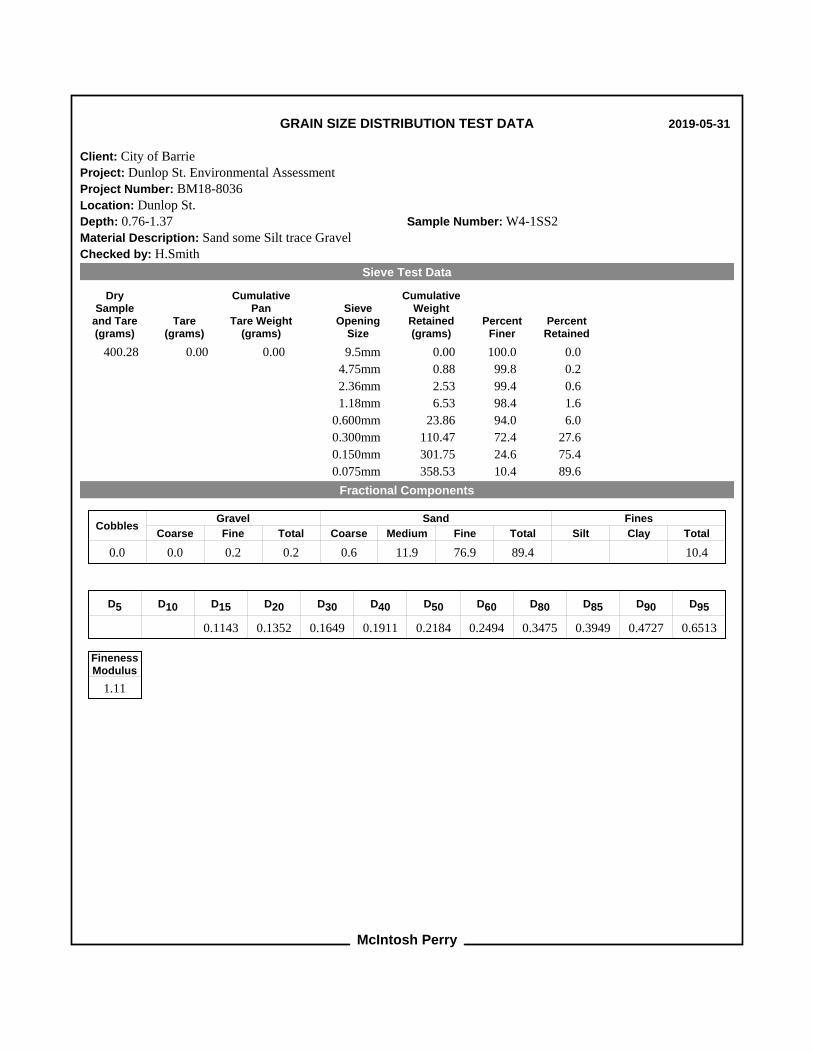
McIntosh Perry
GRAIN SIZE DISTRIBUTION TEST DATA 2019-05-31
Client: City of BarrieProject: Dunlop St. Environmental AssessmentProject Number: BM18-8036Location: Dunlop St.Depth: 0.76-1.37 Sample Number: W4-1SS2Material Description: Sand some Silt trace GravelChecked by: H.Smith
Sieve Test Data
DrySample
and Tare(grams)
Tare(grams)
CumulativePan
Tare Weight(grams)
SieveOpening
Size
CumulativeWeight
Retained(grams)
PercentFiner
PercentRetained
400.28 0.00 0.00 9.5mm 0.00 100.0 0.0
4.75mm 0.88 99.8 0.2
2.36mm 2.53 99.4 0.6
1.18mm 6.53 98.4 1.6
0.600mm 23.86 94.0 6.0
0.300mm 110.47 72.4 27.6
0.150mm 301.75 24.6 75.4
0.075mm 358.53 10.4 89.6
Fractional Components
Cobbles
0.0
Gravel
Coarse
0.0
Fine
0.2
Total
0.2
Sand
Coarse
0.6
Medium
11.9
Fine
76.9
Total
89.4
Fines
Silt Clay Total
10.4
D5 D10 D15
0.1143
D20
0.1352
D30
0.1649
D40
0.1911
D50
0.2184
D60
0.2494
D80
0.3475
D85
0.3949
D90
0.4727
D95
0.6513
FinenessModulus
1.11

McIntosh Perry
GRAIN SIZE DISTRIBUTION TEST DATA 2019-05-31
Client: City of BarrieProject: Dunlop St. Environmental AssessmentProject Number: BM18-8036Location: Dunlop St.Depth: 4.57-5.20 Sample Number: W4-1SS7Material Description: Silt with Clay trace SandUSCS: MLChecked by: H.Smith
Sieve Test Data
DrySample
and Tare(grams)
Tare(grams)
CumulativePan
Tare Weight(grams)
SieveOpening
Size
CumulativeWeight
Retained(grams)
PercentFiner
PercentRetained
638.17 0.00 0.00 2.00mm 0.00 100.0 0.0
62.82 0.00 0.00 0.850mm 0.00 100.0 0.0
0.425mm 0.00 100.0 0.0
0.250mm 0.20 99.7 0.3
0.106mm 0.37 99.4 0.6
0.075mm 0.60 99.0 1.0
Hydrometer Test Data
Hydrometer test uses material passing #10Percent passing #10 based upon complete sample = 100.0Weight of hydrometer sample =62.82Automatic temperature correction Composite correction (fluid density and meniscus height) at 20 deg. C = -5.0Meniscus correction only = -1.0Specific gravity of solids = 2.730Hydrometer type = 152H Hydrometer effective depth equation: L = 16.4047 - 0.190 x Rm
ElapsedTime (min.)
Temp.(deg. C.)
ActualReading
CorrectedReading K Rm
Eff.Depth
Diameter(mm.)
PercentFiner
PercentRetained
1.00 21.7 53.0 48.3 0.0130 52.0 6.5 0.0333 75.6 24.4
2.00 21.7 50.5 45.8 0.0130 49.5 7.0 0.0244 71.7 28.3
5.00 21.7 45.0 40.3 0.0130 44.0 8.0 0.0166 63.1 36.9
15.00 21.7 37.0 32.3 0.0130 36.0 9.6 0.0104 50.6 49.4
30.00 21.7 31.5 26.8 0.0130 30.5 10.6 0.0078 42.0 58.0
60.00 21.7 26.5 21.8 0.0130 25.5 11.6 0.0057 34.2 65.8
250.00 21.7 20.5 15.8 0.0130 19.5 12.7 0.0029 24.8 75.2
1440.00 20.8 15.5 10.6 0.0132 14.5 13.6 0.0013 16.6 83.4

McIntosh Perry
Fractional Components
Cobbles
0.0
Gravel
Coarse
0.0
Fine
0.0
Total
0.0
Sand
Coarse
0.0
Medium
0.0
Fine
1.0
Total
1.0
Fines
Silt
78.1
Clay
20.9
Total
99.0
D5 D10 D15 D20
0.0018
D30
0.0046
D40
0.0072
D50
0.0102
D60
0.0147
D80
0.0396
D85
0.0460
D90
0.0530
D95
0.0619
FinenessModulus
0.01

McIntosh Perry
GRAIN SIZE DISTRIBUTION TEST DATA 2019-05-31
Client: City of BarrieProject: Dunlop St. Environmental AssessmentProject Number: BM18-8036Location: Dunlop St.Depth: 0.00-0.61 Sample Number: W5-1SS1Material Description: Sand with Gravel some SiltChecked by: H.Smith
Sieve Test Data
DrySample
and Tare(grams)
Tare(grams)
CumulativePan
Tare Weight(grams)
SieveOpening
Size
CumulativeWeight
Retained(grams)
PercentFiner
PercentRetained
507.33 0.00 0.00 26.5mm 0.00 100.0 0.0
19.0mm 14.71 97.1 2.9
16.0mm 34.45 93.2 6.8
13.2mm 40.10 92.1 7.9
9.5mm 70.48 86.1 13.9
4.75mm 127.07 75.0 25.0
2.36mm 171.73 66.2 33.8
1.18mm 215.66 57.5 42.5
0.600mm 281.68 44.5 55.5
0.300mm 361.72 28.7 71.3
0.150mm 414.79 18.2 81.8
0.075mm 441.59 13.0 87.0
Fractional Components
Cobbles
0.0
Gravel
Coarse
2.8
Fine
22.2
Total
25.0
Sand
Coarse
10.8
Medium
27.8
Fine
23.4
Total
62.0
Fines
Silt Clay Total
13.0
D5 D10 D15
0.1027
D20
0.1750
D30
0.3195
D40
0.4948
D50
0.7758
D60
1.4087
D80
6.8159
D85
9.0167
D90
11.3598
D95
17.4310
FinenessModulus
3.27

Th
ese
re
su
lts a
re fo
r th
e e
xclu
siv
e u
se
of th
e c
lien
t fo
r w
ho
m th
ey w
ere
ob
tain
ed
.
Checked By: H.Smith
Client:
Project:
Project No.: Figure
City of Barrie
Dunlop St. Environmental Assessment
BM18-8036 3 of 3
SYMBOL SOURCESAMPLE DEPTH
Material Description USCSNO. (ft.)
SOIL DATA
PE
RC
EN
T F
INE
R
0
10
20
30
40
50
60
70
80
90
100
PE
RC
EN
T C
OA
RS
ER
100
90
80
70
60
50
40
30
20
10
0
GRAIN SIZE - mm.
0.0010.010.1110100
% CobblesCoarse
% Gravel
Fine Coarse Medium
% Sand
Fine Silt
% Fines
Clay
0.0 9.9 8.7 7.6 21.8 34.3 17.7
0.0 0.0 5.7 2.7 16.2 66.0 6.0 3.4
0.0 0.0 32.1 20.2 23.5 17.6 6.6
0.0 1.4 26.7 20.7 25.7 19.3 6.2
0.0 0.0 0.1 0.0 0.2 3.0 83.3 13.4
6 in.
3 in.
2 in.
1½
in.
1 in.
¾ in.
½ in.
3/8
in.
#4
#10
#20
#30
#40
#60
#100
#140
#200
Particle Size Distribution Report
Dunlop St. W5-1SS2 0.76-1.37 Sand some Gravel some Silt
Dunlop St. W5-1SS5 3.05-3.66 Sand trace Silt trace Gravel trace Clay
Dunlop St. W8-1SS1 0.00-0.61 Gravelly Sand trace Silt
Dunlop St. W8-1SS2 0.76-1.37 Sand with Gravel trace Silt
Dunlop St. W8-1SS6B 3.81-4.42 Silt some Clay trace Sand trace Gravel ML

McIntosh Perry
GRAIN SIZE DISTRIBUTION TEST DATA 2019-05-31
Client: City of BarrieProject: Dunlop St. Environmental AssessmentProject Number: BM18-8036Location: Dunlop St.Depth: 0.76-1.37 Sample Number: W5-1SS2Material Description: Sand some Gravel some SiltChecked by: H.Smith
Sieve Test Data
DrySample
and Tare(grams)
Tare(grams)
CumulativePan
Tare Weight(grams)
SieveOpening
Size
CumulativeWeight
Retained(grams)
PercentFiner
PercentRetained
343.82 0.00 0.00 37.5mm 0.00 100.0 0.0
26.5mm 23.29 93.2 6.8
19.0mm 34.19 90.1 9.9
16.0mm 40.74 88.2 11.8
13.2mm 40.74 88.2 11.8
9.5mm 45.56 86.7 13.3
4.75mm 63.94 81.4 18.6
2.36mm 84.89 75.3 24.7
1.18mm 108.87 68.3 31.7
0.600mm 141.33 58.9 41.1
0.300mm 193.75 43.6 56.4
0.150mm 251.67 26.8 73.2
0.075mm 282.90 17.7 82.3
Fractional Components
Cobbles
0.0
Gravel
Coarse
9.9
Fine
8.7
Total
18.6
Sand
Coarse
7.6
Medium
21.8
Fine
34.3
Total
63.7
Fines
Silt Clay Total
17.7
D5 D10 D15 D20
0.0934
D30
0.1747
D40
0.2606
D50
0.3894
D60
0.6396
D80
4.0168
D85
7.4712
D90
18.9101
D95
29.6371
FinenessModulus
2.69

McIntosh Perry
GRAIN SIZE DISTRIBUTION TEST DATA 2019-05-31
Client: City of BarrieProject: Dunlop St. Environmental AssessmentProject Number: BM18-8036Location: Dunlop St.Depth: 3.05-3.66 Sample Number: W5-1SS5Material Description: Sand trace Silt trace Gravel trace ClayChecked by: H.Smith
Sieve Test Data
DrySample
and Tare(grams)
Tare(grams)
CumulativePan
Tare Weight(grams)
SieveOpening
Size
CumulativeWeight
Retained(grams)
PercentFiner
PercentRetained
179.58 0.00 0.00 13.2mm 0.00 100.0 0.0
9.5mm 2.16 98.8 1.2
4.75mm 10.16 94.3 5.7
2.0mm 15.12 91.6 8.4
126.68 0.00 0.00 0.850mm 5.73 87.4 12.6
0.425mm 22.34 75.4 24.6
0.250mm 56.21 50.9 49.1
0.106mm 107.05 14.2 85.8
0.075mm 113.65 9.4 90.6
Hydrometer Test Data
Hydrometer test uses material passing #10Percent passing #10 based upon complete sample = 91.6Weight of hydrometer sample =126.68Automatic temperature correction Composite correction (fluid density and meniscus height) at 20 deg. C = -1.0Meniscus correction only = -1.0Specific gravity of solids = 2.710Hydrometer type = 152H Hydrometer effective depth equation: L = 16.8007 - 0.186 x Rm
ElapsedTime (min.)
Temp.(deg. C.)
ActualReading
CorrectedReading K Rm
Eff.Depth
Diameter(mm.)
PercentFiner
PercentRetained
1.00 21.7 10.0 9.3 0.0131 9.0 15.1 0.0511 6.7 93.3
2.00 21.7 9.0 8.3 0.0131 8.0 15.3 0.0363 5.9 94.1
5.00 21.7 8.0 7.3 0.0131 7.0 15.5 0.0231 5.2 94.8
15.00 21.7 7.5 6.8 0.0131 6.5 15.6 0.0134 4.9 95.1
30.00 21.7 7.0 6.3 0.0131 6.0 15.7 0.0095 4.5 95.5
60.00 21.7 6.5 5.8 0.0131 5.5 15.8 0.0067 4.2 95.8
250.00 21.7 6.0 5.3 0.0131 5.0 15.9 0.0033 3.8 96.2
1440.00 21.7 5.0 4.3 0.0131 4.0 16.1 0.0014 3.1 96.9

McIntosh Perry
Fractional Components
Cobbles
0.0
Gravel
Coarse
0.0
Fine
5.7
Total
5.7
Sand
Coarse
2.7
Medium
16.2
Fine
66.0
Total
84.9
Fines
Silt
6.0
Clay
3.4
Total
9.4
D5
0.0167
D10
0.0798
D15
0.1097
D20
0.1294
D30
0.1652
D40
0.2027
D50
0.2455
D60
0.2978
D80
0.4977
D85
0.6590
D90
1.2956
D95
5.3022
FinenessModulus
1.56
Cu
3.73
Cc
1.15

McIntosh Perry
GRAIN SIZE DISTRIBUTION TEST DATA 2019-05-31
Client: City of BarrieProject: Dunlop St. Environmental AssessmentProject Number: BM18-8036Location: Dunlop St.Depth: 0.00-0.61 Sample Number: W8-1SS1Material Description: Gravelly Sand trace SiltChecked by: H.Smith
Sieve Test Data
DrySample
and Tare(grams)
Tare(grams)
CumulativePan
Tare Weight(grams)
SieveOpening
Size
CumulativeWeight
Retained(grams)
PercentFiner
PercentRetained
717.49 0.00 0.00 19.0mm 0.00 100.0 0.0
16.0mm 8.43 98.8 1.2
13.2mm 34.78 95.2 4.8
9.5mm 90.26 87.4 12.6
4.75mm 230.11 67.9 32.1
2.36mm 354.83 50.5 49.5
1.18mm 423.96 40.9 59.1
0.600mm 492.40 31.4 68.6
0.300mm 593.99 17.2 82.8
0.150mm 647.61 9.7 90.3
0.075mm 670.17 6.6 93.4
Fractional Components
Cobbles
0.0
Gravel
Coarse
0.0
Fine
32.1
Total
32.1
Sand
Coarse
20.2
Medium
23.5
Fine
17.6
Total
61.3
Fines
Silt Clay Total
6.6
D5 D10
0.1562
D15
0.2602
D20
0.3482
D30
0.5588
D40
1.0915
D50
2.2920
D60
3.5640
D80
7.2136
D85
8.6531
D90
10.5527
D95
13.1106
FinenessModulus
3.95
Cu
22.82
Cc
0.56

McIntosh Perry
GRAIN SIZE DISTRIBUTION TEST DATA 2019-05-31
Client: City of BarrieProject: Dunlop St. Environmental AssessmentProject Number: BM18-8036Location: Dunlop St.Depth: 0.76-1.37 Sample Number: W8-1SS2Material Description: Sand with Gravel trace SiltChecked by: H.Smith
Sieve Test Data
DrySample
and Tare(grams)
Tare(grams)
CumulativePan
Tare Weight(grams)
SieveOpening
Size
CumulativeWeight
Retained(grams)
PercentFiner
PercentRetained
756.21 0.00 0.00 26.5mm 0.00 100.0 0.0
19.0mm 10.43 98.6 1.4
16.0mm 10.43 98.6 1.4
13.2mm 25.69 96.6 3.4
9.5mm 61.82 91.8 8.2
4.75mm 212.69 71.9 28.1
2.36mm 347.64 54.0 46.0
1.18mm 421.80 44.2 55.8
0.600mm 500.81 33.8 66.2
0.300mm 623.73 17.5 82.5
0.150mm 684.78 9.4 90.6
0.075mm 709.37 6.2 93.8
Fractional Components
Cobbles
0.0
Gravel
Coarse
1.4
Fine
26.7
Total
28.1
Sand
Coarse
20.7
Medium
25.7
Fine
19.3
Total
65.7
Fines
Silt Clay Total
6.2
D5 D10
0.1627
D15
0.2595
D20
0.3377
D30
0.5088
D40
0.8551
D50
1.8514
D60
3.1070
D80
6.1246
D85
7.2100
D90
8.7164
D95
11.6499
FinenessModulus
3.79
Cu
19.09
Cc
0.51

McIntosh Perry
GRAIN SIZE DISTRIBUTION TEST DATA 2019-05-31
Client: City of BarrieProject: Dunlop St. Environmental AssessmentProject Number: BM18-8036Location: Dunlop St.Depth: 3.81-4.42 Sample Number: W8-1SS6BMaterial Description: Silt some Clay trace Sand trace GravelUSCS: MLChecked by: H.Smith
Sieve Test Data
DrySample
and Tare(grams)
Tare(grams)
CumulativePan
Tare Weight(grams)
SieveOpening
Size
CumulativeWeight
Retained(grams)
PercentFiner
PercentRetained
535.30 0.00 0.00 9.5mm 0.00 100.0 0.0
4.75mm 0.37 99.9 0.1
2.00mm 0.65 99.9 0.1
72.78 0.00 0.00 0.850mm 0.00 99.9 0.1
0.425mm 0.10 99.7 0.3
0.250mm 0.31 99.5 0.5
0.106mm 2.10 97.0 3.0
0.075mm 2.34 96.7 3.3
Hydrometer Test Data
Hydrometer test uses material passing #10Percent passing #10 based upon complete sample = 99.9Weight of hydrometer sample =72.78Automatic temperature correction Composite correction (fluid density and meniscus height) at 20 deg. C = -5.0Meniscus correction only = -1.0Specific gravity of solids = 2.720Hydrometer type = 152H Hydrometer effective depth equation: L = 16.8007 - 0.186 x Rm
ElapsedTime (min.)
Temp.(deg. C.)
ActualReading
CorrectedReading K Rm
Eff.Depth
Diameter(mm.)
PercentFiner
PercentRetained
1.00 21.7 60.0 55.3 0.0131 59.0 5.8 0.0316 74.8 25.2
2.00 21.7 58.0 53.3 0.0131 57.0 6.2 0.0230 72.1 27.9
5.00 21.7 52.0 47.3 0.0131 51.0 7.3 0.0158 64.0 36.0
15.00 21.7 41.0 36.3 0.0131 40.0 9.4 0.0103 49.1 50.9
30.00 21.7 33.5 28.8 0.0131 32.5 10.8 0.0078 39.0 61.0
60.00 21.7 27.0 22.3 0.0131 26.0 12.0 0.0058 30.2 69.8
250.00 21.7 18.0 13.3 0.0131 17.0 13.6 0.0031 18.0 82.0
1440.00 21.7 12.0 7.3 0.0131 11.0 14.8 0.0013 9.9 90.1

McIntosh Perry
Fractional Components
Cobbles
0.0
Gravel
Coarse
0.0
Fine
0.1
Total
0.1
Sand
Coarse
0.0
Medium
0.2
Fine
3.0
Total
3.2
Fines
Silt
83.3
Clay
13.4
Total
96.7
D5 D10
0.0013
D15
0.0024
D20
0.0035
D30
0.0058
D40
0.0081
D50
0.0106
D60
0.0140
D80
0.0399
D85
0.0470
D90
0.0552
D95
0.0672
FinenessModulus
0.03
Cu
10.44
Cc
1.80
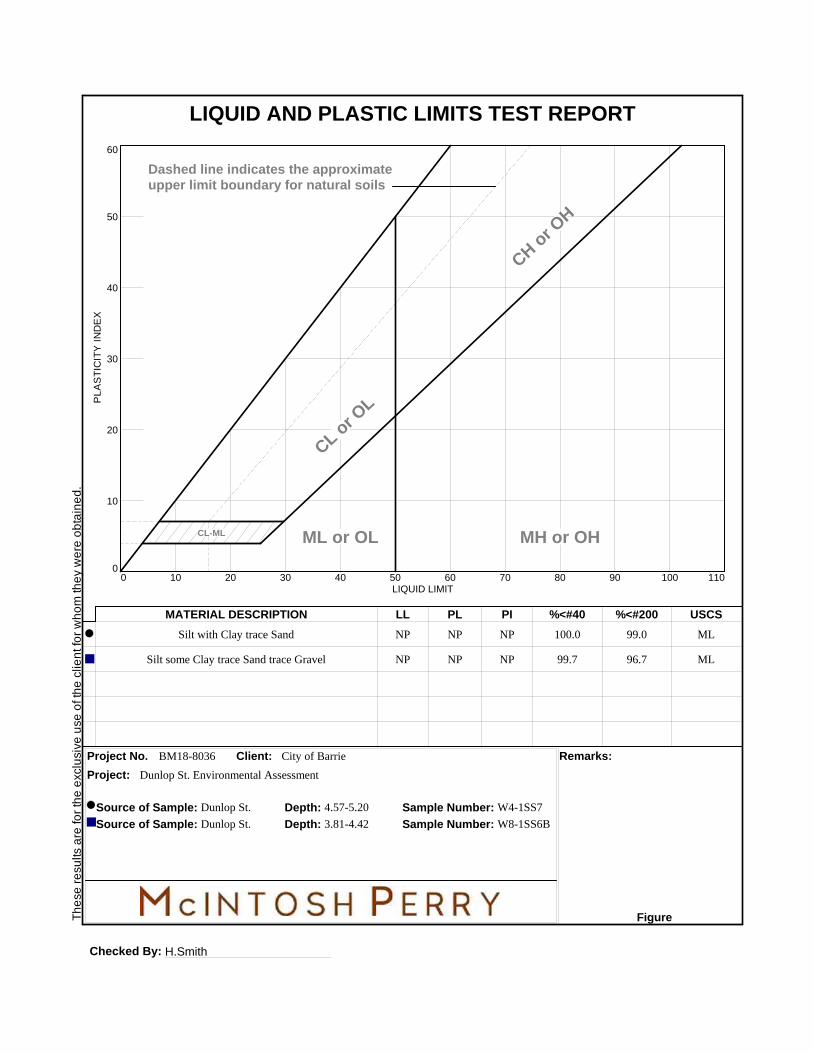
Th
ese
re
su
lts a
re fo
r th
e e
xclu
siv
e u
se
of th
e c
lien
t fo
r w
ho
m th
ey w
ere
ob
tain
ed
.
Checked By: H.Smith
LIQUID AND PLASTIC LIMITS TEST REPORTP
LA
ST
ICIT
Y I
ND
EX
0
10
20
30
40
50
60
LIQUID LIMIT0 10 20 30 40 50 60 70 80 90 100 110
CL-ML
CL or O
L
CH or O
H
ML or OL MH or OH
Dashed line indicates the approximateupper limit boundary for natural soils
4
7
MATERIAL DESCRIPTION LL PL PI %<#40 %<#200 USCS
Project No. Client: Remarks:
Project:
Figure
Source of Sample: Dunlop St. Depth: 4.57-5.20 Sample Number: W4-1SS7
Source of Sample: Dunlop St. Depth: 3.81-4.42 Sample Number: W8-1SS6B
Silt with Clay trace Sand NP NP NP 100.0 99.0 ML
Silt some Clay trace Sand trace Gravel NP NP NP 99.7 96.7 ML
BM18-8036 City of Barrie
Dunlop St. Environmental Assessment
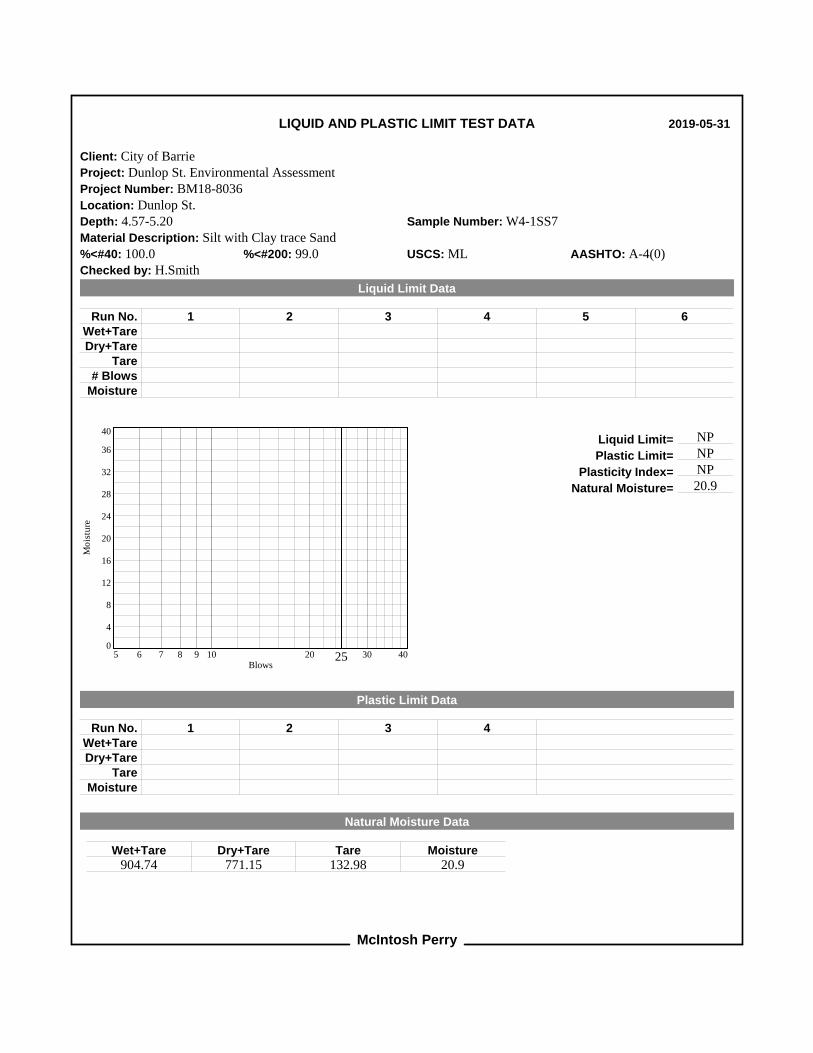
McIntosh Perry
LIQUID AND PLASTIC LIMIT TEST DATA 2019-05-31
Client: City of BarrieProject: Dunlop St. Environmental AssessmentProject Number: BM18-8036Location: Dunlop St.Depth: 4.57-5.20 Sample Number: W4-1SS7Material Description: Silt with Clay trace Sand%<#40: 100.0 %<#200: 99.0 USCS: ML AASHTO: A-4(0)Checked by: H.Smith
Liquid Limit Data
1 2 3 4 5 6Run No.Wet+TareDry+Tare
Tare# Blows
Moisture
Mo
istu
re
0
4
8
12
16
20
24
28
32
36
40
Blows5 6 7 8 9 10 20 25 30 40
Liquid Limit= NP
Plastic Limit= NP
Plasticity Index= NP
Natural Moisture= 20.9
Plastic Limit Data
1 2 3 4Run No.Wet+TareDry+Tare
TareMoisture
Natural Moisture Data
Wet+Tare904.74
Dry+Tare771.15
Tare132.98
Moisture20.9

McIntosh Perry
LIQUID AND PLASTIC LIMIT TEST DATA 2019-05-31
Client: City of BarrieProject: Dunlop St. Environmental AssessmentProject Number: BM18-8036Location: Dunlop St.Depth: 3.81-4.42 Sample Number: W8-1SS6BMaterial Description: Silt some Clay trace Sand trace Gravel%<#40: 99.7 %<#200: 96.7 USCS: ML AASHTO: A-4(0)Checked by: H.Smith
Liquid Limit Data
1 2 3 4 5 6Run No.Wet+TareDry+Tare
Tare# Blows
Moisture
Mo
istu
re
0
4
8
12
16
20
24
28
32
36
40
Blows5 6 7 8 9 10 20 25 30 40
Liquid Limit= NP
Plastic Limit= NP
Plasticity Index= NP
Natural Moisture= 20.1
Plastic Limit Data
1 2 3 4Run No.Wet+TareDry+Tare
TareMoisture
Natural Moisture Data
Wet+Tare771.38
Dry+Tare664.00
Tare128.70
Moisture20.1

DUNLOP STREET MUNICIPAL CLASS EAGEOTECHNICAL REPORT
APPENDIX E: SOIL CHEMICAL TESTING RESULTS
[This report shall not be reproduced except in full without the written authority of the Laboratory.]
14-MAY-19
Lab Work Order #: L2272905
Date Received:Mcintosh Perry Limited (Vaughan)
2010 WINSTON PARK DROAKVILLE ON 46H 5R7
ATTN: Bradley TrinhFINAL 22-MAY-19 13:55 (MT)Report Date:
Version:
Certificate of Analysis
ALS CANADA LTD Part of the ALS Group An ALS Limited Company
____________________________________________
Melanie MoshiAccount Manager
ADDRESS: 95 West Beaver Creek Road, Unit 1, Richmond Hill, ON L4B 1H2 Canada | Phone: +1 905 881 9887 | Fax: +1 905 881 8062
Client Phone: 905-856-5200
0T1-0919169-ENJob Reference: NOT SUBMITTEDProject P.O. #:
17-725700C of C Numbers:DUNLOP STRET WEST BARRIELegal Site Desc:

Result
22-MAY-19 13:55 (MT)Sample DetailsGrouping Analyte D.L. UnitsQualifier Analyzed
Ontario Regulation 153/04 - April 15, 2011 Standards = [Suite] - ON-511-T2-RPI-ICC-C/F-SOIL
L2272905 CONTD....2Page of
0T1-0919169-EN - DUNLOP STRET WEST BARRIEANALYTICAL GUIDELINE REPORT
Analytical result for this parameter exceeds Guideline Limit listed on this report. Guideline Limits applied:
Guideline Limits
#1: T2-Soil-Ind/Com/Commu Property Use (Coarse) #2: T2-Soil-Ind/Com/Commu Property Use (Fine)
#3: T2-Soil-Res/Park/Inst. Property Use (Coarse) #4: T2-Soil-Res/Park/Inst. Property Use (Fine)
* ** Detection Limit for result exceeds Guideline Limit. Assessment against Guideline Limit cannot be made.
7
L2272905-1
L2272905-2
E4-1 SS2
E4-1 SS5
BRADLEY TRINH on 07-MAY-19
BRADLEY TRINH on 07-MAY-19 @
Sampled By:
Sampled By:
SOIL
SOIL
Matrix:
Matrix:
#1
#1
#2
#2
#3
#3
#4
#4
Physical Tests
Cyanides
Saturated Paste Extractables
Metals
Speciated Metals
Physical Tests
Leachable Anions & Nutrients
Conductivity% MoisturepH
Cyanide, Weak Acid Diss
SARCalcium (Ca)Magnesium (Mg)Sodium (Na)
Antimony (Sb)Arsenic (As)Barium (Ba)Beryllium (Be)Boron (B)Boron (B), Hot Water Ext.Cadmium (Cd)Chromium (Cr)Cobalt (Co)Copper (Cu)Lead (Pb)Mercury (Hg)Molybdenum (Mo)Nickel (Ni)Selenium (Se)Silver (Ag)Thallium (Tl)Uranium (U)Vanadium (V)Zinc (Zn)
Chromium, Hexavalent
Conductivity% MoisturepHRedox PotentialResistivity
Chloride
0.3373.847.99
<0.050
4.957.970.5953.8
<1.01.219.9
<0.50<5.00.13
<0.507.82.14.412.8
0.0117<1.04.1
<1.0<0.20<0.50<1.019.918.3
<0.20
1.4012.07.87187716
627
0.00400.100.10
0.050
0.100.500.500.50
1.01.01.00.505.00.100.501.01.01.01.0
0.00501.01.01.00.200.501.01.05.0
0.20
0.00400.100.10
-10001.0
5.0
mS/cm%
pH units
ug/g
SARmg/Lmg/Lmg/L
ug/gug/gug/gug/gug/gug/gug/gug/gug/gug/gug/gug/gug/gug/gug/gug/gug/gug/gug/gug/g
ug/g
mS/cm%
pH unitsmV
ohm*cm
ug/g
21-MAY-1915-MAY-1921-MAY-19
17-MAY-19
21-MAY-1921-MAY-1921-MAY-1921-MAY-19
21-MAY-1921-MAY-1921-MAY-1921-MAY-1921-MAY-1921-MAY-1921-MAY-1921-MAY-1921-MAY-1921-MAY-1921-MAY-1921-MAY-1921-MAY-1921-MAY-1921-MAY-1921-MAY-1921-MAY-1921-MAY-1921-MAY-1921-MAY-19
17-MAY-19
21-MAY-1915-MAY-1921-MAY-1916-MAY-1921-MAY-19
21-MAY-19
1.4 1.4 0.7 0.7
0.051 0.051 0.051 0.051
12 12 5 5
40 50 7.5 7.518 18 18 18670 670 390 3908 10 4 5
120 120 120 1202 2 1.5 1.5
1.9 1.9 1.2 1.2160 160 160 16080 100 22 22230 300 140 180120 120 120 1203.9 20 0.27 1.840 40 6.9 6.9270 340 100 1305.5 5.5 2.4 2.440 50 20 253.3 3.3 1 133 33 23 2386 86 86 86340 340 340 340
8 10 8 10
1.4 1.4 *0.7 *0.7

Result
22-MAY-19 13:55 (MT)Sample DetailsGrouping Analyte D.L. UnitsQualifier Analyzed
Ontario Regulation 153/04 - April 15, 2011 Standards = [Suite] - ON-511-T2-RPI-ICC-C/F-SOIL
L2272905 CONTD....3Page of
0T1-0919169-EN - DUNLOP STRET WEST BARRIEANALYTICAL GUIDELINE REPORT
Analytical result for this parameter exceeds Guideline Limit listed on this report. Guideline Limits applied:
Guideline Limits
#1: T2-Soil-Ind/Com/Commu Property Use (Coarse) #2: T2-Soil-Ind/Com/Commu Property Use (Fine)
#3: T2-Soil-Res/Park/Inst. Property Use (Coarse) #4: T2-Soil-Res/Park/Inst. Property Use (Fine)
* ** Detection Limit for result exceeds Guideline Limit. Assessment against Guideline Limit cannot be made.
7
L2272905-2
L2272905-3
L2272905-4
E4-1 SS5
WS-1 SS3
WS-1 SS6
BRADLEY TRINH on 07-MAY-19 @
BRADLEY TRINH on 09-MAY-19 @
BRADLEY TRINH on 09-MAY-19 @
Sampled By:
Sampled By:
Sampled By:
SOIL
SOIL
SOIL
Matrix:
Matrix:
Matrix:
#1
#1
#1
#2
#2
#2
#3
#3
#3
#4
#4
#4
Anions and Nutrients
Inorganic Parameters
Physical Tests
Cyanides
Saturated Paste Extractables
Metals
Speciated Metals
Sulphate
Acid Volatile Sulphides
Conductivity% MoisturepH
Cyanide, Weak Acid Diss
SARCalcium (Ca)Magnesium (Mg)Sodium (Na)
Antimony (Sb)Arsenic (As)Barium (Ba)Beryllium (Be)Boron (B)Boron (B), Hot Water Ext.Cadmium (Cd)Chromium (Cr)Cobalt (Co)Copper (Cu)Lead (Pb)Mercury (Hg)Molybdenum (Mo)Nickel (Ni)Selenium (Se)Silver (Ag)Thallium (Tl)Uranium (U)Vanadium (V)Zinc (Zn)
Chromium, Hexavalent
36
<0.20
0.68818.67.85
<0.050
13.36.65
<0.50125
<1.0<1.016.5
<0.50<5.0<0.10<0.508.12.14.03.3
<0.0050<1.03.8
<1.0<0.20<0.50<1.021.710.3
<0.20
SAR:M
20
0.20
0.00400.100.10
0.050
0.100.500.500.50
1.01.01.00.505.00.100.501.01.01.01.0
0.00501.01.01.00.200.501.01.05.0
0.20
mg/kg
mg/kg
mS/cm%
pH units
ug/g
SARmg/Lmg/Lmg/L
ug/gug/gug/gug/gug/gug/gug/gug/gug/gug/gug/gug/gug/gug/gug/gug/gug/gug/gug/gug/g
ug/g
16-MAY-19
16-MAY-19
21-MAY-1915-MAY-1921-MAY-19
17-MAY-19
21-MAY-1921-MAY-1921-MAY-1921-MAY-19
21-MAY-1921-MAY-1921-MAY-1921-MAY-1921-MAY-1921-MAY-1921-MAY-1921-MAY-1921-MAY-1921-MAY-1921-MAY-1921-MAY-1921-MAY-1921-MAY-1921-MAY-1921-MAY-1921-MAY-1921-MAY-1921-MAY-1921-MAY-19
17-MAY-19
1.4 1.4 0.7 0.7
0.051 0.051 0.051 0.051
*12 *12 *5 *5
40 50 7.5 7.518 18 18 18670 670 390 3908 10 4 5
120 120 120 1202 2 1.5 1.5
1.9 1.9 1.2 1.2160 160 160 16080 100 22 22230 300 140 180120 120 120 1203.9 20 0.27 1.840 40 6.9 6.9270 340 100 1305.5 5.5 2.4 2.440 50 20 253.3 3.3 1 133 33 23 2386 86 86 86340 340 340 340
8 10 8 10
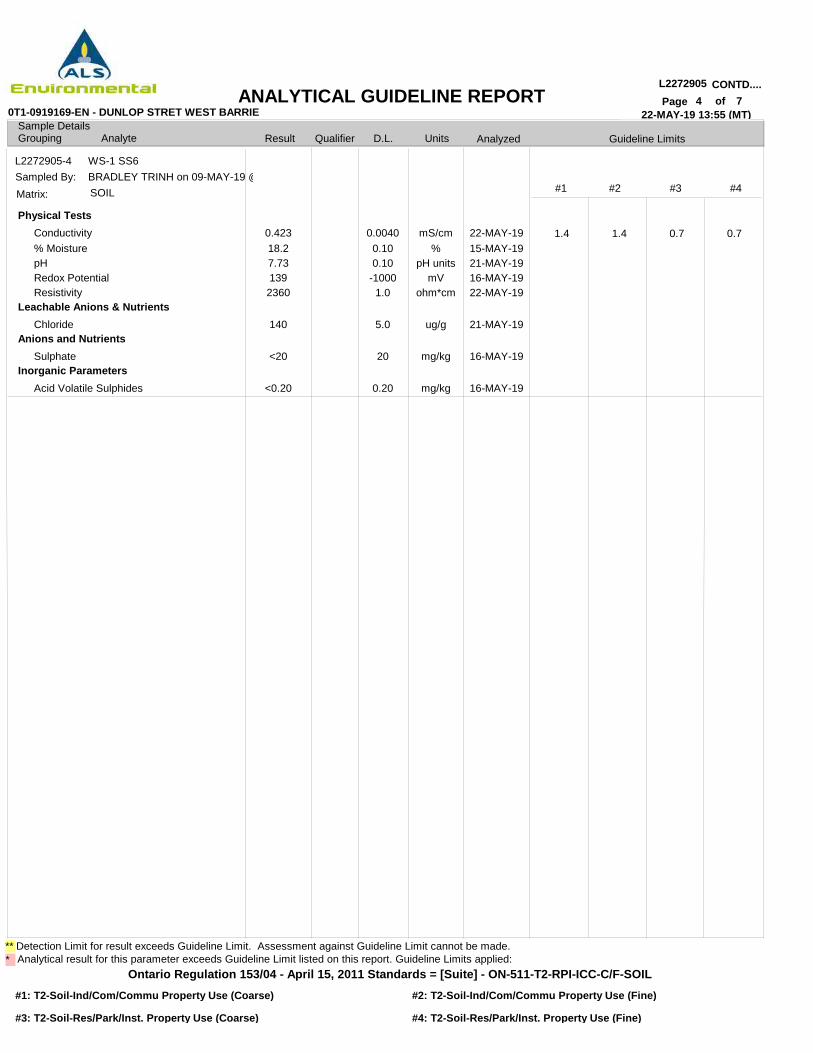
Result
22-MAY-19 13:55 (MT)Sample DetailsGrouping Analyte D.L. UnitsQualifier Analyzed
Ontario Regulation 153/04 - April 15, 2011 Standards = [Suite] - ON-511-T2-RPI-ICC-C/F-SOIL
L2272905 CONTD....4Page of
0T1-0919169-EN - DUNLOP STRET WEST BARRIEANALYTICAL GUIDELINE REPORT
Analytical result for this parameter exceeds Guideline Limit listed on this report. Guideline Limits applied:
Guideline Limits
#1: T2-Soil-Ind/Com/Commu Property Use (Coarse) #2: T2-Soil-Ind/Com/Commu Property Use (Fine)
#3: T2-Soil-Res/Park/Inst. Property Use (Coarse) #4: T2-Soil-Res/Park/Inst. Property Use (Fine)
* ** Detection Limit for result exceeds Guideline Limit. Assessment against Guideline Limit cannot be made.
7
L2272905-4 WS-1 SS6BRADLEY TRINH on 09-MAY-19 @Sampled By:SOILMatrix: #1 #2 #3 #4
Physical Tests
Leachable Anions & Nutrients
Anions and Nutrients
Inorganic Parameters
Conductivity% MoisturepHRedox PotentialResistivity
Chloride
Sulphate
Acid Volatile Sulphides
0.42318.27.731392360
140
<20
<0.20
0.00400.100.10
-10001.0
5.0
20
0.20
mS/cm%
pH unitsmV
ohm*cm
ug/g
mg/kg
mg/kg
22-MAY-1915-MAY-1921-MAY-1916-MAY-1922-MAY-19
21-MAY-19
16-MAY-19
16-MAY-19
1.4 1.4 0.7 0.7

Reference Information
0T1-0919169-EN - DUNLOP STRET WEST BARRIE L2272905 CONTD....5Page of
22-MAY-19 13:55 (MT)
B-HWS-R511-WT
CL-R511-WT
CN-WAD-R511-WT
CR-CR6-IC-WT
EC-WT
HG-200.2-CVAA-WT
MET-200.2-CCMS-WT
MOISTURE-WT
Boron-HWE-O.Reg 153/04 (July2011)
Chloride-O.Reg 153/04 (July 2011)
Cyanide (WAD)-O.Reg 153/04 (July 2011)
Hexavalent Chromium in Soil
Conductivity (EC)
Mercury in Soil by CVAAS
Metals in Soil by CRC ICPMS
% Moisture
A dried solid sample is extracted with calcium chloride, the sample undergoes a heating process. After cooling the sample is filtered and analyzed by ICP/OES.
Analysis conducted in accordance with the Protocol for Analytical Methods Used in the Assessment of Properties under Part XV.1 of the Environmental Protection Act (July 1, 2011).
5 grams of dried soil is mixed with 10 grams of distilled water for a minimum of 30 minutes. The extract is filtered and analyzed by ion chromatography.
Analysis conducted in accordance with the Protocol for Analytical Methods Used in the Assessment of Properties under Part XV.1 of the Environmental Protection Act (July 1, 2011).
The sample is extracted with a strong base for 16 hours, and then filtered. The filtrate is then distilled where the cyanide is converted to cyanogen chloride by reacting with chloramine-T, the cyanogen chloride then reacts with a combination of barbituric acid and isonicotinic acid to form a highly colored complex.
Analysis conducted in accordance with the Protocol for Analytical Methods Used in the Assessment of Properties under Part XV.1 of the Environmental Protection Act (July 1, 2011).
This analysis is carried out using procedures adapted from "Test Methods for Evaluating Solid Waste" SW-846, Method 7199, published by the United States Environmental Protection Agency (EPA). The procedure involves analysis for chromium (VI) by ion chromatography using diphenylcarbazide in asulphuric acid solution.
Analysis conducted in accordance with the Protocol for Analytical Methods Used in the Assessment of Properties under Part XV.1 of the Environmental Protection Act (July 1, 2011).
A representative subsample is tumbled with de-ionized (DI) water. The ratio of water to soil is 2:1 v/w. After tumbling the sample is then analyzed by a conductivity meter.
Analysis conducted in accordance with the Protocol for Analytical Methods Used in the Assessment of Properties under Part XV.1 of the Environmental Protection Act (July 1, 2011).
Soil samples are digested with nitric and hydrochloric acids, followed by analysis by CVAAS.
Analysis conducted in accordance with the Protocol for Analytical Methods Used in the Assessment of Properties under Part XV.1 of the Environmental Protection Act (July 1, 2011).
Soil/sediment is dried, disaggregated, and sieved (2 mm). For tests intended to support Ontario regulations, the <2mm fraction is ground to pass through a 0.355 mm sieve. Strong Acid Leachable Metals in the <2mm fraction are solubilized by heated digestion with nitric and hydrochloric acids. Instrumental analysis is by Collision / Reaction Cell ICPMS.
Limitations: This method is intended to liberate environmentally available metals. Silicate minerals are not solubilized. Some metals may be only partially recovered (matrix dependent), including Al, Ba, Be, Cr, S, Sr, Ti, Tl, V, W, and Zr. Elemental Sulfur may be poorly recovered by this method. Volatile forms of sulfur (e.g. sulfide, H2S) may be excluded if lost during sampling, storage, or digestion.
Analysis conducted in accordance with the Protocol for Analytical Methods Used in the Assessment of Properties under Part XV.1 of the Environmental Protection Act (July 1, 2011), unless a subset of the Analytical Test Group (ATG) has been requested (the Protocol states that all analytes in an ATG must be reported).
Methods Listed (if applicable):
ALS Test Code Test Description
Soil
Soil
Soil
Soil
Soil
Soil
Soil
Soil
SAR:M Reported SAR represents a maximum value. Actual SAR may be lower if both Ca and Mg were detectable.
Sample Parameter Qualifier key listed:
HW EXTR, EPA 6010B
EPA 300.0
MOE 3015/APHA 4500CN I-WAD
SW846 3060A/7199
MOEE E3138
EPA 200.2/1631E (mod)
EPA 200.2/6020A (mod)
CCME PHC in Soil - Tier 1 (mod)
Method Reference***
Description Qualifier
Matrix
7

Reference Information
0T1-0919169-EN - DUNLOP STRET WEST BARRIE L2272905 CONTD....6Page of
22-MAY-19 13:55 (MT)
PH-WT
REDOX-POTENTIAL-WT
RESISTIVITY-CALC-WT
RESISTIVITY-CALC-WT
SAR-R511-WT
SO4-WT
SULPHIDE-WT
pH
Redox Potential
Resistivity Calculation
Resistivity Calculation
SAR-O.Reg 153/04 (July 2011)
Sulphate
Sulphide, Acid Volatile
A minimum 10g portion of the sample is extracted with 20mL of 0.01M calcium chloride solution by shaking for at least 30 minutes. The aqueous layer isseparated from the soil and then analyzed using a pH meter and electrode.
Analysis conducted in accordance with the Protocol for Analytical Methods Used in the Assessment of Properties under Part XV.1 of the Environmental Protection Act (July 1, 2011).
This analysis is carried out in accordance with the procedure described in the "APHA" method 2580 "Oxidation-Reduction Potential" 2012. Samples are extracted at a fixed ratio with DI water. Results are reported as observed oxidation-reduction potential of the platinum metal-reference electrode employed, in mV.
Resistivity are calculated based on the conductivity using APHA 2510B where Conductivity is the inverse of Resistivity.
Resistivity are calculated based on the conductivity using APHA 2510B where Conductivity is the inverse of Resistivity.
A dried, disaggregated solid sample is extracted with deionized water, the aqueous extract is separated from the solid, acidified and then analyzed usinga ICP/OES. The concentrations of Na, Ca and Mg are reported as per CALA requirements for calculated parameters. These individual parameters are not for comparison to any guideline.
Analysis conducted in accordance with the Protocol for Analytical Methods Used in the Assessment of Properties under Part XV.1 of the Environmental Protection Act (July 1, 2011).
5 grams of soil is mixed with 50 mL of distilled water for a minimum of 30 minutes. The extract is filtered and analyzed by ion chromatography.
This analysis is carried out in accordance with the method described in APHA 4500 S2-J. Hydrochloric acid is added to sediment samples within a purge and trap system. The evolved hydrogen sulphide (H2S) is carried into a basic solution by inert gas. The acid volatile sulfide is then determined colourimetrically.
Soil
Soil
Soil
Soil
Soil
Soil
Soil
MOEE E3137A
APHA 2580
APHA 2510 B
MOECC E3138
SW846 6010C
EPA 300.0
APHA 4500S2J
*** ALS test methods may incorporate modifications from specified reference methods to improve performance.
The last two letters of the above test code(s) indicate the laboratory that performed analytical analysis for that test. Refer to the list below:
Chain of Custody numbers:
17-725700
Laboratory Definition Code Laboratory Location Laboratory Definition Code Laboratory Location
WT ALS ENVIRONMENTAL - WATERLOO, ONTARIO, CANADA
7

Reference Information
0T1-0919169-EN - DUNLOP STRET WEST BARRIE L2272905 CONTD....7Page of
22-MAY-19 13:55 (MT)
GLOSSARY OF REPORT TERMS
Surrogates are compounds that are similar in behaviour to target analyte(s), but that do not normally occur in environmental samples. For applicable tests, surrogates are added to samples prior to analysis as a check on recovery. In reports that display the D.L. column, laboratory objectives for surrogates are listed there.mg/kg - milligrams per kilogram based on dry weight of samplemg/kg wwt - milligrams per kilogram based on wet weight of samplemg/kg lwt - milligrams per kilogram based on lipid-adjusted weight mg/L - unit of concentration based on volume, parts per million.< - Less than.D.L. - The reporting limit.N/A - Result not available. Refer to qualifier code and definition for explanation.
Test results reported relate only to the samples as received by the laboratory.UNLESS OTHERWISE STATED, ALL SAMPLES WERE RECEIVED IN ACCEPTABLE CONDITION.Analytical results in unsigned test reports with the DRAFT watermark are subject to change, pending final QC review.
Application of guidelines is provided "as is" without warranty of any kind, either expressed or implied, including, but not limited to, fitness for a particular purpose, or non-infringement. ALS assumes no responsibility for errors or omissions in the information. Guideline limits are not adjusted for the hardness, pH or temperature of the sample (the most conservative values are used). Measurement uncertainty is not applied to test results prior to comparison with specified criteria values.
7
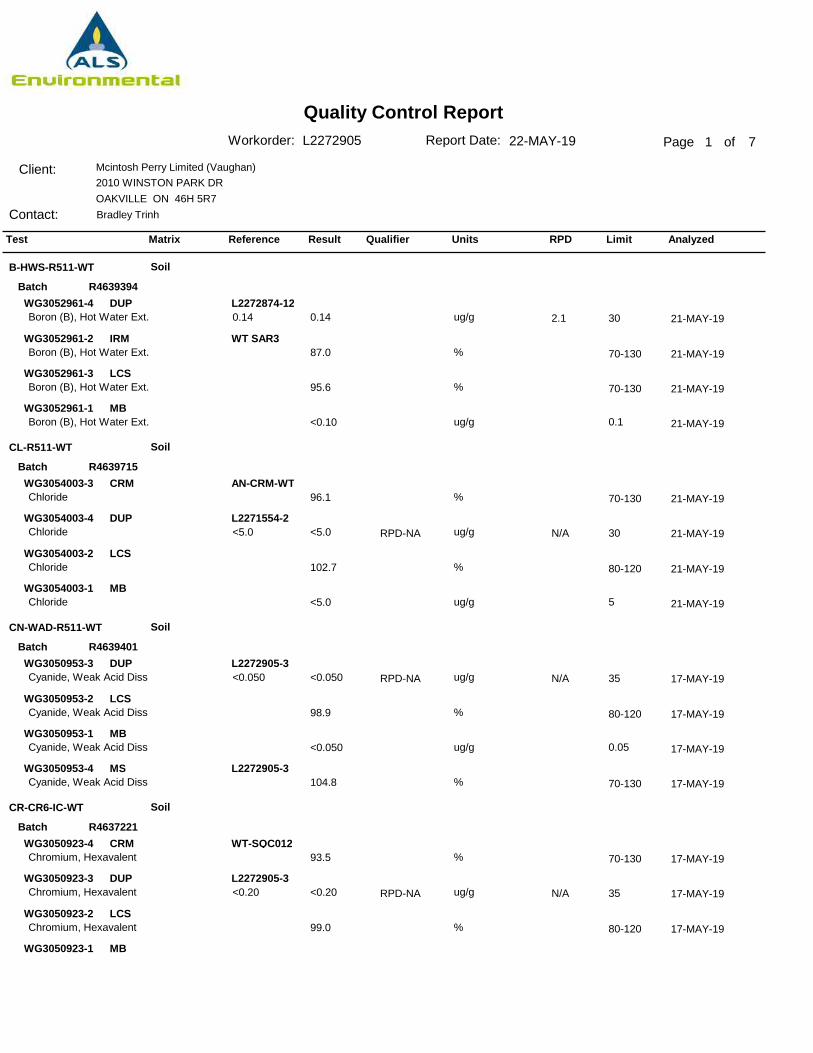
Quality Control ReportPage 1 of
Client:
Contact:
Mcintosh Perry Limited (Vaughan)2010 WINSTON PARK DR OAKVILLE ON 46H 5R7Bradley Trinh
Report Date: 22-MAY-19Workorder: L2272905
Test Matrix Reference Result Qualifier Units RPD Limit Analyzed
B-HWS-R511-WT
CL-R511-WT
CN-WAD-R511-WT
CR-CR6-IC-WT
Soil
Soil
Soil
Soil
R4639394
R4639715
R4639401
R4637221
Batch
Batch
Batch
Batch
DUP
IRM
LCS
MB
CRM
DUP
LCS
MB
DUP
LCS
MB
MS
CRM
DUP
LCS
MB
WG3052961-4
WG3052961-2
WG3052961-3
WG3052961-1
WG3054003-3
WG3054003-4
WG3054003-2
WG3054003-1
WG3050953-3
WG3050953-2
WG3050953-1
WG3050953-4
WG3050923-4
WG3050923-3
WG3050923-2
WG3050923-1
L2272874-12
WT SAR3
AN-CRM-WT
L2271554-2
L2272905-3
L2272905-3
WT-SQC012
L2272905-3
Boron (B), Hot Water Ext.
Boron (B), Hot Water Ext.
Boron (B), Hot Water Ext.
Boron (B), Hot Water Ext.
Chloride
Chloride
Chloride
Chloride
Cyanide, Weak Acid Diss
Cyanide, Weak Acid Diss
Cyanide, Weak Acid Diss
Cyanide, Weak Acid Diss
Chromium, Hexavalent
Chromium, Hexavalent
Chromium, Hexavalent
0.14
87.0
95.6
<0.10
96.1
<5.0
102.7
<5.0
<0.050
98.9
<0.050
104.8
93.5
<0.20
99.0
21-MAY-19
21-MAY-19
21-MAY-19
21-MAY-19
21-MAY-19
21-MAY-19
21-MAY-19
21-MAY-19
17-MAY-19
17-MAY-19
17-MAY-19
17-MAY-19
17-MAY-19
17-MAY-19
17-MAY-19
2.1
N/A
N/A
N/A
30
30
35
35
70-130
70-130
70-130
80-120
80-120
70-130
70-130
80-120
ug/g
%
%
ug/g
%
ug/g
%
ug/g
ug/g
%
ug/g
%
%
ug/g
%
0.14
<5.0
<0.050
<0.20
0.1
5
0.05
RPD-NA
RPD-NA
RPD-NA
7
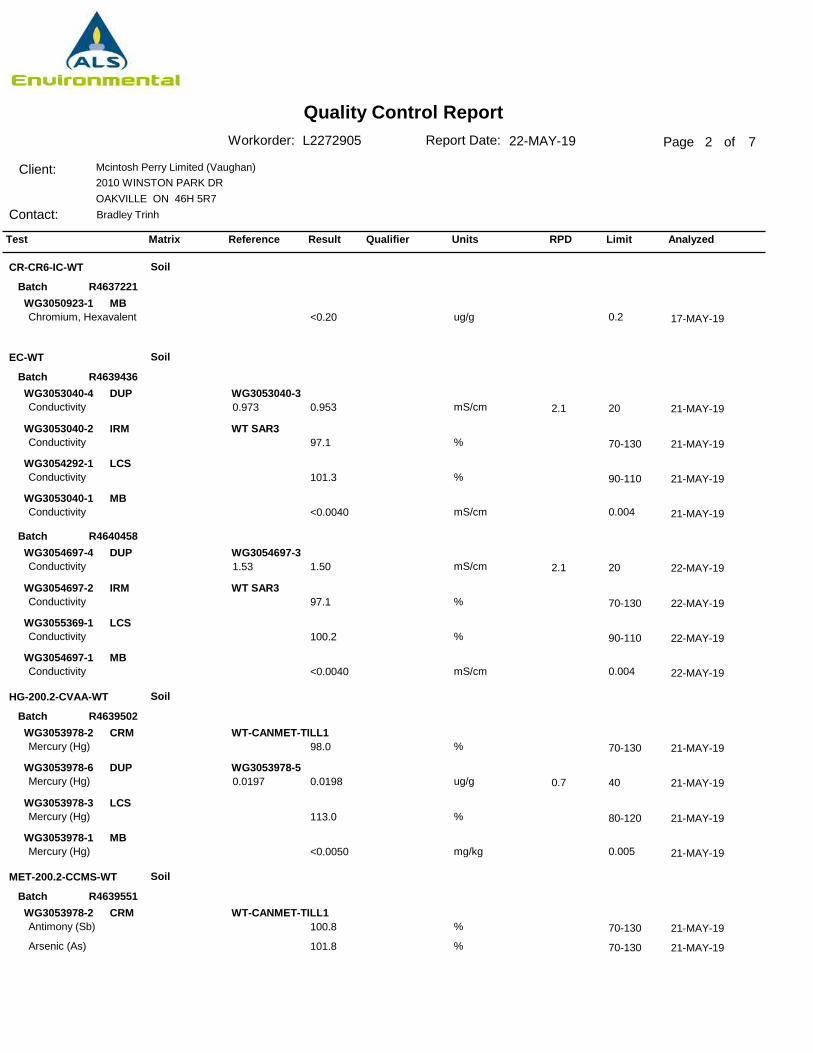
Quality Control ReportPage 2 of
Client:
Contact:
Mcintosh Perry Limited (Vaughan)2010 WINSTON PARK DR OAKVILLE ON 46H 5R7Bradley Trinh
Report Date: 22-MAY-19Workorder: L2272905
Test Matrix Reference Result Qualifier Units RPD Limit Analyzed
CR-CR6-IC-WT
EC-WT
HG-200.2-CVAA-WT
MET-200.2-CCMS-WT
Soil
Soil
Soil
Soil
R4637221
R4639436
R4640458
R4639502
R4639551
Batch
Batch
Batch
Batch
Batch
MB
DUP
IRM
LCS
MB
DUP
IRM
LCS
MB
CRM
DUP
LCS
MB
CRM
WG3050923-1
WG3053040-4
WG3053040-2
WG3054292-1
WG3053040-1
WG3054697-4
WG3054697-2
WG3055369-1
WG3054697-1
WG3053978-2
WG3053978-6
WG3053978-3
WG3053978-1
WG3053978-2
WG3053040-3
WT SAR3
WG3054697-3
WT SAR3
WT-CANMET-TILL1
WG3053978-5
WT-CANMET-TILL1
Chromium, Hexavalent
Conductivity
Conductivity
Conductivity
Conductivity
Conductivity
Conductivity
Conductivity
Conductivity
Mercury (Hg)
Mercury (Hg)
Mercury (Hg)
Mercury (Hg)
Antimony (Sb)
Arsenic (As)
<0.20
0.953
97.1
101.3
<0.0040
1.50
97.1
100.2
<0.0040
98.0
0.0198
113.0
<0.0050
100.8
101.8
17-MAY-19
21-MAY-19
21-MAY-19
21-MAY-19
21-MAY-19
22-MAY-19
22-MAY-19
22-MAY-19
22-MAY-19
21-MAY-19
21-MAY-19
21-MAY-19
21-MAY-19
21-MAY-19
21-MAY-19
2.1
2.1
0.7
20
20
40
70-130
90-110
70-130
90-110
70-130
80-120
70-130
70-130
ug/g
mS/cm
%
%
mS/cm
mS/cm
%
%
mS/cm
%
ug/g
%
mg/kg
%
%
0.973
1.53
0.0197
0.2
0.004
0.004
0.005
7
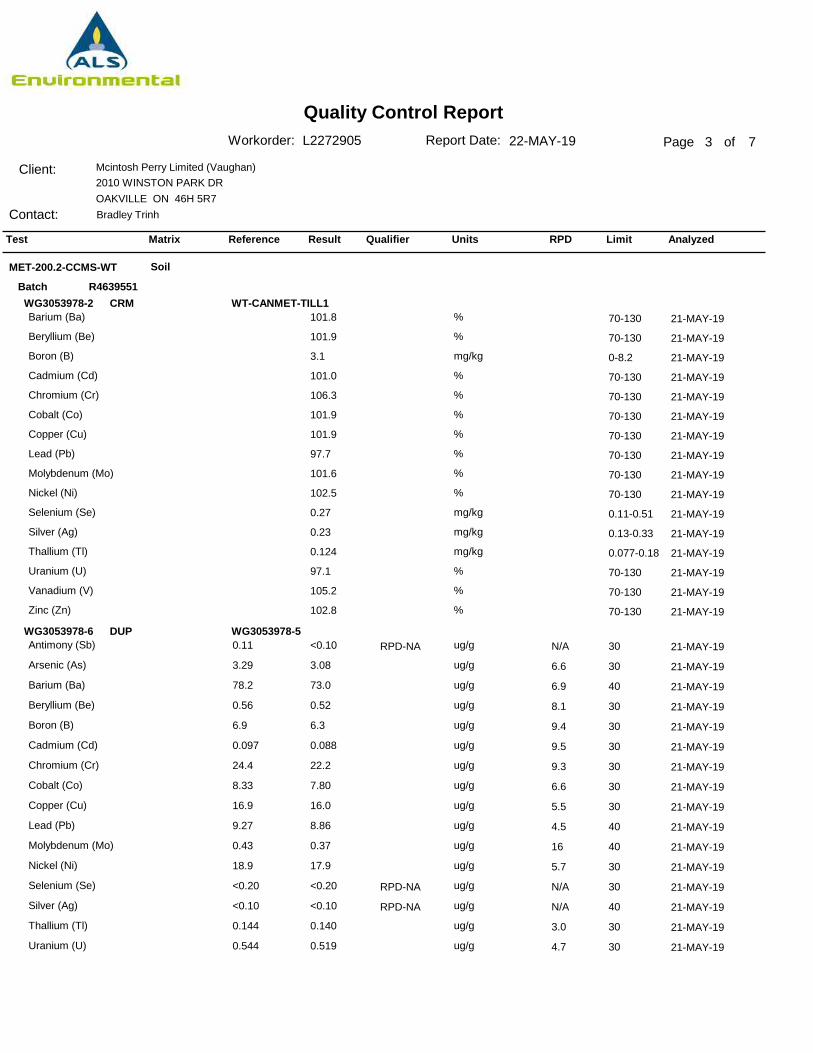
Quality Control ReportPage 3 of
Client:
Contact:
Mcintosh Perry Limited (Vaughan)2010 WINSTON PARK DR OAKVILLE ON 46H 5R7Bradley Trinh
Report Date: 22-MAY-19Workorder: L2272905
Test Matrix Reference Result Qualifier Units RPD Limit Analyzed
MET-200.2-CCMS-WT Soil
R4639551BatchCRM
DUP
WG3053978-2
WG3053978-6
WT-CANMET-TILL1
WG3053978-5
Barium (Ba)
Beryllium (Be)
Boron (B)
Cadmium (Cd)
Chromium (Cr)
Cobalt (Co)
Copper (Cu)
Lead (Pb)
Molybdenum (Mo)
Nickel (Ni)
Selenium (Se)
Silver (Ag)
Thallium (Tl)
Uranium (U)
Vanadium (V)
Zinc (Zn)
Antimony (Sb)
Arsenic (As)
Barium (Ba)
Beryllium (Be)
Boron (B)
Cadmium (Cd)
Chromium (Cr)
Cobalt (Co)
Copper (Cu)
Lead (Pb)
Molybdenum (Mo)
Nickel (Ni)
Selenium (Se)
Silver (Ag)
Thallium (Tl)
Uranium (U)
101.8
101.9
3.1
101.0
106.3
101.9
101.9
97.7
101.6
102.5
0.27
0.23
0.124
97.1
105.2
102.8
<0.10
3.08
73.0
0.52
6.3
0.088
22.2
7.80
16.0
8.86
0.37
17.9
<0.20
<0.10
0.140
0.519
21-MAY-19
21-MAY-19
21-MAY-19
21-MAY-19
21-MAY-19
21-MAY-19
21-MAY-19
21-MAY-19
21-MAY-19
21-MAY-19
21-MAY-19
21-MAY-19
21-MAY-19
21-MAY-19
21-MAY-19
21-MAY-19
21-MAY-19
21-MAY-19
21-MAY-19
21-MAY-19
21-MAY-19
21-MAY-19
21-MAY-19
21-MAY-19
21-MAY-19
21-MAY-19
21-MAY-19
21-MAY-19
21-MAY-19
21-MAY-19
21-MAY-19
21-MAY-19
N/A
6.6
6.9
8.1
9.4
9.5
9.3
6.6
5.5
4.5
16
5.7
N/A
N/A
3.0
4.7
30
30
40
30
30
30
30
30
30
40
40
30
30
40
30
30
70-130
70-130
0-8.2
70-130
70-130
70-130
70-130
70-130
70-130
70-130
0.11-0.51
0.13-0.33
0.077-0.18
70-130
70-130
70-130
%
%
mg/kg
%
%
%
%
%
%
%
mg/kg
mg/kg
mg/kg
%
%
%
ug/g
ug/g
ug/g
ug/g
ug/g
ug/g
ug/g
ug/g
ug/g
ug/g
ug/g
ug/g
ug/g
ug/g
ug/g
ug/g
0.11
3.29
78.2
0.56
6.9
0.097
24.4
8.33
16.9
9.27
0.43
18.9
<0.20
<0.10
0.144
0.544
RPD-NA
RPD-NA
RPD-NA
7

Quality Control ReportPage 4 of
Client:
Contact:
Mcintosh Perry Limited (Vaughan)2010 WINSTON PARK DR OAKVILLE ON 46H 5R7Bradley Trinh
Report Date: 22-MAY-19Workorder: L2272905
Test Matrix Reference Result Qualifier Units RPD Limit Analyzed
MET-200.2-CCMS-WT Soil
R4639551BatchDUP
LCS
MB
WG3053978-6
WG3053978-4
WG3053978-1
WG3053978-5Vanadium (V)
Zinc (Zn)
Antimony (Sb)
Arsenic (As)
Barium (Ba)
Beryllium (Be)
Boron (B)
Cadmium (Cd)
Chromium (Cr)
Cobalt (Co)
Copper (Cu)
Lead (Pb)
Molybdenum (Mo)
Nickel (Ni)
Selenium (Se)
Silver (Ag)
Thallium (Tl)
Uranium (U)
Vanadium (V)
Zinc (Zn)
Antimony (Sb)
Arsenic (As)
Barium (Ba)
Beryllium (Be)
Boron (B)
Cadmium (Cd)
Chromium (Cr)
Cobalt (Co)
Copper (Cu)
Lead (Pb)
Molybdenum (Mo)
Nickel (Ni)
32.6
39.8
105.3
100.5
102.7
97.6
93.1
98.3
100.1
98.7
96.4
98.8
99.0
98.7
99.2
99.7
98.4
98.4
102.6
97.8
<0.10
<0.10
<0.50
<0.10
<5.0
<0.020
<0.50
<0.10
<0.50
<0.50
<0.10
<0.50
21-MAY-19
21-MAY-19
21-MAY-19
21-MAY-19
21-MAY-19
21-MAY-19
21-MAY-19
21-MAY-19
21-MAY-19
21-MAY-19
21-MAY-19
21-MAY-19
21-MAY-19
21-MAY-19
21-MAY-19
21-MAY-19
21-MAY-19
21-MAY-19
21-MAY-19
21-MAY-19
21-MAY-19
21-MAY-19
21-MAY-19
21-MAY-19
21-MAY-19
21-MAY-19
21-MAY-19
21-MAY-19
21-MAY-19
21-MAY-19
21-MAY-19
21-MAY-19
6.7
5.3
30
30
80-120
80-120
80-120
80-120
80-120
80-120
80-120
80-120
80-120
80-120
80-120
80-120
80-120
80-120
80-120
80-120
80-120
80-120
ug/g
ug/g
%
%
%
%
%
%
%
%
%
%
%
%
%
%
%
%
%
%
mg/kg
mg/kg
mg/kg
mg/kg
mg/kg
mg/kg
mg/kg
mg/kg
mg/kg
mg/kg
mg/kg
mg/kg
34.8
42.0
0.1
0.1
0.5
0.1
5
0.02
0.5
0.1
0.5
0.5
0.1
0.5
7
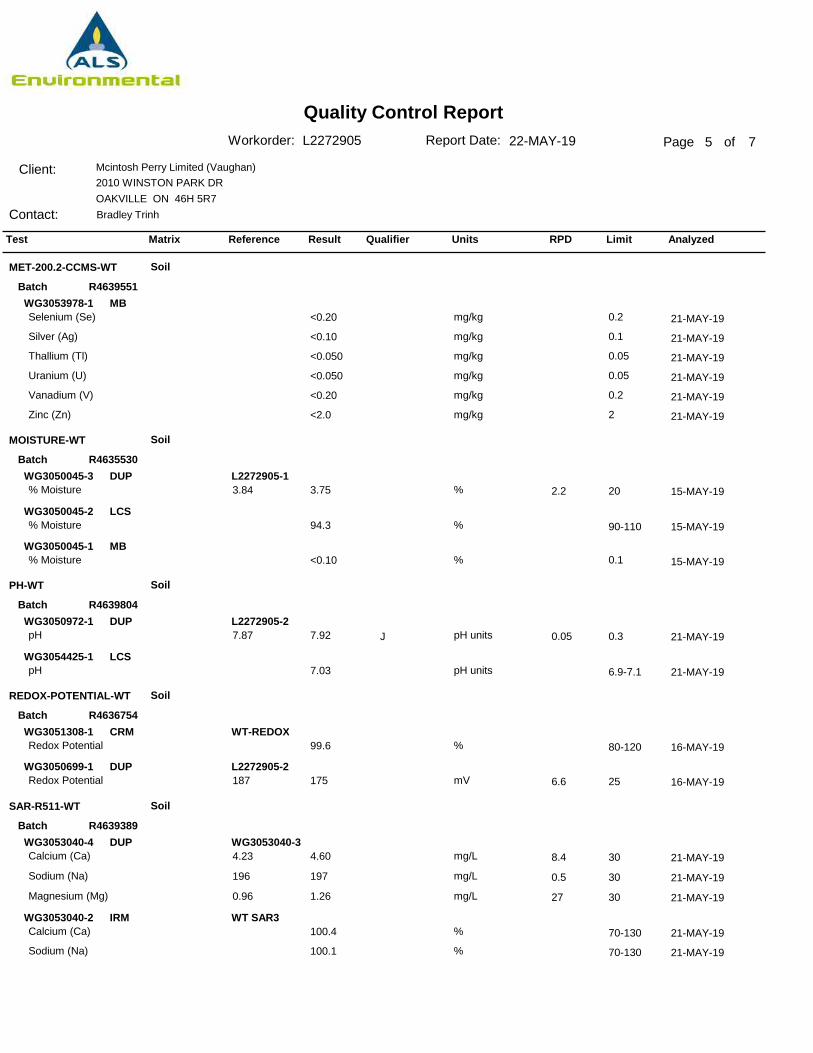
Quality Control ReportPage 5 of
Client:
Contact:
Mcintosh Perry Limited (Vaughan)2010 WINSTON PARK DR OAKVILLE ON 46H 5R7Bradley Trinh
Report Date: 22-MAY-19Workorder: L2272905
Test Matrix Reference Result Qualifier Units RPD Limit Analyzed
MET-200.2-CCMS-WT
MOISTURE-WT
PH-WT
REDOX-POTENTIAL-WT
SAR-R511-WT
Soil
Soil
Soil
Soil
Soil
R4639551
R4635530
R4639804
R4636754
R4639389
Batch
Batch
Batch
Batch
Batch
MB
DUP
LCS
MB
DUP
LCS
CRM
DUP
DUP
IRM
WG3053978-1
WG3050045-3
WG3050045-2
WG3050045-1
WG3050972-1
WG3054425-1
WG3051308-1
WG3050699-1
WG3053040-4
WG3053040-2
L2272905-1
L2272905-2
WT-REDOX
L2272905-2
WG3053040-3
WT SAR3
Selenium (Se)
Silver (Ag)
Thallium (Tl)
Uranium (U)
Vanadium (V)
Zinc (Zn)
% Moisture
% Moisture
% Moisture
pH
pH
Redox Potential
Redox Potential
Calcium (Ca)
Sodium (Na)
Magnesium (Mg)
Calcium (Ca)
Sodium (Na)
<0.20
<0.10
<0.050
<0.050
<0.20
<2.0
3.75
94.3
<0.10
7.92
7.03
99.6
175
4.60
197
1.26
100.4
100.1
21-MAY-19
21-MAY-19
21-MAY-19
21-MAY-19
21-MAY-19
21-MAY-19
15-MAY-19
15-MAY-19
15-MAY-19
21-MAY-19
21-MAY-19
16-MAY-19
16-MAY-19
21-MAY-19
21-MAY-19
21-MAY-19
21-MAY-19
21-MAY-19
2.2
0.05
6.6
8.4
0.5
27
20
0.3
25
30
30
30
90-110
6.9-7.1
80-120
70-130
70-130
mg/kg
mg/kg
mg/kg
mg/kg
mg/kg
mg/kg
%
%
%
pH units
pH units
%
mV
mg/L
mg/L
mg/L
%
%
3.84
7.87
187
4.23
196
0.96
0.2
0.1
0.05
0.05
0.2
2
0.1
J
7

Quality Control ReportPage 6 of
Client:
Contact:
Mcintosh Perry Limited (Vaughan)2010 WINSTON PARK DR OAKVILLE ON 46H 5R7Bradley Trinh
Report Date: 22-MAY-19Workorder: L2272905
Test Matrix Reference Result Qualifier Units RPD Limit Analyzed
SAR-R511-WT
SO4-WT
SULPHIDE-WT
Soil
Soil
Soil
R4639389
R4637087
R4636594
Batch
Batch
Batch
IRM
LCS
MB
CRM
DUP
LCS
MB
DUP
LCS
MB
WG3053040-2
WG3053040-5
WG3053040-1
WG3050546-4
WG3050546-3
WG3050546-2
WG3050546-1
WG3051330-3
WG3051330-2
WG3051330-1
WT SAR3
AN-CRM-WT
L2272905-2
L2271619-5
Magnesium (Mg)
Calcium (Ca)
Sodium (Na)
Magnesium (Mg)
Calcium (Ca)
Sodium (Na)
Magnesium (Mg)
Sulphate
Sulphate
Sulphate
Sulphate
Acid Volatile Sulphides
Acid Volatile Sulphides
Acid Volatile Sulphides
102.7
101.7
101.4
100.6
<0.50
<0.50
<0.50
115.4
35
102.4
<20
<0.20
74.8
<0.20
21-MAY-19
21-MAY-19
21-MAY-19
21-MAY-19
21-MAY-19
21-MAY-19
21-MAY-19
16-MAY-19
16-MAY-19
16-MAY-19
16-MAY-19
16-MAY-19
16-MAY-19
16-MAY-19
1.6
N/A
30
30
70-130
70-130
70-130
70-130
60-140
80-120
70-130
%
%
%
%
mg/L
mg/L
mg/L
%
mg/kg
%
mg/kg
mg/kg
%
mg/kg
36
<0.20
0.5
0.5
0.5
20
0.2
RPD-NA
7

Quality Control Report
Page 7 of
Report Date: 22-MAY-19Workorder: L2272905
Sample Parameter Qualifier Definitions:
Description Qualifier
J
RPD-NA
Duplicate results and limits are expressed in terms of absolute difference.
Relative Percent Difference Not Available due to result(s) being less than detection limit.
Limit ALS Control Limit (Data Quality Objectives)DUP DuplicateRPD Relative Percent DifferenceN/A Not AvailableLCS Laboratory Control SampleSRM Standard Reference MaterialMS Matrix SpikeMSD Matrix Spike DuplicateADE Average Desorption EfficiencyMB Method BlankIRM Internal Reference MaterialCRM Certified Reference MaterialCCV Continuing Calibration VerificationCVS Calibration Verification StandardLCSD Laboratory Control Sample Duplicate
Legend:
The ALS Quality Control Report is provided to ALS clients upon request. ALS includes comprehensive QC checks with every analysis to ensure our high standards of quality are met. Each QC result has a known or expected target value, which is compared against pre-determined data quality objectives to provide confidence in the accuracy of associated test results.
Please note that this report may contain QC results from anonymous Sample Duplicates and Matrix Spikes that do not originate from this Work Order.
Hold Time Exceedances:
All test results reported with this submission were conducted within ALS recommended hold times.
ALS recommended hold times may vary by province. They are assigned to meet known provincial and/or federal government requirements. In the absence of regulatory hold times, ALS establishes recommendations based on guidelines published by the US EPA, APHA Standard Methods, or Environment Canada (where available). For more information, please contact ALS.
Client:
Contact:
Mcintosh Perry Limited (Vaughan)2010 WINSTON PARK DR OAKVILLE ON 46H 5R7Bradley Trinh
7

0BM
18-
8036
Dun
lop
Stre
etO
.Reg
153
Met
als a
nd In
orga
nics
Tes
ting
Resu
lts co
mpa
red
to:
Full
Dept
h Ge
neric
Site
Con
ditio
n So
il St
anda
rds i
n Po
tabl
e (T
able
2) a
nd N
on-P
otab
le (T
able
3) G
roun
dwat
er C
ondi
tions
Cont
amin
ant
Uni
tsE4
-1 S
S2W
5-1
SS3
Res/
Park
CCI
Res/
Park
CCI
Antim
ony
µg/g
01
7.5
(50)
40
7.5
(50)
40
Arse
nic
µg/g
1.2
118
1818
18Ba
rium
µg/g
19.9
16.5
390
670
390
670
Bery
llium
µg/g
00.
5(5
) 4(1
0) 8
(5) 4
(10)
8Bo
ron
(tota
l)µg
/g5
512
012
012
012
0C
adm
ium
µg/g
00.
51.
21.
91.
21.
9C
hrom
ium
Tota
lµg
/g7.
88.
116
016
016
016
0C
obal
tµg
/g2.
12.
122
(100
) 80
22(1
00) 8
0C
oppe
rµg
/g4.
44
(180
) 140
(300
) 230
(180
) 140
(300
) 230
Lead
µg/g
12.8
3.3
120
120
120
120
Mer
cury
µg/g
0.01
170.
005
(1.8
) 0.2
7(2
0) 3
.9(1
.8) 0
.27
(20)
3.9
Mol
ybde
num
µg/g
01
6.9
406.
940
Nic
kel
µg/g
4.1
3.8
(130
) 100
(340
) 270
(130
) 100
(340
) 270
Sele
nium
µg/g
01
2.4
5.5
2.4
5.5
Silv
erµg
/g0
0.2
(25)
20
(50)
40
(25)
20
(50)
40
Thal
lium
µg/g
0.5
0.5
13.
31
3.3
Ura
nium
µg/g
11
2333
2333
Vana
dium
µg/g
19.9
21.7
8686
8686
Zinc
µg/g
18.3
10.3
340
340
340
340
Elec
trica
lC
ondu
ctiv
ity(m
S⁄ c
m)
mS/
cm0.
337
0.68
80.
71.
40.
71.
4
Sodi
umAd
sorp
tion
Rat
io
µg/g
4.98
13.3
512
512
Sodi
umµg
/g53
.812
5N
AN
AN
AN
A
Tabl
e 3
Tabl
e 2
Sam
ples


![APPENDIX F Geotechnical Investigation Report · Geotechnical Investigation Report!!!!! [Page left intentionally blank.] ... obtained from previous investigation, and slope stability](https://cdn.vdocuments.us/doc/165x107/5ed3369c20ca8951594598e3/appendix-f-geotechnical-investigation-report-geotechnical-investigation-report.jpg)


