APPENDIX E: AIR QUALITY, NOISE AND VIBRATION IMPACT STUDY Downtown Ottawa Transit Tunnel: Tunney’s Pasture to Blair Station via a Downtown LRT Tunnel Prepared for: Delcan Corporation 1223 Michael Street Suite 100 Ottawa, ON K1J 7T2 On behalf of: City of Ottawa 110 Laurier Avenue West Ottawa, ON K1P 1J1 Prepared by: Gradient Micro Climate Engineering Inc. 127 Walgreen Road Ottawa, ON K0A 1L0 May 2010

127 Walgreen Road, Ottawa, Ontario K0A 1L0 � Tel.: (613) 836-0934 � Fax: (613) 836-8183 A member of the dfaGroup � www.gradientwind.com
REPORT: GmE 08-042-EA
Prepared For:
Mr. David Hopper, Project Manager Delcan Corporation
1223 Michael Street, Suite 100 Ottawa, Ontario
K1J 7T2
Prepared By:
Joshua Foster, B. Eng.; E.I.T. Vincent Ferraro, M.Eng., P.Eng.
May 28, 2010
AIR QUALITY, NOISE, AND VIBRATION IMPACT STUDY
City of Ottawa: Environmental Assessment Downtown Ottawa Transit Tunnel
Ottawa, Ontario
Delcan Corporation DOTT EA – Air Quality, Noise and Vibration i
EXECUTIVE SUMMARY
Gradient Microclimate Engineering Inc. (GmE ) was retained by Delcan Corporation to provide
engineering support for the environmental assessment (EA) phase of the City of Ottawa’s
Downtown Ottawa Transit Tunnel (DOTT) project in the areas of air quality, noise, and ground
vibrations. The DOTT project is a proposed 12.5 kilometer (km) conversion of the City of
Ottawa’s bus rapid transit (BRT) network, known as the Transitway, to electric Light Rail
Transit (LRT), from Tunney’s Pasture Station in the west to Blair Station in the east. The
project comprises two above-grade segments on the east and west ends linked by a 3.2 km
downtown tunnel segment. This report presents the assessment methodology and comparative
results for existing and future environmental impacts of the undertaking relating to air quality,
noise and ground vibrations, and provides recommendations for mitigation where required.
IMPACTS OF OPERATIONS
Air Quality Impacts
An assessment of air quality along the corridor was undertaken with the use of air dispersion
software CAL3QHC developed by the United States Environmental Protection Agency (US
EPA). The program implements essential atmospheric parameters combined with traffic
volumes and vehicle emissions parameters of a specified vehicle fleet to determine worst-case
concentrations of selected pollutants for all possible wind directions. Worst-case concentrations
varying by wind direction are subsequently combined with local wind statistics to obtain
reasonable worst-case concentrations of the selected compounds. This study focuses on
common tailpipe emissions, including Carbon Monoxide (CO), Nitrogen Oxides (NOX),
Hydrocarbons (HC), and Suspended Particulate Matter (PM) for analysis. Particulate matter is
analyzed into several fractions (PM44, PM10 and PM2.5), with emphasis on the most harmful
fraction being PM2.5. Subscripts indicate maximum particle sizes in microns (10-6 meter).
The outcome of the air quality impact analysis indicates that converting the Transitway (BRT)
into an electric LRT system creates an overall improvement in ambient air quality, due to
elimination of diesel buses along the Transitway and reduced vehicle emissions across the
vehicle fleet over the study horizon. Increased bus traffic at transfer hubs will be outweighed by
improved emission technology over time, including hybrid and alternate fuel vehicles.

Delcan Corporation DOTT EA – Air Quality, Noise and Vibration ii
Analysis of the potential impact on air quality from ventilation shaft emissions along the tunnel
portion was performed using the MOE software AERMOD, for scenarios considering normal
operations, maintenance, and emergency fire conditions. Under normal operations, the only
anticipated emission is particulate matter (PM) from brake dust, which was found to produce
negligible impact on the environment. Operation of diesel generators, underground during night
time maintenance operations, would release products of combustion similar to roadway
vehicles described previously. Results of simulations indicate that concentrations of ventilation
shaft emissions at virtually all sensitive receivers fall below Ministry of the Environment
(MOE) standards defined in Ontario Regulation (O.Reg.) 419. The two locations which
experience violations of the criterion for NOX are the proposed future site of the Ottawa Public
Library and the rooftop fresh air intake at 118 Sparks Street. Based on the level of conservatism
in the modelling assumptions, and the design flexibility at the library site, the detailed design of
the building and its mechanical system will create adequate opportunity to mitigate any
marginal air quality issues. For the building at 118 Sparks Street, a minor violation of the NOX
criterion occurs for one hour in five years (equivalent to once in 43,800 hours), also based on
the same conservative modelling assumptions. As such, the Sparks Street site is considered to
experience acceptable air quality without the need for mitigation. Air quality monitoring during
maintenance operations is recommended to establish policies for maintenance activities.
Simulation of fire conditions in the tunnel indicates that smoke and other combustion products
discharged from ventilation shafts can produce hazardous concentrations at fresh air intakes of
nearby buildings. Although emergency conditions are not constrained by MOE regulations,
given the low risk and uncertain location of affected shafts, it is recommended that heat and
smoke detectors for automatic damper control of fresh air intakes be installed at selected
buildings itemized in the main body of the report. The same analysis during fire scenarios
indicates that station entrances remain free of harmful contamination levels, thereby allowing
safe egress of patrons in an emergency.
Air emissions from the Maintenance and Storage (M & S) Facility, as well as from expanded
operations at the terminal stations, will be assessed and controlled during the detailed design
and project implementation phases of the project according to MOE and City of Ottawa
requirements.
Delcan Corporation DOTT EA – Air Quality, Noise and Vibration iii
Noise Impacts
Existing and future noise conditions were predicted using the MOE road and rail analysis
software STAMSON 5.04 based on current and projected traffic volumes to the year 2031. A
comparison of existing and future conditions revealed that, despite an increase in noise levels
due to converting the Transitway to LRT, noise levels at most receptors remain dominated by
existing sources, including Highway 417 and Scott Street. However, mitigation is necessary
and recommended for the houses and church located along the north side of the Transitway
between Parkdale Avenue and Merton Street. Adequate mitigation would be in the form of a
2.4 meter (m) tall noise barrier installed adjacent to the property lines of the affected properties
within the City’s right of way, as illustrated in Figure 3 found in the main body of the report.
Noise emanating from the ventilation shafts and at the tunnel portals during normal operations
have not been specifically considered as part of this study. Noise from tunnel ventilation
equipment will be mitigated to acceptable levels by the selection of silencers, according to the
Certificate of Approvals process regulated by the MOE and the City of Ottawa Environmental
Noise Control Guidelines (ENCG), following equipment selection during the detailed design
phase of the project. In a similar way, noise from expanded operations at the terminal stations
and from the future M & S Facility, as well as Electrical Substations (Traction Power Stations)
would be evaluated during the detailed design and implementation phase of the project
according to the rules established by the City of Ottawa ENCG based on the MOE protocol.
Appropriate mitigation for these facilities may include the use of landscaped earth berms and
noise barriers, as well as silencers for mechanical equipment and duct work.
Ground Vibrations and Ground-Borne Noise Impacts
Existing ground vibrations were measured at nine locations throughout the corridor to assess
the impact from buses along the Transitway and traffic on surrounding roadways. Vibration
impacts of the new LRT system were predicted using the United States Federal Transit
Administration’s (FTA) Transit Noise and Vibration Impact Assessment protocol. The analysis
considered conservative assumptions relating to track operations, including: (i) worn tracks,
and (ii) the presence of special track work (such as switches and crossovers) among others.
According to the FTA, these factors have an equal impact on vibrations and are not additive.

Delcan Corporation DOTT EA – Air Quality, Noise and Vibration iv
Without mitigation, ground vibration levels and associated ground-borne noise will increase to
perceptible and possibly annoying levels along the full corridor, including the downtown tunnel
section. However, implementation of appropriate mitigation features would limit future ground
vibrations to acceptable levels according to the various building uses along the corridor.
Although ground-borne noise is more difficult to attenuate along the tunnel section, the same
mitigation features would satisfy the vast majority of noise issues affecting buildings in the
downtown core. As such, recommended mitigation includes: (i) track and sleeper isolation such
as floating slab track, double-tie systems, or equivalent vibration attenuation techniques along
the downtown tunnel section, the maintenance tunnel link, and the at-grade section from
Tunney’s Pasture Station to the Bayview Road crossing, and (ii) use of track isolation such as
resilient track fasteners alone, for the remainder of the corridor. Furthermore, the use of
continuously welded rail, as well as regular maintenance of train wheels and track, is
recommended to ensure acceptable long term performance within vibration and noise limits.
Short term monitoring of noise and vibrations is also recommended for the first six months of
LRT operations at selected basements of adjacent buildings along the tunnel sections, including
all buildings sensitive to noise and vibration, to evaluate the success of the noted mitigation
strategies.
The noted mitigation strategies should be reevaluated throughout the design evolution to ensure
appropriate attenuation is achieved by the LRT system. The stiffness of the vehicles’ primary
suspension and the natural frequency of the floating slab can have a significant effect on the
vibration attenuation performance of the entire system.
Delcan Corporation DOTT EA – Air Quality, Noise and Vibration v
CONSTRUCTION IMPACTS
Varied construction activities along the LRT corridor are expected to create isolated and short-
term noise, air quality and vibration impacts on the environment. The construction manager
will be required to develop a strategy for mitigating the effects according to good practices
intended to satisfy, as far as technically feasible, the fugitive dust limits specified in O.Reg.
419, the noise limits specified in MOE NPC-1151 and City of Ottawa By-laws for Noise2, and
the limits on ground vibrations specified in MOE NPC-1193. Tunnel construction works must
also be preceded by pre-construction surveys for selected buildings along the tunnel route. A
list of common mitigation strategies adapted to the current project includes, but is not limited
to, the following:
For air emissions:
(i) Monitor weather forecast, and plan operations to take advantage of calm wind periods;
(ii) Minimize site storage of granular material in height and extent;
(iii) Locate storage piles in sheltered areas that can be covered;
(iv) Provide movable wind breaks as necessary to minimize fugitive dust;
(v) Use water spray and suppression techniques to control fugitive dust;
(vi) Cover haul trucks and wash down access routes to the construction site.
For noise and vibrations:
(i) Limit speeds of heavy vehicles within and upon approaching the site;
(ii) Provide compacted smooth surfaces, avoiding abrupt steps and ditches;
(iii) Install movable noise barriers or temporary enclosures at tunnel portals;
(iv) Keep equipment properly maintained according to manufacturer’s procedures;
(v) For the TBM, maintain the cutting face in optimum condition. Select cutting speed
within operational limits to avoid resonance in adjacent structures. Monitor noise and
vibration at basements of selected adjacent buildings;
(vi) Implement a blast design program prepared by a blast design engineer.
1 MOE, Model Municipal Noise Control By-Law, NPC-115 Construction Equipment, August 1978 2 City of Ottawa, Noise By-law ByLAW NO. 2004-253 3 MOE, Model Municipal Noise Control By-Law, NPC-119 Blasting, August 1978
Delcan Corporation DOTT EA – Air Quality, Noise and Vibration vi
TABLE OF CONTENTS PAGE
1. INTRODUCTION 1
2. TERMS OF REFERENCE 2
3. OBJECTIVES 3
4. METHODOLOGY 4
4.1 Assessment of Air Quality 4 4.1.1 Air Quality Criteria 5 4.1.2 Modelling Vehicle and Bus Emissions 7 4.1.3 Modelling Ventilation Shaft Emissions 11 4.1.4 Bus Terminals and M & S Facility 15
4.2 Assessment of Airborne Noise From At-Grade Transportation Sources 16 4.2.1 Noise Criteria 17 4.2.2 Noise Assessment Procedure 18 4.2.3 Stationary Noise 19
4.3 Assessment of Ground Vibrations and Ground-Borne Noise 19 4.3.1 Vibration Criteria 20 4.3.2 Assessment Procedure 21
5. RESULTS 26
5.1 Air Quality 26 5.1.1 Impact of Vehicle and Bus Emissions 26 5.1.2 Impact of Ventilation Shafts 29 5.1.3 Maintenance and Storage Facility 31
5.2 Airborne Noise From At-Grade Transportation Sources 34
5.3 Ground Vibrations and Ground-borne Noise 45
6. IMPACTS OF CONSTRUCTION 54
7. SUMMARY AND CONCLUSIONS 57
7.1 Operational Impacts 57
7.2 Construction Impacts 59
Delcan Corporation DOTT EA – Air Quality, Noise and Vibration vii
LIST OF FIGURES:
FIGURE 1: KEY PLAN AND OVERVIEW FOR RECEPTOR LOCATIONS FIGURE 2: RECEPTOR LOCATIONS SMIRLE AVE TO PARKDALE AVE FIGURE 3: RECEPTOR LOCATIONS PARKDALE AVE TO BAYSWATER AVE FIGURE 4: RECEPTOR LOCATIONS BAYSWATER AVE TO PRESTON STREET FIGURE 4: RECEPTOR LOCATIONS PRESTON STREET TO WELLINGTON STREET FIGURE 6: RECEPTOR LOCATIONS WELLINGTON STREET TO BAY STREET FIGURE 7: RECEPTOR LOCATIONS BAY STREET TO BANK STREET FIGURE 8: RECEPTOR LOCATIONS BANK STREET TO ELGIN STREET FIGURE 9: RECEPTOR LOCATIONS ELGIN STREET TO McKENZIE BRIDGE FIGURE 10: RECEPTOR LOCATIONS McKENZIE KING BRIDGE TO NICHOLAS STREET FIGURE 11: RECEPTOR LOCATIONS NICHOLAS STREET TO GREENFIELD AVE FIGURE 12: RECEPTOR LOCATIONS GREENFIELD AVE TO HWY 417 FIGURE 13: RECEPTOR LOCATIONS HWY 417 TO HURDMAN STATION FIGURE 14: RECEPTOR LOCATIONS HURDMAN STATION FIGURE 15: RECEPTOR LOCATIONS HURDMAN STATION TO RIVERSIDE DRIVE FIGURE 16: RECEPTOR LOCATIONS RIVERSIDE DRIVE TO TRAIN STATION FIGURE 17: RECEPTOR LOCATIONS TRAIN STATION TO BELFAST ROAD FIGURE 18: RECEPTOR LOCATIONS BELFAST ROAD TO ST. LAURENT BLVD FIGURE 19: RECEPTOR LOCATIONS ST. LAURENT BLVD TO MICHAEL STREET FIGURE 20: RECEPTOR LOCATIONS MICHAEL STREET TO CYRVILLE ROAD FIGURE 21: RECEPTOR LOCATIONS CYRVILLE ROAD TO HWY 174 FIGURE 22: RECEPTOR LOCATIONS HWY 174 TO BLAIR STATION FIGURE 23: RECEPTOR LOCATIONS BLAIR STATION FIGURE 24: RECEPTOR LOCATIONS MAINTENANCE & STORAGE FACILITY FIGURE 25: AERMOD 3D MODEL OF DOWNTOWN (VIEWED FROM THE INTERSECTION
OF WELLINGTON STREET AND KENT STREET LOOKING SOUTH EAST FIGURE 26: GENERIC VIBRATION CRITERION (VC) CURVES FOR VIBRATION –
SENSITIVE EQUIPMENT – SHOWING ALSO THE ISO GUIDELINES FOR PEOPLE IN BUILDINGS
FIGURE 27: FTA GENERALIZED CURVES OF VIBRATION LEVELS VERSES DISTANCE (ADOPTED FROM 10-1, FTA TRANSIT NOISE AND VIBRATION IMPACT ASSESSMENT)
FIGURE 28: VIBRATION LEVELS AT 18 m FROM TRACK, TRAIN SPEED 80 km/h (ADOPTED FROM FIGURE 5, PARRAMATTA RAIL LINK – APPROACH TO CONTROLLING TRAIN REGENERATED NOISE AND VIBRATION)
APPENDICES
APPENDIX A: AMBIENT AIR QUALITY MODELLING OF EXISTING CONDITIONS INPUT AND OUTPUT DATA FOR CAL3QHC
APPENDIX B: AMBIENT AIR QUALITY MODELLING OF FUTURE CONDITIONS INPUT AND OUTPUT DATA FOR CAL3QHC
APPENDIX C: AIR DISPERSION MODELLING FOR VENTILATION SHAFTS INPUT AND OUTPUT DATA FROM AERMOD
APPENDIX D: NOISE MODELLING OF EXISTING CONDITIONS INPUT AND OUTPUT DATA STAMSON 5.04
APPENDIX E: NOISE MODELLING OF FUTURE CONDITIONS INPUT AND OUTPUT DATA STAMSON 5.04
APPENDIX F: FUTURE GROUND VIBRATION PREDICTIONS CALCULATIONS

Delcan Corporation DOTT EA – Air Quality, Noise and Vibration Page 1
1. INTRODUCTION
Gradient Microclimate Engineering Inc. (GmE ) was retained by Delcan Corporation to provide
engineering support for the environmental assessment (EA) phase for the City of Ottawa
Downtown Ottawa Transit Tunnel (DOTT) project in the areas of air quality, noise, and ground
vibrations. The DOTT EA is undertaken as a coordinated Provincial–Federal EA, pursuant to
the new Provincial Transit Project Regulation (Ontario Regulation 231/08), and the Federal
Canadian Environmental Assessment Act.
This report describes the assessment, methodology and results for future environmental air
quality, noise and ground vibration impacts created by the project, compares them with existing
conditions, and provides recommendations for mitigation where required.
Detailed assessments of the operational impacts are presented in Sections 4 and 5, and a
qualitative assessment of the impacts of construction is presented in Section 6.
Delcan Corporation DOTT EA – Air Quality, Noise and Vibration Page 2
2. TERMS OF REFERENCE
The DOTT is a proposed twelve and a half kilometer (12.5 km) conversion of the City of
Ottawa bus rapid transit (BRT) network, known as the Transitway, to electric light rail transit
(LRT). The extent of the project spans from the existing Transitway station at Tunney’s Pasture
in the west to Blair Station in the east. The undertaking involves converting a dedicated bus
roadway to at-grade rail on the east and west ends, and linking them with a new 3.2 km tunnel
under the City’s downtown core. The tunnel will extend from the Western Portal, located east
of LeBreton Station, to the Eastern Portal, located north of Lees Station, weaving a cross-
country route beneath existing tall buildings, underground services, and the Rideau Canal.
Outside the portals, the DOTT alignment will follow the existing Transitway corridor. Twin
parallel tunnels are proposed, having a diameter of approximately six meters (m) each. The
running tunnels will be mined primarily through limestone bedrock using a Tunnel Boring
Machine (TBM). Underground station caverns will be mined using controlled drilling and
blasting techniques. The Campus Station at the University of Ottawa will be constructed using
the cut and cover technique. The end portals and ventilation shafts will be constructed using
conventional surface excavation techniques.
Station platforms are designed to handle six-car trains, with 180 m long platforms, to
accommodate future expansion beyond the design horizon of 2031, although only four-car
trains will be required for much of the intervening period. The operational design speed of the
new LRT system is 80 kilometers per hour (80 km/h) with anticipated headways of two (2) to
three (3) minutes during peak hours. Figure 1 illustrates an overview of the project.
Train maintenance will occur at a new Maintenance and Storage (M & S) Facility located in an
industrial area at Belfast Road and Terminal Avenue, south of the Canadian National Railway
line and a residential neighbourhood beyond. One or several large buildings will house the
maintenance operations and the LRT vehicles. The facility will operate on a 24-hour basis and
would include outdoor maintenance and marshalling activities.

Delcan Corporation DOTT EA – Air Quality, Noise and Vibration Page 3
3. OBJECTIVES
The DOTT is intended to promote efficient rapid mass transit, and is the first link in a city wide
LRT system. The underlying goal of the studies covered in this report is to identify and
minimize any impacts of the undertaking, including construction activities, on the human and
natural environments by judicious selection of design elements. As such, the necessary scope of
work to achieve this goal comprises: assessing existing conditions for air quality, noise, and
ground vibrations, predicting future conditions resulting from the undertaking, and
recommending appropriate mitigation measures where comparisons show significant
deterioration according to the guidelines of the City of Ottawa, Ministry of the Environment of
Ontario (MOE) and other governing authorities.
Under the new Transit Project Regulation (Ontario Regulation 231/08), future impacts of the
project are to be considered relative to existing conditions at the time the assessment is
undertaken. Under the new regulations, a ‘future do nothing’ analysis is no longer required, and
has not been presented in this report.
Delcan Corporation DOTT EA – Air Quality, Noise and Vibration Page 4
4. METHODOLOGY
The following sections describe the methodology for assessing baseline existing conditions and
predicted future conditions due to LRT operations for each of the subject areas. Construction
impacts are discussed qualitatively in Section 6.
4.1 Assessment of Air Quality
Converting the Transitway (BRT) into an electric LRT system will have benefits or drawbacks
depending on location. Whereas the LRT system will reduce diesel emissions from BRT buses,
including Carbon Monoxide (CO), Hydrocarbons (HC), Oxides of Nitrogen (NOx), and
Particulate Matter (PM), in addition to other secondary compounds, increased bus traffic at
terminal stations may have a negative effect on air quality at nearby points of reception. Section
4.1.2 describes the methodology used to assess the impact of vehicle and bus emissions on
ambient air quality throughout the DOTT corridor.
The new 3.2 km tunnel and four underground stations through Ottawa’s downtown core are
proposed as part of the project. Each station will be serviced by one ventilation shaft at each
end, which will be used primarily to supply fresh air and climate control to the stations. The
ventilation shafts are also used to balance air and extract smoke in the event of a fire. Under
normal operation, the piston effect of the trains entering and leaving the station will make up
the majority of the air exchanges. Reversible ventilation fans will be operated automatically
during periods of high temperatures on warm summer days, and during underground
maintenance operations. In the event of an underground fire, the fans will operate automatically
to push fresh air into the station, or to extract smoke as controlled by heat and smoke sensors
installed throughout the tunnel and stations.
The ventilation shafts will impact the outside environment in three possible scenarios. First,
under normal operation, PM from brake dust and other machinery will be exhausted above
grade level. In this case, there are no other significant airborne emissions from the electric
trains. Second, during night time maintenance of the tunnel or stations, by-products of diesel or
gasoline fumes emitted by maintenance equipment (i.e. generators, work cars and hand tools)
will be exhausted at the ventilation shafts. Third, during rare emergency fire situations, one or

Delcan Corporation DOTT EA – Air Quality, Noise and Vibration Page 5
more ventilation shafts will exhaust smoke and other combustion products to the above grade
environment. Section 4.1.3 describes the methodology used to assess the impact of the
ventilation shafts on local air quality affecting surrounding buildings for each of these cases.
4.1.1 Air Quality Criteria
An assessment of air quality is based on determining the concentration of a pollutant at a
particular location. Pollutant concentrations are measured in either parts per million (ppm) or
micrograms per cubic meter (�g/m3). Resulting concentrations are compared to clean air
standards that have been set by the Ontario Ministry of the Environment’s (MOE), Standards
Development Branch. There are two sets of standards and guidelines. The Ambient Air Quality
Criteria (AAQC)4 are the Ministry’s targets for clean air from all sources of pollutants,
including transit, transportation, and industrial faculties when considered with other sources.
Regulation 419: Air Pollution – Local Air Quality Standards (O. Reg. 419)5, are the legal limits
for single or multiple sources falling within a single property, such as an industrial facility.
AAQC and O. Reg. 419 standards are effect-based concentration levels for individual
pollutants in air, with variable averaging periods for each pollutant. Averaging periods vary
from one to twenty-four hours, appropriate for the relevant effect each pollutant causes. For
example, CO has acute health effects (poisoning) and an averaging period of one-half hour,
whereas prolonged exposure to high levels of PM can have long term respiratory effects, with a
corresponding averaging period of twenty-four hours. The AAQC and O. Reg. 419 standards
for representative pollutants are listed in Table 1, with the averaging period for each pollutant
described in parenthesis.
4 Standards Development Branch, Ontario Ministry of the Environment, Ontario’s Ambient Air Quality Criteria (AAQC), February 2008. 5 Standards Development Branch, Ontario Ministry of the Environment, Summary of Standards and Guidelines to Support Ontario Regulation 419: Air Pollution – Local Air Quality, February 2008
Delcan Corporation DOTT EA – Air Quality, Noise and Vibration Page 6
TABLE 1: AMBIENT AIR QUALITY CRITERIA AND O. REG. 419 STANDARDS
POLLUTANT AAQC (�g/m3)
O. Reg. 419 (�g/m3)
LIMITING EFFECT
CO 36200 (1 HR) 15700 (8 HR) 6000 (1/2 HR) Health HC 2500 (24 HR) 2500 (24 HR) Health NOx 400 (1 HR) 200 (24 HR) 400 (1 HR) 200 (24 HR) Health
(PM44, < 44�m) 120 (24 HR) 120 (24 HR) Visibility
(PM10, < 10�m) 50 (24 HR) Not Available Health
(PM2.5, < 2.5�m) 30 (24 HR) Not Available Health
Although emergency situations are not constrained by air pollution criteria, the National Fire
Protection Association code, ‘NFPA 130’6, requires that ventilation shafts be designed to
prevent the entrainment of smoke into the underground stations for safe egress of passengers,
as well as to protect the safety of pedestrians and occupants of adjacent buildings.
The impact of emissions from subway shafts during a tunnel fire are defined in terms of
dilution ratios. Dilution ratios represent the amount of mixing or dilution of the smoke plume,
defined as a source concentration divided by the concentration at a point of reception. Dilution
ratios are used in this case due to the lack of reliable data regarding the contents of combustion
products. Although smoke, comprising particulates of various sizes, is the visible component of
combustion, other harmful products are also carried in the hot plume that would be exhausted
from one or more of the eight ventilation shafts or the tunnel portals. In-house experience,
supported with limited full-scale testing, indicates that dilution ratios of 1000 or more are
required to achieve acceptable air quality for most chemicals, including particulates, assuming
continuous long-term exposure. Lower dilution, and therefore higher concentrations, will be
acceptable for occasional short-exposures.
6 National Fire Protection Association, Standard for Fixed Guideway Transit and Passenger Rail Systems, NFPA 130, 2007
Delcan Corporation DOTT EA – Air Quality, Noise and Vibration Page 7
4.1.2 Modelling Vehicle and Bus Emissions
To assess the impact of converting the BRT Transitway into an electric LRT system, air
dispersion modelling was performed using the computer software CAL3QHC. Developed by
the United States Environmental Protection Agency (EPA), CAL3QHC is an air dispersion
model in widespread use to predict air quality influenced by roadway vehicle emissions. The
main features of the atmosphere which influence pollution dispersion, which are reflected in the
model, include wind, atmospheric stability, and mixing height. Stability of the atmosphere is
controlled by thermal effects within the lowest 500 m of the atmosphere, which changes on a
diurnal cycle and day-to-day, as well as by wind strength. Both of these influence mixing
height. CAL3QHC incorporates conservative estimates of atmospheric parameters, along with
roadway parameters such as vehicle counts, traffic speeds, and characteristics of signalized
intersections, to estimate actual pollutant concentrations at each receptor for the worst-case one
hour period for all wind directions at ten degree intervals.
Using peak hour traffic volumes to represent reasonable worst-case conditions, an assessment
of air quality along the DOTT corridor was performed for common vehicle pollutants,
including CO, NOX, HC and suspended PM, broken down into inhalable (PM<10�m) and
respirable (PM<2.5�m) components. Since PM2.5 is known to have the greatest health risks and
the most stringent criterion, only results for PM2.5 are presented in this report. The analysis was
based on current traffic information received from the City of Ottawa through Delcan. Future
traffic volumes were based on assumptions of growth rates outside the downtown core of 2%
per year and 0% through the downtown core. Zero growth was assumed for the downtown core
due to saturation in development in the area, and the reduction of buses along Albert and Slater
Streets under future conditions. The vehicle emission factors, summarized in Table 2, were
taken from a report; ‘On Road Vehicle Emission Inventories’7 prepared for Environment
Canada corresponding to current and forecasted Canadian vehicle fleets according to the
protocol established in MOBILE 6. Major intersections and roadways with significant vehicle
traffic within the influence zone of the corridor, such as Scott Street, as well as Highways 417
and 174, were included in the model. Eighty ambient air quality receptor locations, illustrated
in Figures 2 through 24, were selected to quantify the worst-case one-hour concentrations
7 Senes Consultants Limited; Air Improvement Resource Inc., Updated estimate of Canadian On-Road Vehicle Emissions for the Year 1995-2020, Environment Canada, October 2002
Delcan Corporation DOTT EA – Air Quality, Noise and Vibration Page 8
during peak traffic hours of the morning periods. The model was run for the full azimuth of
wind directions, and for wind speeds of one meter per second (m/s), 2 m/s, and 4 m/s,
referenced to the weather station at the Ottawa International Airport. Wind speed and
directional statistics for the Ottawa area were combined with the pollution data to determine
statistical levels of pollutants occurring along the corridor.
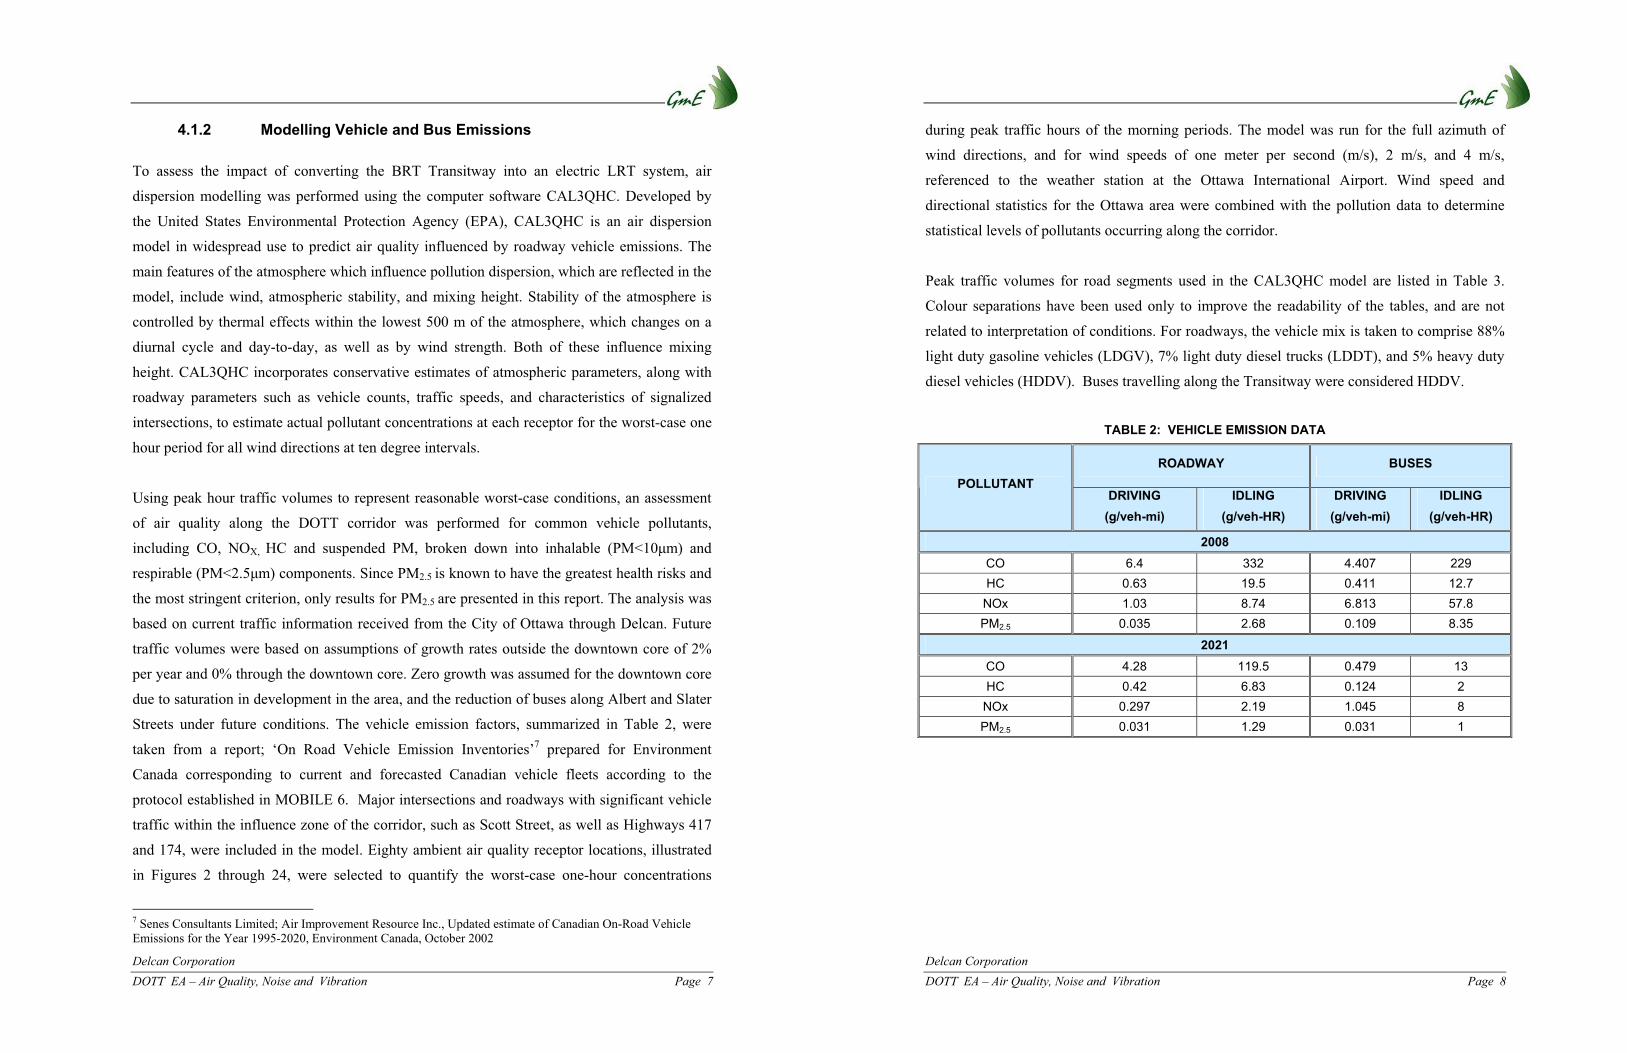
Peak traffic volumes for road segments used in the CAL3QHC model are listed in Table 3.
Colour separations have been used only to improve the readability of the tables, and are not
related to interpretation of conditions. For roadways, the vehicle mix is taken to comprise 88%
light duty gasoline vehicles (LDGV), 7% light duty diesel trucks (LDDT), and 5% heavy duty
diesel vehicles (HDDV). Buses travelling along the Transitway were considered HDDV.
TABLE 2: VEHICLE EMISSION DATA
ROADWAY BUSES POLLUTANT
DRIVING (g/veh-mi)
IDLING (g/veh-HR)
DRIVING (g/veh-mi)
IDLING (g/veh-HR)
2008CO 6.4 332 4.407 229 HC 0.63 19.5 0.411 12.7 NOx 1.03 8.74 6.813 57.8 PM2.5 0.035 2.68 0.109 8.35
2021CO 4.28 119.5 0.479 13 HC 0.42 6.83 0.124 2 NOx 0.297 2.19 1.045 8 PM2.5 0.031 1.29 0.031 1
Delcan Corporation DOTT EA – Air Quality, Noise and Vibration Page 9
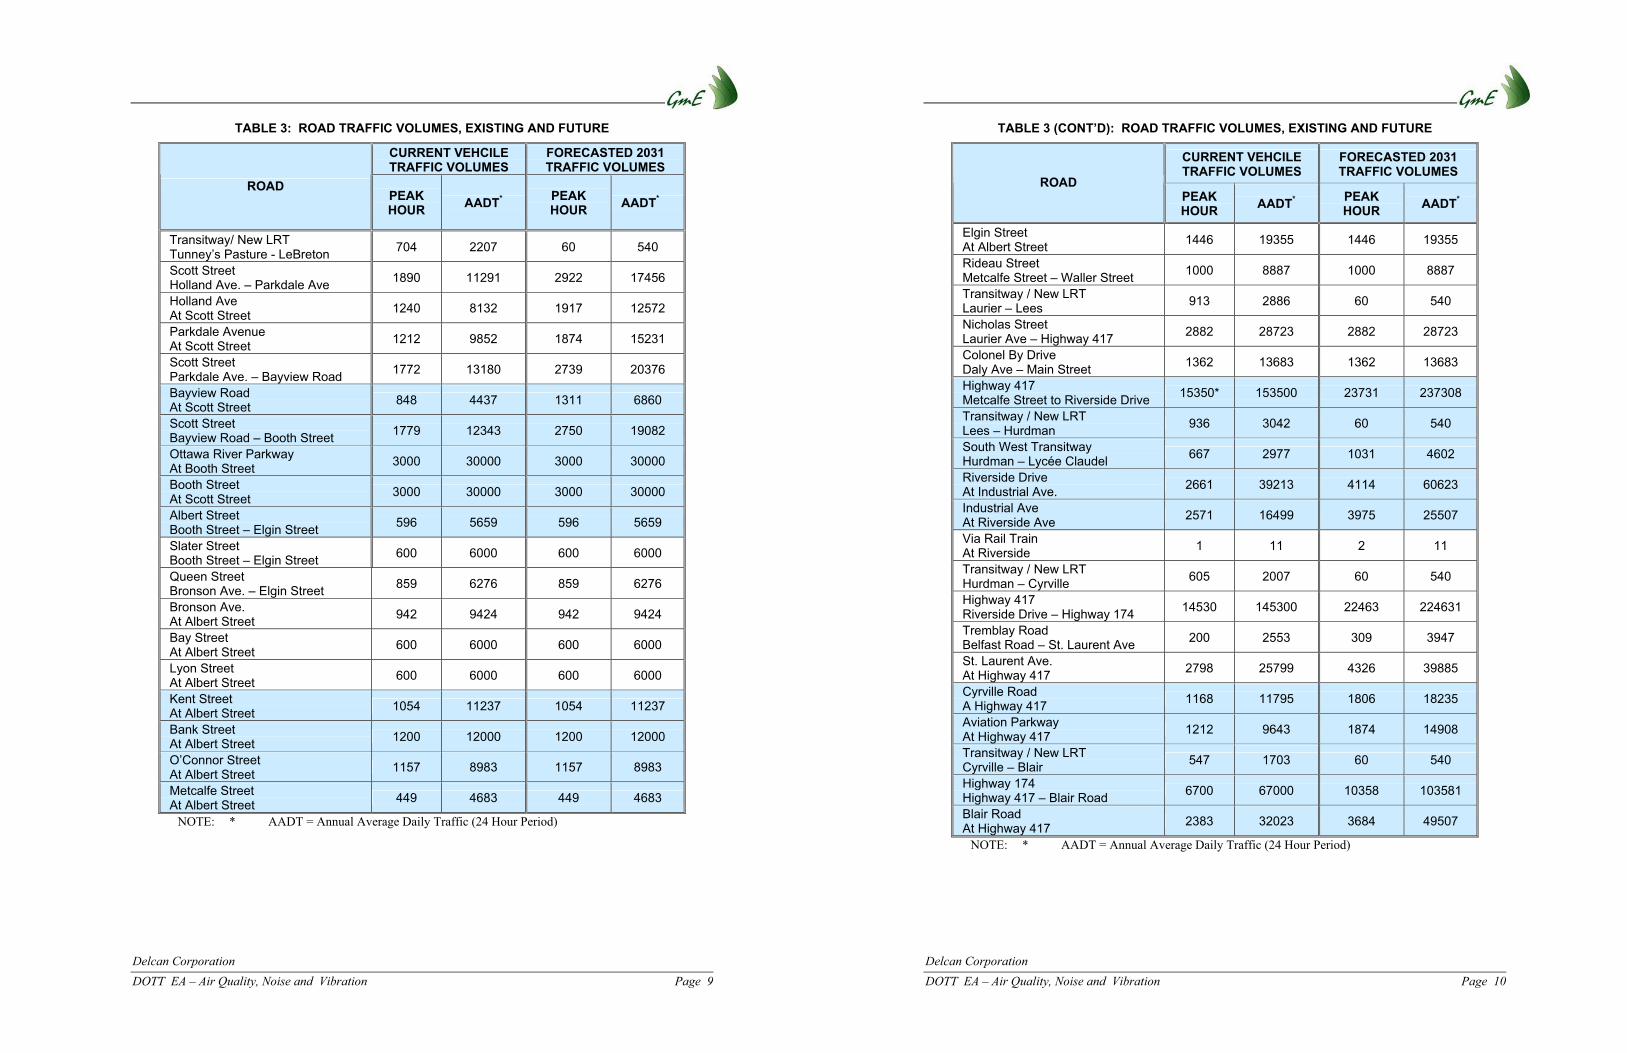
TABLE 3: ROAD TRAFFIC VOLUMES, EXISTING AND FUTURE
CURRENT VEHCILE TRAFFIC VOLUMES
FORECASTED 2031 TRAFFIC VOLUMES
ROAD PEAK HOUR AADT* PEAK
HOUR AADT*
Transitway/ New LRT Tunney’s Pasture - LeBreton 704 2207 60 540
Scott Street Holland Ave. – Parkdale Ave 1890 11291 2922 17456
Holland Ave At Scott Street 1240 8132 1917 12572
Parkdale Avenue At Scott Street 1212 9852 1874 15231
Scott Street Parkdale Ave. – Bayview Road 1772 13180 2739 20376
Bayview Road At Scott Street 848 4437 1311 6860
Scott Street Bayview Road – Booth Street 1779 12343 2750 19082
Ottawa River Parkway At Booth Street 3000 30000 3000 30000
Booth StreetAt Scott Street 3000 30000 3000 30000
Albert Street Booth Street – Elgin Street 596 5659 596 5659
Slater Street Booth Street – Elgin Street 600 6000 600 6000
Queen Street Bronson Ave. – Elgin Street 859 6276 859 6276
Bronson Ave. At Albert Street 942 9424 942 9424
Bay Street At Albert Street 600 6000 600 6000
Lyon Street At Albert Street 600 6000 600 6000
Kent Street At Albert Street 1054 11237 1054 11237
Bank Street At Albert Street 1200 12000 1200 12000
O’Connor Street At Albert Street 1157 8983 1157 8983
Metcalfe Street At Albert Street 449 4683 449 4683
NOTE: * AADT = Annual Average Daily Traffic (24 Hour Period)
Delcan Corporation DOTT EA – Air Quality, Noise and Vibration Page 10
TABLE 3 (CONT’D): ROAD TRAFFIC VOLUMES, EXISTING AND FUTURE
CURRENT VEHCILE TRAFFIC VOLUMES
FORECASTED 2031 TRAFFIC VOLUMES
ROAD PEAK HOUR AADT* PEAK
HOUR AADT*
Elgin Street At Albert Street 1446 19355 1446 19355
Rideau Street Metcalfe Street – Waller Street 1000 8887 1000 8887
Transitway / New LRT Laurier – Lees 913 2886 60 540
Nicholas Street Laurier Ave – Highway 417 2882 28723 2882 28723
Colonel By Drive Daly Ave – Main Street 1362 13683 1362 13683
Highway 417 Metcalfe Street to Riverside Drive 15350* 153500 23731 237308
Transitway / New LRT Lees – Hurdman 936 3042 60 540
South West Transitway Hurdman – Lycée Claudel 667 2977 1031 4602
Riverside Drive At Industrial Ave. 2661 39213 4114 60623
Industrial Ave At Riverside Ave 2571 16499 3975 25507
Via Rail Train At Riverside 1 11 2 11
Transitway / New LRT Hurdman – Cyrville 605 2007 60 540
Highway 417 Riverside Drive – Highway 174 14530 145300 22463 224631
Tremblay Road Belfast Road – St. Laurent Ave 200 2553 309 3947
St. Laurent Ave. At Highway 417 2798 25799 4326 39885
Cyrville Road A Highway 417 1168 11795 1806 18235
Aviation Parkway At Highway 417 1212 9643 1874 14908
Transitway / New LRT Cyrville – Blair 547 1703 60 540
Highway 174 Highway 417 – Blair Road 6700 67000 10358 103581
Blair Road At Highway 417 2383 32023 3684 49507
NOTE: * AADT = Annual Average Daily Traffic (24 Hour Period)
Delcan Corporation DOTT EA – Air Quality, Noise and Vibration Page 11
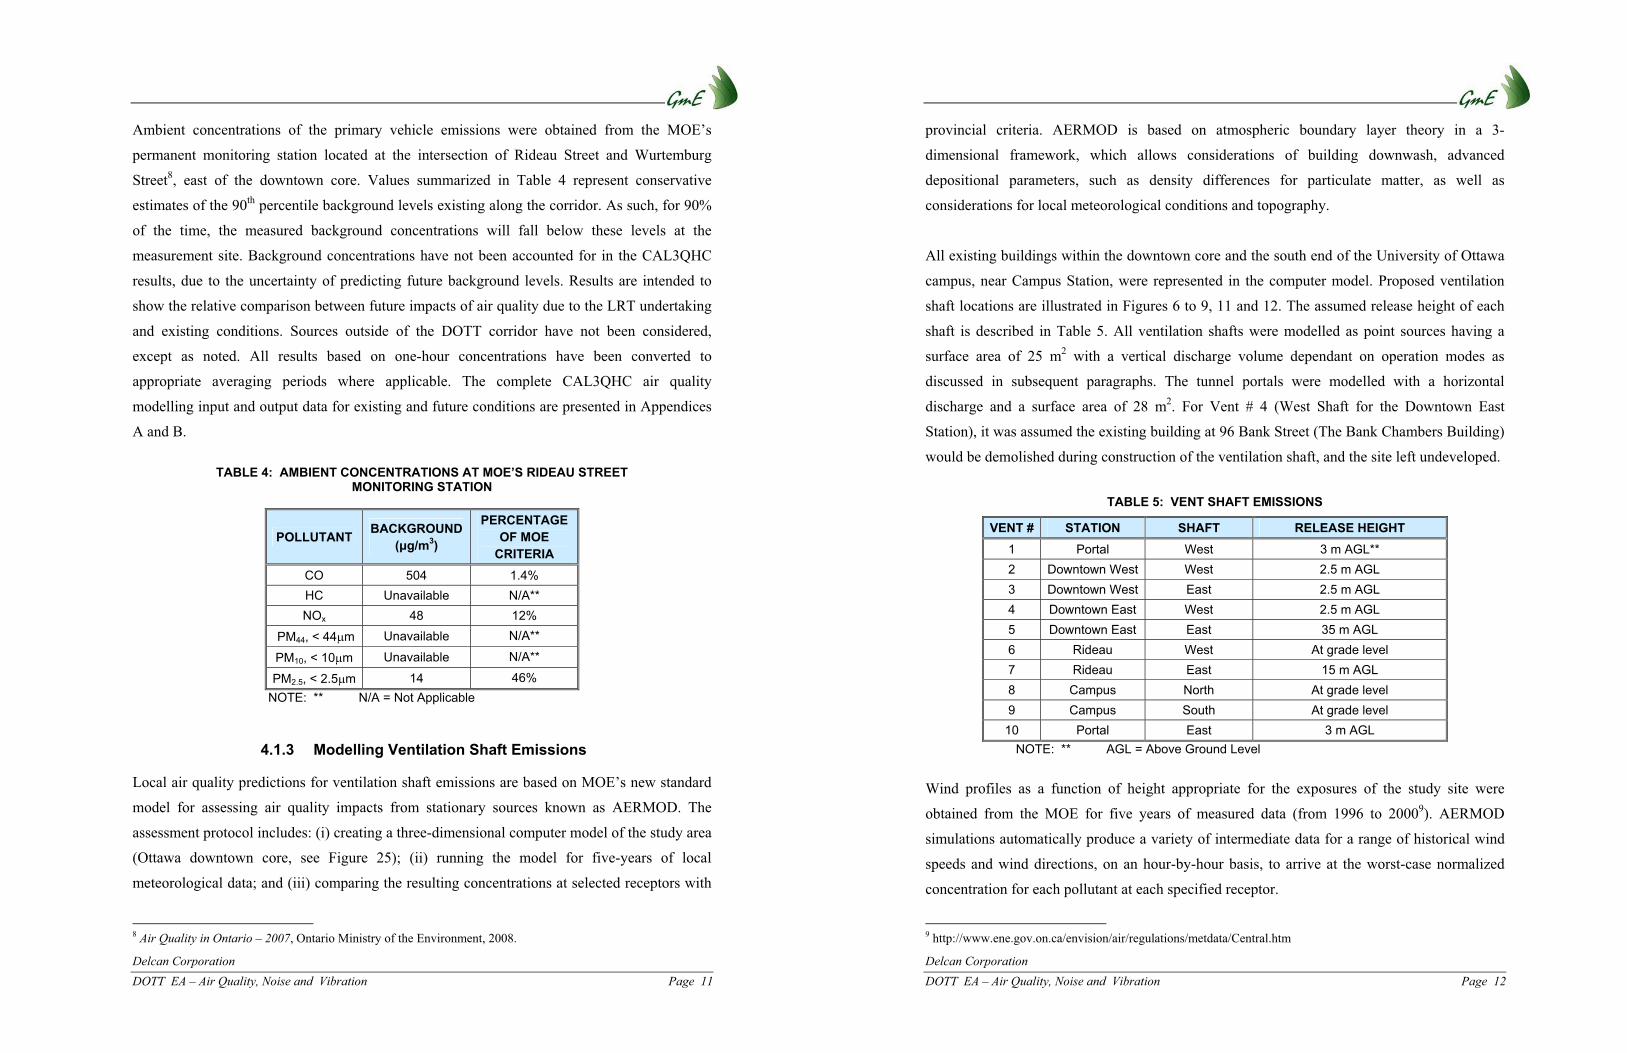
Ambient concentrations of the primary vehicle emissions were obtained from the MOE’s
permanent monitoring station located at the intersection of Rideau Street and Wurtemburg
Street8, east of the downtown core. Values summarized in Table 4 represent conservative
estimates of the 90th percentile background levels existing along the corridor. As such, for 90%
of the time, the measured background concentrations will fall below these levels at the
measurement site. Background concentrations have not been accounted for in the CAL3QHC
results, due to the uncertainty of predicting future background levels. Results are intended to
show the relative comparison between future impacts of air quality due to the LRT undertaking
and existing conditions. Sources outside of the DOTT corridor have not been considered,
except as noted. All results based on one-hour concentrations have been converted to
appropriate averaging periods where applicable. The complete CAL3QHC air quality
modelling input and output data for existing and future conditions are presented in Appendices
A and B.
TABLE 4: AMBIENT CONCENTRATIONS AT MOE’S RIDEAU STREET
MONITORING STATION
POLLUTANT BACKGROUND (�g/m3)
PERCENTAGE OF MOE
CRITERIA CO 504 1.4% HC Unavailable N/A** NOx 48 12%
PM44, < 44�m Unavailable N/A**
PM10, < 10�m Unavailable N/A**
PM2.5, < 2.5�m 14 46% NOTE: ** N/A = Not Applicable
4.1.3 Modelling Ventilation Shaft Emissions
Local air quality predictions for ventilation shaft emissions are based on MOE’s new standard
model for assessing air quality impacts from stationary sources known as AERMOD. The
assessment protocol includes: (i) creating a three-dimensional computer model of the study area
(Ottawa downtown core, see Figure 25); (ii) running the model for five-years of local
meteorological data; and (iii) comparing the resulting concentrations at selected receptors with
8 Air Quality in Ontario – 2007, Ontario Ministry of the Environment, 2008.
Delcan Corporation DOTT EA – Air Quality, Noise and Vibration Page 12
provincial criteria. AERMOD is based on atmospheric boundary layer theory in a 3-
dimensional framework, which allows considerations of building downwash, advanced
depositional parameters, such as density differences for particulate matter, as well as
considerations for local meteorological conditions and topography.
All existing buildings within the downtown core and the south end of the University of Ottawa
campus, near Campus Station, were represented in the computer model. Proposed ventilation
shaft locations are illustrated in Figures 6 to 9, 11 and 12. The assumed release height of each
shaft is described in Table 5. All ventilation shafts were modelled as point sources having a
surface area of 25 m2 with a vertical discharge volume dependant on operation modes as
discussed in subsequent paragraphs. The tunnel portals were modelled with a horizontal
discharge and a surface area of 28 m2. For Vent # 4 (West Shaft for the Downtown East
Station), it was assumed the existing building at 96 Bank Street (The Bank Chambers Building)
would be demolished during construction of the ventilation shaft, and the site left undeveloped.
TABLE 5: VENT SHAFT EMISSIONS
VENT # STATION SHAFT RELEASE HEIGHT 1 Portal West 3 m AGL** 2 Downtown West West 2.5 m AGL 3 Downtown West East 2.5 m AGL 4 Downtown East West 2.5 m AGL 5 Downtown East East 35 m AGL 6 Rideau West At grade level 7 Rideau East 15 m AGL 8 Campus North At grade level 9 Campus South At grade level 10 Portal East 3 m AGL
NOTE: ** AGL = Above Ground Level
Wind profiles as a function of height appropriate for the exposures of the study site were
obtained from the MOE for five years of measured data (from 1996 to 20009). AERMOD
simulations automatically produce a variety of intermediate data for a range of historical wind
speeds and wind directions, on an hour-by-hour basis, to arrive at the worst-case normalized
concentration for each pollutant at each specified receptor.
9 http://www.ene.gov.on.ca/envision/air/regulations/metdata/Central.htm
Delcan Corporation DOTT EA – Air Quality, Noise and Vibration Page 13
An array of approximately 300 receptors, in addition to the 80 used in CAL3QHC, were placed
throughout the downtown core and the University of Ottawa campus. Receptors were placed at
building fresh air intakes, ground level entrances, and at the entrances to underground stations.
Since building fresh air intakes provide air continuously to unsuspecting building occupants,
they are considered to be among the most important and sensitive receptors. A complete set of
air dispersion input and output data from AERMOD is presented in Appendix C.
Normal Operations
Under normal operations of the tunnel, only PM, in the form of brake dust, will be emitted
through the vent shafts. A review of similar tunnel installations indicated that platform
concentrations of PM average 270 micrograms per cubic meter (�g/m3)10. Using this PM
concentration at platform level, together with the design shaft exhaust flow rate of 100 cubic
meters per second (m3/s) for the DOTT11,12 produces an average emission rate of PM at each
ventilation shaft of 0.027 grams per second (g/s) under normal operations. All ventilation shafts
and portals were considered to be emitting PM concurrently and continuously.
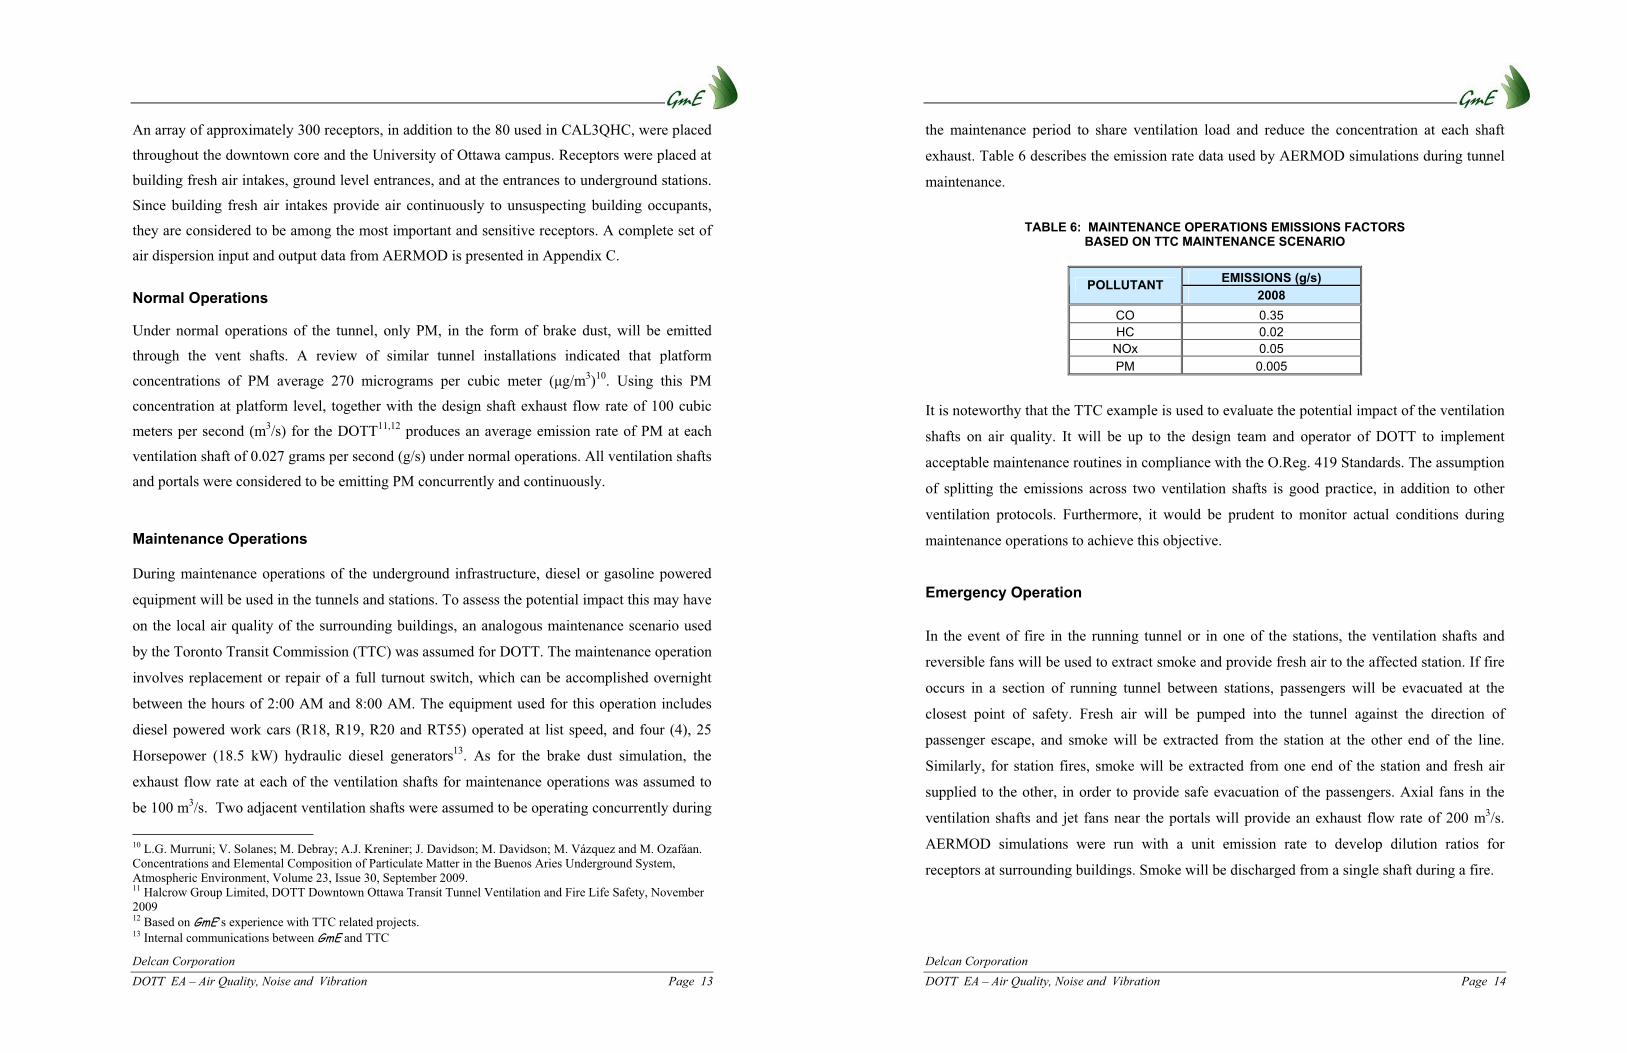
Maintenance Operations During maintenance operations of the underground infrastructure, diesel or gasoline powered
equipment will be used in the tunnels and stations. To assess the potential impact this may have
on the local air quality of the surrounding buildings, an analogous maintenance scenario used
by the Toronto Transit Commission (TTC) was assumed for DOTT. The maintenance operation
involves replacement or repair of a full turnout switch, which can be accomplished overnight
between the hours of 2:00 AM and 8:00 AM. The equipment used for this operation includes
diesel powered work cars (R18, R19, R20 and RT55) operated at list speed, and four (4), 25
Horsepower (18.5 kW) hydraulic diesel generators13. As for the brake dust simulation, the
exhaust flow rate at each of the ventilation shafts for maintenance operations was assumed to
be 100 m3/s. Two adjacent ventilation shafts were assumed to be operating concurrently during
10 L.G. Murruni; V. Solanes; M. Debray; A.J. Kreniner; J. Davidson; M. Davidson; M. Vázquez and M. Ozafáan. Concentrations and Elemental Composition of Particulate Matter in the Buenos Aries Underground System, Atmospheric Environment, Volume 23, Issue 30, September 2009. 11 Halcrow Group Limited, DOTT Downtown Ottawa Transit Tunnel Ventilation and Fire Life Safety, November 2009 12 Based on GmE’s experience with TTC related projects. 13 Internal communications between GmE and TTC
Delcan Corporation DOTT EA – Air Quality, Noise and Vibration Page 14
the maintenance period to share ventilation load and reduce the concentration at each shaft
exhaust. Table 6 describes the emission rate data used by AERMOD simulations during tunnel
maintenance.
TABLE 6: MAINTENANCE OPERATIONS EMISSIONS FACTORS BASED ON TTC MAINTENANCE SCENARIO
EMISSIONS (g/s) POLLUTANT
2008 CO 0.35 HC 0.02 NOx 0.05 PM 0.005
It is noteworthy that the TTC example is used to evaluate the potential impact of the ventilation
shafts on air quality. It will be up to the design team and operator of DOTT to implement
acceptable maintenance routines in compliance with the O.Reg. 419 Standards. The assumption
of splitting the emissions across two ventilation shafts is good practice, in addition to other
ventilation protocols. Furthermore, it would be prudent to monitor actual conditions during
maintenance operations to achieve this objective.
Emergency Operation In the event of fire in the running tunnel or in one of the stations, the ventilation shafts and
reversible fans will be used to extract smoke and provide fresh air to the affected station. If fire
occurs in a section of running tunnel between stations, passengers will be evacuated at the
closest point of safety. Fresh air will be pumped into the tunnel against the direction of
passenger escape, and smoke will be extracted from the station at the other end of the line.
Similarly, for station fires, smoke will be extracted from one end of the station and fresh air
supplied to the other, in order to provide safe evacuation of the passengers. Axial fans in the
ventilation shafts and jet fans near the portals will provide an exhaust flow rate of 200 m3/s.
AERMOD simulations were run with a unit emission rate to develop dilution ratios for
receptors at surrounding buildings. Smoke will be discharged from a single shaft during a fire.

Delcan Corporation DOTT EA – Air Quality, Noise and Vibration Page 15
4.1.4 Bus Terminals and M & S Facility
Future sources of air emissions related to the undertaking include the expanded activities at the
terminal stations (Tunney’s Pasture, Blair and Hurdman), as well as the new Maintenance and
Storage (M & S) Facility. These sites could not be analyzed with any assurance of reasonable
results during the EA phase of the project, due to the lack of design parameters. However,
detailed analysis of impacts and mitigation measures are required during detailed design and
project implementation by the MOE through the Certificate of Approval (C of A) process and
O.Reg 419.
Whereas air pollution impacts of the terminal stations arise from increased bus activities, new
sources of emissions from the M & S Facility could include heating systems, operations (i.e.
welding, painting), and emergency generator testing.
Delcan Corporation DOTT EA – Air Quality, Noise and Vibration Page 16
4.2 Assessment of Airborne Noise From At-Grade Transportation Sources
Airborne noise is defined as any obtrusive sound. It is created at a source, transmitted through a
medium, such as air, and intercepted by a receiver. Noise may be characterized in terms of the
power of the source or the sound pressure at a specific distance. While the power of a source is
characteristic of that source, the sound pressure depends on the location of the receiver and the
path the noise takes to reach the receiver. Its measurement is based on the decibel unit, dBA,
which is a logarithmic ratio referenced to a standard noise level (2×10⁻⁵ Pascals). The ‘A’
suffix refers to a weighting scale, which represents the noise perceived by the human ear. With
this scale, a doubling of power results in a 3 dBA increase in measured noise levels and is just
perceptible to most people. An increase of 10 dBA is often perceived to be twice as loud.
For vehicle traffic, the equivalent sound energy level, LEQ, provides a weighted measure of the
time varying noise levels, which is well correlated with the annoyance of sound. It is defined as
the continuous sound level, which has the same energy as a time varying noise level over a
selected period of time. For roadways, the LEQ is commonly calculated based on a 16-hour
daytime / 8-hour night time split to assess its impact on residential buildings.
The MOE provides guidelines for control of noise produced by human activities14. These
guidelines have been adopted by various municipalities and are incorporated into local noise
by-laws. The City of Ottawa commissioned a comprehensive technical document for the
purpose of assessing and controlling noise impacts within its urban boundary15. In broad terms,
noise sources are classified as either transportation or stationary. Transportation noise sources
include road, rail and aircraft sources. Stationary sources occur within a specified property and
can either be fixed, such as a ventilation shaft, or moving, such as maintenance vehicles at an
industrial facility.
14 Noise Assessment Criteria in Land Use Planning, Publication LU131, Ministry of The Environment, Oct. 1997. 15 City of Ottawa Environmental Noise Control Guidelines, Planning and Growth Management Department, City of Ottawa, April 2006.
Delcan Corporation DOTT EA – Air Quality, Noise and Vibration Page 17
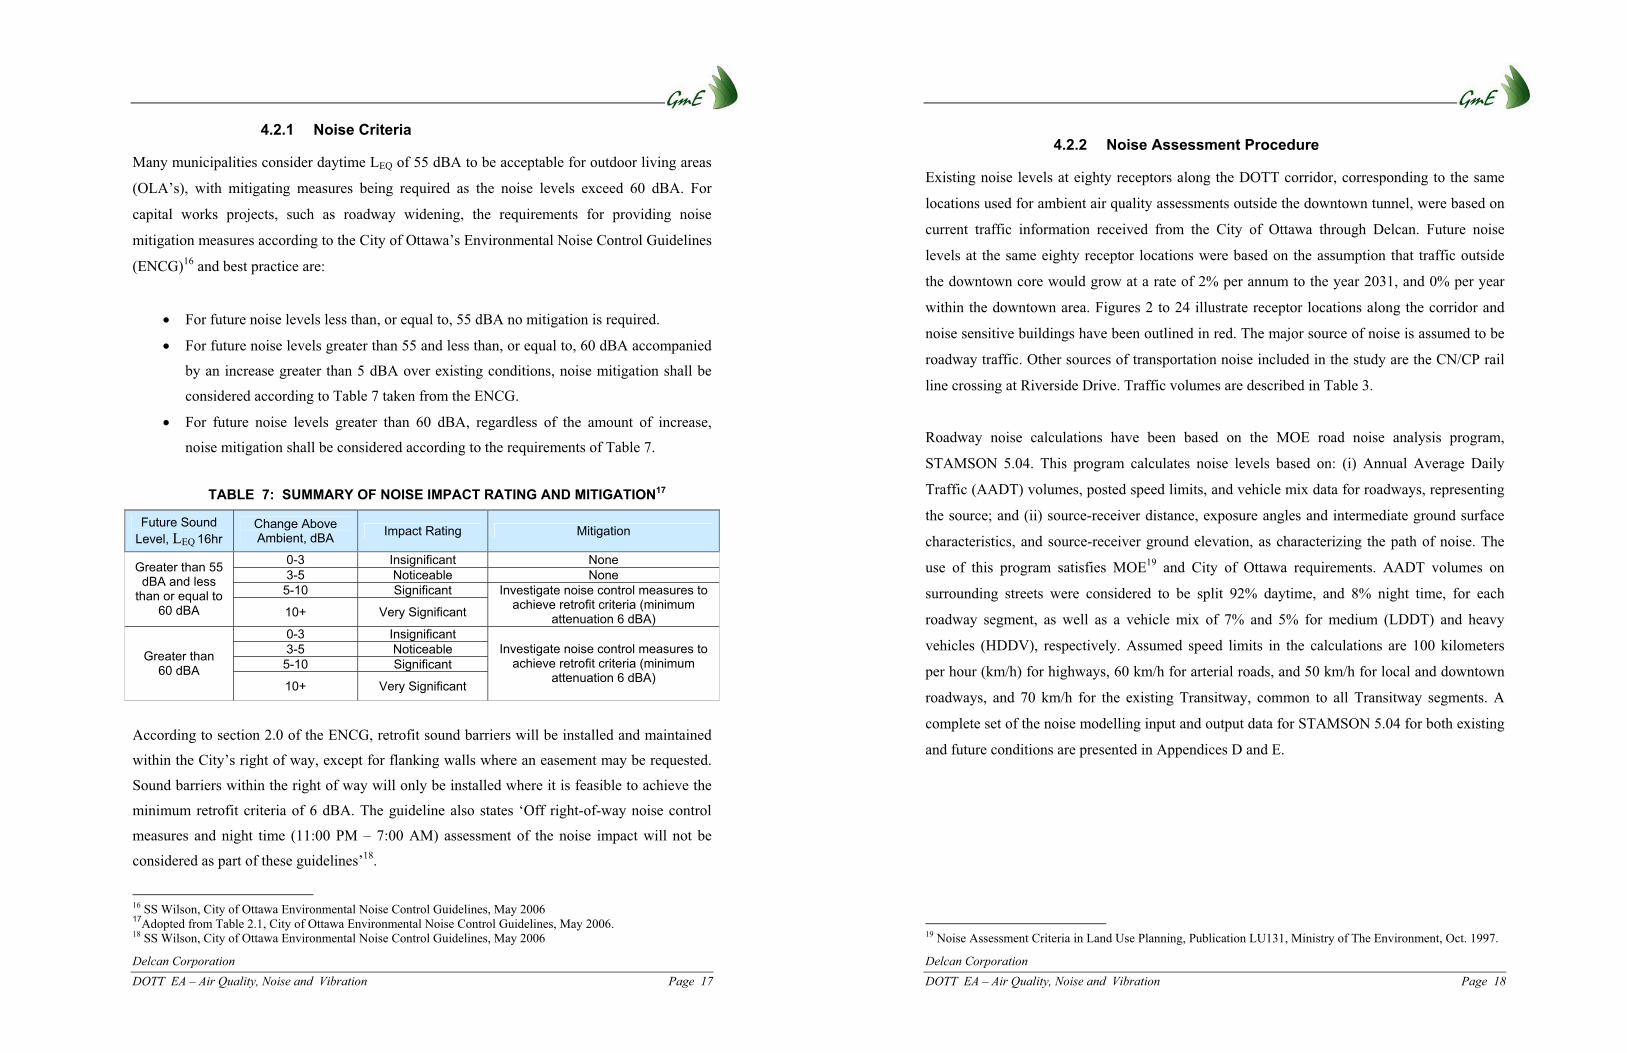
4.2.1 Noise Criteria
Many municipalities consider daytime LEQ of 55 dBA to be acceptable for outdoor living areas
(OLA’s), with mitigating measures being required as the noise levels exceed 60 dBA. For
capital works projects, such as roadway widening, the requirements for providing noise
mitigation measures according to the City of Ottawa’s Environmental Noise Control Guidelines
(ENCG)16 and best practice are:
� For future noise levels less than, or equal to, 55 dBA no mitigation is required.
� For future noise levels greater than 55 and less than, or equal to, 60 dBA accompanied
by an increase greater than 5 dBA over existing conditions, noise mitigation shall be
considered according to Table 7 taken from the ENCG.
� For future noise levels greater than 60 dBA, regardless of the amount of increase,
noise mitigation shall be considered according to the requirements of Table 7.
TABLE 7: SUMMARY OF NOISE IMPACT RATING AND MITIGATION17
Future Sound Level, LEQ 16hr
Change Above Ambient, dBA Impact Rating Mitigation
0-3 Insignificant None 3-5 Noticeable None
5-10 Significant
Greater than 55 dBA and less
than or equal to 60 dBA 10+ Very Significant
Investigate noise control measures to achieve retrofit criteria (minimum
attenuation 6 dBA) 0-3 Insignificant 3-5 Noticeable
5-10 Significant Greater than 60 dBA
10+ Very Significant
Investigate noise control measures to achieve retrofit criteria (minimum
attenuation 6 dBA)
According to section 2.0 of the ENCG, retrofit sound barriers will be installed and maintained
within the City’s right of way, except for flanking walls where an easement may be requested.
Sound barriers within the right of way will only be installed where it is feasible to achieve the
minimum retrofit criteria of 6 dBA. The guideline also states ‘Off right-of-way noise control
measures and night time (11:00 PM – 7:00 AM) assessment of the noise impact will not be
considered as part of these guidelines’18.
16 SS Wilson, City of Ottawa Environmental Noise Control Guidelines, May 2006 17Adopted from Table 2.1, City of Ottawa Environmental Noise Control Guidelines, May 2006. 18 SS Wilson, City of Ottawa Environmental Noise Control Guidelines, May 2006
Delcan Corporation DOTT EA – Air Quality, Noise and Vibration Page 18
4.2.2 Noise Assessment Procedure
Existing noise levels at eighty receptors along the DOTT corridor, corresponding to the same
locations used for ambient air quality assessments outside the downtown tunnel, were based on
current traffic information received from the City of Ottawa through Delcan. Future noise
levels at the same eighty receptor locations were based on the assumption that traffic outside
the downtown core would grow at a rate of 2% per annum to the year 2031, and 0% per year
within the downtown area. Figures 2 to 24 illustrate receptor locations along the corridor and
noise sensitive buildings have been outlined in red. The major source of noise is assumed to be
roadway traffic. Other sources of transportation noise included in the study are the CN/CP rail
line crossing at Riverside Drive. Traffic volumes are described in Table 3.
Roadway noise calculations have been based on the MOE road noise analysis program,
STAMSON 5.04. This program calculates noise levels based on: (i) Annual Average Daily
Traffic (AADT) volumes, posted speed limits, and vehicle mix data for roadways, representing
the source; and (ii) source-receiver distance, exposure angles and intermediate ground surface
characteristics, and source-receiver ground elevation, as characterizing the path of noise. The
use of this program satisfies MOE19 and City of Ottawa requirements. AADT volumes on
surrounding streets were considered to be split 92% daytime, and 8% night time, for each
roadway segment, as well as a vehicle mix of 7% and 5% for medium (LDDT) and heavy
vehicles (HDDV), respectively. Assumed speed limits in the calculations are 100 kilometers
per hour (km/h) for highways, 60 km/h for arterial roads, and 50 km/h for local and downtown
roadways, and 70 km/h for the existing Transitway, common to all Transitway segments. A
complete set of the noise modelling input and output data for STAMSON 5.04 for both existing
and future conditions are presented in Appendices D and E.
19 Noise Assessment Criteria in Land Use Planning, Publication LU131, Ministry of The Environment, Oct. 1997.
Delcan Corporation DOTT EA – Air Quality, Noise and Vibration Page 19
4.2.3 Stationary Noise
Background noise levels in the downtown area will also be influenced by stationary sources
such as building mechanical systems. In theory, new stationary noise sources are subject to an
approval process enforced by the MOE with a maximum noise limit of 50 dBA daytime and
45 dBA night time. As a result, background noise contribution to the total noise environment is
considered to be secondary and has not been specifically considered in this study.
According to the City of Ottawa noise guidelines, the M & S Facility, as well as the current
BRT stations and future LRT stations, are to be considered as stationary noise sources. Other
stationary noise sources to be considered are electrical substations (Traction Power Stations)
and ventilation shafts. However, due to the limited amount of information available at the time
this study was completed, a reliable noise assessment was not possible for these stationary
sources. However, future activity levels around each station are expected to remain similar to
existing conditions. A qualitative analysis for the LRT stations, M & S Facility, portals,
ventilation shafts, and electrical substations is provided in Section 5.2.1. A detailed noise
assessment for these stationary noise sources will be required during the detailed design phase
of the project, once source data at each location are identified.
4.3 Assessment of Ground Vibrations and Ground-Borne Noise
Rail transit systems can produce perceptible levels of ground vibrations, especially when they
are in close proximity to residential neighborhoods. Similar to sound waves in air, vibrations in
solids are generated at a source, propagated through the medium, and intercepted by a receiver.
In the case of ground vibrations, the medium can be uniform, or more often, a complex layering
of soils and rock strata. Also, similar to sound waves in air, ground vibrations produce
perceptible motions and regenerated noise known as ‘ground-borne noise’ when the vibrations
encounter a hollow structure such as a building. Ground-borne noise and vibrations are
generated when there is excitation of the ground, from a train for instance. Repetitive motion of
the wheels on the track causes vibrations to propagate through the soil until they encounter a
building. The vibrations pass along the structure of the building beginning at the foundation
and propagating to all floors. Air inside the building excited by the vibrating walls and floors
Delcan Corporation DOTT EA – Air Quality, Noise and Vibration Page 20
represents regenerated airborne noise. Characteristics of the soil and the building are imparted
to the noise thereby creating a unique noise signature.
Human response to ground vibrations is dependent on the strength of vibrations, which is
measured by the root mean square (RMS) of the movement of a particle on a surface. Typical
units of ground vibration measures are millimeters per second (mm/s), or inch per second (in/s).
Since vibrations can vary over a wide range it is also convenient to represent them in decibel
units, of dBV. In North America it is common practice to use the reference value of one micro-
inch per second (�in/s) to represent vibration levels for this purpose. The threshold level of
human perception to vibrations is about 0.10 mm/s RMS or about 72 dBV. Although
somewhat variable, the threshold of annoyance for continuous vibrations is (1.0 mm/s or
92 dBV), ten times higher than the perception threshold, whereas the threshold for significant
structural damage is (10 mm/s or 112 dBV) at least one hundred times higher than the
annoyance threshold level20. Factors affecting vibrations generated by LRT vehicles running above grade or in tunnels
include: vehicle suspension, wheel and track condition, special track work, track support
systems, speed, transit structure, depth of system underground, and soil conditions, among
other factors. For example, worn tracks and wheel flats are known to increase vibrations
significantly. At grade, rail systems have different frequency components as compared to
subway systems, due to differences in the density and strength of surrounding media among
other parameters. Vibrations in rock are harder to generate but travel farther than vibrations in
soils.
4.3.1 Vibration Criteria
Generic vibration criteria for a variety of building functions have been established based on years of experience and fundamental research performed by the International Standards Organization (ISO) ISO 2631-221, and similar groups. Vibration levels appropriate for different occupancies and equipment are referenced according to the nomenclature adjacent to the line levels in Figure 26. The most demanding levels required in research laboratories are referred to
20 C.D. Dowding, Blast Vibration Monitoring & Control, Prentice Hall, 1985 21 ISO 2631-2 Evaluation of Human Exposure to Whole-Body Vibrations – Part 2: Continuous and Shock-Induced Vibrations In Buildings (1 to 80 Hertz), 1989-02-15

Delcan Corporation DOTT EA – Air Quality, Noise and Vibration Page 21
as Vibration Criteria (VC)-A through VC-E, with VC-A being the least stringent in the group. VC-A is preceded in decreasing order of severity by ‘Operating Theatre’ representing hospitals, ‘Residential’, ‘Office’ and ‘Workshop’ levels. In the United States, the Federal Transportation Authority (FTA) has set vibration criteria for sensitive land use next to transit corridors. Similar standards have been developed by a partnership of MOE and TTC22, which were adopted as the appropriate standard for most buildings along the DOTT corridor. The ISO criteria are included for reference when dealing with highly sensitive equipment common in high-technology manufacturing and some university facilities. Table 9 describes the buildings where vibrations were predicted, their intended land use and vibration criteria.
4.3.2 Assessment Procedure
Existing levels of ground vibrations due to vehicle traffic were determined by field measurements using two Instantel seismographs (Minimate Plus) capable of recording three components of ground velocity, one vertical and two horizontal. Nine measurement sites were selected at sensitive receptors throughout the corridor, as identified in Table 8 (Note, colour separations have been used to improve the readability of the table). At each test location, the seismographs were installed adjacent to the building’s foundation. Figures 2 to 24 illustrate the vibration measurement locations.
TABLE 8: VIBRATION MEASUREMENT LOCATIONS ALONG THE DOTT CORRIDOR
RECEPTOR LOCATION DESCRIPTION LAND USE
A Townhouse, 231 Forward Avenue Residential
B ODAWA Cultural Centre, 12 Stirling Avenue Institutional
C Park Square Condom, 151 Bay Street Apartment Buildings
D South Side of Sun Life Building, 99 Bank Street Commercial
E North Side of Sun Life Building, 99 Bank Street Commercial
F National Arts Centre, 53 Elgin Street Institutional
G Les Suites Hotel, 130 Besserer Street Apartment Building
H SITE Building, University of Ottawa Sensitive Building
I Single Detached Home, 388 Tremblay Road Residential
22 MOEE/TTC Protocol for Nonie and Vibration Assessment for the Proposed Yonge-Spadina Subway Loop, June 16, 1993
Delcan Corporation DOTT EA – Air Quality, Noise and Vibration Page 22
Potential vibration impacts of the proposed LRT system were predicted using the FTA’s
‘Transit Noise and Vibration Impact Assessment’23 protocol. The FTA general vibration
assessment is based on an upper bound generic set of curves that show vibration level
attenuation with distance. These curves, illustrated in Figure 27, are based on ground vibration
measurements at various transit systems throughout North America. Vibration levels at points
of reception are adjusted by various factors to incorporate known characteristics of the system
being analyzed; such as operating speed of vehicle, conditions of the track, construction of the
track and tunnel; depth and geology of the soil; as well as the structural type of the impacted
building structures. The analysis accounted for worn track or special track work which, although
considered to have equal impacts on noise and ground vibrations, are not considered to be
additive. The validity of the FTA method was confirmed by comparisons with empirical
seismic attenuation information developed by Dobrin and Savit (1988)24, using analogous
source data from Parramatta Rail Link25, New South Wales, Australia. Both the Parramatta Rail
Link and the DOTT incorporate a tunnel through limestone bedrock. Vibration levels of the
Parramatta Rail Link are presented in Figure 28.
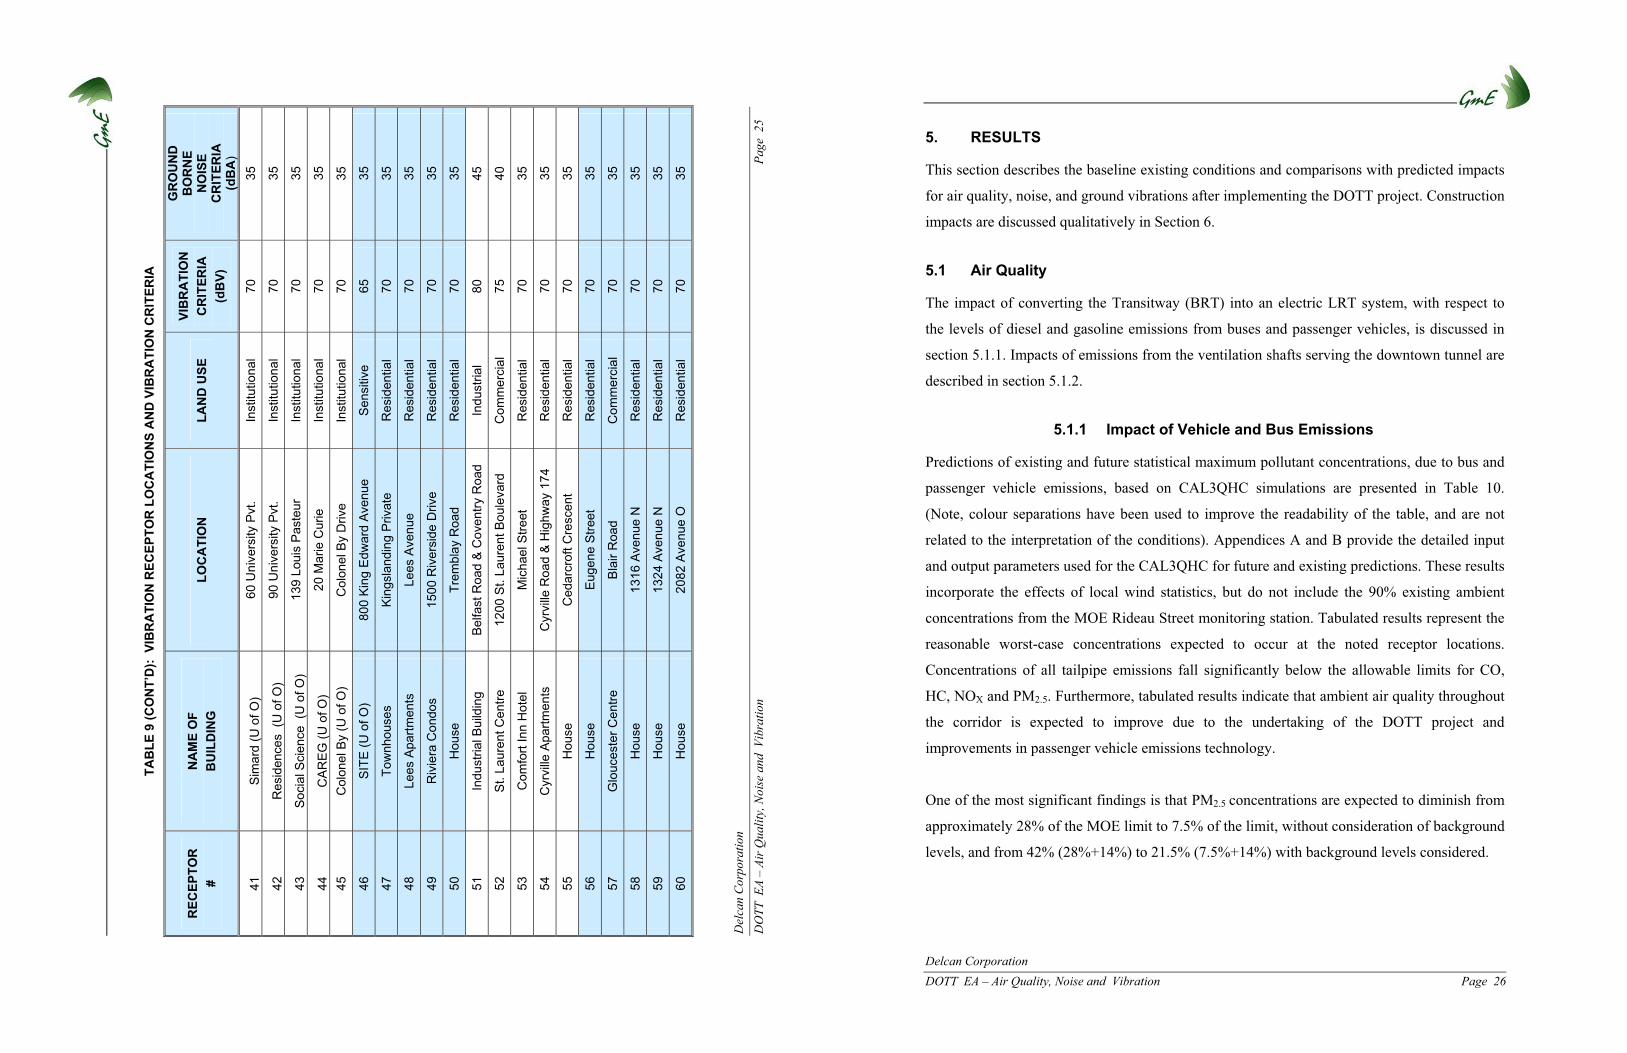
Future vibration predictions were carried out at 60 reprehensive receptor locations, described in
Table 9 and illustrated in Figures 2 to 24, throughout the corridor. (Note, colour separations
have been used to improve the readability of the table, and are not related to the interpretation
of the conditions). Sensitivity of buildings to vibrations, and therefore allowable levels of
motion, is dependent upon intended use. All vibration sensitive buildings throughout the
corridor are highlighted in red in Figures 2 to 24.
23 C. E. Hanson; D. A. Towers; and L. D. Meister, Transit Noise and Vibration Impact Assessment, Federal Transit Administration, May 2006. 24 Dobrin and Savit , Applied Geophysics (1988) 25 D. Roberts; B. Murray, Parramatta Rail Link – The Approach to Controlling Train Regenerated Noise & Vibration, Conference on Railway Engineering, Darwin 20-23 June 2004

Del
can
Corp
orat
ion
DO
TT E
A –
Air Q
ualit
y, N
oise
and
Vib
ratio
n
Page
23
TAB
LE 9
: VI
BR
ATI
ON
REC
EPTO
R L
OC
ATI
ON
S A
ND
VIB
RA
TIO
N C
RIT
ERIA
REC
EPTO
R
# N
AM
E O
F B
UIL
DIN
G
LOC
ATI
ON
LA
ND
USE
VI
BR
ATI
ON
C
RIT
ERIA
(d
BV)
GR
OU
ND
B
OR
NE
NO
ISE
CR
ITER
IA
(dB
A)
1 H
ouse
S
cott
Stre
et a
t Car
olin
e A
venu
e R
esid
entia
l 70
35
2 Tu
nney
's P
astu
re
Sco
tt S
treet
& H
olla
nd A
venu
e C
omm
erci
al
75
40
3 H
ouse
S
cott
Stre
et &
Par
kdal
e Av
enue
R
esid
entia
l 70
35
4 A
partm
ent B
uild
ing
231
Par
kdal
e A
venu
e R
esid
entia
l 70
35
5 O
DAW
A N
ativ
e C
entre
12
Stir
ling
Ave
nue
Inst
itutio
nal
70
35
6R
ussi
an O
rthod
ox C
hurc
h S
tone
hurs
t Ave
nue
Inst
itutio
nal
7035
7H
ouse
S
cott
Stre
et &
Gar
land
Stre
et
Res
iden
tial
7035
8To
wnh
ouse
s S
cott
Stre
et &
Cha
mpa
gne
Ave
. R
esid
entia
l 70
35
9To
wnh
ouse
s A
lber
t Stre
et &
Em
pres
s S
treet
R
esid
entia
l 70
35
10C
larid
ge C
ondo
min
ium
s Fl
eet S
treet
R
esid
entia
l 70
35
11
The
Gar
dens
81
Bro
nson
Ave
nue
Res
iden
tial
70
35
12
Alb
ert a
t Bay
, Sui
te H
otel
47
3 A
lber
t Stre
et
Res
iden
tial
70
35
13
Otta
wa
Tech
nica
l HS
44
0 A
lber
t Stre
et
Inst
itutio
nal
70
35
14
Dor
al In
n 48
6 A
lber
t Stre
et
Res
iden
tial
70
35
15
Chr
ist C
hurc
h C
athe
dral
43
9 Q
ueen
Stre
et
Inst
ruct
iona
l 70
35
16P
ark
Squ
are
Con
do
151
Bay
Stre
et
Res
iden
tial
7035
17C
row
n Pl
aza
Hot
el
101
Lyon
Stre
et
Res
iden
tial
7035
18C
onst
itutio
n S
quar
e P
h III
35
0 A
lber
t Stre
et
Com
mer
cial
75
40
19P
lace
De
Ville
Tow
er A
& B
32
0 Q
ueen
Stre
et
Com
mer
cial
75
40
20E
ldor
ado
Nuc
lear
Bui
ldin
g 25
5 A
lber
t Stre
et
Com
mer
cial
75
40
Del
can
Corp
orat
ion
DO
TT E
A –
Air Q
ualit
y, N
oise
and
Vib
ratio
n
Page
24
TAB
LE 9
(CO
NT’
D):
VIB
RA
TIO
N R
ECEP
TOR
LO
CA
TIO
NS
AN
D V
IBR
ATI
ON
CR
ITER
IA
REC
EPTO
R
# N
AM
E O
F B
UIL
DIN
G
LOC
ATI
ON
LA
ND
USE
VI
BR
ATI
ON
C
RIT
ERIA
(d
BV)
GR
OU
ND
B
OR
NE
NO
ISE
CR
ITER
IA
(dB
A)
21
Cap
ital S
quar
e 22
2 Q
ueen
Stre
et
Com
mer
cial
75
40
22
Sun
-Life
Bui
ldin
g 99
Ban
k S
treet
C
omm
erci
al
75
40
23
CB
C R
adio
Can
ada
181
Que
en S
treet
S
ensi
tive
65
30
24
Wor
ld E
xcha
nge
Pla
za
45 O
'Con
nor S
treet
C
omm
erci
al
75
40
25
Her
itage
Pla
ce
155
Que
en S
treet
C
omm
erci
al
75
40
2613
1 Q
ueen
**
131
Que
en S
treet
C
omm
erci
al
7540
27D
'Arc
y M
cGee
Bui
ldin
g 90
Spa
rks
Stre
et
Com
mer
cial
75
40
28Th
e C
ham
bers
51
Que
en S
treet
C
omm
erci
al
7540
29C
entra
l Pos
t O
ffice
47
Spa
rks
Stre
et
Com
mer
cial
75
40
30N
AC
53 E
lgin
Stre
et
Sen
sitiv
e65
30
31
Gov
’t C
onfe
renc
e C
entre
2
Rid
eau
Stre
et
Com
mer
cial
75
40
32
Frie
man
Mal
l 96
Spa
rks
Stre
et
Com
mer
cial
75
40
33
Rid
eau
Cen
tre
50 R
idea
u S
treet
C
omm
erci
al
75
40
34
Wes
tin H
otel
11
Col
onel
By
Driv
e R
esid
ence
s 70
35
35
Les
Sui
tes
Hot
el
130
Bes
sere
r Stre
et
Res
iden
ces
70
35
36O
ttaw
a A
rt G
alle
ry2
Dal
y A
venu
e C
omm
erci
al
7540
37H
oste
l (O
ld J
ail)
75 N
icho
las
Stre
et
Res
iden
tial
7035
38S
tew
art H
all (
U o
f O)
1 S
tew
art S
treet
In
stitu
tiona
l70
35
39D
esm
arai
s (U
of O
) 55
Lau
rier A
venu
e In
stitu
tiona
l70
35
40La
urie
r Tow
ers
50 L
aurie
r Ave
nue
Res
iden
tial
7035
Del
can
Corp
orat
ion
DO
TT E
A –
Air Q
ualit
y, N
oise
and
Vib
ratio
n
Page
25
TA
BLE
9 (C
ON
T’D
): V
IBR
ATI
ON
REC
EPTO
R L
OC
ATI
ON
S A
ND
VIB
RA
TIO
N C
RIT
ERIA
REC
EPTO
R
# N
AM
E O
F B
UIL
DIN
G
LOC
ATI
ON
LA
ND
USE
VI
BR
ATI
ON
C
RIT
ERIA
(d
BV)
GR
OU
ND
B
OR
NE
NO
ISE
CR
ITER
IA
(dB
A)
41
Sim
ard
(U o
f O)
60 U
nive
rsity
Pvt
. In
stitu
tiona
l 70
35
42
Res
iden
ces
(U o
f O)
90 U
nive
rsity
Pvt
. In
stitu
tiona
l 70
35
43
Soc
ial S
cien
ce (
U o
f O)
139
Loui
s P
aste
ur
Inst
itutio
nal
70
35
44
CA
RE
G (U
of O
) 20
Mar
ie C
urie
In
stitu
tiona
l 70
35
45
Col
onel
By
(U o
f O)
Col
onel
By
Driv
e In
stitu
tiona
l 70
35
46S
ITE
(U o
f O)
800
Kin
g E
dwar
d A
venu
e S
ensi
tive
6535
47To
wnh
ouse
s K
ings
land
ing
Priv
ate
Res
iden
tial
7035
48Le
es A
partm
ents
Le
es A
venu
e R
esid
entia
l 70
35
49R
ivie
ra C
ondo
s 15
00 R
iver
side
Driv
e R
esid
entia
l 70
35
50H
ouse
Tr
embl
ay R
oad
Res
iden
tial
7035
51
Indu
stria
l Bui
ldin
g B
elfa
st R
oad
& C
oven
try R
oad
Indu
stria
l 80
45
52
St.
Laur
ent C
entre
12
00 S
t. La
uren
t Bou
leva
rd
Com
mer
cial
75
40
53
Com
fort
Inn
Hot
el
Mic
hael
Stre
et
Res
iden
tial
70
35
54
Cyr
ville
Apa
rtmen
ts
Cyr
ville
Roa
d &
Hig
hway
174
R
esid
entia
l 70
35
55
Hou
se
Ced
arcr
oft C
resc
ent
Res
iden
tial
70
35
56H
ouse
E
ugen
e S
treet
R
esid
entia
l 70
35
57G
louc
este
r Cen
tre
Bla
ir R
oad
Com
mer
cial
70
35
58H
ouse
13
16 A
venu
e N
R
esid
entia
l 70
35
59H
ouse
13
24 A
venu
e N
R
esid
entia
l 70
35
60H
ouse
20
82 A
venu
e O
R
esid
entia
l 70
35
Delcan Corporation DOTT EA – Air Quality, Noise and Vibration Page 26
5. RESULTS
This section describes the baseline existing conditions and comparisons with predicted impacts
for air quality, noise, and ground vibrations after implementing the DOTT project. Construction
impacts are discussed qualitatively in Section 6.
5.1 Air Quality
The impact of converting the Transitway (BRT) into an electric LRT system, with respect to
the levels of diesel and gasoline emissions from buses and passenger vehicles, is discussed in
section 5.1.1. Impacts of emissions from the ventilation shafts serving the downtown tunnel are
described in section 5.1.2.
5.1.1 Impact of Vehicle and Bus Emissions
Predictions of existing and future statistical maximum pollutant concentrations, due to bus and
passenger vehicle emissions, based on CAL3QHC simulations are presented in Table 10.
(Note, colour separations have been used to improve the readability of the table, and are not
related to the interpretation of the conditions). Appendices A and B provide the detailed input
and output parameters used for the CAL3QHC for future and existing predictions. These results
incorporate the effects of local wind statistics, but do not include the 90% existing ambient
concentrations from the MOE Rideau Street monitoring station. Tabulated results represent the
reasonable worst-case concentrations expected to occur at the noted receptor locations.
Concentrations of all tailpipe emissions fall significantly below the allowable limits for CO,
HC, NOX and PM2.5. Furthermore, tabulated results indicate that ambient air quality throughout
the corridor is expected to improve due to the undertaking of the DOTT project and
improvements in passenger vehicle emissions technology.
One of the most significant findings is that PM2.5 concentrations are expected to diminish from
approximately 28% of the MOE limit to 7.5% of the limit, without consideration of background
levels, and from 42% (28%+14%) to 21.5% (7.5%+14%) with background levels considered.

Delcan Corporation DOTT EA – Air Quality, Noise and Vibration Page 27
TABLE 10: PREDICTED POLLUTANT CONCENTRATIONS FOR EXISTING VERSUS FUTURE CONDITIONS, WIND PROBABILITIES ARE CONSIDERED
CONCENTRATION (mg/m3)
CO (1HR) HC (24 HR) NOX (1 HR) PM2.5 (24 HR) RECEPTOR
existing future existing future existing future existing future 1 204.6 205.1 5.5 5.9 56.8 12.0 2.5 1.1 2 155.4 92.6 4.0 2.9 40.2 7.4 1.8 0.5 3 402.3 305.9 10.4 8.6 78.1 14.2 3.8 1.5 4 117.9 48.7 3.0 1.7 31.3 6.8 1.4 0.4 5 599.3 314.7 15.9 9.2 67.4 14.0 3.3 1.4 6 303.8 232.3 8.4 6.8 41.4 10.9 1.7 1.17 255.7 212.0 7.3 7.9 55.7 34.5 1.7 2.18 81.2 102.0 2.5 3.2 21.4 6.6 0.5 0.69 101.1 141.1 3.2 5.7 41.8 31.9 0.7 1.8
10 122.7 263.1 4.3 7.8 34.0 12.4 0.6 1.211 55.4 75.7 1.8 2.4 17.0 5.5 0.3 0.4 12 60.9 70.5 1.9 2.5 20.6 9.8 0.4 0.6 13 81.1 134.3 2.7 5.5 42.8 31.4 0.6 1.8 14 108.5 226.0 3.8 6.8 32.2 12.2 0.6 1.1 15 65.1 104.1 2.1 3.6 19.6 13.5 0.4 0.9 16 105.2 165.7 3.4 5.3 27.1 14.6 0.6 1.117 118.3 62.0 3.5 2.5 30.6 7.1 1.2 0.418 131.6 73.4 3.9 2.8 32.4 7.3 1.2 0.519 84.2 46.8 2.4 1.7 21.6 4.7 0.9 0.420 129.3 73.1 3.8 2.8 31.4 7.0 1.3 0.421 64.6 32.1 1.7 1.0 17.2 3.1 0.7 0.2 22 331.1 226.4 9.3 7.1 41.8 13.4 1.9 1.2 23 674.0 420.5 18.6 13.2 62.1 25.9 3.1 2.2 24 175.6 77.7 5.0 2.3 21.9 3.7 1.0 0.3 25 62.8 53.6 1.7 1.7 14.9 4.0 0.6 0.3 26 416.7 175.0 11.4 5.0 21.8 5.0 1.3 0.627 107.8 46.3 2.9 1.3 5.9 1.3 0.3 0.128 173.0 81.5 5.2 2.6 13.0 2.9 0.5 0.229 198.7 83.1 5.3 2.4 10.2 2.4 0.6 0.330 280.8 120.3 7.8 3.5 15.9 3.7 0.8 0.431 371.9 156.5 10.2 4.5 19.7 4.5 1.1 0.5 32 232.0 99.2 6.5 3.0 13.5 3.1 0.7 0.3 33 263.5 76.4 7.1 2.6 42.6 5.6 2.1 0.4 34 199.8 54.4 5.5 2.0 39.4 4.2 1.8 0.2 35 680.5 143.0 18.6 5.7 205.3 8.3 8.0 0.4 36 679.0 118.0 18.0 4.7 194.3 6.8 8.4 0.337 510.0 114.0 14.1 4.5 162.3 6.3 6.0 0.338 412.1 76.9 10.8 3.1 110.4 4.4 5.1 0.239 367.2 120.4 10.5 4.8 88.4 6.6 4.0 0.340 184.0 82.4 5.6 3.3 43.9 4.6 1.7 0.2
Delcan Corporation DOTT EA – Air Quality, Noise and Vibration Page 28
TABLE 10 (CONT’D): PREDICTED POLLUTANT CONCENTRATIONS FOR EXISTING VERSUS FUTURE CONDITIONS, WIND PROBABILITIES ARE CONSIDERED
CONCENTRATION (mg/m3)
CO HC NOX PM2.5RECEPTOR existing future existing future existing future existing future
41 440.1 232.6 14.1 9.3 99.8 12.5 3.7 0.7 43 239.8 101.9 7.3 4.1 62.9 5.6 2.3 0.3 44 633.2 132.9 17.0 5.4 178.5 7.3 7.8 0.3 45 156.4 75.3 4.5 2.8 46.2 8.0 1.6 0.4 46 207.9 88.0 5.6 3.0 61.7 8.8 2.4 0.547 209.9 129.8 5.8 4.1 53.7 8.5 2.1 0.748 251.8 201.9 7.4 6.3 40.2 9.2 1.6 0.849 198.9 142.7 5.8 4.5 52.8 7.9 1.9 0.750 423.7 363.6 12.4 11.1 76.1 16.9 3.4 1.751 525.1 126.9 14.0 4.9 130.7 7.1 6.4 0.4 52 445.6 305.8 14.5 11.2 75.3 14.5 2.4 1.0 53 231.8 165.0 7.9 6.5 48.0 8.9 1.4 0.5 54 251.9 221.8 9.5 8.8 52.3 12.0 1.1 0.6 55 193.8 152.1 6.9 6.0 39.7 8.2 1.1 0.4 56 246.9 231.5 9.5 9.2 46.6 12.4 0.9 0.757 231.1 221.1 9.0 8.8 39.9 11.9 0.8 0.658 455.4 412.4 17.9 16.5 76.2 22.2 1.5 1.259 191.4 173.4 7.2 6.9 32.9 9.2 0.7 0.560 213.2 173.0 7.3 6.5 30.9 8.5 0.9 0.561 483.9 349.3 17.5 14.0 87.7 18.7 2.6 1.0 62 187.6 143.9 6.6 5.7 35.3 7.8 1.1 0.4 63 300.1 295.3 11.2 11.8 53.1 15.9 1.4 0.8 64 353.0 166.9 10.6 6.7 75.1 9.0 3.4 0.5 65 232.5 137.3 7.4 5.5 47.1 7.4 1.9 0.4 66 106.1 98.0 3.9 3.9 19.1 5.6 0.5 0.367 96.0 86.4 3.5 3.5 17.2 5.1 0.4 0.268 140.1 142.1 5.4 5.8 24.1 9.2 0.5 0.569 133.3 133.6 5.1 5.4 23.0 9.4 0.5 0.570 182.5 180.3 7.1 7.3 30.8 11.3 0.6 0.6
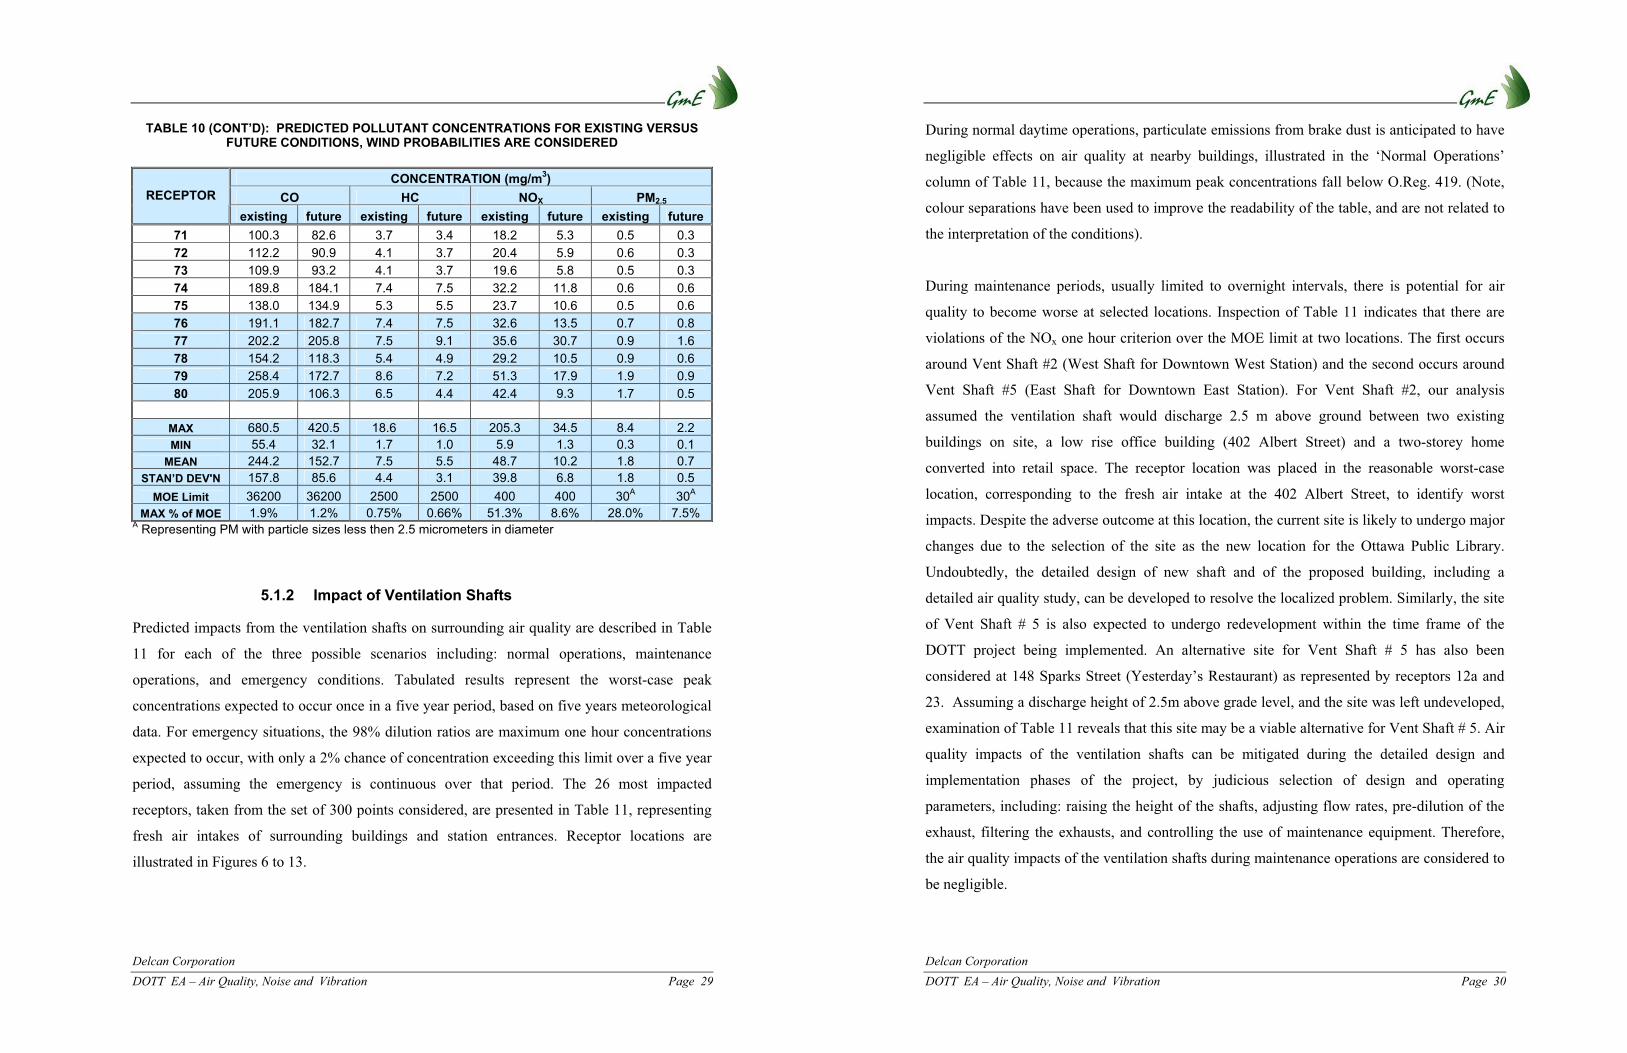
Delcan Corporation DOTT EA – Air Quality, Noise and Vibration Page 29
TABLE 10 (CONT’D): PREDICTED POLLUTANT CONCENTRATIONS FOR EXISTING VERSUS FUTURE CONDITIONS, WIND PROBABILITIES ARE CONSIDERED
CONCENTRATION (mg/m3)
CO HC NOX PM2.5RECEPTOR existing future existing future existing future existing future
71 100.3 82.6 3.7 3.4 18.2 5.3 0.5 0.3 72 112.2 90.9 4.1 3.7 20.4 5.9 0.6 0.3 73 109.9 93.2 4.1 3.7 19.6 5.8 0.5 0.3 74 189.8 184.1 7.4 7.5 32.2 11.8 0.6 0.6 75 138.0 134.9 5.3 5.5 23.7 10.6 0.5 0.6 76 191.1 182.7 7.4 7.5 32.6 13.5 0.7 0.877 202.2 205.8 7.5 9.1 35.6 30.7 0.9 1.678 154.2 118.3 5.4 4.9 29.2 10.5 0.9 0.679 258.4 172.7 8.6 7.2 51.3 17.9 1.9 0.980 205.9 106.3 6.5 4.4 42.4 9.3 1.7 0.5
MAX 680.5 420.5 18.6 16.5 205.3 34.5 8.4 2.2MIN 55.4 32.1 1.7 1.0 5.9 1.3 0.3 0.1
MEAN 244.2 152.7 7.5 5.5 48.7 10.2 1.8 0.7STAN’D DEV'N 157.8 85.6 4.4 3.1 39.8 6.8 1.8 0.5
MOE Limit 36200 36200 2500 2500 400 400 30A 30A
MAX % of MOE 1.9% 1.2% 0.75% 0.66% 51.3% 8.6% 28.0% 7.5%A Representing PM with particle sizes less then 2.5 micrometers in diameter
5.1.2 Impact of Ventilation Shafts
Predicted impacts from the ventilation shafts on surrounding air quality are described in Table
11 for each of the three possible scenarios including: normal operations, maintenance
operations, and emergency conditions. Tabulated results represent the worst-case peak
concentrations expected to occur once in a five year period, based on five years meteorological
data. For emergency situations, the 98% dilution ratios are maximum one hour concentrations
expected to occur, with only a 2% chance of concentration exceeding this limit over a five year
period, assuming the emergency is continuous over that period. The 26 most impacted
receptors, taken from the set of 300 points considered, are presented in Table 11, representing
fresh air intakes of surrounding buildings and station entrances. Receptor locations are
illustrated in Figures 6 to 13.
Delcan Corporation DOTT EA – Air Quality, Noise and Vibration Page 30
During normal daytime operations, particulate emissions from brake dust is anticipated to have
negligible effects on air quality at nearby buildings, illustrated in the ‘Normal Operations’
column of Table 11, because the maximum peak concentrations fall below O.Reg. 419. (Note,
colour separations have been used to improve the readability of the table, and are not related to
the interpretation of the conditions).
During maintenance periods, usually limited to overnight intervals, there is potential for air
quality to become worse at selected locations. Inspection of Table 11 indicates that there are
violations of the NOx one hour criterion over the MOE limit at two locations. The first occurs
around Vent Shaft #2 (West Shaft for Downtown West Station) and the second occurs around
Vent Shaft #5 (East Shaft for Downtown East Station). For Vent Shaft #2, our analysis
assumed the ventilation shaft would discharge 2.5 m above ground between two existing
buildings on site, a low rise office building (402 Albert Street) and a two-storey home
converted into retail space. The receptor location was placed in the reasonable worst-case
location, corresponding to the fresh air intake at the 402 Albert Street, to identify worst
impacts. Despite the adverse outcome at this location, the current site is likely to undergo major
changes due to the selection of the site as the new location for the Ottawa Public Library.
Undoubtedly, the detailed design of new shaft and of the proposed building, including a
detailed air quality study, can be developed to resolve the localized problem. Similarly, the site
of Vent Shaft # 5 is also expected to undergo redevelopment within the time frame of the
DOTT project being implemented. An alternative site for Vent Shaft # 5 has also been
considered at 148 Sparks Street (Yesterday’s Restaurant) as represented by receptors 12a and
23. Assuming a discharge height of 2.5m above grade level, and the site was left undeveloped,
examination of Table 11 reveals that this site may be a viable alternative for Vent Shaft # 5. Air
quality impacts of the ventilation shafts can be mitigated during the detailed design and
implementation phases of the project, by judicious selection of design and operating
parameters, including: raising the height of the shafts, adjusting flow rates, pre-dilution of the
exhaust, filtering the exhausts, and controlling the use of maintenance equipment. Therefore,
the air quality impacts of the ventilation shafts during maintenance operations are considered to
be negligible.
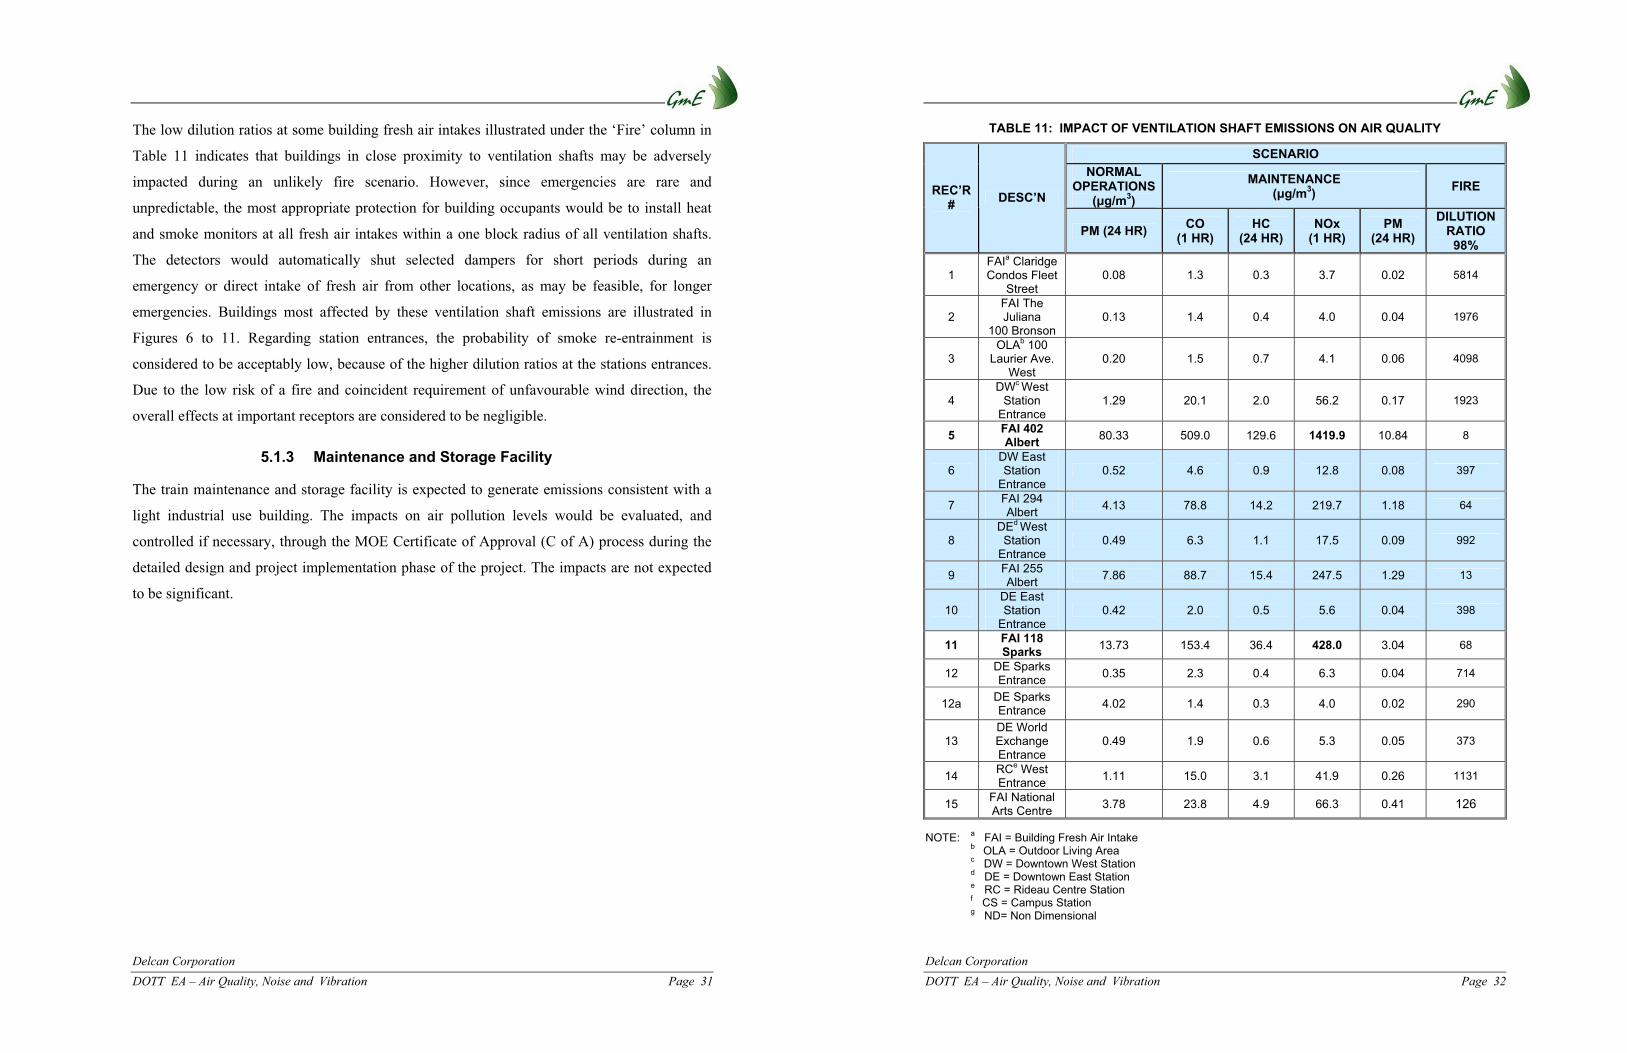
Delcan Corporation DOTT EA – Air Quality, Noise and Vibration Page 31
The low dilution ratios at some building fresh air intakes illustrated under the ‘Fire’ column in
Table 11 indicates that buildings in close proximity to ventilation shafts may be adversely
impacted during an unlikely fire scenario. However, since emergencies are rare and
unpredictable, the most appropriate protection for building occupants would be to install heat
and smoke monitors at all fresh air intakes within a one block radius of all ventilation shafts.
The detectors would automatically shut selected dampers for short periods during an
emergency or direct intake of fresh air from other locations, as may be feasible, for longer
emergencies. Buildings most affected by these ventilation shaft emissions are illustrated in
Figures 6 to 11. Regarding station entrances, the probability of smoke re-entrainment is
considered to be acceptably low, because of the higher dilution ratios at the stations entrances.
Due to the low risk of a fire and coincident requirement of unfavourable wind direction, the
overall effects at important receptors are considered to be negligible.
5.1.3 Maintenance and Storage Facility
The train maintenance and storage facility is expected to generate emissions consistent with a
light industrial use building. The impacts on air pollution levels would be evaluated, and
controlled if necessary, through the MOE Certificate of Approval (C of A) process during the
detailed design and project implementation phase of the project. The impacts are not expected
to be significant.
Delcan Corporation DOTT EA – Air Quality, Noise and Vibration Page 32
TABLE 11: IMPACT OF VENTILATION SHAFT EMISSIONS ON AIR QUALITY
SCENARIO NORMAL
OPERATIONS(�g/m3)
MAINTENANCE (�g/m3) FIRE REC’R
# DESC’N
PM (24 HR) CO (1 HR)
HC (24 HR)
NOx (1 HR)
PM (24 HR)
DILUTION RATIO
98%
1FAIa Claridge Condos Fleet
Street0.08 1.3 0.3 3.7 0.02 5814
2FAI The Juliana
100 Bronson 0.13 1.4 0.4 4.0 0.04 1976
3OLAb 100
Laurier Ave. West
0.20 1.5 0.7 4.1 0.06 4098
4DWc West
StationEntrance
1.29 20.1 2.0 56.2 0.17 1923
5 FAI 402 Albert 80.33 509.0 129.6 1419.9 10.84 8
6DW East Station
Entrance0.52 4.6 0.9 12.8 0.08 397
7 FAI 294 Albert 4.13 78.8 14.2 219.7 1.18 64
8DEd WestStation
Entrance0.49 6.3 1.1 17.5 0.09 992
9 FAI 255 Albert 7.86 88.7 15.4 247.5 1.29 13
10DE East Station
Entrance0.42 2.0 0.5 5.6 0.04 398
11 FAI 118 Sparks 13.73 153.4 36.4 428.0 3.04 68
12 DE Sparks Entrance 0.35 2.3 0.4 6.3 0.04 714
12a DE Sparks Entrance 4.02 1.4 0.3 4.0 0.02 290
13DE World Exchange Entrance
0.49 1.9 0.6 5.3 0.05 373
14 RCe West Entrance 1.11 15.0 3.1 41.9 0.26 1131
15 FAI National Arts Centre 3.78 23.8 4.9 66.3 0.41 126
NOTE: a FAI = Building Fresh Air Intake
b OLA = Outdoor Living Area c DW = Downtown West Station d DE = Downtown East Station e RC = Rideau Centre Station f CS = Campus Station g ND= Non Dimensional

Delcan Corporation DOTT EA – Air Quality, Noise and Vibration Page 33
TABLE 11 (CONT’D): IMPACT OF VENTILATION SHAFT EMISSIONS ON AIR QUALITY
SCENARIO NORMAL
OPERATIONS(�g/m3)
MAINTENANCE (�g/m3)
FIRE (ND) REC’R
# DESC’N
PM (24 HR) CO (1 HR)
HC (24 HR)
NOx (1 HR)
PM (24 HR)
DILUTION RATIO
98%
16 FAIa 51 Queen 3.42 27.7 5.5 77.4 0.46 50
17
RCe East Entrance
(Government Conference
Centre)
0.41 6.0 0.8 16.7 0.06 1534
18 FAI Rideau Centre 6.72 105.5 21.5 294.4 1.80 583
19CSf North
StationEntrance
1.53 8.9 2.2 24.9 0.18 379
20 FAI on Residences 11.61 94.1 22.0 262.4 1.84 10
21CS South
StationEntrance
0.28 6.3 0.7 17.7 0.06 3650
22 FAI Marion (U of O) 7.64 10.2 11.2 28.4 0.94 42
23FAI
Yesterday'sRestaurant
11.12 1.7 0.3 4.8 0.03 14
24 FAI SITE(U of O) 0.14 1.9 0.5 5.3 0.04 5495
25 FAI Athletics (U of O) 0.09 1.9 0.3 5.3 0.03 9259
26 FAI Lees Apartments 0.11 1.3 0.4 3.8 0.03 1176
Max 80.33 509.0 129.6 1419.9 10.84 N/AMOE Limit 120 6000 7500 400 120 N/A
% of MOE LIMIT 66% 12% 1.7% 354% 9% N/A NOTE: a FAI = Building Fresh Air Intake
b OLA = Outdoor Living Area c DW = Downtown West Station d DE = Downtown East Station e RC = Rideau Centre Station f CS = Campus Station g ND= Non Dimensional
Delcan Corporation DOTT EA – Air Quality, Noise and Vibration Page 34
5.2 Airborne Noise From At-Grade Transportation Sources
Existing and future noise levels due to vehicle traffic along the DOTT corridor are summarized
in Table 12 for daytime (7:00 AM to 11:00 PM) and Table 13 for night time (11:00 PM to
7:00 AM) periods. (Note, colour separations have been used to improve the readability of the
table, and are not related to the interpretation of the conditions). Appropriate contributions to
noise levels by the existing BRT and proposed LRT system have also been included for
existing and future conditions respectively. Various columns in Tables 12 and 13 show the
change in noise levels for both total noise levels and contributions due to the Transitway from
both BRT and LRT. Appendices D and E provide the detailed input parameters and calculation
results from STAMSON 5.04 for existing and future conditions.
The average change in noise levels over existing conditions ranges from a decrease of 4 dBA to
an increase of 6 dBA. Since existing and future noise levels are dominated primarily by
surrounding roadways, such as Highway 417 and Scott Street, the impact of the proposed LRT
will be imperceptible at most noise sensitive areas.
According to the City of Ottawa ENCG, mitigation should be investigated and implemented
where feasible when future daytime noise levels exceed 60 dBA, or when there is a change of
more than 5 dBA and future noise levels exceed 55 dBA as per Table 7. However, since noise
over most of the DOTT corridor is dominated by existing sources, such as Highway 417, there
is no benefit to mitigating noise along the LRT. As such, the rules of the ENCG in Table 7 are
adapted to apply for the LRT alone, when the LRT is an equal or higher source of noise at a
given sensitive point of reception.
Referring to the daytime noise levels in Table 12, the residences along the north side of the
Transitway from Parkdale Avenue to Merton Street (represented by receptors 9 and 13) will
experience increased noise levels due to the new LRT system and will require mitigation.
Other areas where mitigation should be investigated, according to ENCG, are the apartment
buildings at 231 Parkdale Avenue (represented by receptor 7), and the Riviera apartments next
to Hurdman Station (represented by receptors 45, 46, and 47).

Delcan Corporation DOTT EA – Air Quality, Noise and Vibration Page 35
A common and practical method of mitigating excess noise from vehicle and rail traffic is to
introduce physical noise barriers of various heights along the property lines or within the right-
of-ways of residences that are adversely affected. Due to the elevated nature of the receiver at
apartment buildings, noise barriers are impractical and mitigation within the city right of way is
not feasible. Regarding the noted apartment buildings, the worst-case differences in noise levels
between future and existing conditions are less than 3 dBA, which are just perceptible to most
observers. The residences along the north side of the Transitway from Parkdale Avenue to
Merton Street could be adequately protected using a noise barrier of approximately 2.4 m
adjacent to the property line of the effected residences, at the locations illustrated in Figure 3.
The exact configuration and heights of the barrier will need to be considered as part of the
detailed design phase of the project.
5.2.1 Impact of Stationary Sources
The activity and traffic patterns around the stations from Bayview to Cyrville are expected to
remain similar to the current function of each station. Given the location of the stations away
from sensitive receivers, any increase in noise levels between future and existing conditions
would be negligible.
At Tunney’s Pasture and Blair stations, bus volumes passing through the station are expected to
increase when these stations convert to transfer hubs for the LRT line. Although the increased
activity at each of these stations can increase the noise impact to the surrounding sensitive
areas, the actual impacts are likely to be minor. The Blair Station would be located in a busy
commercial area between Highway 174 and the Gloucester Centre. As such, any increase in bus
activity would be overcome by noise levels on Highway 174 as they impact the residential area
south of Highway 174. A similar situation exists, although less pronounced, at Tunney’s
Pasture Station, where traffic along Scott Street is a major contributor to the noise environment
for the sensitive residential area on the south side. In both cases, the bus terminals would be
located in proximity to institutional or commercial buildings, which are not noise sensitive.
Delcan Corporation DOTT EA – Air Quality, Noise and Vibration Page 36
Noise from the Maintenance and Storage (M & S) Facility will be created by marshalling
activities of the LRT vehicles in the rail yard, as well as maintenance work. Although noise
levels around the facility are expected to increase, the increased noise impact at the residences
is expected to be small due to the primary influence of the existing rail corridor and shielding
provided by the M & S Facility buildings themselves. In conformance with the MOE and City
of Ottawa ENCG, the facility would be subject to a detailed stationary noise analysis during
detailed design and project implementation. Appropriate mitigation may require the use of
landscaped earth berms and noise barriers around the north edge of the property, and
appropriate selection of silencers for mechanical equipment.
Noise from the tunnel portals and the ventilation shafts (systems) along the downtown tunnel
can also have adverse impacts on the local outdoor environment. However, despite being
intermittent and potentially significant sources, noise created by the fans at the noted locations
can readily be mitigated with the use of silencers selected at the time of detailed design.
Assessment and control of noise from these sources is also mandated through the MOE’s
Certificate of Approval (C of A) process, which must occur during the design phase of the
project.
Noise for electrical substations (Traction Power Stations) will create characteristic humming
sounds produced by the transformers. These noises, typically in the range of 500 to 2000 hertz,
are considered pure tone and can be potentially obtrusive to adjacent noise sensitive receivers.
However, noise associated with these electrical substations can be readily mitigated by
separation distance from noise sensitive buildings and the use of noise barriers or enclosures
around substations. Similar to other stationary sources, noise associated with electrical
substations will be addressed through the MOE’s Certificate of Approval procedure and the
City of Ottawa’s ENCG requirements.
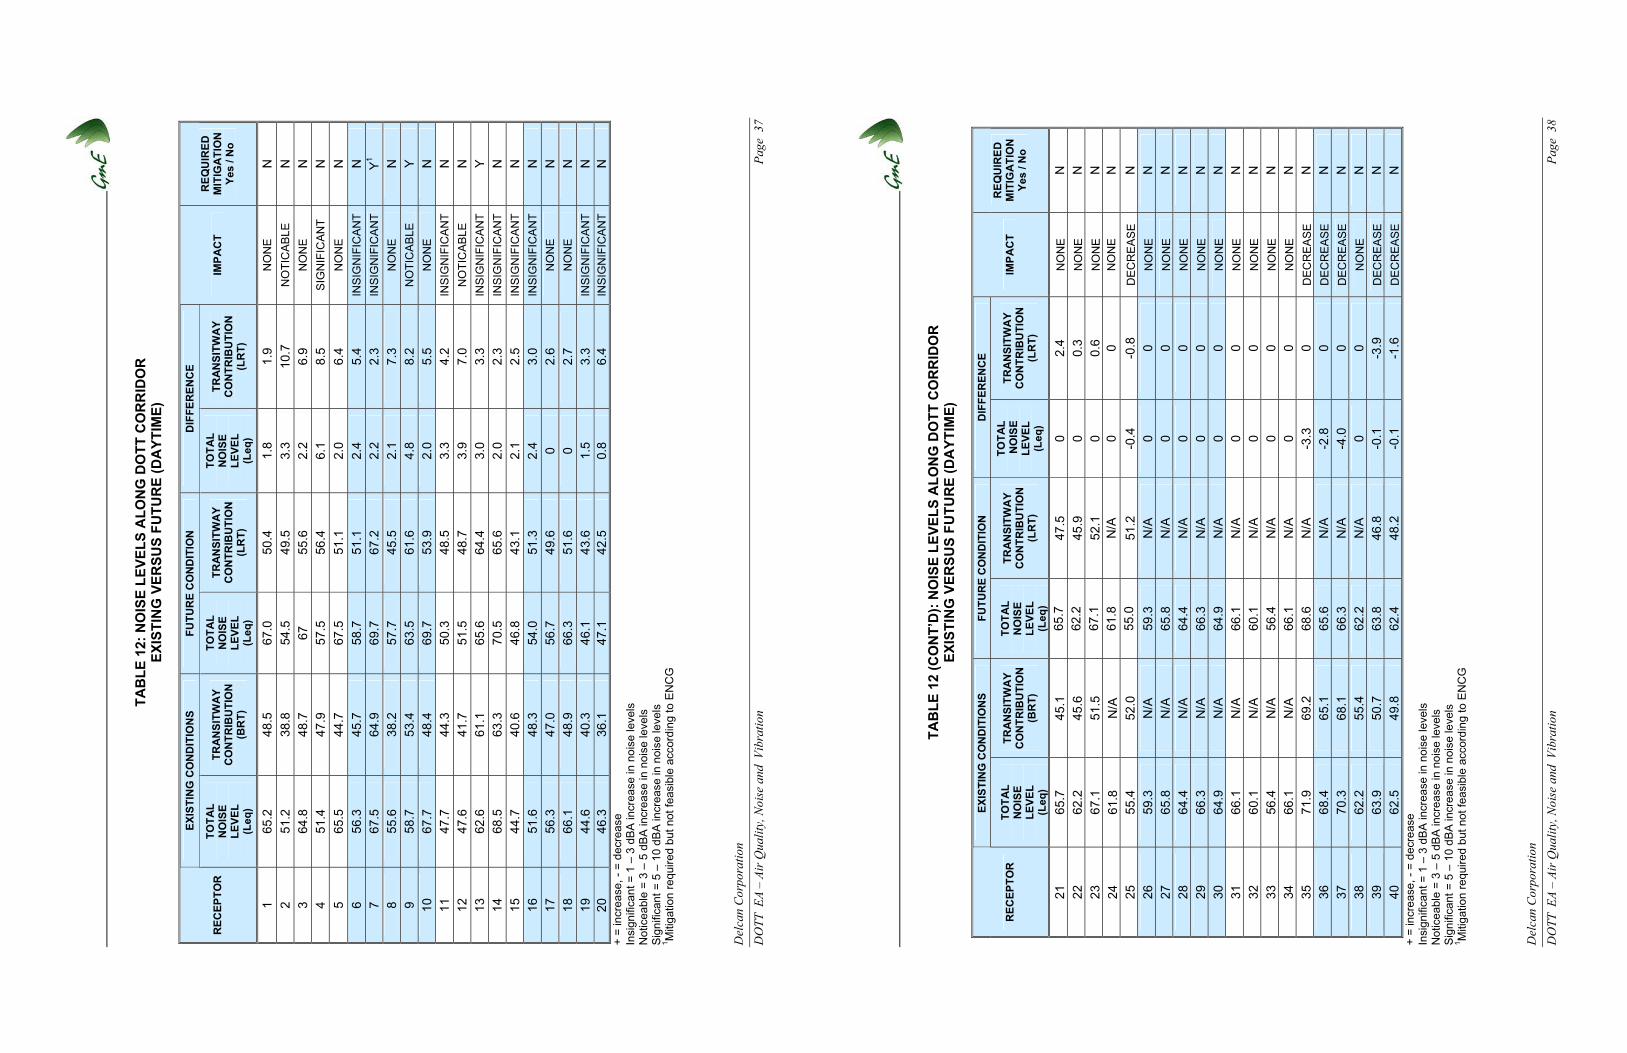
Del
can
Corp
orat
ion
DO
TT E
A –
Air Q
ualit
y, N
oise
and
Vib
ratio
n
Page
37
TAB
LE 1
2: N
OIS
E LE
VELS
ALO
NG
DO
TT C
OR
RID
OR
EX
ISTI
NG
VER
SUS
FUTU
RE
(DA
YTIM
E)
EXIS
TIN
G C
ON
DIT
ION
S FU
TUR
E C
ON
DIT
ION
D
IFFE
REN
CE
REC
EPTO
RTO
TAL
NO
ISE
LEVE
L (L
eq)
TRA
NSI
TWA
Y C
ON
TRIB
UTI
ON
(B
RT)
TOTA
L N
OIS
E LE
VEL
(Leq
)
TRA
NSI
TWA
Y C
ON
TRIB
UTI
ON
(L
RT)
TOTA
L N
OIS
E LE
VEL
(Leq
)
TRA
NSI
TWA
Y C
ON
TRIB
UTI
ON
(L
RT)
IMPA
CT
REQ
UIR
ED
MIT
IGA
TIO
N
Yes
/ No
1 65
.2
48.5
67
.0
50.4
1.
8 1.
9 N
ON
EN
2 51
.2
38.8
54
.5
49.5
3.
3 10
.7
NO
TIC
AB
LEN
3 64
.8
48.7
67
55
.6
2.2
6.9
NO
NE
N4
51.4
47
.9
57.5
56
.4
6.1
8.5
SIG
NIF
ICA
NT
N5
65.5
44
.7
67.5
51
.1
2.0
6.4
NO
NE
N6
56.3
45.7
58.7
51.1
2.4
5.4
INS
IGN
IFIC
AN
T N
767
.564
.969
.767
.22.
22.
3IN
SIG
NIF
ICA
NT
Y1
855
.638
.257
.745
.52.
17.
3N
ON
EN
958
.753
.463
.561
.64.
88.
2N
OTI
CA
BLE
Y10
67.7
48.4
69.7
53.9
2.0
5.5
NO
NE
N11
47
.7
44.3
50
.3
48.5
3.
3 4.
2 IN
SIG
NIF
ICA
NT
N12
47
.6
41.7
51
.5
48.7
3.
9 7.
0 N
OTI
CA
BLE
N13
62
.6
61.1
65
.6
64.4
3.
0 3.
3 IN
SIG
NIF
ICA
NT
Y14
68
.5
63.3
70
.5
65.6
2.
0 2.
3 IN
SIG
NIF
ICA
NT
N15
44
.7
40.6
46
.8
43.1
2.
1 2.
5 IN
SIG
NIF
ICA
NT
N16
51.6
48.3
54.0
51.3
2.4
3.0
INS
IGN
IFIC
AN
T N
1756
.347
.056
.749
.60
2.6
NO
NE
N18
66.1
48.9
66.3
51.6
02.
7N
ON
EN
1944
.640
.346
.143
.61.
53.
3IN
SIG
NIF
ICA
NT
N20
46.3
36.1
47.1
42.5
0.8
6.4
INS
IGN
IFIC
AN
T N
+ =
incr
ease
, - =
dec
reas
e In
sign
ifica
nt =
1 –
3 d
BA
incr
ease
in n
oise
leve
ls
Not
icea
ble
= 3
– 5
dBA
incr
ease
in n
oise
leve
ls
Sig
nific
ant =
5 –
10
dBA
incr
ease
in n
oise
leve
ls
1 Miti
gatio
n re
quire
d bu
t not
feas
ible
acc
ordi
ng to
EN
CG
Del
can
Corp
orat
ion
DO
TT E
A –
Air Q
ualit
y, N
oise
and
Vib
ratio
n
Page
38
TAB
LE 1
2 (C
ON
T’D
): N
OIS
E LE
VELS
ALO
NG
DO
TT C
OR
RID
OR
EX
ISTI
NG
VER
SUS
FUTU
RE
(DA
YTIM
E)
EXIS
TIN
G C
ON
DIT
ION
S FU
TUR
E C
ON
DIT
ION
D
IFFE
REN
CE
REC
EPTO
RTO
TAL
N
OIS
E
LEVE
L
(Leq
)
TRA
NSI
TWA
Y C
ON
TRIB
UTI
ON
(B
RT)
TOTA
L
NO
ISE
LE
VEL
(L
eq)
TRA
NSI
TWA
Y C
ON
TRIB
UTI
ON
(L
RT)
TOTA
L N
OIS
E LE
VEL
(L
eq)
TRA
NSI
TWA
Y C
ON
TRIB
UTI
ON
(L
RT)
IMPA
CT
REQ
UIR
ED
MIT
IGA
TIO
N
Yes
/ No
21
65.7
45
.1
65.7
47.5
0
2.4
NO
NE
N22
62
.2
45.6
62
.245
.9
0 0.
3 N
ON
EN
23
67.1
51
.5
67.1
52.1
0
0.6
NO
NE
N24
61
.8
N/A
61
.8
N/A
0
0 N
ON
EN
25
55.4
52
.0
55.0
51.2
-0
.4
-0.8
D
EC
RE
AS
EN
2659
.3N
/A59
.3N
/A0
0N
ON
EN
2765
.8N
/A65
.8N
/A0
0N
ON
EN
2864
.4N
/A64
.4N
/A0
0N
ON
EN
2966
.3N
/A66
.3N
/A0
0N
ON
EN
3064
.9N
/A64
.9N
/A0
0N
ON
EN
31
66.1
N
/A
66.1
N
/A
0 0
NO
NE
N32
60
.1
N/A
60
.1
N/A
0
0 N
ON
EN
33
56.4
N
/A
56.4
N
/A
0 0
NO
NE
N34
66
.1
N/A
66
.1
N/A
0
0 N
ON
EN
35
71.9
69
.2
68.6
N
/A
-3.3
0
DE
CR
EA
SE
N36
68.4
65.1
65.6
N/A
-2.8
0D
EC
RE
AS
EN
3770
.368
.166
.3N
/A-4
.00
DE
CR
EA
SE
N38
62.2
55.4
62.2
N/A
00
NO
NE
N39
63.9
50.7
63.8
46.8
-0.1
-3.9
DE
CR
EA
SE
N40
62.5
49.8
62.4
48.2
-0.1
-1.6
DE
CR
EA
SE
N+
= in
crea
se, -
= d
ecre
ase
Insi
gnifi
cant
= 1
– 3
dB
A in
crea
se in
noi
se le
vels
N
otic
eabl
e =
3 –
5 dB
A in
crea
se in
noi
se le
vels
S
igni
fican
t = 5
– 1
0 dB
A in
crea
se in
noi
se le
vels
1 M
itiga
tion
requ
ired
but n
ot fe
asib
le a
ccor
ding
to E
NC
G

Del
can
Corp
orat
ion
DO
TT E
A –
Air Q
ualit
y, N
oise
and
Vib
ratio
n
Page
39
TAB
LE 1
2 (C
ON
T’D
): N
OIS
E LE
VELS
ALO
NG
DO
TT C
OR
RID
OR
EX
ISTI
NG
VER
SUS
FUTU
RE
(DA
YTIM
E)
EX
ISTI
NG
CO
ND
ITIO
NS
FUTU
RE
CO
ND
ITIO
N
DIF
FER
ENC
E
REC
EPTO
RTO
TAL
NO
ISE
EVEL
(L
eq)
TRA
NSI
TWA
Y C
ON
TRIB
UTI
ON
(B
RT)
TOTA
L N
OIS
E LE
VEL
(Leq
)
TRA
NSI
TWA
Y C
ON
TRIB
UTI
ON
(L
RT)
L
TOTA
L N
OIS
E LE
VEL
(Leq
)
TRA
NSI
TWA
Y C
ON
TRIB
UTI
ON
(L
RT)
IMPA
CT
REQ
UIR
ED
MIT
IGA
TIO
N
Yes
/ No
41
74.7
59
.5
74.6
57
.2
-0.1
-2
.3
DE
CR
EA
SE
N42
72
.5
61.7
72
.3
59.4
0
-2.3
D
EC
RE
AS
EN
43
70.2
64
.6
70.5
65
.5
0.3
0.9
NO
NE
N44
69
.6
64.1
69
.8
64.9
0.
2 0.
8 N
ON
EY1
45
62.6
62
.5
63.9
63
.8
1.3
1.3
INS
IGN
IFIC
AN
T Y1
4665
.465
.462
.562
.5-2
.9-2
.9D
EC
RE
AS
EN
4757
.756
.859
.356
.11.
6-0
.7N
ON
EN
4864
.238
.566
.141
.51.
93.
0N
ON
EN
4959
.646
.161
.150
.11.
54.
0N
ON
EN
5065
.135
.866
.942
.11.
86.
3N
ON
EN
51
65.9
59
.8
65.4
57
.2
-0.5
-2
.6
DE
CR
EA
SE
N52
66
.8
44.3
66
.8
49.8
0
5.5
NO
NE
N53
58
.4
40.3
58
.5
44.6
0.
1 4.
3 N
ON
EN
54
66.9
45
.3
67.0
50
.8
0.1
5.5
NO
NE
N55
57
.8
37.9
57
.8
41.0
0
3.1
NO
NE
N56
66.2
40.4
66.2
43.3
02.
9N
ON
EN
5769
.948
.370
.051
.50.
13.
2N
ON
EN
5871
.366
.272
.469
.11.
12.
9IN
SIG
NIF
ICA
NT
N59
61.5
45.8
61.8
48.9
0.3
3.1
NO
NE
N60
64.8
41.6
66.4
44.7
1.6
3.1
NO
NE
N+
= in
crea
se, -
= d
ecre
ase
Insi
gnifi
cant
= 1
– 3
dB
A in
crea
se in
noi
se le
vels
N
otic
eabl
e =
3 –
5 dB
A in
crea
se in
noi
se le
vels
S
igni
fican
t = 5
– 1
0 dB
A in
crea
se in
noi
se le
vels
1 M
itiga
tion
requ
ired
but n
ot fe
asib
le a
ccor
ding
to E
NC
G
Del
can
Corp
orat
ion
DO
TT E
A –
Air Q
ualit
y, N
oise
and
Vib
ratio
n
Page
40
TAB
LE 1
2 (C
ON
T’D
): N
OIS
E LE
VELS
ALO
NG
DO
TT C
OR
RID
OR
EX
ISTI
NG
VER
SUS
FUTU
RE
(DA
YTIM
E)
EX
ISTI
NG
CO
ND
ITIO
NS
FUTU
RE
CO
ND
ITIO
N
DIF
FER
ENC
E
REC
EPTO
RTO
TAL
NO
ISE
LEVE
L (L
eq)
TRA
NSI
TWA
Y C
ON
TRIB
UTI
ON
(B
RT)
TOTA
L N
OIS
E LE
VEL
(Leq
)
TRA
NSI
TWA
Y C
ON
TRIB
UTI
ON
(L
RT)
TOTA
L N
OIS
E LE
VEL
(Leq
)
TRA
NSI
TWA
Y C
ON
TRIB
UTI
ON
(L
RT)
IMPA
CT
REQ
UIR
ED
MIT
IGA
TIO
N
Yes
/ No
61
78.2
66
.3
78.5
69
.1
0.3
2.5
NO
NE
N62
68
.1
50.7
68
.1
53.6
0
2.9
NO
NE
N63
60
.9
39.1
62
.6
42.9
1.
7 3.
8 N
ON
EN
64
66.3
59
.2
66.5
59
.7
0.2
0.5
NO
NE
N65
62
.1
52.4
62
.8
56.1
0.
7 3.
7 N
ON
EN
6659
.447
.661
.450
.32.
02.
7N
ON
EN
6762
.042
.563
.946
.61.
94.
1N
ON
EN
6854
.937
.756
.841
.51.
93.
8N
ON
EN
6963
.144
.665
.048
.81.
94.
2N
ON
EN
7058
.746
.060
.749
.82.
03.
8N
ON
EN
71
52.1
39
.3
54.1
43
.1
2.0
3.8
NO
NE
N72
60
.6
48.6
62
.6
52.3
2.
0 3.
7 N
ON
EN
73
61.3
49
.4
63.3
53
.1
2.0
3.7
NO
NE
N74
64
.6
46.7
66
.5
50.8
1.
9 4.
1 N
ON
EN
75
55.8
39
.5
57.8
43
.1
2.0
3.6
NO
NE
N76
63.2
45.1
65.2
49.3
2.0
4.2
NO
NE
N77
62.5
45.8
64.4
48.3
1.9
2.5
NO
NE
N78
55.4
38.7
57.3
41.4
1.9
2.7
NO
NE
N79
61.9
44.4
63.8
46.9
1.9
2.5
NO
NE
N80
64.0
55.1
65.8
56.2
1.8
1.1
NO
NE
N+
= in
crea
se, -
= d
ecre
ase
Insi
gnifi
cant
= 1
– 3
dB
A in
crea
se in
noi
se le
vels
N
otic
eabl
e =
3 –
5 dB
A in
crea
se in
noi
se le
vels
S
igni
fican
t = 5
– 1
0 dB
A in
crea
se in
noi
se le
vels
1 M
itiga
tion
requ
ired
but n
ot fe
asib
le a
ccor
ding
to E
NC
G
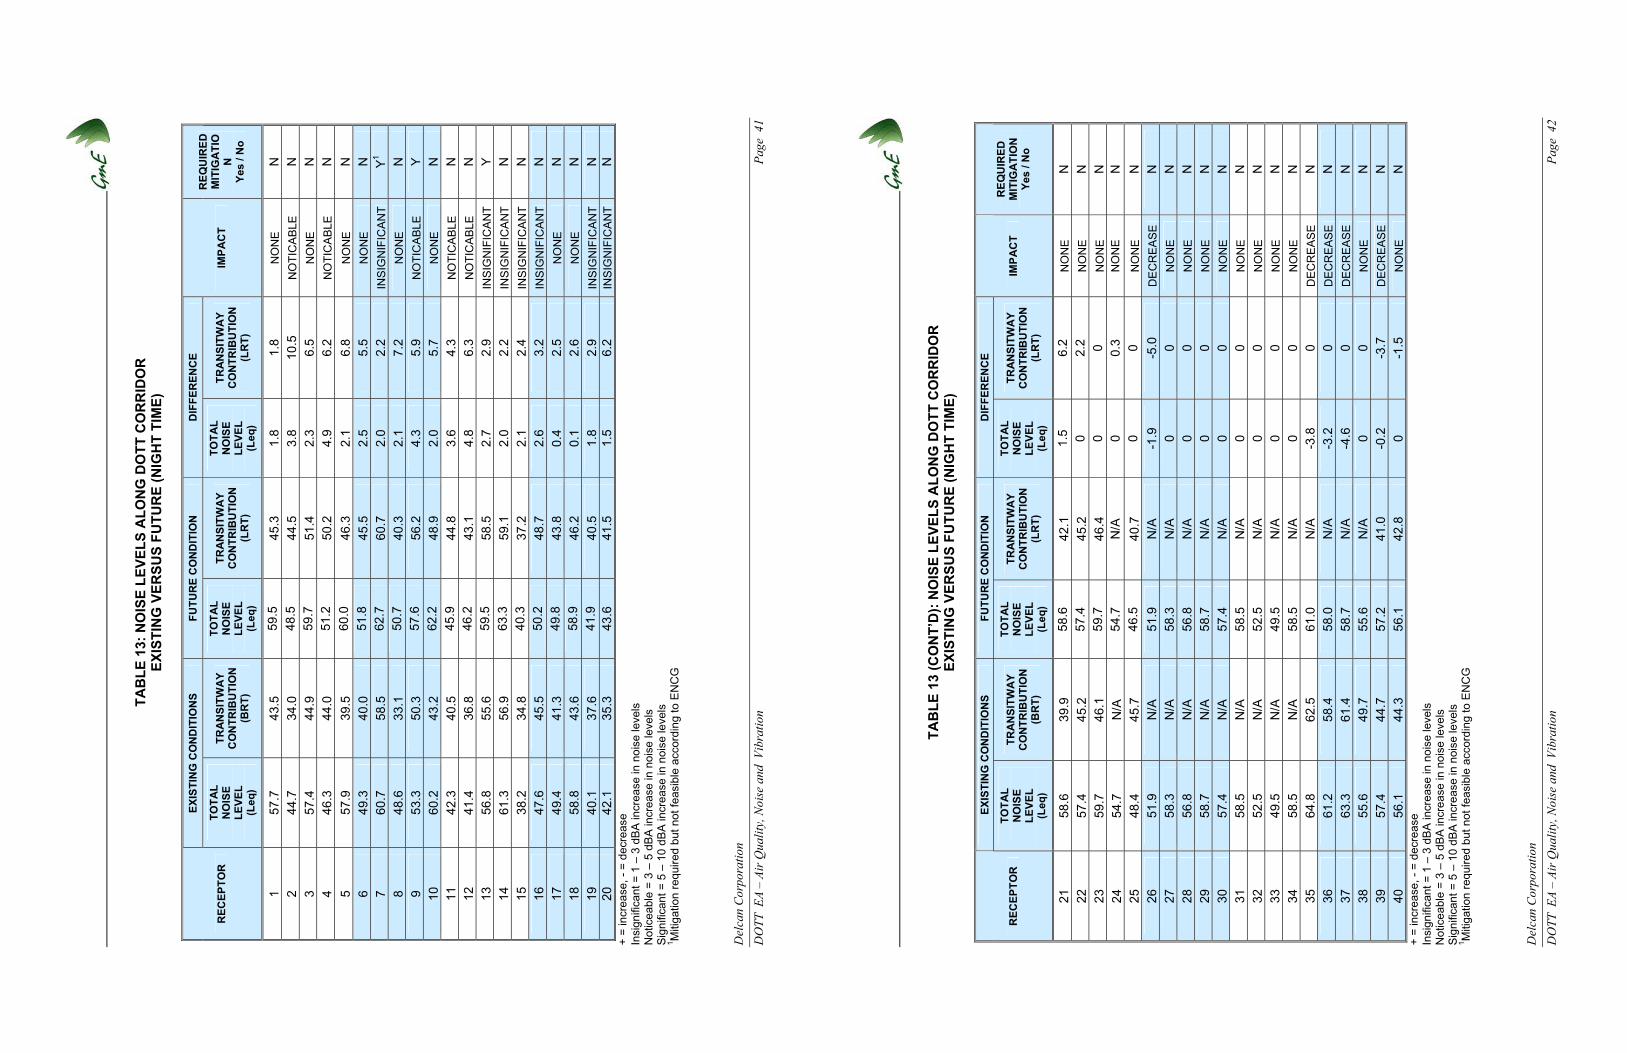
Del
can
Corp
orat
ion
DO
TT E
A –
Air Q
ualit
y, N
oise
and
Vib
ratio
n
Page
41
TAB
LE 1
3: N
OIS
E LE
VELS
ALO
NG
DO
TT C
OR
RID
OR
EX
ISTI
NG
VER
SUS
FUTU
RE
(NIG
HT
TIM
E)
EX
ISTI
NG
CO
ND
ITIO
NS
FUTU
RE
CO
ND
ITIO
N
DIF
FER
ENC
E
REC
EPTO
RTO
TAL
NO
ISE
LEVE
L (L
eq)
TRA
NSI
TWA
Y C
ON
TRIB
UTI
ON
(B
RT)
TOTA
L N
OIS
E LE
VEL
(Leq
)
TRA
NSI
TWA
Y C
ON
TRIB
UTI
ON
(L
RT)
TOTA
L N
OIS
E LE
VEL
(Leq
)
TRA
NSI
TWA
Y C
ON
TRIB
UTI
ON
(L
RT)
IMPA
CT
REQ
UIR
ED
MIT
IGA
TIO
N
Yes
/ No
1 57
.7
43.5
59
.545
.3
1.8
1.8
NO
NE
N2
44.7
34
.0
48.5
44.5
3.
8 10
.5
NO
TIC
AB
LEN
3 57
.4
44.9
59
.751
.4
2.3
6.5
NO
NE
N4
46.3
44
.0
51.2
50.2
4.
9 6.
2 N
OTI
CA
BLE
N5
57.9
39
.5
60.0
46.3
2.
1 6.
8 N
ON
EN
649
.340
.051
.845
.52.
55.
5N
ON
EN
760
.758
.562
.760
.72.
02.
2IN
SIG
NIF
ICA
NT
Y1
848
.633
.150
.740
.32.
17.
2N
ON
EN
953
.350
.357
.656
.24.
35.
9N
OTI
CA
BLE
Y10
60.2
43.2
62.2
48.9
2.0
5.7
NO
NE
N11
42
.3
40.5
45
.944
.8
3.6
4.3
NO
TIC
AB
LEN
12
41.4
36
.8
46.2
43.1
4.
8 6.
3 N
OTI
CA
BLE
N13
56
.8
55.6
59
.558
.5
2.7
2.9
INS
IGN
IFIC
AN
TY
14
61.3
56
.9
63.3
59.1
2.
0 2.
2 IN
SIG
NIF
ICA
NT
N15
38
.2
34.8
40
.337
.2
2.1
2.4
INS
IGN
IFIC
AN
T N
1647
.645
.550
.248
.72.
63.
2IN
SIG
NIF
ICA
NT
N17
49.4
41.3
49.8
43.8
0.4
2.5
NO
NE
N18
58.8
43.6
58.9
46.2
0.1
2.6
NO
NE
N19
40.1
37.6
41.9
40.5
1.8
2.9
INS
IGN
IFIC
AN
T N
2042
.135
.343
.641
.51.
56.
2IN
SIG
NIF
ICA
NT
N+
= in
crea
se, -
= d
ecre
ase
Insi
gnifi
cant
= 1
– 3
dB
A in
crea
se in
noi
se le
vels
N
otic
eabl
e =
3 –
5 dB
A in
crea
se in
noi
se le
vels
S
igni
fican
t = 5
– 1
0 dB
A in
crea
se in
noi
se le
vels
1 M
itiga
tion
requ
ired
but n
ot fe
asib
le a
ccor
ding
to E
NC
G
Del
can
Corp
orat
ion
DO
TT E
A –
Air Q
ualit
y, N
oise
and
Vib
ratio
n
Page
42
TAB
LE 1
3 (C
ON
T’D
): N
OIS
E LE
VELS
ALO
NG
DO
TT C
OR
RID
OR
EX
ISTI
NG
VER
SUS
FUTU
RE
(NIG
HT
TIM
E)
EX
ISTI
NG
CO
ND
ITIO
NS
FUTU
RE
CO
ND
ITIO
N
DIF
FER
ENC
E
REC
EPTO
RTO
TAL
NO
ISE
LEVE
L (L
eq)
TRA
NSI
TWA
Y C
ON
TRIB
UTI
ON
(B
RT)
TOTA
L N
OIS
E LE
VEL
(Leq
)
TRA
NSI
TWA
Y C
ON
TRIB
UTI
ON
(L
RT)
TOTA
L N
OIS
E LE
VEL
(Leq
)
TRA
NSI
TWA
Y C
ON
TRIB
UTI
ON
(L
RT)
IMPA
CT
REQ
UIR
ED
MIT
IGA
TIO
N
Yes
/ No
21
58.6
39
.9
58.6
42.1
1.5
6.2
NO
NE
N22
57
.4
45.2
57
.445
.20
2.2
NO
NE
N23
59
.7
46.1
59
.746
.40
0 N
ON
EN
24
54.7
N
/A
54.7
N
/A
0 0.
3 N
ON
EN
25
48.4
45
.7
46.5
40.7
0 0
NO
NE
N26
51.9
N/A
51.9
N/A
-1.9
-5.0
DE
CR
EA
SE
N27
58.3
N/A
58.3
N/A
00
NO
NE
N28
56.8
N/A
56.8
N/A
00
NO
NE
N29
58.7
N/A
58.7
N/A
00
NO
NE
N30
57.4
N/A
57.4
N/A
00
NO
NE
N31
58
.5
N/A
58
.5
N/A
0
0 N
ON
EN
32
52.5
N
/A
52.5
N
/A
0 0
NO
NE
N33
49
.5
N/A
49
.5
N/A
0
0 N
ON
EN
34
58.5
N
/A
58.5
N
/A
0 0
NO
NE
N35
64
.8
62.5
61
.0
N/A
-3
.8
0 D
EC
RE
AS
EN
3661
.258
.458
.0N
/A-3
.20
DE
CR
EA
SE
N37
63.3
61.4
58.7
N/A
-4.6
0D
EC
RE
AS
EN
3855
.649
.755
.6N
/A0
0N
ON
EN
3957
.444
.757
.241
.0-0
.2-3
.7D
EC
RE
AS
EN
4056
.144
.356
.142
.80
-1.5
NO
NE
N+
= in
crea
se, -
= d
ecre
ase
Insi
gnifi
cant
= 1
– 3
dB
A in
crea
se in
noi
se le
vels
N
otic
eabl
e =
3 –
5 dB
A in
crea
se in
noi
se le
vels
S
igni
fican
t = 5
– 1
0 dB
A in
crea
se in
noi
se le
vels
1 M
itiga
tion
requ
ired
but n
ot fe
asib
le a
ccor
ding
to E
NC
G

Del
can
Corp
orat
ion
DO
TT E
A –
Air Q
ualit
y, N
oise
and
Vib
ratio
n
Page
43
TAB
LE 1
3 (C
ON
T’D
): N
OIS
E LE
VELS
ALO
NG
DO
TT C
OR
RID
OR
EX
ISTI
NG
VER
SUS
FUTU
RE
(NIG
HT
TIM
E)
EX
ISTI
NG
CO
ND
ITIO
NS
FUTU
RE
CO
ND
ITIO
N
DIF
FER
ENC
E
REC
EPTO
RTO
TAL
NO
ISE
LEVE
L (L
eq)
TRA
NSI
TWA
Y C
ON
TRIB
UTI
ON
(B
RT)
TOTA
L N
OIS
E LE
VEL
(Leq
)
TRA
NSI
TWA
Y C
ON
TRIB
UTI
ON
(L
RT)
TOTA
L N
OIS
E LE
VEL
(Leq
)
TRA
NSI
TWA
Y C
ON
TRIB
UTI
ON
(L
RT)
IMPA
CT
REQ
UIR
ED
MIT
IGA
TIO
N
Yes
/ No
41
67.1
52
.6
67.1
50
.7
0 -1
.9
NO
NE
N42
64
.9
55.0
64
.8
52.8
-0
.1
-2.2
D
EC
RE
AS
EN
43
62.9
57
.9
63.3
58
.9
0.4
1.0
NO
NE
N44
62
.3
57.4
62
.6
58.4
0.
3 1.
0 N
ON
EY1
45
56.0
57
.4
57.3
56
.8
1.3
-0.6
N
ON
EY1
4659
.059
.055
.955
.9-3
.1-3
.1D
EC
RE
AS
EY
4751
.750
.052
.249
.50.
5-0
.5N
ON
EN
4857
.333
.059
.235
.91.
92.
9N
ON
EN
4953
.243
.254
.947
.31.
74.
1N
ON
EN
5058
.131
.759
.936
.91.
85.
2N
ON
EN
51
59.7
54
.0
59.1
51
.4
-0.6
-2
.6
DE
CR
EA
SE
N52
62
.3
40.7
62
.4
46.4
0.
1 5.
7 N
ON
EN
53
51.8
34
.7
51.9
39
.0
0.1
4.3
NO
NE
N54
61
.6
42.0
61
.7
47.3
0.
1 5.
3 N
ON
EN
55
51.3
31
.9
51.3
34
.9
0 3.
0 N
ON
EN
5660
.934
.260
.936
.90
2.7
NO
NE
N57
62.3
41.7
62.4
44.6
0.1
2.9
NO
NE
N58
64.1
59.8
65.4
62.7
1.3
2.9
INS
IGN
IFIC
AN
T Y
5954
.939
.955
.343
.20.
43.
3N
ON
EN
6057
.435
.859
.039
.21.
63.
4N
ON
EN
+ =
incr
ease
, - =
dec
reas
e In
sign
ifica
nt =
1 –
3 d
BA
incr
ease
in n
oise
leve
ls
Not
icea
ble
= 3
– 5
dBA
incr
ease
in n
oise
leve
ls
Sig
nific
ant =
5 –
10
dBA
incr
ease
in n
oise
leve
ls
1 Miti
gatio
n re
quire
d bu
t not
feas
ible
acc
ordi
ng to
EN
CG
D
elca
n Co
rpor
atio
n D
OTT
EA
– Ai
r Qua
lity,
Noi
se a
nd V
ibra
tion
Pa
ge 4
4
TAB
LE 1
3 (C
ON
T’D
): N
OIS
E LE
VELS
ALO
NG
DO
TT C
OR
RID
OR
EX
ISTI
NG
VER
SUS
FUTU
RE
(NIG
HT
TIM
E)
EX
ISTI
NG
CO
ND
ITIO
NS
FUTU
RE
CO
ND
ITIO
N
DIF
FER
ENC
E
REC
EPTO
RTO
TAL
NO
ISE
LEVE
L (L
eq)
TRA
NSI
TWA
Y C
ON
TRIB
UTI
ON
(B
RT)
TOTA
L N
OIS
E LE
VEL
(Leq
)
TRA
NSI
TWA
Y C
ON
TRIB
UTI
ON
(L
RT)
TOTA
L N
OIS
E LE
VEL
(Leq
)
TRA
NSI
TWA
Y C
ON
TRIB
UTI
ON
(L
RT)
IMPA
CT
REQ
UIR
ED
MIT
IGA
TIO
N
Yes
/ No
61
70.7
59
.7
71.0
62
.5
0.3
2.8
NO
NE
N62
60
.7
44.3
60
.8
47.3
0.
1 3.
0 N
ON
EN
63
57.4
37
.1
57.4
40
.8
0 3.
7 N
ON
EN
64
59.0
52
.5
59.2
53
.2
0.2
0.7
NO
NE
N65
54
.6
45.7
55
.5
49.6
0.
9 3.
9 N
ON
EN
6653
.142
.155
.044
.61.
92.
5N
ON
EN
6756
.038
.958
.543
.12.
54.
2N
ON
EN
6848
.431
.250
.335
.91.
94.
7N
ON
EN
6960
.742
.262
.646
.31.
94.
1N
ON
EN
7052
.440
.154
.544
.22.
14.
1N
ON
EN
71
45.7
33
.5
47.8
37
.5
2.1
4.0
NO
NE
N72
54
.1
42.6
56
.2
46.5
2.
1 3.
9 N
ON
EN
73
54.8
43
.4
56.9
47
.3
2.1
3.9
NO
NE
N74
61
.5
44.4
63
.4
48.3
1.
9 3.
9 N
ON
EN
75
49.2
33
.5
51.1
37
.5
1.9
4.0
NO
NE
N76
62.0
44.7
63.9
48.6
1.9
3.9
NO
NE
N77
58.0
44.2
60.0
47.8
2.0
3.6
NO
NE
N78
48.8
32.7
50.7
35.7
1.9
3.0
NO
NE
N79
57.3
43.5
59.1
44.5
1.8
1.0
NO
NE
N80
57.5
48.8
59.3
49.8
1.8
1.0
NO
NE
N+
= in
crea
se, -
= d
ecre
ase
Insi
gnifi
cant
= 1
– 3
dB
A in
crea
se in
noi
se le
vels
N
otic
eabl
e =
3 –
5 dB
A in
crea
se in
noi
se le
vels
S
igni
fican
t = 5
– 1
0 dB
A in
crea
se in
noi
se le
vels
1 M
itiga
tion
requ
ired
but n
ot fe
asib
le a
ccor
ding
to E
NC
G

Delcan Corporation DOTT EA – Air Quality, Noise and Vibration Page 45
5.3 Ground Vibrations and Ground-borne Noise
Results of existing ground vibrations measurements are presented in Table 14, with the
measurements locations illustrated in Figures 2 to 24. Measured RMS vibrations fall below the
level commonly considered to be perceptible by most building occupants of 72 dBV
(0.1 mm/s). Existing vibration levels are also found to be negligible with respect to the risk of
structural damages or even cosmetic damages to building finishes.
Predicted future vibration levels and ground-borne noise (GBN) along the tunnel section
resulting from the implementation of the DOTT project are summarized in Table 15. (Note,
colour separations have been used to improve the readability of the table, and are not related to
the interpretation of the conditions). Results in Table 15 have considered factors such as special
track work, and worn or corrugated track which have similar but non-additive influence on
ground vibration levels. For the section of the corridor from Tunney’s Pasture to the West
Portal, predicted future ground vibration levels, without mitigation, range from 61 to 80 dBV
with corresponding ground-borne noise (GBN) ranging from 26 to 50 dBA. The highest levels
of vibrations and GBN are experienced by residences on the north side of the Transitway and
the south side of Scott Street from Tunney’s Pasture to the Bayview Road crossing. At these
locations, vibration and GBN exceed applicable limits and will be annoying to a large
proportion of the population. From the Bayview Road crossing to the West Portal, vibrations
and GBN levels decrease to acceptable levels as a result of increased separation distance to
sensitive receivers.
In the tunnel sections, from the West Portal to Campus Station, ground vibrations are less
significant as compared to the west section, reaching a maximum level of 68 dBV at the
University of Ottawa’s Desmarais building. However, the harmonic characteristic of vibrations
passing through rock into a building focuses the energy at lower frequencies, thereby making
the vibrations more difficult to attenuate with distance, and more perceptible in the form of
audible noise. As a comparison, the relatively low vibration level of 68 dBV at the Desmarais
building creates GBN of 53 dBA, which is 18 dBA above the sound level criteria. This explains
the reason for hearing low rumbling noises in buildings next to subway systems.
Delcan Corporation DOTT EA – Air Quality, Noise and Vibration Page 46
The most sensitive buildings along the tunnel section include the National Arts Centre (NAC)
concert hall and the recording studios in the CBC Radio Canada building. Due to the potential
interference with audio recordings from GBN, a more stringent criterion of 30 dBA has been
selected for these buildings. Inspection of Table 15 indicates that predicted noise levels are
expected to be 39 dBA and 46 dBA at the CBC and NAC buildings respectively.
Transitioning from the bored tunnel through rock to the cut and cover section at the Campus
Station, the vibration energy shifts to still lower frequencies, where structural vibrations are
more problematic. In this region, ground vibration and GBN levels without mitigation are
highest at the University of Ottawa’s SITE building with predicted levels of 75 dBV and
40 dBA, respectively. The SITE building houses vibration sensitive equipment, such as a
scanning electron microscope. Unmitigated vibration and GBN levels at the SITE building
exceed the criteria for sensitive buildings of 65 dBV and 30 dBA.
From the East Portal to Blair Station, the alignment of the new LRT system follows the existing
Transitway which runs parallel to Highway 417 through most of this section. Due to greater
separation distances between the LRT alignment and the surrounding buildings, the impacts of
ground vibration and GBN are less significant though this section. However some buildings,
such as the Lees Apartment buildings and the Comfort Inn on Michael Street may experience
minor violations of the vibration and GBN criteria, with unmitigated levels of 75 dBV and
40 dBA at Lees Apartments; and 80 dBV and 45 dBA at the Comfort Inn.
The cut and cover branch tunnel from the main line to the M & S Facility passes in close
proximity to the residences on Avenue N and Avenue O. These residences will experience
unmitigated vibrations and GBN levels of up to 81 dBV and 36 dBA, which also exceed the
corresponding criteria as summarized in Table 15.
Effective mitigation can be achieved by installing track and sleeper isolation treatments,
including floating slabs and resilient track fasteners. Floating slab track, such as the TTC’s
double-tie system, involves supporting the track ties on an isolated concrete slab, which in turn
is supported by rubber pads resting along a tunnel invert or concrete rail bed. Resilient fasteners
are rubber or neoprene track isolation pads placed between the rail and tie or sleeper. Research

Delcan Corporation DOTT EA – Air Quality, Noise and Vibration Page 47
has shown that resilient track fasteners can reduce vibrations by up to 5 dBV, and floating slab
track can provide up to a 20 dBV reduction in rock bored tunnels and a 15 dBV reduction for
cut and cover tunnels in soil.
As such, based on the anticipated excess ground vibrations due to the LRT, track and sleeper
isolation, such as floating slab track or equivalent vibration attenuation techniques, is
recommended for the following sections of DOTT: (i) Tunney’s Pasture Station to the Bayview
Road crossing, (ii) the full tunnel segment between the West and East Portals, and (iii) the cut
and cover branch tunnel leading to the M & S Facility. Track isolation such as resilient track
fasteners and continuously welded rail are recommended for the entire corridor, including the
east at grade section. LRT vehicles with soft primary suspensions, and well maintained tracks
and wheels will also be required to control vibrations at the source.
At the Comfort Inn (Table 15, Receptor 53), even with resilient track fasteners recommended
for the east section, the GBN levels will exceed the criterion by a small amount (i.e. 40 dBA
predicted versus 35 dBA criterion). The excess audible vibration could be mitigated either by:
limiting the train speed during the night time period (11:00 PM to 7:00 AM) to 50 km/h from
the St. Laurent Boulevard underpass to Station 108+450; or installing a 300 m long section of
floating slab track over the same section of the corridor. The mitigation performance of
imposing speed limits in combination with resilient track fasteners along this section is
described in Table 15. However, since the predicted excess audible GBN is minor, and train
operations decrease during the overnight hours, mitigation is not considered mandatory.
These mitigations strategies should be reevaluated throughout the design evolution to ensure
appropriate attenuation is achieved by the LRT system. The stiffness of the vehicles’ primary
suspension and the natural frequency of the floating slab can a have a significant effect on the
vibration attenuation performance of the entire system. Short term monitoring of noise and
vibrations is recommended for the first six months of LRT operations at select basements of
adjacent buildings along the tunnel sections, including all buildings sensitive to noise and
vibration, to evaluate the success of the noted mitigation strategies.
Delcan Corporation DOTT EA – Air Quality, Noise and Vibration Page 48
TABLE 14: VIBRATION MEASUREMENT RESULTS OF EXISTING CONDITIONS
MEASURED RMS VIBRATION LEVEL REC’R LOCATION DESCRIPTION
LAND USE (dBV) (mm/s)
VIBRATION CRITERIA
(dBV)
A Townhouse, 231 Forward Ave. Residential 58 0.02 70
B ODAWA Cultural Centre, 12 Stirling Ave. Institutional 60 0.03 70
C Park Square Condom, 151 Bay Street Residential 66 0.05 70
DSouth Side of Sun Life Building,
99 Bank Street Commercial 64 0.04 75
ENorth Side of Sun Life Building,
99 Bank Street Commercial 62 0.03 75
F National Arts Centre, 53 Elgin Street Institutional 60 0.03 70
G Les Suites Hotel, 130 Besserer Street Residential 70 0.09 70
H SITE Building, University of Ottawa Sensitive Building 62 0.03 65
I Single Detached Home, 388 Tremblay Residential 66 0.06 70 NOTE: dBV = 20 Log10 ((mm/s*.03937)/1e-6)

Del
can
Corp
orat
ion
DO
TT E
A –
Air Q
ualit
y, N
oise
and
Vib
ratio
n
Page
49
TAB
LE 1
5: P
RED
ICTE
D F
UTU
RE
VIB
RA
TIO
N IM
PAC
TS O
F LR
T SY
STEM
REC
EPTO
R
NA
ME
OF
BU
ILD
ING
DIS
TAN
CE
TO
CEN
TER
LIN
E O
F N
EAR
EST
TRA
CK
PRED
ICTE
D
VIB
RA
TIO
N
LEVE
L W
ITH
OU
T M
ITIG
ATI
ON
(d
BV)
VIB
RA
TIO
N
CR
ITER
IA
(dB
V)
PRED
ICTE
D
VIB
RA
TIO
N
LEVE
L W
ITH
M
ITIG
ATI
ON
(d
BV)
PRED
ICTE
D
GR
OU
ND
B
OR
NE
NO
ISE
LEVE
L W
ITH
OU
T M
ITIG
ATI
ON
(d
BA
)
GR
OU
ND
B
OR
NE
NO
ISE
CR
ITER
IA
(dB
A)
PRED
ICTE
D
GR
OU
ND
B
OR
NE
NO
ISE
LEVE
L W
ITH
M
ITIG
ATI
ON
(d
BA
) 1
Hou
se
48
70
70
55
35
35
20.0
2
Tunn
ey's
Pas
ture
37
78
75
63
43
40
28
.0
3 H
ouse
40
76
70
61
41
35
26
.0
4 23
1 P
arkd
ale
29
85
70
70
50
35
35.0
5O
DAW
A N
ativ
e C
entre
37
73
70
58
38
35
23.0
6R
ussi
an
Orth
odox
Chu
rch
2280
7065
4535
30.0
7H
ouse
35
7970
6444
3529
.0
8To
wnh
ouse
s 15
562
70N
/A27
35N
/A
9To
wnh
ouse
s 10
161
70N
/A26
35N
/A
10C
larid
ge
Con
dos
187
5770
N/A
2235
N/A
11
The
Gar
dens
24
64
70
40
50
35
23
12A
lber
t at B
ay,
Sui
te H
otel
33
62
70
37
47
35
21
13O
ttaw
aTe
chni
cal
H S
38
61
70
36
46
35
20
14
Dor
al In
n 34
63
70
38
48
35
22
Del
can
Corp
orat
ion
DO
TT E
A –
Air Q
ualit
y, N
oise
and
Vib
ratio
n
Page
50
TAB
LE 1
5 (C
ON
T’D
): P
RED
ICTE
D F
UTU
RE
VIB
RA
TIO
N IM
PAC
TS O
F LR
T SY
STEM
REC
EPTO
R
NA
ME
OF
BU
ILD
ING
DIS
TAN
CE
TO
CEN
TER
LIN
E O
F N
EAR
EST
TRA
CK
PRED
ICTE
D
VIB
RA
TIO
N
LEVE
L W
ITH
OU
T M
ITIG
ATI
ON
(d
BV)
VIB
RA
TIO
N
CR
ITER
IA
(dB
V)
PRED
ICTE
D
VIB
RA
TIO
N
LEVE
L W
ITH
M
ITIG
ATI
ON
(d
BV)
PRED
ICTE
D
GR
OU
ND
B
OR
NE
NO
ISE
LEVE
L W
ITH
OU
T M
ITIG
ATI
ON
(d
BA
)
GR
OU
ND
B
OR
NE
NO
ISE
CR
ITER
IA
(dB
A)
PRED
ICTE
D
GR
OU
ND
B
OR
NE
NO
ISE
LEVE
L W
ITH
M
ITIG
ATI
ON
(d
BA
)
15C
hris
t Chu
rch
Cat
hedr
al
89
53
70
29
39
35
12
16P
ark
Squ
are
Con
do
27
63
70
39
49
35
22
17C
row
n Pl
aza
Hot
el23
65
70
40
50
35
24
18C
onst
itutio
n S
quar
e P
h III
28
63
75
39
49
40
22
19P
lace
De
Ville
To
wer
A &
B
2165
7541
5140
24
20E
ldor
ado
N
ucle
ar
Bui
ldin
g29
6475
3949
4022
21C
apita
l Squ
are
2564
7540
5040
23
22S
un-L
ife B
uild
ing
2665
7540
5040
23
23C
BC
Rad
io
Can
ada
36
61
65
36
46
30
20
24W
orld
Exc
hang
e P
laza
28
63
75
38
48
40
22
25
Her
itage
Pla
ce
30
63
75
38
48
40
22
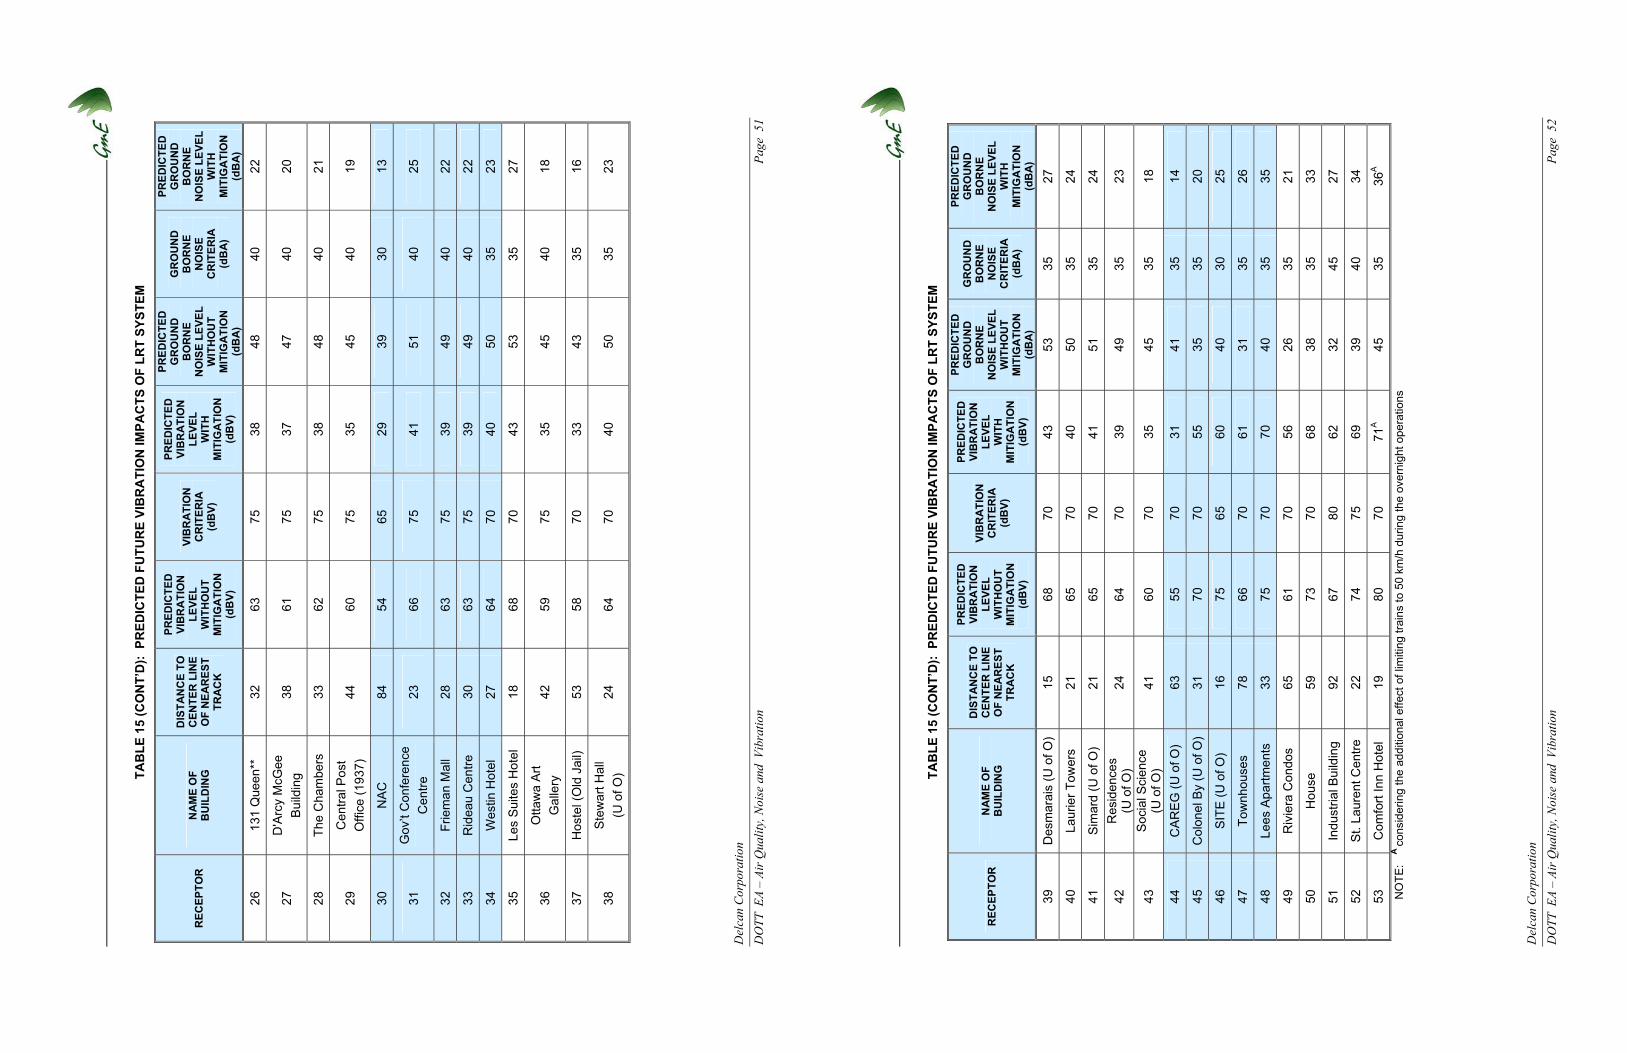
Del
can
Corp
orat
ion
DO
TT E
A –
Air Q
ualit
y, N
oise
and
Vib
ratio
n
Page
51
TAB
LE 1
5 (C
ON
T’D
): P
RED
ICTE
D F
UTU
RE
VIB
RA
TIO
N IM
PAC
TS O
F LR
T SY
STEM
REC
EPTO
R
NA
ME
OF
BU
ILD
ING
DIS
TAN
CE
TO
CEN
TER
LIN
E O
F N
EAR
EST
TRA
CK
PRED
ICTE
D
VIB
RA
TIO
N
LEVE
L W
ITH
OU
T M
ITIG
ATI
ON
(d
BV)
VIB
RA
TIO
N
CR
ITER
IA
(dB
V)
PRED
ICTE
D
VIB
RA
TIO
N
LEVE
L W
ITH
M
ITIG
ATI
ON
(d
BV)
PRED
ICTE
D
GR
OU
ND
B
OR
NE
NO
ISE
LEVE
L W
ITH
OU
T M
ITIG
ATI
ON
(d
BA
)
GR
OU
ND
B
OR
NE
NO
ISE
CR
ITER
IA
(dB
A)
PRED
ICTE
D
GR
OU
ND
B
OR
NE
NO
ISE
LEVE
L W
ITH
M
ITIG
ATI
ON
(d
BA
)
26
131
Que
en**
32
63
75
38
48
40
22
27D
'Arc
y M
cGee
B
uild
ing
38
61
75
37
47
40
20
28
The
Cha
mbe
rs
33
62
75
38
48
40
21
29C
entra
l Pos
t O
ffice
(193
7)
44
60
75
35
45
40
19
30N
AC
8454
6529
3930
13
31G
ov’t
Con
fere
nce
Cen
tre23
6675
4151
4025
32Fr
iem
an M
all
2863
7539
4940
22
33R
idea
u C
entre
30
6375
3949
4022
34W
estin
Hot
el
2764
7040
5035
23
35
Les
Sui
tes
Hot
el
18
68
70
43
53
35
27
36O
ttaw
a A
rt G
alle
ry42
59
75
35
45
40
18
37
Hos
tel (
Old
Jai
l) 53
58
70
33
43
35
16
38S
tew
art H
all
(U o
f O)
24
64
70
40
50
35
23
Del
can
Corp
orat
ion
DO
TT E
A –
Air Q
ualit
y, N
oise
and
Vib
ratio
n
Page
52
TAB
LE 1
5 (C
ON
T’D
): P
RED
ICTE
D F
UTU
RE
VIB
RA
TIO
N IM
PAC
TS O
F LR
T SY
STEM
REC
EPTO
R
NA
ME
OF
BU
ILD
ING
DIS
TAN
CE
TO
CEN
TER
LIN
E O
F N
EAR
EST
TRA
CK
PRED
ICTE
D
VIB
RA
TIO
N
LEVE
L W
ITH
OU
T M
ITIG
ATI
ON
(d
BV)
VIB
RA
TIO
N
CR
ITER
IA
(dB
V)
PRED
ICTE
D
VIB
RA
TIO
N
LEVE
L W
ITH
M
ITIG
ATI
ON
(d
BV)
PRED
ICTE
D
GR
OU
ND
B
OR
NE
NO
ISE
LEVE
L W
ITH
OU
T M
ITIG
ATI
ON
(d
BA
)
GR
OU
ND
B
OR
NE
NO
ISE
CR
ITER
IA
(dB
A)
PRED
ICTE
D
GR
OU
ND
B
OR
NE
NO
ISE
LEVE
L W
ITH
M
ITIG
ATI
ON
(d
BA
)
39
Des
mar
ais
(U o
f O)
15
68
70
43
53
35
27
40
Laur
ier T
ower
s 21
65
70
40
50
35
24
41
Sim
ard
(U o
f O)
21
65
70
41
51
35
24
42R
esid
ence
s
(U o
f O)
24
64
70
39
49
35
23
43S
ocia
l Sci
ence
(U
of O
) 41
60
70
35
45
35
18
44C
AR
EG
(U o
f O)
6355
7031
4135
14
45C
olon
el B
y (U
of O
) 31
7070
5535
3520
46S
ITE
(U o
f O)
1675
6560
4030
25
47To
wnh
ouse
s 78
6670
6131
3526
48Le
es A
partm
ents
33
7570
7040
3535
49
Riv
iera
Con
dos
65
61
70
56
26
35
21
50
Hou
se
59
73
70
68
38
35
33
51
Indu
stria
l Bui
ldin
g 92
67
80
62
32
45
27
52
St.
Laur
ent C
entre
22
74
75
69
39
40
34
53
Com
fort
Inn
Hot
el
19
80
70
71A
45
35
36A
N
OTE
: A
cons
ider
ing
the
addi
tiona
l effe
ct o
f lim
iting
trai
ns to
50
km/h
dur
ing
the
over
nigh
t ope
ratio
ns

Del
can
Corp
orat
ion
DO
TT E
A –
Air Q
ualit
y, N
oise
and
Vib
ratio
n
Page
53
TAB
LE 1
5 (C
ON
T’D
): P
RED
ICTE
D F
UTU
RE
VIB
RA
TIO
N IM
PAC
TS O
F LR
T SY
STEM
REC
EPTO
R
NA
ME
OF
BU
ILD
ING
DIS
TAN
CE
TO
CEN
TER
LIN
E O
F N
EAR
EST
TRA
CK
PRED
ICTE
D
VIB
RA
TIO
N
LEVE
L W
ITH
OU
T M
ITIG
ATI
ON
(d
BV)
VIB
RA
TIO
N
CR
ITER
IA
(dB
V)
PRED
ICTE
D
VIB
RA
TIO
N
LEVE
L W
ITH
M
ITIG
ATI
ON
(d
BV)
PRED
ICTE
D
GR
OU
ND
B
OR
NE
NO
ISE
LEVE
L W
ITH
OU
T M
ITIG
ATI
ON
(d
BA
)
GR
OU
ND
B
OR
NE
NO
ISE
CR
ITER
IA
(dB
A)
PRED
ICTE
D
GR
OU
ND
B
OR
NE
NO
ISE
LEVE
L W
ITH
M
ITIG
ATI
ON
(d
BA
)
54C
yrvi
lleA
partm
ents
42
67
70
62
32
35
27
55
Hou
se
146
62
70
57
27
35
22
56
Hou
se
123
62
70
57
27
35
22
57
Glo
uces
ter C
entre
21
74
70
69
39
35
34
58
Hou
se
25
77
70
62
42
35
27
59
Hou
se
45
73
70
58
37
35
22
60
Hou
se
15
81
70
66
36
35
31
Delcan Corporation DOTT EA – Air Quality, Noise and Vibration Page 54
6. IMPACTS OF CONSTRUCTION
Construction activity required to install the LRT system between the Tunney’s Pasture and
Blair Stations will involve a variety of techniques appropriate for at-grade, sub-grade and
tunnel construction. The east and west external segments of the corridor will involve surface
works for replacing or upgrading the roadbed, as well as installing shallow foundations for
elevated carriageways and stations. Constructing the cut and cover Campus Station, the
ventilation shafts along the downtown segment, as well as the branch tunnel to the M & S
Facility, will require deep excavations, controlled blasting, and sheet piling or foundation
anchoring. Pile driving may be required at isolated locations. The main tunnel construction and
station mining will make extensive use of a tunnel boring machine (TBM), as well as controlled
drilling and blasting. The West Portal, Campus Station to East Portal sections of the downtown
tunnel and the branch tunnel to the M & S Facility will be constructed using cut and cover
techniques. .
As such, many areas along the corridor are expected to experience some degree of air quality,
noise, and vibration impacts. In most cases however, the impacts will be controlled, minor and
intermittent over short cycles of activity. The only exception to short-cycle intermittent
vibrations will be the tunnel mining, which involves longer-cycle intermittent operations of the
TBM with periods of quasi-continuous cutting on the order of hours, extending over a period of
four or five days for any given point of reception.
The expected impacts for the east and west segments of the corridor, as well as at the site of the
M & S Facility, will be limited to isolated and local surface construction projects generating
occasional minor ground vibrations, fumes and dust, as well as intermittent noise. Common
mitigation measures should make use of moveable noise barriers around the perimeter of the
work areas, extensive water spraying to control dust, and implementing daytime hours of
operation to avoid night time impacts when background noise is lowest. In all cases, air quality,
noise and ground vibrations, are not expected to be disruptive to commonly occurring regular
activities. To a similar extent, the impacts of cut and cover construction at the Campus Station

Delcan Corporation DOTT EA – Air Quality, Noise and Vibration Page 55
and excavations for the ventilation shafts are likely to produce minor noise, air quality and
ground vibrations, typical of urban building construction projects involving deep foundations.
Station mining and portal entry may involve controlled blasting commonly used in deep
foundation excavation, in addition to traditional excavation techniques. The impacts from
station mining will be limited to ground vibrations and re-generated noise. Specialized services
of blast design engineers will be required to design suitable blasting programs to control the
impacts of these operations. Similar minor vibration impacts as for other foundation excavation
works are anticipated. No additional mitigation measures are anticipated for these works.
Tunnel excavation using the TBM represents a unique construction technique not commonly
used in the Ottawa area. The TBM operates by shearing the rock face with rotary motion of a
large circular disk fitted with cutting heads. With the sides of the machine anchored against the
prepared tunnel walls, the cutting face is slowly pushed forward with hydraulic pistons at a
typical rate of 0.5 meters per hour (m/h) depending on the type of rock being excavated. Once
the maximum stroke of the pistons is reached, the rear of the machine is pulled forward and re-
anchored against the surface of the tunnel for the start of another cutting cycle. As a result of
this procedure, vibrations produced by cutting may last on the order of hours, followed by a
shorter period for repositioning the TBM. Depending on the speed of advance, perceptible
vibrations and ground-borne noise (GBN) may occur at any given single point of reception over
a period lasting several days to a week, with 5 days being the expected average. Based on
available evidence from other sites worldwide, vibrations from TBM operations are likely to
produce low level vibrations with peak energy in the low frequency range (i.e. 3 Hertz to
50 Hertz). These vibrations are likely to produce perceptible vibrations for building occupants
along the route. However, the most severe vibrations are expected to be limited to basements
and commercial areas, which are least sensitive to the influences. Furthermore, at higher floor
levels, vibrations will be naturally mitigated by distance and inherent damping in the structure.
Vibrations from TBM operations are expected to have negligible impacts for the structures
themselves. Resonance conditions, which can occur when the cutting speed of the machine
coincides with the dominant frequencies in the rock mass and the natural frequency of the
foundations they encounter, are rare. However, a vibration monitoring program should be an
integral part of the tunnel construction part of the project. As such, other than operational
Delcan Corporation DOTT EA – Air Quality, Noise and Vibration Page 56
controls, no mitigation is anticipated during tunnel boring. Nonetheless, it will be necessary to
inform building occupants of the likely impacts, their importance, and purpose of monitoring.
In summary, various control techniques are available to the construction manager to mitigate
emissions from construction activities. For air emissions, detailed information is available from
Environment Canada26.
Suggested methods to control air emissions include, but are not limited to:
(i) Monitor current and forecasted wind conditions and plan operations to take advantage
of calm wind periods;
(ii) Minimize site storage of granular material in height and extent;
(iii) Locate storage piles in sheltered areas that can be covered;
(iv) Provide movable wind breaks;
(v) Use water spray and suppression techniques to control fugitive dust;
(vi) Cover haul trucks and keep access routes to the construction site clean of debris.
For noise and vibrations, common control methods include but are not limited to:
(i) Limit speeds of heavy vehicles within and upon approaching the site;
(ii) Provide compacted smooth surfaces, avoiding abrupt steps and ditches;
(iii) Install movable barriers or temporary enclosures, around blast sites for instance;
(iv) Keep equipment properly maintained and functioning as intended by the manufacturer;
(v) For the TBM, maintain the cutting face in optimum condition. Select cutting speed
within operational limits. Select cutting speeds to avoid resonance in adjacent
structures. Monitor noise and vibration at basements of adjacent buildings.
The construction manager will be responsible for preparing and implementing a mitigation
strategy with the intent of satisfying the requirements of Ontario Regulations 419 for dust
emissions, MOE NPC-11527 and City of Ottawa By-laws for noise28, and MOE NPC-11929 for
ground vibrations. Proper planning will also require that pre-construction surveys be
undertaken for selected buildings along the tunnel corridor. 26 Best Practices for the Reduction of Air Emissions From Construction and Demolition Activities, March 2005, Cheminco Services Inc. 27 MOE, Model Municipal Noise Control By-Law, NPC-115 Construction Equipment, August 1978 28 City of Ottawa, Noise By-law ByLAW NO. 2004-253 29 MOE, Model Municipal Noise Control By-Law, NPC-119 Blasting, August 1978

Delcan Corporation DOTT EA – Air Quality, Noise and Vibration Page 57
7. SUMMARY AND CONCLUSIONS
The work summarized in this report compares existing and predicted future conditions for
noise, air quality and ground vibrations, in support of the Downtown Ottawa Transit Tunnel
(DOTT) Environmental Assessment. The project involves conversion of the current Transitway
carrying Bus Rapid Transit (BRT) into electric Light Rail Transit (LRT) between Tunney’s
Pasture Station on the west and Blair Station on the east.
7.1 Operational Impacts
AIR QUALITY
Introducing the DOTT project is expected to reduce levels of vehicle tailpipe emissions over
the majority of the corridor, including the downtown segment. For bus terminals and
surrounding areas, increased bus activity and associated diesel emissions, over time will be
outweighed by improvements in vehicle pollution technology involving the entire vehicle fleet.
As a result, the DOTT project is projected to have a net positive impact on the air quality of the
corridor, especially through the downtown core.
Under normal operations of the tunnel, dispersion analyses of ventilation shaft emissions reveal
that concentrations of particulates from brake dust fall below acceptable MOE limits. During
maintenance operations, ventilation shaft emissions from diesel generators produce occasional
minor violations of the criterion for NOX at two out of 300 considered locations under
reasonable worst-case conditions. The two locations are the proposed future site of the Ottawa
Public Library and the rooftop fresh air intake at 118 Sparks Street. Based on the level of
conservatism in the modelling assumptions, and the design flexibility at the library site, the
detailed design of the building and its mechanical system will create adequate opportunity to
mitigate any marginal air quality issues. For the building at 118 Sparks Street, a minor violation
of the NOX criterion occurs for one hour in five years, (which is equivalent to once in 43,800
hours), also based on the same conservative modelling assumptions. As such, the Sparks Street
site is considered to experience acceptable air quality without the need for mitigation.
Nonetheless, air quality monitoring during maintenance operations is recommended to establish
appropriate policies to ensure compliance with the MOE O.Reg. 419, Air Quality Standards.
Delcan Corporation DOTT EA – Air Quality, Noise and Vibration Page 58
Simulation of fire conditions in the tunnel indicates that smoke and other combustion products
discharged from ventilation shafts can produce hazardous concentrations at fresh air intakes of
nearby buildings. Although emergency conditions are not constrained by MOE regulations,
given the low risk and uncertain location of affected shafts, it is recommended that heat and
smoke detectors for automatic damper control of fresh air intakes of selected buildings be
installed approximately within one block radius of each ventilation shaft, as indicated on
Figures 6 to 11. The same analysis during fire scenarios indicate that station entrances remain
sufficiently free of contamination, thereby allowing safe egress of patrons in an emergency.
Due to the nature of the vehicles being maintained, operations of the M & S Facility are
expected to generate minor air emissions consistent with a light industrial facility. The impacts
and necessary controls for air quality will be determined during the detailed design and project
implementation phase according to protocols established by the MOE’s C of A process.
AIRBORNE NOISE
Comparisons of existing and future conditions above grade indicate that despite increases in
noise levels at some locations due to converting the Transitway from BRT to LRT, noise levels
at most receptors are dominated by existing sources, such as Highway 417 and Scott Street. As
a result, mitigation is necessary and recommended only for the one area adversely impacted by
the construction of the LRT, which is on the north side of the Transitway between Parkdale
Avenue and Merton Street extension. In this area, suitable mitigation comprises a physical
noise barrier, approximately 2.4 m tall, installed adjacent to the property lines of the affected
residences and place of worship within the City’s right-of-way. The general layout and extent
of the required noise barriers are illustrated in Figure 3.
Noise created by the operation of the M & S Facility, ventilation shafts, and electrical
substations, particularly during nighttime operations, will be assessed and controlled to City of
Ottawa ENCG standards according to the MOE’s C of A protocol.
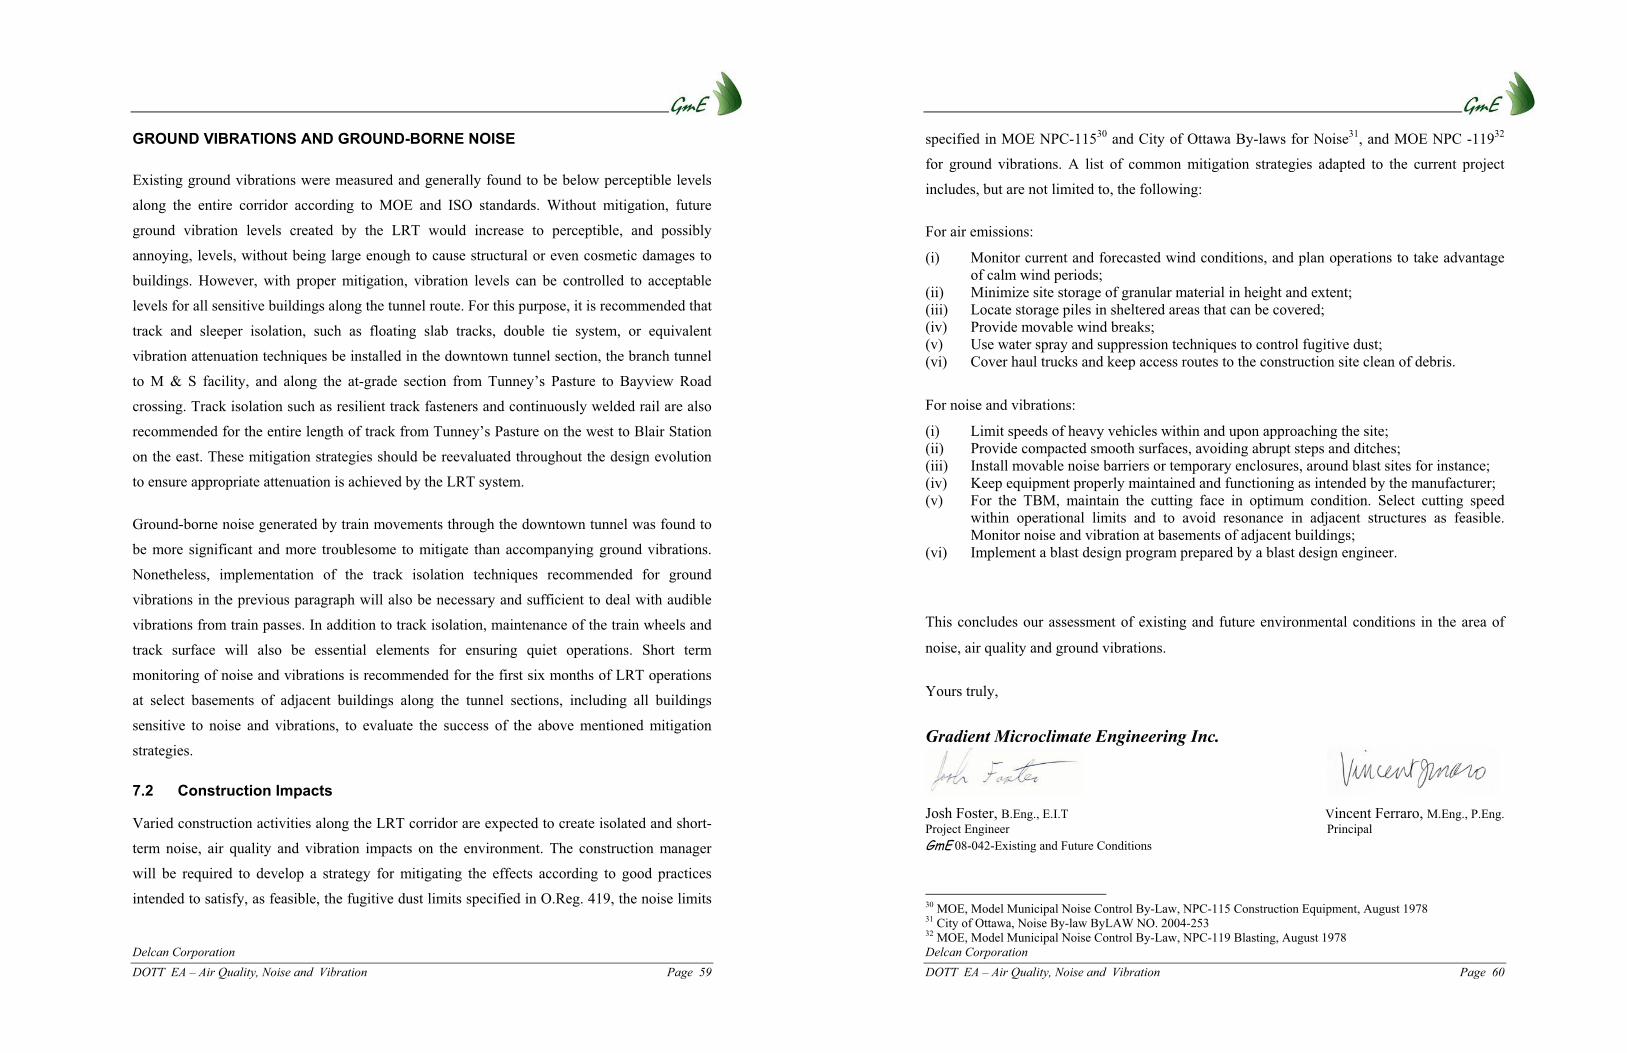
Delcan Corporation DOTT EA – Air Quality, Noise and Vibration Page 59
GROUND VIBRATIONS AND GROUND-BORNE NOISE
Existing ground vibrations were measured and generally found to be below perceptible levels
along the entire corridor according to MOE and ISO standards. Without mitigation, future
ground vibration levels created by the LRT would increase to perceptible, and possibly
annoying, levels, without being large enough to cause structural or even cosmetic damages to
buildings. However, with proper mitigation, vibration levels can be controlled to acceptable
levels for all sensitive buildings along the tunnel route. For this purpose, it is recommended that
track and sleeper isolation, such as floating slab tracks, double tie system, or equivalent
vibration attenuation techniques be installed in the downtown tunnel section, the branch tunnel
to M & S facility, and along the at-grade section from Tunney’s Pasture to Bayview Road
crossing. Track isolation such as resilient track fasteners and continuously welded rail are also
recommended for the entire length of track from Tunney’s Pasture on the west to Blair Station
on the east. These mitigation strategies should be reevaluated throughout the design evolution
to ensure appropriate attenuation is achieved by the LRT system.
Ground-borne noise generated by train movements through the downtown tunnel was found to
be more significant and more troublesome to mitigate than accompanying ground vibrations.
Nonetheless, implementation of the track isolation techniques recommended for ground
vibrations in the previous paragraph will also be necessary and sufficient to deal with audible
vibrations from train passes. In addition to track isolation, maintenance of the train wheels and
track surface will also be essential elements for ensuring quiet operations. Short term
monitoring of noise and vibrations is recommended for the first six months of LRT operations
at select basements of adjacent buildings along the tunnel sections, including all buildings
sensitive to noise and vibrations, to evaluate the success of the above mentioned mitigation
strategies.
7.2 Construction Impacts
Varied construction activities along the LRT corridor are expected to create isolated and short-
term noise, air quality and vibration impacts on the environment. The construction manager
will be required to develop a strategy for mitigating the effects according to good practices
intended to satisfy, as feasible, the fugitive dust limits specified in O.Reg. 419, the noise limits
Delcan Corporation DOTT EA – Air Quality, Noise and Vibration Page 60
specified in MOE NPC-11530 and City of Ottawa By-laws for Noise31, and MOE NPC -11932
for ground vibrations. A list of common mitigation strategies adapted to the current project
includes, but are not limited to, the following:
For air emissions:
(i) Monitor current and forecasted wind conditions, and plan operations to take advantage of calm wind periods;
(ii) Minimize site storage of granular material in height and extent; (iii) Locate storage piles in sheltered areas that can be covered; (iv) Provide movable wind breaks; (v) Use water spray and suppression techniques to control fugitive dust; (vi) Cover haul trucks and keep access routes to the construction site clean of debris.
For noise and vibrations:
(i) Limit speeds of heavy vehicles within and upon approaching the site; (ii) Provide compacted smooth surfaces, avoiding abrupt steps and ditches; (iii) Install movable noise barriers or temporary enclosures, around blast sites for instance; (iv) Keep equipment properly maintained and functioning as intended by the manufacturer; (v) For the TBM, maintain the cutting face in optimum condition. Select cutting speed
within operational limits and to avoid resonance in adjacent structures as feasible. Monitor noise and vibration at basements of adjacent buildings;
(vi) Implement a blast design program prepared by a blast design engineer.
This concludes our assessment of existing and future environmental conditions in the area of
noise, air quality and ground vibrations.
Yours truly,
Gradient Microclimate Engineering Inc.
Josh Foster, B.Eng., E.I.T Vincent Ferraro, M.Eng., P.Eng. Project Engineer Principal GmE 08-042-Existing and Future Conditions
30 MOE, Model Municipal Noise Control By-Law, NPC-115 Construction Equipment, August 1978 31 City of Ottawa, Noise By-law ByLAW NO. 2004-253 32 MOE, Model Municipal Noise Control By-Law, NPC-119 Blasting, August 1978


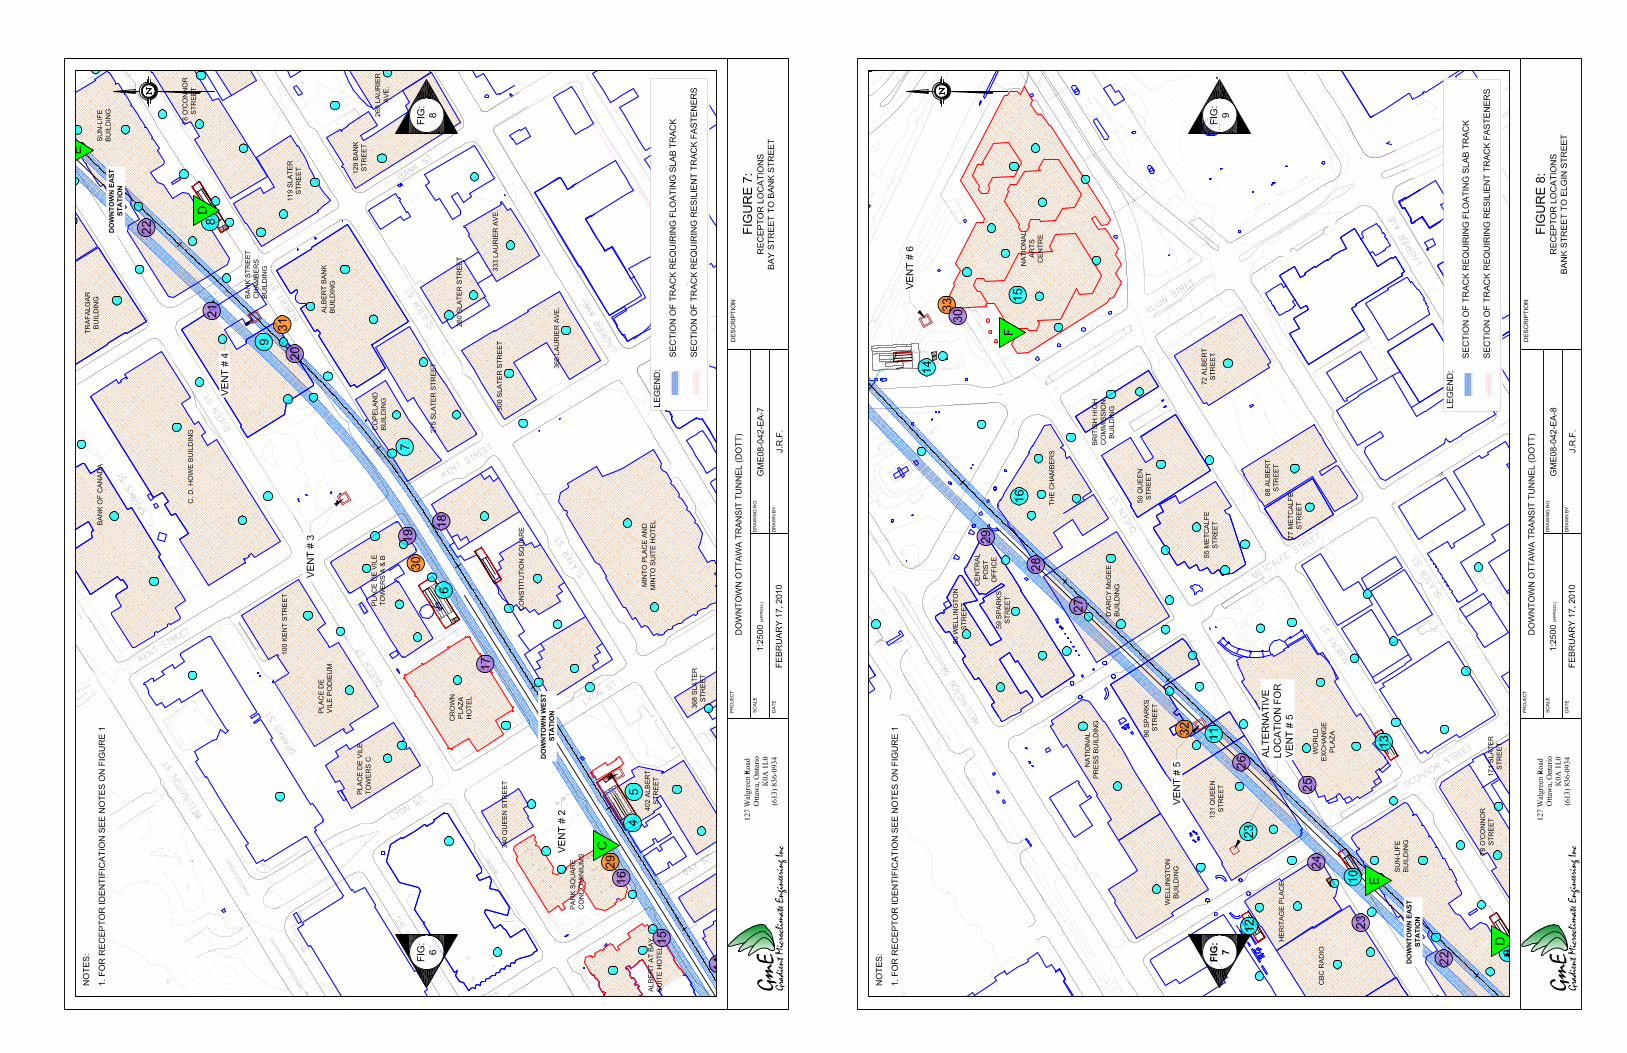
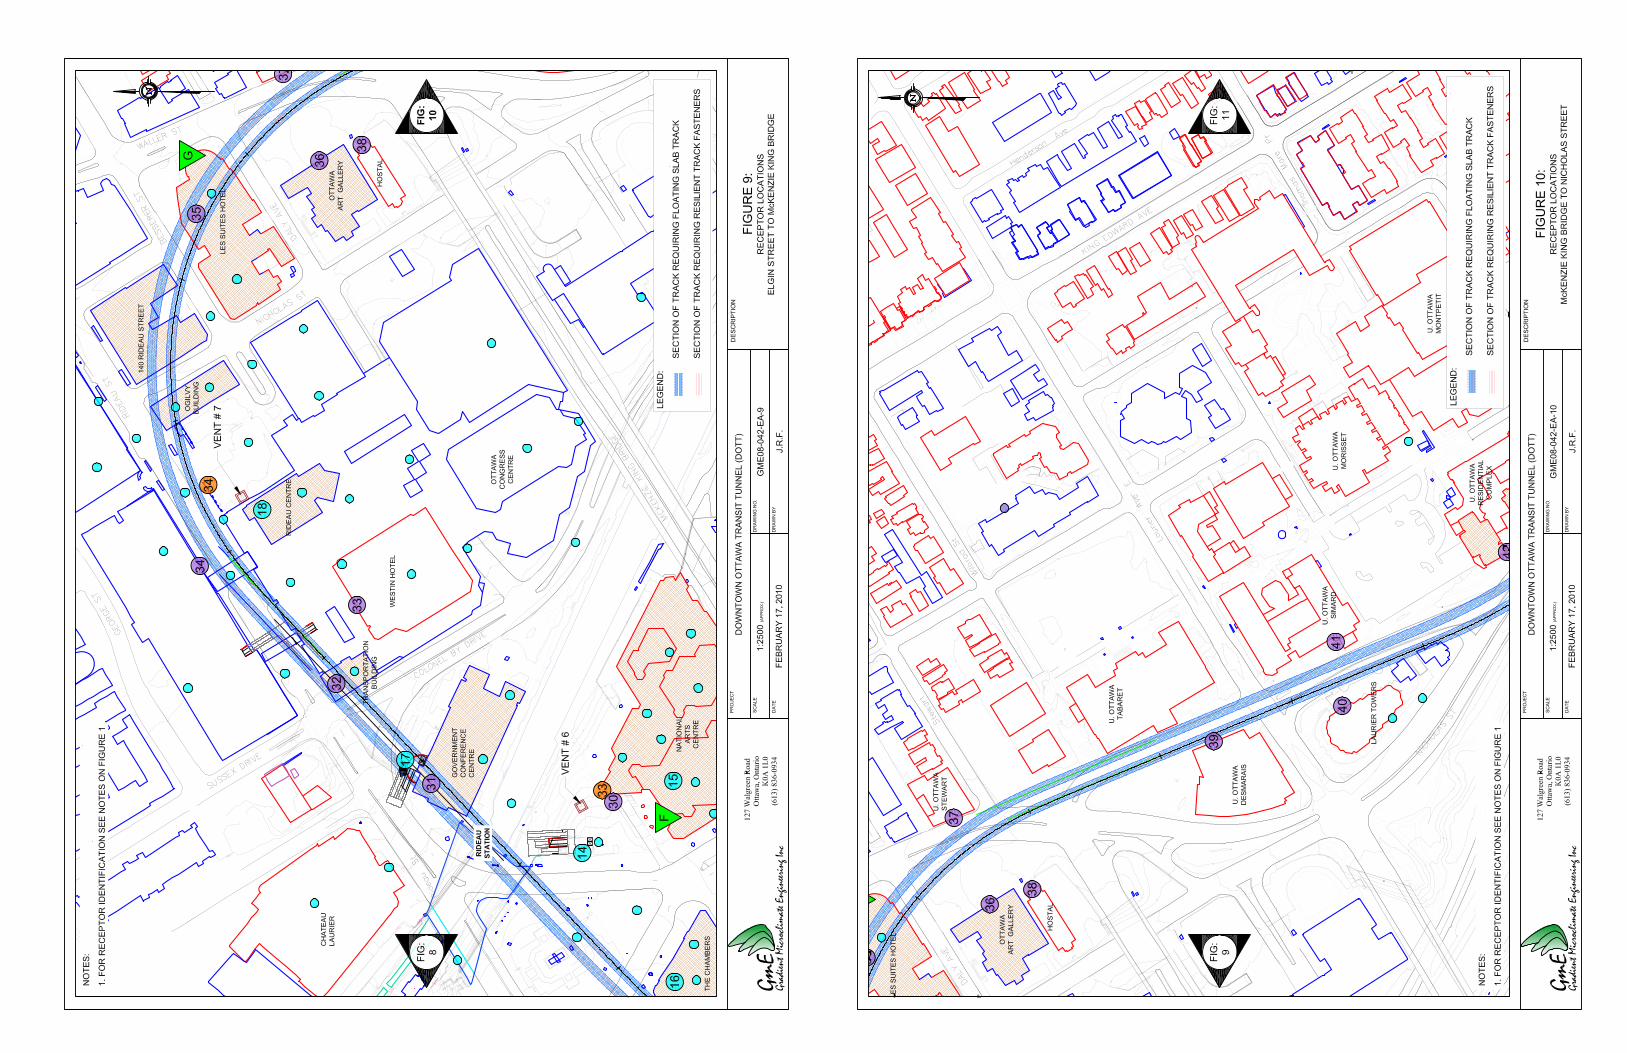


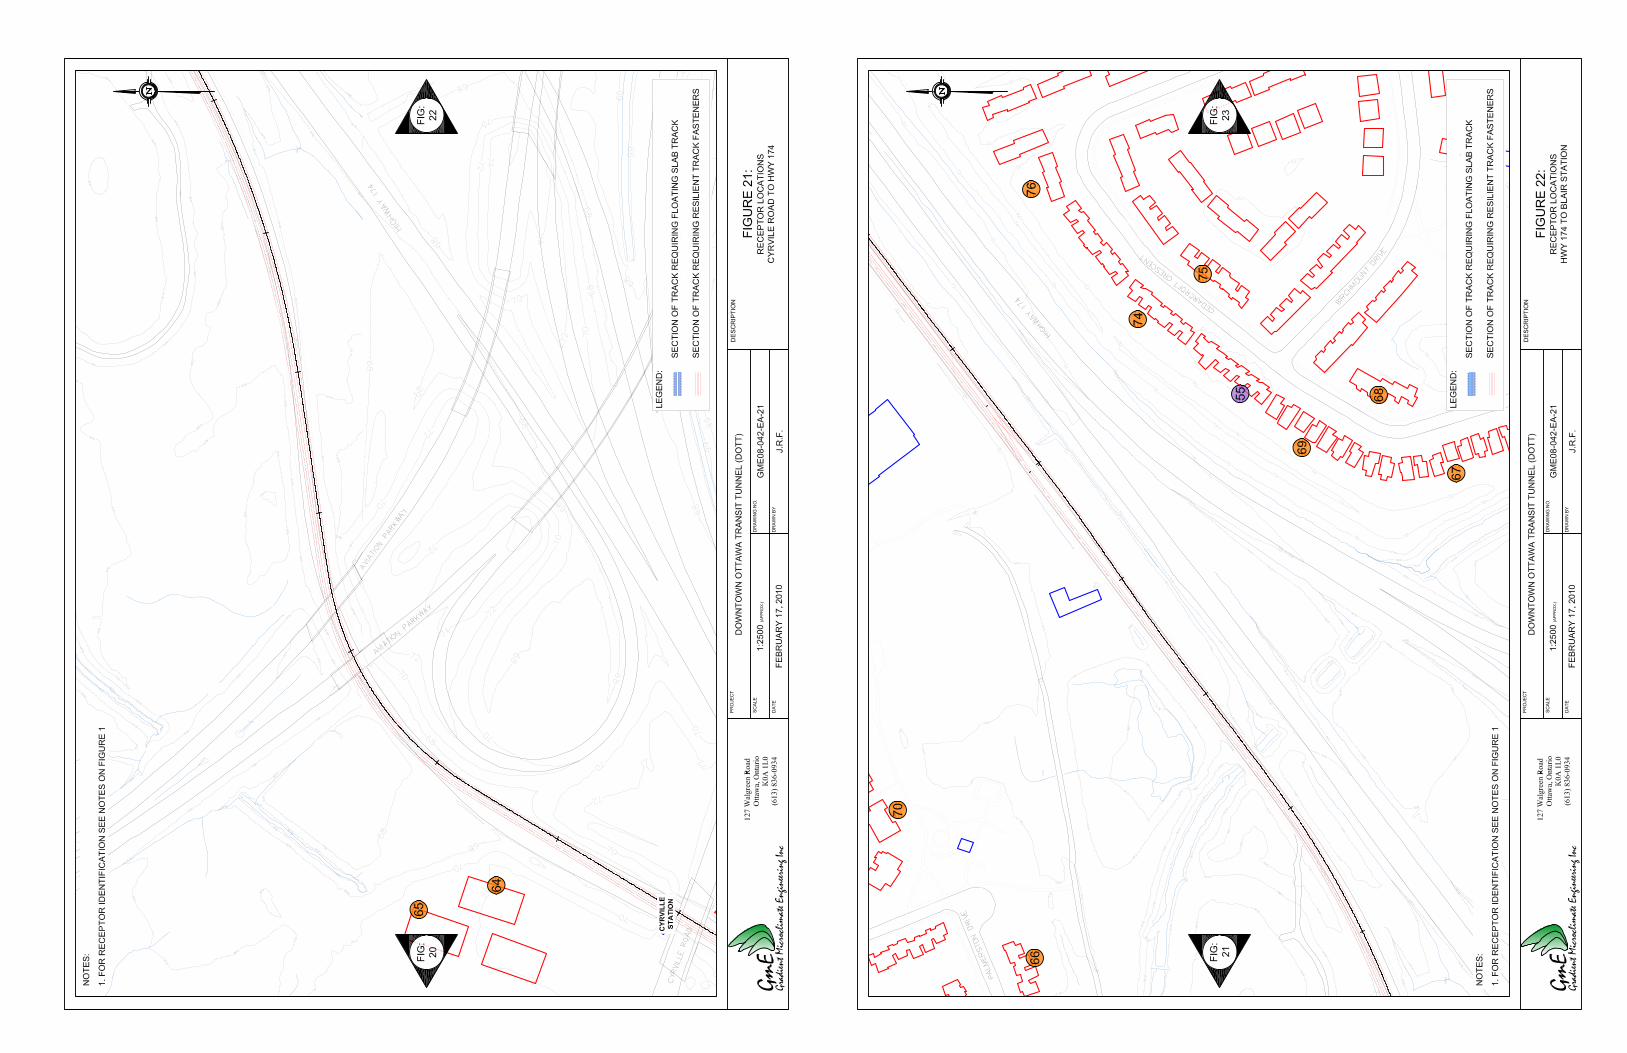
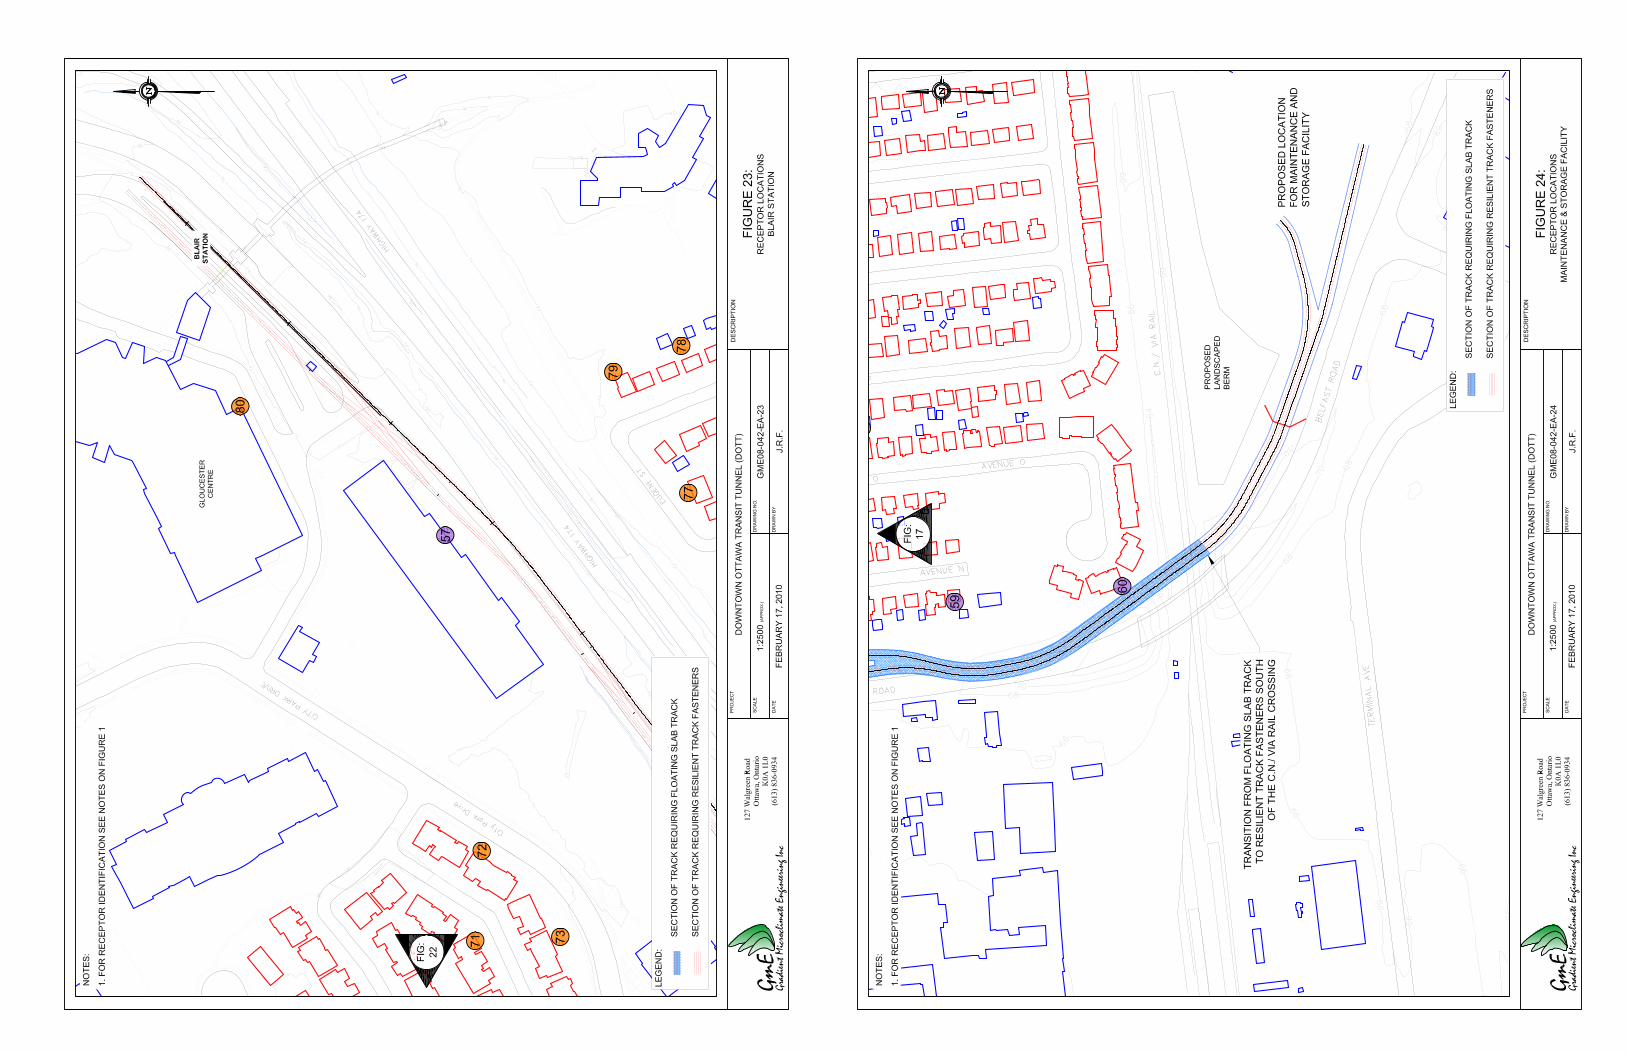
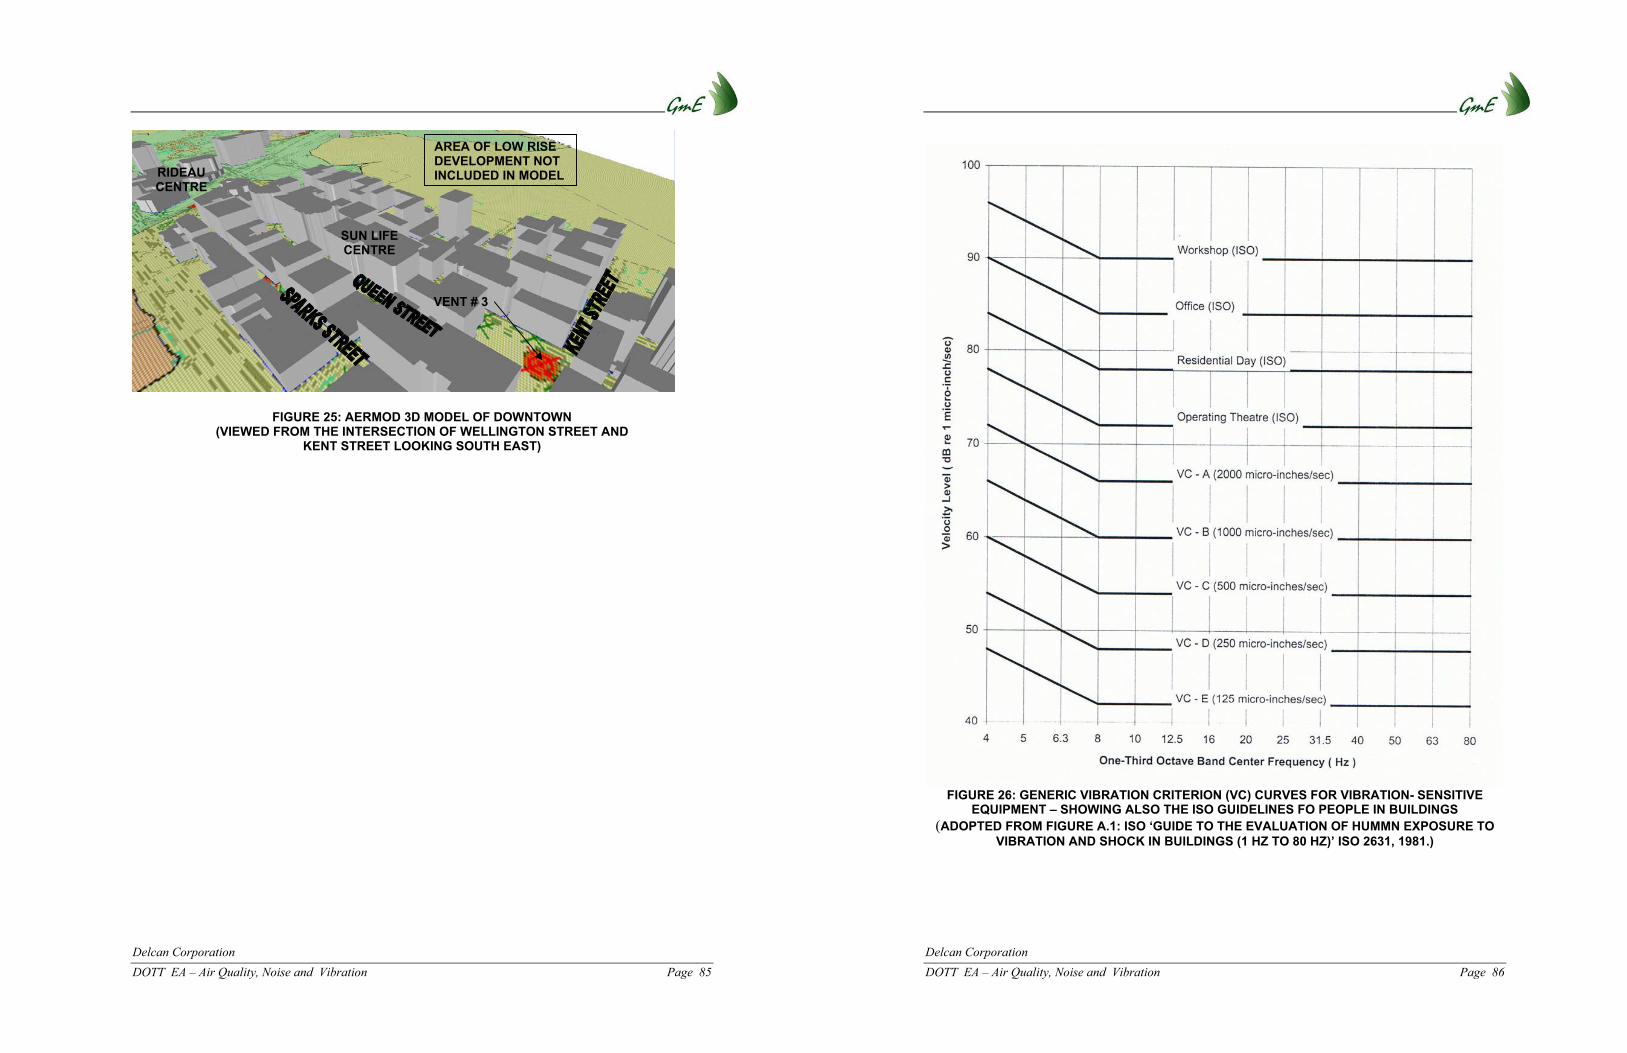
Delcan Corporation DOTT EA – Air Quality, Noise and Vibration Page 85
FIGURE 25: AERMOD 3D MODEL OF DOWNTOWN (VIEWED FROM THE INTERSECTION OF WELLINGTON STREET AND
KENT STREET LOOKING SOUTH EAST)
AREA OF LOW RISE DEVELOPMENT NOT INCLUDED IN MODELRIDEAU
CENTRE
SUN LIFECENTRE
VENT # 3
Delcan Corporation DOTT EA – Air Quality, Noise and Vibration Page 86
FIGURE 26: GENERIC VIBRATION CRITERION (VC) CURVES FOR VIBRATION- SENSITIVE
EQUIPMENT – SHOWING ALSO THE ISO GUIDELINES FO PEOPLE IN BUILDINGS (ADOPTED FROM FIGURE A.1: ISO ‘GUIDE TO THE EVALUATION OF HUMMN EXPOSURE TO
VIBRATION AND SHOCK IN BUILDINGS (1 HZ TO 80 HZ)’ ISO 2631, 1981.)

Delcan Corporation DOTT EA – Air Quality, Noise and Vibration Page 87
FIGURE 27: FTA GENERALIZED CURVES OF VIBRATION LEVELS VERSES DISTANCE
(ADOPTED FROM FIGURE 10-1, FTA TRANSIT NOISE AND VIBRATION IMPACT ASSESSMENT)
Delcan Corporation DOTT EA – Air Quality, Noise and Vibration Page 88
FIGURE 28: VIBRATION LEVELS AT 18M FROM TRACK, TRAIN SPEED 80 KM/H
(ADOPTED FROM FIGURE 5, PARRAMATTA RAIL LINK – THE APPROACH TO CONTROLLING TRAIN REGENERATED NOISE AND VIBRATION)

Delcan Corporation DOTT EA – Air Quality, Noise and Vibration
APPENDICES A TO F FOUND ON ATTACHED CD
APPENDIX A: AMBIENT AIR QUALITY MODELLING OF EXISTING CONDITIONS INPUT AND OUTPUT DATA FOR CAL3QHC
APPENDIX B: AMBIENT AIR QUALITY MODELLING OF FUTURE CONDITIONS
INPUT AND OUTPUT DATA FOR CAL3QHC APPENDIX C: AIR DISPERSION MODELLING FOR VENTILATION SHAFTS
INPUT AND OUTPUT DATA FROM AERMOD APPENDIX D: NOISE MODELLING OF EXISTING CONDITIONS INPUT AND
OUTPUT DATA STAMSON 5.04 (Sample calculations of representative receptors are attached) APPENDIX E: NOISE MODELLING OF FUTURE CONDITIONS INPUT AND
OUTPUT DATA STAMSON 5.04 (Sample calculations of representative receptors are attached) APPENDIX F: FUTURE GROUND VIBRATION PREDICTIONS CALCULATIONS (Sample calculations of representative receptors are attached)

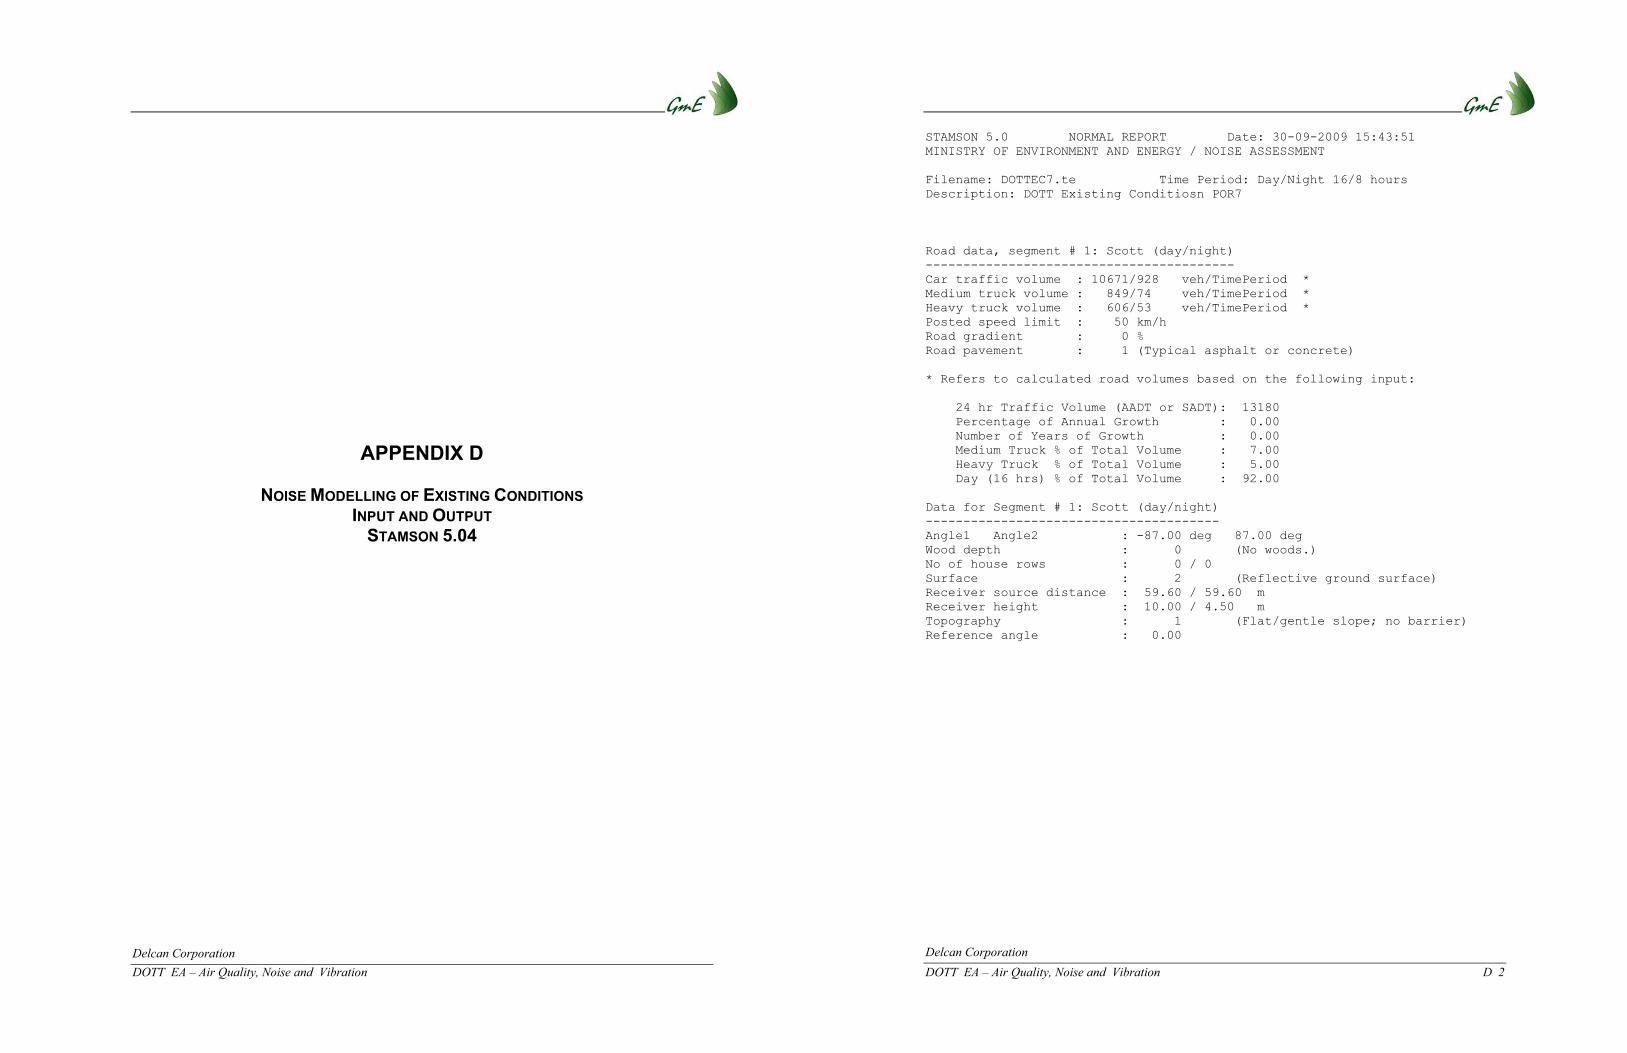
Delcan Corporation DOTT EA – Air Quality, Noise and Vibration
APPENDIX D
NOISE MODELLING OF EXISTING CONDITIONS INPUT AND OUTPUT
STAMSON 5.04
Delcan Corporation DOTT EA – Air Quality, Noise and Vibration D 2
STAMSON 5.0 NORMAL REPORT Date: 30-09-2009 15:43:51 MINISTRY OF ENVIRONMENT AND ENERGY / NOISE ASSESSMENT
Filename: DOTTEC7.te Time Period: Day/Night 16/8 hours Description: DOTT Existing Conditiosn POR7
Road data, segment # 1: Scott (day/night) -----------------------------------------Car traffic volume : 10671/928 veh/TimePeriod * Medium truck volume : 849/74 veh/TimePeriod * Heavy truck volume : 606/53 veh/TimePeriod * Posted speed limit : 50 km/h Road gradient : 0 % Road pavement : 1 (Typical asphalt or concrete)
* Refers to calculated road volumes based on the following input:
24 hr Traffic Volume (AADT or SADT): 13180 Percentage of Annual Growth : 0.00 Number of Years of Growth : 0.00 Medium Truck % of Total Volume : 7.00 Heavy Truck % of Total Volume : 5.00 Day (16 hrs) % of Total Volume : 92.00
Data for Segment # 1: Scott (day/night) ---------------------------------------Angle1 Angle2 : -87.00 deg 87.00 deg Wood depth : 0 (No woods.) No of house rows : 0 / 0Surface : 2 (Reflective ground surface) Receiver source distance : 59.60 / 59.60 m Receiver height : 10.00 / 4.50 m Topography : 1 (Flat/gentle slope; no barrier) Reference angle : 0.00

Delcan Corporation DOTT EA – Air Quality, Noise and Vibration D 3
Road data, segment # 2: Parkdale (day/night) --------------------------------------------Car traffic volume : 7758/675 veh/TimePeriod * Medium truck volume : 617/54 veh/TimePeriod * Heavy truck volume : 441/38 veh/TimePeriod * Posted speed limit : 50 km/h Road gradient : 0 % Road pavement : 1 (Typical asphalt or concrete)
* Refers to calculated road volumes based on the following input:
24 hr Traffic Volume (AADT or SADT): 9582 Percentage of Annual Growth : 0.00 Number of Years of Growth : 0.00 Medium Truck % of Total Volume : 7.00 Heavy Truck % of Total Volume : 5.00 Day (16 hrs) % of Total Volume : 92.00
Data for Segment # 2: Parkdale (day/night) ------------------------------------------Angle1 Angle2 : -80.00 deg 0.00 deg Wood depth : 0 (No woods.) No of house rows : 0 / 0Surface : 2 (Reflective ground surface) Receiver source distance : 27.50 / 27.50 m Receiver height : 10.00 / 4.50 m Topography : 1 (Flat/gentle slope; no barrier) Reference angle : 0.00
Delcan Corporation DOTT EA – Air Quality, Noise and Vibration D 4
Results segment # 1: Scott (day) --------------------------------
Source height = 1.50 m
ROAD (0.00 + 61.78 + 0.00) = 61.78 dBA Angle1 Angle2 Alpha RefLeq P.Adj D.Adj F.Adj W.Adj H.Adj B.Adj SubLeq ---------------------------------------------------------------------------- -87 87 0.00 67.92 0.00 -5.99 -0.15 0.00 0.00 0.00 61.78 ----------------------------------------------------------------------------
Segment Leq : 61.78 dBA
Results segment # 2: Parkdale (day) -----------------------------------
Source height = 1.50 m
ROAD (0.00 + 60.38 + 0.00) = 60.38 dBA Angle1 Angle2 Alpha RefLeq P.Adj D.Adj F.Adj W.Adj H.Adj B.Adj SubLeq ---------------------------------------------------------------------------- -80 0 0.00 66.54 0.00 -2.63 -3.52 0.00 0.00 0.00 60.38 ----------------------------------------------------------------------------
Segment Leq : 60.38 dBA
Total Leq All Segments: 64.15 dBA

Delcan Corporation DOTT EA – Air Quality, Noise and Vibration D 5
Results segment # 1: Scott (night) ----------------------------------
Source height = 1.50 m
ROAD (0.00 + 54.20 + 0.00) = 54.20 dBA Angle1 Angle2 Alpha RefLeq P.Adj D.Adj F.Adj W.Adj H.Adj B.Adj SubLeq ---------------------------------------------------------------------------- -87 87 0.00 60.34 0.00 -5.99 -0.15 0.00 0.00 0.00 54.20 ----------------------------------------------------------------------------
Segment Leq : 54.20 dBA
Results segment # 2: Parkdale (night) -------------------------------------
Source height = 1.49 m
ROAD (0.00 + 52.77 + 0.00) = 52.77 dBA Angle1 Angle2 Alpha RefLeq P.Adj D.Adj F.Adj W.Adj H.Adj B.Adj SubLeq ---------------------------------------------------------------------------- -80 0 0.00 58.92 0.00 -2.63 -3.52 0.00 0.00 0.00 52.77 ----------------------------------------------------------------------------
Segment Leq : 52.77 dBA
Total Leq All Segments: 56.55 dBA
Delcan Corporation DOTT EA – Air Quality, Noise and Vibration D 6
RT/Custom data, segment # 1: Transitway (day/night) ---------------------------------------------------1 - Bus: Traffic volume : 1980/227 veh/TimePeriod Speed : 70 km/h
Data for Segment # 1: Transitway (day/night) --------------------------------------------Angle1 Angle2 : -87.00 deg 87.00 deg Wood depth : 0 (No woods.) No of house rows : 0 / 0Surface : 2 (Reflective ground surface) Receiver source distance : 30.80 / 30.80 m Receiver height : 10.00 / 4.50 m Topography : 3 (Elevated; no barrier) Elevation : 7.70 m Reference angle : 0.00

Delcan Corporation DOTT EA – Air Quality, Noise and Vibration D 7
Results segment # 1: Transitway (day) -------------------------------------
Source height = 0.50 m
RT/Custom (0.00 + 64.91 + 0.00) = 64.91 dBA Angle1 Angle2 Alpha RefLeq D.Adj F.Adj W.Adj H.Adj B.Adj SubLeq ---------------------------------------------------------------------- -87 87 0.00 68.18 -3.12 -0.15 0.00 0.00 0.00 64.91 ----------------------------------------------------------------------
Segment Leq : 64.91 dBA
Total Leq All Segments: 64.91 dBA
Results segment # 1: Transitway (night) ---------------------------------------
Source height = 0.50 m
RT/Custom (0.00 + 58.52 + 0.00) = 58.52 dBA Angle1 Angle2 Alpha RefLeq D.Adj F.Adj W.Adj H.Adj B.Adj SubLeq ---------------------------------------------------------------------- -87 87 0.00 61.79 -3.12 -0.15 0.00 0.00 0.00 58.52 ----------------------------------------------------------------------
Segment Leq : 58.52 dBA
Total Leq All Segments: 58.52 dBA
TOTAL Leq FROM ALL SOURCES (DAY): 67.56 (NIGHT): 60.66
Delcan Corporation DOTT EA – Air Quality, Noise and Vibration D 8
STAMSON 5.0 NORMAL REPORT Date: 05-10-2009 16:12:43 MINISTRY OF ENVIRONMENT AND ENERGY / NOISE ASSESSMENT
Filename: dottec52.te Time Period: Day/Night 16/8 hours Description: DOTT Existing Conditions POR 52
Road data, segment # 1: Hwy 417 (day/night) -------------------------------------------Car traffic volume : 117635/10229 veh/TimePeriod * Medium truck volume : 9357/814 veh/TimePeriod * Heavy truck volume : 6684/581 veh/TimePeriod * Posted speed limit : 100 km/h Road gradient : 0 % Road pavement : 1 (Typical asphalt or concrete)
* Refers to calculated road volumes based on the following input:
24 hr Traffic Volume (AADT or SADT): 145300 Percentage of Annual Growth : 0.00 Number of Years of Growth : 0.00 Medium Truck % of Total Volume : 7.00 Heavy Truck % of Total Volume : 5.00 Day (16 hrs) % of Total Volume : 92.00
Data for Segment # 1: Hwy 417 (day/night) -----------------------------------------Angle1 Angle2 : -80.00 deg 87.00 deg Wood depth : 0 (No woods.) No of house rows : 0 / 0Surface : 1 (Absorptive ground surface) Receiver source distance : 102.20 / 102.20 m Receiver height : 1.50 / 4.50 m Topography : 4 (Elevated; with barrier) Barrier angle1 : -80.00 deg Angle2 : 87.00 deg Barrier height : 6.50 m Elevation : 3.70 m Barrier receiver distance : 40.00 / 40.00 m Source elevation : 63.30 m Receiver elevation : 67.00 m Barrier elevation : 63.50 m Reference angle : 0.00

Delcan Corporation DOTT EA – Air Quality, Noise and Vibration D 9
Road data, segment # 2: Tremblay (day/night) --------------------------------------------Car traffic volume : 3643/317 veh/TimePeriod * Medium truck volume : 290/25 veh/TimePeriod * Heavy truck volume : 207/18 veh/TimePeriod * Posted speed limit : 50 km/h Road gradient : 0 % Road pavement : 1 (Typical asphalt or concrete)
* Refers to calculated road volumes based on the following input:
24 hr Traffic Volume (AADT or SADT): 4500 Percentage of Annual Growth : 0.00 Number of Years of Growth : 0.00 Medium Truck % of Total Volume : 7.00 Heavy Truck % of Total Volume : 5.00 Day (16 hrs) % of Total Volume : 92.00
Data for Segment # 2: Tremblay (day/night) ------------------------------------------Angle1 Angle2 : -87.00 deg 87.00 deg Wood depth : 0 (No woods.) No of house rows : 0 / 0Surface : 1 (Absorptive ground surface) Receiver source distance : 15.00 / 15.00 m Receiver height : 1.50 / 4.50 m Topography : 1 (Flat/gentle slope; no barrier) Reference angle : 0.00
Delcan Corporation DOTT EA – Air Quality, Noise and Vibration D 10
Results segment # 1: Hwy 417 (day) ----------------------------------
Source height = 1.50 m
Barrier height for grazing incidence ------------------------------------Source ! Receiver ! Barrier ! Elevation of Height (m) ! Height (m) ! Height (m) ! Barrier Top (m) ------------+-------------+-------------+-------------- 1.50 ! 1.50 ! 3.55 ! 67.05
ROAD (0.00 + 65.08 + 0.00) = 65.08 dBA Angle1 Angle2 Alpha RefLeq P.Adj D.Adj F.Adj W.Adj H.Adj B.Adj SubLeq ---------------------------------------------------------------------------- -80 87 0.16 84.37 0.00 -9.66 -0.66 0.00 0.00 -8.96 65.08----------------------------------------------------------------------------
Segment Leq : 65.08 dBA
Results segment # 2: Tremblay (day) -----------------------------------
Source height = 1.50 m
ROAD (0.00 + 61.78 + 0.00) = 61.78 dBA Angle1 Angle2 Alpha RefLeq P.Adj D.Adj F.Adj W.Adj H.Adj B.Adj SubLeq ---------------------------------------------------------------------------- -87 87 0.66 63.25 0.00 0.00 -1.47 0.00 0.00 0.00 61.78 ----------------------------------------------------------------------------
Segment Leq : 61.78 dBA
Total Leq All Segments: 66.75 dBA

Delcan Corporation DOTT EA – Air Quality, Noise and Vibration D 11
Results segment # 1: Hwy 417 (night) ------------------------------------
Source height = 1.50 m
Barrier height for grazing incidence ------------------------------------Source ! Receiver ! Barrier ! Elevation of Height (m) ! Height (m) ! Height (m) ! Barrier Top (m) ------------+-------------+-------------+-------------- 1.50 ! 4.50 ! 5.38 ! 68.88
ROAD (0.00 + 61.54 + 0.00) = 61.54 dBA Angle1 Angle2 Alpha RefLeq P.Adj D.Adj F.Adj W.Adj H.Adj B.Adj SubLeq ---------------------------------------------------------------------------- -80 87 0.07 76.77 0.00 -8.91 -0.48 0.00 0.00 -5.85 61.54----------------------------------------------------------------------------
Segment Leq : 61.54 dBA
Results segment # 2: Tremblay (night) -------------------------------------
Source height = 1.50 m
ROAD (0.00 + 54.32 + 0.00) = 54.32 dBA Angle1 Angle2 Alpha RefLeq P.Adj D.Adj F.Adj W.Adj H.Adj B.Adj SubLeq ---------------------------------------------------------------------------- -87 87 0.57 55.65 0.00 0.00 -1.33 0.00 0.00 0.00 54.32 ----------------------------------------------------------------------------
Segment Leq : 54.32 dBA
Total Leq All Segments: 62.29 dBA
Delcan Corporation DOTT EA – Air Quality, Noise and Vibration D 12
RT/Custom data, segment # 1: Transitway (day/night) ---------------------------------------------------1 - Bus: Traffic volume : 1796/211 veh/TimePeriod Speed : 70 km/h
Data for Segment # 1: Transitway (day/night) --------------------------------------------Angle1 Angle2 : -70.00 deg 70.00 deg Wood depth : 0 (No woods.) No of house rows : 0 / 0Surface : 1 (Absorptive ground surface) Receiver source distance : 59.50 / 59.50 m Receiver height : 1.50 / 4.50 m Topography : 4 (Elevated; with barrier) Barrier angle1 : -70.00 deg Angle2 : 70.00 deg Barrier height : 6.50 m Elevation : 3.50 m Barrier receiver distance : 40.00 / 40.00 m Source elevation : 63.50 m Receiver elevation : 67.00 m Barrier elevation : 63.50 m Reference angle : 0.00
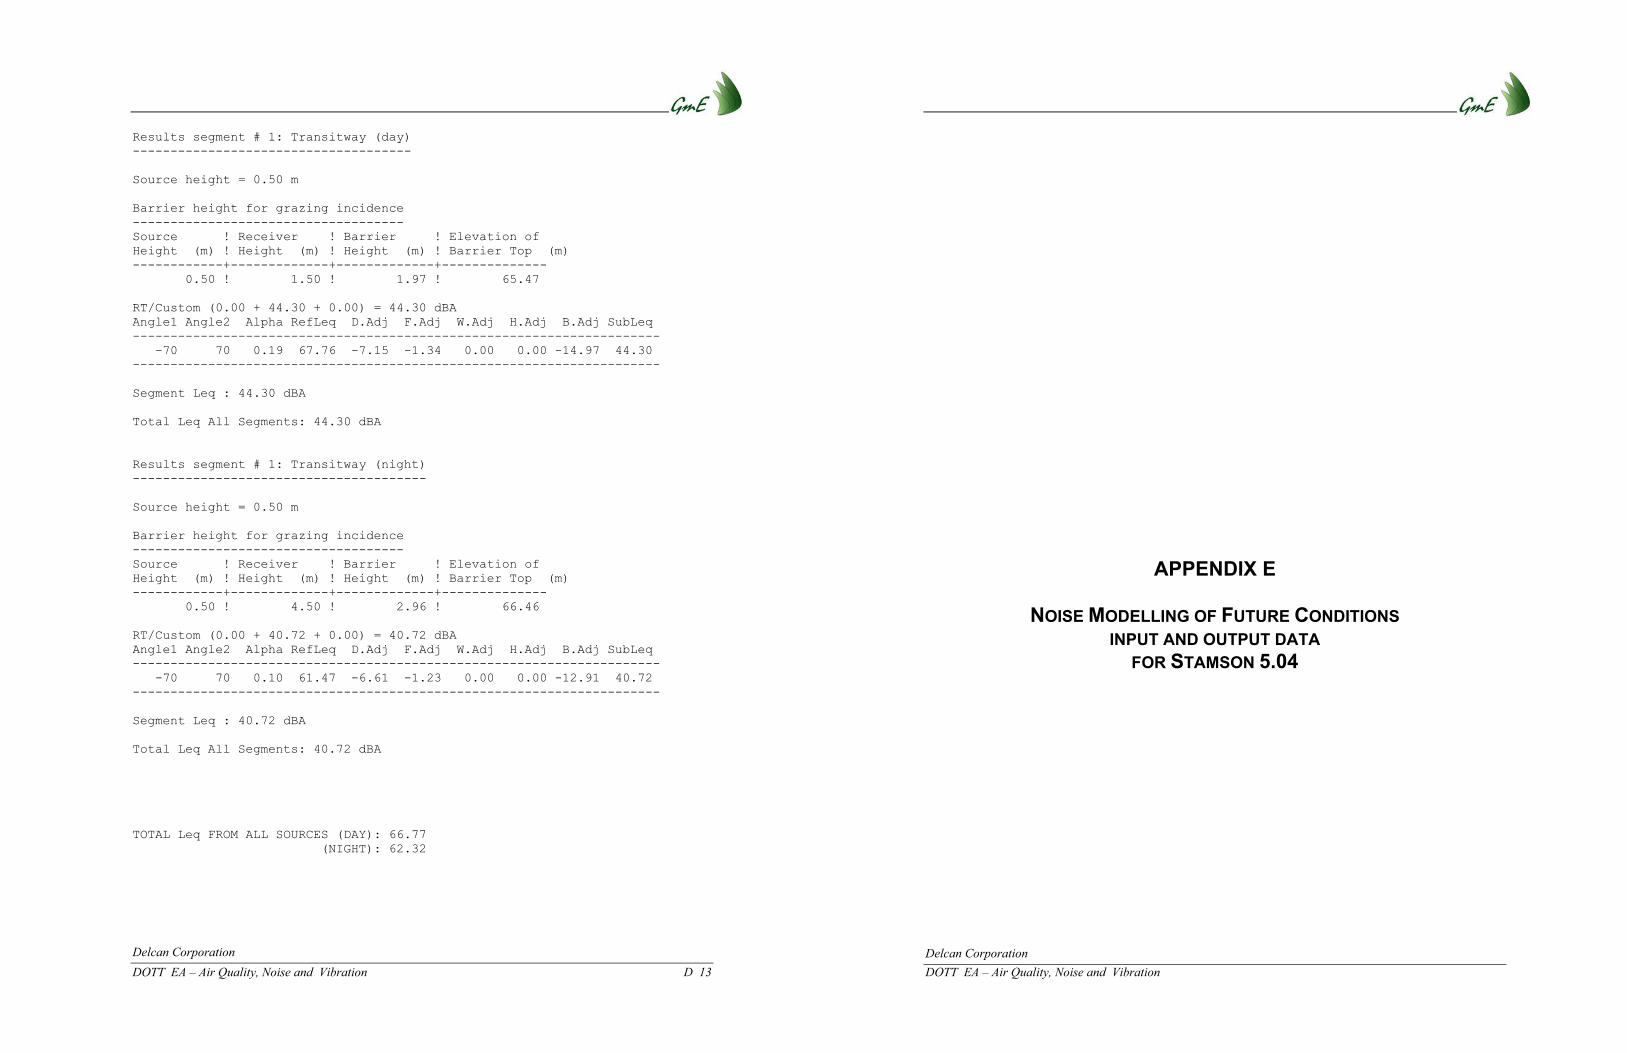
Delcan Corporation DOTT EA – Air Quality, Noise and Vibration D 13
Results segment # 1: Transitway (day) -------------------------------------
Source height = 0.50 m
Barrier height for grazing incidence ------------------------------------Source ! Receiver ! Barrier ! Elevation of Height (m) ! Height (m) ! Height (m) ! Barrier Top (m) ------------+-------------+-------------+-------------- 0.50 ! 1.50 ! 1.97 ! 65.47
RT/Custom (0.00 + 44.30 + 0.00) = 44.30 dBA Angle1 Angle2 Alpha RefLeq D.Adj F.Adj W.Adj H.Adj B.Adj SubLeq ---------------------------------------------------------------------- -70 70 0.19 67.76 -7.15 -1.34 0.00 0.00 -14.97 44.30----------------------------------------------------------------------
Segment Leq : 44.30 dBA
Total Leq All Segments: 44.30 dBA
Results segment # 1: Transitway (night) ---------------------------------------
Source height = 0.50 m
Barrier height for grazing incidence ------------------------------------Source ! Receiver ! Barrier ! Elevation of Height (m) ! Height (m) ! Height (m) ! Barrier Top (m) ------------+-------------+-------------+-------------- 0.50 ! 4.50 ! 2.96 ! 66.46
RT/Custom (0.00 + 40.72 + 0.00) = 40.72 dBA Angle1 Angle2 Alpha RefLeq D.Adj F.Adj W.Adj H.Adj B.Adj SubLeq ---------------------------------------------------------------------- -70 70 0.10 61.47 -6.61 -1.23 0.00 0.00 -12.91 40.72----------------------------------------------------------------------
Segment Leq : 40.72 dBA
Total Leq All Segments: 40.72 dBA
TOTAL Leq FROM ALL SOURCES (DAY): 66.77 (NIGHT): 62.32
Delcan Corporation DOTT EA – Air Quality, Noise and Vibration
APPENDIX E
NOISE MODELLING OF FUTURE CONDITIONS INPUT AND OUTPUT DATA
FOR STAMSON 5.04

Delcan Corporation DOTT EA – Air Quality, Noise and Vibration E 2
STAMSON 5.0 NORMAL REPORT Date: 10-12-2009 09:16:20 MINISTRY OF ENVIRONMENT AND ENERGY / NOISE ASSESSMENT
Filename: dottfc7.te Time Period: Day/Night 16/8 hours Description: DOTT Future Condition POR 7
Rail data, segment # 1: LRT (day/night) ---------------------------------------Train ! Trains ! Speed !# loc !# Cars! Eng !Cont Type ! !(km/h) !/Train!/Train! type !weld -----------------+-------------+-------+------+------+------+---- 1. train ! 540.0/60.0 ! 80.0 ! 1.0 ! 4.0 ! Elec! Yes
Data for Segment # 1: LRT (day/night) -------------------------------------Angle1 Angle2 : -87.00 deg 87.00 deg Wood depth : 0 (No woods.) No of house rows : 0 / 0Surface : 2 (Reflective ground surface) Receiver source distance : 30.80 / 30.80 m Receiver height : 10.00 / 10.00 m Topography : 3 (Elevated; no barrier) No Whistle Elevation : 7.70 m Reference angle : 0.00
Delcan Corporation DOTT EA – Air Quality, Noise and Vibration E 3
Results segment # 1: LRT (day) ------------------------------
LOCOMOTIVE (0.00 + 61.79 + 0.00) = 61.79 dBA Angle1 Angle2 Alpha RefLeq D.Adj F.Adj W.Adj H.Adj B.Adj SubLeq ---------------------------------------------------------------------- -87 87 0.00 65.06 -3.12 -0.15 0.00 0.00 0.00 61.79 ----------------------------------------------------------------------
WHEEL (0.00 + 65.78 + 0.00) = 65.78 dBA Angle1 Angle2 Alpha RefLeq D.Adj F.Adj W.Adj H.Adj B.Adj SubLeq ---------------------------------------------------------------------- -87 87 0.00 69.05 -3.12 -0.15 0.00 0.00 0.00 65.78 ----------------------------------------------------------------------
Segment Leq : 67.24 dBA
Total Leq All Segments: 67.24 dBA
Results segment # 1: LRT (night) --------------------------------
LOCOMOTIVE (0.00 + 55.26 + 0.00) = 55.26 dBA Angle1 Angle2 Alpha RefLeq D.Adj F.Adj W.Adj H.Adj B.Adj SubLeq ---------------------------------------------------------------------- -87 87 0.00 58.53 -3.12 -0.15 0.00 0.00 0.00 55.26 ----------------------------------------------------------------------
WHEEL (0.00 + 59.25 + 0.00) = 59.25 dBA Angle1 Angle2 Alpha RefLeq D.Adj F.Adj W.Adj H.Adj B.Adj SubLeq ---------------------------------------------------------------------- -87 87 0.00 62.52 -3.12 -0.15 0.00 0.00 0.00 59.25 ----------------------------------------------------------------------
Segment Leq : 60.71 dBA
Total Leq All Segments: 60.71 dBA

Delcan Corporation DOTT EA – Air Quality, Noise and Vibration E 4
Road data, segment # 1: Scott (day/night) -----------------------------------------Car traffic volume : 16496/1434 veh/TimePeriod * Medium truck volume : 1312/114 veh/TimePeriod * Heavy truck volume : 937/82 veh/TimePeriod * Posted speed limit : 50 km/h Road gradient : 0 % Road pavement : 1 (Typical asphalt or concrete)
* Refers to calculated road volumes based on the following input:
24 hr Traffic Volume (AADT or SADT): 20376 Percentage of Annual Growth : 0.00 Number of Years of Growth : 0.00 Medium Truck % of Total Volume : 7.00 Heavy Truck % of Total Volume : 5.00 Day (16 hrs) % of Total Volume : 92.00
Data for Segment # 1: Scott (day/night) ---------------------------------------Angle1 Angle2 : -87.00 deg 87.00 deg Wood depth : 0 (No woods.) No of house rows : 0 / 0Surface : 2 (Reflective ground surface) Receiver source distance : 59.60 / 59.60 m Receiver height : 10.00 / 4.50 m Topography : 1 (Flat/gentle slope; no barrier) Reference angle : 0.00
Delcan Corporation DOTT EA – Air Quality, Noise and Vibration E 5
Road data, segment # 2: Parkdale (day/night) --------------------------------------------Car traffic volume : 11993/1043 veh/TimePeriod * Medium truck volume : 954/83 veh/TimePeriod * Heavy truck volume : 681/59 veh/TimePeriod * Posted speed limit : 50 km/h Road gradient : 0 % Road pavement : 1 (Typical asphalt or concrete)
* Refers to calculated road volumes based on the following input:
24 hr Traffic Volume (AADT or SADT): 14814 Percentage of Annual Growth : 0.00 Number of Years of Growth : 0.00 Medium Truck % of Total Volume : 7.00 Heavy Truck % of Total Volume : 5.00 Day (16 hrs) % of Total Volume : 92.00
Data for Segment # 2: Parkdale (day/night) ------------------------------------------Angle1 Angle2 : -80.00 deg 0.00 deg Wood depth : 0 (No woods.) No of house rows : 0 / 0Surface : 2 (Reflective ground surface) Receiver source distance : 27.50 / 27.50 m Receiver height : 10.00 / 4.50 m Topography : 1 (Flat/gentle slope; no barrier) Reference angle : 0.00

Delcan Corporation DOTT EA – Air Quality, Noise and Vibration E 6
Results segment # 1: Scott (day) --------------------------------
Source height = 1.50 m
ROAD (0.00 + 63.67 + 0.00) = 63.67 dBA Angle1 Angle2 Alpha RefLeq P.Adj D.Adj F.Adj W.Adj H.Adj B.Adj SubLeq ---------------------------------------------------------------------------- -87 87 0.00 69.81 0.00 -5.99 -0.15 0.00 0.00 0.00 63.67 ----------------------------------------------------------------------------
Segment Leq : 63.67 dBA
Results segment # 2: Parkdale (day) -----------------------------------
Source height = 1.50 m
ROAD (0.00 + 62.27 + 0.00) = 62.27 dBA Angle1 Angle2 Alpha RefLeq P.Adj D.Adj F.Adj W.Adj H.Adj B.Adj SubLeq ---------------------------------------------------------------------------- -80 0 0.00 68.42 0.00 -2.63 -3.52 0.00 0.00 0.00 62.27 ----------------------------------------------------------------------------
Segment Leq : 62.27 dBA
Total Leq All Segments: 66.04 dBA
Delcan Corporation DOTT EA – Air Quality, Noise and Vibration E 7
Results segment # 1: Scott (night) ----------------------------------
Source height = 1.50 m
ROAD (0.00 + 56.09 + 0.00) = 56.09 dBA Angle1 Angle2 Alpha RefLeq P.Adj D.Adj F.Adj W.Adj H.Adj B.Adj SubLeq ---------------------------------------------------------------------------- -87 87 0.00 62.23 0.00 -5.99 -0.15 0.00 0.00 0.00 56.09 ----------------------------------------------------------------------------
Segment Leq : 56.09 dBA
Results segment # 2: Parkdale (night) -------------------------------------
Source height = 1.49 m
ROAD (0.00 + 54.66 + 0.00) = 54.66 dBA Angle1 Angle2 Alpha RefLeq P.Adj D.Adj F.Adj W.Adj H.Adj B.Adj SubLeq ---------------------------------------------------------------------------- -80 0 0.00 60.82 0.00 -2.63 -3.52 0.00 0.00 0.00 54.66 ----------------------------------------------------------------------------
Segment Leq : 54.66 dBA
Total Leq All Segments: 58.44 dBA
TOTAL Leq FROM ALL SOURCES (DAY): 69.69 (NIGHT): 62.73

Delcan Corporation DOTT EA – Air Quality, Noise and Vibration E 8
STAMSON 5.0 NORMAL REPORT Date: 09-12-2009 10:05:37 MINISTRY OF ENVIRONMENT AND ENERGY / NOISE ASSESSMENT
Filename: dottfc52.te Time Period: Day/Night 16/8 hours Description: DOTT Future Condition POR 52
Rail data, segment # 1: LRT (day/night) ---------------------------------------Train ! Trains ! Speed !# loc !# Cars! Eng !Cont Type ! !(km/h) !/Train!/Train! type !weld -----------------+-------------+-------+------+------+------+---- 1. train ! 540.0/60.0 ! 80.0 ! 1.0 ! 4.0 ! Elec! Yes
Data for Segment # 1: LRT (day/night) -------------------------------------Angle1 Angle2 : -70.00 deg 70.00 deg Wood depth : 0 (No woods.) No of house rows : 0 / 0Surface : 1 (Absorptive ground surface) Receiver source distance : 59.50 / 59.50 m Receiver height : 1.50 / 4.50 m Topography : 4 (Elevated; with barrier) No Whistle Barrier angle1 : -70.00 deg Angle2 : 70.00 deg Barrier height : 6.50 m Elevation : 3.50 m Barrier receiver distance : 40.00 / 40.00 m Source elevation : 63.50 m Receiver elevation : 67.00 m Barrier elevation : 63.50 m Reference angle : 0.00
Delcan Corporation DOTT EA – Air Quality, Noise and Vibration E 9
Results segment # 1: LRT (day) ------------------------------
Barrier height for grazing incidence ------------------------------------Source ! Receiver ! Barrier ! Elevation of Height (m) ! Height (m) ! Height (m) ! Barrier Top (m) ------------+-------------+-------------+-------------- 4.00 ! 1.50 ! 4.33 ! 67.83 0.50 ! 1.50 ! 1.97 ! 65.47
LOCOMOTIVE (0.00 + 47.75 + 0.00) = 47.75 dBA Angle1 Angle2 Alpha RefLeq D.Adj F.Adj W.Adj H.Adj B.Adj SubLeq ---------------------------------------------------------------------- -70 70 0.09 65.06 -6.52 -1.21 0.00 0.00 -9.58 47.75----------------------------------------------------------------------
WHEEL (0.00 + 45.59 + 0.00) = 45.59 dBA Angle1 Angle2 Alpha RefLeq D.Adj F.Adj W.Adj H.Adj B.Adj SubLeq ---------------------------------------------------------------------- -70 70 0.19 69.05 -7.15 -1.34 0.00 0.00 -14.97 45.59----------------------------------------------------------------------
Segment Leq : 49.81 dBA
Total Leq All Segments: 49.81 dBA
Results segment # 1: LRT (night) --------------------------------
Barrier height for grazing incidence ------------------------------------Source ! Receiver ! Barrier ! Elevation of Height (m) ! Height (m) ! Height (m) ! Barrier Top (m) ------------+-------------+-------------+-------------- 4.00 ! 4.50 ! 5.31 ! 68.81 0.50 ! 4.50 ! 2.96 ! 66.46
LOCOMOTIVE (0.00 + 44.63 + 0.00) = 44.63 dBA Angle1 Angle2 Alpha RefLeq D.Adj F.Adj W.Adj H.Adj B.Adj SubLeq ---------------------------------------------------------------------- -70 70 0.00 58.53 -5.98 -1.09 0.00 0.00 -6.83 44.63----------------------------------------------------------------------
WHEEL (0.00 + 41.77 + 0.00) = 41.77 dBA Angle1 Angle2 Alpha RefLeq D.Adj F.Adj W.Adj H.Adj B.Adj SubLeq ---------------------------------------------------------------------- -70 70 0.10 62.52 -6.61 -1.23 0.00 0.00 -12.91 41.77----------------------------------------------------------------------
Segment Leq : 46.44 dBA
Total Leq All Segments: 46.44 dBA

Delcan Corporation DOTT EA – Air Quality, Noise and Vibration E 10
Road data, segment # 1: Hwy 417 (day/night) -------------------------------------------Car traffic volume : 117635/10229 veh/TimePeriod * Medium truck volume : 9357/814 veh/TimePeriod * Heavy truck volume : 6684/581 veh/TimePeriod * Posted speed limit : 100 km/h Road gradient : 0 % Road pavement : 1 (Typical asphalt or concrete)
* Refers to calculated road volumes based on the following input:
24 hr Traffic Volume (AADT or SADT): 145300 Percentage of Annual Growth : 0.00 Number of Years of Growth : 0.00 Medium Truck % of Total Volume : 7.00 Heavy Truck % of Total Volume : 5.00 Day (16 hrs) % of Total Volume : 92.00
Data for Segment # 1: Hwy 417 (day/night) -----------------------------------------Angle1 Angle2 : -80.00 deg 87.00 deg Wood depth : 0 (No woods.) No of house rows : 0 / 0Surface : 1 (Absorptive ground surface) Receiver source distance : 102.20 / 102.20 m Receiver height : 1.50 / 4.50 m Topography : 4 (Elevated; with barrier) Barrier angle1 : -80.00 deg Angle2 : 87.00 deg Barrier height : 6.50 m Elevation : 3.70 m Barrier receiver distance : 40.00 / 40.00 m Source elevation : 63.30 m Receiver elevation : 67.00 m Barrier elevation : 63.50 m Reference angle : 0.00
Delcan Corporation DOTT EA – Air Quality, Noise and Vibration E 11
Road data, segment # 2: Tremblay (day/night) --------------------------------------------Car traffic volume : 3643/317 veh/TimePeriod * Medium truck volume : 290/25 veh/TimePeriod * Heavy truck volume : 207/18 veh/TimePeriod * Posted speed limit : 50 km/h Road gradient : 0 % Road pavement : 1 (Typical asphalt or concrete)
* Refers to calculated road volumes based on the following input:
24 hr Traffic Volume (AADT or SADT): 4500 Percentage of Annual Growth : 0.00 Number of Years of Growth : 0.00 Medium Truck % of Total Volume : 7.00 Heavy Truck % of Total Volume : 5.00 Day (16 hrs) % of Total Volume : 92.00
Data for Segment # 2: Tremblay (day/night) ------------------------------------------Angle1 Angle2 : -87.00 deg 87.00 deg Wood depth : 0 (No woods.) No of house rows : 0 / 0Surface : 1 (Absorptive ground surface) Receiver source distance : 15.00 / 15.00 m Receiver height : 1.50 / 4.50 m Topography : 1 (Flat/gentle slope; no barrier) Reference angle : 0.00
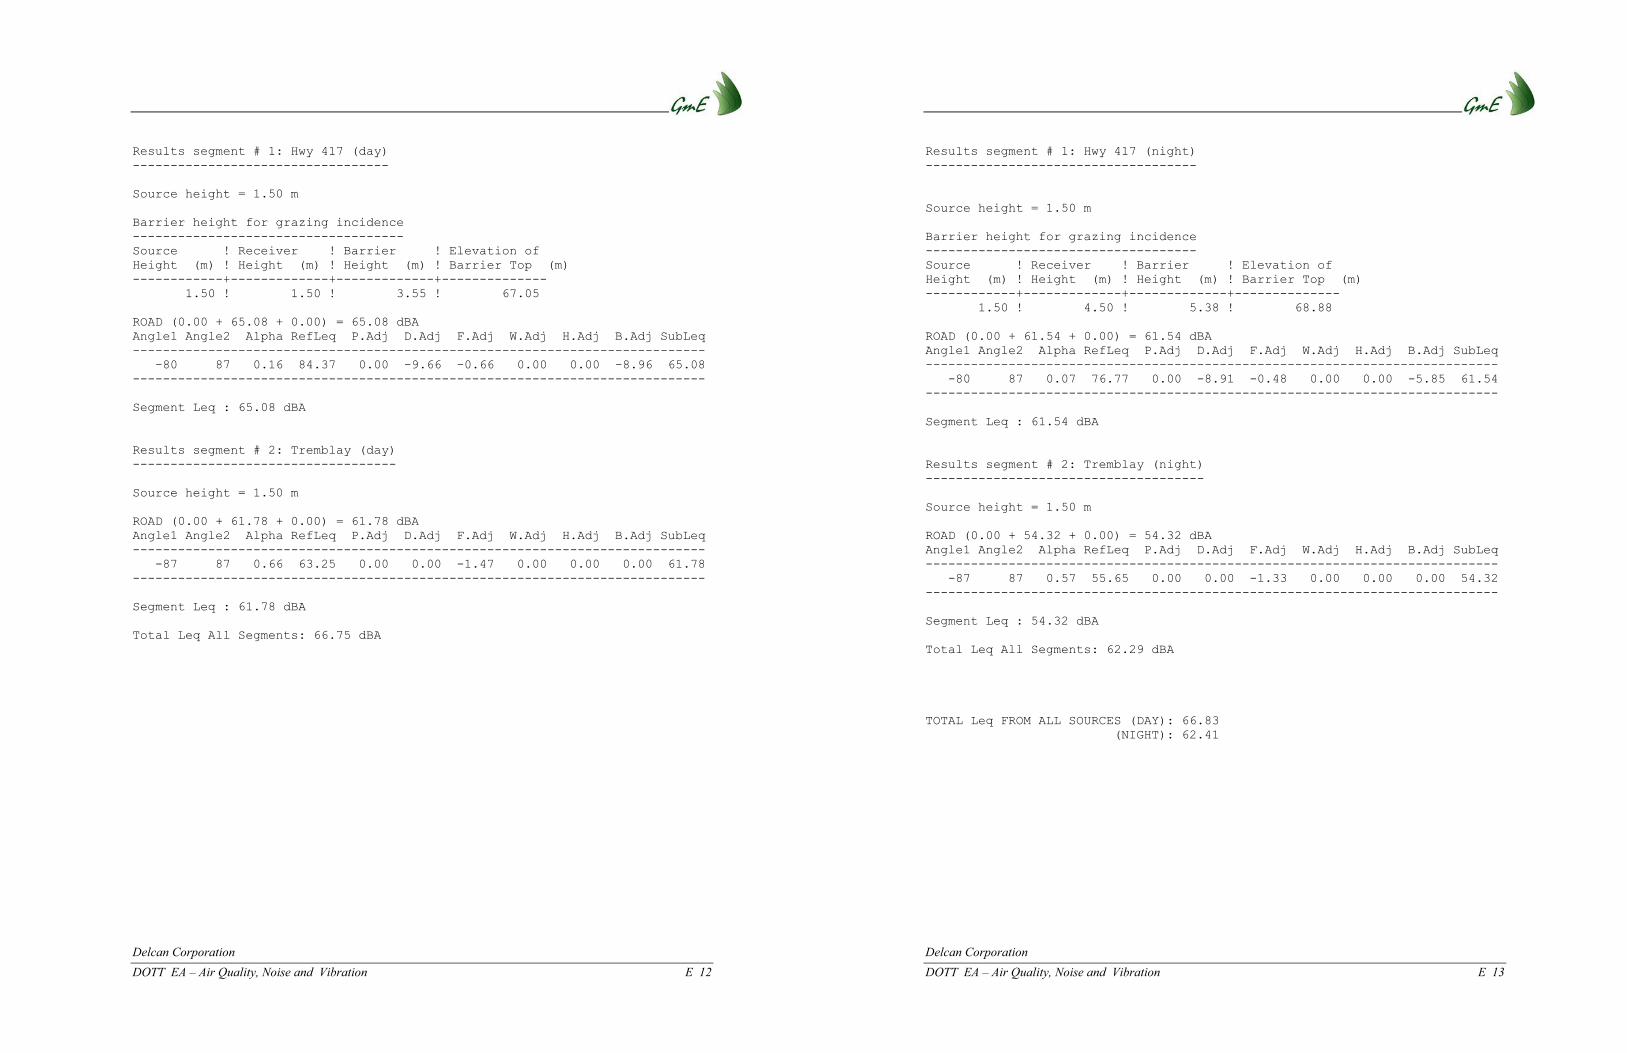
Delcan Corporation DOTT EA – Air Quality, Noise and Vibration E 12
Results segment # 1: Hwy 417 (day) ----------------------------------
Source height = 1.50 m
Barrier height for grazing incidence ------------------------------------Source ! Receiver ! Barrier ! Elevation of Height (m) ! Height (m) ! Height (m) ! Barrier Top (m) ------------+-------------+-------------+-------------- 1.50 ! 1.50 ! 3.55 ! 67.05
ROAD (0.00 + 65.08 + 0.00) = 65.08 dBA Angle1 Angle2 Alpha RefLeq P.Adj D.Adj F.Adj W.Adj H.Adj B.Adj SubLeq ---------------------------------------------------------------------------- -80 87 0.16 84.37 0.00 -9.66 -0.66 0.00 0.00 -8.96 65.08----------------------------------------------------------------------------
Segment Leq : 65.08 dBA
Results segment # 2: Tremblay (day) -----------------------------------
Source height = 1.50 m
ROAD (0.00 + 61.78 + 0.00) = 61.78 dBA Angle1 Angle2 Alpha RefLeq P.Adj D.Adj F.Adj W.Adj H.Adj B.Adj SubLeq ---------------------------------------------------------------------------- -87 87 0.66 63.25 0.00 0.00 -1.47 0.00 0.00 0.00 61.78 ----------------------------------------------------------------------------
Segment Leq : 61.78 dBA
Total Leq All Segments: 66.75 dBA
Delcan Corporation DOTT EA – Air Quality, Noise and Vibration E 13
Results segment # 1: Hwy 417 (night) ------------------------------------
Source height = 1.50 m
Barrier height for grazing incidence ------------------------------------Source ! Receiver ! Barrier ! Elevation of Height (m) ! Height (m) ! Height (m) ! Barrier Top (m) ------------+-------------+-------------+-------------- 1.50 ! 4.50 ! 5.38 ! 68.88
ROAD (0.00 + 61.54 + 0.00) = 61.54 dBA Angle1 Angle2 Alpha RefLeq P.Adj D.Adj F.Adj W.Adj H.Adj B.Adj SubLeq ---------------------------------------------------------------------------- -80 87 0.07 76.77 0.00 -8.91 -0.48 0.00 0.00 -5.85 61.54----------------------------------------------------------------------------
Segment Leq : 61.54 dBA
Results segment # 2: Tremblay (night) -------------------------------------
Source height = 1.50 m
ROAD (0.00 + 54.32 + 0.00) = 54.32 dBA Angle1 Angle2 Alpha RefLeq P.Adj D.Adj F.Adj W.Adj H.Adj B.Adj SubLeq ---------------------------------------------------------------------------- -87 87 0.57 55.65 0.00 0.00 -1.33 0.00 0.00 0.00 54.32 ----------------------------------------------------------------------------
Segment Leq : 54.32 dBA
Total Leq All Segments: 62.29 dBA
TOTAL Leq FROM ALL SOURCES (DAY): 66.83 (NIGHT): 62.41

Delcan Corporation DOTT EA – Air Quality, Noise and Vibration
APPENDIX F
FUTURE GROUND VIBRATION PREDICTIONS CALCULATIONS
Delcan Corporation DOTT EA – Air Quality, Noise and Vibration F 2

Delcan Corporation DOTT EA – Air Quality, Noise and Vibration F 3
Delcan Corporation DOTT EA – Air Quality, Noise and Vibration F 4
GME08-042 03-Feb-10
Possible Vibration Impacts on Houses near Scott & CarolinePerdicted using FTA General Assesment
Train Speed 50 km/h 30 mph
(m) (ft)North Track 52.0 170.6South Track 48.0 157.5
North Track South TrackFrom FTA Manual Fig 10-1 Vibration Levels at distance from track 62 63 dBV re 1 micro in/sec
Adjustment Factors FTA Table 10-1Speed reference 50 mph -4.4 -4.4Vehicle Parameters 0 0 Assume Soft primary suspension, Weels run trueTrack Condition 10 10 Worn or Corrugated TrackTrack Treatments 0 0 noneType of Transit Structure 0 0 Grade Tie & BallastEfficient vibration Propagation 0 0 Propagation through rock
Vibration Levels at Fdn 71.1 67.6 68.6
Coupling to Building Foundation -5 -5 Wood Framed HouseFloor to Floor Attenuation -2.0 -2.0 1 Levels of BasementAmplification of Floor and Walls 6 6
Total Vibration Level 70.1 66.6 67.6 dBV or 0.082 mm/sNoise Level in dBA 35.1 31.6 32.6 dBA
-15 -15 Mitigation Floating SlabVibration Levels with Mitigation 55.1 51.6 52.6
20.1 16.6 17.6
Distance from C/L of track to Edge of Fdn

Delcan Corporation DOTT EA – Air Quality, Noise and Vibration F 5
GME08-042 25-Aug-09
Possible Vibration Impacts on the NAC (53 Elgin)Predicted using Dobrin and Savit (1988)
Train Speed 80 km/h 50 mph
(m) (ft) (m) (ft)North Track 96.4 316.2 120.9 396.7South Track 83.8 274.9 105.1 344.9
Source at 18m from trackVelocity dB re
Freq 10 -̂9 m/s10 55
12.5 5716 5820 6225 65
31.5 7040 7550 7863 8380 85100 86125 85160 85200 84250 68 Referance: David Robersts & Bary Murray, "Parramatta Rail Link - The Approach to Controlling Train 315 57 Regnerated Noise & Vibration", RTSA Conference on Railway Engineering, June 2004.400 57500 57
Propogation Through homogenours Soil
A = Ao(Ro/R)e -̂alfph(R-Ro) Dobrin and Savit (1988)
Were Ao is amplitude at distance Ro, R is distance from track to point of intrest, andalph is the absorption coefficient and is calculated by
alph = pi*f/Qv
Were f is the frequency, v is the velocity of the wave in rock = 5.97 km/s for limestone, Q is the quality factor for the soil = 650 for limestone
dB Velocity re 10 -̂9 m/s
Vibration at Fdn Mitigation UnmitigatedMitigatedNorth Track South Track Combined Floating Slab Mitigated Convert ot Noise dBA
Freq Source Level Source Linier Liner m/s dB Liner m/s dB dB -dB Vib Levels SPL A weight dBA10 55 0.00000056 0.00000010 40.4 0.00000012 41.6 44.1 -8.0 36.1 9.1 -70.4 -53.3 -25.2
12.5 57 0.00000071 0.00000013 42.4 0.00000015 43.6 46.1 -5.0 41.1 14.1 -63.4 -44.3 -49.316 58 0.00000079 0.00000015 43.4 0.00000017 44.6 47.1 0.0 47.1 20.1 -56.7 -36.6 -36.620 62 0.00000126 0.00000023 47.4 0.00000027 48.6 51.1 -3.0 48.1 21.1 -50.5 -26.4 -29.425 65 0.00000178 0.00000033 50.4 0.00000038 51.6 54.1 -7.0 47.1 20.1 -44.7 -17.6 -24.6
31.5 70 0.00000316 0.00000059 55.4 0.00000068 56.6 59.1 -13.0 46.1 19.1 -39.4 -7.3 -20.340 75 0.00000562 0.00000105 60.4 0.00000121 61.6 64.1 -23.0 41.1 14.1 -34.6 2.5 -20.550 78 0.00000794 0.00000148 63.4 0.00000170 64.6 67.1 -29.0 38.1 11.1 -30.2 9.9 -19.163 83 0.00001413 0.00000263 68.4 0.00000302 69.6 72.1 -27.0 45.1 18.1 -26.2 18.9 -8.180 85 0.00001778 0.00000330 70.4 0.00000380 71.6 74.0 -31.0 43.0 16.0 -22.5 24.5 -6.5100 86 0.00001995 0.00000370 71.4 0.00000426 72.6 75.0 -29.0 46.0 19.0 -19.1 28.9 -0.1125 85 0.00001778 0.00000329 70.4 0.00000379 71.6 74.0 -25.0 49.0 22.0 -16.1 30.9 5.9160 85 0.00001778 0.00000329 70.3 0.00000379 71.6 74.0 -25.0 49.0 22.0 -13.4 33.6 8.6200 84 0.00001585 0.00000292 69.3 0.00000337 70.5 73.0 -28.0 45.0 18.0 -10.9 35.1 7.1250 68 0.00000251 0.00000046 53.3 0.00000053 54.5 57.0 -28.0 29.0 2.0 -8.6 21.4 -6.6315 57 0.00000071 0.00000013 42.3 0.00000015 43.5 45.9 -25.0 20.9 -6.1 -6.6 12.3 -12.7400 57 0.00000071 0.00000013 42.2 0.00000015 43.5 45.9 -25.0 20.9 -6.1 -4.8 14.1 -10.9500 57 0.00000071 0.00000013 42.1 0.00000015 43.4 45.8 -25.0 20.8 -6.2 -3.2 15.6 -9.4
Overall 92.8 0.00004377 0.00000811 78.2 0.00000934 79.4 81.9 57.2 39.1 12.60.0124 m/s 0.000753.8 re micro in/s 29.1
Distance from C/L of track to Edge of Fdn
Propogation through rock
1 10 100 10000
20
40
60
80
100
Source Levels
Velocity dB re 10 -̂9 m/s
Frequancy (Hz)
Dec
ible
s


