Appendix 4D Release to ASX under rule 4.2A
Half Year Information for Sky Network Television Limited for the six months to 31 December 2014
To be read in conjunction with Sky Network Television Limited financial statements for the year
ended 30 June 2014
CONTENTS
Results for announcement to the market
Results commentary
Consolidated interim financial statements
Independent review opinion
Directors declaration
Other information
For
per
sona
l use
onl
y

Results for announcement to market
SKY Network Television Limited
Half year ended on 31 December 2014 (In NZD)
Total operating revenues of $464,506,000 has increased $8,135,000 from the prior half year,
which is a 1.8% increase.
Net profit of $92,495,000 has increased $10,419,000 from the prior half year, which is a 12.7%
increase.
Net profit attributable to security holders of $92,471,000 has increased $8,949,000 from the
prior half year, which is a 10.7% increase.
Dividends Amount per security
Franked amount per Security
Interim Dividend payable (March 2015) 15.0 cents N/A
Final Dividend (paid September 2014) 15.0 cents N/A
Previous corresponding period – Interim Dividend (paid March 2014)
14.0 cents N/A
Previous corresponding period – Final Dividend (paid September 2013)
12.0 cents
N/A
Record date for determining entitlements to the dividend 10 March 2015
Brief explanation of any figures reported above, refer attached results commentary.
For
per
sona
l use
onl
y

SKY Interim Report 2014 | 1
THIS IS JUST THE BEGINNING...
WITH HEADPHONES ON – NO ONE WILL HEAR YOU SHRIEK
A NEW DAWN
“BRILLIANT” MOVIE FAN
“THIS IS WHAT WE’VE BEEN WAITING FOR” SPORTS FAN
“ I CAN WATCH WHAT I WANT, WHEN I WANT” SKY GO FAN
SKY NETWORK TELEVISION LIMITED
PRESENTS THIS YEAR’S INTERIM REPORT DECEMBER 2014
For
per
sona
l use
onl
y

2 | SKY Interim Report 2014
2 NEON
4 Fan Pass
6 Chief Executive’s Review
10 Subscriber Base
11 Consolidated Interim Income Statement
12 Consolidated Interim Statement of Comprehensive Income
13 Consolidated Interim Balance Sheet
14 Consolidated Interim Statement of Changes in Equity
15 Consolidated Interim Statement of Cash Flows
16 Notes to the Interim Financial Statements
21 Independent Review Report
22 Directory
For
per
sona
l use
onl
y

SKY Interim Report 2014 | 1
HOLD
ONNEW
AUDIENCES
NEW
EXPERIENCES
2015
WILL
BE A YEAR TO
REMEMBER
For
per
sona
l use
onl
y

2 | SKY Interim Report 2013
WE’RE ENTERING A NEW DIMENSION
ONLINE, ON DEMAND
2 | SKY Interim Report December 2014
For
per
sona
l use
onl
y

THE GREAT ESCAPE
WE’RE ENTERING A NEW DIMENSION
ONLINE, ON DEMANDAs our exciting industry continues to embrace new ways of watching TV, Kiwis can now effortlessly jump into great television shows and films On Demand with NEON.
NEON is a new Subscription Video On Demand (SVOD) service powered by SKY, which makes it easy for Kiwis to access great entertainment. And right from the start we’ve invested time and energy in talking to a wide range of people about the kind of experience they would like and what features would make it great. Not only did we encourage them to share their ideas but we’ve included as many of these ideas as possible to create NEON. The result; in addition to being simple to use, NEON really is built by Kiwis for Kiwis!
NEON’s programming has been hand-picked by our experienced and passionate programming team from distributors across the globe to make sure there is a really solid mix of great TV series and movies to watch.
NEON is about giving people who love film and TV the freedom to watch wherever they are in New Zealand, whenever they want to, essentially making their own ‘TV schedule’.
For a monthly fee NEON customers can access thousands of hours of brilliant entertainment on PC and Mac using an internet browser and on selected iPhones and iPads through the NEON App. Those after a big-screen experience can AirPlay using Apple TV or connect a laptop to a TV using an HDMI cable. Soon it will also be available on Xbox 360 and selected Samsung Android tablets and phones, making it accessible to even more Kiwis.
Put simply, NEON is the great escape.
SKY Interim Report December 2014 | 3
For
per
sona
l use
onl
y

FAN PASS
HOME
SCHEDULE
HIGHLIGHTS
ABOUT
SUBSCRIBEREGISTER
SIGN IN
Powered by SKY SPORT
SCOREBOARD
SHOW SCORES
ALL SPORTS
WATCH ON A PC,
TABLET OR MOBILE
YOUR FAVOURITE SPORT, YOUR WAY.
WATCH REPLAY
UPCOMING
UPCOMING
V
V
V
FINAL
Sun, Feb 15
Fri, Feb 20
7:35 PM NZT
Fri, Feb 20
9:40 PM NZT
LIVE AND STREAMING A GREAT RESULT
4 | SKY Interim Report December 2014
FAN PASS
Kiwis love sport, and here at SKY we love finding new ways to bring more sport and more live action to more Kiwis.
FAN PASS is an online live streaming service powered by SKY SPORT that offers all the action from either the 2015 Investec Super Rugby, NRL or F1R seasons.
For people without SKY SPORT, it’s the perfect way to make sure they keep up to date with their favourite sport all season long.
FAN PASS is about being flexible. We’ve provided three pass options. The full season pass will have fans right there for every breath-taking moment, while monthly and weekly FAN PASS options are available for those who like to ‘drop in’ on a more casual basis.
FAN PASS lets fans watch live sport wherever they are in New Zealand on selected mobiles, tablets and PC/MAC or on their TV via Airplay, through Android mirroring functionality or using an HDMI cable connected to their computer.
We’ve partnered with Neulion, a world-class live sports streaming service, to ensure customers receive a reliable, high quality live streaming service, match replays and highlights On Demand throughout the season.
So whether it’s enjoying every one of the action packed 125 Super Rugby games, watching the Aussies and Warriors battle it out in an epic 201 game NRL season or taking a trip around the world for all 20 F1R races, with FAN PASS it’s always a great result.F
or p
erso
nal u
se o
nly

SKY Interim Report December 2014 | 5
FAN PASS
HOME
SCHEDULE
HIGHLIGHTS
ABOUT
SUBSCRIBEREGISTER
SIGN IN
Powered by SKY SPORT
SCOREBOARD
SHOW SCORES
ALL SPORTS
WATCH ON A PC,
TABLET OR MOBILE
YOUR FAVOURITE SPORT, YOUR WAY.
WATCH REPLAY
UPCOMING
UPCOMING
V
V
V
FINAL
Sun, Feb 15
Fri, Feb 20
7:35 PM NZT
Fri, Feb 20
9:40 PM NZT
SKY Interim Report December 2014 | 5
For
per
sona
l use
onl
y

6 | SKY Interim Report 2014
TOTAL REVENUE
$464.5m
AFTER TAX EARNINGS
$92.5m EMBRACING THE NEW ERA,
RELISHING THE CHALLENGES, MEETING CHANGING
CUSTOMER NEEDS
6 | SKY Interim Report December 2014
For
per
sona
l use
onl
y

SKY Interim Report 2014 | 7
AFTER TAX EARNINGS
$92.5m CHIEF EXECUTIVE’S REVIEW
Dear Shareholders
I am glad to report that the SKY business has continued to perform strongly in the six months to 31 December 2014.
SKY has reported $92.5 million in after tax earnings, a 12.7% increase on the previous period. Revenues are up 1.8% to $464.5 million and earnings before interest, tax, depreciation and amortisation (EBITDA) increased by 1.0% to $192.4 million.
The improved financial position is primarily due to a 12.5% decrease in depreciation and amortisation expenses. There was also a 30.7% decrease in finance costs due to a reduction in borrowings in the prior year.
MY SKY subscribers now represent 64.2% of SKY’s satellite subscriber base compared to 58.6% in the comparative period. At 31 December 2014, SKY had 529,001 MY SKY subscribers compared to 486,252 in December 2013, an increase of 8.8%. Subscribers continue to find great value in the MY SKY product which is demonstrated by continued migration from the standard digital decoder to the MY SKY decoder.
Gross churn for the period ending 31 December 2014 increased to 13.7% from 13.3% in the previous period. For the rolling 12 months to 31 December 2014, MY SKY gross churn was 11.9% compared to the churn rate for subscribers on the standard digital decoder during this period of 16.8%. This compares to gross churn for MY SKY of 10.3% and a churn rate for subscribers on the standard digital decoders of 17.4% in the comparative period.
Taking a closer look at SKY’s financial results, total revenue increased by 1.8% reflecting an increase in subscription revenues of 3.0% mainly due to an increase in MY SKY subscribers and an increase in ARPU (average monthly revenue per residential subscriber).
SKY’s operating costs (excluding depreciation) for the six months to 31 December 2014 showed a 2.3% increase from the prior six month period.
However programming costs which comprise both the costs of purchasing programme rights and also programme operating costs increased by $10.0 million (7.2%). This can be mainly attributed to the increased cost of the cricket rights and the Commonwealth Games which were not included in the prior period results.
Marketing costs decreased by 7.1% mainly attributed to the reduced marketing spend by IGLOO as well a reduction in rebranding costs for SKY which were high in the prior period. Advertising costs also decreased by 6.8% driven by a decrease in advertising revenue of 3.9%.
SKY increased its capital expenditure during the period to $51.1 million from $47.4 million in the comparative period, mainly due to an increase in new projects work such as the development of a new broadcast head end and enabling MY SKY boxes to connect to the internet.
A disappointing aspect of the six month result was the net loss of 8,707 subscribers. Losing net subscribers in the July to December period is not unusual, it happened last year as well as in previous years. Historically, net loss periods were caused by limited interest in content offerings at the time and sometimes by what is known as the ‘echo effect.’
An echo effect is created when a large number of subscribers come on board, typically with a year commitment. A small percentage will roll off when their year’s commitment is over. This happened in the past with the Rugby World Cup in 2011 and the shut off of analogue terrestrial free-to-air channels.
In late 2013 the racing industry, better known as the Totalisator Agency Board (TAB) shut down their free-to-air channel and broadcast instead on the SKY satellite platform. This move was supported by a SKY acquisition campaign which brought new subscribers to SKY. The offer to join was aggressive, not only to take advantage of the opportunity but to help the TAB favourably promote the concept to their customers. Because of the discount offered we insisted on a 12 month term.
SKY Interim Report December 2014 | 7
For
per
sona
l use
onl
y

8 | SKY Interim Report 20148 | SKY Interim Report December 2014
Some of these subscribers disconnected during the period between 1 July and 31 December at the expiry of their minimum commitment.
On a percentage basis, both voluntary and involuntary (non-pay) disconnects were within a few points of the same period last year. Our challenge has been attracting new subscribers to the platform in a period where the industry is transitioning.
The internet has created an opportunity for new entrants and new business models. If you are a consumer seeking additional content for which you are willing to pay, you now have numerous options in New Zealand.
In some cases these options are perfect for customers looking for limited offerings at a lower cost. More typically some consumers adopt a ‘wait and see’ approach hoping, in vain, for the nirvana of the content a SKY subscription delivers, but at the lower cost of one of the new entrants.
Although these trading conditions are challenging in the short term, in the medium to long term these marketplace changes will help us grow the business as consumers who have previously rejected the notion of paying for television become open to it and new market segments emerge.
The key to our growth is that we must take advantage of the technological opportunities this new era represents and we believe that SKY is in the best position to exploit the opportunities that the internet offers.
The internet has ushered in what may be remembered, to paraphrase, as the ‘Golden Age of Video On Demand’.
SKY’s traditional pay TV model is still the most successful financially, and the leader in Video On Demand when used with a personal video recorder. We believe that most consumers will continue to prefer the ease, simplicity and variety of a full SKY subscription. We also believe that economically we are able to extract the most value from content acquisition under this model.
Under an aggregated model SKY subscribers will continue to find value in content that they may not have discovered nor been recommended by even the smartest recommendation engine.
We have already launched several new business models that exploit both the internet and Video On Demand.
We have launched IGLOO a hybrid model delivering content via the internet and Digital Terrestrial Transmission (DTT). We have also just launched NEON an internet delivered Subscription Video On Demand model and FAN PASS which is a single sport, single season subscription model delivered via the internet.
We are now working on our greatest innovation and challenge of all. Our next goal is to download to all MY SKY decoders a software upgrade which will allow every MY SKY decoder to connect to the internet allowing access to content in either the traditional linear format or an On Demand basis. We will also be rolling out MY SKY boxes to all our digital subscribers to enable them to take advantage of these new products and services.
Customers will be able to avail themselves of choices from a vast On Demand library of content as well as traditional linear channels. Whatever mood, whichever physical location, whoever is watching, SKY will be the destination of choice. While programmed channels with strong brands still offer viewers an ‘a la carte’ selection of our best content, these exciting new products with their Video On Demand options will empower our subscribers to create their own viewing priorities and watch-lists for even deeper engagement with our premium SKY content.
Story telling is a key human trait. From cavemen drawing pictures on walls, through to the development of moveable type and the invention of radio, television and cinema, it is storytelling that has motivated innovation.
The internet enables SKY to deliver even better storytelling for our customers. We relish the challenge.
For
per
sona
l use
onl
y
SKY Interim Report 2014 | 9
THE INTERNET HAS USHERED IN WHAT MAY BE REMEMBERED,
TO PARAPHRASE, AS THE ‘GOLDEN AGE OF VIDEO ON DEMAND’
SKY Interim Report December 2014 | 9
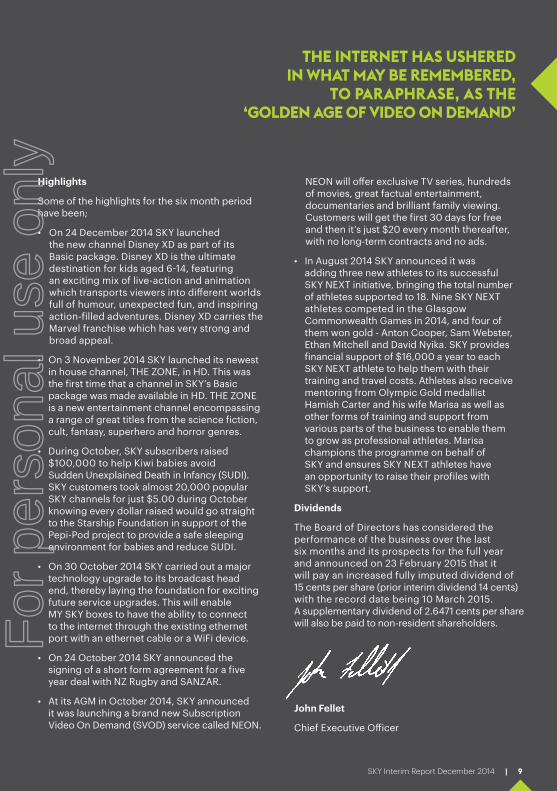
Highlights
Some of the highlights for the six month period have been;
On 24 December 2014 SKY launched the new channel Disney XD as part of its Basic package. Disney XD is the ultimate destination for kids aged 6-14, featuring an exciting mix of live-action and animation which transports viewers into different worlds full of humour, unexpected fun, and inspiring action-filled adventures. Disney XD carries the Marvel franchise which has very strong and broad appeal.
• On 3 November 2014 SKY launched its newest in house channel, THE ZONE, in HD. This was the first time that a channel in SKY’s Basic package was made available in HD. THE ZONE is a new entertainment channel encompassing a range of great titles from the science fiction, cult, fantasy, superhero and horror genres.
• During October, SKY subscribers raised $100,000 to help Kiwi babies avoid Sudden Unexplained Death in Infancy (SUDI). SKY customers took almost 20,000 popular SKY channels for just $5.00 during October knowing every dollar raised would go straight to the Starship Foundation in support of the Pepi-Pod project to provide a safe sleeping environment for babies and reduce SUDI.
• On 30 October 2014 SKY carried out a major technology upgrade to its broadcast head end, thereby laying the foundation for exciting future service upgrades. This will enable MY SKY boxes to have the ability to connect to the internet through the existing ethernet port with an ethernet cable or a WiFi device.
• On 24 October 2014 SKY announced the signing of a short form agreement for a five year deal with NZ Rugby and SANZAR.
• At its AGM in October 2014, SKY announced it was launching a brand new Subscription Video On Demand (SVOD) service called NEON.
NEON will offer exclusive TV series, hundreds of movies, great factual entertainment, documentaries and brilliant family viewing. Customers will get the first 30 days for free and then it’s just $20 every month thereafter, with no long-term contracts and no ads.
• In August 2014 SKY announced it was adding three new athletes to its successful SKY NEXT initiative, bringing the total number of athletes supported to 18. Nine SKY NEXT athletes competed in the Glasgow Commonwealth Games in 2014, and four of them won gold - Anton Cooper, Sam Webster, Ethan Mitchell and David Nyika. SKY provides financial support of $16,000 a year to each SKY NEXT athlete to help them with their training and travel costs. Athletes also receive mentoring from Olympic Gold medallist Hamish Carter and his wife Marisa as well as other forms of training and support from various parts of the business to enable them to grow as professional athletes. Marisa champions the programme on behalf of SKY and ensures SKY NEXT athletes have an opportunity to raise their profiles with SKY’s support.
Dividends
The Board of Directors has considered the performance of the business over the last six months and its prospects for the full year and announced on 23 February 2015 that it will pay an increased fully imputed dividend of 15 cents per share (prior interim dividend 14 cents) with the record date being 10 March 2015. A supplementary dividend of 2.6471 cents per share will also be paid to non-resident shareholders.
•
John Fellet
Chief Executive Officer
For
per
sona
l use
onl
y

10 | SKY Interim Report December 2014
SUBSCRIBER BASEThe following operating data has been taken from the company records and is not audited
31 Dec 2014 30 Jun 2014 31 Dec 2013
Total number of households in New Zealand (1) 1,714,700 1,696,500 1,684,800Subscribers
Residential 696,211 715,058 684,841Wholesale (2) 119,196 111,390 135,399Commercial 9,153 9,060 8,401Other (3) 31,788 29,547 28,474
Total subscribers 856,348 865,055 857,115
MY SKY Subscribers (4) 529,001 504,713 486,252Percentage of households subscribing to the SKY network:
Penetration (residential and wholesale) 48.3% 48.7% 48.7%Gross churn rate (5) 13.7% 13.2% 13.3%Average monthly revenue per residential subscriber:
Residential 63.40 61.56 62.48Wholesale 66.50 66.84 67.87MY SKY 89.84 87.22 87.13All subscribers 79.43 77.52 77.51
Notes
1 Based on New Zealand Government updated census data.2 Includes subscribers receiving SKY packages via affiliate services, such as arrangements with Spark (formerly Telecom) and Vodafone. 3 Includes subscribers to programmed music and online DVD rentals via SKY’s subsidiary companies, SKY DMX Music Limited
and Screen Enterprises Limited. Also includes residential subscribers to IGLOO’s package launched in December 2012. 4 Included in total subscribers. 5 Gross churn refers to the percentage of residential subscribers over the 12-month period ended on the date shown who
terminated their subscription, net of existing subscribers who transferred their service to new residences during the period.
HISTORY OF DIVIDEND PAYMENTSBy calendar year in cents per share
2014 2013 2012 2011 2010
Interim dividend (paid in March) 14.0 12.0 11.0 8.0 7.0Final dividend (paid in September) 15.0 12.0 11.0 10.5 7.0Total ordinary dividend 29.0 24.0 22.0 18.5 14.0Add special dividend - - 32.0 25.0 - Total dividend for the year 29.0 24.0 54.0 43.5 14.0F
or p
erso
nal u
se o
nly
SKY Interim Report December 2014 | 11
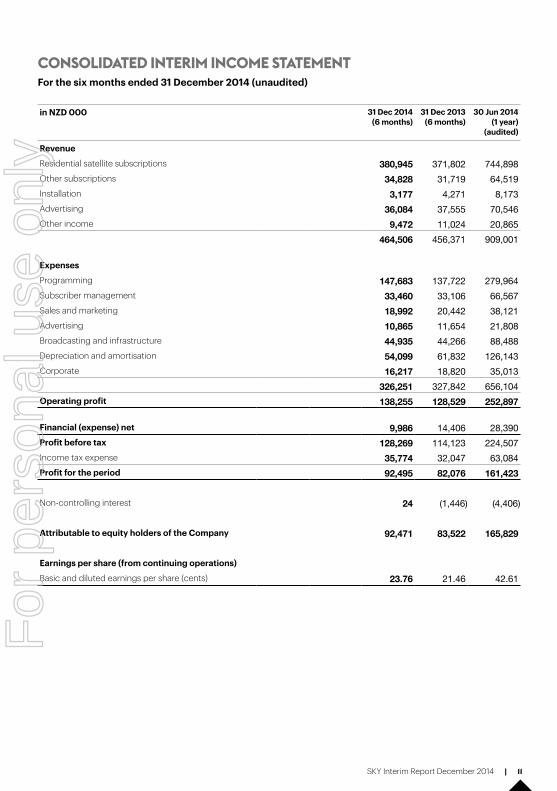
CONSOLIDATED INTERIM INCOME STATEMENTFor the six months ended 31 December 2014 (unaudited)
in NZD 000 31 Dec 2014 (6 months)
31 Dec 2013 (6 months)
30 Jun 2014 (1 year)
(audited)
Revenue
Residential satellite subscriptions 380,945 371,802 744,898Other subscriptions 34,828 31,719 64,519Installation 3,177 4,271 8,173Advertising 36,084 37,555 70,546Other income 9,472 11,024 20,865
464,506 456,371 909,001
Expenses
Programming 147,683 137,722 279,964Subscriber management 33,460 33,106 66,567Sales and marketing 18,992 20,442 38,121Advertising 10,865 11,654 21,808Broadcasting and infrastructure 44,935 44,266 88,488Depreciation and amortisation 54,099 61,832 126,143Corporate 16,217 18,820 35,013
326,251 327,842 656,104Operating profit 138,255 128,529 252,897
Financial (expense) net 9,986 14,406 28,390Profit before tax 128,269 114,123 224,507Income tax expense 35,774 32,047 63,084Profit for the period 92,495 82,076 161,423
Non-controlling interest 24 (1,446) (4,406)
Attributable to equity holders of the Company 92,471 83,522 165,829
Earnings per share (from continuing operations)
Basic and diluted earnings per share (cents) 23.76 21.46 42.61
For
per
sona
l use
onl
y

12 | SKY Interim Report December 2014
CONSOLIDATED INTERIM STATEMENT OF COMPREHENSIVE INCOMEFor the six months ended 31 December 2014 (unaudited)
in NZD 000 31 Dec 2014 (6 months)
31 Dec 2013 (6 months)
30 Jun 2014 (1 year)
(audited)
Profit for the period 92,495 82,076 161,423
Other comprehensive income items that may be reclassified subsequently to profit and loss
Cash flow hedges 8,279 186 (251)Income tax effect (2,318) (52) 70Other comprehensive income for the period net of income tax 5,961 134 (181)Total comprehensive income for the period 98,456 82,210 161,242
Attributable to:
Equity holders of the Company 98,432 83,686 165,648Non-controlling interest 24 (1,476) (4,406)
98,456 82,210 161,242
For
per
sona
l use
onl
y
SKY Interim Report December 2014 | 13
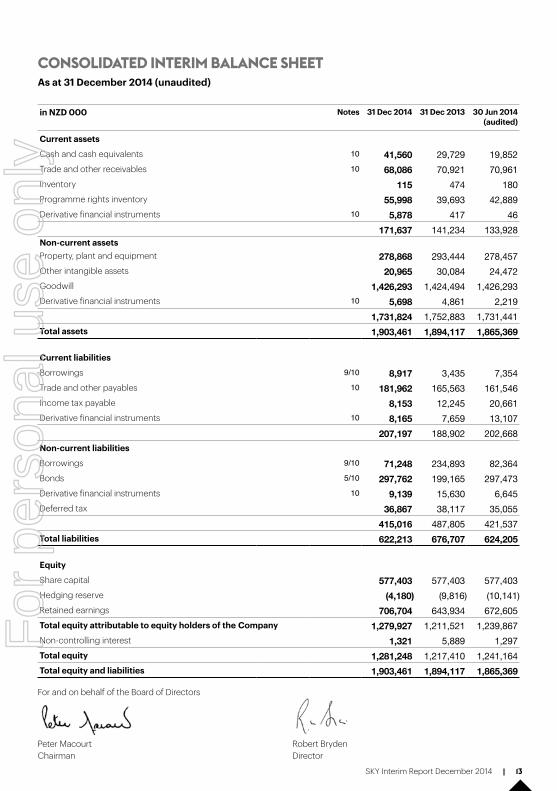
CONSOLIDATED INTERIM BALANCE SHEETAs at 31 December 2014 (unaudited)
in NZD 000 Notes 31 Dec 2014 31 Dec 2013 30 Jun 2014 (audited)
Current assets
Cash and cash equivalents 10 41,560 29,729 19,852Trade and other receivables 10 68,086 70,921 70,961Inventory 115 474 180Programme rights inventory 55,998 39,693 42,889Derivative financial instruments 10 5,878 417 46
171,637 141,234 133,928Non-current assetsProperty, plant and equipment 278,868 293,444 278,457 Other intangible assets 20,965 30,084 24,472 Goodwill 1,426,293 1,424,494 1,426,293 Derivative financial instruments 10 5,698 4,861 2,219
1,731,824 1,752,883 1,731,441 Total assets 1,903,461 1,894,117 1,865,369
Current liabilities
Borrowings 9/10 8,917 3,435 7,354 Trade and other payables 10 181,962 165,563 161,546 Income tax payable 8,153 12,245 20,661 Derivative financial instruments 10 8,165 7,659 13,107
207,197 188,902 202,668 Non-current liabilities
Borrowings 9/10 71,248 234,893 82,364 Bonds 5/10 297,762 199,165 297,473 Derivative financial instruments 10 9,139 15,630 6,645 Deferred tax 36,867 38,117 35,055
415,016 487,805 421,537 Total liabilities 622,213 676,707 624,205
Equity
Share capital 577,403 577,403 577,403 Hedging reserve (4,180) (9,816) (10,141)Retained earnings 706,704 643,934 672,605 Total equity attributable to equity holders of the Company 1,279,927 1,211,521 1,239,867 Non-controlling interest 1,321 5,889 1,297 Total equity 1,281,248 1,217,410 1,241,164 Total equity and liabilities 1,903,461 1,894,117 1,865,369
For and on behalf of the Board of Directors
Peter Macourt Chairman
Robert Bryden Director
For
per
sona
l use
onl
y

14 | SKY Interim Report December 2014
CONSOLIDATED INTERIM STATEMENT OF CHANGES IN EQUITYFor the six months ended 31 December 2014 (unaudited)
in NZD 000 Attributable to owners of the parent Non- Share
capitalHedging
reserveRetained earnings Total
controlling interest
Total equity
Balance at 1 July 2014 577,403 (10,141) 672,605 1,239,867 1,297 1,241,164
Profit for the period - - 92,471 92,471 24 92,495Cash flow hedges, net of tax - 5,961 - 5,961 - 5,961Total comprehensive income for the period - 5,961 92,471 98,432 24 98,456Transactions with owners in their capacity as ownersDividend paid - - (58,372) (58,372) - (58,372)Supplementary dividends - - (7,158) (7,158) - (7,158)Foreign investor tax credits - - 7,158 7,158 - 7,158
- - (58,372) (58,372) - (58,372)Balance at 31 December 2014 577,403 (4,180) 706,704 1,279,927 1,321 1,281,248
For the six months ended 31 December 2013 (unaudited)Balance at 1 July 2013 577,403 (9,960) 607,089 1,174,532 7,365 1,181,897
Profit/(loss) for the period - - 83,522 83,522 (1,446) 82,076Cash flow hedges, net of tax - 144 20 164 (30) 134Total comprehensive income for the period - 144 83,542 83,686 (1,476) 82,210Transactions with owners in their capacity as ownersDividend paid - - (46,697) (46,697) - (46,697)Supplementary dividends - - (5,141) (5,141) - (5,141)Foreign investor tax credits - - 5,141 5,141 - 5,141
- - (46,697) (46,697) - (46,697)Balance at 31 December 2013 577,403 (9,816) 643,934 1,211,521 5,889 1,217,410
For the year ended 30 June 2014 (audited)Balance at 1 July 2013 577,403 (9,960) 607,089 1,174,532 7,365 1,181,897
Profit/(loss) for the year - - 165,829 165,829 (4,406) 161,423Cash flow hedges, net of tax - (181) - (181) - (181)Total comprehensive income for the period - (181) 165,829 165,648 (4,406) 161,242Transactions with owners in their capacity as ownersChange in non-controlling interest 863 863 (1,662) (799)Dividend paid - - (101,176) (101,176) - (101,176)Supplementary dividends - - (11,665) (11,665) - (11,665)Foreign investor tax credits - - 11,665 11,665 - 11,665
- - (100,313) (100,313) (1,662) (101,975)Balance at 30 June 2014 577,403 (10,141) 672,605 1,239,867 1,297 1,241,164
For
per
sona
l use
onl
y

SKY Interim Report December 2014 | 15
CONSOLIDATED INTERIM STATEMENT OF CASH FLOWSFor the six months ended 31 December 2014 (unaudited)
in NZD 000 Notes 31 Dec 2014 (6 months)
31 Dec 2013 (6 months)
30 Jun 2014 (1 year)
(audited)
Cash flows from operating activities
Profit before tax 128,269 114,123 224,507Adjustment for non-cash items:
Depreciation and amortisation 54,099 61,832 126,143Unrealised foreign exchange (gain)/loss (754) 11 296Interest expense 11,467 14,137 28,751Bad debts and movement in provision for doubtful debts 1,944 2,064 4,399Reversal of inventory impairment (599) (906) (889)Amortisation of bond issue costs 288 151 367Other non-cash items (1,541) (373) 1,799Loss/(gain) on disposal of assets 57 (31) - Movement in working capital items:
Decrease/(increase) in receivables 2,898 (372) 3,858Increase/(decrease) in payables 17,482 4,064 (8,080)Decrease in inventory 664 1,365 1,642Increase in programme rights (13,109) (332) (3,527)Cash generated from operations 201,165 195,733 379,266
Interest paid (11,405) (13,927) (28,896)Income tax paid (41,560) (26,083) (45,056)Net cash from operating activities 148,200 155,723 305,314
Cash flows from investing activities
Proceeds from sale of property, plant and equipment 78 42 109 Acquisition of property, plant, equipment and intangibles 7 (50,775) (47,608) (93,002)Acquisition of business - - (779)Net cash used in investing activities (50,697) (47,566) (93,672)
Cash flows from financing activities
Proceeds from bond issue - - 100,000 Payment of bond issuance costs - - (1,908)Advances received – bank loan 9 51,000 33,000 61,000 Repayment of borrowings – bank loan 9 (59,000) (78,000) (253,000)Payment of finance lease liabilities (1,745) (1,626) (3,315)Capital introduced by non-controlling interests - - 300 Acquisition of and distributions to non-controlling interests - - (1,178)Payment of bank facility fees (520) (640) (1,524)Dividends paid 8 (65,530) (51,838) (112,841)Net cash used in financing activities (75,795) (99,104) (212,466)
Net increase/(decrease) in cash and cash equivalents 21,708 9,053 (824)Cash and cash equivalents at beginning of the period 19,852 20,676 20,676 Cash and cash equivalents at end of the period 41,560 29,729 19,852
For
per
sona
l use
onl
y

16 | SKY Interim Report December 2014
NOTES TO THE INTERIM FINANCIAL STATEMENTSFor the six months ended 31 December 2014 (unaudited)
1. GENERAL INFORMATIONSKY Network Television Limited (“SKY”) is a company, incorporated and domiciled in New Zealand. The address of its registered office is 10 Panorama Road, Mt Wellington, Auckland, New Zealand. The consolidated interim financial statements of the Group for the six months ended 31 December 2014 comprise SKY and its subsidiaries.
SKY is registered under the Companies Act 1993 and is an FMC Reporting Entity under Part 7 of the Financial Markets Conduct Act 2013. These consolidated interim financial statements have been prepared in accordance with the requirements of the NZX Main Board Listing Rules.
SKY is a leading media company in New Zealand and operates as a provider of multi-channel, pay-per-view and free-to-air television services in New Zealand.
These consolidated interim financial statements were approved by the Board of Directors on 23 February 2015.
2. BASIS OF PREPARATION These consolidated interim financial statements of SKY are for the six months ended 31 December 2014. They have been prepared in accordance with New Zealand generally accepted accounting practice, NZ IAS 34 Interim Financial Reporting and International Accounting Standard 34 (IAS 34). They do not include all of the information required for full annual financial statements, and should be read in conjunction with the consolidated financial statements of the Group as at and for the year ended 30 June 2014.
The preparation of interim financial statements in accordance with NZ IAS 34 Interim Financial Reporting requires management to make judgements, estimates and assumptions that affect the application of policies and reported amounts of assets and liabilities, income and expenses. The estimates and associated assumptions are based on historical experience and various other factors that are believed to be reasonable under the circumstances, the results of which form the basis of making the judgements about carrying values of assets and liabilities that are not readily apparent from other sources. Actual results may differ from these estimates.
These financial statements have been prepared under the historical cost convention except for the revaluation of certain financial instruments (including derivative instruments).
3. SIGNIFICANT ACCOUNTING POLICIESThe accounting policies applied by the Group in these consolidated interim financial statements are the same as those applied by the Group in its consolidated financial statements as at and for the year ended 30 June 2014.
4. GROUP STRUCTUREAt 31 December 2014 SKY had the following subsidiaries:
• Cricket Max Limited (non-trading)• IGLOO Limited• Media Finance Limited (non-trading)• Outside Broadcasting Limited• Screen Enterprises Limited• SKY DMX Music Limited (50.5%)• Believe It or Not Limited (51.0%)• SKY Arena Limited (75.0%).F
or p
erso
nal u
se o
nly

SKY Interim Report December 2014 | 17
NOTES TO THE INTERIM FINANCIAL STATEMENTS CONTINUEDFor the six months ended 31 December 2014 (unaudited)
5. BONDSTerms and conditions of outstanding bonds are as follows:
Bond A31 Dec 2014 31 Dec 2013 30 Jun 2014
(audited)
Nominal interest rate 4.43% 3.62% 3.62%Issue date 16 Oct 2006 16 Oct 2006 16 Oct 2006Date of maturity 16 Oct 2016 16 Oct 2016 16 Oct 2016in NZD 000
Carrying amount 199,464 199,165 199,313 Face value 200,000 200,000 200,000 Fair value 198,500 194,600 196,000 Market yield 5.22% 5.25% 5.83%
Bond B
Nominal interest rate 6.25% - 6.25%Issue date 31 Mar 2014 - 31 Mar 2014Date of maturity 31 Mar 2021 - 31 Mar 2021in NZD 000
Carrying amount 98,298 - 98,160 Face value 100,000 - 100,000 Fair value 105,901 - 100,991 Market yield 5.43% - 6.07%
On 31 March 2014 the Group issued bonds for a value of $100 million which were fully subscribed (Bond B).
On 16 October 2006, the Group issued bonds for a value of $200 million which were fully subscribed (Bond A).
Bond A is subject to a call option commencing on 16 October 2010 and each subsequent 16 October until 16 October 2015 whereby the Company has the right to redeem or repurchase all or some of the bonds on each anniversary of the issue date. The difference between the carrying amount and fair value has not been recognised in the interim financial statements as the bonds are intended to be held until maturity.
For
per
sona
l use
onl
y

18 | SKY Interim Report December 2014
NOTES TO THE INTERIM FINANCIAL STATEMENTS CONTINUEDFor the six months ended 31 December 2014 (unaudited)
6. RELATED PARTY TRANSACTIONSThere were no loans to directors by the Group or associated parties at any of the reporting dates above.
The gross remuneration of directors and key management personnel during the period was $7,594,000 (31 December 2013: $7,109,000; 30 June 2014: $12,456.000).
7. CAPITAL EXPENDITUREThe Group acquired the following property, plant and equipment and intangibles during the period:
in NZD 000 31 Dec 2014 (6 months)
31 Dec 2013 (6 months)
30 Jun 2014 (1 year)
(audited)
Capital projects in progress 18,035 15,196 20,472Land and buildings 6,311 79 455Broadcasting and studio equipment 105 228 870Plant and equipment and other 3,123 1,601 7,032Decoders 8,378 9,530 18,736Installation costs 14,629 18,674 36,861Intangibles 557 2,063 6,715
51,138 47,371 91,141Movement in capital expenditure creditors (363) 237 1,861Cash outflow in the period 50,775 47,608 93,002
8. DIVIDENDSOn 23 February 2015 the Board of Directors announced that it will pay a fully imputed dividend of 15 cents per share with the record date being 10 March 2015. A supplementary dividend of 2.6471 cents per share will be paid to non-resident shareholders, subject to the foreign investor tax credit regime.
9. BORROWINGSBank loans
During the period bank borrowings of $59 million were repaid and a new drawdown of $51 million was taken up.
For
per
sona
l use
onl
y

SKY Interim Report December 2014 | 19
NOTES TO THE INTERIM FINANCIAL STATEMENTS CONTINUEDFor the six months ended 31 December 2014 (unaudited)
10. FAIR VALUE MEASUREMENTS OF FINANCIAL INSTRUMENTSThe Group’s activities expose it to a variety of financial risks, market risk (including currency risk, fair value interest rate risk, cash flow interest rate risk and price risk) credit risk and liquidity risk.
The consolidated interim financial statements do not include all financial risk management information and disclosures required in the annual financial statements, they should be read in conjunction with the Group’s annual financial statements as at 30 June 2014. There have been no changes in any risk management policies since year end.
Financial assets of the Group include cash, and cash equivalents, trade and other receivables and derivative financial assets. Financial liabilities of the Group include trade and other payables, borrowings, lease liabilities, bonds and derivative financial liabilities. The Group does not hold or issue financial instruments for trading purposes.
Based on NZ IFRS 13 Fair Value Measurement, the fair value of each financial instrument is categorised in its entirety based on the lowest level of input that is significant to that fair value measurement. The levels are defined as follows:
Level 1: Quoted prices (unadjusted in active market for identical assets and liabilities);
Level 2: Inputs other than quoted prices included within level 1 that are observable for the asset or liability, either directly (that is, as prices) or indirectly (that is, derived from prices);
Level 3: Inputs for the asset or liability, that are not based on observable market data (that is unobservable inputs).
Fair value estimates of the Group’s financial assets and liabilities for recognition or disclosure purposes are all made on a level 2 basis. During the six months ended 31 December 2014 there were no transfers of financial instruments between levels.
Financial instruments measured at fair value
The following financial instruments are subject to recurring fair value measurements:
in NZD 000 31 Dec 2014 31 Dec 2013 30 Jun 2014
Derivative financial instruments (Level 2)
Current assets 5,878 417 46Non-current assets 5,698 4,861 2,219Current liabilities (8,165) (7,659) (13,107)Non-current liabilities (9,139) (15,630) (6,645)
(5,728) (18,011) (17,487)
For
per
sona
l use
onl
y

20 | SKY Interim Report December 2014
NOTES TO THE INTERIM FINANCIAL STATEMENTS CONTINUEDFor the six months ended 31 December 2014 (unaudited)
10. FAIR VALUE MEASUREMENTS OF FINANCIAL INSTRUMENTS CONTINUED
Financial instruments not measured at fair value
The following financial instruments are not measured at fair value in the consolidated interim financial statements. These had the following fair values as at December 2014:
in NZD 000 31 Dec 2014 31 Dec 2013 30 Jun 2014 Carrying
amountFair
valueCarrying
amountFair
valueCarrying
amountFair
value
Financial assets
Cash and cash equivalents 41,560 41,560 29,729 29,729 19,852 19,852Trade and other receivables 62,637 62,637 66,226 66,226 65,836 65,836
104,197 104,197 95,955 95,955 85,688 85,688Financial liabilities
Trade and other payables (118,274) (118,274) (104,016) (104,016) (95,451) (95,451)Bank borrowings (71,248) (71,890) (226,003) (224,914) (79,069) (79,264)Lease liabilities (8,917) (9,011) (12,325) (12,909) (10,649) (10,932)Bonds (297,762) (304,401) (199,165) (194,600) (297,473) (296,991)
(496,201) (503,576) (541,509) (536,439) (482,642) (482,638)
Prepaid expenses, deferred revenue and unearned subscriptions do not meet the definition of a financial instrument and have been excluded from the “Trade and other receivables” and “Trade and other payables” categories above.
Due to their short-term nature, the carrying amounts of cash and cash equivalents, trade and other receivables and trade and other payables is assumed to approximate their fair value.
The fair value of long-term borrowings are estimated by discounting future cash flows using current market interest rates offered to the Group for debt with substantially the same characteristics and maturities. The interest rates used in estimating the fair value of long-term debt were as follows:
31 Dec 2014 31 Dec 2013 30 Jun 2014
Bond A 5.22% 5.25% 5.83%Bond B 5.43% - 6.07%Bank borrowings 5.31% 4.56% 5.13%Lease liabilities 5.7% 6.20% 6.03%
Specific valuation techniques used to value financial instruments are:
The fair value of interest rate swaps is calculated as the present value of the estimated future cash flows based on observable inputs. The fair value of forward foreign exchange contracts is based on market forward foreign exchange rates at period end.
11. CONTINGENT LIABILTIESThe Group is subject to litigation incidental to its business, none of which is expected to be material. No provision has been made in the Group’s financial statements in relation to any current litigation and the directors believe that such litigation will not have a significant effect on the Group’s financial position, results of operations or cash flows.
12. SUBSEQUENT EVENTSOther than as set out in note 8 (Dividends) there have been no subsequent events after balance date.
For
per
sona
l use
onl
y
SKY Interim Report December 2014 | 21
INDEPENDENT REVIEW REPORTTo the shareholders of Sky Network Television Limited
Report on the Interim Financial Statements
We have reviewed the accompanying interim condensed consolidated financial statements (“financial statements”) of Sky Network Television Limited on pages 11 to 20, which comprise the balance sheet as at 31 December 2014, the income statement, statement of comprehensive income, statement of changes in equity and statement of cash flows for the period then ended, and a summary of significant accounting policies and selected explanatory notes.
Directors’ Responsibility for the Interim Financial Statements
The Directors of the Company are responsible for the preparation and fair presentation of these financial statements in accordance with New Zealand Equivalent to International Accounting Standard 34 Interim Financial Reporting (NZ IAS 34) and for such internal controls as the directors determine are necessary to enable the preparation of financial statements that are free from material misstatement, whether due to fraud or error.
Our Responsibility
Our responsibility is to express a conclusion on the accompanying financial statements based on our review. We conducted our review in accordance with the New Zealand Standard on Review Engagements 2410 Review of Financial Statements Performed by the Independent Auditor of the Entity (NZ SRE 2410). NZ SRE 2410 requires us to conclude whether anything has come to our attention that causes us to believe that the financial statements, taken as a whole, are not prepared in all material respects, in accordance with NZ IAS 34. As the auditors of the Company, NZ SRE 2410 requires that we comply with the ethical requirements relevant to the audit of the annual financial statements.
A review of financial statements in accordance with NZ SRE 2410 is a limited assurance engagement. The auditor performs procedures, primarily consisting of making enquiries, primarily of persons responsible for financial and accounting matters, and applying analytical and other review procedures. The procedures performed in a review are substantially less than those performed in an audit conducted in accordance with International Standards on Auditing (New Zealand) and International Standards on Auditing. Accordingly we do not express an audit opinion on these financial statements.
We carry out other assignments for the Company in the areas of assurance and advisory services. In addition, certain partners and employees of our firm may deal with the Company on normal terms within the ordinary course of trading activities of the Company. The provision of these other services has not impaired our independence as auditors of the Comapny.
Conclusion
Based on our review, nothing has come to our attention that causes us to believe that these financial statements of the Company are not prepared, in all material respects, in accordance with NZ IAS 34.
Restriction on Distribution or Use
This report is made solely to the Company’s shareholders, as a body. Our review work has been undertaken so that we might state to the Company’s shareholders those matters which we are required to state to them in our review report and for no other purpose. To the fullest extent permitted by law, we do not accept or assume responsibility to anyone other than the Company and the Company’s shareholders, as a body, for our review procedures, for this report or for the conclusion we have formed.
Chartered Accountants Auckland
23 February 2015
For
per
sona
l use
onl
y

DIRECTORY YOU’LL KNOW WHERE TO FIND US...
REGISTRARSShareholders should address questions relating to share certificates, notify changes of address or address any administrative questions to SKY’s share registrar as follows:
NEW ZEALAND ORDINARY SHARE REGISTRAR
Computershare Investor Services LimitedLevel 2, 159 Hurstmere Road Takapuna, North Shore City 0622New Zealand
Mailing address: Private Bag 92119Auckland Mail Centre Auckland 1142 New Zealand
Tel: +64 9 488 8777 Fax: +64 9 488 8787Email: [email protected]
AUSTRALIAN BRANCH REGISTER
Computershare Investor Services Pty LimitedYarra Falls, 452 Johnston StreetAbbotsford, VIC 3067GPO Box 2975EEMelbourne VIC 3000 Australia
Freephone: 1300 850 505 (within Australia)Tel: +61 3 9415 4000 Fax: +61 3 9473 2500Email: [email protected]
BONDHOLDER TRUSTEE
The New Zealand Guardian Trust Company LimitedLevel 7, Vero Centre, 48 Shortland Street Auckland New Zealand
Mailing address: P.O. Box 1934Auckland New Zealand
Tel: +64 9 377 7300 Fax: +64 9 377 7470Email: [email protected]
22 | SKY Interim Report December 2014
For
per
sona
l use
onl
y
DIRECTORS
Peter Macourt ChairmanRobert Bryden Deputy ChairmanJohn Fellet Chief ExecutiveDerek Handley Geraldine McBrideHumphry Rolleston John Waller
EXECUTIVES
John Fellet Director and Chief Executive OfficerJason Hollingworth Chief Financial Officer
and Company SecretaryGregory Drummond Director of Broadcasting and MediaTravis Dunbar Director of Entertainment
ProgrammingCharles Ingley Director of TechnologyMegan King Director of Content,
Strategy, Planning and DeliveryRichard Last Director of Sport Chris Major Director of Government RelationsRawinia Newton Director of Advertising SalesCathryn Oliver Chief of StaffMatthew Orange Director of Strategy
and ProductsMichael Watson Director of MarketingKirsty Way Director of Corporate
CommunicationsMartin Wrigley Director of Operations
NEW ZEALAND REGISTERED OFFICE
10 Panorama Road Mt Wellington Auckland 1060 New Zealand
Tel: +64 9 579 9999 Fax: +64 9 579 8324 Website: www.skytv.co.nz
AUSTRALIAN REGISTERED OFFICE
c/- Allens Arthur Robinson Corporate Pty LimitedLevel 28, Deutsche Bank PlaceCorner Hunter and Philip StreetsSydney, NSW 2000 Australia
Tel: +61 2 9230 4000 Fax: +61 2 9230 5333
AUDITORS TO SKY
PricewaterhouseCoopers PricewaterhouseCoopers Tower 188 Quay Street Auckland New Zealand
Tel: +64 9 355 8000 Fax: +64 9 355 8001
SOLICITORS TO SKY
Buddle FindlayPricewaterhouseCoopers Tower,188 Quay Street Auckland New Zealand
Tel: +64 9 358 2555 Fax: +64 9 358 2055
SKY Interim Report December 2014 | 23
For
per
sona
l use
onl
y

24 | SKY Interim Report December 2014
NOTHING WILL STOP US NOW...
For
per
sona
l use
onl
y

SKY Interim Report December 2014 | 25
NOTHING WILL STOP US NOW...
For
per
sona
l use
onl
y
SKY NETWORK TELEVISION LIMITED
PO Box 9059 Newmarket Auckland 1149 New Zealand
10 Panorama Road Mt Wellington Auckland 1060 New Zealand
sky.co.nz
For
per
sona
l use
onl
y
SKY Network Television Limited
10 Panorama Road, Mt Wellington
PO Box 9059, Newmarket
Auckland, New Zealand
Tel: +64 579 9999
Fax: +64 525 8324
www.skytv.co.nz
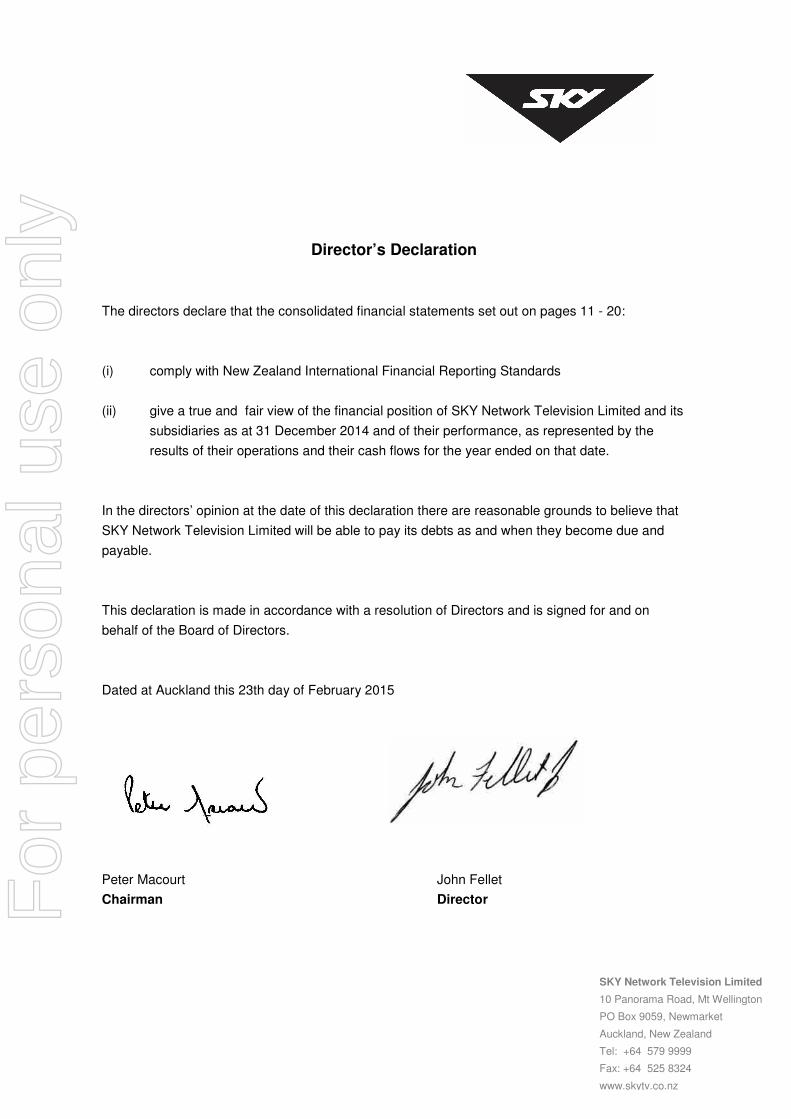
Director’s Declaration
The directors declare that the consolidated financial statements set out on pages 11 - 20:
(i) comply with New Zealand International Financial Reporting Standards
(ii) give a true and fair view of the financial position of SKY Network Television Limited and its
subsidiaries as at 31 December 2014 and of their performance, as represented by the
results of their operations and their cash flows for the year ended on that date.
In the directors’ opinion at the date of this declaration there are reasonable grounds to believe that
SKY Network Television Limited will be able to pay its debts as and when they become due and
payable.
This declaration is made in accordance with a resolution of Directors and is signed for and on
behalf of the Board of Directors.
Dated at Auckland this 23th day of February 2015
Peter Macourt John Fellet
Chairman Director
For
per
sona
l use
onl
y
Other Information
SKY Network Television Limited Half Year ended on 31 December 2014 (In NZD)
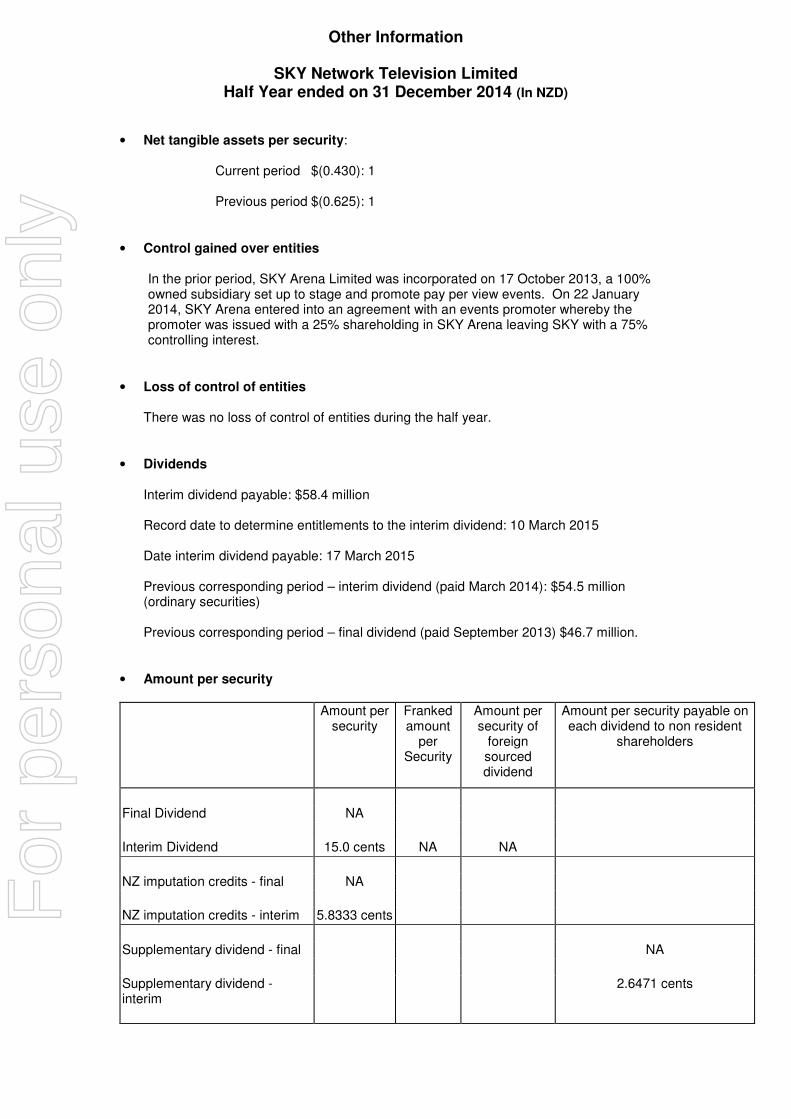
• Net tangible assets per security: Current period $(0.430): 1 Previous period $(0.625): 1
• Control gained over entities In the prior period, SKY Arena Limited was incorporated on 17 October 2013, a 100% owned subsidiary set up to stage and promote pay per view events. On 22 January 2014, SKY Arena entered into an agreement with an events promoter whereby the promoter was issued with a 25% shareholding in SKY Arena leaving SKY with a 75% controlling interest.
• Loss of control of entities There was no loss of control of entities during the half year.
• Dividends Interim dividend payable: $58.4 million Record date to determine entitlements to the interim dividend: 10 March 2015 Date interim dividend payable: 17 March 2015 Previous corresponding period – interim dividend (paid March 2014): $54.5 million (ordinary securities) Previous corresponding period – final dividend (paid September 2013) $46.7 million.
• Amount per security
Amount per security
Franked amount
per Security
Amount per security of
foreign sourced dividend
Amount per security payable on each dividend to non resident
shareholders
Final Dividend NA
Interim Dividend 15.0 cents NA NA
NZ imputation credits - final NA
NZ imputation credits - interim 5.8333 cents
Supplementary dividend - final NA
Supplementary dividend - interim
2.6471 cents
For
per
sona
l use
onl
y

• Details of aggregate share of profits (losses) of associates and joint venture entities
Not applicable
• Accounting standards
New Zealand international financial reporting standards used in compiling report.
• Directors’ Details
The directors of Sky Network Television Limited at any time during the half year are as follows: Peter Macourt Chairman Robert Bryden Deputy Chairman John Fellet Director & Chief Executive John Hart Director (resigned 24 October 2014) Humphry Rolleston Director John Waller Director Derek Handley Director Geraldine McBride Director
For
per
sona
l use
onl
y

SKY TELEVISION
INTERIM RESULTS
2015
For
per
sona
l use
onl
y

|
Dec 2013 Dec 2014 % Change
Residential - Digital 198.6 167.2 (15.8%)Residential - MYSKY 486.3 529.0 8.8Wholesale 135.4 119.2 (12.0)Commercial & Other 36.9 40.9 10.9
TOTAL SUBSCRIBERS 857.1 856.4 (0.1%)
THE INTERIM POSITION
Page 2
For
per
sona
l use
onl
y
|
0.0
0.5
1.0
1.5
2.0
2.5
3.0T
housa
nds
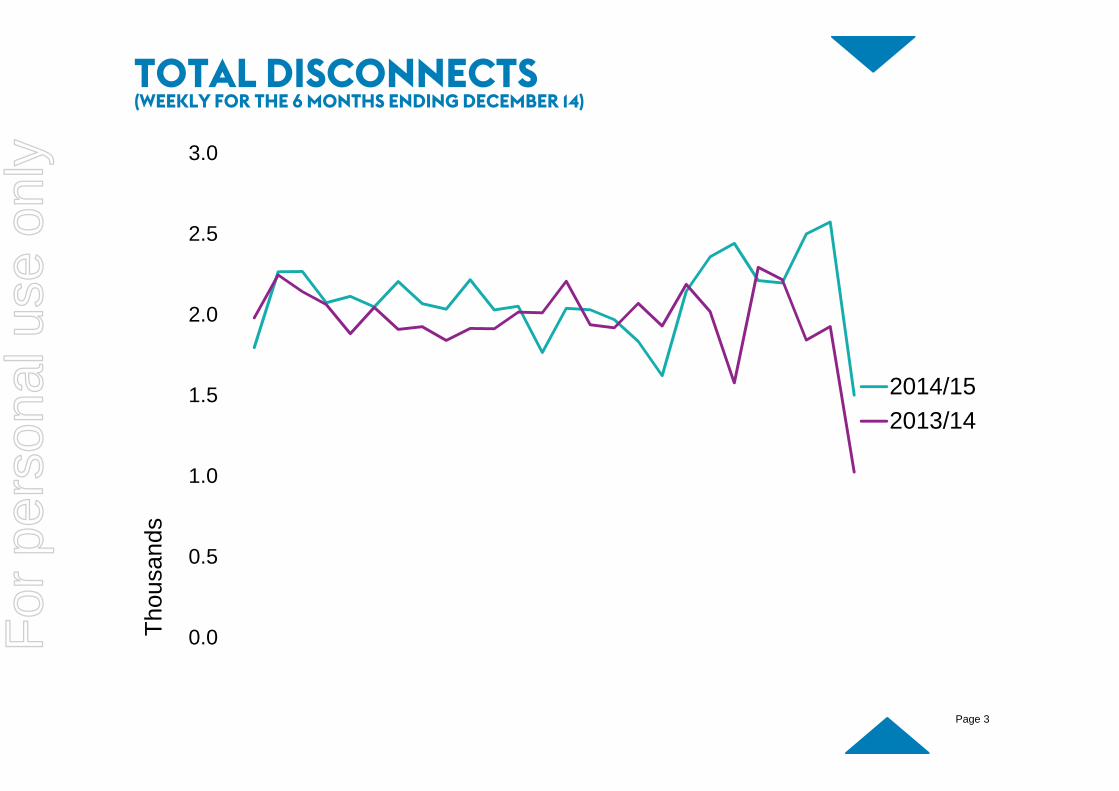
2014/15
2013/14
TOTAL DISCONNECTS(WEEKLY FOR THE 6 MONTHS ENDING DECEMBER 14)
Page 3
For
per
sona
l use
onl
y
|
0.0
0.1
0.2
0.3
0.4
0.5
0.6
0.7
0.8
0.9T
housa
nds
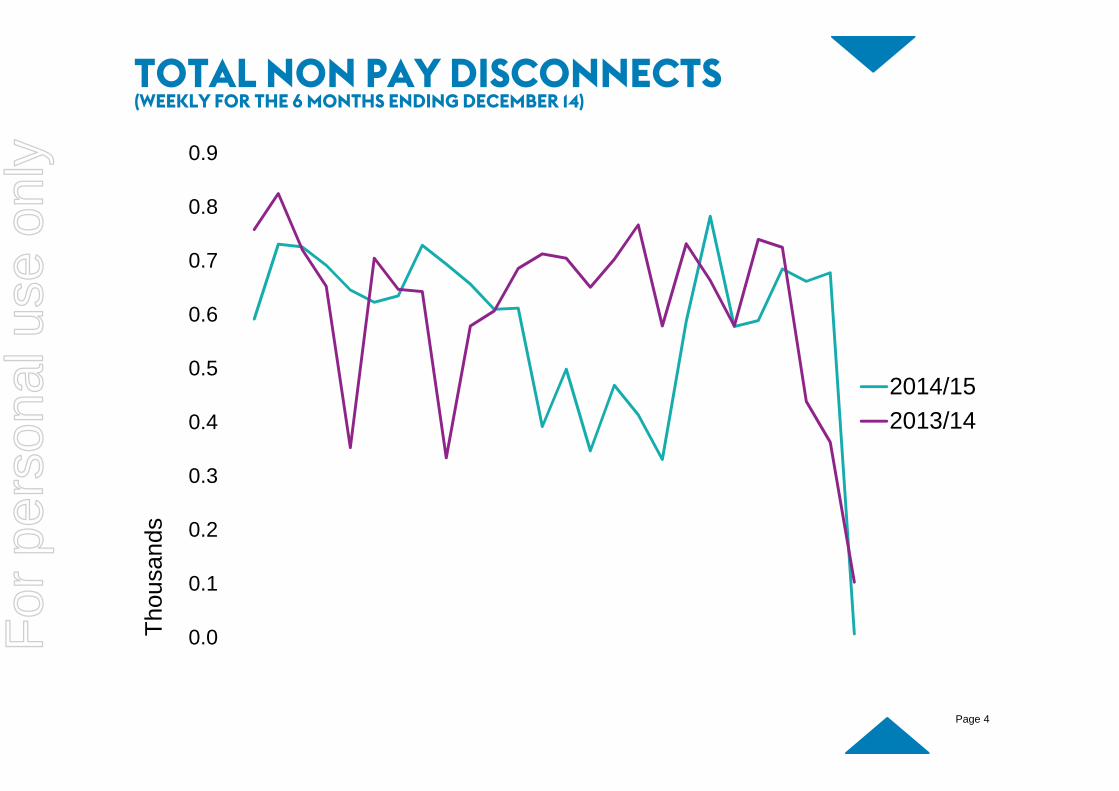
2014/15
2013/14
TOTAL NON PAY DISCONNECTS(WEEKLY FOR THE 6 MONTHS ENDING DECEMBER 14)
Page 4
For
per
sona
l use
onl
y
|
0.0
0.5
1.0
1.5
2.0
2.5
3.0T
housa
nds
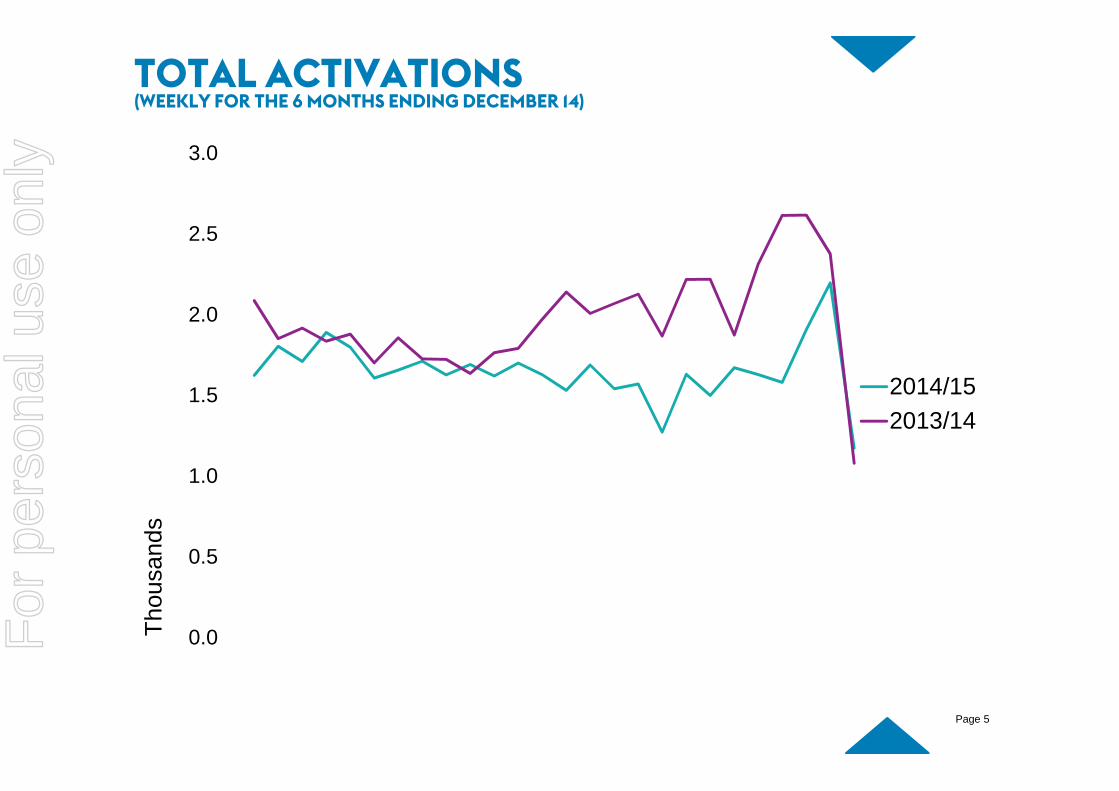
2014/15
2013/14
TOTAL ACTIVATIONS(WEEKLY FOR THE 6 MONTHS ENDING DECEMBER 14)
Page 5
For
per
sona
l use
onl
y
|
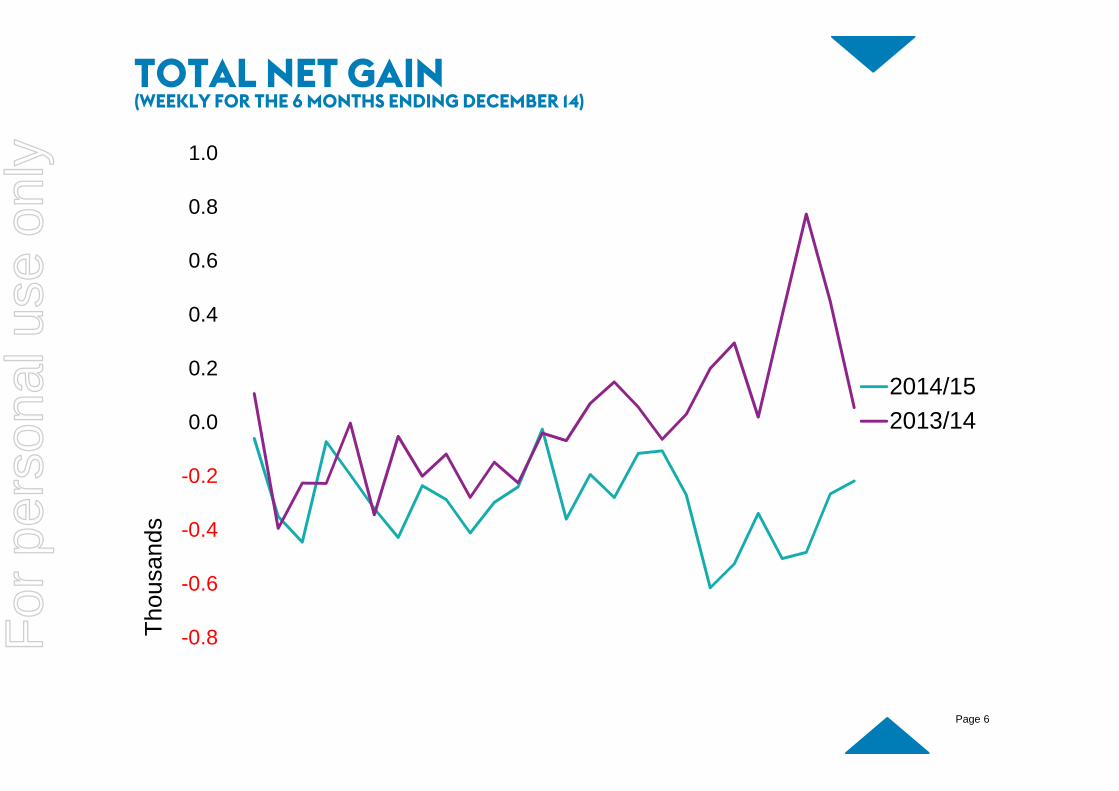
-0.8
-0.6
-0.4
-0.2
0.0
0.2
0.4
0.6
0.8
1.0T
housa
nds
2014/15
2013/14
TOTAL NET GAIN(WEEKLY FOR THE 6 MONTHS ENDING DECEMBER 14)
Page 6
For
per
sona
l use
onl
y

|
UHF Std SKY Wholesale SKY MY SKY Other
THE SKY JOURNEY SO FAR
Page 7
For
per
sona
l use
onl
y
|
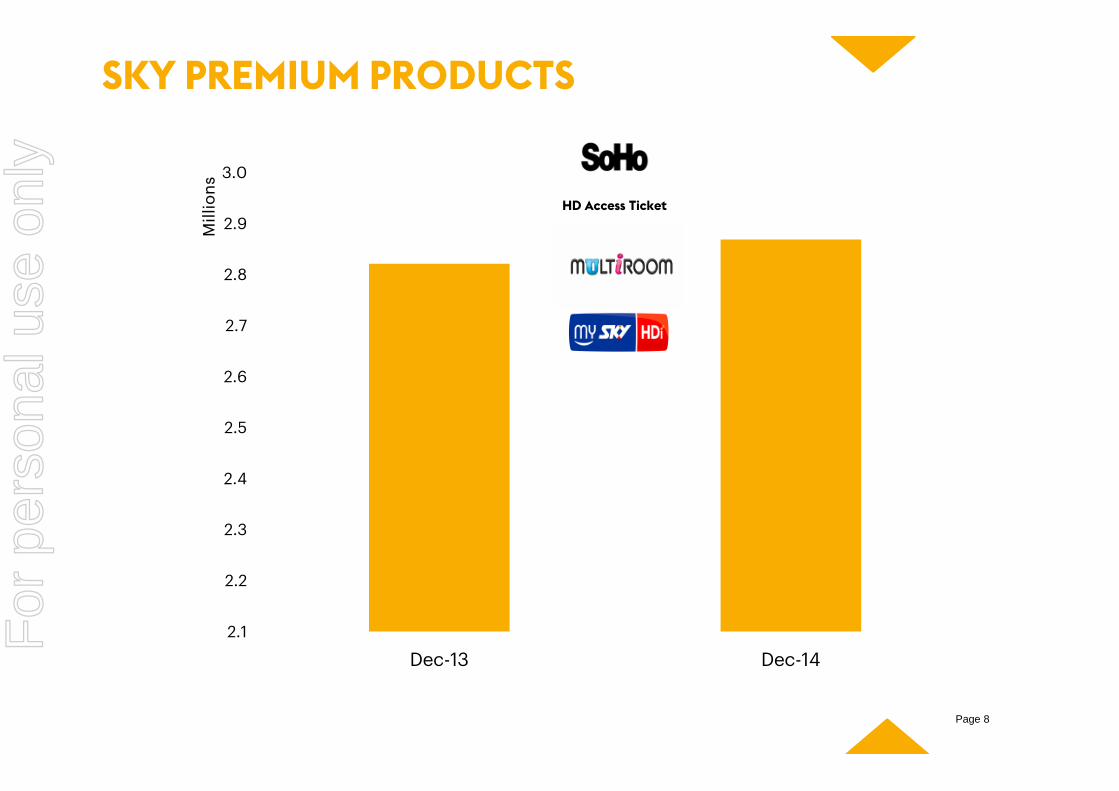
2.1
2.2
2.3
2.4
2.5
2.6
2.7
2.8
2.9
3.0
Dec-13 Dec-14
Mill
ions
HD Access Ticket
SKY PREMIUM PRODUCTS
Page 8
For
per
sona
l use
onl
y
|
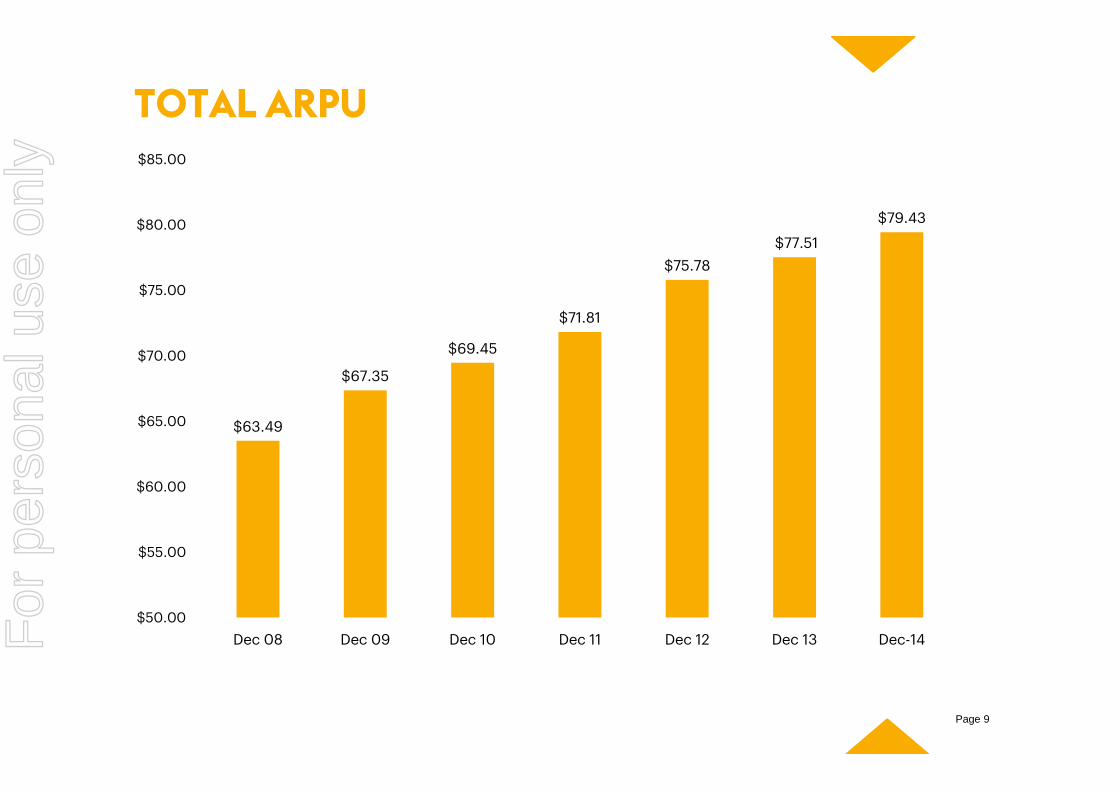
TOTAL ARPU
$63.49
$67.35
$69.45
$71.81
$75.78$77.51
$79.43
$50.00
$55.00
$60.00
$65.00
$70.00
$75.00
$80.00
$85.00
Dec 08 Dec 09 Dec 10 Dec 11 Dec 12 Dec 13 Dec-14
Page 9
For
per
sona
l use
onl
y

|
ADVERTISING REVENUE
35 38 36
67
5854
6367 68
71
0
10
20
30
40
50
60
70
80
2008 2009 2010 2011 2012 2013 2014 Interim 2015
Mill
ion
s
Page 10
For
per
sona
l use
onl
y
|
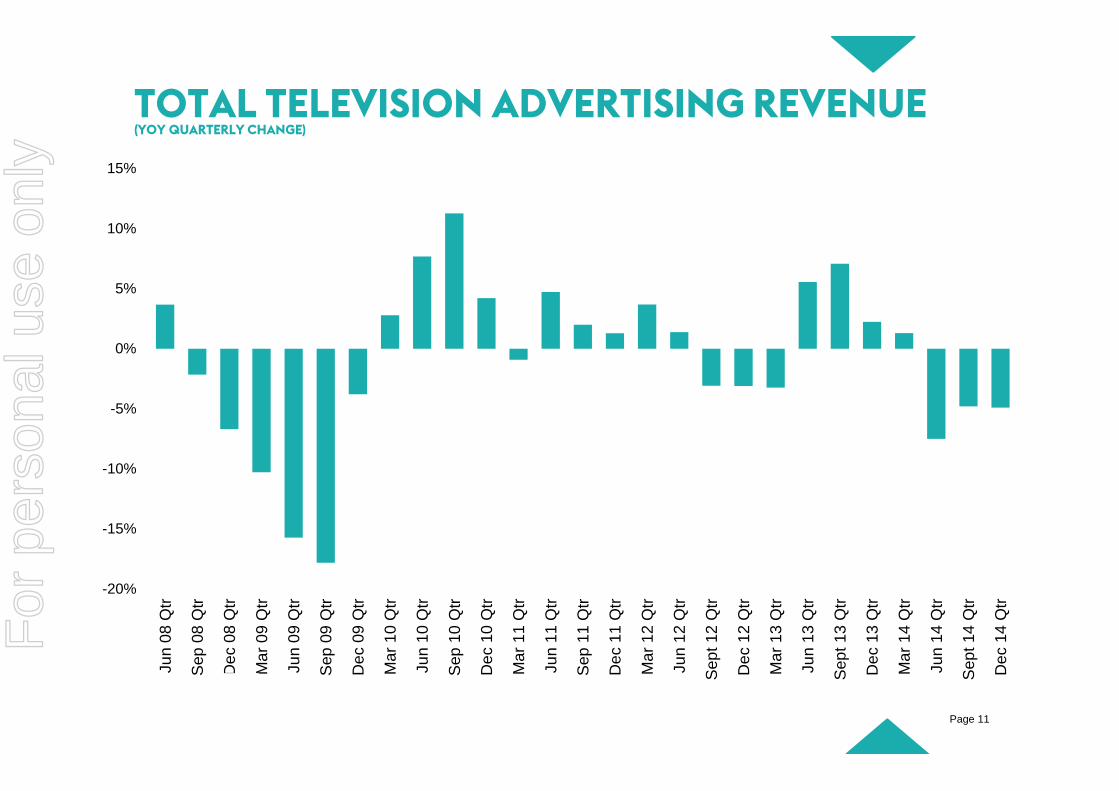
TOTAL TELEVISION ADVERTISING REVENUE(YOY QUARTERLY CHANGE)
-20%
-15%
-10%
-5%
0%
5%
10%
15%Ju
n0
8Q
tr
Sep
08
Qtr
De
c08
Qtr
Ma
r0
9Q
tr
Jun
09
Qtr
Sep
09
Qtr
De
c09
Qtr
Ma
r1
0Q
tr
Jun
10
Qtr
Sep
10
Qtr
De
c10
Qtr
Ma
r1
1Q
tr
Jun
11
Qtr
Sep
11
Qtr
De
c11
Qtr
Ma
r1
2Q
tr
Jun
12
Qtr
Sep
t12
Qtr
De
c12
Qtr
Ma
r1
3Q
tr
Jun
13
Qtr
Sep
t13
Qtr
De
c13
Qtr
Ma
r1
4Q
tr
Jun
14
Qtr
Sep
t14
Qtr
De
c14
Qtr
Page 11
For
per
sona
l use
onl
y
|
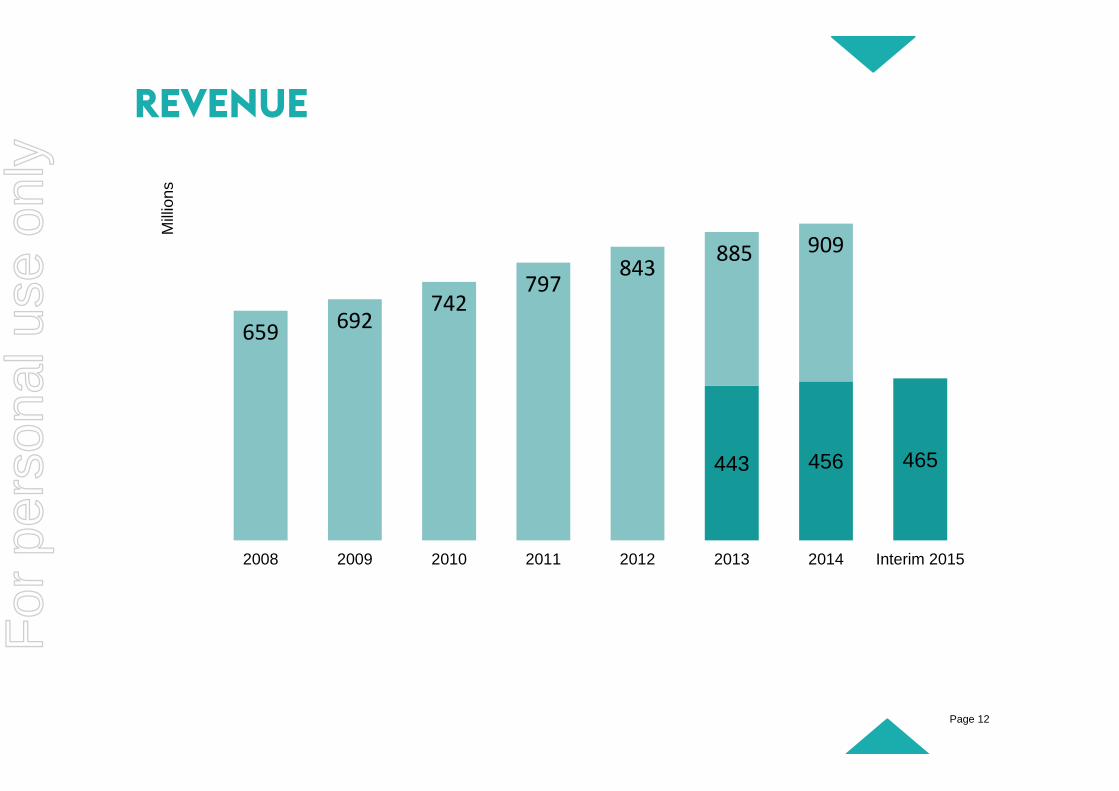
REVENUE
443 456 465
659 692742
797843
885 909
0
100
200
300
400
500
600
700
800
900
1000
2008 2009 2010 2011 2012 2013 2014 Interim 2015
Mill
ion
s
Page 12
For
per
sona
l use
onl
y
|
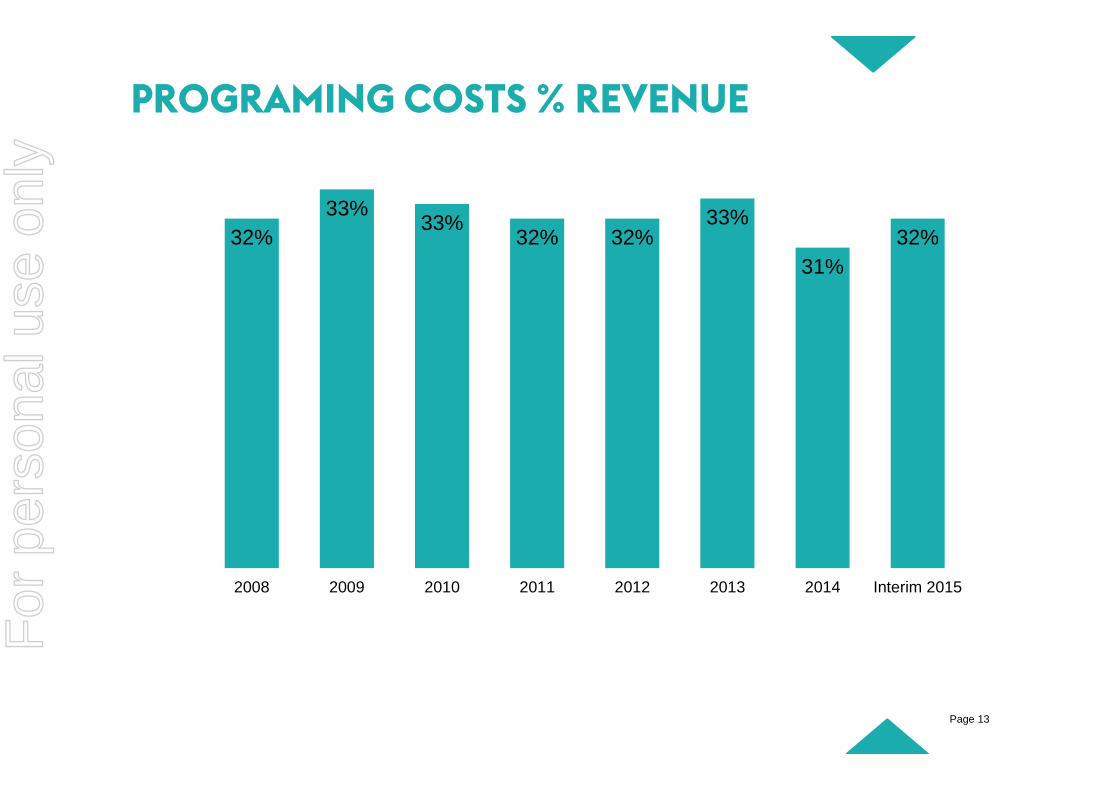
PROGRAMING COSTS % REVENUE
32%
33%33%
32% 32%33%
31%
32%
20%
22%
24%
26%
28%
30%
32%
2008 2009 2010 2011 2012 2013 2014 Interim 2015
Page 13
For
per
sona
l use
onl
y

|
EBITDA
177.5 190.4 192.4
266.6 261.0
287.5
321.7336.0
353.1
379.0
2008 2009 2010 2011 2012 2013 2014 Interim 2015
Mill
ion
s
Page 14
For
per
sona
l use
onl
y

|
NET PROFIT
67.482.1
92.5
97.788.1
103.0
120.3 123.7
137.2
161.4
0
20
40
60
80
100
120
140
160
180
2008 2009 2010 2011 2012 2013 2014 Interim 2015
Mill
ion
s
Page 15
For
per
sona
l use
onl
y

FINANCIAL DETAIL
For
per
sona
l use
onl
y

|
INTERIM RESULTS SUMMARY
2013 2014 % Change
Revenue 456.4 464.5 1.8%
Operating Expenses 266.0 272.1 2.3%
EBITDA 190.4 192.4 1.1%
Depn & Amort 61.8 54.1 (12.5%)
EBIT 128.6 138.3 7.6%
Interest 14.4 10.0 (30.6%)
Tax 32.1 35.8 11.5%
NET PROFIT after TAX 82.1 92.5 12.7%
Page 17
For
per
sona
l use
onl
y
|
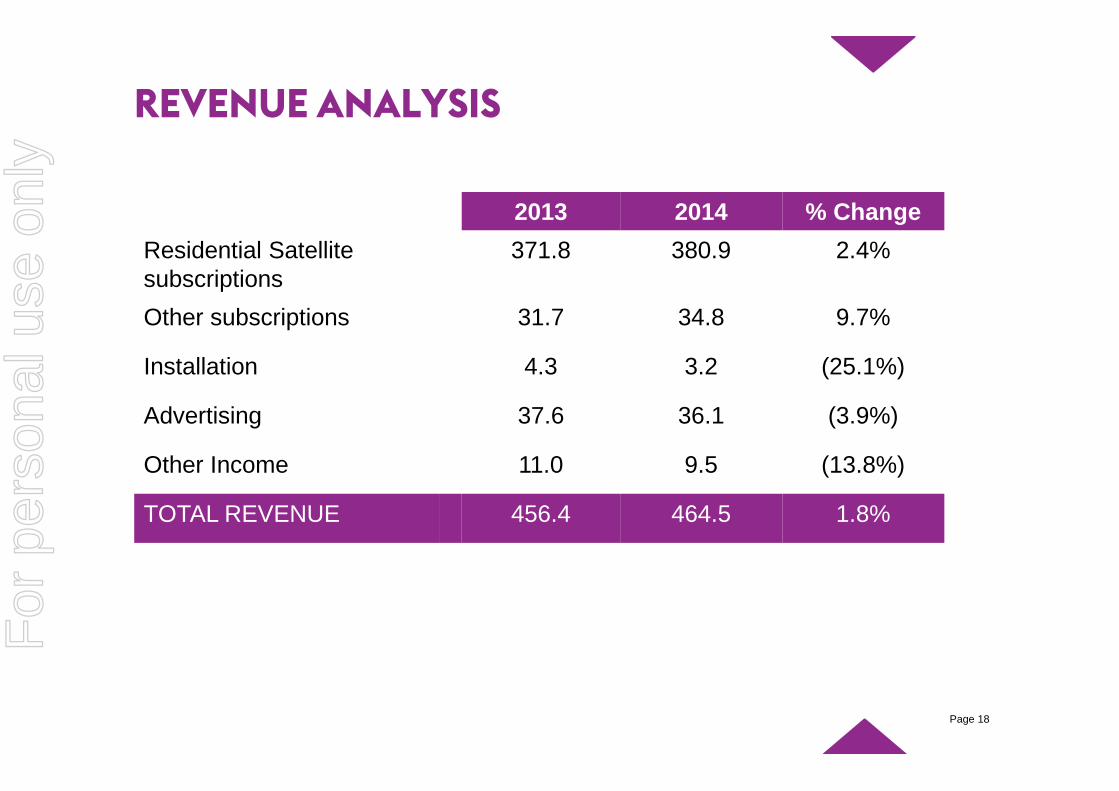
REVENUE ANALYSIS
2013 2014 % Change
Residential Satellitesubscriptions
371.8 380.9 2.4%
Other subscriptions 31.7 34.8 9.7%
Installation 4.3 3.2 (25.1%)
Advertising 37.6 36.1 (3.9%)
Other Income 11.0 9.5 (13.8%)
TOTAL REVENUE 456.4 464.5 1.8%
Page 18
For
per
sona
l use
onl
y

|
EXPENSE ANALYSIS
2013 2014 % Change
Programming rights 137.7 147.7 7.3%
Subscriber management 33.1 33.5 1.2%
Sales and marketing 20.4 19.0 (7.1%)
Advertising 11.7 10.9 (6.5%)
Broadcasting andinfrastructure
44.3 44.9 1.4%
Depreciation andamortisation
61.8 54.1 (12.5%)
Corporate 18.8 16.2 (13.9%)
TOTAL EXPENSE 327.8 326.3 (0.5%)
Page 19
For
per
sona
l use
onl
y
|
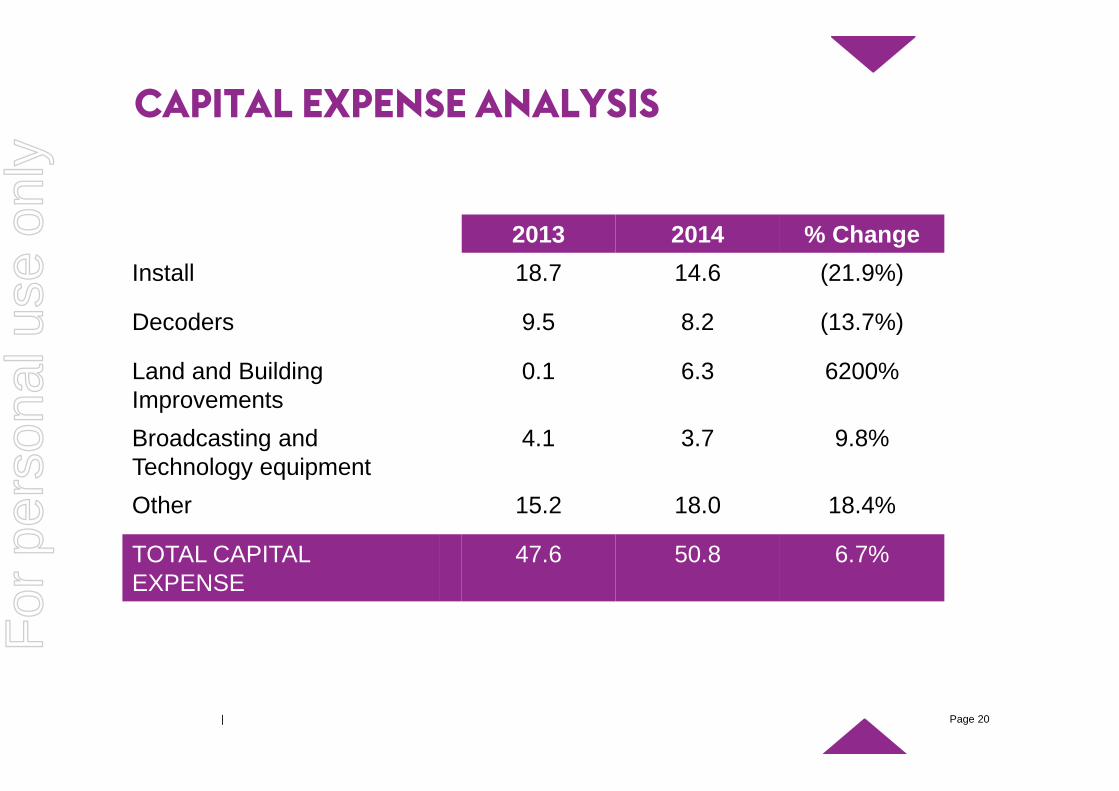
CAPITAL EXPENSE ANALYSIS
2013 2014 % Change
Install 18.7 14.6 (21.9%)
Decoders 9.5 8.2 (13.7%)
Land and BuildingImprovements
0.1 6.3 6200%
Broadcasting andTechnology equipment
4.1 3.7 9.8%
Other 15.2 18.0 18.4%
TOTAL CAPITALEXPENSE
47.6 50.8 6.7%
Page 20
For
per
sona
l use
onl
y
|
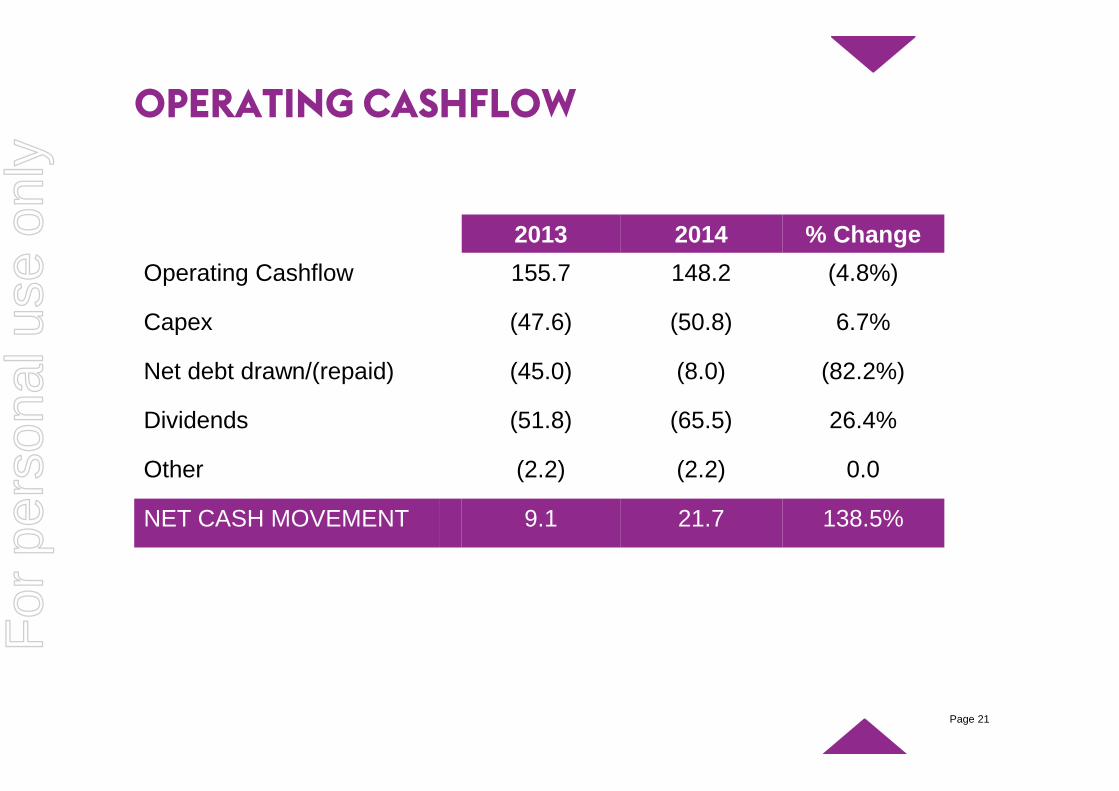
OPERATING CASHFLOW
2013 2014 % Change
Operating Cashflow 155.7 148.2 (4.8%)
Capex (47.6) (50.8) 6.7%
Net debt drawn/(repaid) (45.0) (8.0) (82.2%)
Dividends (51.8) (65.5) 26.4%
Other (2.2) (2.2) 0.0
NET CASH MOVEMENT 9.1 21.7 138.5%
Page 21
For
per
sona
l use
onl
y
|
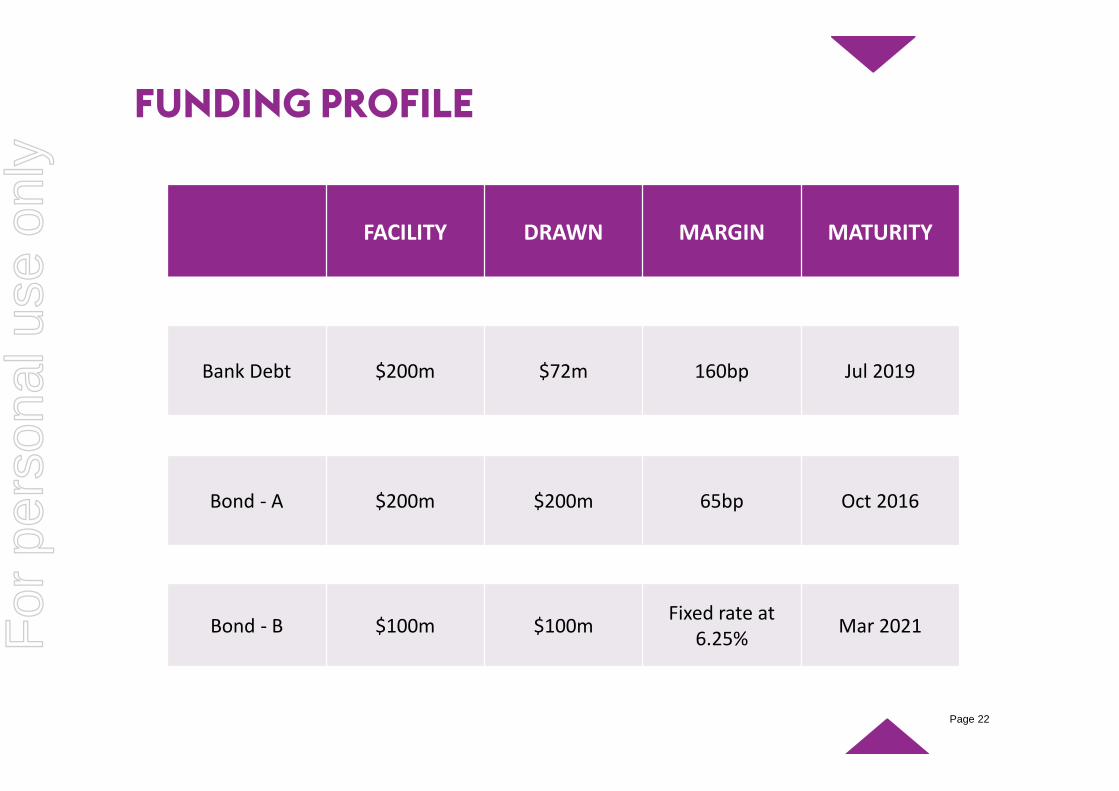
FUNDING PROFILE
FACILITY DRAWN MARGIN MATURITY
Bank Debt $200m $72m 160bp Jul 2019
Bond - A $200m $200m 65bp Oct 2016
Bond - B $100m $100mFixed rate at
6.25%Mar 2021
Page 22
For
per
sona
l use
onl
y
|
FOREIGN CURRENCY HEDGING
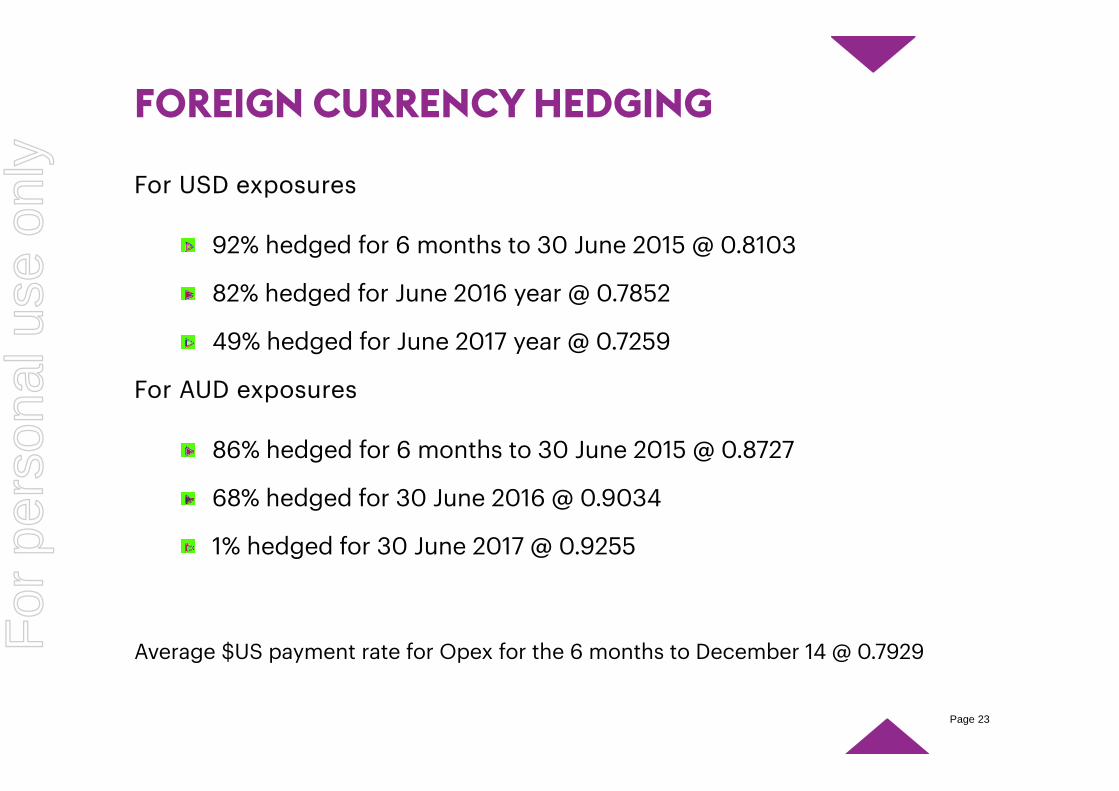
For USD exposures
92% hedged for 6 months to 30 June 2015 @ 0.8103
82% hedged for June 2016 year @ 0.7852
49% hedged for June 2017 year @ 0.7259
For AUD exposures
86% hedged for 6 months to 30 June 2015 @ 0.8727
68% hedged for 30 June 2016 @ 0.9034
1% hedged for 30 June 2017 @ 0.9255
Average $US payment rate for Opex for the 6 months to December 14 @ 0.7929
Page 23
For
per
sona
l use
onl
y
|
DIVIDEND
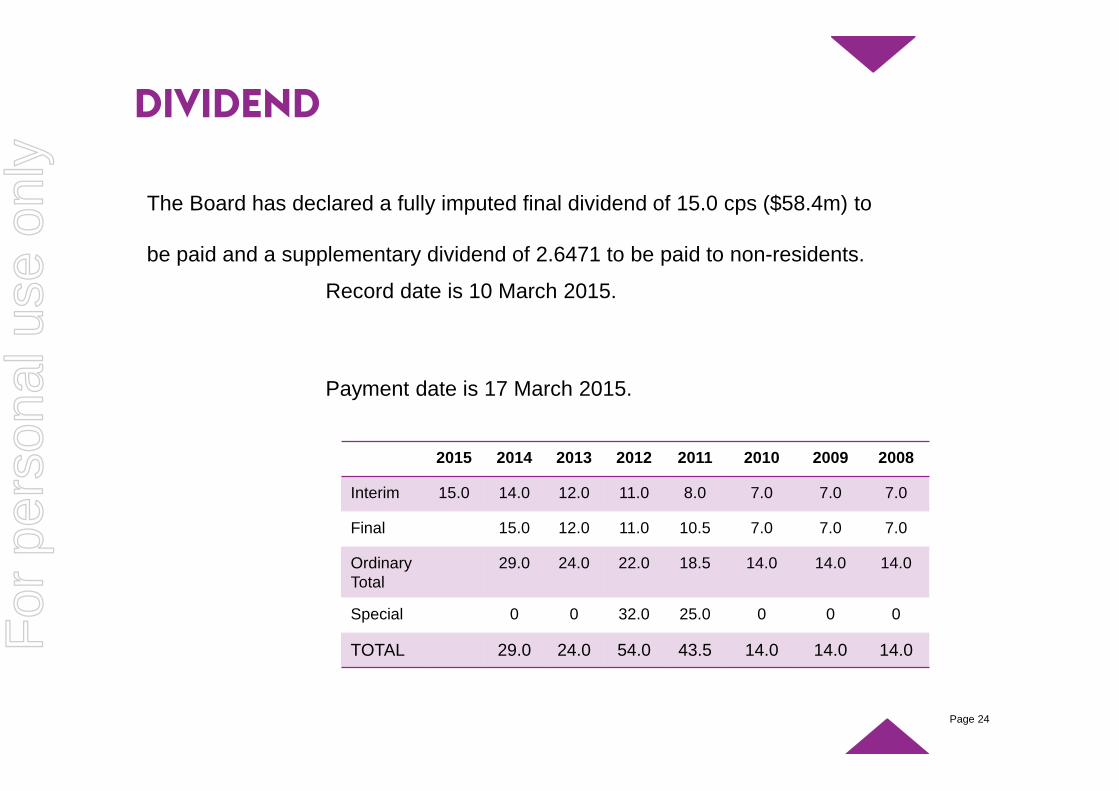
The Board has declared a fully imputed final dividend of 15.0 cps ($58.4m) to
be paid and a supplementary dividend of 2.6471 to be paid to non-residents.
Record date is 10 March 2015.
Payment date is 17 March 2015.
2015 2014 2013 2012 2011 2010 2009 2008
Interim 15.0 14.0 12.0 11.0 8.0 7.0 7.0 7.0
Final 15.0 12.0 11.0 10.5 7.0 7.0 7.0
OrdinaryTotal
29.0 24.0 22.0 18.5 14.0 14.0 14.0
Special 0 0 32.0 25.0 0 0 0
TOTAL 29.0 24.0 54.0 43.5 14.0 14.0 14.0
Page 24
For
per
sona
l use
onl
y

SKY HIGHLIGHTS
For
per
sona
l use
onl
y
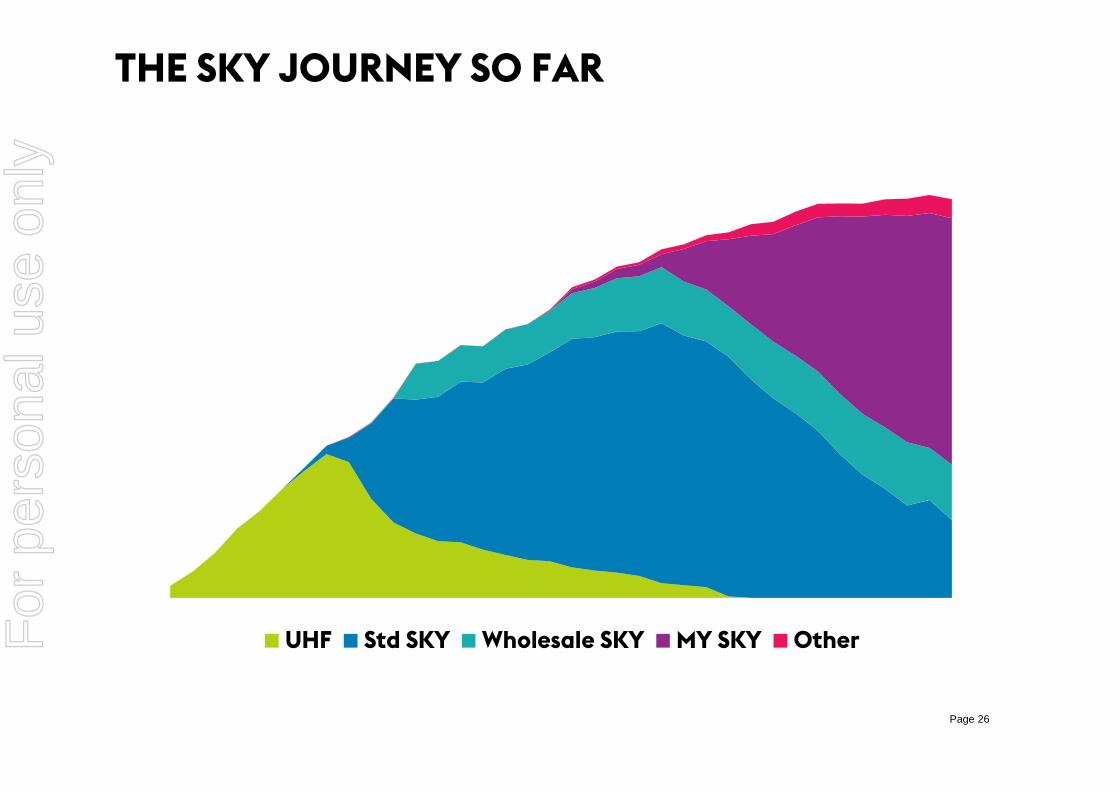
UHF Std SKY Wholesale SKY MY SKY Other
THE SKY JOURNEY SO FAR
Page 26
For
per
sona
l use
onl
y
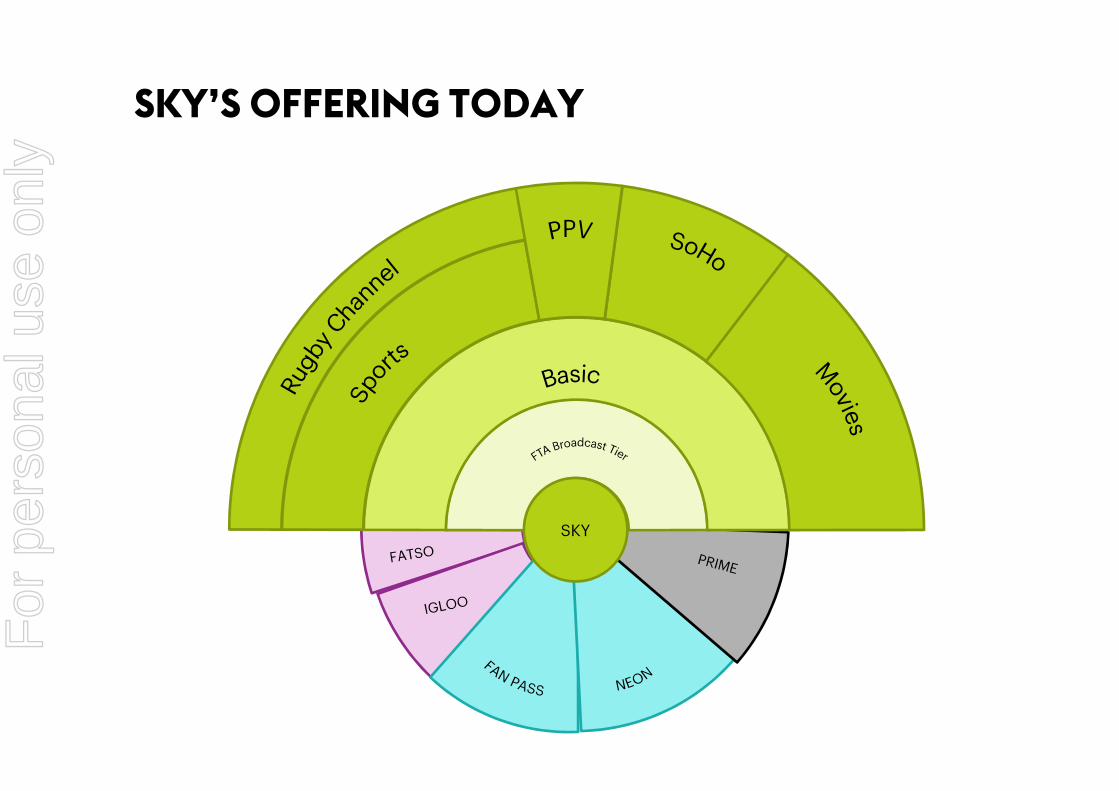
SKY’S OFFERING TODAY
SKY
For
per
sona
l use
onl
y
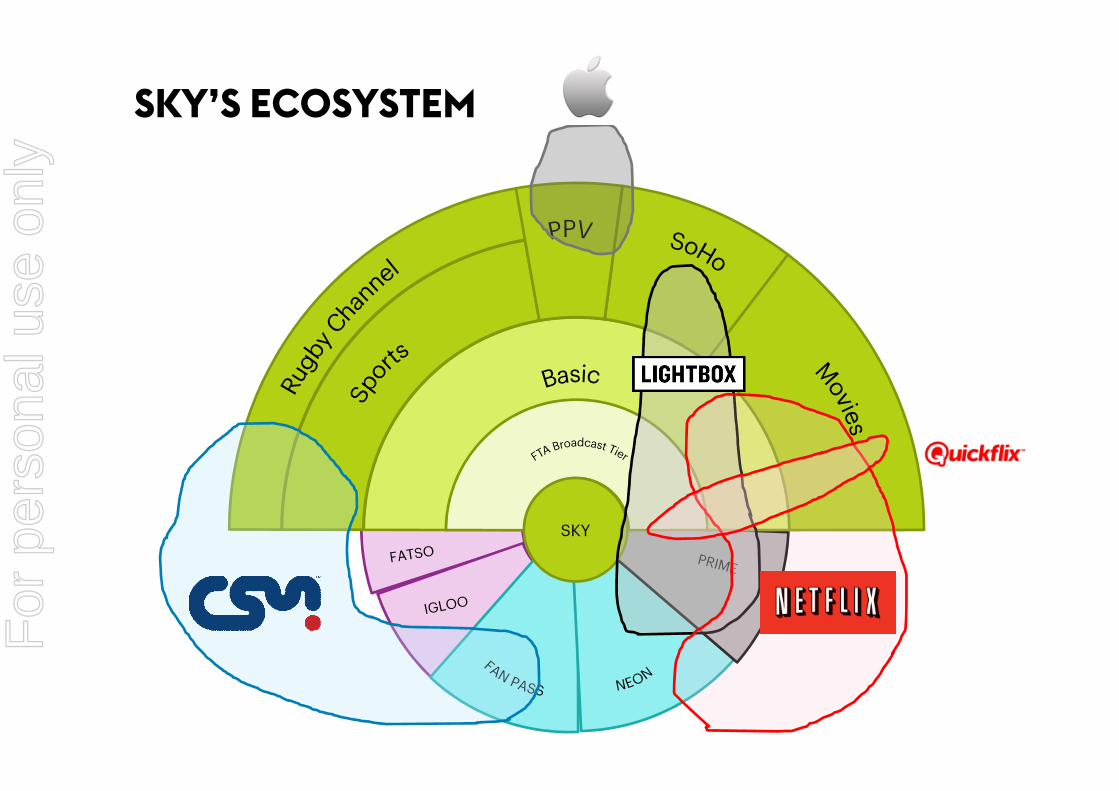
SKY’S ECOSYSTEM
SKY
For
per
sona
l use
onl
y

For
per
sona
l use
onl
y

For
per
sona
l use
onl
y

|
For
per
sona
l use
onl
y

For
per
sona
l use
onl
y

WANT MORE?POP ON IN
To say thanks to our subscribers for being such great customers,we’re offering them more than ever before
POP-UP
POP-UP
For
per
sona
l use
onl
y

For
per
sona
l use
onl
y

Guidance
$m
Revenue 930-940
EBITDA 370-380
Depreciation 105-110
NPAT 170-180
Capex 115-125
Guidance is to the low end of the rangeprovided October 2014
GUIDANCE
For
per
sona
l use
onl
y

SKY TELEVISION
INTERIM RESULTS
2015
For
per
sona
l use
onl
y


