
ldquoCritical Care Management of
Cardiovascular Patientsrdquo
Glenn J R Whitman MD
Director CVSICU and Heart Transplant
Johns Hopkins Hospital
September 12 2016 1
Michigan Society of Thoracic and Cardiovascular Surgery
August 132016
Disclosures
bull Abbott Nutrition
September 12 2016 2
QUALITY AND
REPORTING
September 12 2016 3
Consumer Reports August 2014
September 12 2016 6
STS Star Ratings for
Coronary Bypass Surgery
NQF Report Metrics
1 Operative Mortality (Risk-Adjusted)
2 Major Morbidity (5 Risk-Adjusted variables)
RF Reop Stroke Mediastinitis Intub gt 24 hrs
3 Use of Internal Mammary Artery
4 Medications
o Pre-op Beta Blockers
o Discharge Beta Blockers
o Discharge Anti-Lipids
o Discharge Anti-Platelets
STS Composite Score
September 12 2016 9
It is all about ldquomorbidity and mortalityrdquo
0
5
10
15
20
25
30
35
40
To
tal
Ris
k B
ene
fit
Tim
ing
of
Surg
ery
Card
ioge
nic
Sh
ock
Ju
dg
me
nt
Cata
str
op
he
Heart
Fa
ilure
Myo
ca
rdia
l V
iabili
ty
Hig
h R
isk
To
tal
Te
chn
ical
Ju
dg
me
nt
Myca
rdia
l P
rote
ction
Myo
ca
rdia
l p
rote
ctio
n
Recog
nitio
n
Str
oke
To
tal
Respir
ato
ry
Sep
sis
Recog
nitio
n
Cata
str
op
he
Hem
odyn
am
ic M
ana
gem
en
t
Arr
hyth
mia
Man
ag
em
ent
Card
iac A
rrest
Card
ioge
nic
Sh
ock
Ris
k B
ene
fit
To
tal
Recog
nitio
n
Cata
str
op
he
Dysrh
yth
mia
Pha
rmaco
logic
al M
an
ag
em
en
t
Sep
sis
Ju
dg
me
nt
Respir
ato
ry
To
tal
Cata
str
op
he
PreOp IntraOp PostOp ICU PostOP Floor Discharge
Deaths by POCA Category and
Problem
Shannon FL1 Fazzalari FL Theurer PF Bell GF Sutcliffe KM Prager RL
Michigan Society of Thoracic and Cardiovascular Surgeons
Full Time Intensivists How It All
Began
September 12 2016 13
JAMA
19842522023
bull St Barnabas Hospital Bronx NY
bull 1979-1981 10 bed ICU n =1070
ICU Care Daytime Nighttime
Yr 1 Office based MD Agency MD board eligible
Yr 2 Full time MD (IMCards) Subspecialty Fellow
Benefit of On-Site Physician
Mortality Decreased (OR 062 p=001)
September 12 2016 14Li et al JAMA 19842522023
bull 26 Observational Trials staffing
patterns and outcomes
bull Staffing
bull Low Intensity no intensivistelective
consultation
bull High Intensity closed ICUmandatory
consult
September 12 2016 15
Pronovost et al JAMA 20022882151
Staffing Patterns Matter in the ICU
Pronovost et al JAMA 2002
FULL TIME INTENSIVIST ICU
STAFFING
bull Improves Mortality
bull Decreases Length of Stay
bull Improves Cost Efficiency
September 12 2016 17
Fuchs et al
Clinical Anesthesiology 200519125-135
Effect of Multi-D Rounds and ICU Mortality
Kim M et al Arch Int Med
2010170369-376
Pa Hospitals n = 112
Patients = 108000
2004-2006
Low intensity Intensivist
optionalnone
Hi intensity
Intensivist mandatory
Multi-Dbull Pharmacy
bull Resp Therapy
bull Social Work
Date of download 1222014Copyright copy 2014 American Medical
Association All rights reserved
From Pharmacist Participation on Physician Rounds and Adverse Drug Events in the Intensive Care Unit
JAMA 1999282(3)267-270 doi101001jama2823267
Figure Legend
MICU CCU
366 recommendations
with a 95 acceptance rate
20
Pronovost JCC 20031871-75
Daily Goals Impact on ICU Care
September 12 2016 22
N Engl J Med 2009 360(5)491-499
Selected Process Measures before and after Checklist Implementation According to Site
Years 2007- 2008
8 hospitals
8 countries
2 time intervals pre
and post checklist
Appr 3750 pts
group
Selected Process Measures before and after Checklist Implementation According to Site
Haynes AB et al N Engl J Med 2009360491-499
Selected Process Measures before and after Checklist Implementation According to Site
Outcomes before and after Checklist Implementation According to Site
Haynes AB et al N Engl J Med 2009360491-499
Outcomes before and after Checklist Implementation According to Site
September 12 2016 27
0
10
20
30
40
50
60
70
80
90
100
Jul15 Aug15 Sep15 Oct15 Nov15 Dec15 Jan16 Feb16 Mar16 Apr16 May16 Jun16
POD0 Complete
Signed
Goal
POD 0 Checklist Compliance
ICU TEAMWORK MATTERS
September 12 2016 34
Cardiac Surgery Quality Assurance
Performance Improvement Committee (2009 ndash 2012)
bull First and Third Friday of Every Month
bull Representatives From
bull Attendings
bull Fellows
bull APrsquos both CVSICU and CVPCU
bull RespiratoryTherapy
bull Physical Therapy
bull Pharmacy
bull Nursing both CVSICU and CVPCU
bull Administration
bull Quality Improvement
INFLUENCE OF THE COMPREHENSIVE
UNITndashBASED SAFETY PROGRAM IN ICUS
EVIDENCE FROM THE KEYSTONE ICU
PROJECT
September 12 2016 36
Hsu Y Marsteller J
Am J Med Qual 201631349-
357
CUSP Comprehensive Unit Based
Safety Program
bull CUSP Members
bull Team Leader
bull Physician Champion
bull Executive Champion
bull Nurse Manager
bull Infection Prevention Representative
bull Resp Therapy Environmental Invited
Stakeholders
September 12 2016 37
CUSP
bull Monthly Meetings
bull Monthly Safety Rounds
bull Identify system defects
bull Develop safety and monitoring tools
bull Educate the staff
bull Present outcomes
September 12 2016 38
0
10
20
30
40
50
60
70
Teamwork Safety Job Satisfaction Stress Recognition Perceptions of Mgmt Working Conditions Teamwork Safety Job Satisfaction Stress Recognition Perceptions of Mgmt Working Conditions
Non-CUSP ICUs CUSP ICUs
significantly positive difference
Hsu Y Marsteller J
American Journal of Medical Quality 201631349ndash357
Influence of CUSP on ICU Culture
Improvement in
bull Teamwork
bull Safety
bull Satisfaction
bull Environment
Teamwork Climate
The Effect of a Comprehensive Unit
Based Safety Program on CLABSI
September 12 2016 41
Miller K et al 2016 Am J Infection Control
The Impact of ICU Structure and
Processes on Outcomes
bull Full Time Intensivists
bull Multidisciplinary Teams
bull Organization of Rounds
bull Checklists
bull Teamwork
bull Performance Improvement and
Metrics
September 12 2016 42
0
5
10
15
20
25
30
35
40
1-6 6-12 12-24 24-48 gt48
Infe
cti
on
Rate
Post Op Vent Time (hrs)
Non-PNA Infxn
PNA
Post-Op SSI and PNA Rate in Open Heart
Surgery Patients
Johns Hopkins Hospital 112011 ndash 32014
(n = 2253)
Primary Outcome
Postoperative Overall Infection (n=127)
withwithout Vent time adjusted
Odds of
Infection
(95CI)
Without Vent
Timep-value
With Vent
Timep-value
Intraop + Postop
Transfusion
RBC
(unit)11(10-12) 004 10(09-11) 076
FFP 13 (08-22) 026 11(06-18) 081
Platelet 08(05-13) 034 08(05-14) 048
Cryo 12 (06-25) 060 12(04-32) 078
Preop
WBC11(10-11) lt0001 105(10-11) 0001
Preop
COPD33(22-50) lt0001 26(16-43) lt0001
Preop Crgt
15mgdL17(10-27) 004 134(08-22) 026
Adjusted variables were blood products previous cardiac surgery preoperative WBC value heart failure within 2 weeks prior to
surgery preoperative COPD preoperative serum creatinine CPB time and surgery type vs isolated CABG and postoperative
ventilation time Only values lt 005 are shown except for transfusions
1
25 26
147
0
2
4
6
8
10
12
14
16
0-12 12-24 24-48 48+O
dd
s o
f o
ve
rall
In
fec
tio
n
Postoperative Ventilation Time (hours)
ref
p=003p=0004
plt0001
0
5
10
15
20
25
30
35
JHH2008
STS Like2008
STS National2008
Patients Extubated lt6hrs
(CABG Only)
Early Extubation Performance at the
Johns Hopkins Hospital - 2008
0
5
10
15
20
25
30
35
40
45
50
JHH Period 1(132005-9292009)
JHH Period 2(1012009-8312011)
Patients Extubated
lt6hrs (CABG Only)
n= 1174
n= 637
STS National Average 2009 37
STS Like Institutions 2009 32
plt001 compared to JHH Period 1
Pre vs Post Implementation of New MV
Weaning Protocol
A Bow Around Your Finger
0
5
10
15
20
25
30
35
40
45
50
JHH Period 1(132005-9292009)
JHH Period 2(1012009-8312011)
JHH Period 3(912011-6302012)
n=1174
n=637
Ŧ
STS National Average 2011 40
STS Like Institutions 2011 42
Patients Extubated
lt6hrs(CABG Only)
n=236
plt001 compared to JHH Period 1 Ŧ plt001 compared to JHH Period 2 Fitch ZW Debesa O Ohkuma R et al
J Thorac Cardiovasc Surg 2014 Apr 147(4)1344-50
Results Following Additional Protocol
Changes
12
24
38
51
0
10
20
30
40
50
60
JHH Period 1 (132005-9292009)
JHH Period 2 (1012009-8312011)
JHH Period 3 (912011-6302012)
JHH Period 4 (112014-8152014)
STS Like Institutions 2014
plt001 compared to JHH Period 1 Ŧ plt001 compared to JHH Period 2
n=236
n=637
n=1174
n=236
Ŧ
Patients Extubated
lt6hrs(CABG Only)
Extubation lt 6 Hours Current
Performance 2014
September 12 2016 50
CVSICU Reasons For
Extubation gt6h
Hemodynamic Instability4 Hypoxia
3CVA or delirium
5
Bleeding20
Open chest ECMO17
Metabolic Acidosis28
Other23
CVSICU Arrival Temp
1215
5
137
14 13 11 11 10 118
0
20
40
60
80
100
Jul15 Aug15 Sep15 Oct15 Nov15 Dec15 Jan16 Feb16 Mar16 Apr16 May16 Jun16
Temp gt35
Temp lt 350
0
2
4
6
8
10
12
14
16
18
2013 n=390
2014 n=348
2015 n=469
Q1-2016 n=110
Isolated CAB Morbidity
Failed to Prescribe All Eligible
Medications for Isolated CAB
54
If you donrsquot know your performance
you are not doing as well as you think you are
Intervention ndash PCR testing
bull Preoperative PCR testing for MRSA
ndash Nasal swab by PAs on preop visit
bull If positive
ndash Intranasal mupirocin bid
ndash Chlorhexidine baths
bull Both for 5 days (or as many days as possible preop
full course completed in ICU if necessary)
Overall SSI in CABG Patients
05 005
37
265
0
1
2
3
4
5
Pre-Intervention (n=1357) Intervention (n=1990)
Non-MRSA
MRSA42
27
Perc
enta
ge o
f C
AB
G p
atients
Un-adjusted Adjusted
OR 95 CI p-value OR 95 CI p-value
Intervention Era 064 044 093 002 058 040 086 0007
MRSA ICU Admissions
26
14
0
1
2
3
Pre-Intervention (n=2826) Intervention (n=4038)
Perc
enta
ge o
f IC
U A
dm
issio
ns
MRSA-Positive on ICU Admission
Univariate Multivariate
OR 95 CI p-value OR 95 CI p-value
Intervention Era 05 037 074 lt0001 05 037 076 lt0001
MRSA ICU Admissions
10
26
04
0
1
2
3
Pre-Intervention (n=2826) Intervention (n=4038)
Perc
enta
ge o
f IC
U A
dm
issio
ns
No PCR
PCR Screened
14
MRSA-Positive on ICU Admission
Univariate Multivariate
OR 95 CI p-value OR 95 CI p-value
Intervention Era 05 037 074 lt0001 05 037 076 lt0001
MRSA ICU Transmission
Adjusted Poisson Regression MRSA transmissions
aIRR 95 CI P
Intervention era 029 013 065 0002
16
04
00
02
04
06
08
10
12
14
16
18
Pre-Intervention(14733 pt days)
Intervention(21467 pt days)
Incid
ence R
ate
per
1000 p
tdays
Staph Screening Miss CategoriesJuly 2016
September 12 2016 60
1
2
2
3Transfer
True Miss
gt45 Days
Discontinued
Group but not Individual
Accountability
September 12 2016 61
65
74
81
71
87 8892
0
10
20
30
40
50
60
70
80
90
100
2009 2010 2011 2012 2013 2014 2015 (Jan-March)
CVSICU Hand Hygiene Compliance by Year
45
67
89
10
11
12
13
14
15
Hg
b(g
md
L)
1 2 3 4 5 6 7 8 9 10 11 12 1314 15 16 17 18 19 2021 22 23 24 25
Week
All Surgeons Combined
Weekly Transfusions with Corresponding Hgb for All
Procedures
Period 1 Period 2
45
67
89
10
11
12
13
14
15
Hg
b(g
msd
L)
1 2 3 4 5 6 7 8 9 10 11 12131415 16171819 20212223 24 25
Week
For a Single Surgeon
Weekly Transfusions with Corresponding Hgb for All
Procedures
Period 1 Period 2 Period 3
45
67
89
10
11
12
13
14
15
Hg
b(g
md
L)
1 2 3 4 5 6 7 8 9 10 11 12 1314 15 16 17 18 19 2021 22 23 24 25
Week
All Surgeons Combined
Weekly Transfusions with Corresponding Hgb for All
Procedures
Period 1 Period 2 Period 3
02
04
06
0
Tra
nsfu
sed
(
)
Period 1 Period 2 Period 3
Percent of Transfusions at Increasing Hgb
Thresholds All Surgeons Combined
above Hgb of 8 gmdL
above Hgb of 9 gmdL
above Hgb of 10 gmdL
Denotes significantly different than period 1
Denotes significantly different than period 2
Monthly Cardiac Surgery Dashboard
bull Vent Times
bull Reasons for ext gt 6 hrs
bull iNO vs Veletri hrs
bull HyperHypo glycemia
bull Checklist Compliance
bull Staph screening (with reasons
for misses)
bull Blood Utilization
bull CVSICU arrival
bull K+
bull Temp
bull Base Deficit
bull Daily Weights
bull Transfers gt 6 pm
bull Bouncebacks (Total lt 24 hrs)
with Reasons)
September 12 2016 66
And Weekly Mortality and Morbidity
The Johns Hopkins Cardiac Surgery
Code of Conduct and Professional Behavior
September 12 2016 68
Critical Care of the Cardiovascular PatientThe essentials for high quality
1 Full time intensivists
2 Structured Multi-D rounds (Pharmacy)
3 Nurse readbacks
4 Checklists
5 Culture of safetyteamwork (CUSP)
6 Performance improvement requires
bull Multidisciplinary input
bull Agreed upon targets
bull Review of outcomes
bull Continual reassessment
6 Individual accountability matters
Isolated CABG
Post Op Morbidities
0
2
4
6
8
10
12
14
16
18
ANY MORBIDITY(Total)
ProlongedVentilation
MultipleMorbidities
Reoperation Renal Failure CerebrovascularAccident
Deep SternalWound
Mediastinitis
2014 Jan 1 ndash Jun 30
bull Universal public reporting is inevitable
bull ICU care plays a major role in patient
outcomes
September 12 2016 70
Surgeon-Reported Conflicts with Intensivists About
Postoperative Goals of Care
JAMA Surg 201314829-35
bull Vascular Neurologic and
Cardiothoracic Surgeons
bull Mail Questionnaire
bull 56 response rate n = 2100
September 12 2016 71
Rates of Surgeon Reported ConflictsJAMA Surg 201314829-35
September 12 2016 72
0
1
2
3
4
1 2 3 4 5 6 7 8 9 10
Institution
Count of Cardiac Surg
Count of Gen Surg CC
Count of Card Surg CC
Count of Anesth
Count of Anesth CC
Count of Cardiac Anesth
Count of Card Anesth CC
Count of Pulm CC
radic
radic
radic
radic
radic
radic
radic
radic
radic
radic
radic = CT trained
Heterogeneity of Specialties in Cardiac
Intensive Care Units
446537
556
75
889
1943
0 - 6 hrs 6 - 9 hrs 9 - 12 hrs 12 - 18 hrs 18 - 24 hrs gt 24 hrs
ICU
Sta
y(h
rs)
me
an
plusmnS
D
Intubation Duration
p lt 001
p = 070
p = 005
Unadjusted ICU Length of Stay
67 7
8
85
13
0 - 6 hrs 6 - 9 hrs 9 - 12 hrs 12 - 18 hrs 18 - 24 hrs gt 24 hrs
Hospital S
tay
(days)
media
n
(IQ
R)
Intubation Duration
p lt 001
p lt 001
p lt 001
Unadjusted Hospital Length of Stay
Multidisciplinary Teams
Physician Nurse and ge 1 more Health Care
Professional
of Patients with Infection by
RBC Units Transfused2
7
26 3
2
44
90
12
5
21 2
6
26
39
70
12
5
03
00 02 03
17
11
06
00 04 05 1
0
00
0 1 2 3-5 6-9 10+
Overall Infection Pneumonia Sepsis SSI
Total Number of RBC units Transfused
o
f p
ati
en
ts w
ith
In
fecti
on
significantly different (plt005) compared to no RBC exposure
Relationship between Infection
and Ventilation Time1
7
43 46
24
1
13
36 39
20
9
01
02 07
35
04
05
00
23
0-12 12-24 24-48 48+
Ventilation Time vs Infection ()
Overall Infection Pneumonia Sepsis SSI
Length of Mechanical Ventilation (hrs)
P
ati
en
ts w
ith
Infe
cti
on
by T
yp
e
Note 48 of all infections occurred in patients with 48+ hours ventilation
significantly different (plt005) compared to vent time lt12 hrs group
Isolated CABG
Post Op Morbidities
0
2
4
6
8
10
12
14
16
18
ANY MORBIDITY(Total)
ProlongedVentilation
MultipleMorbidities
Reoperation Renal Failure CerebrovascularAccident
Deep SternalWound
Mediastinitis
2013
2014
n= 390
n= 181
2014 Jan 1 ndash Jun 30
2013 and 2014
The Tenets of CUSP
bull Step 1 Safety Attitude Questionnaire (SAQ)
bull Step 2 Educate re Science of Improving
bull Step 3 Identify Defects ( events that should
not recur)
bull Step 4 Executive Partnership to ldquoBridge the
Gaprdquo
bull Step 5 Choose a Defect each Month that
poses a hazard
bull Step 6 ReassessSeptember 12 2016 80
Patients with BD lt -4 and
K lt 33 by Month
21
01
2
0 0
6
01
2
00
5
10
15
20
25
30
35
40
Jul15 Aug15 Sep15 Oct15 Nov15 Dec15 Jan16 Feb16 Mar16 Apr16 May16 Jun16
Quality Improvement
- Insight regarding what metric to target
- A sense of comfort to embark upon
new initiatives
- Involves ability to create consensus
September 12 2016 83
45
67
89
10
11
12
13
14
15
Hg
b(g
md
L)
1 2 3 4 5 6 7 8 9 10 11 12131415161718192021222324 25
Week
All Surgeons Combined
Weekly Transfusions with Corresponding Hgb for
CABG Patients
Period 1 Period 2 Period 3
02
04
06
0
Tra
nsfu
sed
(
)
Period 1 Period 2 Period 3
Percent of Transfusions at Increasing Hgb
Thresholds All Surgeons Combined
above Hgb of 8 gmdL
above Hgb of 9 gmdL
above Hgb of 10 gmdL
Denotes significantly different than period 1
Denotes significantly different than period 2
Conclusion
bull Though recognizing that this is as yet untested the
perspective that comes with cardiothoracic surgical
training and practice best addresses the above
issues which face every cardiothoracic surgical team
and ICU
As a result thoracic surgeons
bull Should be the directors of the CTICU and
bull Should play an integral part in the delivery of day to day ICU
care
September 12 2016 86
9122016 87
Procedure groups for which models exist bull Isolated CABG (CAB)
bull Isolated Aortic Valve Replacement (AVRepl)
bull Aortic Valve Replacement and CABG (AVRepl+CAB)
bull Isolated Mitral Valve Replacement (MVRepl)
bull Mitral Valve Replacement and CABG (MVRepl+CAB)
bull Isolated Mitral Valve Repair (MVRepr)
bull Mitral Valve Repair and CABG (MVRepr+CAB)
Model endpoints bull Operative Mortality
bull Stroke
bull Renal Failure
bull Prolonged Ventilation
bull Deep Sternal Wound Infection
bull Reoperation
bull MortalityMorbidity combined endpoint (any of the 6 previous endpoints)
bull Prolonged length of stay (length of stay gt14 days)
bull Short length of stay (length of stay lt 6 days
(Based on roughly 27 million patients)
Procedures for which the STS
database has a predictive model

0
5
10
15
20
25
30
35
40
To
tal
Ris
k B
ene
fit
Tim
ing
of
Surg
ery
Card
ioge
nic
Sh
ock
Ju
dg
me
nt
Cata
str
op
he
Heart
Fa
ilure
Myo
ca
rdia
l V
iabili
ty
Hig
h R
isk
To
tal
Te
chn
ical
Ju
dg
me
nt
Myca
rdia
l P
rote
ction
Myo
ca
rdia
l p
rote
ctio
n
Recog
nitio
n
Str
oke
To
tal
Respir
ato
ry
Sep
sis
Recog
nitio
n
Cata
str
op
he
Hem
odyn
am
ic M
ana
gem
en
t
Arr
hyth
mia
Man
ag
em
ent
Card
iac A
rrest
Card
ioge
nic
Sh
ock
Ris
k B
ene
fit
To
tal
Recog
nitio
n
Cata
str
op
he
Dysrh
yth
mia
Pha
rmaco
logic
al M
an
ag
em
en
t
Sep
sis
Ju
dg
me
nt
Respir
ato
ry
To
tal
Cata
str
op
he
PreOp IntraOp PostOp ICU PostOP Floor Discharge
Deaths by POCA Category and
Problem
Shannon FL1 Fazzalari FL Theurer PF Bell GF Sutcliffe KM Prager RL
Michigan Society of Thoracic and Cardiovascular Surgeons
Full Time Intensivists How It All
Began
September 12 2016 13
JAMA
19842522023
bull St Barnabas Hospital Bronx NY
bull 1979-1981 10 bed ICU n =1070
ICU Care Daytime Nighttime
Yr 1 Office based MD Agency MD board eligible
Yr 2 Full time MD (IMCards) Subspecialty Fellow
Benefit of On-Site Physician
Mortality Decreased (OR 062 p=001)
September 12 2016 14Li et al JAMA 19842522023
bull 26 Observational Trials staffing
patterns and outcomes
bull Staffing
bull Low Intensity no intensivistelective
consultation
bull High Intensity closed ICUmandatory
consult
September 12 2016 15
Pronovost et al JAMA 20022882151
Staffing Patterns Matter in the ICU
Pronovost et al JAMA 2002
FULL TIME INTENSIVIST ICU
STAFFING
bull Improves Mortality
bull Decreases Length of Stay
bull Improves Cost Efficiency
September 12 2016 17
Fuchs et al
Clinical Anesthesiology 200519125-135
Effect of Multi-D Rounds and ICU Mortality
Kim M et al Arch Int Med
2010170369-376
Pa Hospitals n = 112
Patients = 108000
2004-2006
Low intensity Intensivist
optionalnone
Hi intensity
Intensivist mandatory
Multi-Dbull Pharmacy
bull Resp Therapy
bull Social Work
Date of download 1222014Copyright copy 2014 American Medical
Association All rights reserved
From Pharmacist Participation on Physician Rounds and Adverse Drug Events in the Intensive Care Unit
JAMA 1999282(3)267-270 doi101001jama2823267
Figure Legend
MICU CCU
366 recommendations
with a 95 acceptance rate
20
Pronovost JCC 20031871-75
Daily Goals Impact on ICU Care
September 12 2016 22
N Engl J Med 2009 360(5)491-499
Selected Process Measures before and after Checklist Implementation According to Site
Years 2007- 2008
8 hospitals
8 countries
2 time intervals pre
and post checklist
Appr 3750 pts
group
Selected Process Measures before and after Checklist Implementation According to Site
Haynes AB et al N Engl J Med 2009360491-499
Selected Process Measures before and after Checklist Implementation According to Site
Outcomes before and after Checklist Implementation According to Site
Haynes AB et al N Engl J Med 2009360491-499
Outcomes before and after Checklist Implementation According to Site
September 12 2016 27
0
10
20
30
40
50
60
70
80
90
100
Jul15 Aug15 Sep15 Oct15 Nov15 Dec15 Jan16 Feb16 Mar16 Apr16 May16 Jun16
POD0 Complete
Signed
Goal
POD 0 Checklist Compliance
ICU TEAMWORK MATTERS
September 12 2016 34
Cardiac Surgery Quality Assurance
Performance Improvement Committee (2009 ndash 2012)
bull First and Third Friday of Every Month
bull Representatives From
bull Attendings
bull Fellows
bull APrsquos both CVSICU and CVPCU
bull RespiratoryTherapy
bull Physical Therapy
bull Pharmacy
bull Nursing both CVSICU and CVPCU
bull Administration
bull Quality Improvement
INFLUENCE OF THE COMPREHENSIVE
UNITndashBASED SAFETY PROGRAM IN ICUS
EVIDENCE FROM THE KEYSTONE ICU
PROJECT
September 12 2016 36
Hsu Y Marsteller J
Am J Med Qual 201631349-
357
CUSP Comprehensive Unit Based
Safety Program
bull CUSP Members
bull Team Leader
bull Physician Champion
bull Executive Champion
bull Nurse Manager
bull Infection Prevention Representative
bull Resp Therapy Environmental Invited
Stakeholders
September 12 2016 37
CUSP
bull Monthly Meetings
bull Monthly Safety Rounds
bull Identify system defects
bull Develop safety and monitoring tools
bull Educate the staff
bull Present outcomes
September 12 2016 38
0
10
20
30
40
50
60
70
Teamwork Safety Job Satisfaction Stress Recognition Perceptions of Mgmt Working Conditions Teamwork Safety Job Satisfaction Stress Recognition Perceptions of Mgmt Working Conditions
Non-CUSP ICUs CUSP ICUs
significantly positive difference
Hsu Y Marsteller J
American Journal of Medical Quality 201631349ndash357
Influence of CUSP on ICU Culture
Improvement in
bull Teamwork
bull Safety
bull Satisfaction
bull Environment
Teamwork Climate
The Effect of a Comprehensive Unit
Based Safety Program on CLABSI
September 12 2016 41
Miller K et al 2016 Am J Infection Control
The Impact of ICU Structure and
Processes on Outcomes
bull Full Time Intensivists
bull Multidisciplinary Teams
bull Organization of Rounds
bull Checklists
bull Teamwork
bull Performance Improvement and
Metrics
September 12 2016 42
0
5
10
15
20
25
30
35
40
1-6 6-12 12-24 24-48 gt48
Infe
cti
on
Rate
Post Op Vent Time (hrs)
Non-PNA Infxn
PNA
Post-Op SSI and PNA Rate in Open Heart
Surgery Patients
Johns Hopkins Hospital 112011 ndash 32014
(n = 2253)
Primary Outcome
Postoperative Overall Infection (n=127)
withwithout Vent time adjusted
Odds of
Infection
(95CI)
Without Vent
Timep-value
With Vent
Timep-value
Intraop + Postop
Transfusion
RBC
(unit)11(10-12) 004 10(09-11) 076
FFP 13 (08-22) 026 11(06-18) 081
Platelet 08(05-13) 034 08(05-14) 048
Cryo 12 (06-25) 060 12(04-32) 078
Preop
WBC11(10-11) lt0001 105(10-11) 0001
Preop
COPD33(22-50) lt0001 26(16-43) lt0001
Preop Crgt
15mgdL17(10-27) 004 134(08-22) 026
Adjusted variables were blood products previous cardiac surgery preoperative WBC value heart failure within 2 weeks prior to
surgery preoperative COPD preoperative serum creatinine CPB time and surgery type vs isolated CABG and postoperative
ventilation time Only values lt 005 are shown except for transfusions
1
25 26
147
0
2
4
6
8
10
12
14
16
0-12 12-24 24-48 48+O
dd
s o
f o
ve
rall
In
fec
tio
n
Postoperative Ventilation Time (hours)
ref
p=003p=0004
plt0001
0
5
10
15
20
25
30
35
JHH2008
STS Like2008
STS National2008
Patients Extubated lt6hrs
(CABG Only)
Early Extubation Performance at the
Johns Hopkins Hospital - 2008
0
5
10
15
20
25
30
35
40
45
50
JHH Period 1(132005-9292009)
JHH Period 2(1012009-8312011)
Patients Extubated
lt6hrs (CABG Only)
n= 1174
n= 637
STS National Average 2009 37
STS Like Institutions 2009 32
plt001 compared to JHH Period 1
Pre vs Post Implementation of New MV
Weaning Protocol
A Bow Around Your Finger
0
5
10
15
20
25
30
35
40
45
50
JHH Period 1(132005-9292009)
JHH Period 2(1012009-8312011)
JHH Period 3(912011-6302012)
n=1174
n=637
Ŧ
STS National Average 2011 40
STS Like Institutions 2011 42
Patients Extubated
lt6hrs(CABG Only)
n=236
plt001 compared to JHH Period 1 Ŧ plt001 compared to JHH Period 2 Fitch ZW Debesa O Ohkuma R et al
J Thorac Cardiovasc Surg 2014 Apr 147(4)1344-50
Results Following Additional Protocol
Changes
12
24
38
51
0
10
20
30
40
50
60
JHH Period 1 (132005-9292009)
JHH Period 2 (1012009-8312011)
JHH Period 3 (912011-6302012)
JHH Period 4 (112014-8152014)
STS Like Institutions 2014
plt001 compared to JHH Period 1 Ŧ plt001 compared to JHH Period 2
n=236
n=637
n=1174
n=236
Ŧ
Patients Extubated
lt6hrs(CABG Only)
Extubation lt 6 Hours Current
Performance 2014
September 12 2016 50
CVSICU Reasons For
Extubation gt6h
Hemodynamic Instability4 Hypoxia
3CVA or delirium
5
Bleeding20
Open chest ECMO17
Metabolic Acidosis28
Other23
CVSICU Arrival Temp
1215
5
137
14 13 11 11 10 118
0
20
40
60
80
100
Jul15 Aug15 Sep15 Oct15 Nov15 Dec15 Jan16 Feb16 Mar16 Apr16 May16 Jun16
Temp gt35
Temp lt 350
0
2
4
6
8
10
12
14
16
18
2013 n=390
2014 n=348
2015 n=469
Q1-2016 n=110
Isolated CAB Morbidity
Failed to Prescribe All Eligible
Medications for Isolated CAB
54
If you donrsquot know your performance
you are not doing as well as you think you are
Intervention ndash PCR testing
bull Preoperative PCR testing for MRSA
ndash Nasal swab by PAs on preop visit
bull If positive
ndash Intranasal mupirocin bid
ndash Chlorhexidine baths
bull Both for 5 days (or as many days as possible preop
full course completed in ICU if necessary)
Overall SSI in CABG Patients
05 005
37
265
0
1
2
3
4
5
Pre-Intervention (n=1357) Intervention (n=1990)
Non-MRSA
MRSA42
27
Perc
enta
ge o
f C
AB
G p
atients
Un-adjusted Adjusted
OR 95 CI p-value OR 95 CI p-value
Intervention Era 064 044 093 002 058 040 086 0007
MRSA ICU Admissions
26
14
0
1
2
3
Pre-Intervention (n=2826) Intervention (n=4038)
Perc
enta
ge o
f IC
U A
dm
issio
ns
MRSA-Positive on ICU Admission
Univariate Multivariate
OR 95 CI p-value OR 95 CI p-value
Intervention Era 05 037 074 lt0001 05 037 076 lt0001
MRSA ICU Admissions
10
26
04
0
1
2
3
Pre-Intervention (n=2826) Intervention (n=4038)
Perc
enta
ge o
f IC
U A
dm
issio
ns
No PCR
PCR Screened
14
MRSA-Positive on ICU Admission
Univariate Multivariate
OR 95 CI p-value OR 95 CI p-value
Intervention Era 05 037 074 lt0001 05 037 076 lt0001
MRSA ICU Transmission
Adjusted Poisson Regression MRSA transmissions
aIRR 95 CI P
Intervention era 029 013 065 0002
16
04
00
02
04
06
08
10
12
14
16
18
Pre-Intervention(14733 pt days)
Intervention(21467 pt days)
Incid
ence R
ate
per
1000 p
tdays
Staph Screening Miss CategoriesJuly 2016
September 12 2016 60
1
2
2
3Transfer
True Miss
gt45 Days
Discontinued
Group but not Individual
Accountability
September 12 2016 61
65
74
81
71
87 8892
0
10
20
30
40
50
60
70
80
90
100
2009 2010 2011 2012 2013 2014 2015 (Jan-March)
CVSICU Hand Hygiene Compliance by Year
45
67
89
10
11
12
13
14
15
Hg
b(g
md
L)
1 2 3 4 5 6 7 8 9 10 11 12 1314 15 16 17 18 19 2021 22 23 24 25
Week
All Surgeons Combined
Weekly Transfusions with Corresponding Hgb for All
Procedures
Period 1 Period 2
45
67
89
10
11
12
13
14
15
Hg
b(g
msd
L)
1 2 3 4 5 6 7 8 9 10 11 12131415 16171819 20212223 24 25
Week
For a Single Surgeon
Weekly Transfusions with Corresponding Hgb for All
Procedures
Period 1 Period 2 Period 3
45
67
89
10
11
12
13
14
15
Hg
b(g
md
L)
1 2 3 4 5 6 7 8 9 10 11 12 1314 15 16 17 18 19 2021 22 23 24 25
Week
All Surgeons Combined
Weekly Transfusions with Corresponding Hgb for All
Procedures
Period 1 Period 2 Period 3
02
04
06
0
Tra
nsfu
sed
(
)
Period 1 Period 2 Period 3
Percent of Transfusions at Increasing Hgb
Thresholds All Surgeons Combined
above Hgb of 8 gmdL
above Hgb of 9 gmdL
above Hgb of 10 gmdL
Denotes significantly different than period 1
Denotes significantly different than period 2
Monthly Cardiac Surgery Dashboard
bull Vent Times
bull Reasons for ext gt 6 hrs
bull iNO vs Veletri hrs
bull HyperHypo glycemia
bull Checklist Compliance
bull Staph screening (with reasons
for misses)
bull Blood Utilization
bull CVSICU arrival
bull K+
bull Temp
bull Base Deficit
bull Daily Weights
bull Transfers gt 6 pm
bull Bouncebacks (Total lt 24 hrs)
with Reasons)
September 12 2016 66
And Weekly Mortality and Morbidity
The Johns Hopkins Cardiac Surgery
Code of Conduct and Professional Behavior
September 12 2016 68
Critical Care of the Cardiovascular PatientThe essentials for high quality
1 Full time intensivists
2 Structured Multi-D rounds (Pharmacy)
3 Nurse readbacks
4 Checklists
5 Culture of safetyteamwork (CUSP)
6 Performance improvement requires
bull Multidisciplinary input
bull Agreed upon targets
bull Review of outcomes
bull Continual reassessment
6 Individual accountability matters
Isolated CABG
Post Op Morbidities
0
2
4
6
8
10
12
14
16
18
ANY MORBIDITY(Total)
ProlongedVentilation
MultipleMorbidities
Reoperation Renal Failure CerebrovascularAccident
Deep SternalWound
Mediastinitis
2014 Jan 1 ndash Jun 30
bull Universal public reporting is inevitable
bull ICU care plays a major role in patient
outcomes
September 12 2016 70
Surgeon-Reported Conflicts with Intensivists About
Postoperative Goals of Care
JAMA Surg 201314829-35
bull Vascular Neurologic and
Cardiothoracic Surgeons
bull Mail Questionnaire
bull 56 response rate n = 2100
September 12 2016 71
Rates of Surgeon Reported ConflictsJAMA Surg 201314829-35
September 12 2016 72
0
1
2
3
4
1 2 3 4 5 6 7 8 9 10
Institution
Count of Cardiac Surg
Count of Gen Surg CC
Count of Card Surg CC
Count of Anesth
Count of Anesth CC
Count of Cardiac Anesth
Count of Card Anesth CC
Count of Pulm CC
radic
radic
radic
radic
radic
radic
radic
radic
radic
radic
radic = CT trained
Heterogeneity of Specialties in Cardiac
Intensive Care Units
446537
556
75
889
1943
0 - 6 hrs 6 - 9 hrs 9 - 12 hrs 12 - 18 hrs 18 - 24 hrs gt 24 hrs
ICU
Sta
y(h
rs)
me
an
plusmnS
D
Intubation Duration
p lt 001
p = 070
p = 005
Unadjusted ICU Length of Stay
67 7
8
85
13
0 - 6 hrs 6 - 9 hrs 9 - 12 hrs 12 - 18 hrs 18 - 24 hrs gt 24 hrs
Hospital S
tay
(days)
media
n
(IQ
R)
Intubation Duration
p lt 001
p lt 001
p lt 001
Unadjusted Hospital Length of Stay
Multidisciplinary Teams
Physician Nurse and ge 1 more Health Care
Professional
of Patients with Infection by
RBC Units Transfused2
7
26 3
2
44
90
12
5
21 2
6
26
39
70
12
5
03
00 02 03
17
11
06
00 04 05 1
0
00
0 1 2 3-5 6-9 10+
Overall Infection Pneumonia Sepsis SSI
Total Number of RBC units Transfused
o
f p
ati
en
ts w
ith
In
fecti
on
significantly different (plt005) compared to no RBC exposure
Relationship between Infection
and Ventilation Time1
7
43 46
24
1
13
36 39
20
9
01
02 07
35
04
05
00
23
0-12 12-24 24-48 48+
Ventilation Time vs Infection ()
Overall Infection Pneumonia Sepsis SSI
Length of Mechanical Ventilation (hrs)
P
ati
en
ts w
ith
Infe
cti
on
by T
yp
e
Note 48 of all infections occurred in patients with 48+ hours ventilation
significantly different (plt005) compared to vent time lt12 hrs group
Isolated CABG
Post Op Morbidities
0
2
4
6
8
10
12
14
16
18
ANY MORBIDITY(Total)
ProlongedVentilation
MultipleMorbidities
Reoperation Renal Failure CerebrovascularAccident
Deep SternalWound
Mediastinitis
2013
2014
n= 390
n= 181
2014 Jan 1 ndash Jun 30
2013 and 2014
The Tenets of CUSP
bull Step 1 Safety Attitude Questionnaire (SAQ)
bull Step 2 Educate re Science of Improving
bull Step 3 Identify Defects ( events that should
not recur)
bull Step 4 Executive Partnership to ldquoBridge the
Gaprdquo
bull Step 5 Choose a Defect each Month that
poses a hazard
bull Step 6 ReassessSeptember 12 2016 80
Patients with BD lt -4 and
K lt 33 by Month
21
01
2
0 0
6
01
2
00
5
10
15
20
25
30
35
40
Jul15 Aug15 Sep15 Oct15 Nov15 Dec15 Jan16 Feb16 Mar16 Apr16 May16 Jun16
Quality Improvement
- Insight regarding what metric to target
- A sense of comfort to embark upon
new initiatives
- Involves ability to create consensus
September 12 2016 83
45
67
89
10
11
12
13
14
15
Hg
b(g
md
L)
1 2 3 4 5 6 7 8 9 10 11 12131415161718192021222324 25
Week
All Surgeons Combined
Weekly Transfusions with Corresponding Hgb for
CABG Patients
Period 1 Period 2 Period 3
02
04
06
0
Tra
nsfu
sed
(
)
Period 1 Period 2 Period 3
Percent of Transfusions at Increasing Hgb
Thresholds All Surgeons Combined
above Hgb of 8 gmdL
above Hgb of 9 gmdL
above Hgb of 10 gmdL
Denotes significantly different than period 1
Denotes significantly different than period 2
Conclusion
bull Though recognizing that this is as yet untested the
perspective that comes with cardiothoracic surgical
training and practice best addresses the above
issues which face every cardiothoracic surgical team
and ICU
As a result thoracic surgeons
bull Should be the directors of the CTICU and
bull Should play an integral part in the delivery of day to day ICU
care
September 12 2016 86
9122016 87
Procedure groups for which models exist bull Isolated CABG (CAB)
bull Isolated Aortic Valve Replacement (AVRepl)
bull Aortic Valve Replacement and CABG (AVRepl+CAB)
bull Isolated Mitral Valve Replacement (MVRepl)
bull Mitral Valve Replacement and CABG (MVRepl+CAB)
bull Isolated Mitral Valve Repair (MVRepr)
bull Mitral Valve Repair and CABG (MVRepr+CAB)
Model endpoints bull Operative Mortality
bull Stroke
bull Renal Failure
bull Prolonged Ventilation
bull Deep Sternal Wound Infection
bull Reoperation
bull MortalityMorbidity combined endpoint (any of the 6 previous endpoints)
bull Prolonged length of stay (length of stay gt14 days)
bull Short length of stay (length of stay lt 6 days
(Based on roughly 27 million patients)
Procedures for which the STS
database has a predictive model
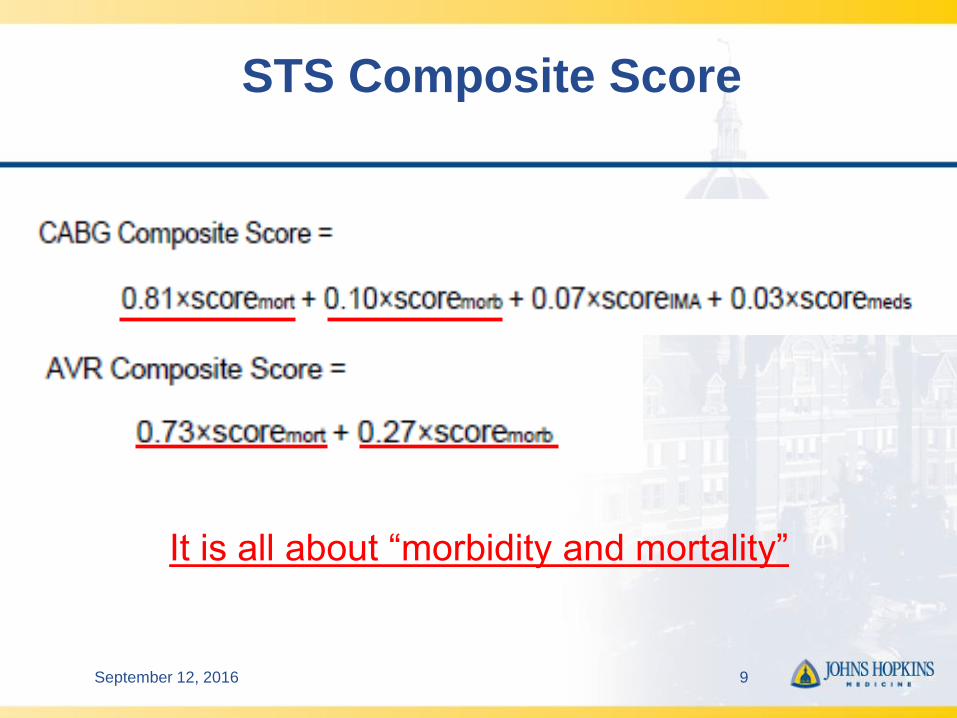

20
Pronovost JCC 20031871-75
Daily Goals Impact on ICU Care
September 12 2016 22
N Engl J Med 2009 360(5)491-499
Selected Process Measures before and after Checklist Implementation According to Site
Years 2007- 2008
8 hospitals
8 countries
2 time intervals pre
and post checklist
Appr 3750 pts
group
Selected Process Measures before and after Checklist Implementation According to Site
Haynes AB et al N Engl J Med 2009360491-499
Selected Process Measures before and after Checklist Implementation According to Site
Outcomes before and after Checklist Implementation According to Site
Haynes AB et al N Engl J Med 2009360491-499
Outcomes before and after Checklist Implementation According to Site
September 12 2016 27
0
10
20
30
40
50
60
70
80
90
100
Jul15 Aug15 Sep15 Oct15 Nov15 Dec15 Jan16 Feb16 Mar16 Apr16 May16 Jun16
POD0 Complete
Signed
Goal
POD 0 Checklist Compliance
ICU TEAMWORK MATTERS
September 12 2016 34
Cardiac Surgery Quality Assurance
Performance Improvement Committee (2009 ndash 2012)
bull First and Third Friday of Every Month
bull Representatives From
bull Attendings
bull Fellows
bull APrsquos both CVSICU and CVPCU
bull RespiratoryTherapy
bull Physical Therapy
bull Pharmacy
bull Nursing both CVSICU and CVPCU
bull Administration
bull Quality Improvement
INFLUENCE OF THE COMPREHENSIVE
UNITndashBASED SAFETY PROGRAM IN ICUS
EVIDENCE FROM THE KEYSTONE ICU
PROJECT
September 12 2016 36
Hsu Y Marsteller J
Am J Med Qual 201631349-
357
CUSP Comprehensive Unit Based
Safety Program
bull CUSP Members
bull Team Leader
bull Physician Champion
bull Executive Champion
bull Nurse Manager
bull Infection Prevention Representative
bull Resp Therapy Environmental Invited
Stakeholders
September 12 2016 37
CUSP
bull Monthly Meetings
bull Monthly Safety Rounds
bull Identify system defects
bull Develop safety and monitoring tools
bull Educate the staff
bull Present outcomes
September 12 2016 38
0
10
20
30
40
50
60
70
Teamwork Safety Job Satisfaction Stress Recognition Perceptions of Mgmt Working Conditions Teamwork Safety Job Satisfaction Stress Recognition Perceptions of Mgmt Working Conditions
Non-CUSP ICUs CUSP ICUs
significantly positive difference
Hsu Y Marsteller J
American Journal of Medical Quality 201631349ndash357
Influence of CUSP on ICU Culture
Improvement in
bull Teamwork
bull Safety
bull Satisfaction
bull Environment
Teamwork Climate
The Effect of a Comprehensive Unit
Based Safety Program on CLABSI
September 12 2016 41
Miller K et al 2016 Am J Infection Control
The Impact of ICU Structure and
Processes on Outcomes
bull Full Time Intensivists
bull Multidisciplinary Teams
bull Organization of Rounds
bull Checklists
bull Teamwork
bull Performance Improvement and
Metrics
September 12 2016 42
0
5
10
15
20
25
30
35
40
1-6 6-12 12-24 24-48 gt48
Infe
cti
on
Rate
Post Op Vent Time (hrs)
Non-PNA Infxn
PNA
Post-Op SSI and PNA Rate in Open Heart
Surgery Patients
Johns Hopkins Hospital 112011 ndash 32014
(n = 2253)
Primary Outcome
Postoperative Overall Infection (n=127)
withwithout Vent time adjusted
Odds of
Infection
(95CI)
Without Vent
Timep-value
With Vent
Timep-value
Intraop + Postop
Transfusion
RBC
(unit)11(10-12) 004 10(09-11) 076
FFP 13 (08-22) 026 11(06-18) 081
Platelet 08(05-13) 034 08(05-14) 048
Cryo 12 (06-25) 060 12(04-32) 078
Preop
WBC11(10-11) lt0001 105(10-11) 0001
Preop
COPD33(22-50) lt0001 26(16-43) lt0001
Preop Crgt
15mgdL17(10-27) 004 134(08-22) 026
Adjusted variables were blood products previous cardiac surgery preoperative WBC value heart failure within 2 weeks prior to
surgery preoperative COPD preoperative serum creatinine CPB time and surgery type vs isolated CABG and postoperative
ventilation time Only values lt 005 are shown except for transfusions
1
25 26
147
0
2
4
6
8
10
12
14
16
0-12 12-24 24-48 48+O
dd
s o
f o
ve
rall
In
fec
tio
n
Postoperative Ventilation Time (hours)
ref
p=003p=0004
plt0001
0
5
10
15
20
25
30
35
JHH2008
STS Like2008
STS National2008
Patients Extubated lt6hrs
(CABG Only)
Early Extubation Performance at the
Johns Hopkins Hospital - 2008
0
5
10
15
20
25
30
35
40
45
50
JHH Period 1(132005-9292009)
JHH Period 2(1012009-8312011)
Patients Extubated
lt6hrs (CABG Only)
n= 1174
n= 637
STS National Average 2009 37
STS Like Institutions 2009 32
plt001 compared to JHH Period 1
Pre vs Post Implementation of New MV
Weaning Protocol
A Bow Around Your Finger
0
5
10
15
20
25
30
35
40
45
50
JHH Period 1(132005-9292009)
JHH Period 2(1012009-8312011)
JHH Period 3(912011-6302012)
n=1174
n=637
Ŧ
STS National Average 2011 40
STS Like Institutions 2011 42
Patients Extubated
lt6hrs(CABG Only)
n=236
plt001 compared to JHH Period 1 Ŧ plt001 compared to JHH Period 2 Fitch ZW Debesa O Ohkuma R et al
J Thorac Cardiovasc Surg 2014 Apr 147(4)1344-50
Results Following Additional Protocol
Changes
12
24
38
51
0
10
20
30
40
50
60
JHH Period 1 (132005-9292009)
JHH Period 2 (1012009-8312011)
JHH Period 3 (912011-6302012)
JHH Period 4 (112014-8152014)
STS Like Institutions 2014
plt001 compared to JHH Period 1 Ŧ plt001 compared to JHH Period 2
n=236
n=637
n=1174
n=236
Ŧ
Patients Extubated
lt6hrs(CABG Only)
Extubation lt 6 Hours Current
Performance 2014
September 12 2016 50
CVSICU Reasons For
Extubation gt6h
Hemodynamic Instability4 Hypoxia
3CVA or delirium
5
Bleeding20
Open chest ECMO17
Metabolic Acidosis28
Other23
CVSICU Arrival Temp
1215
5
137
14 13 11 11 10 118
0
20
40
60
80
100
Jul15 Aug15 Sep15 Oct15 Nov15 Dec15 Jan16 Feb16 Mar16 Apr16 May16 Jun16
Temp gt35
Temp lt 350
0
2
4
6
8
10
12
14
16
18
2013 n=390
2014 n=348
2015 n=469
Q1-2016 n=110
Isolated CAB Morbidity
Failed to Prescribe All Eligible
Medications for Isolated CAB
54
If you donrsquot know your performance
you are not doing as well as you think you are
Intervention ndash PCR testing
bull Preoperative PCR testing for MRSA
ndash Nasal swab by PAs on preop visit
bull If positive
ndash Intranasal mupirocin bid
ndash Chlorhexidine baths
bull Both for 5 days (or as many days as possible preop
full course completed in ICU if necessary)
Overall SSI in CABG Patients
05 005
37
265
0
1
2
3
4
5
Pre-Intervention (n=1357) Intervention (n=1990)
Non-MRSA
MRSA42
27
Perc
enta
ge o
f C
AB
G p
atients
Un-adjusted Adjusted
OR 95 CI p-value OR 95 CI p-value
Intervention Era 064 044 093 002 058 040 086 0007
MRSA ICU Admissions
26
14
0
1
2
3
Pre-Intervention (n=2826) Intervention (n=4038)
Perc
enta
ge o
f IC
U A
dm
issio
ns
MRSA-Positive on ICU Admission
Univariate Multivariate
OR 95 CI p-value OR 95 CI p-value
Intervention Era 05 037 074 lt0001 05 037 076 lt0001
MRSA ICU Admissions
10
26
04
0
1
2
3
Pre-Intervention (n=2826) Intervention (n=4038)
Perc
enta
ge o
f IC
U A
dm
issio
ns
No PCR
PCR Screened
14
MRSA-Positive on ICU Admission
Univariate Multivariate
OR 95 CI p-value OR 95 CI p-value
Intervention Era 05 037 074 lt0001 05 037 076 lt0001
MRSA ICU Transmission
Adjusted Poisson Regression MRSA transmissions
aIRR 95 CI P
Intervention era 029 013 065 0002
16
04
00
02
04
06
08
10
12
14
16
18
Pre-Intervention(14733 pt days)
Intervention(21467 pt days)
Incid
ence R
ate
per
1000 p
tdays
Staph Screening Miss CategoriesJuly 2016
September 12 2016 60
1
2
2
3Transfer
True Miss
gt45 Days
Discontinued
Group but not Individual
Accountability
September 12 2016 61
65
74
81
71
87 8892
0
10
20
30
40
50
60
70
80
90
100
2009 2010 2011 2012 2013 2014 2015 (Jan-March)
CVSICU Hand Hygiene Compliance by Year
45
67
89
10
11
12
13
14
15
Hg
b(g
md
L)
1 2 3 4 5 6 7 8 9 10 11 12 1314 15 16 17 18 19 2021 22 23 24 25
Week
All Surgeons Combined
Weekly Transfusions with Corresponding Hgb for All
Procedures
Period 1 Period 2
45
67
89
10
11
12
13
14
15
Hg
b(g
msd
L)
1 2 3 4 5 6 7 8 9 10 11 12131415 16171819 20212223 24 25
Week
For a Single Surgeon
Weekly Transfusions with Corresponding Hgb for All
Procedures
Period 1 Period 2 Period 3
45
67
89
10
11
12
13
14
15
Hg
b(g
md
L)
1 2 3 4 5 6 7 8 9 10 11 12 1314 15 16 17 18 19 2021 22 23 24 25
Week
All Surgeons Combined
Weekly Transfusions with Corresponding Hgb for All
Procedures
Period 1 Period 2 Period 3
02
04
06
0
Tra
nsfu
sed
(
)
Period 1 Period 2 Period 3
Percent of Transfusions at Increasing Hgb
Thresholds All Surgeons Combined
above Hgb of 8 gmdL
above Hgb of 9 gmdL
above Hgb of 10 gmdL
Denotes significantly different than period 1
Denotes significantly different than period 2
Monthly Cardiac Surgery Dashboard
bull Vent Times
bull Reasons for ext gt 6 hrs
bull iNO vs Veletri hrs
bull HyperHypo glycemia
bull Checklist Compliance
bull Staph screening (with reasons
for misses)
bull Blood Utilization
bull CVSICU arrival
bull K+
bull Temp
bull Base Deficit
bull Daily Weights
bull Transfers gt 6 pm
bull Bouncebacks (Total lt 24 hrs)
with Reasons)
September 12 2016 66
And Weekly Mortality and Morbidity
The Johns Hopkins Cardiac Surgery
Code of Conduct and Professional Behavior
September 12 2016 68
Critical Care of the Cardiovascular PatientThe essentials for high quality
1 Full time intensivists
2 Structured Multi-D rounds (Pharmacy)
3 Nurse readbacks
4 Checklists
5 Culture of safetyteamwork (CUSP)
6 Performance improvement requires
bull Multidisciplinary input
bull Agreed upon targets
bull Review of outcomes
bull Continual reassessment
6 Individual accountability matters
Isolated CABG
Post Op Morbidities
0
2
4
6
8
10
12
14
16
18
ANY MORBIDITY(Total)
ProlongedVentilation
MultipleMorbidities
Reoperation Renal Failure CerebrovascularAccident
Deep SternalWound
Mediastinitis
2014 Jan 1 ndash Jun 30
bull Universal public reporting is inevitable
bull ICU care plays a major role in patient
outcomes
September 12 2016 70
Surgeon-Reported Conflicts with Intensivists About
Postoperative Goals of Care
JAMA Surg 201314829-35
bull Vascular Neurologic and
Cardiothoracic Surgeons
bull Mail Questionnaire
bull 56 response rate n = 2100
September 12 2016 71
Rates of Surgeon Reported ConflictsJAMA Surg 201314829-35
September 12 2016 72
0
1
2
3
4
1 2 3 4 5 6 7 8 9 10
Institution
Count of Cardiac Surg
Count of Gen Surg CC
Count of Card Surg CC
Count of Anesth
Count of Anesth CC
Count of Cardiac Anesth
Count of Card Anesth CC
Count of Pulm CC
radic
radic
radic
radic
radic
radic
radic
radic
radic
radic
radic = CT trained
Heterogeneity of Specialties in Cardiac
Intensive Care Units
446537
556
75
889
1943
0 - 6 hrs 6 - 9 hrs 9 - 12 hrs 12 - 18 hrs 18 - 24 hrs gt 24 hrs
ICU
Sta
y(h
rs)
me
an
plusmnS
D
Intubation Duration
p lt 001
p = 070
p = 005
Unadjusted ICU Length of Stay
67 7
8
85
13
0 - 6 hrs 6 - 9 hrs 9 - 12 hrs 12 - 18 hrs 18 - 24 hrs gt 24 hrs
Hospital S
tay
(days)
media
n
(IQ
R)
Intubation Duration
p lt 001
p lt 001
p lt 001
Unadjusted Hospital Length of Stay
Multidisciplinary Teams
Physician Nurse and ge 1 more Health Care
Professional
of Patients with Infection by
RBC Units Transfused2
7
26 3
2
44
90
12
5
21 2
6
26
39
70
12
5
03
00 02 03
17
11
06
00 04 05 1
0
00
0 1 2 3-5 6-9 10+
Overall Infection Pneumonia Sepsis SSI
Total Number of RBC units Transfused
o
f p
ati
en
ts w
ith
In
fecti
on
significantly different (plt005) compared to no RBC exposure
Relationship between Infection
and Ventilation Time1
7
43 46
24
1
13
36 39
20
9
01
02 07
35
04
05
00
23
0-12 12-24 24-48 48+
Ventilation Time vs Infection ()
Overall Infection Pneumonia Sepsis SSI
Length of Mechanical Ventilation (hrs)
P
ati
en
ts w
ith
Infe
cti
on
by T
yp
e
Note 48 of all infections occurred in patients with 48+ hours ventilation
significantly different (plt005) compared to vent time lt12 hrs group
Isolated CABG
Post Op Morbidities
0
2
4
6
8
10
12
14
16
18
ANY MORBIDITY(Total)
ProlongedVentilation
MultipleMorbidities
Reoperation Renal Failure CerebrovascularAccident
Deep SternalWound
Mediastinitis
2013
2014
n= 390
n= 181
2014 Jan 1 ndash Jun 30
2013 and 2014
The Tenets of CUSP
bull Step 1 Safety Attitude Questionnaire (SAQ)
bull Step 2 Educate re Science of Improving
bull Step 3 Identify Defects ( events that should
not recur)
bull Step 4 Executive Partnership to ldquoBridge the
Gaprdquo
bull Step 5 Choose a Defect each Month that
poses a hazard
bull Step 6 ReassessSeptember 12 2016 80
Patients with BD lt -4 and
K lt 33 by Month
21
01
2
0 0
6
01
2
00
5
10
15
20
25
30
35
40
Jul15 Aug15 Sep15 Oct15 Nov15 Dec15 Jan16 Feb16 Mar16 Apr16 May16 Jun16
Quality Improvement
- Insight regarding what metric to target
- A sense of comfort to embark upon
new initiatives
- Involves ability to create consensus
September 12 2016 83
45
67
89
10
11
12
13
14
15
Hg
b(g
md
L)
1 2 3 4 5 6 7 8 9 10 11 12131415161718192021222324 25
Week
All Surgeons Combined
Weekly Transfusions with Corresponding Hgb for
CABG Patients
Period 1 Period 2 Period 3
02
04
06
0
Tra
nsfu
sed
(
)
Period 1 Period 2 Period 3
Percent of Transfusions at Increasing Hgb
Thresholds All Surgeons Combined
above Hgb of 8 gmdL
above Hgb of 9 gmdL
above Hgb of 10 gmdL
Denotes significantly different than period 1
Denotes significantly different than period 2
Conclusion
bull Though recognizing that this is as yet untested the
perspective that comes with cardiothoracic surgical
training and practice best addresses the above
issues which face every cardiothoracic surgical team
and ICU
As a result thoracic surgeons
bull Should be the directors of the CTICU and
bull Should play an integral part in the delivery of day to day ICU
care
September 12 2016 86
9122016 87
Procedure groups for which models exist bull Isolated CABG (CAB)
bull Isolated Aortic Valve Replacement (AVRepl)
bull Aortic Valve Replacement and CABG (AVRepl+CAB)
bull Isolated Mitral Valve Replacement (MVRepl)
bull Mitral Valve Replacement and CABG (MVRepl+CAB)
bull Isolated Mitral Valve Repair (MVRepr)
bull Mitral Valve Repair and CABG (MVRepr+CAB)
Model endpoints bull Operative Mortality
bull Stroke
bull Renal Failure
bull Prolonged Ventilation
bull Deep Sternal Wound Infection
bull Reoperation
bull MortalityMorbidity combined endpoint (any of the 6 previous endpoints)
bull Prolonged length of stay (length of stay gt14 days)
bull Short length of stay (length of stay lt 6 days
(Based on roughly 27 million patients)
Procedures for which the STS
database has a predictive model

Selected Process Measures before and after Checklist Implementation According to Site
Haynes AB et al N Engl J Med 2009360491-499
Selected Process Measures before and after Checklist Implementation According to Site
Outcomes before and after Checklist Implementation According to Site
Haynes AB et al N Engl J Med 2009360491-499
Outcomes before and after Checklist Implementation According to Site
September 12 2016 27
0
10
20
30
40
50
60
70
80
90
100
Jul15 Aug15 Sep15 Oct15 Nov15 Dec15 Jan16 Feb16 Mar16 Apr16 May16 Jun16
POD0 Complete
Signed
Goal
POD 0 Checklist Compliance
ICU TEAMWORK MATTERS
September 12 2016 34
Cardiac Surgery Quality Assurance
Performance Improvement Committee (2009 ndash 2012)
bull First and Third Friday of Every Month
bull Representatives From
bull Attendings
bull Fellows
bull APrsquos both CVSICU and CVPCU
bull RespiratoryTherapy
bull Physical Therapy
bull Pharmacy
bull Nursing both CVSICU and CVPCU
bull Administration
bull Quality Improvement
INFLUENCE OF THE COMPREHENSIVE
UNITndashBASED SAFETY PROGRAM IN ICUS
EVIDENCE FROM THE KEYSTONE ICU
PROJECT
September 12 2016 36
Hsu Y Marsteller J
Am J Med Qual 201631349-
357
CUSP Comprehensive Unit Based
Safety Program
bull CUSP Members
bull Team Leader
bull Physician Champion
bull Executive Champion
bull Nurse Manager
bull Infection Prevention Representative
bull Resp Therapy Environmental Invited
Stakeholders
September 12 2016 37
CUSP
bull Monthly Meetings
bull Monthly Safety Rounds
bull Identify system defects
bull Develop safety and monitoring tools
bull Educate the staff
bull Present outcomes
September 12 2016 38
0
10
20
30
40
50
60
70
Teamwork Safety Job Satisfaction Stress Recognition Perceptions of Mgmt Working Conditions Teamwork Safety Job Satisfaction Stress Recognition Perceptions of Mgmt Working Conditions
Non-CUSP ICUs CUSP ICUs
significantly positive difference
Hsu Y Marsteller J
American Journal of Medical Quality 201631349ndash357
Influence of CUSP on ICU Culture
Improvement in
bull Teamwork
bull Safety
bull Satisfaction
bull Environment
Teamwork Climate
The Effect of a Comprehensive Unit
Based Safety Program on CLABSI
September 12 2016 41
Miller K et al 2016 Am J Infection Control
The Impact of ICU Structure and
Processes on Outcomes
bull Full Time Intensivists
bull Multidisciplinary Teams
bull Organization of Rounds
bull Checklists
bull Teamwork
bull Performance Improvement and
Metrics
September 12 2016 42
0
5
10
15
20
25
30
35
40
1-6 6-12 12-24 24-48 gt48
Infe
cti
on
Rate
Post Op Vent Time (hrs)
Non-PNA Infxn
PNA
Post-Op SSI and PNA Rate in Open Heart
Surgery Patients
Johns Hopkins Hospital 112011 ndash 32014
(n = 2253)
Primary Outcome
Postoperative Overall Infection (n=127)
withwithout Vent time adjusted
Odds of
Infection
(95CI)
Without Vent
Timep-value
With Vent
Timep-value
Intraop + Postop
Transfusion
RBC
(unit)11(10-12) 004 10(09-11) 076
FFP 13 (08-22) 026 11(06-18) 081
Platelet 08(05-13) 034 08(05-14) 048
Cryo 12 (06-25) 060 12(04-32) 078
Preop
WBC11(10-11) lt0001 105(10-11) 0001
Preop
COPD33(22-50) lt0001 26(16-43) lt0001
Preop Crgt
15mgdL17(10-27) 004 134(08-22) 026
Adjusted variables were blood products previous cardiac surgery preoperative WBC value heart failure within 2 weeks prior to
surgery preoperative COPD preoperative serum creatinine CPB time and surgery type vs isolated CABG and postoperative
ventilation time Only values lt 005 are shown except for transfusions
1
25 26
147
0
2
4
6
8
10
12
14
16
0-12 12-24 24-48 48+O
dd
s o
f o
ve
rall
In
fec
tio
n
Postoperative Ventilation Time (hours)
ref
p=003p=0004
plt0001
0
5
10
15
20
25
30
35
JHH2008
STS Like2008
STS National2008
Patients Extubated lt6hrs
(CABG Only)
Early Extubation Performance at the
Johns Hopkins Hospital - 2008
0
5
10
15
20
25
30
35
40
45
50
JHH Period 1(132005-9292009)
JHH Period 2(1012009-8312011)
Patients Extubated
lt6hrs (CABG Only)
n= 1174
n= 637
STS National Average 2009 37
STS Like Institutions 2009 32
plt001 compared to JHH Period 1
Pre vs Post Implementation of New MV
Weaning Protocol
A Bow Around Your Finger
0
5
10
15
20
25
30
35
40
45
50
JHH Period 1(132005-9292009)
JHH Period 2(1012009-8312011)
JHH Period 3(912011-6302012)
n=1174
n=637
Ŧ
STS National Average 2011 40
STS Like Institutions 2011 42
Patients Extubated
lt6hrs(CABG Only)
n=236
plt001 compared to JHH Period 1 Ŧ plt001 compared to JHH Period 2 Fitch ZW Debesa O Ohkuma R et al
J Thorac Cardiovasc Surg 2014 Apr 147(4)1344-50
Results Following Additional Protocol
Changes
12
24
38
51
0
10
20
30
40
50
60
JHH Period 1 (132005-9292009)
JHH Period 2 (1012009-8312011)
JHH Period 3 (912011-6302012)
JHH Period 4 (112014-8152014)
STS Like Institutions 2014
plt001 compared to JHH Period 1 Ŧ plt001 compared to JHH Period 2
n=236
n=637
n=1174
n=236
Ŧ
Patients Extubated
lt6hrs(CABG Only)
Extubation lt 6 Hours Current
Performance 2014
September 12 2016 50
CVSICU Reasons For
Extubation gt6h
Hemodynamic Instability4 Hypoxia
3CVA or delirium
5
Bleeding20
Open chest ECMO17
Metabolic Acidosis28
Other23
CVSICU Arrival Temp
1215
5
137
14 13 11 11 10 118
0
20
40
60
80
100
Jul15 Aug15 Sep15 Oct15 Nov15 Dec15 Jan16 Feb16 Mar16 Apr16 May16 Jun16
Temp gt35
Temp lt 350
0
2
4
6
8
10
12
14
16
18
2013 n=390
2014 n=348
2015 n=469
Q1-2016 n=110
Isolated CAB Morbidity
Failed to Prescribe All Eligible
Medications for Isolated CAB
54
If you donrsquot know your performance
you are not doing as well as you think you are
Intervention ndash PCR testing
bull Preoperative PCR testing for MRSA
ndash Nasal swab by PAs on preop visit
bull If positive
ndash Intranasal mupirocin bid
ndash Chlorhexidine baths
bull Both for 5 days (or as many days as possible preop
full course completed in ICU if necessary)
Overall SSI in CABG Patients
05 005
37
265
0
1
2
3
4
5
Pre-Intervention (n=1357) Intervention (n=1990)
Non-MRSA
MRSA42
27
Perc
enta
ge o
f C
AB
G p
atients
Un-adjusted Adjusted
OR 95 CI p-value OR 95 CI p-value
Intervention Era 064 044 093 002 058 040 086 0007
MRSA ICU Admissions
26
14
0
1
2
3
Pre-Intervention (n=2826) Intervention (n=4038)
Perc
enta
ge o
f IC
U A
dm
issio
ns
MRSA-Positive on ICU Admission
Univariate Multivariate
OR 95 CI p-value OR 95 CI p-value
Intervention Era 05 037 074 lt0001 05 037 076 lt0001
MRSA ICU Admissions
10
26
04
0
1
2
3
Pre-Intervention (n=2826) Intervention (n=4038)
Perc
enta
ge o
f IC
U A
dm
issio
ns
No PCR
PCR Screened
14
MRSA-Positive on ICU Admission
Univariate Multivariate
OR 95 CI p-value OR 95 CI p-value
Intervention Era 05 037 074 lt0001 05 037 076 lt0001
MRSA ICU Transmission
Adjusted Poisson Regression MRSA transmissions
aIRR 95 CI P
Intervention era 029 013 065 0002
16
04
00
02
04
06
08
10
12
14
16
18
Pre-Intervention(14733 pt days)
Intervention(21467 pt days)
Incid
ence R
ate
per
1000 p
tdays
Staph Screening Miss CategoriesJuly 2016
September 12 2016 60
1
2
2
3Transfer
True Miss
gt45 Days
Discontinued
Group but not Individual
Accountability
September 12 2016 61
65
74
81
71
87 8892
0
10
20
30
40
50
60
70
80
90
100
2009 2010 2011 2012 2013 2014 2015 (Jan-March)
CVSICU Hand Hygiene Compliance by Year
45
67
89
10
11
12
13
14
15
Hg
b(g
md
L)
1 2 3 4 5 6 7 8 9 10 11 12 1314 15 16 17 18 19 2021 22 23 24 25
Week
All Surgeons Combined
Weekly Transfusions with Corresponding Hgb for All
Procedures
Period 1 Period 2
45
67
89
10
11
12
13
14
15
Hg
b(g
msd
L)
1 2 3 4 5 6 7 8 9 10 11 12131415 16171819 20212223 24 25
Week
For a Single Surgeon
Weekly Transfusions with Corresponding Hgb for All
Procedures
Period 1 Period 2 Period 3
45
67
89
10
11
12
13
14
15
Hg
b(g
md
L)
1 2 3 4 5 6 7 8 9 10 11 12 1314 15 16 17 18 19 2021 22 23 24 25
Week
All Surgeons Combined
Weekly Transfusions with Corresponding Hgb for All
Procedures
Period 1 Period 2 Period 3
02
04
06
0
Tra
nsfu
sed
(
)
Period 1 Period 2 Period 3
Percent of Transfusions at Increasing Hgb
Thresholds All Surgeons Combined
above Hgb of 8 gmdL
above Hgb of 9 gmdL
above Hgb of 10 gmdL
Denotes significantly different than period 1
Denotes significantly different than period 2
Monthly Cardiac Surgery Dashboard
bull Vent Times
bull Reasons for ext gt 6 hrs
bull iNO vs Veletri hrs
bull HyperHypo glycemia
bull Checklist Compliance
bull Staph screening (with reasons
for misses)
bull Blood Utilization
bull CVSICU arrival
bull K+
bull Temp
bull Base Deficit
bull Daily Weights
bull Transfers gt 6 pm
bull Bouncebacks (Total lt 24 hrs)
with Reasons)
September 12 2016 66
And Weekly Mortality and Morbidity
The Johns Hopkins Cardiac Surgery
Code of Conduct and Professional Behavior
September 12 2016 68
Critical Care of the Cardiovascular PatientThe essentials for high quality
1 Full time intensivists
2 Structured Multi-D rounds (Pharmacy)
3 Nurse readbacks
4 Checklists
5 Culture of safetyteamwork (CUSP)
6 Performance improvement requires
bull Multidisciplinary input
bull Agreed upon targets
bull Review of outcomes
bull Continual reassessment
6 Individual accountability matters
Isolated CABG
Post Op Morbidities
0
2
4
6
8
10
12
14
16
18
ANY MORBIDITY(Total)
ProlongedVentilation
MultipleMorbidities
Reoperation Renal Failure CerebrovascularAccident
Deep SternalWound
Mediastinitis
2014 Jan 1 ndash Jun 30
bull Universal public reporting is inevitable
bull ICU care plays a major role in patient
outcomes
September 12 2016 70
Surgeon-Reported Conflicts with Intensivists About
Postoperative Goals of Care
JAMA Surg 201314829-35
bull Vascular Neurologic and
Cardiothoracic Surgeons
bull Mail Questionnaire
bull 56 response rate n = 2100
September 12 2016 71
Rates of Surgeon Reported ConflictsJAMA Surg 201314829-35
September 12 2016 72
0
1
2
3
4
1 2 3 4 5 6 7 8 9 10
Institution
Count of Cardiac Surg
Count of Gen Surg CC
Count of Card Surg CC
Count of Anesth
Count of Anesth CC
Count of Cardiac Anesth
Count of Card Anesth CC
Count of Pulm CC
radic
radic
radic
radic
radic
radic
radic
radic
radic
radic
radic = CT trained
Heterogeneity of Specialties in Cardiac
Intensive Care Units
446537
556
75
889
1943
0 - 6 hrs 6 - 9 hrs 9 - 12 hrs 12 - 18 hrs 18 - 24 hrs gt 24 hrs
ICU
Sta
y(h
rs)
me
an
plusmnS
D
Intubation Duration
p lt 001
p = 070
p = 005
Unadjusted ICU Length of Stay
67 7
8
85
13
0 - 6 hrs 6 - 9 hrs 9 - 12 hrs 12 - 18 hrs 18 - 24 hrs gt 24 hrs
Hospital S
tay
(days)
media
n
(IQ
R)
Intubation Duration
p lt 001
p lt 001
p lt 001
Unadjusted Hospital Length of Stay
Multidisciplinary Teams
Physician Nurse and ge 1 more Health Care
Professional
of Patients with Infection by
RBC Units Transfused2
7
26 3
2
44
90
12
5
21 2
6
26
39
70
12
5
03
00 02 03
17
11
06
00 04 05 1
0
00
0 1 2 3-5 6-9 10+
Overall Infection Pneumonia Sepsis SSI
Total Number of RBC units Transfused
o
f p
ati
en
ts w
ith
In
fecti
on
significantly different (plt005) compared to no RBC exposure
Relationship between Infection
and Ventilation Time1
7
43 46
24
1
13
36 39
20
9
01
02 07
35
04
05
00
23
0-12 12-24 24-48 48+
Ventilation Time vs Infection ()
Overall Infection Pneumonia Sepsis SSI
Length of Mechanical Ventilation (hrs)
P
ati
en
ts w
ith
Infe
cti
on
by T
yp
e
Note 48 of all infections occurred in patients with 48+ hours ventilation
significantly different (plt005) compared to vent time lt12 hrs group
Isolated CABG
Post Op Morbidities
0
2
4
6
8
10
12
14
16
18
ANY MORBIDITY(Total)
ProlongedVentilation
MultipleMorbidities
Reoperation Renal Failure CerebrovascularAccident
Deep SternalWound
Mediastinitis
2013
2014
n= 390
n= 181
2014 Jan 1 ndash Jun 30
2013 and 2014
The Tenets of CUSP
bull Step 1 Safety Attitude Questionnaire (SAQ)
bull Step 2 Educate re Science of Improving
bull Step 3 Identify Defects ( events that should
not recur)
bull Step 4 Executive Partnership to ldquoBridge the
Gaprdquo
bull Step 5 Choose a Defect each Month that
poses a hazard
bull Step 6 ReassessSeptember 12 2016 80
Patients with BD lt -4 and
K lt 33 by Month
21
01
2
0 0
6
01
2
00
5
10
15
20
25
30
35
40
Jul15 Aug15 Sep15 Oct15 Nov15 Dec15 Jan16 Feb16 Mar16 Apr16 May16 Jun16
Quality Improvement
- Insight regarding what metric to target
- A sense of comfort to embark upon
new initiatives
- Involves ability to create consensus
September 12 2016 83
45
67
89
10
11
12
13
14
15
Hg
b(g
md
L)
1 2 3 4 5 6 7 8 9 10 11 12131415161718192021222324 25
Week
All Surgeons Combined
Weekly Transfusions with Corresponding Hgb for
CABG Patients
Period 1 Period 2 Period 3
02
04
06
0
Tra
nsfu
sed
(
)
Period 1 Period 2 Period 3
Percent of Transfusions at Increasing Hgb
Thresholds All Surgeons Combined
above Hgb of 8 gmdL
above Hgb of 9 gmdL
above Hgb of 10 gmdL
Denotes significantly different than period 1
Denotes significantly different than period 2
Conclusion
bull Though recognizing that this is as yet untested the
perspective that comes with cardiothoracic surgical
training and practice best addresses the above
issues which face every cardiothoracic surgical team
and ICU
As a result thoracic surgeons
bull Should be the directors of the CTICU and
bull Should play an integral part in the delivery of day to day ICU
care
September 12 2016 86
9122016 87
Procedure groups for which models exist bull Isolated CABG (CAB)
bull Isolated Aortic Valve Replacement (AVRepl)
bull Aortic Valve Replacement and CABG (AVRepl+CAB)
bull Isolated Mitral Valve Replacement (MVRepl)
bull Mitral Valve Replacement and CABG (MVRepl+CAB)
bull Isolated Mitral Valve Repair (MVRepr)
bull Mitral Valve Repair and CABG (MVRepr+CAB)
Model endpoints bull Operative Mortality
bull Stroke
bull Renal Failure
bull Prolonged Ventilation
bull Deep Sternal Wound Infection
bull Reoperation
bull MortalityMorbidity combined endpoint (any of the 6 previous endpoints)
bull Prolonged length of stay (length of stay gt14 days)
bull Short length of stay (length of stay lt 6 days
(Based on roughly 27 million patients)
Procedures for which the STS
database has a predictive model

Outcomes before and after Checklist Implementation According to Site
Haynes AB et al N Engl J Med 2009360491-499
Outcomes before and after Checklist Implementation According to Site
September 12 2016 27
0
10
20
30
40
50
60
70
80
90
100
Jul15 Aug15 Sep15 Oct15 Nov15 Dec15 Jan16 Feb16 Mar16 Apr16 May16 Jun16
POD0 Complete
Signed
Goal
POD 0 Checklist Compliance
ICU TEAMWORK MATTERS
September 12 2016 34
Cardiac Surgery Quality Assurance
Performance Improvement Committee (2009 ndash 2012)
bull First and Third Friday of Every Month
bull Representatives From
bull Attendings
bull Fellows
bull APrsquos both CVSICU and CVPCU
bull RespiratoryTherapy
bull Physical Therapy
bull Pharmacy
bull Nursing both CVSICU and CVPCU
bull Administration
bull Quality Improvement
INFLUENCE OF THE COMPREHENSIVE
UNITndashBASED SAFETY PROGRAM IN ICUS
EVIDENCE FROM THE KEYSTONE ICU
PROJECT
September 12 2016 36
Hsu Y Marsteller J
Am J Med Qual 201631349-
357
CUSP Comprehensive Unit Based
Safety Program
bull CUSP Members
bull Team Leader
bull Physician Champion
bull Executive Champion
bull Nurse Manager
bull Infection Prevention Representative
bull Resp Therapy Environmental Invited
Stakeholders
September 12 2016 37
CUSP
bull Monthly Meetings
bull Monthly Safety Rounds
bull Identify system defects
bull Develop safety and monitoring tools
bull Educate the staff
bull Present outcomes
September 12 2016 38
0
10
20
30
40
50
60
70
Teamwork Safety Job Satisfaction Stress Recognition Perceptions of Mgmt Working Conditions Teamwork Safety Job Satisfaction Stress Recognition Perceptions of Mgmt Working Conditions
Non-CUSP ICUs CUSP ICUs
significantly positive difference
Hsu Y Marsteller J
American Journal of Medical Quality 201631349ndash357
Influence of CUSP on ICU Culture
Improvement in
bull Teamwork
bull Safety
bull Satisfaction
bull Environment
Teamwork Climate
The Effect of a Comprehensive Unit
Based Safety Program on CLABSI
September 12 2016 41
Miller K et al 2016 Am J Infection Control
The Impact of ICU Structure and
Processes on Outcomes
bull Full Time Intensivists
bull Multidisciplinary Teams
bull Organization of Rounds
bull Checklists
bull Teamwork
bull Performance Improvement and
Metrics
September 12 2016 42
0
5
10
15
20
25
30
35
40
1-6 6-12 12-24 24-48 gt48
Infe
cti
on
Rate
Post Op Vent Time (hrs)
Non-PNA Infxn
PNA
Post-Op SSI and PNA Rate in Open Heart
Surgery Patients
Johns Hopkins Hospital 112011 ndash 32014
(n = 2253)
Primary Outcome
Postoperative Overall Infection (n=127)
withwithout Vent time adjusted
Odds of
Infection
(95CI)
Without Vent
Timep-value
With Vent
Timep-value
Intraop + Postop
Transfusion
RBC
(unit)11(10-12) 004 10(09-11) 076
FFP 13 (08-22) 026 11(06-18) 081
Platelet 08(05-13) 034 08(05-14) 048
Cryo 12 (06-25) 060 12(04-32) 078
Preop
WBC11(10-11) lt0001 105(10-11) 0001
Preop
COPD33(22-50) lt0001 26(16-43) lt0001
Preop Crgt
15mgdL17(10-27) 004 134(08-22) 026
Adjusted variables were blood products previous cardiac surgery preoperative WBC value heart failure within 2 weeks prior to
surgery preoperative COPD preoperative serum creatinine CPB time and surgery type vs isolated CABG and postoperative
ventilation time Only values lt 005 are shown except for transfusions
1
25 26
147
0
2
4
6
8
10
12
14
16
0-12 12-24 24-48 48+O
dd
s o
f o
ve
rall
In
fec
tio
n
Postoperative Ventilation Time (hours)
ref
p=003p=0004
plt0001
0
5
10
15
20
25
30
35
JHH2008
STS Like2008
STS National2008
Patients Extubated lt6hrs
(CABG Only)
Early Extubation Performance at the
Johns Hopkins Hospital - 2008
0
5
10
15
20
25
30
35
40
45
50
JHH Period 1(132005-9292009)
JHH Period 2(1012009-8312011)
Patients Extubated
lt6hrs (CABG Only)
n= 1174
n= 637
STS National Average 2009 37
STS Like Institutions 2009 32
plt001 compared to JHH Period 1
Pre vs Post Implementation of New MV
Weaning Protocol
A Bow Around Your Finger
0
5
10
15
20
25
30
35
40
45
50
JHH Period 1(132005-9292009)
JHH Period 2(1012009-8312011)
JHH Period 3(912011-6302012)
n=1174
n=637
Ŧ
STS National Average 2011 40
STS Like Institutions 2011 42
Patients Extubated
lt6hrs(CABG Only)
n=236
plt001 compared to JHH Period 1 Ŧ plt001 compared to JHH Period 2 Fitch ZW Debesa O Ohkuma R et al
J Thorac Cardiovasc Surg 2014 Apr 147(4)1344-50
Results Following Additional Protocol
Changes
12
24
38
51
0
10
20
30
40
50
60
JHH Period 1 (132005-9292009)
JHH Period 2 (1012009-8312011)
JHH Period 3 (912011-6302012)
JHH Period 4 (112014-8152014)
STS Like Institutions 2014
plt001 compared to JHH Period 1 Ŧ plt001 compared to JHH Period 2
n=236
n=637
n=1174
n=236
Ŧ
Patients Extubated
lt6hrs(CABG Only)
Extubation lt 6 Hours Current
Performance 2014
September 12 2016 50
CVSICU Reasons For
Extubation gt6h
Hemodynamic Instability4 Hypoxia
3CVA or delirium
5
Bleeding20
Open chest ECMO17
Metabolic Acidosis28
Other23
CVSICU Arrival Temp
1215
5
137
14 13 11 11 10 118
0
20
40
60
80
100
Jul15 Aug15 Sep15 Oct15 Nov15 Dec15 Jan16 Feb16 Mar16 Apr16 May16 Jun16
Temp gt35
Temp lt 350
0
2
4
6
8
10
12
14
16
18
2013 n=390
2014 n=348
2015 n=469
Q1-2016 n=110
Isolated CAB Morbidity
Failed to Prescribe All Eligible
Medications for Isolated CAB
54
If you donrsquot know your performance
you are not doing as well as you think you are
Intervention ndash PCR testing
bull Preoperative PCR testing for MRSA
ndash Nasal swab by PAs on preop visit
bull If positive
ndash Intranasal mupirocin bid
ndash Chlorhexidine baths
bull Both for 5 days (or as many days as possible preop
full course completed in ICU if necessary)
Overall SSI in CABG Patients
05 005
37
265
0
1
2
3
4
5
Pre-Intervention (n=1357) Intervention (n=1990)
Non-MRSA
MRSA42
27
Perc
enta
ge o
f C
AB
G p
atients
Un-adjusted Adjusted
OR 95 CI p-value OR 95 CI p-value
Intervention Era 064 044 093 002 058 040 086 0007
MRSA ICU Admissions
26
14
0
1
2
3
Pre-Intervention (n=2826) Intervention (n=4038)
Perc
enta
ge o
f IC
U A
dm
issio
ns
MRSA-Positive on ICU Admission
Univariate Multivariate
OR 95 CI p-value OR 95 CI p-value
Intervention Era 05 037 074 lt0001 05 037 076 lt0001
MRSA ICU Admissions
10
26
04
0
1
2
3
Pre-Intervention (n=2826) Intervention (n=4038)
Perc
enta
ge o
f IC
U A
dm
issio
ns
No PCR
PCR Screened
14
MRSA-Positive on ICU Admission
Univariate Multivariate
OR 95 CI p-value OR 95 CI p-value
Intervention Era 05 037 074 lt0001 05 037 076 lt0001
MRSA ICU Transmission
Adjusted Poisson Regression MRSA transmissions
aIRR 95 CI P
Intervention era 029 013 065 0002
16
04
00
02
04
06
08
10
12
14
16
18
Pre-Intervention(14733 pt days)
Intervention(21467 pt days)
Incid
ence R
ate
per
1000 p
tdays
Staph Screening Miss CategoriesJuly 2016
September 12 2016 60
1
2
2
3Transfer
True Miss
gt45 Days
Discontinued
Group but not Individual
Accountability
September 12 2016 61
65
74
81
71
87 8892
0
10
20
30
40
50
60
70
80
90
100
2009 2010 2011 2012 2013 2014 2015 (Jan-March)
CVSICU Hand Hygiene Compliance by Year
45
67
89
10
11
12
13
14
15
Hg
b(g
md
L)
1 2 3 4 5 6 7 8 9 10 11 12 1314 15 16 17 18 19 2021 22 23 24 25
Week
All Surgeons Combined
Weekly Transfusions with Corresponding Hgb for All
Procedures
Period 1 Period 2
45
67
89
10
11
12
13
14
15
Hg
b(g
msd
L)
1 2 3 4 5 6 7 8 9 10 11 12131415 16171819 20212223 24 25
Week
For a Single Surgeon
Weekly Transfusions with Corresponding Hgb for All
Procedures
Period 1 Period 2 Period 3
45
67
89
10
11
12
13
14
15
Hg
b(g
md
L)
1 2 3 4 5 6 7 8 9 10 11 12 1314 15 16 17 18 19 2021 22 23 24 25
Week
All Surgeons Combined
Weekly Transfusions with Corresponding Hgb for All
Procedures
Period 1 Period 2 Period 3
02
04
06
0
Tra
nsfu
sed
(
)
Period 1 Period 2 Period 3
Percent of Transfusions at Increasing Hgb
Thresholds All Surgeons Combined
above Hgb of 8 gmdL
above Hgb of 9 gmdL
above Hgb of 10 gmdL
Denotes significantly different than period 1
Denotes significantly different than period 2
Monthly Cardiac Surgery Dashboard
bull Vent Times
bull Reasons for ext gt 6 hrs
bull iNO vs Veletri hrs
bull HyperHypo glycemia
bull Checklist Compliance
bull Staph screening (with reasons
for misses)
bull Blood Utilization
bull CVSICU arrival
bull K+
bull Temp
bull Base Deficit
bull Daily Weights
bull Transfers gt 6 pm
bull Bouncebacks (Total lt 24 hrs)
with Reasons)
September 12 2016 66
And Weekly Mortality and Morbidity
The Johns Hopkins Cardiac Surgery
Code of Conduct and Professional Behavior
September 12 2016 68
Critical Care of the Cardiovascular PatientThe essentials for high quality
1 Full time intensivists
2 Structured Multi-D rounds (Pharmacy)
3 Nurse readbacks
4 Checklists
5 Culture of safetyteamwork (CUSP)
6 Performance improvement requires
bull Multidisciplinary input
bull Agreed upon targets
bull Review of outcomes
bull Continual reassessment
6 Individual accountability matters
Isolated CABG
Post Op Morbidities
0
2
4
6
8
10
12
14
16
18
ANY MORBIDITY(Total)
ProlongedVentilation
MultipleMorbidities
Reoperation Renal Failure CerebrovascularAccident
Deep SternalWound
Mediastinitis
2014 Jan 1 ndash Jun 30
bull Universal public reporting is inevitable
bull ICU care plays a major role in patient
outcomes
September 12 2016 70
Surgeon-Reported Conflicts with Intensivists About
Postoperative Goals of Care
JAMA Surg 201314829-35
bull Vascular Neurologic and
Cardiothoracic Surgeons
bull Mail Questionnaire
bull 56 response rate n = 2100
September 12 2016 71
Rates of Surgeon Reported ConflictsJAMA Surg 201314829-35
September 12 2016 72
0
1
2
3
4
1 2 3 4 5 6 7 8 9 10
Institution
Count of Cardiac Surg
Count of Gen Surg CC
Count of Card Surg CC
Count of Anesth
Count of Anesth CC
Count of Cardiac Anesth
Count of Card Anesth CC
Count of Pulm CC
radic
radic
radic
radic
radic
radic
radic
radic
radic
radic
radic = CT trained
Heterogeneity of Specialties in Cardiac
Intensive Care Units
446537
556
75
889
1943
0 - 6 hrs 6 - 9 hrs 9 - 12 hrs 12 - 18 hrs 18 - 24 hrs gt 24 hrs
ICU
Sta
y(h
rs)
me
an
plusmnS
D
Intubation Duration
p lt 001
p = 070
p = 005
Unadjusted ICU Length of Stay
67 7
8
85
13
0 - 6 hrs 6 - 9 hrs 9 - 12 hrs 12 - 18 hrs 18 - 24 hrs gt 24 hrs
Hospital S
tay
(days)
media
n
(IQ
R)
Intubation Duration
p lt 001
p lt 001
p lt 001
Unadjusted Hospital Length of Stay
Multidisciplinary Teams
Physician Nurse and ge 1 more Health Care
Professional
of Patients with Infection by
RBC Units Transfused2
7
26 3
2
44
90
12
5
21 2
6
26
39
70
12
5
03
00 02 03
17
11
06
00 04 05 1
0
00
0 1 2 3-5 6-9 10+
Overall Infection Pneumonia Sepsis SSI
Total Number of RBC units Transfused
o
f p
ati
en
ts w
ith
In
fecti
on
significantly different (plt005) compared to no RBC exposure
Relationship between Infection
and Ventilation Time1
7
43 46
24
1
13
36 39
20
9
01
02 07
35
04
05
00
23
0-12 12-24 24-48 48+
Ventilation Time vs Infection ()
Overall Infection Pneumonia Sepsis SSI
Length of Mechanical Ventilation (hrs)
P
ati
en
ts w
ith
Infe
cti
on
by T
yp
e
Note 48 of all infections occurred in patients with 48+ hours ventilation
significantly different (plt005) compared to vent time lt12 hrs group
Isolated CABG
Post Op Morbidities
0
2
4
6
8
10
12
14
16
18
ANY MORBIDITY(Total)
ProlongedVentilation
MultipleMorbidities
Reoperation Renal Failure CerebrovascularAccident
Deep SternalWound
Mediastinitis
2013
2014
n= 390
n= 181
2014 Jan 1 ndash Jun 30
2013 and 2014
The Tenets of CUSP
bull Step 1 Safety Attitude Questionnaire (SAQ)
bull Step 2 Educate re Science of Improving
bull Step 3 Identify Defects ( events that should
not recur)
bull Step 4 Executive Partnership to ldquoBridge the
Gaprdquo
bull Step 5 Choose a Defect each Month that
poses a hazard
bull Step 6 ReassessSeptember 12 2016 80
Patients with BD lt -4 and
K lt 33 by Month
21
01
2
0 0
6
01
2
00
5
10
15
20
25
30
35
40
Jul15 Aug15 Sep15 Oct15 Nov15 Dec15 Jan16 Feb16 Mar16 Apr16 May16 Jun16
Quality Improvement
- Insight regarding what metric to target
- A sense of comfort to embark upon
new initiatives
- Involves ability to create consensus
September 12 2016 83
45
67
89
10
11
12
13
14
15
Hg
b(g
md
L)
1 2 3 4 5 6 7 8 9 10 11 12131415161718192021222324 25
Week
All Surgeons Combined
Weekly Transfusions with Corresponding Hgb for
CABG Patients
Period 1 Period 2 Period 3
02
04
06
0
Tra
nsfu
sed
(
)
Period 1 Period 2 Period 3
Percent of Transfusions at Increasing Hgb
Thresholds All Surgeons Combined
above Hgb of 8 gmdL
above Hgb of 9 gmdL
above Hgb of 10 gmdL
Denotes significantly different than period 1
Denotes significantly different than period 2
Conclusion
bull Though recognizing that this is as yet untested the
perspective that comes with cardiothoracic surgical
training and practice best addresses the above
issues which face every cardiothoracic surgical team
and ICU
As a result thoracic surgeons
bull Should be the directors of the CTICU and
bull Should play an integral part in the delivery of day to day ICU
care
September 12 2016 86
9122016 87
Procedure groups for which models exist bull Isolated CABG (CAB)
bull Isolated Aortic Valve Replacement (AVRepl)
bull Aortic Valve Replacement and CABG (AVRepl+CAB)
bull Isolated Mitral Valve Replacement (MVRepl)
bull Mitral Valve Replacement and CABG (MVRepl+CAB)
bull Isolated Mitral Valve Repair (MVRepr)
bull Mitral Valve Repair and CABG (MVRepr+CAB)
Model endpoints bull Operative Mortality
bull Stroke
bull Renal Failure
bull Prolonged Ventilation
bull Deep Sternal Wound Infection
bull Reoperation
bull MortalityMorbidity combined endpoint (any of the 6 previous endpoints)
bull Prolonged length of stay (length of stay gt14 days)
bull Short length of stay (length of stay lt 6 days
(Based on roughly 27 million patients)
Procedures for which the STS
database has a predictive model
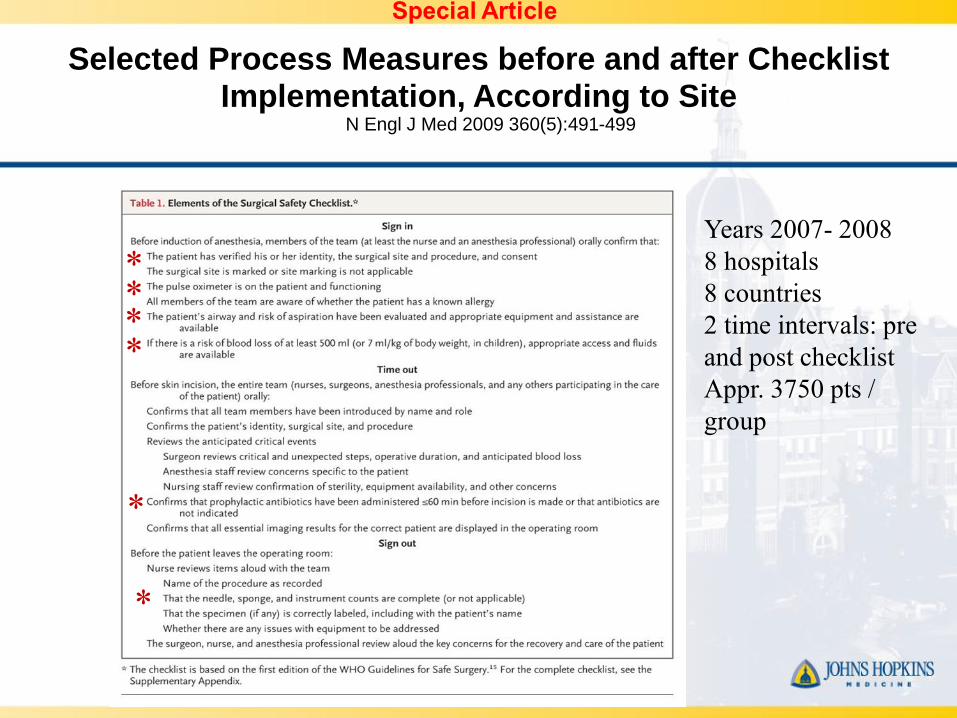
0
10
20
30
40
50
60
70
80
90
100
Jul15 Aug15 Sep15 Oct15 Nov15 Dec15 Jan16 Feb16 Mar16 Apr16 May16 Jun16
POD0 Complete
Signed
Goal
POD 0 Checklist Compliance
ICU TEAMWORK MATTERS
September 12 2016 34
Cardiac Surgery Quality Assurance
Performance Improvement Committee (2009 ndash 2012)
bull First and Third Friday of Every Month
bull Representatives From
bull Attendings
bull Fellows
bull APrsquos both CVSICU and CVPCU
bull RespiratoryTherapy
bull Physical Therapy
bull Pharmacy
bull Nursing both CVSICU and CVPCU
bull Administration
bull Quality Improvement
INFLUENCE OF THE COMPREHENSIVE
UNITndashBASED SAFETY PROGRAM IN ICUS
EVIDENCE FROM THE KEYSTONE ICU
PROJECT
September 12 2016 36
Hsu Y Marsteller J
Am J Med Qual 201631349-
357
CUSP Comprehensive Unit Based
Safety Program
bull CUSP Members
bull Team Leader
bull Physician Champion
bull Executive Champion
bull Nurse Manager
bull Infection Prevention Representative
bull Resp Therapy Environmental Invited
Stakeholders
September 12 2016 37
CUSP
bull Monthly Meetings
bull Monthly Safety Rounds
bull Identify system defects
bull Develop safety and monitoring tools
bull Educate the staff
bull Present outcomes
September 12 2016 38
0
10
20
30
40
50
60
70
Teamwork Safety Job Satisfaction Stress Recognition Perceptions of Mgmt Working Conditions Teamwork Safety Job Satisfaction Stress Recognition Perceptions of Mgmt Working Conditions
Non-CUSP ICUs CUSP ICUs
significantly positive difference
Hsu Y Marsteller J
American Journal of Medical Quality 201631349ndash357
Influence of CUSP on ICU Culture
Improvement in
bull Teamwork
bull Safety
bull Satisfaction
bull Environment
Teamwork Climate
The Effect of a Comprehensive Unit
Based Safety Program on CLABSI
September 12 2016 41
Miller K et al 2016 Am J Infection Control
The Impact of ICU Structure and
Processes on Outcomes
bull Full Time Intensivists
bull Multidisciplinary Teams
bull Organization of Rounds
bull Checklists
bull Teamwork
bull Performance Improvement and
Metrics
September 12 2016 42
0
5
10
15
20
25
30
35
40
1-6 6-12 12-24 24-48 gt48
Infe
cti
on
Rate
Post Op Vent Time (hrs)
Non-PNA Infxn
PNA
Post-Op SSI and PNA Rate in Open Heart
Surgery Patients
Johns Hopkins Hospital 112011 ndash 32014
(n = 2253)
Primary Outcome
Postoperative Overall Infection (n=127)
withwithout Vent time adjusted
Odds of
Infection
(95CI)
Without Vent
Timep-value
With Vent
Timep-value
Intraop + Postop
Transfusion
RBC
(unit)11(10-12) 004 10(09-11) 076
FFP 13 (08-22) 026 11(06-18) 081
Platelet 08(05-13) 034 08(05-14) 048
Cryo 12 (06-25) 060 12(04-32) 078
Preop
WBC11(10-11) lt0001 105(10-11) 0001
Preop
COPD33(22-50) lt0001 26(16-43) lt0001
Preop Crgt
15mgdL17(10-27) 004 134(08-22) 026
Adjusted variables were blood products previous cardiac surgery preoperative WBC value heart failure within 2 weeks prior to
surgery preoperative COPD preoperative serum creatinine CPB time and surgery type vs isolated CABG and postoperative
ventilation time Only values lt 005 are shown except for transfusions
1
25 26
147
0
2
4
6
8
10
12
14
16
0-12 12-24 24-48 48+O
dd
s o
f o
ve
rall
In
fec
tio
n
Postoperative Ventilation Time (hours)
ref
p=003p=0004
plt0001
0
5
10
15
20
25
30
35
JHH2008
STS Like2008
STS National2008
Patients Extubated lt6hrs
(CABG Only)
Early Extubation Performance at the
Johns Hopkins Hospital - 2008
0
5
10
15
20
25
30
35
40
45
50
JHH Period 1(132005-9292009)
JHH Period 2(1012009-8312011)
Patients Extubated
lt6hrs (CABG Only)
n= 1174
n= 637
STS National Average 2009 37
STS Like Institutions 2009 32
plt001 compared to JHH Period 1
Pre vs Post Implementation of New MV
Weaning Protocol
A Bow Around Your Finger
0
5
10
15
20
25
30
35
40
45
50
JHH Period 1(132005-9292009)
JHH Period 2(1012009-8312011)
JHH Period 3(912011-6302012)
n=1174
n=637
Ŧ
STS National Average 2011 40
STS Like Institutions 2011 42
Patients Extubated
lt6hrs(CABG Only)
n=236
plt001 compared to JHH Period 1 Ŧ plt001 compared to JHH Period 2 Fitch ZW Debesa O Ohkuma R et al
J Thorac Cardiovasc Surg 2014 Apr 147(4)1344-50
Results Following Additional Protocol
Changes
12
24
38
51
0
10
20
30
40
50
60
JHH Period 1 (132005-9292009)
JHH Period 2 (1012009-8312011)
JHH Period 3 (912011-6302012)
JHH Period 4 (112014-8152014)
STS Like Institutions 2014
plt001 compared to JHH Period 1 Ŧ plt001 compared to JHH Period 2
n=236
n=637
n=1174
n=236
Ŧ
Patients Extubated
lt6hrs(CABG Only)
Extubation lt 6 Hours Current
Performance 2014
September 12 2016 50
CVSICU Reasons For
Extubation gt6h
Hemodynamic Instability4 Hypoxia
3CVA or delirium
5
Bleeding20
Open chest ECMO17
Metabolic Acidosis28
Other23
CVSICU Arrival Temp
1215
5
137
14 13 11 11 10 118
0
20
40
60
80
100
Jul15 Aug15 Sep15 Oct15 Nov15 Dec15 Jan16 Feb16 Mar16 Apr16 May16 Jun16
Temp gt35
Temp lt 350
0
2
4
6
8
10
12
14
16
18
2013 n=390
2014 n=348
2015 n=469
Q1-2016 n=110
Isolated CAB Morbidity
Failed to Prescribe All Eligible
Medications for Isolated CAB
54
If you donrsquot know your performance
you are not doing as well as you think you are
Intervention ndash PCR testing
bull Preoperative PCR testing for MRSA
ndash Nasal swab by PAs on preop visit
bull If positive
ndash Intranasal mupirocin bid
ndash Chlorhexidine baths
bull Both for 5 days (or as many days as possible preop
full course completed in ICU if necessary)
Overall SSI in CABG Patients
05 005
37
265
0
1
2
3
4
5
Pre-Intervention (n=1357) Intervention (n=1990)
Non-MRSA
MRSA42
27
Perc
enta
ge o
f C
AB
G p
atients
Un-adjusted Adjusted
OR 95 CI p-value OR 95 CI p-value
Intervention Era 064 044 093 002 058 040 086 0007
MRSA ICU Admissions
26
14
0
1
2
3
Pre-Intervention (n=2826) Intervention (n=4038)
Perc
enta
ge o
f IC
U A
dm
issio
ns
MRSA-Positive on ICU Admission
Univariate Multivariate
OR 95 CI p-value OR 95 CI p-value
Intervention Era 05 037 074 lt0001 05 037 076 lt0001
MRSA ICU Admissions
10
26
04
0
1
2
3
Pre-Intervention (n=2826) Intervention (n=4038)
Perc
enta
ge o
f IC
U A
dm
issio
ns
No PCR
PCR Screened
14
MRSA-Positive on ICU Admission
Univariate Multivariate
OR 95 CI p-value OR 95 CI p-value
Intervention Era 05 037 074 lt0001 05 037 076 lt0001
MRSA ICU Transmission
Adjusted Poisson Regression MRSA transmissions
aIRR 95 CI P
Intervention era 029 013 065 0002
16
04
00
02
04
06
08
10
12
14
16
18
Pre-Intervention(14733 pt days)
Intervention(21467 pt days)
Incid
ence R
ate
per
1000 p
tdays
Staph Screening Miss CategoriesJuly 2016
September 12 2016 60
1
2
2
3Transfer
True Miss
gt45 Days
Discontinued
Group but not Individual
Accountability
September 12 2016 61
65
74
81
71
87 8892
0
10
20
30
40
50
60
70
80
90
100
2009 2010 2011 2012 2013 2014 2015 (Jan-March)
CVSICU Hand Hygiene Compliance by Year
45
67
89
10
11
12
13
14
15
Hg
b(g
md
L)
1 2 3 4 5 6 7 8 9 10 11 12 1314 15 16 17 18 19 2021 22 23 24 25
Week
All Surgeons Combined
Weekly Transfusions with Corresponding Hgb for All
Procedures
Period 1 Period 2
45
67
89
10
11
12
13
14
15
Hg
b(g
msd
L)
1 2 3 4 5 6 7 8 9 10 11 12131415 16171819 20212223 24 25
Week
For a Single Surgeon
Weekly Transfusions with Corresponding Hgb for All
Procedures
Period 1 Period 2 Period 3
45
67
89
10
11
12
13
14
15
Hg
b(g
md
L)
1 2 3 4 5 6 7 8 9 10 11 12 1314 15 16 17 18 19 2021 22 23 24 25
Week
All Surgeons Combined
Weekly Transfusions with Corresponding Hgb for All
Procedures
Period 1 Period 2 Period 3
02
04
06
0
Tra
nsfu
sed
(
)
Period 1 Period 2 Period 3
Percent of Transfusions at Increasing Hgb
Thresholds All Surgeons Combined
above Hgb of 8 gmdL
above Hgb of 9 gmdL
above Hgb of 10 gmdL
Denotes significantly different than period 1
Denotes significantly different than period 2
Monthly Cardiac Surgery Dashboard
bull Vent Times
bull Reasons for ext gt 6 hrs
bull iNO vs Veletri hrs
bull HyperHypo glycemia
bull Checklist Compliance
bull Staph screening (with reasons
for misses)
bull Blood Utilization
bull CVSICU arrival
bull K+
bull Temp
bull Base Deficit
bull Daily Weights
bull Transfers gt 6 pm
bull Bouncebacks (Total lt 24 hrs)
with Reasons)
September 12 2016 66
And Weekly Mortality and Morbidity
The Johns Hopkins Cardiac Surgery
Code of Conduct and Professional Behavior
September 12 2016 68
Critical Care of the Cardiovascular PatientThe essentials for high quality
1 Full time intensivists
2 Structured Multi-D rounds (Pharmacy)
3 Nurse readbacks
4 Checklists
5 Culture of safetyteamwork (CUSP)
6 Performance improvement requires
bull Multidisciplinary input
bull Agreed upon targets
bull Review of outcomes
bull Continual reassessment
6 Individual accountability matters
Isolated CABG
Post Op Morbidities
0
2
4
6
8
10
12
14
16
18
ANY MORBIDITY(Total)
ProlongedVentilation
MultipleMorbidities
Reoperation Renal Failure CerebrovascularAccident
Deep SternalWound
Mediastinitis
2014 Jan 1 ndash Jun 30
bull Universal public reporting is inevitable
bull ICU care plays a major role in patient
outcomes
September 12 2016 70
Surgeon-Reported Conflicts with Intensivists About
Postoperative Goals of Care
JAMA Surg 201314829-35
bull Vascular Neurologic and
Cardiothoracic Surgeons
bull Mail Questionnaire
bull 56 response rate n = 2100
September 12 2016 71
Rates of Surgeon Reported ConflictsJAMA Surg 201314829-35
September 12 2016 72
0
1
2
3
4
1 2 3 4 5 6 7 8 9 10
Institution
Count of Cardiac Surg
Count of Gen Surg CC
Count of Card Surg CC
Count of Anesth
Count of Anesth CC
Count of Cardiac Anesth
Count of Card Anesth CC
Count of Pulm CC
radic
radic
radic
radic
radic
radic
radic
radic
radic
radic
radic = CT trained
Heterogeneity of Specialties in Cardiac
Intensive Care Units
446537
556
75
889
1943
0 - 6 hrs 6 - 9 hrs 9 - 12 hrs 12 - 18 hrs 18 - 24 hrs gt 24 hrs
ICU
Sta
y(h
rs)
me
an
plusmnS
D
Intubation Duration
p lt 001
p = 070
p = 005
Unadjusted ICU Length of Stay
67 7
8
85
13
0 - 6 hrs 6 - 9 hrs 9 - 12 hrs 12 - 18 hrs 18 - 24 hrs gt 24 hrs
Hospital S
tay
(days)
media
n
(IQ
R)
Intubation Duration
p lt 001
p lt 001
p lt 001
Unadjusted Hospital Length of Stay
Multidisciplinary Teams
Physician Nurse and ge 1 more Health Care
Professional
of Patients with Infection by
RBC Units Transfused2
7
26 3
2
44
90
12
5
21 2
6
26
39
70
12
5
03
00 02 03
17
11
06
00 04 05 1
0
00
0 1 2 3-5 6-9 10+
Overall Infection Pneumonia Sepsis SSI
Total Number of RBC units Transfused
o
f p
ati
en
ts w
ith
In
fecti
on
significantly different (plt005) compared to no RBC exposure
Relationship between Infection
and Ventilation Time1
7
43 46
24
1
13
36 39
20
9
01
02 07
35
04
05
00
23
0-12 12-24 24-48 48+
Ventilation Time vs Infection ()
Overall Infection Pneumonia Sepsis SSI
Length of Mechanical Ventilation (hrs)
P
ati
en
ts w
ith
Infe
cti
on
by T
yp
e
Note 48 of all infections occurred in patients with 48+ hours ventilation
significantly different (plt005) compared to vent time lt12 hrs group
Isolated CABG
Post Op Morbidities
0
2
4
6
8
10
12
14
16
18
ANY MORBIDITY(Total)
ProlongedVentilation
MultipleMorbidities
Reoperation Renal Failure CerebrovascularAccident
Deep SternalWound
Mediastinitis
2013
2014
n= 390
n= 181
2014 Jan 1 ndash Jun 30
2013 and 2014
The Tenets of CUSP
bull Step 1 Safety Attitude Questionnaire (SAQ)
bull Step 2 Educate re Science of Improving
bull Step 3 Identify Defects ( events that should
not recur)
bull Step 4 Executive Partnership to ldquoBridge the
Gaprdquo
bull Step 5 Choose a Defect each Month that
poses a hazard
bull Step 6 ReassessSeptember 12 2016 80
Patients with BD lt -4 and
K lt 33 by Month
21
01
2
0 0
6
01
2
00
5
10
15
20
25
30
35
40
Jul15 Aug15 Sep15 Oct15 Nov15 Dec15 Jan16 Feb16 Mar16 Apr16 May16 Jun16
Quality Improvement
- Insight regarding what metric to target
- A sense of comfort to embark upon
new initiatives
- Involves ability to create consensus
September 12 2016 83
45
67
89
10
11
12
13
14
15
Hg
b(g
md
L)
1 2 3 4 5 6 7 8 9 10 11 12131415161718192021222324 25
Week
All Surgeons Combined
Weekly Transfusions with Corresponding Hgb for
CABG Patients
Period 1 Period 2 Period 3
02
04
06
0
Tra
nsfu
sed
(
)
Period 1 Period 2 Period 3
Percent of Transfusions at Increasing Hgb
Thresholds All Surgeons Combined
above Hgb of 8 gmdL
above Hgb of 9 gmdL
above Hgb of 10 gmdL
Denotes significantly different than period 1
Denotes significantly different than period 2
Conclusion
bull Though recognizing that this is as yet untested the
perspective that comes with cardiothoracic surgical
training and practice best addresses the above
issues which face every cardiothoracic surgical team
and ICU
As a result thoracic surgeons
bull Should be the directors of the CTICU and
bull Should play an integral part in the delivery of day to day ICU
care
September 12 2016 86
9122016 87
Procedure groups for which models exist bull Isolated CABG (CAB)
bull Isolated Aortic Valve Replacement (AVRepl)
bull Aortic Valve Replacement and CABG (AVRepl+CAB)
bull Isolated Mitral Valve Replacement (MVRepl)
bull Mitral Valve Replacement and CABG (MVRepl+CAB)
bull Isolated Mitral Valve Repair (MVRepr)
bull Mitral Valve Repair and CABG (MVRepr+CAB)
Model endpoints bull Operative Mortality
bull Stroke
bull Renal Failure
bull Prolonged Ventilation
bull Deep Sternal Wound Infection
bull Reoperation
bull MortalityMorbidity combined endpoint (any of the 6 previous endpoints)
bull Prolonged length of stay (length of stay gt14 days)
bull Short length of stay (length of stay lt 6 days
(Based on roughly 27 million patients)
Procedures for which the STS
database has a predictive model
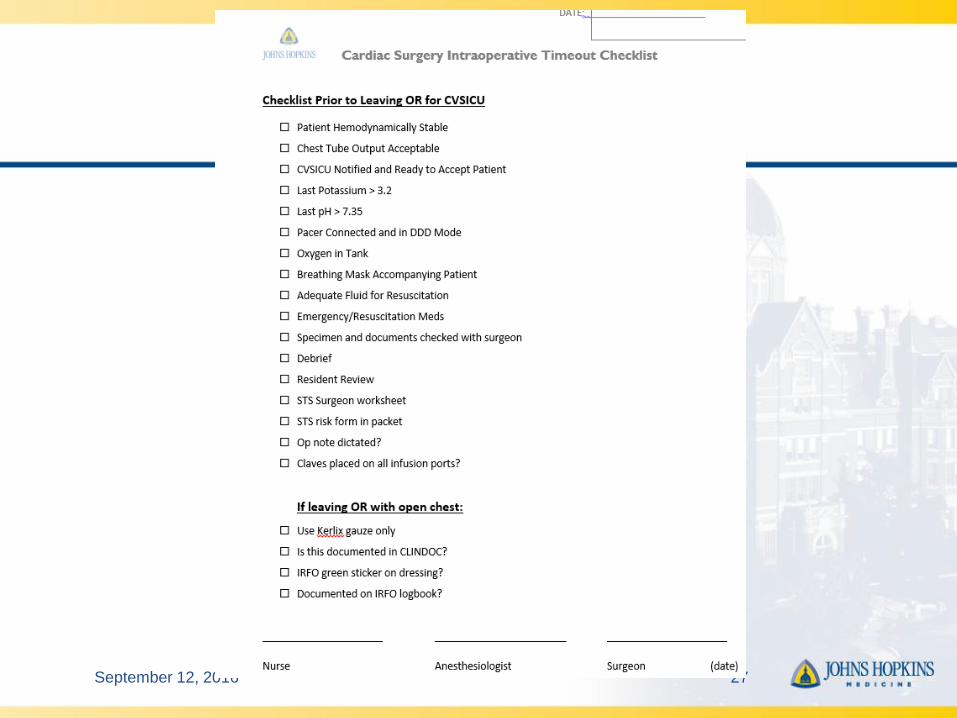

0
10
20
30
40
50
60
70
Teamwork Safety Job Satisfaction Stress Recognition Perceptions of Mgmt Working Conditions Teamwork Safety Job Satisfaction Stress Recognition Perceptions of Mgmt Working Conditions
Non-CUSP ICUs CUSP ICUs
significantly positive difference
Hsu Y Marsteller J
American Journal of Medical Quality 201631349ndash357
Influence of CUSP on ICU Culture
Improvement in
bull Teamwork
bull Safety
bull Satisfaction
bull Environment
Teamwork Climate
The Effect of a Comprehensive Unit
Based Safety Program on CLABSI
September 12 2016 41
Miller K et al 2016 Am J Infection Control
The Impact of ICU Structure and
Processes on Outcomes
bull Full Time Intensivists
bull Multidisciplinary Teams
bull Organization of Rounds
bull Checklists
bull Teamwork
bull Performance Improvement and
Metrics
September 12 2016 42
0
5
10
15
20
25
30
35
40
1-6 6-12 12-24 24-48 gt48
Infe
cti
on
Rate
Post Op Vent Time (hrs)
Non-PNA Infxn
PNA
Post-Op SSI and PNA Rate in Open Heart
Surgery Patients
Johns Hopkins Hospital 112011 ndash 32014
(n = 2253)
Primary Outcome
Postoperative Overall Infection (n=127)
withwithout Vent time adjusted
Odds of
Infection
(95CI)
Without Vent
Timep-value
With Vent
Timep-value
Intraop + Postop
Transfusion
RBC
(unit)11(10-12) 004 10(09-11) 076
FFP 13 (08-22) 026 11(06-18) 081
Platelet 08(05-13) 034 08(05-14) 048
Cryo 12 (06-25) 060 12(04-32) 078
Preop
WBC11(10-11) lt0001 105(10-11) 0001
Preop
COPD33(22-50) lt0001 26(16-43) lt0001
Preop Crgt
15mgdL17(10-27) 004 134(08-22) 026
Adjusted variables were blood products previous cardiac surgery preoperative WBC value heart failure within 2 weeks prior to
surgery preoperative COPD preoperative serum creatinine CPB time and surgery type vs isolated CABG and postoperative
ventilation time Only values lt 005 are shown except for transfusions
1
25 26
147
0
2
4
6
8
10
12
14
16
0-12 12-24 24-48 48+O
dd
s o
f o
ve
rall
In
fec
tio
n
Postoperative Ventilation Time (hours)
ref
p=003p=0004
plt0001
0
5
10
15
20
25
30
35
JHH2008
STS Like2008
STS National2008
Patients Extubated lt6hrs
(CABG Only)
Early Extubation Performance at the
Johns Hopkins Hospital - 2008
0
5
10
15
20
25
30
35
40
45
50
JHH Period 1(132005-9292009)
JHH Period 2(1012009-8312011)
Patients Extubated
lt6hrs (CABG Only)
n= 1174
n= 637
STS National Average 2009 37
STS Like Institutions 2009 32
plt001 compared to JHH Period 1
Pre vs Post Implementation of New MV
Weaning Protocol
A Bow Around Your Finger
0
5
10
15
20
25
30
35
40
45
50
JHH Period 1(132005-9292009)
JHH Period 2(1012009-8312011)
JHH Period 3(912011-6302012)
n=1174
n=637
Ŧ
STS National Average 2011 40
STS Like Institutions 2011 42
Patients Extubated
lt6hrs(CABG Only)
n=236
plt001 compared to JHH Period 1 Ŧ plt001 compared to JHH Period 2 Fitch ZW Debesa O Ohkuma R et al
J Thorac Cardiovasc Surg 2014 Apr 147(4)1344-50
Results Following Additional Protocol
Changes
12
24
38
51
0
10
20
30
40
50
60
JHH Period 1 (132005-9292009)
JHH Period 2 (1012009-8312011)
JHH Period 3 (912011-6302012)
JHH Period 4 (112014-8152014)
STS Like Institutions 2014
plt001 compared to JHH Period 1 Ŧ plt001 compared to JHH Period 2
n=236
n=637
n=1174
n=236
Ŧ
Patients Extubated
lt6hrs(CABG Only)
Extubation lt 6 Hours Current
Performance 2014
September 12 2016 50
CVSICU Reasons For
Extubation gt6h
Hemodynamic Instability4 Hypoxia
3CVA or delirium
5
Bleeding20
Open chest ECMO17
Metabolic Acidosis28
Other23
CVSICU Arrival Temp
1215
5
137
14 13 11 11 10 118
0
20
40
60
80
100
Jul15 Aug15 Sep15 Oct15 Nov15 Dec15 Jan16 Feb16 Mar16 Apr16 May16 Jun16
Temp gt35
Temp lt 350
0
2
4
6
8
10
12
14
16
18
2013 n=390
2014 n=348
2015 n=469
Q1-2016 n=110
Isolated CAB Morbidity
Failed to Prescribe All Eligible
Medications for Isolated CAB
54
If you donrsquot know your performance
you are not doing as well as you think you are
Intervention ndash PCR testing
bull Preoperative PCR testing for MRSA
ndash Nasal swab by PAs on preop visit
bull If positive
ndash Intranasal mupirocin bid
ndash Chlorhexidine baths
bull Both for 5 days (or as many days as possible preop
full course completed in ICU if necessary)
Overall SSI in CABG Patients
05 005
37
265
0
1
2
3
4
5
Pre-Intervention (n=1357) Intervention (n=1990)
Non-MRSA
MRSA42
27
Perc
enta
ge o
f C
AB
G p
atients
Un-adjusted Adjusted
OR 95 CI p-value OR 95 CI p-value
Intervention Era 064 044 093 002 058 040 086 0007
MRSA ICU Admissions
26
14
0
1
2
3
Pre-Intervention (n=2826) Intervention (n=4038)
Perc
enta
ge o
f IC
U A
dm
issio
ns
MRSA-Positive on ICU Admission
Univariate Multivariate
OR 95 CI p-value OR 95 CI p-value
Intervention Era 05 037 074 lt0001 05 037 076 lt0001
MRSA ICU Admissions
10
26
04
0
1
2
3
Pre-Intervention (n=2826) Intervention (n=4038)
Perc
enta
ge o
f IC
U A
dm
issio
ns
No PCR
PCR Screened
14
MRSA-Positive on ICU Admission
Univariate Multivariate
OR 95 CI p-value OR 95 CI p-value
Intervention Era 05 037 074 lt0001 05 037 076 lt0001
MRSA ICU Transmission
Adjusted Poisson Regression MRSA transmissions
aIRR 95 CI P
Intervention era 029 013 065 0002
16
04
00
02
04
06
08
10
12
14
16
18
Pre-Intervention(14733 pt days)
Intervention(21467 pt days)
Incid
ence R
ate
per
1000 p
tdays
Staph Screening Miss CategoriesJuly 2016
September 12 2016 60
1
2
2
3Transfer
True Miss
gt45 Days
Discontinued
Group but not Individual
Accountability
September 12 2016 61
65
74
81
71
87 8892
0
10
20
30
40
50
60
70
80
90
100
2009 2010 2011 2012 2013 2014 2015 (Jan-March)
CVSICU Hand Hygiene Compliance by Year
45
67
89
10
11
12
13
14
15
Hg
b(g
md
L)
1 2 3 4 5 6 7 8 9 10 11 12 1314 15 16 17 18 19 2021 22 23 24 25
Week
All Surgeons Combined
Weekly Transfusions with Corresponding Hgb for All
Procedures
Period 1 Period 2
45
67
89
10
11
12
13
14
15
Hg
b(g
msd
L)
1 2 3 4 5 6 7 8 9 10 11 12131415 16171819 20212223 24 25
Week
For a Single Surgeon
Weekly Transfusions with Corresponding Hgb for All
Procedures
Period 1 Period 2 Period 3
45
67
89
10
11
12
13
14
15
Hg
b(g
md
L)
1 2 3 4 5 6 7 8 9 10 11 12 1314 15 16 17 18 19 2021 22 23 24 25
Week
All Surgeons Combined
Weekly Transfusions with Corresponding Hgb for All
Procedures
Period 1 Period 2 Period 3
02
04
06
0
Tra
nsfu
sed
(
)
Period 1 Period 2 Period 3
Percent of Transfusions at Increasing Hgb
Thresholds All Surgeons Combined
above Hgb of 8 gmdL
above Hgb of 9 gmdL
above Hgb of 10 gmdL
Denotes significantly different than period 1
Denotes significantly different than period 2
Monthly Cardiac Surgery Dashboard
bull Vent Times
bull Reasons for ext gt 6 hrs
bull iNO vs Veletri hrs
bull HyperHypo glycemia
bull Checklist Compliance
bull Staph screening (with reasons
for misses)
bull Blood Utilization
bull CVSICU arrival
bull K+
bull Temp
bull Base Deficit
bull Daily Weights
bull Transfers gt 6 pm
bull Bouncebacks (Total lt 24 hrs)
with Reasons)
September 12 2016 66
And Weekly Mortality and Morbidity
The Johns Hopkins Cardiac Surgery
Code of Conduct and Professional Behavior
September 12 2016 68
Critical Care of the Cardiovascular PatientThe essentials for high quality
1 Full time intensivists
2 Structured Multi-D rounds (Pharmacy)
3 Nurse readbacks
4 Checklists
5 Culture of safetyteamwork (CUSP)
6 Performance improvement requires
bull Multidisciplinary input
bull Agreed upon targets
bull Review of outcomes
bull Continual reassessment
6 Individual accountability matters
Isolated CABG
Post Op Morbidities
0
2
4
6
8
10
12
14
16
18
ANY MORBIDITY(Total)
ProlongedVentilation
MultipleMorbidities
Reoperation Renal Failure CerebrovascularAccident
Deep SternalWound
Mediastinitis
2014 Jan 1 ndash Jun 30
bull Universal public reporting is inevitable
bull ICU care plays a major role in patient
outcomes
September 12 2016 70
Surgeon-Reported Conflicts with Intensivists About
Postoperative Goals of Care
JAMA Surg 201314829-35
bull Vascular Neurologic and
Cardiothoracic Surgeons
bull Mail Questionnaire
bull 56 response rate n = 2100
September 12 2016 71
Rates of Surgeon Reported ConflictsJAMA Surg 201314829-35
September 12 2016 72
0
1
2
3
4
1 2 3 4 5 6 7 8 9 10
Institution
Count of Cardiac Surg
Count of Gen Surg CC
Count of Card Surg CC
Count of Anesth
Count of Anesth CC
Count of Cardiac Anesth
Count of Card Anesth CC
Count of Pulm CC
radic
radic
radic
radic
radic
radic
radic
radic
radic
radic
radic = CT trained
Heterogeneity of Specialties in Cardiac
Intensive Care Units
446537
556
75
889
1943
0 - 6 hrs 6 - 9 hrs 9 - 12 hrs 12 - 18 hrs 18 - 24 hrs gt 24 hrs
ICU
Sta
y(h
rs)
me
an
plusmnS
D
Intubation Duration
p lt 001
p = 070
p = 005
Unadjusted ICU Length of Stay
67 7
8
85
13
0 - 6 hrs 6 - 9 hrs 9 - 12 hrs 12 - 18 hrs 18 - 24 hrs gt 24 hrs
Hospital S
tay
(days)
media
n
(IQ
R)
Intubation Duration
p lt 001
p lt 001
p lt 001
Unadjusted Hospital Length of Stay
Multidisciplinary Teams
Physician Nurse and ge 1 more Health Care
Professional
of Patients with Infection by
RBC Units Transfused2
7
26 3
2
44
90
12
5
21 2
6
26
39
70
12
5
03
00 02 03
17
11
06
00 04 05 1
0
00
0 1 2 3-5 6-9 10+
Overall Infection Pneumonia Sepsis SSI
Total Number of RBC units Transfused
o
f p
ati
en
ts w
ith
In
fecti
on
significantly different (plt005) compared to no RBC exposure
Relationship between Infection
and Ventilation Time1
7
43 46
24
1
13
36 39
20
9
01
02 07
35
04
05
00
23
0-12 12-24 24-48 48+
Ventilation Time vs Infection ()
Overall Infection Pneumonia Sepsis SSI
Length of Mechanical Ventilation (hrs)
P
ati
en
ts w
ith
Infe
cti
on
by T
yp
e
Note 48 of all infections occurred in patients with 48+ hours ventilation
significantly different (plt005) compared to vent time lt12 hrs group
Isolated CABG
Post Op Morbidities
0
2
4
6
8
10
12
14
16
18
ANY MORBIDITY(Total)
ProlongedVentilation
MultipleMorbidities
Reoperation Renal Failure CerebrovascularAccident
Deep SternalWound
Mediastinitis
2013
2014
n= 390
n= 181
2014 Jan 1 ndash Jun 30
2013 and 2014
The Tenets of CUSP
bull Step 1 Safety Attitude Questionnaire (SAQ)
bull Step 2 Educate re Science of Improving
bull Step 3 Identify Defects ( events that should
not recur)
bull Step 4 Executive Partnership to ldquoBridge the
Gaprdquo
bull Step 5 Choose a Defect each Month that
poses a hazard
bull Step 6 ReassessSeptember 12 2016 80
Patients with BD lt -4 and
K lt 33 by Month
21
01
2
0 0
6
01
2
00
5
10
15
20
25
30
35
40
Jul15 Aug15 Sep15 Oct15 Nov15 Dec15 Jan16 Feb16 Mar16 Apr16 May16 Jun16
Quality Improvement
- Insight regarding what metric to target
- A sense of comfort to embark upon
new initiatives
- Involves ability to create consensus
September 12 2016 83
45
67
89
10
11
12
13
14
15
Hg
b(g
md
L)
1 2 3 4 5 6 7 8 9 10 11 12131415161718192021222324 25
Week
All Surgeons Combined
Weekly Transfusions with Corresponding Hgb for
CABG Patients
Period 1 Period 2 Period 3
02
04
06
0
Tra
nsfu
sed
(
)
Period 1 Period 2 Period 3
Percent of Transfusions at Increasing Hgb
Thresholds All Surgeons Combined
above Hgb of 8 gmdL
above Hgb of 9 gmdL
above Hgb of 10 gmdL
Denotes significantly different than period 1
Denotes significantly different than period 2
Conclusion
bull Though recognizing that this is as yet untested the
perspective that comes with cardiothoracic surgical
training and practice best addresses the above
issues which face every cardiothoracic surgical team
and ICU
As a result thoracic surgeons
bull Should be the directors of the CTICU and
bull Should play an integral part in the delivery of day to day ICU
care
September 12 2016 86
9122016 87
Procedure groups for which models exist bull Isolated CABG (CAB)
bull Isolated Aortic Valve Replacement (AVRepl)
bull Aortic Valve Replacement and CABG (AVRepl+CAB)
bull Isolated Mitral Valve Replacement (MVRepl)
bull Mitral Valve Replacement and CABG (MVRepl+CAB)
bull Isolated Mitral Valve Repair (MVRepr)
bull Mitral Valve Repair and CABG (MVRepr+CAB)
Model endpoints bull Operative Mortality
bull Stroke
bull Renal Failure
bull Prolonged Ventilation
bull Deep Sternal Wound Infection
bull Reoperation
bull MortalityMorbidity combined endpoint (any of the 6 previous endpoints)
bull Prolonged length of stay (length of stay gt14 days)
bull Short length of stay (length of stay lt 6 days
(Based on roughly 27 million patients)
Procedures for which the STS
database has a predictive model

0
5
10
15
20
25
30
35
40
1-6 6-12 12-24 24-48 gt48
Infe
cti
on
Rate
Post Op Vent Time (hrs)
Non-PNA Infxn
PNA
Post-Op SSI and PNA Rate in Open Heart
Surgery Patients
Johns Hopkins Hospital 112011 ndash 32014
(n = 2253)
Primary Outcome
Postoperative Overall Infection (n=127)
withwithout Vent time adjusted
Odds of
Infection
(95CI)
Without Vent
Timep-value
With Vent
Timep-value
Intraop + Postop
Transfusion
RBC
(unit)11(10-12) 004 10(09-11) 076
FFP 13 (08-22) 026 11(06-18) 081
Platelet 08(05-13) 034 08(05-14) 048
Cryo 12 (06-25) 060 12(04-32) 078
Preop
WBC11(10-11) lt0001 105(10-11) 0001
Preop
COPD33(22-50) lt0001 26(16-43) lt0001
Preop Crgt
15mgdL17(10-27) 004 134(08-22) 026
Adjusted variables were blood products previous cardiac surgery preoperative WBC value heart failure within 2 weeks prior to
surgery preoperative COPD preoperative serum creatinine CPB time and surgery type vs isolated CABG and postoperative
ventilation time Only values lt 005 are shown except for transfusions
1
25 26
147
0
2
4
6
8
10
12
14
16
0-12 12-24 24-48 48+O
dd
s o
f o
ve
rall
In
fec
tio
n
Postoperative Ventilation Time (hours)
ref
p=003p=0004
plt0001
0
5
10
15
20
25
30
35
JHH2008
STS Like2008
STS National2008
Patients Extubated lt6hrs
(CABG Only)
Early Extubation Performance at the
Johns Hopkins Hospital - 2008
0
5
10
15
20
25
30
35
40
45
50
JHH Period 1(132005-9292009)
JHH Period 2(1012009-8312011)
Patients Extubated
lt6hrs (CABG Only)
n= 1174
n= 637
STS National Average 2009 37
STS Like Institutions 2009 32
plt001 compared to JHH Period 1
Pre vs Post Implementation of New MV
Weaning Protocol
A Bow Around Your Finger
0
5
10
15
20
25
30
35
40
45
50
JHH Period 1(132005-9292009)
JHH Period 2(1012009-8312011)
JHH Period 3(912011-6302012)
n=1174
n=637
Ŧ
STS National Average 2011 40
STS Like Institutions 2011 42
Patients Extubated
lt6hrs(CABG Only)
n=236
plt001 compared to JHH Period 1 Ŧ plt001 compared to JHH Period 2 Fitch ZW Debesa O Ohkuma R et al
J Thorac Cardiovasc Surg 2014 Apr 147(4)1344-50
Results Following Additional Protocol
Changes
12
24
38
51
0
10
20
30
40
50
60
JHH Period 1 (132005-9292009)
JHH Period 2 (1012009-8312011)
JHH Period 3 (912011-6302012)
JHH Period 4 (112014-8152014)
STS Like Institutions 2014
plt001 compared to JHH Period 1 Ŧ plt001 compared to JHH Period 2
n=236
n=637
n=1174
n=236
Ŧ
Patients Extubated
lt6hrs(CABG Only)
Extubation lt 6 Hours Current
Performance 2014
September 12 2016 50
CVSICU Reasons For
Extubation gt6h
Hemodynamic Instability4 Hypoxia
3CVA or delirium
5
Bleeding20
Open chest ECMO17
Metabolic Acidosis28
Other23
CVSICU Arrival Temp
1215
5
137
14 13 11 11 10 118
0
20
40
60
80
100
Jul15 Aug15 Sep15 Oct15 Nov15 Dec15 Jan16 Feb16 Mar16 Apr16 May16 Jun16
Temp gt35
Temp lt 350
0
2
4
6
8
10
12
14
16
18
2013 n=390
2014 n=348
2015 n=469
Q1-2016 n=110
Isolated CAB Morbidity
Failed to Prescribe All Eligible
Medications for Isolated CAB
54
If you donrsquot know your performance
you are not doing as well as you think you are
Intervention ndash PCR testing
bull Preoperative PCR testing for MRSA
ndash Nasal swab by PAs on preop visit
bull If positive
ndash Intranasal mupirocin bid
ndash Chlorhexidine baths
bull Both for 5 days (or as many days as possible preop
full course completed in ICU if necessary)
Overall SSI in CABG Patients
05 005
37
265
0
1
2
3
4
5
Pre-Intervention (n=1357) Intervention (n=1990)
Non-MRSA
MRSA42
27
Perc
enta
ge o
f C
AB
G p
atients
Un-adjusted Adjusted
OR 95 CI p-value OR 95 CI p-value
Intervention Era 064 044 093 002 058 040 086 0007
MRSA ICU Admissions
26
14
0
1
2
3
Pre-Intervention (n=2826) Intervention (n=4038)
Perc
enta
ge o
f IC
U A
dm
issio
ns
MRSA-Positive on ICU Admission
Univariate Multivariate
OR 95 CI p-value OR 95 CI p-value
Intervention Era 05 037 074 lt0001 05 037 076 lt0001
MRSA ICU Admissions
10
26
04
0
1
2
3
Pre-Intervention (n=2826) Intervention (n=4038)
Perc
enta
ge o
f IC
U A
dm
issio
ns
No PCR
PCR Screened
14
MRSA-Positive on ICU Admission
Univariate Multivariate
OR 95 CI p-value OR 95 CI p-value
Intervention Era 05 037 074 lt0001 05 037 076 lt0001
MRSA ICU Transmission
Adjusted Poisson Regression MRSA transmissions
aIRR 95 CI P
Intervention era 029 013 065 0002
16
04
00
02
04
06
08
10
12
14
16
18
Pre-Intervention(14733 pt days)
Intervention(21467 pt days)
Incid
ence R
ate
per
1000 p
tdays
Staph Screening Miss CategoriesJuly 2016
September 12 2016 60
1
2
2
3Transfer
True Miss
gt45 Days
Discontinued
Group but not Individual
Accountability
September 12 2016 61
65
74
81
71
87 8892
0
10
20
30
40
50
60
70
80
90
100
2009 2010 2011 2012 2013 2014 2015 (Jan-March)
CVSICU Hand Hygiene Compliance by Year
45
67
89
10
11
12
13
14
15
Hg
b(g
md
L)
1 2 3 4 5 6 7 8 9 10 11 12 1314 15 16 17 18 19 2021 22 23 24 25
Week
All Surgeons Combined
Weekly Transfusions with Corresponding Hgb for All
Procedures
Period 1 Period 2
45
67
89
10
11
12
13
14
15
Hg
b(g
msd
L)
1 2 3 4 5 6 7 8 9 10 11 12131415 16171819 20212223 24 25
Week
For a Single Surgeon
Weekly Transfusions with Corresponding Hgb for All
Procedures
Period 1 Period 2 Period 3
45
67
89
10
11
12
13
14
15
Hg
b(g
md
L)
1 2 3 4 5 6 7 8 9 10 11 12 1314 15 16 17 18 19 2021 22 23 24 25
Week
All Surgeons Combined
Weekly Transfusions with Corresponding Hgb for All
Procedures
Period 1 Period 2 Period 3
02
04
06
0
Tra
nsfu
sed
(
)
Period 1 Period 2 Period 3
Percent of Transfusions at Increasing Hgb
Thresholds All Surgeons Combined
above Hgb of 8 gmdL
above Hgb of 9 gmdL
above Hgb of 10 gmdL
Denotes significantly different than period 1
Denotes significantly different than period 2
Monthly Cardiac Surgery Dashboard
bull Vent Times
bull Reasons for ext gt 6 hrs
bull iNO vs Veletri hrs
bull HyperHypo glycemia
bull Checklist Compliance
bull Staph screening (with reasons
for misses)
bull Blood Utilization
bull CVSICU arrival
bull K+
bull Temp
bull Base Deficit
bull Daily Weights
bull Transfers gt 6 pm
bull Bouncebacks (Total lt 24 hrs)
with Reasons)
September 12 2016 66
And Weekly Mortality and Morbidity
The Johns Hopkins Cardiac Surgery
Code of Conduct and Professional Behavior
September 12 2016 68
Critical Care of the Cardiovascular PatientThe essentials for high quality
1 Full time intensivists
2 Structured Multi-D rounds (Pharmacy)
3 Nurse readbacks
4 Checklists
5 Culture of safetyteamwork (CUSP)
6 Performance improvement requires
bull Multidisciplinary input
bull Agreed upon targets
bull Review of outcomes
bull Continual reassessment
6 Individual accountability matters
Isolated CABG
Post Op Morbidities
0
2
4
6
8
10
12
14
16
18
ANY MORBIDITY(Total)
ProlongedVentilation
MultipleMorbidities
Reoperation Renal Failure CerebrovascularAccident
Deep SternalWound
Mediastinitis
2014 Jan 1 ndash Jun 30
bull Universal public reporting is inevitable
bull ICU care plays a major role in patient
outcomes
September 12 2016 70
Surgeon-Reported Conflicts with Intensivists About
Postoperative Goals of Care
JAMA Surg 201314829-35
bull Vascular Neurologic and
Cardiothoracic Surgeons
bull Mail Questionnaire
bull 56 response rate n = 2100
September 12 2016 71
Rates of Surgeon Reported ConflictsJAMA Surg 201314829-35
September 12 2016 72
0
1
2
3
4
1 2 3 4 5 6 7 8 9 10
Institution
Count of Cardiac Surg
Count of Gen Surg CC
Count of Card Surg CC
Count of Anesth
Count of Anesth CC
Count of Cardiac Anesth
Count of Card Anesth CC
Count of Pulm CC
radic
radic
radic
radic
radic
radic
radic
radic
radic
radic
radic = CT trained
Heterogeneity of Specialties in Cardiac
Intensive Care Units
446537
556
75
889
1943
0 - 6 hrs 6 - 9 hrs 9 - 12 hrs 12 - 18 hrs 18 - 24 hrs gt 24 hrs
ICU
Sta
y(h
rs)
me
an
plusmnS
D
Intubation Duration
p lt 001
p = 070
p = 005
Unadjusted ICU Length of Stay
67 7
8
85
13
0 - 6 hrs 6 - 9 hrs 9 - 12 hrs 12 - 18 hrs 18 - 24 hrs gt 24 hrs
Hospital S
tay
(days)
media
n
(IQ
R)
Intubation Duration
p lt 001
p lt 001
p lt 001
Unadjusted Hospital Length of Stay
Multidisciplinary Teams
Physician Nurse and ge 1 more Health Care
Professional
of Patients with Infection by
RBC Units Transfused2
7
26 3
2
44
90
12
5
21 2
6
26
39
70
12
5
03
00 02 03
17
11
06
00 04 05 1
0
00
0 1 2 3-5 6-9 10+
Overall Infection Pneumonia Sepsis SSI
Total Number of RBC units Transfused
o
f p
ati
en
ts w
ith
In
fecti
on
significantly different (plt005) compared to no RBC exposure
Relationship between Infection
and Ventilation Time1
7
43 46
24
1
13
36 39
20
9
01
02 07
35
04
05
00
23
0-12 12-24 24-48 48+
Ventilation Time vs Infection ()
Overall Infection Pneumonia Sepsis SSI
Length of Mechanical Ventilation (hrs)
P
ati
en
ts w
ith
Infe
cti
on
by T
yp
e
Note 48 of all infections occurred in patients with 48+ hours ventilation
significantly different (plt005) compared to vent time lt12 hrs group
Isolated CABG
Post Op Morbidities
0
2
4
6
8
10
12
14
16
18
ANY MORBIDITY(Total)
ProlongedVentilation
MultipleMorbidities
Reoperation Renal Failure CerebrovascularAccident
Deep SternalWound
Mediastinitis
2013
2014
n= 390
n= 181
2014 Jan 1 ndash Jun 30
2013 and 2014
The Tenets of CUSP
bull Step 1 Safety Attitude Questionnaire (SAQ)
bull Step 2 Educate re Science of Improving
bull Step 3 Identify Defects ( events that should
not recur)
bull Step 4 Executive Partnership to ldquoBridge the
Gaprdquo
bull Step 5 Choose a Defect each Month that
poses a hazard
bull Step 6 ReassessSeptember 12 2016 80
Patients with BD lt -4 and
K lt 33 by Month
21
01
2
0 0
6
01
2
00
5
10
15
20
25
30
35
40
Jul15 Aug15 Sep15 Oct15 Nov15 Dec15 Jan16 Feb16 Mar16 Apr16 May16 Jun16
Quality Improvement
- Insight regarding what metric to target
- A sense of comfort to embark upon
new initiatives
- Involves ability to create consensus
September 12 2016 83
45
67
89
10
11
12
13
14
15
Hg
b(g
md
L)
1 2 3 4 5 6 7 8 9 10 11 12131415161718192021222324 25
Week
All Surgeons Combined
Weekly Transfusions with Corresponding Hgb for
CABG Patients
Period 1 Period 2 Period 3
02
04
06
0
Tra
nsfu
sed
(
)
Period 1 Period 2 Period 3
Percent of Transfusions at Increasing Hgb
Thresholds All Surgeons Combined
above Hgb of 8 gmdL
above Hgb of 9 gmdL
above Hgb of 10 gmdL
Denotes significantly different than period 1
Denotes significantly different than period 2
Conclusion
bull Though recognizing that this is as yet untested the
perspective that comes with cardiothoracic surgical
training and practice best addresses the above
issues which face every cardiothoracic surgical team
and ICU
As a result thoracic surgeons
bull Should be the directors of the CTICU and
bull Should play an integral part in the delivery of day to day ICU
care
September 12 2016 86
9122016 87
Procedure groups for which models exist bull Isolated CABG (CAB)
bull Isolated Aortic Valve Replacement (AVRepl)
bull Aortic Valve Replacement and CABG (AVRepl+CAB)
bull Isolated Mitral Valve Replacement (MVRepl)
bull Mitral Valve Replacement and CABG (MVRepl+CAB)
bull Isolated Mitral Valve Repair (MVRepr)
bull Mitral Valve Repair and CABG (MVRepr+CAB)
Model endpoints bull Operative Mortality
bull Stroke
bull Renal Failure
bull Prolonged Ventilation
bull Deep Sternal Wound Infection
bull Reoperation
bull MortalityMorbidity combined endpoint (any of the 6 previous endpoints)
bull Prolonged length of stay (length of stay gt14 days)
bull Short length of stay (length of stay lt 6 days
(Based on roughly 27 million patients)
Procedures for which the STS
database has a predictive model

0
5
10
15
20
25
30
35
40
45
50
JHH Period 1(132005-9292009)
JHH Period 2(1012009-8312011)
Patients Extubated
lt6hrs (CABG Only)
n= 1174
n= 637
STS National Average 2009 37
STS Like Institutions 2009 32
plt001 compared to JHH Period 1
Pre vs Post Implementation of New MV
Weaning Protocol
A Bow Around Your Finger
0
5
10
15
20
25
30
35
40
45
50
JHH Period 1(132005-9292009)
JHH Period 2(1012009-8312011)
JHH Period 3(912011-6302012)
n=1174
n=637
Ŧ
STS National Average 2011 40
STS Like Institutions 2011 42
Patients Extubated
lt6hrs(CABG Only)
n=236
plt001 compared to JHH Period 1 Ŧ plt001 compared to JHH Period 2 Fitch ZW Debesa O Ohkuma R et al
J Thorac Cardiovasc Surg 2014 Apr 147(4)1344-50
Results Following Additional Protocol
Changes
12
24
38
51
0
10
20
30
40
50
60
JHH Period 1 (132005-9292009)
JHH Period 2 (1012009-8312011)
JHH Period 3 (912011-6302012)
JHH Period 4 (112014-8152014)
STS Like Institutions 2014
plt001 compared to JHH Period 1 Ŧ plt001 compared to JHH Period 2
n=236
n=637
n=1174
n=236
Ŧ
Patients Extubated
lt6hrs(CABG Only)
Extubation lt 6 Hours Current
Performance 2014
September 12 2016 50
CVSICU Reasons For
Extubation gt6h
Hemodynamic Instability4 Hypoxia
3CVA or delirium
5
Bleeding20
Open chest ECMO17
Metabolic Acidosis28
Other23
CVSICU Arrival Temp
1215
5
137
14 13 11 11 10 118
0
20
40
60
80
100
Jul15 Aug15 Sep15 Oct15 Nov15 Dec15 Jan16 Feb16 Mar16 Apr16 May16 Jun16
Temp gt35
Temp lt 350
0
2
4
6
8
10
12
14
16
18
2013 n=390
2014 n=348
2015 n=469
Q1-2016 n=110
Isolated CAB Morbidity
Failed to Prescribe All Eligible
Medications for Isolated CAB
54
If you donrsquot know your performance
you are not doing as well as you think you are
Intervention ndash PCR testing
bull Preoperative PCR testing for MRSA
ndash Nasal swab by PAs on preop visit
bull If positive
ndash Intranasal mupirocin bid
ndash Chlorhexidine baths
bull Both for 5 days (or as many days as possible preop
full course completed in ICU if necessary)
Overall SSI in CABG Patients
05 005
37
265
0
1
2
3
4
5
Pre-Intervention (n=1357) Intervention (n=1990)
Non-MRSA
MRSA42
27
Perc
enta
ge o
f C
AB
G p
atients
Un-adjusted Adjusted
OR 95 CI p-value OR 95 CI p-value
Intervention Era 064 044 093 002 058 040 086 0007
MRSA ICU Admissions
26
14
0
1
2
3
Pre-Intervention (n=2826) Intervention (n=4038)
Perc
enta
ge o
f IC
U A
dm
issio
ns
MRSA-Positive on ICU Admission
Univariate Multivariate
OR 95 CI p-value OR 95 CI p-value
Intervention Era 05 037 074 lt0001 05 037 076 lt0001
MRSA ICU Admissions
10
26
04
0
1
2
3
Pre-Intervention (n=2826) Intervention (n=4038)
Perc
enta
ge o
f IC
U A
dm
issio
ns
No PCR
PCR Screened
14
MRSA-Positive on ICU Admission
Univariate Multivariate
OR 95 CI p-value OR 95 CI p-value
Intervention Era 05 037 074 lt0001 05 037 076 lt0001
MRSA ICU Transmission
Adjusted Poisson Regression MRSA transmissions
aIRR 95 CI P
Intervention era 029 013 065 0002
16
04
00
02
04
06
08
10
12
14
16
18
Pre-Intervention(14733 pt days)
Intervention(21467 pt days)
Incid
ence R
ate
per
1000 p
tdays
Staph Screening Miss CategoriesJuly 2016
September 12 2016 60
1
2
2
3Transfer
True Miss
gt45 Days
Discontinued
Group but not Individual
Accountability
September 12 2016 61
65
74
81
71
87 8892
0
10
20
30
40
50
60
70
80
90
100
2009 2010 2011 2012 2013 2014 2015 (Jan-March)
CVSICU Hand Hygiene Compliance by Year
45
67
89
10
11
12
13
14
15
Hg
b(g
md
L)
1 2 3 4 5 6 7 8 9 10 11 12 1314 15 16 17 18 19 2021 22 23 24 25
Week
All Surgeons Combined
Weekly Transfusions with Corresponding Hgb for All
Procedures
Period 1 Period 2
45
67
89
10
11
12
13
14
15
Hg
b(g
msd
L)
1 2 3 4 5 6 7 8 9 10 11 12131415 16171819 20212223 24 25
Week
For a Single Surgeon
Weekly Transfusions with Corresponding Hgb for All
Procedures
Period 1 Period 2 Period 3
45
67
89
10
11
12
13
14
15
Hg
b(g
md
L)
1 2 3 4 5 6 7 8 9 10 11 12 1314 15 16 17 18 19 2021 22 23 24 25
Week
All Surgeons Combined
Weekly Transfusions with Corresponding Hgb for All
Procedures
Period 1 Period 2 Period 3
02
04
06
0
Tra
nsfu
sed
(
)
Period 1 Period 2 Period 3
Percent of Transfusions at Increasing Hgb
Thresholds All Surgeons Combined
above Hgb of 8 gmdL
above Hgb of 9 gmdL
above Hgb of 10 gmdL
Denotes significantly different than period 1
Denotes significantly different than period 2
Monthly Cardiac Surgery Dashboard
bull Vent Times
bull Reasons for ext gt 6 hrs
bull iNO vs Veletri hrs
bull HyperHypo glycemia
bull Checklist Compliance
bull Staph screening (with reasons
for misses)
bull Blood Utilization
bull CVSICU arrival
bull K+
bull Temp
bull Base Deficit
bull Daily Weights
bull Transfers gt 6 pm
bull Bouncebacks (Total lt 24 hrs)
with Reasons)
September 12 2016 66
And Weekly Mortality and Morbidity
The Johns Hopkins Cardiac Surgery
Code of Conduct and Professional Behavior
September 12 2016 68
Critical Care of the Cardiovascular PatientThe essentials for high quality
1 Full time intensivists
2 Structured Multi-D rounds (Pharmacy)
3 Nurse readbacks
4 Checklists
5 Culture of safetyteamwork (CUSP)
6 Performance improvement requires
bull Multidisciplinary input
bull Agreed upon targets
bull Review of outcomes
bull Continual reassessment
6 Individual accountability matters
Isolated CABG
Post Op Morbidities
0
2
4
6
8
10
12
14
16
18
ANY MORBIDITY(Total)
ProlongedVentilation
MultipleMorbidities
Reoperation Renal Failure CerebrovascularAccident
Deep SternalWound
Mediastinitis
2014 Jan 1 ndash Jun 30
bull Universal public reporting is inevitable
bull ICU care plays a major role in patient
outcomes
September 12 2016 70
Surgeon-Reported Conflicts with Intensivists About
Postoperative Goals of Care
JAMA Surg 201314829-35
bull Vascular Neurologic and
Cardiothoracic Surgeons
bull Mail Questionnaire
bull 56 response rate n = 2100
September 12 2016 71
Rates of Surgeon Reported ConflictsJAMA Surg 201314829-35
September 12 2016 72
0
1
2
3
4
1 2 3 4 5 6 7 8 9 10
Institution
Count of Cardiac Surg
Count of Gen Surg CC
Count of Card Surg CC
Count of Anesth
Count of Anesth CC
Count of Cardiac Anesth
Count of Card Anesth CC
Count of Pulm CC
radic
radic
radic
radic
radic
radic
radic
radic
radic
radic
radic = CT trained
Heterogeneity of Specialties in Cardiac
Intensive Care Units
446537
556
75
889
1943
0 - 6 hrs 6 - 9 hrs 9 - 12 hrs 12 - 18 hrs 18 - 24 hrs gt 24 hrs
ICU
Sta
y(h
rs)
me
an
plusmnS
D
Intubation Duration
p lt 001
p = 070
p = 005
Unadjusted ICU Length of Stay
67 7
8
85
13
0 - 6 hrs 6 - 9 hrs 9 - 12 hrs 12 - 18 hrs 18 - 24 hrs gt 24 hrs
Hospital S
tay
(days)
media
n
(IQ
R)
Intubation Duration
p lt 001
p lt 001
p lt 001
Unadjusted Hospital Length of Stay
Multidisciplinary Teams
Physician Nurse and ge 1 more Health Care
Professional
of Patients with Infection by
RBC Units Transfused2
7
26 3
2
44
90
12
5
21 2
6
26
39
70
12
5
03
00 02 03
17
11
06
00 04 05 1
0
00
0 1 2 3-5 6-9 10+
Overall Infection Pneumonia Sepsis SSI
Total Number of RBC units Transfused
o
f p
ati
en
ts w
ith
In
fecti
on
significantly different (plt005) compared to no RBC exposure
Relationship between Infection
and Ventilation Time1
7
43 46
24
1
13
36 39
20
9
01
02 07
35
04
05
00
23
0-12 12-24 24-48 48+
Ventilation Time vs Infection ()
Overall Infection Pneumonia Sepsis SSI
Length of Mechanical Ventilation (hrs)
P
ati
en
ts w
ith
Infe
cti
on
by T
yp
e
Note 48 of all infections occurred in patients with 48+ hours ventilation
significantly different (plt005) compared to vent time lt12 hrs group
Isolated CABG
Post Op Morbidities
0
2
4
6
8
10
12
14
16
18
ANY MORBIDITY(Total)
ProlongedVentilation
MultipleMorbidities
Reoperation Renal Failure CerebrovascularAccident
Deep SternalWound
Mediastinitis
2013
2014
n= 390
n= 181
2014 Jan 1 ndash Jun 30
2013 and 2014
The Tenets of CUSP
bull Step 1 Safety Attitude Questionnaire (SAQ)
bull Step 2 Educate re Science of Improving
bull Step 3 Identify Defects ( events that should
not recur)
bull Step 4 Executive Partnership to ldquoBridge the
Gaprdquo
bull Step 5 Choose a Defect each Month that
poses a hazard
bull Step 6 ReassessSeptember 12 2016 80
Patients with BD lt -4 and
K lt 33 by Month
21
01
2
0 0
6
01
2
00
5
10
15
20
25
30
35
40
Jul15 Aug15 Sep15 Oct15 Nov15 Dec15 Jan16 Feb16 Mar16 Apr16 May16 Jun16
Quality Improvement
- Insight regarding what metric to target
- A sense of comfort to embark upon
new initiatives
- Involves ability to create consensus
September 12 2016 83
45
67
89
10
11
12
13
14
15
Hg
b(g
md
L)
1 2 3 4 5 6 7 8 9 10 11 12131415161718192021222324 25
Week
All Surgeons Combined
Weekly Transfusions with Corresponding Hgb for
CABG Patients
Period 1 Period 2 Period 3
02
04
06
0
Tra
nsfu
sed
(
)
Period 1 Period 2 Period 3
Percent of Transfusions at Increasing Hgb
Thresholds All Surgeons Combined
above Hgb of 8 gmdL
above Hgb of 9 gmdL
above Hgb of 10 gmdL
Denotes significantly different than period 1
Denotes significantly different than period 2
Conclusion
bull Though recognizing that this is as yet untested the
perspective that comes with cardiothoracic surgical
training and practice best addresses the above
issues which face every cardiothoracic surgical team
and ICU
As a result thoracic surgeons
bull Should be the directors of the CTICU and
bull Should play an integral part in the delivery of day to day ICU
care
September 12 2016 86
9122016 87
Procedure groups for which models exist bull Isolated CABG (CAB)
bull Isolated Aortic Valve Replacement (AVRepl)
bull Aortic Valve Replacement and CABG (AVRepl+CAB)
bull Isolated Mitral Valve Replacement (MVRepl)
bull Mitral Valve Replacement and CABG (MVRepl+CAB)
bull Isolated Mitral Valve Repair (MVRepr)
bull Mitral Valve Repair and CABG (MVRepr+CAB)
Model endpoints bull Operative Mortality
bull Stroke
bull Renal Failure
bull Prolonged Ventilation
bull Deep Sternal Wound Infection
bull Reoperation
bull MortalityMorbidity combined endpoint (any of the 6 previous endpoints)
bull Prolonged length of stay (length of stay gt14 days)
bull Short length of stay (length of stay lt 6 days
(Based on roughly 27 million patients)
Procedures for which the STS
database has a predictive model

0
5
10
15
20
25
30
35
40
45
50
JHH Period 1(132005-9292009)
JHH Period 2(1012009-8312011)
JHH Period 3(912011-6302012)
n=1174
n=637
Ŧ
STS National Average 2011 40
STS Like Institutions 2011 42
Patients Extubated
lt6hrs(CABG Only)
n=236
plt001 compared to JHH Period 1 Ŧ plt001 compared to JHH Period 2 Fitch ZW Debesa O Ohkuma R et al
J Thorac Cardiovasc Surg 2014 Apr 147(4)1344-50
Results Following Additional Protocol
Changes
12
24
38
51
0
10
20
30
40
50
60
JHH Period 1 (132005-9292009)
JHH Period 2 (1012009-8312011)
JHH Period 3 (912011-6302012)
JHH Period 4 (112014-8152014)
STS Like Institutions 2014
plt001 compared to JHH Period 1 Ŧ plt001 compared to JHH Period 2
n=236
n=637
n=1174
n=236
Ŧ
Patients Extubated
lt6hrs(CABG Only)
Extubation lt 6 Hours Current
Performance 2014
September 12 2016 50
CVSICU Reasons For
Extubation gt6h
Hemodynamic Instability4 Hypoxia
3CVA or delirium
5
Bleeding20
Open chest ECMO17
Metabolic Acidosis28
Other23
CVSICU Arrival Temp
1215
5
137
14 13 11 11 10 118
0
20
40
60
80
100
Jul15 Aug15 Sep15 Oct15 Nov15 Dec15 Jan16 Feb16 Mar16 Apr16 May16 Jun16
Temp gt35
Temp lt 350
0
2
4
6
8
10
12
14
16
18
2013 n=390
2014 n=348
2015 n=469
Q1-2016 n=110
Isolated CAB Morbidity
Failed to Prescribe All Eligible
Medications for Isolated CAB
54
If you donrsquot know your performance
you are not doing as well as you think you are
Intervention ndash PCR testing
bull Preoperative PCR testing for MRSA
ndash Nasal swab by PAs on preop visit
bull If positive
ndash Intranasal mupirocin bid
ndash Chlorhexidine baths
bull Both for 5 days (or as many days as possible preop
full course completed in ICU if necessary)
Overall SSI in CABG Patients
05 005
37
265
0
1
2
3
4
5
Pre-Intervention (n=1357) Intervention (n=1990)
Non-MRSA
MRSA42
27
Perc
enta
ge o
f C
AB
G p
atients
Un-adjusted Adjusted
OR 95 CI p-value OR 95 CI p-value
Intervention Era 064 044 093 002 058 040 086 0007
MRSA ICU Admissions
26
14
0
1
2
3
Pre-Intervention (n=2826) Intervention (n=4038)
Perc
enta
ge o
f IC
U A
dm
issio
ns
MRSA-Positive on ICU Admission
Univariate Multivariate
OR 95 CI p-value OR 95 CI p-value
Intervention Era 05 037 074 lt0001 05 037 076 lt0001
MRSA ICU Admissions
10
26
04
0
1
2
3
Pre-Intervention (n=2826) Intervention (n=4038)
Perc
enta
ge o
f IC
U A
dm
issio
ns
No PCR
PCR Screened
14
MRSA-Positive on ICU Admission
Univariate Multivariate
OR 95 CI p-value OR 95 CI p-value
Intervention Era 05 037 074 lt0001 05 037 076 lt0001
MRSA ICU Transmission
Adjusted Poisson Regression MRSA transmissions
aIRR 95 CI P
Intervention era 029 013 065 0002
16
04
00
02
04
06
08
10
12
14
16
18
Pre-Intervention(14733 pt days)
Intervention(21467 pt days)
Incid
ence R
ate
per
1000 p
tdays
Staph Screening Miss CategoriesJuly 2016
September 12 2016 60
1
2
2
3Transfer
True Miss
gt45 Days
Discontinued
Group but not Individual
Accountability
September 12 2016 61
65
74
81
71
87 8892
0
10
20
30
40
50
60
70
80
90
100
2009 2010 2011 2012 2013 2014 2015 (Jan-March)
CVSICU Hand Hygiene Compliance by Year
45
67
89
10
11
12
13
14
15
Hg
b(g
md
L)
1 2 3 4 5 6 7 8 9 10 11 12 1314 15 16 17 18 19 2021 22 23 24 25
Week
All Surgeons Combined
Weekly Transfusions with Corresponding Hgb for All
Procedures
Period 1 Period 2
45
67
89
10
11
12
13
14
15
Hg
b(g
msd
L)
1 2 3 4 5 6 7 8 9 10 11 12131415 16171819 20212223 24 25
Week
For a Single Surgeon
Weekly Transfusions with Corresponding Hgb for All
Procedures
Period 1 Period 2 Period 3
45
67
89
10
11
12
13
14
15
Hg
b(g
md
L)
1 2 3 4 5 6 7 8 9 10 11 12 1314 15 16 17 18 19 2021 22 23 24 25
Week
All Surgeons Combined
Weekly Transfusions with Corresponding Hgb for All
Procedures
Period 1 Period 2 Period 3
02
04
06
0
Tra
nsfu
sed
(
)
Period 1 Period 2 Period 3
Percent of Transfusions at Increasing Hgb
Thresholds All Surgeons Combined
above Hgb of 8 gmdL
above Hgb of 9 gmdL
above Hgb of 10 gmdL
Denotes significantly different than period 1
Denotes significantly different than period 2
Monthly Cardiac Surgery Dashboard
bull Vent Times
bull Reasons for ext gt 6 hrs
bull iNO vs Veletri hrs
bull HyperHypo glycemia
bull Checklist Compliance
bull Staph screening (with reasons
for misses)
bull Blood Utilization
bull CVSICU arrival
bull K+
bull Temp
bull Base Deficit
bull Daily Weights
bull Transfers gt 6 pm
bull Bouncebacks (Total lt 24 hrs)
with Reasons)
September 12 2016 66
And Weekly Mortality and Morbidity
The Johns Hopkins Cardiac Surgery
Code of Conduct and Professional Behavior
September 12 2016 68
Critical Care of the Cardiovascular PatientThe essentials for high quality
1 Full time intensivists
2 Structured Multi-D rounds (Pharmacy)
3 Nurse readbacks
4 Checklists
5 Culture of safetyteamwork (CUSP)
6 Performance improvement requires
bull Multidisciplinary input
bull Agreed upon targets
bull Review of outcomes
bull Continual reassessment
6 Individual accountability matters
Isolated CABG
Post Op Morbidities
0
2
4
6
8
10
12
14
16
18
ANY MORBIDITY(Total)
ProlongedVentilation
MultipleMorbidities
Reoperation Renal Failure CerebrovascularAccident
Deep SternalWound
Mediastinitis
2014 Jan 1 ndash Jun 30
bull Universal public reporting is inevitable
bull ICU care plays a major role in patient
outcomes
September 12 2016 70
Surgeon-Reported Conflicts with Intensivists About
Postoperative Goals of Care
JAMA Surg 201314829-35
bull Vascular Neurologic and
Cardiothoracic Surgeons
bull Mail Questionnaire
bull 56 response rate n = 2100
September 12 2016 71
Rates of Surgeon Reported ConflictsJAMA Surg 201314829-35
September 12 2016 72
0
1
2
3
4
1 2 3 4 5 6 7 8 9 10
Institution
Count of Cardiac Surg
Count of Gen Surg CC
Count of Card Surg CC
Count of Anesth
Count of Anesth CC
Count of Cardiac Anesth
Count of Card Anesth CC
Count of Pulm CC
radic
radic
radic
radic
radic
radic
radic
radic
radic
radic
radic = CT trained
Heterogeneity of Specialties in Cardiac
Intensive Care Units
446537
556
75
889
1943
0 - 6 hrs 6 - 9 hrs 9 - 12 hrs 12 - 18 hrs 18 - 24 hrs gt 24 hrs
ICU
Sta
y(h
rs)
me
an
plusmnS
D
Intubation Duration
p lt 001
p = 070
p = 005
Unadjusted ICU Length of Stay
67 7
8
85
13
0 - 6 hrs 6 - 9 hrs 9 - 12 hrs 12 - 18 hrs 18 - 24 hrs gt 24 hrs
Hospital S
tay
(days)
media
n
(IQ
R)
Intubation Duration
p lt 001
p lt 001
p lt 001
Unadjusted Hospital Length of Stay
Multidisciplinary Teams
Physician Nurse and ge 1 more Health Care
Professional
of Patients with Infection by
RBC Units Transfused2
7
26 3
2
44
90
12
5
21 2
6
26
39
70
12
5
03
00 02 03
17
11
06
00 04 05 1
0
00
0 1 2 3-5 6-9 10+
Overall Infection Pneumonia Sepsis SSI
Total Number of RBC units Transfused
o
f p
ati
en
ts w
ith
In
fecti
on
significantly different (plt005) compared to no RBC exposure
Relationship between Infection
and Ventilation Time1
7
43 46
24
1
13
36 39
20
9
01
02 07
35
04
05
00
23
0-12 12-24 24-48 48+
Ventilation Time vs Infection ()
Overall Infection Pneumonia Sepsis SSI
Length of Mechanical Ventilation (hrs)
P
ati
en
ts w
ith
Infe
cti
on
by T
yp
e
Note 48 of all infections occurred in patients with 48+ hours ventilation
significantly different (plt005) compared to vent time lt12 hrs group
Isolated CABG
Post Op Morbidities
0
2
4
6
8
10
12
14
16
18
ANY MORBIDITY(Total)
ProlongedVentilation
MultipleMorbidities
Reoperation Renal Failure CerebrovascularAccident
Deep SternalWound
Mediastinitis
2013
2014
n= 390
n= 181
2014 Jan 1 ndash Jun 30
2013 and 2014
The Tenets of CUSP
bull Step 1 Safety Attitude Questionnaire (SAQ)
bull Step 2 Educate re Science of Improving
bull Step 3 Identify Defects ( events that should
not recur)
bull Step 4 Executive Partnership to ldquoBridge the
Gaprdquo
bull Step 5 Choose a Defect each Month that
poses a hazard
bull Step 6 ReassessSeptember 12 2016 80
Patients with BD lt -4 and
K lt 33 by Month
21
01
2
0 0
6
01
2
00
5
10
15
20
25
30
35
40
Jul15 Aug15 Sep15 Oct15 Nov15 Dec15 Jan16 Feb16 Mar16 Apr16 May16 Jun16
Quality Improvement
- Insight regarding what metric to target
- A sense of comfort to embark upon
new initiatives
- Involves ability to create consensus
September 12 2016 83
45
67
89
10
11
12
13
14
15
Hg
b(g
md
L)
1 2 3 4 5 6 7 8 9 10 11 12131415161718192021222324 25
Week
All Surgeons Combined
Weekly Transfusions with Corresponding Hgb for
CABG Patients
Period 1 Period 2 Period 3
02
04
06
0
Tra
nsfu
sed
(
)
Period 1 Period 2 Period 3
Percent of Transfusions at Increasing Hgb
Thresholds All Surgeons Combined
above Hgb of 8 gmdL
above Hgb of 9 gmdL
above Hgb of 10 gmdL
Denotes significantly different than period 1
Denotes significantly different than period 2
Conclusion
bull Though recognizing that this is as yet untested the
perspective that comes with cardiothoracic surgical
training and practice best addresses the above
issues which face every cardiothoracic surgical team
and ICU
As a result thoracic surgeons
bull Should be the directors of the CTICU and
bull Should play an integral part in the delivery of day to day ICU
care
September 12 2016 86
9122016 87
Procedure groups for which models exist bull Isolated CABG (CAB)
bull Isolated Aortic Valve Replacement (AVRepl)
bull Aortic Valve Replacement and CABG (AVRepl+CAB)
bull Isolated Mitral Valve Replacement (MVRepl)
bull Mitral Valve Replacement and CABG (MVRepl+CAB)
bull Isolated Mitral Valve Repair (MVRepr)
bull Mitral Valve Repair and CABG (MVRepr+CAB)
Model endpoints bull Operative Mortality
bull Stroke
bull Renal Failure
bull Prolonged Ventilation
bull Deep Sternal Wound Infection
bull Reoperation
bull MortalityMorbidity combined endpoint (any of the 6 previous endpoints)
bull Prolonged length of stay (length of stay gt14 days)
bull Short length of stay (length of stay lt 6 days
(Based on roughly 27 million patients)
Procedures for which the STS
database has a predictive model

12
24
38
51
0
10
20
30
40
50
60
JHH Period 1 (132005-9292009)
JHH Period 2 (1012009-8312011)
JHH Period 3 (912011-6302012)
JHH Period 4 (112014-8152014)
STS Like Institutions 2014
plt001 compared to JHH Period 1 Ŧ plt001 compared to JHH Period 2
n=236
n=637
n=1174
n=236
Ŧ
Patients Extubated
lt6hrs(CABG Only)
Extubation lt 6 Hours Current
Performance 2014
September 12 2016 50
CVSICU Reasons For
Extubation gt6h
Hemodynamic Instability4 Hypoxia
3CVA or delirium
5
Bleeding20
Open chest ECMO17
Metabolic Acidosis28
Other23
CVSICU Arrival Temp
1215
5
137
14 13 11 11 10 118
0
20
40
60
80
100
Jul15 Aug15 Sep15 Oct15 Nov15 Dec15 Jan16 Feb16 Mar16 Apr16 May16 Jun16
Temp gt35
Temp lt 350
0
2
4
6
8
10
12
14
16
18
2013 n=390
2014 n=348
2015 n=469
Q1-2016 n=110
Isolated CAB Morbidity
Failed to Prescribe All Eligible
Medications for Isolated CAB
54
If you donrsquot know your performance
you are not doing as well as you think you are
Intervention ndash PCR testing
bull Preoperative PCR testing for MRSA
ndash Nasal swab by PAs on preop visit
bull If positive
ndash Intranasal mupirocin bid
ndash Chlorhexidine baths
bull Both for 5 days (or as many days as possible preop
full course completed in ICU if necessary)
Overall SSI in CABG Patients
05 005
37
265
0
1
2
3
4
5
Pre-Intervention (n=1357) Intervention (n=1990)
Non-MRSA
MRSA42
27
Perc
enta
ge o
f C
AB
G p
atients
Un-adjusted Adjusted
OR 95 CI p-value OR 95 CI p-value
Intervention Era 064 044 093 002 058 040 086 0007
MRSA ICU Admissions
26
14
0
1
2
3
Pre-Intervention (n=2826) Intervention (n=4038)
Perc
enta
ge o
f IC
U A
dm
issio
ns
MRSA-Positive on ICU Admission
Univariate Multivariate
OR 95 CI p-value OR 95 CI p-value
Intervention Era 05 037 074 lt0001 05 037 076 lt0001
MRSA ICU Admissions
10
26
04
0
1
2
3
Pre-Intervention (n=2826) Intervention (n=4038)
Perc
enta
ge o
f IC
U A
dm
issio
ns
No PCR
PCR Screened
14
MRSA-Positive on ICU Admission
Univariate Multivariate
OR 95 CI p-value OR 95 CI p-value
Intervention Era 05 037 074 lt0001 05 037 076 lt0001
MRSA ICU Transmission
Adjusted Poisson Regression MRSA transmissions
aIRR 95 CI P
Intervention era 029 013 065 0002
16
04
00
02
04
06
08
10
12
14
16
18
Pre-Intervention(14733 pt days)
Intervention(21467 pt days)
Incid
ence R
ate
per
1000 p
tdays
Staph Screening Miss CategoriesJuly 2016
September 12 2016 60
1
2
2
3Transfer
True Miss
gt45 Days
Discontinued
Group but not Individual
Accountability
September 12 2016 61
65
74
81
71
87 8892
0
10
20
30
40
50
60
70
80
90
100
2009 2010 2011 2012 2013 2014 2015 (Jan-March)
CVSICU Hand Hygiene Compliance by Year
45
67
89
10
11
12
13
14
15
Hg
b(g
md
L)
1 2 3 4 5 6 7 8 9 10 11 12 1314 15 16 17 18 19 2021 22 23 24 25
Week
All Surgeons Combined
Weekly Transfusions with Corresponding Hgb for All
Procedures
Period 1 Period 2
45
67
89
10
11
12
13
14
15
Hg
b(g
msd
L)
1 2 3 4 5 6 7 8 9 10 11 12131415 16171819 20212223 24 25
Week
For a Single Surgeon
Weekly Transfusions with Corresponding Hgb for All
Procedures
Period 1 Period 2 Period 3
45
67
89
10
11
12
13
14
15
Hg
b(g
md
L)
1 2 3 4 5 6 7 8 9 10 11 12 1314 15 16 17 18 19 2021 22 23 24 25
Week
All Surgeons Combined
Weekly Transfusions with Corresponding Hgb for All
Procedures
Period 1 Period 2 Period 3
02
04
06
0
Tra
nsfu
sed
(
)
Period 1 Period 2 Period 3
Percent of Transfusions at Increasing Hgb
Thresholds All Surgeons Combined
above Hgb of 8 gmdL
above Hgb of 9 gmdL
above Hgb of 10 gmdL
Denotes significantly different than period 1
Denotes significantly different than period 2
Monthly Cardiac Surgery Dashboard
bull Vent Times
bull Reasons for ext gt 6 hrs
bull iNO vs Veletri hrs
bull HyperHypo glycemia
bull Checklist Compliance
bull Staph screening (with reasons
for misses)
bull Blood Utilization
bull CVSICU arrival
bull K+
bull Temp
bull Base Deficit
bull Daily Weights
bull Transfers gt 6 pm
bull Bouncebacks (Total lt 24 hrs)
with Reasons)
September 12 2016 66
And Weekly Mortality and Morbidity
The Johns Hopkins Cardiac Surgery
Code of Conduct and Professional Behavior
September 12 2016 68
Critical Care of the Cardiovascular PatientThe essentials for high quality
1 Full time intensivists
2 Structured Multi-D rounds (Pharmacy)
3 Nurse readbacks
4 Checklists
5 Culture of safetyteamwork (CUSP)
6 Performance improvement requires
bull Multidisciplinary input
bull Agreed upon targets
bull Review of outcomes
bull Continual reassessment
6 Individual accountability matters
Isolated CABG
Post Op Morbidities
0
2
4
6
8
10
12
14
16
18
ANY MORBIDITY(Total)
ProlongedVentilation
MultipleMorbidities
Reoperation Renal Failure CerebrovascularAccident
Deep SternalWound
Mediastinitis
2014 Jan 1 ndash Jun 30
bull Universal public reporting is inevitable
bull ICU care plays a major role in patient
outcomes
September 12 2016 70
Surgeon-Reported Conflicts with Intensivists About
Postoperative Goals of Care
JAMA Surg 201314829-35
bull Vascular Neurologic and
Cardiothoracic Surgeons
bull Mail Questionnaire
bull 56 response rate n = 2100
September 12 2016 71
Rates of Surgeon Reported ConflictsJAMA Surg 201314829-35
September 12 2016 72
0
1
2
3
4
1 2 3 4 5 6 7 8 9 10
Institution
Count of Cardiac Surg
Count of Gen Surg CC
Count of Card Surg CC
Count of Anesth
Count of Anesth CC
Count of Cardiac Anesth
Count of Card Anesth CC
Count of Pulm CC
radic
radic
radic
radic
radic
radic
radic
radic
radic
radic
radic = CT trained
Heterogeneity of Specialties in Cardiac
Intensive Care Units
446537
556
75
889
1943
0 - 6 hrs 6 - 9 hrs 9 - 12 hrs 12 - 18 hrs 18 - 24 hrs gt 24 hrs
ICU
Sta
y(h
rs)
me
an
plusmnS
D
Intubation Duration
p lt 001
p = 070
p = 005
Unadjusted ICU Length of Stay
67 7
8
85
13
0 - 6 hrs 6 - 9 hrs 9 - 12 hrs 12 - 18 hrs 18 - 24 hrs gt 24 hrs
Hospital S
tay
(days)
media
n
(IQ
R)
Intubation Duration
p lt 001
p lt 001
p lt 001
Unadjusted Hospital Length of Stay
Multidisciplinary Teams
Physician Nurse and ge 1 more Health Care
Professional
of Patients with Infection by
RBC Units Transfused2
7
26 3
2
44
90
12
5
21 2
6
26
39
70
12
5
03
00 02 03
17
11
06
00 04 05 1
0
00
0 1 2 3-5 6-9 10+
Overall Infection Pneumonia Sepsis SSI
Total Number of RBC units Transfused
o
f p
ati
en
ts w
ith
In
fecti
on
significantly different (plt005) compared to no RBC exposure
Relationship between Infection
and Ventilation Time1
7
43 46
24
1
13
36 39
20
9
01
02 07
35
04
05
00
23
0-12 12-24 24-48 48+
Ventilation Time vs Infection ()
Overall Infection Pneumonia Sepsis SSI
Length of Mechanical Ventilation (hrs)
P
ati
en
ts w
ith
Infe
cti
on
by T
yp
e
Note 48 of all infections occurred in patients with 48+ hours ventilation
significantly different (plt005) compared to vent time lt12 hrs group
Isolated CABG
Post Op Morbidities
0
2
4
6
8
10
12
14
16
18
ANY MORBIDITY(Total)
ProlongedVentilation
MultipleMorbidities
Reoperation Renal Failure CerebrovascularAccident
Deep SternalWound
Mediastinitis
2013
2014
n= 390
n= 181
2014 Jan 1 ndash Jun 30
2013 and 2014
The Tenets of CUSP
bull Step 1 Safety Attitude Questionnaire (SAQ)
bull Step 2 Educate re Science of Improving
bull Step 3 Identify Defects ( events that should
not recur)
bull Step 4 Executive Partnership to ldquoBridge the
Gaprdquo
bull Step 5 Choose a Defect each Month that
poses a hazard
bull Step 6 ReassessSeptember 12 2016 80
Patients with BD lt -4 and
K lt 33 by Month
21
01
2
0 0
6
01
2
00
5
10
15
20
25
30
35
40
Jul15 Aug15 Sep15 Oct15 Nov15 Dec15 Jan16 Feb16 Mar16 Apr16 May16 Jun16
Quality Improvement
- Insight regarding what metric to target
- A sense of comfort to embark upon
new initiatives
- Involves ability to create consensus
September 12 2016 83
45
67
89
10
11
12
13
14
15
Hg
b(g
md
L)
1 2 3 4 5 6 7 8 9 10 11 12131415161718192021222324 25
Week
All Surgeons Combined
Weekly Transfusions with Corresponding Hgb for
CABG Patients
Period 1 Period 2 Period 3
02
04
06
0
Tra
nsfu
sed
(
)
Period 1 Period 2 Period 3
Percent of Transfusions at Increasing Hgb
Thresholds All Surgeons Combined
above Hgb of 8 gmdL
above Hgb of 9 gmdL
above Hgb of 10 gmdL
Denotes significantly different than period 1
Denotes significantly different than period 2
Conclusion
bull Though recognizing that this is as yet untested the
perspective that comes with cardiothoracic surgical
training and practice best addresses the above
issues which face every cardiothoracic surgical team
and ICU
As a result thoracic surgeons
bull Should be the directors of the CTICU and
bull Should play an integral part in the delivery of day to day ICU
care
September 12 2016 86
9122016 87
Procedure groups for which models exist bull Isolated CABG (CAB)
bull Isolated Aortic Valve Replacement (AVRepl)
bull Aortic Valve Replacement and CABG (AVRepl+CAB)
bull Isolated Mitral Valve Replacement (MVRepl)
bull Mitral Valve Replacement and CABG (MVRepl+CAB)
bull Isolated Mitral Valve Repair (MVRepr)
bull Mitral Valve Repair and CABG (MVRepr+CAB)
Model endpoints bull Operative Mortality
bull Stroke
bull Renal Failure
bull Prolonged Ventilation
bull Deep Sternal Wound Infection
bull Reoperation
bull MortalityMorbidity combined endpoint (any of the 6 previous endpoints)
bull Prolonged length of stay (length of stay gt14 days)
bull Short length of stay (length of stay lt 6 days
(Based on roughly 27 million patients)
Procedures for which the STS
database has a predictive model
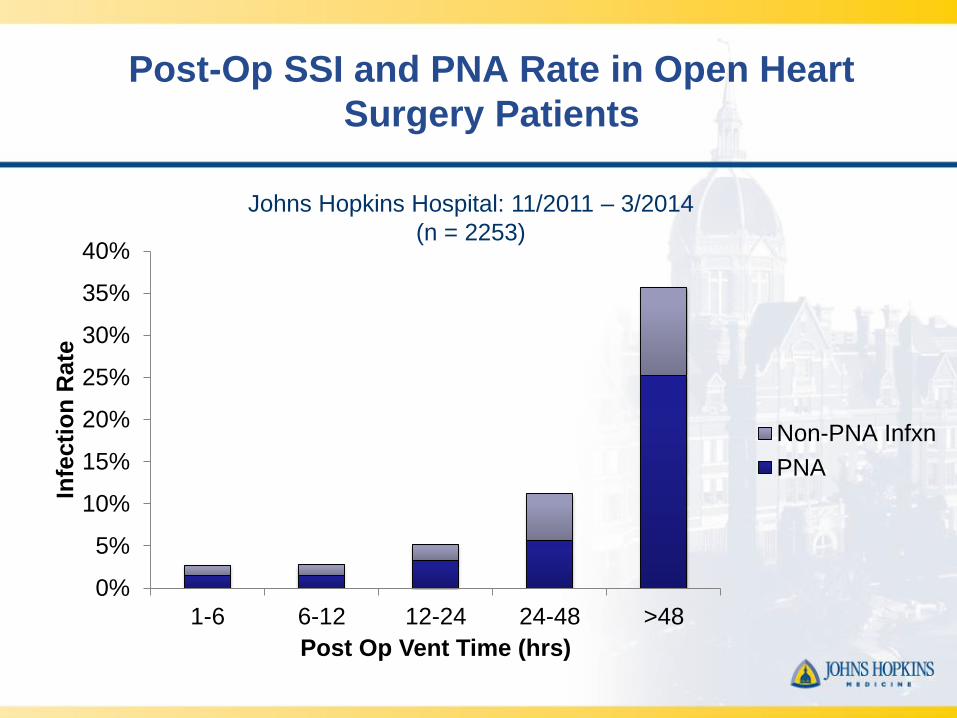
0
2
4
6
8
10
12
14
16
18
2013 n=390
2014 n=348
2015 n=469
Q1-2016 n=110
Isolated CAB Morbidity
Failed to Prescribe All Eligible
Medications for Isolated CAB
54
If you donrsquot know your performance
you are not doing as well as you think you are
Intervention ndash PCR testing
bull Preoperative PCR testing for MRSA
ndash Nasal swab by PAs on preop visit
bull If positive
ndash Intranasal mupirocin bid
ndash Chlorhexidine baths
bull Both for 5 days (or as many days as possible preop
full course completed in ICU if necessary)
Overall SSI in CABG Patients
05 005
37
265
0
1
2
3
4
5
Pre-Intervention (n=1357) Intervention (n=1990)
Non-MRSA
MRSA42
27
Perc
enta
ge o
f C
AB
G p
atients
Un-adjusted Adjusted
OR 95 CI p-value OR 95 CI p-value
Intervention Era 064 044 093 002 058 040 086 0007
MRSA ICU Admissions
26
14
0
1
2
3
Pre-Intervention (n=2826) Intervention (n=4038)
Perc
enta
ge o
f IC
U A
dm
issio
ns
MRSA-Positive on ICU Admission
Univariate Multivariate
OR 95 CI p-value OR 95 CI p-value
Intervention Era 05 037 074 lt0001 05 037 076 lt0001
MRSA ICU Admissions
10
26
04
0
1
2
3
Pre-Intervention (n=2826) Intervention (n=4038)
Perc
enta
ge o
f IC
U A
dm
issio
ns
No PCR
PCR Screened
14
MRSA-Positive on ICU Admission
Univariate Multivariate
OR 95 CI p-value OR 95 CI p-value
Intervention Era 05 037 074 lt0001 05 037 076 lt0001
MRSA ICU Transmission
Adjusted Poisson Regression MRSA transmissions
aIRR 95 CI P
Intervention era 029 013 065 0002
16
04
00
02
04
06
08
10
12
14
16
18
Pre-Intervention(14733 pt days)
Intervention(21467 pt days)
Incid
ence R
ate
per
1000 p
tdays
Staph Screening Miss CategoriesJuly 2016
September 12 2016 60
1
2
2
3Transfer
True Miss
gt45 Days
Discontinued
Group but not Individual
Accountability
September 12 2016 61
65
74
81
71
87 8892
0
10
20
30
40
50
60
70
80
90
100
2009 2010 2011 2012 2013 2014 2015 (Jan-March)
CVSICU Hand Hygiene Compliance by Year
45
67
89
10
11
12
13
14
15
Hg
b(g
md
L)
1 2 3 4 5 6 7 8 9 10 11 12 1314 15 16 17 18 19 2021 22 23 24 25
Week
All Surgeons Combined
Weekly Transfusions with Corresponding Hgb for All
Procedures
Period 1 Period 2
45
67
89
10
11
12
13
14
15
Hg
b(g
msd
L)
1 2 3 4 5 6 7 8 9 10 11 12131415 16171819 20212223 24 25
Week
For a Single Surgeon
Weekly Transfusions with Corresponding Hgb for All
Procedures
Period 1 Period 2 Period 3
45
67
89
10
11
12
13
14
15
Hg
b(g
md
L)
1 2 3 4 5 6 7 8 9 10 11 12 1314 15 16 17 18 19 2021 22 23 24 25
Week
All Surgeons Combined
Weekly Transfusions with Corresponding Hgb for All
Procedures
Period 1 Period 2 Period 3
02
04
06
0
Tra
nsfu
sed
(
)
Period 1 Period 2 Period 3
Percent of Transfusions at Increasing Hgb
Thresholds All Surgeons Combined
above Hgb of 8 gmdL
above Hgb of 9 gmdL
above Hgb of 10 gmdL
Denotes significantly different than period 1
Denotes significantly different than period 2
Monthly Cardiac Surgery Dashboard
bull Vent Times
bull Reasons for ext gt 6 hrs
bull iNO vs Veletri hrs
bull HyperHypo glycemia
bull Checklist Compliance
bull Staph screening (with reasons
for misses)
bull Blood Utilization
bull CVSICU arrival
bull K+
bull Temp
bull Base Deficit
bull Daily Weights
bull Transfers gt 6 pm
bull Bouncebacks (Total lt 24 hrs)
with Reasons)
September 12 2016 66
And Weekly Mortality and Morbidity
The Johns Hopkins Cardiac Surgery
Code of Conduct and Professional Behavior
September 12 2016 68
Critical Care of the Cardiovascular PatientThe essentials for high quality
1 Full time intensivists
2 Structured Multi-D rounds (Pharmacy)
3 Nurse readbacks
4 Checklists
5 Culture of safetyteamwork (CUSP)
6 Performance improvement requires
bull Multidisciplinary input
bull Agreed upon targets
bull Review of outcomes
bull Continual reassessment
6 Individual accountability matters
Isolated CABG
Post Op Morbidities
0
2
4
6
8
10
12
14
16
18
ANY MORBIDITY(Total)
ProlongedVentilation
MultipleMorbidities
Reoperation Renal Failure CerebrovascularAccident
Deep SternalWound
Mediastinitis
2014 Jan 1 ndash Jun 30
bull Universal public reporting is inevitable
bull ICU care plays a major role in patient
outcomes
September 12 2016 70
Surgeon-Reported Conflicts with Intensivists About
Postoperative Goals of Care
JAMA Surg 201314829-35
bull Vascular Neurologic and
Cardiothoracic Surgeons
bull Mail Questionnaire
bull 56 response rate n = 2100
September 12 2016 71
Rates of Surgeon Reported ConflictsJAMA Surg 201314829-35
September 12 2016 72
0
1
2
3
4
1 2 3 4 5 6 7 8 9 10
Institution
Count of Cardiac Surg
Count of Gen Surg CC
Count of Card Surg CC
Count of Anesth
Count of Anesth CC
Count of Cardiac Anesth
Count of Card Anesth CC
Count of Pulm CC
radic
radic
radic
radic
radic
radic
radic
radic
radic
radic
radic = CT trained
Heterogeneity of Specialties in Cardiac
Intensive Care Units
446537
556
75
889
1943
0 - 6 hrs 6 - 9 hrs 9 - 12 hrs 12 - 18 hrs 18 - 24 hrs gt 24 hrs
ICU
Sta
y(h
rs)
me
an
plusmnS
D
Intubation Duration
p lt 001
p = 070
p = 005
Unadjusted ICU Length of Stay
67 7
8
85
13
0 - 6 hrs 6 - 9 hrs 9 - 12 hrs 12 - 18 hrs 18 - 24 hrs gt 24 hrs
Hospital S
tay
(days)
media
n
(IQ
R)
Intubation Duration
p lt 001
p lt 001
p lt 001
Unadjusted Hospital Length of Stay
Multidisciplinary Teams
Physician Nurse and ge 1 more Health Care
Professional
of Patients with Infection by
RBC Units Transfused2
7
26 3
2
44
90
12
5
21 2
6
26
39
70
12
5
03
00 02 03
17
11
06
00 04 05 1
0
00
0 1 2 3-5 6-9 10+
Overall Infection Pneumonia Sepsis SSI
Total Number of RBC units Transfused
o
f p
ati
en
ts w
ith
In
fecti
on
significantly different (plt005) compared to no RBC exposure
Relationship between Infection
and Ventilation Time1
7
43 46
24
1
13
36 39
20
9
01
02 07
35
04
05
00
23
0-12 12-24 24-48 48+
Ventilation Time vs Infection ()
Overall Infection Pneumonia Sepsis SSI
Length of Mechanical Ventilation (hrs)
P
ati
en
ts w
ith
Infe
cti
on
by T
yp
e
Note 48 of all infections occurred in patients with 48+ hours ventilation
significantly different (plt005) compared to vent time lt12 hrs group
Isolated CABG
Post Op Morbidities
0
2
4
6
8
10
12
14
16
18
ANY MORBIDITY(Total)
ProlongedVentilation
MultipleMorbidities
Reoperation Renal Failure CerebrovascularAccident
Deep SternalWound
Mediastinitis
2013
2014
n= 390
n= 181
2014 Jan 1 ndash Jun 30
2013 and 2014
The Tenets of CUSP
bull Step 1 Safety Attitude Questionnaire (SAQ)
bull Step 2 Educate re Science of Improving
bull Step 3 Identify Defects ( events that should
not recur)
bull Step 4 Executive Partnership to ldquoBridge the
Gaprdquo
bull Step 5 Choose a Defect each Month that
poses a hazard
bull Step 6 ReassessSeptember 12 2016 80
Patients with BD lt -4 and
K lt 33 by Month
21
01
2
0 0
6
01
2
00
5
10
15
20
25
30
35
40
Jul15 Aug15 Sep15 Oct15 Nov15 Dec15 Jan16 Feb16 Mar16 Apr16 May16 Jun16
Quality Improvement
- Insight regarding what metric to target
- A sense of comfort to embark upon
new initiatives
- Involves ability to create consensus
September 12 2016 83
45
67
89
10
11
12
13
14
15
Hg
b(g
md
L)
1 2 3 4 5 6 7 8 9 10 11 12131415161718192021222324 25
Week
All Surgeons Combined
Weekly Transfusions with Corresponding Hgb for
CABG Patients
Period 1 Period 2 Period 3
02
04
06
0
Tra
nsfu
sed
(
)
Period 1 Period 2 Period 3
Percent of Transfusions at Increasing Hgb
Thresholds All Surgeons Combined
above Hgb of 8 gmdL
above Hgb of 9 gmdL
above Hgb of 10 gmdL
Denotes significantly different than period 1
Denotes significantly different than period 2
Conclusion
bull Though recognizing that this is as yet untested the
perspective that comes with cardiothoracic surgical
training and practice best addresses the above
issues which face every cardiothoracic surgical team
and ICU
As a result thoracic surgeons
bull Should be the directors of the CTICU and
bull Should play an integral part in the delivery of day to day ICU
care
September 12 2016 86
9122016 87
Procedure groups for which models exist bull Isolated CABG (CAB)
bull Isolated Aortic Valve Replacement (AVRepl)
bull Aortic Valve Replacement and CABG (AVRepl+CAB)
bull Isolated Mitral Valve Replacement (MVRepl)
bull Mitral Valve Replacement and CABG (MVRepl+CAB)
bull Isolated Mitral Valve Repair (MVRepr)
bull Mitral Valve Repair and CABG (MVRepr+CAB)
Model endpoints bull Operative Mortality
bull Stroke
bull Renal Failure
bull Prolonged Ventilation
bull Deep Sternal Wound Infection
bull Reoperation
bull MortalityMorbidity combined endpoint (any of the 6 previous endpoints)
bull Prolonged length of stay (length of stay gt14 days)
bull Short length of stay (length of stay lt 6 days
(Based on roughly 27 million patients)
Procedures for which the STS
database has a predictive model
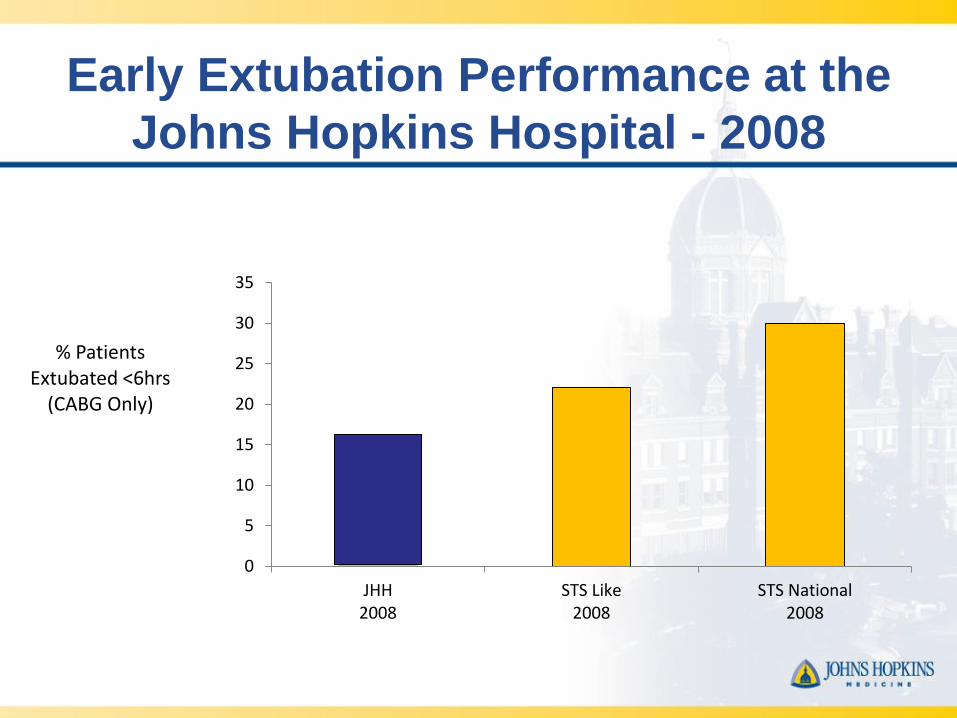

MRSA ICU Admissions
26
14
0
1
2
3
Pre-Intervention (n=2826) Intervention (n=4038)
Perc
enta
ge o
f IC
U A
dm
issio
ns
MRSA-Positive on ICU Admission
Univariate Multivariate
OR 95 CI p-value OR 95 CI p-value
Intervention Era 05 037 074 lt0001 05 037 076 lt0001
MRSA ICU Admissions
10
26
04
0
1
2
3
Pre-Intervention (n=2826) Intervention (n=4038)
Perc
enta
ge o
f IC
U A
dm
issio
ns
No PCR
PCR Screened
14
MRSA-Positive on ICU Admission
Univariate Multivariate
OR 95 CI p-value OR 95 CI p-value
Intervention Era 05 037 074 lt0001 05 037 076 lt0001
MRSA ICU Transmission
Adjusted Poisson Regression MRSA transmissions
aIRR 95 CI P
Intervention era 029 013 065 0002
16
04
00
02
04
06
08
10
12
14
16
18
Pre-Intervention(14733 pt days)
Intervention(21467 pt days)
Incid
ence R
ate
per
1000 p
tdays
Staph Screening Miss CategoriesJuly 2016
September 12 2016 60
1
2
2
3Transfer
True Miss
gt45 Days
Discontinued
Group but not Individual
Accountability
September 12 2016 61
65
74
81
71
87 8892
0
10
20
30
40
50
60
70
80
90
100
2009 2010 2011 2012 2013 2014 2015 (Jan-March)
CVSICU Hand Hygiene Compliance by Year
45
67
89
10
11
12
13
14
15
Hg
b(g
md
L)
1 2 3 4 5 6 7 8 9 10 11 12 1314 15 16 17 18 19 2021 22 23 24 25
Week
All Surgeons Combined
Weekly Transfusions with Corresponding Hgb for All
Procedures
Period 1 Period 2
45
67
89
10
11
12
13
14
15
Hg
b(g
msd
L)
1 2 3 4 5 6 7 8 9 10 11 12131415 16171819 20212223 24 25
Week
For a Single Surgeon
Weekly Transfusions with Corresponding Hgb for All
Procedures
Period 1 Period 2 Period 3
45
67
89
10
11
12
13
14
15
Hg
b(g
md
L)
1 2 3 4 5 6 7 8 9 10 11 12 1314 15 16 17 18 19 2021 22 23 24 25
Week
All Surgeons Combined
Weekly Transfusions with Corresponding Hgb for All
Procedures
Period 1 Period 2 Period 3
02
04
06
0
Tra
nsfu
sed
(
)
Period 1 Period 2 Period 3
Percent of Transfusions at Increasing Hgb
Thresholds All Surgeons Combined
above Hgb of 8 gmdL
above Hgb of 9 gmdL
above Hgb of 10 gmdL
Denotes significantly different than period 1
Denotes significantly different than period 2
Monthly Cardiac Surgery Dashboard
bull Vent Times
bull Reasons for ext gt 6 hrs
bull iNO vs Veletri hrs
bull HyperHypo glycemia
bull Checklist Compliance
bull Staph screening (with reasons
for misses)
bull Blood Utilization
bull CVSICU arrival
bull K+
bull Temp
bull Base Deficit
bull Daily Weights
bull Transfers gt 6 pm
bull Bouncebacks (Total lt 24 hrs)
with Reasons)
September 12 2016 66
And Weekly Mortality and Morbidity
The Johns Hopkins Cardiac Surgery
Code of Conduct and Professional Behavior
September 12 2016 68
Critical Care of the Cardiovascular PatientThe essentials for high quality
1 Full time intensivists
2 Structured Multi-D rounds (Pharmacy)
3 Nurse readbacks
4 Checklists
5 Culture of safetyteamwork (CUSP)
6 Performance improvement requires
bull Multidisciplinary input
bull Agreed upon targets
bull Review of outcomes
bull Continual reassessment
6 Individual accountability matters
Isolated CABG
Post Op Morbidities
0
2
4
6
8
10
12
14
16
18
ANY MORBIDITY(Total)
ProlongedVentilation
MultipleMorbidities
Reoperation Renal Failure CerebrovascularAccident
Deep SternalWound
Mediastinitis
2014 Jan 1 ndash Jun 30
bull Universal public reporting is inevitable
bull ICU care plays a major role in patient
outcomes
September 12 2016 70
Surgeon-Reported Conflicts with Intensivists About
Postoperative Goals of Care
JAMA Surg 201314829-35
bull Vascular Neurologic and
Cardiothoracic Surgeons
bull Mail Questionnaire
bull 56 response rate n = 2100
September 12 2016 71
Rates of Surgeon Reported ConflictsJAMA Surg 201314829-35
September 12 2016 72
0
1
2
3
4
1 2 3 4 5 6 7 8 9 10
Institution
Count of Cardiac Surg
Count of Gen Surg CC
Count of Card Surg CC
Count of Anesth
Count of Anesth CC
Count of Cardiac Anesth
Count of Card Anesth CC
Count of Pulm CC
radic
radic
radic
radic
radic
radic
radic
radic
radic
radic
radic = CT trained
Heterogeneity of Specialties in Cardiac
Intensive Care Units
446537
556
75
889
1943
0 - 6 hrs 6 - 9 hrs 9 - 12 hrs 12 - 18 hrs 18 - 24 hrs gt 24 hrs
ICU
Sta
y(h
rs)
me
an
plusmnS
D
Intubation Duration
p lt 001
p = 070
p = 005
Unadjusted ICU Length of Stay
67 7
8
85
13
0 - 6 hrs 6 - 9 hrs 9 - 12 hrs 12 - 18 hrs 18 - 24 hrs gt 24 hrs
Hospital S
tay
(days)
media
n
(IQ
R)
Intubation Duration
p lt 001
p lt 001
p lt 001
Unadjusted Hospital Length of Stay
Multidisciplinary Teams
Physician Nurse and ge 1 more Health Care
Professional
of Patients with Infection by
RBC Units Transfused2
7
26 3
2
44
90
12
5
21 2
6
26
39
70
12
5
03
00 02 03
17
11
06
00 04 05 1
0
00
0 1 2 3-5 6-9 10+
Overall Infection Pneumonia Sepsis SSI
Total Number of RBC units Transfused
o
f p
ati
en
ts w
ith
In
fecti
on
significantly different (plt005) compared to no RBC exposure
Relationship between Infection
and Ventilation Time1
7
43 46
24
1
13
36 39
20
9
01
02 07
35
04
05
00
23
0-12 12-24 24-48 48+
Ventilation Time vs Infection ()
Overall Infection Pneumonia Sepsis SSI
Length of Mechanical Ventilation (hrs)
P
ati
en
ts w
ith
Infe
cti
on
by T
yp
e
Note 48 of all infections occurred in patients with 48+ hours ventilation
significantly different (plt005) compared to vent time lt12 hrs group
Isolated CABG
Post Op Morbidities
0
2
4
6
8
10
12
14
16
18
ANY MORBIDITY(Total)
ProlongedVentilation
MultipleMorbidities
Reoperation Renal Failure CerebrovascularAccident
Deep SternalWound
Mediastinitis
2013
2014
n= 390
n= 181
2014 Jan 1 ndash Jun 30
2013 and 2014
The Tenets of CUSP
bull Step 1 Safety Attitude Questionnaire (SAQ)
bull Step 2 Educate re Science of Improving
bull Step 3 Identify Defects ( events that should
not recur)
bull Step 4 Executive Partnership to ldquoBridge the
Gaprdquo
bull Step 5 Choose a Defect each Month that
poses a hazard
bull Step 6 ReassessSeptember 12 2016 80
Patients with BD lt -4 and
K lt 33 by Month
21
01
2
0 0
6
01
2
00
5
10
15
20
25
30
35
40
Jul15 Aug15 Sep15 Oct15 Nov15 Dec15 Jan16 Feb16 Mar16 Apr16 May16 Jun16
Quality Improvement
- Insight regarding what metric to target
- A sense of comfort to embark upon
new initiatives
- Involves ability to create consensus
September 12 2016 83
45
67
89
10
11
12
13
14
15
Hg
b(g
md
L)
1 2 3 4 5 6 7 8 9 10 11 12131415161718192021222324 25
Week
All Surgeons Combined
Weekly Transfusions with Corresponding Hgb for
CABG Patients
Period 1 Period 2 Period 3
02
04
06
0
Tra
nsfu
sed
(
)
Period 1 Period 2 Period 3
Percent of Transfusions at Increasing Hgb
Thresholds All Surgeons Combined
above Hgb of 8 gmdL
above Hgb of 9 gmdL
above Hgb of 10 gmdL
Denotes significantly different than period 1
Denotes significantly different than period 2
Conclusion
bull Though recognizing that this is as yet untested the
perspective that comes with cardiothoracic surgical
training and practice best addresses the above
issues which face every cardiothoracic surgical team
and ICU
As a result thoracic surgeons
bull Should be the directors of the CTICU and
bull Should play an integral part in the delivery of day to day ICU
care
September 12 2016 86
9122016 87
Procedure groups for which models exist bull Isolated CABG (CAB)
bull Isolated Aortic Valve Replacement (AVRepl)
bull Aortic Valve Replacement and CABG (AVRepl+CAB)
bull Isolated Mitral Valve Replacement (MVRepl)
bull Mitral Valve Replacement and CABG (MVRepl+CAB)
bull Isolated Mitral Valve Repair (MVRepr)
bull Mitral Valve Repair and CABG (MVRepr+CAB)
Model endpoints bull Operative Mortality
bull Stroke
bull Renal Failure
bull Prolonged Ventilation
bull Deep Sternal Wound Infection
bull Reoperation
bull MortalityMorbidity combined endpoint (any of the 6 previous endpoints)
bull Prolonged length of stay (length of stay gt14 days)
bull Short length of stay (length of stay lt 6 days
(Based on roughly 27 million patients)
Procedures for which the STS
database has a predictive model

MRSA ICU Admissions
10
26
04
0
1
2
3
Pre-Intervention (n=2826) Intervention (n=4038)
Perc
enta
ge o
f IC
U A
dm
issio
ns
No PCR
PCR Screened
14
MRSA-Positive on ICU Admission
Univariate Multivariate
OR 95 CI p-value OR 95 CI p-value
Intervention Era 05 037 074 lt0001 05 037 076 lt0001
MRSA ICU Transmission
Adjusted Poisson Regression MRSA transmissions
aIRR 95 CI P
Intervention era 029 013 065 0002
16
04
00
02
04
06
08
10
12
14
16
18
Pre-Intervention(14733 pt days)
Intervention(21467 pt days)
Incid
ence R
ate
per
1000 p
tdays
Staph Screening Miss CategoriesJuly 2016
September 12 2016 60
1
2
2
3Transfer
True Miss
gt45 Days
Discontinued
Group but not Individual
Accountability
September 12 2016 61
65
74
81
71
87 8892
0
10
20
30
40
50
60
70
80
90
100
2009 2010 2011 2012 2013 2014 2015 (Jan-March)
CVSICU Hand Hygiene Compliance by Year
45
67
89
10
11
12
13
14
15
Hg
b(g
md
L)
1 2 3 4 5 6 7 8 9 10 11 12 1314 15 16 17 18 19 2021 22 23 24 25
Week
All Surgeons Combined
Weekly Transfusions with Corresponding Hgb for All
Procedures
Period 1 Period 2
45
67
89
10
11
12
13
14
15
Hg
b(g
msd
L)
1 2 3 4 5 6 7 8 9 10 11 12131415 16171819 20212223 24 25
Week
For a Single Surgeon
Weekly Transfusions with Corresponding Hgb for All
Procedures
Period 1 Period 2 Period 3
45
67
89
10
11
12
13
14
15
Hg
b(g
md
L)
1 2 3 4 5 6 7 8 9 10 11 12 1314 15 16 17 18 19 2021 22 23 24 25
Week
All Surgeons Combined
Weekly Transfusions with Corresponding Hgb for All
Procedures
Period 1 Period 2 Period 3
02
04
06
0
Tra
nsfu
sed
(
)
Period 1 Period 2 Period 3
Percent of Transfusions at Increasing Hgb
Thresholds All Surgeons Combined
above Hgb of 8 gmdL
above Hgb of 9 gmdL
above Hgb of 10 gmdL
Denotes significantly different than period 1
Denotes significantly different than period 2
Monthly Cardiac Surgery Dashboard
bull Vent Times
bull Reasons for ext gt 6 hrs
bull iNO vs Veletri hrs
bull HyperHypo glycemia
bull Checklist Compliance
bull Staph screening (with reasons
for misses)
bull Blood Utilization
bull CVSICU arrival
bull K+
bull Temp
bull Base Deficit
bull Daily Weights
bull Transfers gt 6 pm
bull Bouncebacks (Total lt 24 hrs)
with Reasons)
September 12 2016 66
And Weekly Mortality and Morbidity
The Johns Hopkins Cardiac Surgery
Code of Conduct and Professional Behavior
September 12 2016 68
Critical Care of the Cardiovascular PatientThe essentials for high quality
1 Full time intensivists
2 Structured Multi-D rounds (Pharmacy)
3 Nurse readbacks
4 Checklists
5 Culture of safetyteamwork (CUSP)
6 Performance improvement requires
bull Multidisciplinary input
bull Agreed upon targets
bull Review of outcomes
bull Continual reassessment
6 Individual accountability matters
Isolated CABG
Post Op Morbidities
0
2
4
6
8
10
12
14
16
18
ANY MORBIDITY(Total)
ProlongedVentilation
MultipleMorbidities
Reoperation Renal Failure CerebrovascularAccident
Deep SternalWound
Mediastinitis
2014 Jan 1 ndash Jun 30
bull Universal public reporting is inevitable
bull ICU care plays a major role in patient
outcomes
September 12 2016 70
Surgeon-Reported Conflicts with Intensivists About
Postoperative Goals of Care
JAMA Surg 201314829-35
bull Vascular Neurologic and
Cardiothoracic Surgeons
bull Mail Questionnaire
bull 56 response rate n = 2100
September 12 2016 71
Rates of Surgeon Reported ConflictsJAMA Surg 201314829-35
September 12 2016 72
0
1
2
3
4
1 2 3 4 5 6 7 8 9 10
Institution
Count of Cardiac Surg
Count of Gen Surg CC
Count of Card Surg CC
Count of Anesth
Count of Anesth CC
Count of Cardiac Anesth
Count of Card Anesth CC
Count of Pulm CC
radic
radic
radic
radic
radic
radic
radic
radic
radic
radic
radic = CT trained
Heterogeneity of Specialties in Cardiac
Intensive Care Units
446537
556
75
889
1943
0 - 6 hrs 6 - 9 hrs 9 - 12 hrs 12 - 18 hrs 18 - 24 hrs gt 24 hrs
ICU
Sta
y(h
rs)
me
an
plusmnS
D
Intubation Duration
p lt 001
p = 070
p = 005
Unadjusted ICU Length of Stay
67 7
8
85
13
0 - 6 hrs 6 - 9 hrs 9 - 12 hrs 12 - 18 hrs 18 - 24 hrs gt 24 hrs
Hospital S
tay
(days)
media
n
(IQ
R)
Intubation Duration
p lt 001
p lt 001
p lt 001
Unadjusted Hospital Length of Stay
Multidisciplinary Teams
Physician Nurse and ge 1 more Health Care
Professional
of Patients with Infection by
RBC Units Transfused2
7
26 3
2
44
90
12
5
21 2
6
26
39
70
12
5
03
00 02 03
17
11
06
00 04 05 1
0
00
0 1 2 3-5 6-9 10+
Overall Infection Pneumonia Sepsis SSI
Total Number of RBC units Transfused
o
f p
ati
en
ts w
ith
In
fecti
on
significantly different (plt005) compared to no RBC exposure
Relationship between Infection
and Ventilation Time1
7
43 46
24
1
13
36 39
20
9
01
02 07
35
04
05
00
23
0-12 12-24 24-48 48+
Ventilation Time vs Infection ()
Overall Infection Pneumonia Sepsis SSI
Length of Mechanical Ventilation (hrs)
P
ati
en
ts w
ith
Infe
cti
on
by T
yp
e
Note 48 of all infections occurred in patients with 48+ hours ventilation
significantly different (plt005) compared to vent time lt12 hrs group
Isolated CABG
Post Op Morbidities
0
2
4
6
8
10
12
14
16
18
ANY MORBIDITY(Total)
ProlongedVentilation
MultipleMorbidities
Reoperation Renal Failure CerebrovascularAccident
Deep SternalWound
Mediastinitis
2013
2014
n= 390
n= 181
2014 Jan 1 ndash Jun 30
2013 and 2014
The Tenets of CUSP
bull Step 1 Safety Attitude Questionnaire (SAQ)
bull Step 2 Educate re Science of Improving
bull Step 3 Identify Defects ( events that should
not recur)
bull Step 4 Executive Partnership to ldquoBridge the
Gaprdquo
bull Step 5 Choose a Defect each Month that
poses a hazard
bull Step 6 ReassessSeptember 12 2016 80
Patients with BD lt -4 and
K lt 33 by Month
21
01
2
0 0
6
01
2
00
5
10
15
20
25
30
35
40
Jul15 Aug15 Sep15 Oct15 Nov15 Dec15 Jan16 Feb16 Mar16 Apr16 May16 Jun16
Quality Improvement
- Insight regarding what metric to target
- A sense of comfort to embark upon
new initiatives
- Involves ability to create consensus
September 12 2016 83
45
67
89
10
11
12
13
14
15
Hg
b(g
md
L)
1 2 3 4 5 6 7 8 9 10 11 12131415161718192021222324 25
Week
All Surgeons Combined
Weekly Transfusions with Corresponding Hgb for
CABG Patients
Period 1 Period 2 Period 3
02
04
06
0
Tra
nsfu
sed
(
)
Period 1 Period 2 Period 3
Percent of Transfusions at Increasing Hgb
Thresholds All Surgeons Combined
above Hgb of 8 gmdL
above Hgb of 9 gmdL
above Hgb of 10 gmdL
Denotes significantly different than period 1
Denotes significantly different than period 2
Conclusion
bull Though recognizing that this is as yet untested the
perspective that comes with cardiothoracic surgical
training and practice best addresses the above
issues which face every cardiothoracic surgical team
and ICU
As a result thoracic surgeons
bull Should be the directors of the CTICU and
bull Should play an integral part in the delivery of day to day ICU
care
September 12 2016 86
9122016 87
Procedure groups for which models exist bull Isolated CABG (CAB)
bull Isolated Aortic Valve Replacement (AVRepl)
bull Aortic Valve Replacement and CABG (AVRepl+CAB)
bull Isolated Mitral Valve Replacement (MVRepl)
bull Mitral Valve Replacement and CABG (MVRepl+CAB)
bull Isolated Mitral Valve Repair (MVRepr)
bull Mitral Valve Repair and CABG (MVRepr+CAB)
Model endpoints bull Operative Mortality
bull Stroke
bull Renal Failure
bull Prolonged Ventilation
bull Deep Sternal Wound Infection
bull Reoperation
bull MortalityMorbidity combined endpoint (any of the 6 previous endpoints)
bull Prolonged length of stay (length of stay gt14 days)
bull Short length of stay (length of stay lt 6 days
(Based on roughly 27 million patients)
Procedures for which the STS
database has a predictive model
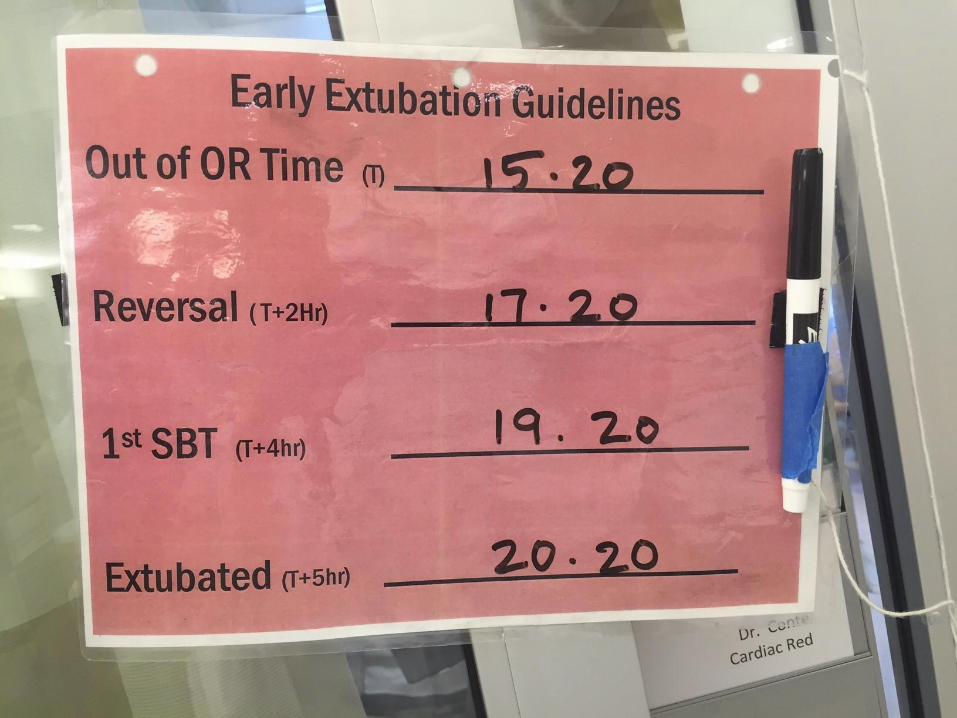

45
67
89
10
11
12
13
14
15
Hg
b(g
md
L)
1 2 3 4 5 6 7 8 9 10 11 12 1314 15 16 17 18 19 2021 22 23 24 25
Week
All Surgeons Combined
Weekly Transfusions with Corresponding Hgb for All
Procedures
Period 1 Period 2
45
67
89
10
11
12
13
14
15
Hg
b(g
msd
L)
1 2 3 4 5 6 7 8 9 10 11 12131415 16171819 20212223 24 25
Week
For a Single Surgeon
Weekly Transfusions with Corresponding Hgb for All
Procedures
Period 1 Period 2 Period 3
45
67
89
10
11
12
13
14
15
Hg
b(g
md
L)
1 2 3 4 5 6 7 8 9 10 11 12 1314 15 16 17 18 19 2021 22 23 24 25
Week
All Surgeons Combined
Weekly Transfusions with Corresponding Hgb for All
Procedures
Period 1 Period 2 Period 3
02
04
06
0
Tra
nsfu
sed
(
)
Period 1 Period 2 Period 3
Percent of Transfusions at Increasing Hgb
Thresholds All Surgeons Combined
above Hgb of 8 gmdL
above Hgb of 9 gmdL
above Hgb of 10 gmdL
Denotes significantly different than period 1
Denotes significantly different than period 2
Monthly Cardiac Surgery Dashboard
bull Vent Times
bull Reasons for ext gt 6 hrs
bull iNO vs Veletri hrs
bull HyperHypo glycemia
bull Checklist Compliance
bull Staph screening (with reasons
for misses)
bull Blood Utilization
bull CVSICU arrival
bull K+
bull Temp
bull Base Deficit
bull Daily Weights
bull Transfers gt 6 pm
bull Bouncebacks (Total lt 24 hrs)
with Reasons)
September 12 2016 66
And Weekly Mortality and Morbidity
The Johns Hopkins Cardiac Surgery
Code of Conduct and Professional Behavior
September 12 2016 68
Critical Care of the Cardiovascular PatientThe essentials for high quality
1 Full time intensivists
2 Structured Multi-D rounds (Pharmacy)
3 Nurse readbacks
4 Checklists
5 Culture of safetyteamwork (CUSP)
6 Performance improvement requires
bull Multidisciplinary input
bull Agreed upon targets
bull Review of outcomes
bull Continual reassessment
6 Individual accountability matters
Isolated CABG
Post Op Morbidities
0
2
4
6
8
10
12
14
16
18
ANY MORBIDITY(Total)
ProlongedVentilation
MultipleMorbidities
Reoperation Renal Failure CerebrovascularAccident
Deep SternalWound
Mediastinitis
2014 Jan 1 ndash Jun 30
bull Universal public reporting is inevitable
bull ICU care plays a major role in patient
outcomes
September 12 2016 70
Surgeon-Reported Conflicts with Intensivists About
Postoperative Goals of Care
JAMA Surg 201314829-35
bull Vascular Neurologic and
Cardiothoracic Surgeons
bull Mail Questionnaire
bull 56 response rate n = 2100
September 12 2016 71
Rates of Surgeon Reported ConflictsJAMA Surg 201314829-35
September 12 2016 72
0
1
2
3
4
1 2 3 4 5 6 7 8 9 10
Institution
Count of Cardiac Surg
Count of Gen Surg CC
Count of Card Surg CC
Count of Anesth
Count of Anesth CC
Count of Cardiac Anesth
Count of Card Anesth CC
Count of Pulm CC
radic
radic
radic
radic
radic
radic
radic
radic
radic
radic
radic = CT trained
Heterogeneity of Specialties in Cardiac
Intensive Care Units
446537
556
75
889
1943
0 - 6 hrs 6 - 9 hrs 9 - 12 hrs 12 - 18 hrs 18 - 24 hrs gt 24 hrs
ICU
Sta
y(h
rs)
me
an
plusmnS
D
Intubation Duration
p lt 001
p = 070
p = 005
Unadjusted ICU Length of Stay
67 7
8
85
13
0 - 6 hrs 6 - 9 hrs 9 - 12 hrs 12 - 18 hrs 18 - 24 hrs gt 24 hrs
Hospital S
tay
(days)
media
n
(IQ
R)
Intubation Duration
p lt 001
p lt 001
p lt 001
Unadjusted Hospital Length of Stay
Multidisciplinary Teams
Physician Nurse and ge 1 more Health Care
Professional
of Patients with Infection by
RBC Units Transfused2
7
26 3
2
44
90
12
5
21 2
6
26
39
70
12
5
03
00 02 03
17
11
06
00 04 05 1
0
00
0 1 2 3-5 6-9 10+
Overall Infection Pneumonia Sepsis SSI
Total Number of RBC units Transfused
o
f p
ati
en
ts w
ith
In
fecti
on
significantly different (plt005) compared to no RBC exposure
Relationship between Infection
and Ventilation Time1
7
43 46
24
1
13
36 39
20
9
01
02 07
35
04
05
00
23
0-12 12-24 24-48 48+
Ventilation Time vs Infection ()
Overall Infection Pneumonia Sepsis SSI
Length of Mechanical Ventilation (hrs)
P
ati
en
ts w
ith
Infe
cti
on
by T
yp
e
Note 48 of all infections occurred in patients with 48+ hours ventilation
significantly different (plt005) compared to vent time lt12 hrs group
Isolated CABG
Post Op Morbidities
0
2
4
6
8
10
12
14
16
18
ANY MORBIDITY(Total)
ProlongedVentilation
MultipleMorbidities
Reoperation Renal Failure CerebrovascularAccident
Deep SternalWound
Mediastinitis
2013
2014
n= 390
n= 181
2014 Jan 1 ndash Jun 30
2013 and 2014
The Tenets of CUSP
bull Step 1 Safety Attitude Questionnaire (SAQ)
bull Step 2 Educate re Science of Improving
bull Step 3 Identify Defects ( events that should
not recur)
bull Step 4 Executive Partnership to ldquoBridge the
Gaprdquo
bull Step 5 Choose a Defect each Month that
poses a hazard
bull Step 6 ReassessSeptember 12 2016 80
Patients with BD lt -4 and
K lt 33 by Month
21
01
2
0 0
6
01
2
00
5
10
15
20
25
30
35
40
Jul15 Aug15 Sep15 Oct15 Nov15 Dec15 Jan16 Feb16 Mar16 Apr16 May16 Jun16
Quality Improvement
- Insight regarding what metric to target
- A sense of comfort to embark upon
new initiatives
- Involves ability to create consensus
September 12 2016 83
45
67
89
10
11
12
13
14
15
Hg
b(g
md
L)
1 2 3 4 5 6 7 8 9 10 11 12131415161718192021222324 25
Week
All Surgeons Combined
Weekly Transfusions with Corresponding Hgb for
CABG Patients
Period 1 Period 2 Period 3
02
04
06
0
Tra
nsfu
sed
(
)
Period 1 Period 2 Period 3
Percent of Transfusions at Increasing Hgb
Thresholds All Surgeons Combined
above Hgb of 8 gmdL
above Hgb of 9 gmdL
above Hgb of 10 gmdL
Denotes significantly different than period 1
Denotes significantly different than period 2
Conclusion
bull Though recognizing that this is as yet untested the
perspective that comes with cardiothoracic surgical
training and practice best addresses the above
issues which face every cardiothoracic surgical team
and ICU
As a result thoracic surgeons
bull Should be the directors of the CTICU and
bull Should play an integral part in the delivery of day to day ICU
care
September 12 2016 86
9122016 87
Procedure groups for which models exist bull Isolated CABG (CAB)
bull Isolated Aortic Valve Replacement (AVRepl)
bull Aortic Valve Replacement and CABG (AVRepl+CAB)
bull Isolated Mitral Valve Replacement (MVRepl)
bull Mitral Valve Replacement and CABG (MVRepl+CAB)
bull Isolated Mitral Valve Repair (MVRepr)
bull Mitral Valve Repair and CABG (MVRepr+CAB)
Model endpoints bull Operative Mortality
bull Stroke
bull Renal Failure
bull Prolonged Ventilation
bull Deep Sternal Wound Infection
bull Reoperation
bull MortalityMorbidity combined endpoint (any of the 6 previous endpoints)
bull Prolonged length of stay (length of stay gt14 days)
bull Short length of stay (length of stay lt 6 days
(Based on roughly 27 million patients)
Procedures for which the STS
database has a predictive model

45
67
89
10
11
12
13
14
15
Hg
b(g
md
L)
1 2 3 4 5 6 7 8 9 10 11 12 1314 15 16 17 18 19 2021 22 23 24 25
Week
All Surgeons Combined
Weekly Transfusions with Corresponding Hgb for All
Procedures
Period 1 Period 2 Period 3
02
04
06
0
Tra
nsfu
sed
(
)
Period 1 Period 2 Period 3
Percent of Transfusions at Increasing Hgb
Thresholds All Surgeons Combined
above Hgb of 8 gmdL
above Hgb of 9 gmdL
above Hgb of 10 gmdL
Denotes significantly different than period 1
Denotes significantly different than period 2
Monthly Cardiac Surgery Dashboard
bull Vent Times
bull Reasons for ext gt 6 hrs
bull iNO vs Veletri hrs
bull HyperHypo glycemia
bull Checklist Compliance
bull Staph screening (with reasons
for misses)
bull Blood Utilization
bull CVSICU arrival
bull K+
bull Temp
bull Base Deficit
bull Daily Weights
bull Transfers gt 6 pm
bull Bouncebacks (Total lt 24 hrs)
with Reasons)
September 12 2016 66
And Weekly Mortality and Morbidity
The Johns Hopkins Cardiac Surgery
Code of Conduct and Professional Behavior
September 12 2016 68
Critical Care of the Cardiovascular PatientThe essentials for high quality
1 Full time intensivists
2 Structured Multi-D rounds (Pharmacy)
3 Nurse readbacks
4 Checklists
5 Culture of safetyteamwork (CUSP)
6 Performance improvement requires
bull Multidisciplinary input
bull Agreed upon targets
bull Review of outcomes
bull Continual reassessment
6 Individual accountability matters
Isolated CABG
Post Op Morbidities
0
2
4
6
8
10
12
14
16
18
ANY MORBIDITY(Total)
ProlongedVentilation
MultipleMorbidities
Reoperation Renal Failure CerebrovascularAccident
Deep SternalWound
Mediastinitis
2014 Jan 1 ndash Jun 30
bull Universal public reporting is inevitable
bull ICU care plays a major role in patient
outcomes
September 12 2016 70
Surgeon-Reported Conflicts with Intensivists About
Postoperative Goals of Care
JAMA Surg 201314829-35
bull Vascular Neurologic and
Cardiothoracic Surgeons
bull Mail Questionnaire
bull 56 response rate n = 2100
September 12 2016 71
Rates of Surgeon Reported ConflictsJAMA Surg 201314829-35
September 12 2016 72
0
1
2
3
4
1 2 3 4 5 6 7 8 9 10
Institution
Count of Cardiac Surg
Count of Gen Surg CC
Count of Card Surg CC
Count of Anesth
Count of Anesth CC
Count of Cardiac Anesth
Count of Card Anesth CC
Count of Pulm CC
radic
radic
radic
radic
radic
radic
radic
radic
radic
radic
radic = CT trained
Heterogeneity of Specialties in Cardiac
Intensive Care Units
446537
556
75
889
1943
0 - 6 hrs 6 - 9 hrs 9 - 12 hrs 12 - 18 hrs 18 - 24 hrs gt 24 hrs
ICU
Sta
y(h
rs)
me
an
plusmnS
D
Intubation Duration
p lt 001
p = 070
p = 005
Unadjusted ICU Length of Stay
67 7
8
85
13
0 - 6 hrs 6 - 9 hrs 9 - 12 hrs 12 - 18 hrs 18 - 24 hrs gt 24 hrs
Hospital S
tay
(days)
media
n
(IQ
R)
Intubation Duration
p lt 001
p lt 001
p lt 001
Unadjusted Hospital Length of Stay
Multidisciplinary Teams
Physician Nurse and ge 1 more Health Care
Professional
of Patients with Infection by
RBC Units Transfused2
7
26 3
2
44
90
12
5
21 2
6
26
39
70
12
5
03
00 02 03
17
11
06
00 04 05 1
0
00
0 1 2 3-5 6-9 10+
Overall Infection Pneumonia Sepsis SSI
Total Number of RBC units Transfused
o
f p
ati
en
ts w
ith
In
fecti
on
significantly different (plt005) compared to no RBC exposure
Relationship between Infection
and Ventilation Time1
7
43 46
24
1
13
36 39
20
9
01
02 07
35
04
05
00
23
0-12 12-24 24-48 48+
Ventilation Time vs Infection ()
Overall Infection Pneumonia Sepsis SSI
Length of Mechanical Ventilation (hrs)
P
ati
en
ts w
ith
Infe
cti
on
by T
yp
e
Note 48 of all infections occurred in patients with 48+ hours ventilation
significantly different (plt005) compared to vent time lt12 hrs group
Isolated CABG
Post Op Morbidities
0
2
4
6
8
10
12
14
16
18
ANY MORBIDITY(Total)
ProlongedVentilation
MultipleMorbidities
Reoperation Renal Failure CerebrovascularAccident
Deep SternalWound
Mediastinitis
2013
2014
n= 390
n= 181
2014 Jan 1 ndash Jun 30
2013 and 2014
The Tenets of CUSP
bull Step 1 Safety Attitude Questionnaire (SAQ)
bull Step 2 Educate re Science of Improving
bull Step 3 Identify Defects ( events that should
not recur)
bull Step 4 Executive Partnership to ldquoBridge the
Gaprdquo
bull Step 5 Choose a Defect each Month that
poses a hazard
bull Step 6 ReassessSeptember 12 2016 80
Patients with BD lt -4 and
K lt 33 by Month
21
01
2
0 0
6
01
2
00
5
10
15
20
25
30
35
40
Jul15 Aug15 Sep15 Oct15 Nov15 Dec15 Jan16 Feb16 Mar16 Apr16 May16 Jun16
Quality Improvement
- Insight regarding what metric to target
- A sense of comfort to embark upon
new initiatives
- Involves ability to create consensus
September 12 2016 83
45
67
89
10
11
12
13
14
15
Hg
b(g
md
L)
1 2 3 4 5 6 7 8 9 10 11 12131415161718192021222324 25
Week
All Surgeons Combined
Weekly Transfusions with Corresponding Hgb for
CABG Patients
Period 1 Period 2 Period 3
02
04
06
0
Tra
nsfu
sed
(
)
Period 1 Period 2 Period 3
Percent of Transfusions at Increasing Hgb
Thresholds All Surgeons Combined
above Hgb of 8 gmdL
above Hgb of 9 gmdL
above Hgb of 10 gmdL
Denotes significantly different than period 1
Denotes significantly different than period 2
Conclusion
bull Though recognizing that this is as yet untested the
perspective that comes with cardiothoracic surgical
training and practice best addresses the above
issues which face every cardiothoracic surgical team
and ICU
As a result thoracic surgeons
bull Should be the directors of the CTICU and
bull Should play an integral part in the delivery of day to day ICU
care
September 12 2016 86
9122016 87
Procedure groups for which models exist bull Isolated CABG (CAB)
bull Isolated Aortic Valve Replacement (AVRepl)
bull Aortic Valve Replacement and CABG (AVRepl+CAB)
bull Isolated Mitral Valve Replacement (MVRepl)
bull Mitral Valve Replacement and CABG (MVRepl+CAB)
bull Isolated Mitral Valve Repair (MVRepr)
bull Mitral Valve Repair and CABG (MVRepr+CAB)
Model endpoints bull Operative Mortality
bull Stroke
bull Renal Failure
bull Prolonged Ventilation
bull Deep Sternal Wound Infection
bull Reoperation
bull MortalityMorbidity combined endpoint (any of the 6 previous endpoints)
bull Prolonged length of stay (length of stay gt14 days)
bull Short length of stay (length of stay lt 6 days
(Based on roughly 27 million patients)
Procedures for which the STS
database has a predictive model

02
04
06
0
Tra
nsfu
sed
(
)
Period 1 Period 2 Period 3
Percent of Transfusions at Increasing Hgb
Thresholds All Surgeons Combined
above Hgb of 8 gmdL
above Hgb of 9 gmdL
above Hgb of 10 gmdL
Denotes significantly different than period 1
Denotes significantly different than period 2
Monthly Cardiac Surgery Dashboard
bull Vent Times
bull Reasons for ext gt 6 hrs
bull iNO vs Veletri hrs
bull HyperHypo glycemia
bull Checklist Compliance
bull Staph screening (with reasons
for misses)
bull Blood Utilization
bull CVSICU arrival
bull K+
bull Temp
bull Base Deficit
bull Daily Weights
bull Transfers gt 6 pm
bull Bouncebacks (Total lt 24 hrs)
with Reasons)
September 12 2016 66
And Weekly Mortality and Morbidity
The Johns Hopkins Cardiac Surgery
Code of Conduct and Professional Behavior
September 12 2016 68
Critical Care of the Cardiovascular PatientThe essentials for high quality
1 Full time intensivists
2 Structured Multi-D rounds (Pharmacy)
3 Nurse readbacks
4 Checklists
5 Culture of safetyteamwork (CUSP)
6 Performance improvement requires
bull Multidisciplinary input
bull Agreed upon targets
bull Review of outcomes
bull Continual reassessment
6 Individual accountability matters
Isolated CABG
Post Op Morbidities
0
2
4
6
8
10
12
14
16
18
ANY MORBIDITY(Total)
ProlongedVentilation
MultipleMorbidities
Reoperation Renal Failure CerebrovascularAccident
Deep SternalWound
Mediastinitis
2014 Jan 1 ndash Jun 30
bull Universal public reporting is inevitable
bull ICU care plays a major role in patient
outcomes
September 12 2016 70
Surgeon-Reported Conflicts with Intensivists About
Postoperative Goals of Care
JAMA Surg 201314829-35
bull Vascular Neurologic and
Cardiothoracic Surgeons
bull Mail Questionnaire
bull 56 response rate n = 2100
September 12 2016 71
Rates of Surgeon Reported ConflictsJAMA Surg 201314829-35
September 12 2016 72
0
1
2
3
4
1 2 3 4 5 6 7 8 9 10
Institution
Count of Cardiac Surg
Count of Gen Surg CC
Count of Card Surg CC
Count of Anesth
Count of Anesth CC
Count of Cardiac Anesth
Count of Card Anesth CC
Count of Pulm CC
radic
radic
radic
radic
radic
radic
radic
radic
radic
radic
radic = CT trained
Heterogeneity of Specialties in Cardiac
Intensive Care Units
446537
556
75
889
1943
0 - 6 hrs 6 - 9 hrs 9 - 12 hrs 12 - 18 hrs 18 - 24 hrs gt 24 hrs
ICU
Sta
y(h
rs)
me
an
plusmnS
D
Intubation Duration
p lt 001
p = 070
p = 005
Unadjusted ICU Length of Stay
67 7
8
85
13
0 - 6 hrs 6 - 9 hrs 9 - 12 hrs 12 - 18 hrs 18 - 24 hrs gt 24 hrs
Hospital S
tay
(days)
media
n
(IQ
R)
Intubation Duration
p lt 001
p lt 001
p lt 001
Unadjusted Hospital Length of Stay
Multidisciplinary Teams
Physician Nurse and ge 1 more Health Care
Professional
of Patients with Infection by
RBC Units Transfused2
7
26 3
2
44
90
12
5
21 2
6
26
39
70
12
5
03
00 02 03
17
11
06
00 04 05 1
0
00
0 1 2 3-5 6-9 10+
Overall Infection Pneumonia Sepsis SSI
Total Number of RBC units Transfused
o
f p
ati
en
ts w
ith
In
fecti
on
significantly different (plt005) compared to no RBC exposure
Relationship between Infection
and Ventilation Time1
7
43 46
24
1
13
36 39
20
9
01
02 07
35
04
05
00
23
0-12 12-24 24-48 48+
Ventilation Time vs Infection ()
Overall Infection Pneumonia Sepsis SSI
Length of Mechanical Ventilation (hrs)
P
ati
en
ts w
ith
Infe
cti
on
by T
yp
e
Note 48 of all infections occurred in patients with 48+ hours ventilation
significantly different (plt005) compared to vent time lt12 hrs group
Isolated CABG
Post Op Morbidities
0
2
4
6
8
10
12
14
16
18
ANY MORBIDITY(Total)
ProlongedVentilation
MultipleMorbidities
Reoperation Renal Failure CerebrovascularAccident
Deep SternalWound
Mediastinitis
2013
2014
n= 390
n= 181
2014 Jan 1 ndash Jun 30
2013 and 2014
The Tenets of CUSP
bull Step 1 Safety Attitude Questionnaire (SAQ)
bull Step 2 Educate re Science of Improving
bull Step 3 Identify Defects ( events that should
not recur)
bull Step 4 Executive Partnership to ldquoBridge the
Gaprdquo
bull Step 5 Choose a Defect each Month that
poses a hazard
bull Step 6 ReassessSeptember 12 2016 80
Patients with BD lt -4 and
K lt 33 by Month
21
01
2
0 0
6
01
2
00
5
10
15
20
25
30
35
40
Jul15 Aug15 Sep15 Oct15 Nov15 Dec15 Jan16 Feb16 Mar16 Apr16 May16 Jun16
Quality Improvement
- Insight regarding what metric to target
- A sense of comfort to embark upon
new initiatives
- Involves ability to create consensus
September 12 2016 83
45
67
89
10
11
12
13
14
15
Hg
b(g
md
L)
1 2 3 4 5 6 7 8 9 10 11 12131415161718192021222324 25
Week
All Surgeons Combined
Weekly Transfusions with Corresponding Hgb for
CABG Patients
Period 1 Period 2 Period 3
02
04
06
0
Tra
nsfu
sed
(
)
Period 1 Period 2 Period 3
Percent of Transfusions at Increasing Hgb
Thresholds All Surgeons Combined
above Hgb of 8 gmdL
above Hgb of 9 gmdL
above Hgb of 10 gmdL
Denotes significantly different than period 1
Denotes significantly different than period 2
Conclusion
bull Though recognizing that this is as yet untested the
perspective that comes with cardiothoracic surgical
training and practice best addresses the above
issues which face every cardiothoracic surgical team
and ICU
As a result thoracic surgeons
bull Should be the directors of the CTICU and
bull Should play an integral part in the delivery of day to day ICU
care
September 12 2016 86
9122016 87
Procedure groups for which models exist bull Isolated CABG (CAB)
bull Isolated Aortic Valve Replacement (AVRepl)
bull Aortic Valve Replacement and CABG (AVRepl+CAB)
bull Isolated Mitral Valve Replacement (MVRepl)
bull Mitral Valve Replacement and CABG (MVRepl+CAB)
bull Isolated Mitral Valve Repair (MVRepr)
bull Mitral Valve Repair and CABG (MVRepr+CAB)
Model endpoints bull Operative Mortality
bull Stroke
bull Renal Failure
bull Prolonged Ventilation
bull Deep Sternal Wound Infection
bull Reoperation
bull MortalityMorbidity combined endpoint (any of the 6 previous endpoints)
bull Prolonged length of stay (length of stay gt14 days)
bull Short length of stay (length of stay lt 6 days
(Based on roughly 27 million patients)
Procedures for which the STS
database has a predictive model

Isolated CABG
Post Op Morbidities
0
2
4
6
8
10
12
14
16
18
ANY MORBIDITY(Total)
ProlongedVentilation
MultipleMorbidities
Reoperation Renal Failure CerebrovascularAccident
Deep SternalWound
Mediastinitis
2014 Jan 1 ndash Jun 30
bull Universal public reporting is inevitable
bull ICU care plays a major role in patient
outcomes
September 12 2016 70
Surgeon-Reported Conflicts with Intensivists About
Postoperative Goals of Care
JAMA Surg 201314829-35
bull Vascular Neurologic and
Cardiothoracic Surgeons
bull Mail Questionnaire
bull 56 response rate n = 2100
September 12 2016 71
Rates of Surgeon Reported ConflictsJAMA Surg 201314829-35
September 12 2016 72
0
1
2
3
4
1 2 3 4 5 6 7 8 9 10
Institution
Count of Cardiac Surg
Count of Gen Surg CC
Count of Card Surg CC
Count of Anesth
Count of Anesth CC
Count of Cardiac Anesth
Count of Card Anesth CC
Count of Pulm CC
radic
radic
radic
radic
radic
radic
radic
radic
radic
radic
radic = CT trained
Heterogeneity of Specialties in Cardiac
Intensive Care Units
446537
556
75
889
1943
0 - 6 hrs 6 - 9 hrs 9 - 12 hrs 12 - 18 hrs 18 - 24 hrs gt 24 hrs
ICU
Sta
y(h
rs)
me
an
plusmnS
D
Intubation Duration
p lt 001
p = 070
p = 005
Unadjusted ICU Length of Stay
67 7
8
85
13
0 - 6 hrs 6 - 9 hrs 9 - 12 hrs 12 - 18 hrs 18 - 24 hrs gt 24 hrs
Hospital S
tay
(days)
media
n
(IQ
R)
Intubation Duration
p lt 001
p lt 001
p lt 001
Unadjusted Hospital Length of Stay
Multidisciplinary Teams
Physician Nurse and ge 1 more Health Care
Professional
of Patients with Infection by
RBC Units Transfused2
7
26 3
2
44
90
12
5
21 2
6
26
39
70
12
5
03
00 02 03
17
11
06
00 04 05 1
0
00
0 1 2 3-5 6-9 10+
Overall Infection Pneumonia Sepsis SSI
Total Number of RBC units Transfused
o
f p
ati
en
ts w
ith
In
fecti
on
significantly different (plt005) compared to no RBC exposure
Relationship between Infection
and Ventilation Time1
7
43 46
24
1
13
36 39
20
9
01
02 07
35
04
05
00
23
0-12 12-24 24-48 48+
Ventilation Time vs Infection ()
Overall Infection Pneumonia Sepsis SSI
Length of Mechanical Ventilation (hrs)
P
ati
en
ts w
ith
Infe
cti
on
by T
yp
e
Note 48 of all infections occurred in patients with 48+ hours ventilation
significantly different (plt005) compared to vent time lt12 hrs group
Isolated CABG
Post Op Morbidities
0
2
4
6
8
10
12
14
16
18
ANY MORBIDITY(Total)
ProlongedVentilation
MultipleMorbidities
Reoperation Renal Failure CerebrovascularAccident
Deep SternalWound
Mediastinitis
2013
2014
n= 390
n= 181
2014 Jan 1 ndash Jun 30
2013 and 2014
The Tenets of CUSP
bull Step 1 Safety Attitude Questionnaire (SAQ)
bull Step 2 Educate re Science of Improving
bull Step 3 Identify Defects ( events that should
not recur)
bull Step 4 Executive Partnership to ldquoBridge the
Gaprdquo
bull Step 5 Choose a Defect each Month that
poses a hazard
bull Step 6 ReassessSeptember 12 2016 80
Patients with BD lt -4 and
K lt 33 by Month
21
01
2
0 0
6
01
2
00
5
10
15
20
25
30
35
40
Jul15 Aug15 Sep15 Oct15 Nov15 Dec15 Jan16 Feb16 Mar16 Apr16 May16 Jun16
Quality Improvement
- Insight regarding what metric to target
- A sense of comfort to embark upon
new initiatives
- Involves ability to create consensus
September 12 2016 83
45
67
89
10
11
12
13
14
15
Hg
b(g
md
L)
1 2 3 4 5 6 7 8 9 10 11 12131415161718192021222324 25
Week
All Surgeons Combined
Weekly Transfusions with Corresponding Hgb for
CABG Patients
Period 1 Period 2 Period 3
02
04
06
0
Tra
nsfu
sed
(
)
Period 1 Period 2 Period 3
Percent of Transfusions at Increasing Hgb
Thresholds All Surgeons Combined
above Hgb of 8 gmdL
above Hgb of 9 gmdL
above Hgb of 10 gmdL
Denotes significantly different than period 1
Denotes significantly different than period 2
Conclusion
bull Though recognizing that this is as yet untested the
perspective that comes with cardiothoracic surgical
training and practice best addresses the above
issues which face every cardiothoracic surgical team
and ICU
As a result thoracic surgeons
bull Should be the directors of the CTICU and
bull Should play an integral part in the delivery of day to day ICU
care
September 12 2016 86
9122016 87
Procedure groups for which models exist bull Isolated CABG (CAB)
bull Isolated Aortic Valve Replacement (AVRepl)
bull Aortic Valve Replacement and CABG (AVRepl+CAB)
bull Isolated Mitral Valve Replacement (MVRepl)
bull Mitral Valve Replacement and CABG (MVRepl+CAB)
bull Isolated Mitral Valve Repair (MVRepr)
bull Mitral Valve Repair and CABG (MVRepr+CAB)
Model endpoints bull Operative Mortality
bull Stroke
bull Renal Failure
bull Prolonged Ventilation
bull Deep Sternal Wound Infection
bull Reoperation
bull MortalityMorbidity combined endpoint (any of the 6 previous endpoints)
bull Prolonged length of stay (length of stay gt14 days)
bull Short length of stay (length of stay lt 6 days
(Based on roughly 27 million patients)
Procedures for which the STS
database has a predictive model

0
1
2
3
4
1 2 3 4 5 6 7 8 9 10
Institution
Count of Cardiac Surg
Count of Gen Surg CC
Count of Card Surg CC
Count of Anesth
Count of Anesth CC
Count of Cardiac Anesth
Count of Card Anesth CC
Count of Pulm CC
radic
radic
radic
radic
radic
radic
radic
radic
radic
radic
radic = CT trained
Heterogeneity of Specialties in Cardiac
Intensive Care Units
446537
556
75
889
1943
0 - 6 hrs 6 - 9 hrs 9 - 12 hrs 12 - 18 hrs 18 - 24 hrs gt 24 hrs
ICU
Sta
y(h
rs)
me
an
plusmnS
D
Intubation Duration
p lt 001
p = 070
p = 005
Unadjusted ICU Length of Stay
67 7
8
85
13
0 - 6 hrs 6 - 9 hrs 9 - 12 hrs 12 - 18 hrs 18 - 24 hrs gt 24 hrs
Hospital S
tay
(days)
media
n
(IQ
R)
Intubation Duration
p lt 001
p lt 001
p lt 001
Unadjusted Hospital Length of Stay
Multidisciplinary Teams
Physician Nurse and ge 1 more Health Care
Professional
of Patients with Infection by
RBC Units Transfused2
7
26 3
2
44
90
12
5
21 2
6
26
39
70
12
5
03
00 02 03
17
11
06
00 04 05 1
0
00
0 1 2 3-5 6-9 10+
Overall Infection Pneumonia Sepsis SSI
Total Number of RBC units Transfused
o
f p
ati
en
ts w
ith
In
fecti
on
significantly different (plt005) compared to no RBC exposure
Relationship between Infection
and Ventilation Time1
7
43 46
24
1
13
36 39
20
9
01
02 07
35
04
05
00
23
0-12 12-24 24-48 48+
Ventilation Time vs Infection ()
Overall Infection Pneumonia Sepsis SSI
Length of Mechanical Ventilation (hrs)
P
ati
en
ts w
ith
Infe
cti
on
by T
yp
e
Note 48 of all infections occurred in patients with 48+ hours ventilation
significantly different (plt005) compared to vent time lt12 hrs group
Isolated CABG
Post Op Morbidities
0
2
4
6
8
10
12
14
16
18
ANY MORBIDITY(Total)
ProlongedVentilation
MultipleMorbidities
Reoperation Renal Failure CerebrovascularAccident
Deep SternalWound
Mediastinitis
2013
2014
n= 390
n= 181
2014 Jan 1 ndash Jun 30
2013 and 2014
The Tenets of CUSP
bull Step 1 Safety Attitude Questionnaire (SAQ)
bull Step 2 Educate re Science of Improving
bull Step 3 Identify Defects ( events that should
not recur)
bull Step 4 Executive Partnership to ldquoBridge the
Gaprdquo
bull Step 5 Choose a Defect each Month that
poses a hazard
bull Step 6 ReassessSeptember 12 2016 80
Patients with BD lt -4 and
K lt 33 by Month
21
01
2
0 0
6
01
2
00
5
10
15
20
25
30
35
40
Jul15 Aug15 Sep15 Oct15 Nov15 Dec15 Jan16 Feb16 Mar16 Apr16 May16 Jun16
Quality Improvement
- Insight regarding what metric to target
- A sense of comfort to embark upon
new initiatives
- Involves ability to create consensus
September 12 2016 83
45
67
89
10
11
12
13
14
15
Hg
b(g
md
L)
1 2 3 4 5 6 7 8 9 10 11 12131415161718192021222324 25
Week
All Surgeons Combined
Weekly Transfusions with Corresponding Hgb for
CABG Patients
Period 1 Period 2 Period 3
02
04
06
0
Tra
nsfu
sed
(
)
Period 1 Period 2 Period 3
Percent of Transfusions at Increasing Hgb
Thresholds All Surgeons Combined
above Hgb of 8 gmdL
above Hgb of 9 gmdL
above Hgb of 10 gmdL
Denotes significantly different than period 1
Denotes significantly different than period 2
Conclusion
bull Though recognizing that this is as yet untested the
perspective that comes with cardiothoracic surgical
training and practice best addresses the above
issues which face every cardiothoracic surgical team
and ICU
As a result thoracic surgeons
bull Should be the directors of the CTICU and
bull Should play an integral part in the delivery of day to day ICU
care
September 12 2016 86
9122016 87
Procedure groups for which models exist bull Isolated CABG (CAB)
bull Isolated Aortic Valve Replacement (AVRepl)
bull Aortic Valve Replacement and CABG (AVRepl+CAB)
bull Isolated Mitral Valve Replacement (MVRepl)
bull Mitral Valve Replacement and CABG (MVRepl+CAB)
bull Isolated Mitral Valve Repair (MVRepr)
bull Mitral Valve Repair and CABG (MVRepr+CAB)
Model endpoints bull Operative Mortality
bull Stroke
bull Renal Failure
bull Prolonged Ventilation
bull Deep Sternal Wound Infection
bull Reoperation
bull MortalityMorbidity combined endpoint (any of the 6 previous endpoints)
bull Prolonged length of stay (length of stay gt14 days)
bull Short length of stay (length of stay lt 6 days
(Based on roughly 27 million patients)
Procedures for which the STS
database has a predictive model


