Results of the 2015 Hospital National Antimicrobial
Prescribing Survey
Antimicrobial prescribing
practice in Australian
hospitals
December 2016

Published by the Australian Commission on Safety and Quality in Health Care
Postal address; GPO Box 5480, Sydney NSW 2001Phone: (02) 9126 3600; international +61 2 9126 3600Email: [email protected]: www.safetyandquality.gov.au
ISBN 978-1-925224-57-3 (print)ISBN 978-1-925224-58-0 (online)
© Commonwealth of Australia 2016
All material and work produced by the Australian Commission on Safety and Quality in Health Care isprotected by Commonwealth copyright. It may be reproduced in whole or in part for study or trainingpurposes, subject to the inclusion of an acknowledgement of the source.
The Commission’s preference is that you attribute this publication (and any material sourced from it) usingthe following citation:
National Centre for Antimicrobial Stewardship and Australian Commission on Safety and Quality in HealthCare. Antimicrobial prescribing practice in Australian hospitals: Results of the 2015 National AntimicrobialPrescribing Survey. Sydney: ACSQHC; 2016.
Enquiries regarding the use of this publication are welcome and can be sent [email protected].

Antimicrobial prescribing practice in Australian hospitals
Results of the 2015 Hospital National Antimicrobial Prescribing Survey
December 2016


Antimicrobial prescribing practice in Australian hospitals iii
Contents
Abbreviations ....................................... iv
Executive summary ...............................1
Background ............................................3
Methods ..................................................4
Timing ........................................................................ 4
Recruitment ............................................................ 4
Auditors .................................................................... 4
Limitations in methodology .............................5
Modifications for the 2015 survey ..................5
Revision of survey methodology ......................5
Modifications to data set specifications .......6
Support for auditors ............................................7
Expert assessments ................................................7
Development of templates to help hospitals communicate local survey results .............................................................7
Findings...................................................8
Participation .............................................................8
State and Territory ...................................................8
Peer group ...................................................................8
Remoteness classification ....................................9
Types of surveys performed and number of prescriptions .................................10
Key indicators ....................................................... 11
Documentation of indication ............................ 15
Documentation of review or stop date........ 15
Surgical prophylaxis for more than 24 hours ...................................................................... 16
Compliance with guidelines .............................. 16
Appropriateness ..................................................... 16
Most commonly prescribed antimicrobials ........................................................ 16
Appropriateness for the 20 most commonly prescribed antimicrobials ........... 16
Poorly prescribed antimicrobials .................... 19
Most common indications ..............................20
Appropriateness of prescribing for the 20 most common indications ......................... 22
Prophylaxis ............................................................... 22
Indications for which prescribing was most commonly assessed as inappropriate ........................................................... 22
Compliance with guidelines for the 20 most common indications .........................24
Feedback ..............................................26
Local use of NAPS results ..............................26
Conclusion ...........................................27
Appendix 1 Hospital NAPS data collection form ..............28
Appendix 2 Participating public hospitals, by peer group, 2015 ...........29
Appendix 3 Participating private hospitals, by peer group, 2015 .................... 30
Appendix 4 Numbers of prescriptions, by hospital peer group, 2015 .................................. 31
Appendix 5 Hospital NAPS definitions of appropriateness ............32

Australian Commission on Safety and Quality in Health Careiv
Abbreviations
AMS antimicrobial stewardshipCOPD chronic obstructive pulmonary diseaseICP infection control practitionerNAPS National Antimicrobial Prescribing SurveyNCAS National Centre for Antimicrobial StewardshipPPS point prevalence surveyPePS period prevalence surveysPPS serial point prevalence survey

Antimicrobial prescribing practice in Australian hospitals 1
Executive summaryThe National Antimicrobial Prescribing Survey (NAPS), which is conducted by the National Centre for Antimicrobial Stewardship (NCAS), is in its fourth year. NAPS has become an important tool for hospitals to support their local antimicrobial stewardship (AMS) programs, and to meet the requirements for accreditation against National Safety and Quality Health Service (NSQHS) Standard 3: Preventing and Controlling Healthcare Associated Infections. The NSQHS Standards were developed by the Australian Commission on Safety and Quality in Health Care (the Commission) to protect the public from harm, and to improve the quality of care provided by health service organisations through the implementation of quality assurance and quality improvement mechanisms.1
NAPS is a component of the Antimicrobial Use and Resistance in Australia (AURA) Surveillance System, which the Commission established with funding provided by the Australian Government Department of Health. NAPS uniquely focuses on measuring the appropriateness of antimicrobial prescribing.
AURA and NAPS directly support a number of key objectives of Australia’s first National Antimicrobial Resistance Strategy.2 NAPS advances the appropriate and judicious use of antimicrobials by:
• facilitating effective audit and review of antimicrobial use, including compliance with prescribing guidelines and prescribing appropriateness
• facilitating effective communication about antimicrobial use and identifying key areas of concern
1 Australian Commission on Safety and Quality in Health Care. National Safety and Quality Health Service Standards. Sydney: ACSQHC, 2012.
2 Commonwealth of Australia. Responding to the threat of antimicrobial resistance: Australia’s first National Antimicrobial Resistance Strategy 2015–2019. Canberra: Commonwealth of Australia, 2015.
• supporting education and training of the workforce by informing local AMS programs
• providing flexible and useful benchmarking within hospitals across units and wards, and between hospitals and jurisdictions.
The uptake of the Hospital NAPS by Australian hospitals has continued to grow, with representation across all states and territories. In 2015, 83% of principal referral hospitals and 74% of large acute public hospitals participated in the survey. In the private hospitals, 50% of group A and 42% of group B hospitals participated. The greatest increases in participation occurred in inner and outer regional centres. Overall, there was a 13.3% increase in participation compared with the 2014 Hospital NAPS.
Each year, the Hospital NAPS is reviewed and modified to support the requirements of end users. For the 2015 survey, recommendations regarding survey methodology according to hospital size were included, together with documentation of review or stop date for antimicrobials as a new key indicator.
The 2015 data from 281 hospitals (213 public and 68 private) and 22 021 prescriptions shows similar results to the 2013 and 2014 Hospital NAPS. Analysis of all prescriptions showed that documentation of indication remained steady at 72.5%, noncompliance with guidelines was 23.3%, and inappropriateness of prescribing was 21.9%. The addition of ‘review or stop date’ as a new indicator revealed very low levels of documentation (35.5%), identifying this as an area for future improvement.
In 2015, there was a reduction in the proportion of surgical prophylaxis prescriptions continuing beyond 24 hours (27.4% in 2015, compared with 35.9% in 2014). However, it is unclear whether this is due to changes in the characteristics of participating hospitals or to real improvement across all facilities.
The most common indications for prescribing antimicrobials were surgical prophylaxis (15.5%), community-acquired pneumonia (10.5%), medical

Australian Commission on Safety and Quality in Health Care2
prophylaxis (7.6%), sepsis (5.7%) and urinary tract infection (5.0%). Some specific observations included high levels of prescribing for surgical prophylaxis, exacerbations of chronic obstructive pulmonary disease and asthma, and bronchitis.
The most common antimicrobials prescribed were cefazolin, ceftriaxone, metronidazole, amoxicillin–clavulanate and piperacillin–tazobactam. The appropriateness of prescribing for these five antimicrobials ranged from 65.1% to 77.6% in 2015, a slight increase from the 2014 Hospital NAPS scores of 63.1% to 76.9%. The high rates of inappropriate prescribing of cephalexin (39.2%) remain a concern. Most inappropriate use of cephalexin occurred in surgical prophylaxis, urinary tract infections and pneumonia.
Feedback on the 2015 Hospital NAPS was positive. Participants reported that yearly participation formed an integral part of their AMS programs, and that they appreciated the support and educational sessions provided by the NAPS team. Many participants also reported that their facility’s NAPS results were presented to high-level AMS, medical advisory, and drug and therapeutic governance committees. NAPS results were used to design local education programs, support hospital accreditation and improve the standard of clinical care.
The professional breakdown of auditors included pharmacists (61.1%), nurses and infection control practitioners (19.9% combined), and doctors (13.3%). There was a substantial difference in auditor profession between public and private hospitals, with the majority of auditors in private hospitals being nurses and infection control practitioners (51.2%).
The NCAS and the Commission are committed to supporting strategies to enhance AMS in Australia. With support from the Commission, the NCAS has expanded NAPS audits to include residential aged-care facilities and multipurpose services, and surgical prophylaxis.
The results of the Aged Care NAPS pilot3 highlighted key areas for quality improvement, including prolonged durations of therapy, and poor documentation.
Findings from each NAPS module help to strengthen AMS programs by building competencies, increasing awareness of appropriate prescribing and guidelines, informing education and targeted quality improvement, and monitoring performance over time.
3 National Centre for Antimicrobial Stewardship, and Australian Commission on Safety and Quality in Health Care. Antimicrobial prescribing and infections in Australian residential aged care facilities: results of the 2015 Aged Care National Antimicrobial Prescribing Survey pilot. Sydney: ACSQHC, 2016.
I loved this audit. I really appreciated the timeliness in which I could access expert opinion and felt supported in conducting the audit. Local medical officers appreciated the audit and feedback, which we turned into an education session. Very beneficial all round! – regional hospital ICP

Antimicrobial prescribing practice in Australian hospitals 3
BackgroundAntimicrobial resistance is a major public health concern, contributing to poor patient outcomes, morbidity, mortality and substantial costs to the healthcare system. The September 2016 United Nations declaration on antimicrobial resistance reinforces the World Health Organization’s Global Action Plan on Antimicrobial Resistance. Australia, as a signatory to the United Nations declaration, is well placed to contribute effectively to the global response through implementation of its first National Antimicrobial Resistance Strategy 2015–2019.4 Surveillance programs such as the National Antimicrobial Prescribing Survey (NAPS) support improved understanding of the use of antimicrobial medicines in hospitals and raise awareness among health professionals about how to prevent antimicrobial-resistant infections.
The development and implementation of NAPS has been an ongoing collaboration between the National Centre for Antimicrobial Stewardship (NCAS) and the Australian Commission on Safety and Quality in Health Care (the Commission). NAPS is developed and administered by the Guidance Group at Melbourne Health. The data derived from the Hospital NAPS and Aged Care NAPS modules has significantly contributed to the Commission’s Antimicrobial Usage and Resistance in Australia (AURA) Surveillance System. The AURA Surveillance System plays a pivotal role in informing local, jurisdictional and national policy, and in the development of strategies to prevent and contain antimicrobial resistance in Australia.
In 2015, the Australian Government released Australia’s first National Antimicrobial Resistance Strategy 2015–2019, which outlines a framework to address antimicrobial resistance using an integrated and coordinated One Health approach.5 NAPS supports achievement of the objectives of the national strategy through education and training of the healthcare workforce, and facilitating antimicrobial audit and review to enable implementation of antimicrobial stewardship (AMS)
4 Commonwealth of Australia. Responding to the threat of antimicrobial resistance: Australia’s first National Antimicrobial Resistance Strategy 2015–2019. Canberra: Commonwealth of Australia, 2015.
5 ‘One Health’ refers to a coordinated, collaborative, multidisciplinary and cross-sectoral approach to the development of health strategies for people, animals and the environment.
practices that improve the appropriate and judicious use of antimicrobials.
NAPS delivers insights into the appropriateness of antimicrobial prescribing at both a local and national level. Since the launch of the web-based survey in 2013, NAPS has diversified and grown into a program that supports effective AMS across Australian hospital and aged-care settings. The data available from each NAPS module, especially the Hospital NAPS, has contributed to local, jurisdictional and national antimicrobial prescribing strategies to improve the quality of antimicrobial prescribing and care delivered to patients. To investigate prescribing practices for surgical prophylaxis, and the impact of compliance on surgical site infections and patient outcomes, the Surgical NAPS module pilot was launched in July 2016. As well, the development and successful implementation of the Aged Care NAPS in 2015 provided Australia with valuable insights into the appropriateness of antimicrobial prescribing in residential aged-care facilities and multipurpose facilities.
The Hospital NAPS is the flagship survey of the NCAS. Participation has grown from 32 pilot sites (30 public and 2 private) in 2011, when the survey was paper based, to 281 hospitals (213 public and 68 private) in 2015. This report focuses on the results of the 2015 Hospital NAPS.

Australian Commission on Safety and Quality in Health Care4
Methods
TimingThe 2015 Hospital NAPS was launched in September 2015, and data collection closed in February 2016.
Hospitals were encouraged to conduct their survey before Antibiotic Awareness Week in November 2015, so that results would be available for discussion and education.
RecruitmentApproximately 900 individuals across 400 hospitals registered on the NAPS website were invited to participate in the 2015 Hospital NAPS. The Commission actively recruited hospitals, with a focus on increasing rural and remote representation. Further promotion occurred through tweets by the Commission and the NCAS throughout October and November 2015.
AuditorsThe majority of auditors were pharmacists (61.1%), followed by nurses and infection control practitioners (ICPs; 19.9% combined), and doctors (13.3%). Similar to the 2014 Hospital NAPS, there was a substantial difference in auditor occupation between public and private hospitals (Figure 1). In private hospitals, nurses and ICPs comprised the majority of auditors (51.2%), and only one doctor was involved in the audit. In public hospitals, pharmacists were the leading auditors, followed by doctors, then nurses and ICPs.
Most auditors were pharmacists across all three remoteness classifications (regional, remote and very remote). A higher proportion of nurses and ICPs completed the Hospital NAPS in regional and remote hospitals than in metropolitan hospitals.
Figure 1 Occupation of auditors, by hospital funding type, 2015
Per
cent
age
0
10
20
30
40
50
60
70
80
Private (n = 121) Public (n = 648)
Pharmacist Nurse or infection control practitioner Doctor Other
37.2
51.2
0.8
10.7
65.4
14.3 15.5
4.8
Figure 1 Occupation of auditors, by hospital funding type, 2015
Per
cent
age
0
10
20
30
40
50
60
70
80
Private (n = 121) Public (n = 648)
Pharmacist Nurse or infection control practitioner Doctor Other
37.2
51.2
0.8
10.7
65.4
14.3 15.5
4.8

Antimicrobial prescribing practice in Australian hospitals 5
Limitations in methodologyThe results in this report should be interpreted in the context of the following limitations:
• Sampling and selection bias: The hospitals included were not a randomised sample because participation by healthcare facilities was voluntary. Hence, the results might not be representative of all Australian hospitals.
• Comparison with previous surveys: This report includes the results of the 2013, 2014 and 2015 Hospital NAPS. However, the ability to directly compare results with those from previous years is limited as a result of changes in inclusion criteria, methodology and distribution of participating hospitals. Additionally, a small number of hospitals used the 2014 methodology for the 2015 survey.
• Patients may be counted multiple times: For facilities that conducted a serial point prevalence survey, patients may be counted multiple times if they were still an inpatient on subsequent audit days. This may artificially inflate the prevalence of certain indications or antimicrobials that require longer durations of treatment.
• Subjective nature of assessments: Individual auditors at each participating facility were responsible for assessing the appropriateness of antimicrobial prescribing and compliance with guidelines. Remote expert assessments were conducted by the NAPS team on request. These assessments are not completely objective and involve some degree of interpretation.
• Sample size: Some indications for antimicrobials are uncommon; therefore, interpretation is difficult because of small numbers.
Modifications for the 2015 surveySeveral modifications were made to the methods and data content of the 2015 survey. Users were notified of the changes through email, the NAPS website and online training sessions.
Revision of survey methodologyTo improve the robustness of the 2015 Hospital NAPS data, to allow increased surveillance and benchmarking, revisions were made to the following areas of the NAPS methodology (see Table 1):• Replacement of the period prevalence survey
(PePS) with the serial point prevalence survey (sPPS). Feedback from 2013 and 2014 Hospital NAPS participants indicated the need for improved information about how to conduct a PePS, particularly about how to accurately report denominator information to estimate prevalence measures. The sPPS methodology allows hospitals to conduct repeated point prevalence surveys (PPSs) at regular intervals – for example, weekly or fortnightly – until they reach the minimum of 30 antimicrobial prescriptions. Since inpatients could be surveyed more than once using the PPS methodology, it was decided that only patients on the first audit day could be included in prevalence estimates.
• Provision of more detailed descriptions of how to conduct a randomised sample survey, including examples of randomisation strategies and suggestions for random number generator tools. This methodology was recommended for larger hospitals with more than 100 beds without the capacity to conduct a whole-hospital PPS.
• Provision of clearer instructions that directed surveys for targeted specialties, wards, antimicrobials or indications could not be included in national benchmarking. Instead, participants were provided with examples of how directed surveys could be used in conjunction with the results from the Hospital NAPS to more thoroughly investigate areas for improvement.

Australian Commission on Safety and Quality in Health Care6
Table 1 Matrix in the NAPS user guide for study type, data use and recommended hospital size category
Study type
Data suitable for
Recommended forPrevalence estimatesAppropriateness of
prescribingPoint prevalence survey (preferred)
ü ü All hospitals if resources sufficient
Serial point prevalence survey
ü
(first day only)ü
(if sufficient data collected, e.g. >30 prescriptions)
Smaller hospitals (e.g. <100 beds)
Random sampling point prevalence survey
ü
(if sampled appropriately across whole hospital)
ü Only hospitals with ≥100 beds
Directed survey X ü All hospitals, if required
Modifications to data set specificationsThe data collection form for the 2015 Hospital NAPS is at Appendix 1.
The four major changes to the data collection form were as follows:• Review or stop date documented was added
as a key indicator, since this is now included in quality statement 6 of the Commission’s Antimicrobial Stewardship Clinical Care Standard.6
• Currently in ICU/NICU (intensive care unit/neonatal intensive care unit) was added to enable better benchmarking and analysis of prescribing for ICU patients.
• Renal replacement therapy given within the previous 24 hours was added to prompt users to consider the effect of any renal replacement therapy (e.g. haemodialysis) when assessing dose appropriateness.
• Indication does not require any antimicrobials is a renaming of the previous ‘antimicrobial not indicated’ statement. The original intention of ‘antimicrobial not indicated’ was to cover situations where an antimicrobial was not required at all. Because some participants found this ambiguous, the statement was renamed to clarify its meaning.
6 Australian Commission on Safety and Quality in Health Care. Antimicrobial Stewardship Clinical Care Standard. Sydney: ACSQHC, 2014.
Changes were also made to the online database, including:• improvements to the reporting functionality, with
new graphs and tables, and clearer rules about the displaying of benchmarking results
• changes to hospital peer group classifications to reflect the Australian Institute of Health and Welfare (AIHW) updated peer group classifications for private hospitals, released in 2015
• reducing the minimum number of hospitals required for benchmarking results to be displayed from seven to three; seven was considered too high, particularly for specialist hospitals or hospitals from smaller states and territories.
The 2014 AIHW Australian hospital peer group classification described in Australian hospital statistics 2012–13 7 has been used for analysis of data submitted by public hospitals. The 2015 Australian hospital peer group classification described in Australian hospital peer groups 8 has been used for analysis of data submitted by private hospitals.
The denominator for hospitals in each peer group is based on data supplied to the NCAS by the AIHW in January 2015.
7 www.aihw.gov.au/WorkArea/DownloadAsset.aspx?id=60129547084
8 www.aihw.gov.au/WorkArea/DownloadAsset.aspx?id=60129553443

Antimicrobial prescribing practice in Australian hospitals 7
Support for auditorsThe NAPS team provided email, telephone and online support to participating sites throughout the data collection period. Participants could attend a one-hour online training session, or a shortened refresher session for existing participants.
Expert assessmentsAn expert assessment service was provided by the NAPS team. Hospitals without access to infectious diseases specialists were offered assistance in the assessment of compliance and appropriateness. Other hospitals could request such assessment, if they felt it would improve the quality of the audit.
Development of templates to help hospitals communicate local survey resultsA large number of regional, remote and private hospitals requested advice about the most effective method for presenting and sharing their 2015 Hospital NAPS results within their hospitals. A standardised reporting template and accompanying example report were developed as a guide, and additional links to useful presentations and posters were provided.
As a small private hospital with no infectious diseases medical staff, or access to any, to have NAPS staff able to review our hospital’s data is a huge benefit and allows our results to have more credibility when reporting findings to visiting medical staff that admit to our hospital. – regional hospital ICP

Australian Commission on Safety and Quality in Health Care8
Findings
ParticipationA total of 300 hospitals submitted data during the data collection period. Because of methodological requirements for the 2015 survey, only hospitals that conducted whole-hospital audits (PPS, sPPS or randomised sample) were included in the analyses (Figure 2). Directed surveys and ‘other’ survey methodologies were excluded because of the potential for systematic bias.
Data submitted from 281 hospitals (213 public and 68 private) was therefore analysed and is presented in this report.
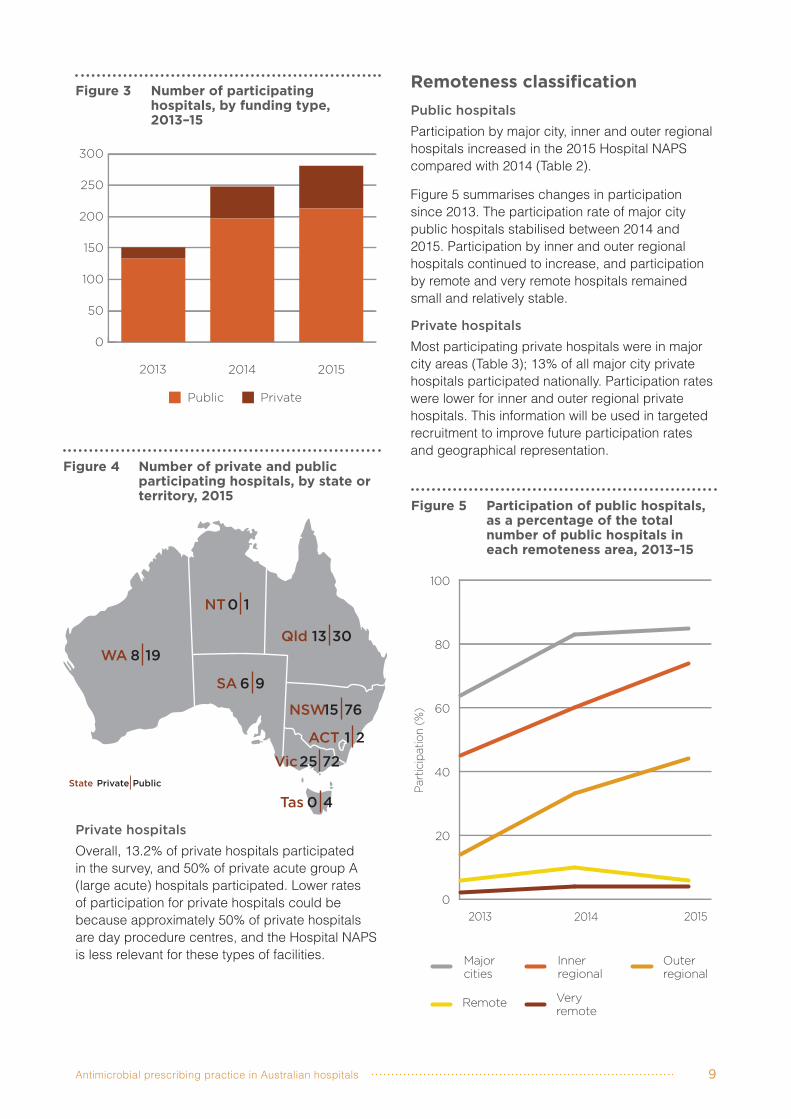
Overall, there has been an increase in participation each year since 2013 (Figure 3). The largest relative increase, of 64.2%, was seen between the 2013 survey (151 hospitals) and the 2014 survey (248 hospitals). A smaller relative increase, of 13.3%, was seen from 2014 to 2015.
State and TerritoryAll Australian states and territories were represented in the 2015 Hospital NAPS (Figure 4).
Peer groupPublic hospitalsApproximately one in four public hospitals participated in the 2015 Hospital NAPS. There was representation from hospitals across all peer groups. Principal referral hospitals were well represented (82.8%), as were large acute (74.2%) and medium acute (62.2%) hospitals, and women’s and children’s hospitals (83.3%). Participation from small, very small and subacute hospitals was lower.
Details of participation of public and private hospitals according to their peer group can be found in Appendixes 2 and 3. Figure 2 Number of participating hospitals (and contributing number of prescriptions) and
reasons for exclusion from analysis, 2015Figure 2 Number of participating hospitals (and contributing number of prescriptions) and
reasons for exclusion from analysis, 2015
Antimicrobial prescribing practice in Australian hospitals 9
Private hospitalsOverall, 13.2% of private hospitals participated in the survey, and 50% of private acute group A (large acute) hospitals participated. Lower rates of participation for private hospitals could be because approximately 50% of private hospitals are day procedure centres, and the Hospital NAPS is less relevant for these types of facilities.
Remoteness classificationPublic hospitalsParticipation by major city, inner and outer regional hospitals increased in the 2015 Hospital NAPS compared with 2014 (Table 2).
Figure 5 summarises changes in participation since 2013. The participation rate of major city public hospitals stabilised between 2014 and 2015. Participation by inner and outer regional hospitals continued to increase, and participation by remote and very remote hospitals remained small and relatively stable.
Private hospitalsMost participating private hospitals were in major city areas (Table 3); 13% of all major city private hospitals participated nationally. Participation rates were lower for inner and outer regional private hospitals. This information will be used in targeted recruitment to improve future participation rates and geographical representation.
Figure 4 Number of private and public participating hospitals, by state or territory, 2015
7225Vic
40TasPublicPrivateState
7615NSW
3013Qld
10NT
96SA
198WA
21ACT
Figure 3 Number of participating hospitals, by funding type, 2013–15
0
50
100
150
200
250
300
Public Private
2013 2014 2015
Figure 5 Participation of public hospitals, as a percentage of the total number of public hospitals in each remoteness area, 2013–15
0
20
40
60
80
100
Major cities
Remote
Inner regional
Very remote
Outer regional
2013 2014
Part
icip
atio
n (%
)
2015

Australian Commission on Safety and Quality in Health Care10
Table 2 Number of participating public hospitals, by remoteness classification, 2015
Remoteness classification
Number of participating
hospitals Total number
nationallyPercentage of hospitals
that participatedPercentage change
from 2014Major cities 85 176 47.8 +2.4Inner regional 74 188 39.4 +23.3Outer regional 44 227 19.4 +33.3Remote 6 71 8.5 –40.0Very remote 4 83 4.8 No changeTotal 213 745 27.4 +12.1
Source: Australian Institute of Health and Welfare. Australian hospital statistics 2012–13. Canberra: AIHW, 2014.
Types of surveys performed and number of prescriptions In total, 22 021 prescriptions were entered in the NAPS database for 14 389 patients for the 2015 Hospital NAPS.
More than 50% of the 22 021 antimicrobial prescriptions occurred in public principal referral and large acute hospitals. The full breakdown of the numbers of prescriptions entered according to hospital peer group is in Appendix 4.
Most hospitals conducted a whole-hospital PPS, followed by an sPPS and a randomised sample. A small number of hospitals used the previous PePS survey methodology, because local resourcing constraints meant that they were not able to wait to conduct their surveys until after the 2015 Hospital NAPS had been officially launched. Since PePS was a previously acceptable methodology, results for these hospitals have been included in the 2015 analyses.
Although half of all participating hospitals conducted a PPS, this methodology accounted for three-quarters of all prescriptions, indicating that hospitals that conducted a PPS had large patient numbers. In contrast, one-third of participating hospitals conducted a serial PPS, accounting for 15.5% of total prescriptions; these tended to be smaller facilities (Table 4).

Antimicrobial prescribing practice in Australian hospitals 11
Table 3 Number of participating private hospitals, by remoteness classification, 2015
Remoteness classificationNumber of participating
hospitalsTotal number
nationallyPercentage of hospitals
that participatedMajor city 55 422 13.0Inner regional 9 74 12.2Outer regional 4 19 21.1Total 68 515 13.2
Note: Before 2015, remoteness data was only available from the Australian Institute of Health and Welfare for public hospitals, not private hospitals. Hence, a comparison between 2014 and 2015 is not possible.
Source: Australian Institute of Health and Welfare. Australian hospital statistics 2012–13. Canberra: AIHW, 2014.
Table 4 Survey methodologies performed by participating hospitals, 2015
Hospitals PrescriptionsMethodology Number Percentage Number Percentage Hospital-wide point prevalence survey 154 54.8 16 382 74.4Randomised sample 24 8.5 1 631 7.4Serial point prevalence survey 96 34.2 3 409 15.5Period prevalence survey 7 2.5 599 2.7Total 281 100.0 22 021 100.0
Key indicators The prevalence of antimicrobial use (i.e. the percentage of hospital inpatients receiving an antimicrobial on the Hospital NAPS audit day) is estimated to be 40.5%, based on data submitted from hospitals that conducted a PPS, an sPPS (only data from the first audit day are used) or a randomised survey.
Table 5 summarises the key indicators from the 2015 Hospital NAPS compared with the 2014 Hospital NAPS. In relation to compliance, 55.9% of prescriptions overall were compliant with guidelines. However, of those prescriptions where compliance was able to be assessed, 70.6% were compliant with guidelines.
In relation to appropriateness, 73.2% of all prescriptions were appropriate. Of those prescriptions where appropriateness was able to be assessed, 77.0% were appropriate.
Based on aggregate data, the results for most key indicators have remained stable across 2013, 2014 and 2015.
A more detailed breakdown of these results by state, peer group, remoteness and funding type can be found in Tables 6 and 7.

Australian Commission on Safety and Quality in Health Care12
Table 5 Results for key Hospital NAPS indicators, 2013–15
Percentage of total prescriptionsPercentage change from 2014 to 2015
Key indicator 2013 2014 2015Absolute changea
Relative changeb
Indication documented in medical notes (best practice >95%)
70.9 74.0 72.5 –1.5 –2.0
Review or stop date documented (best practice >95%)
na na 35.5 na na
Surgical prophylaxis given for >24 hours (best practice <5%)c
41.8 35.9 27.4 –8.5 –24.0
Compliance with guidelines
Compliant with Therapeutic Guidelines: Antibiotic or local guidelinesd
59.7(72.2)
56.2(73.7)
55.9(70.6)
–0.3 –1.0
Noncompliantd 23.0(27.8)
24.3(26.3)
23.3(29.4)
–1.0 –4.0
Directed therapy na 10.4 12.4 2.0 19.0
No guideline available 11.0 4.6 3.8 –0.8 –17.0
Not assessable 6.3 4.5 4.7 0.2 4.0
Appropriateness Appropriate (optimal and adequate)e
70.8(75.6)
72.3(75.9)
73.2(77.0)
0.9 1.0
Inappropriate (suboptimal and inadequate)e
22.9(24.4)
23.0(24.1)
21.9(23.0)
–1.1 –5.0
Not assessable 6.3 4.7 5.0 0.3 6.0
na = not applicablea Figures represent the change between 2014 and 2015 (2015 percentage minus 2014 percentage).b Figures represent the percentage change between 2014 and 2015 expressed as a percentage of the 2014 base year.c Where surgical prophylaxis was selected as the indication (3404 prescriptions in 2015).d Figures in brackets refer to prescriptions for which compliance was assessable (17 429 prescriptions in 2015). The denominator
excludes antimicrobial prescriptions marked as ‘directed therapy’, ‘not available’ or ‘not assessable’.e Figures in brackets refer to prescriptions for which appropriateness was assessable (20 929 prescriptions in 2015). The denominator
excludes antimicrobial prescriptions marked ‘not assessable’.

Antimicrobial prescribing practice in Australian hospitals 13
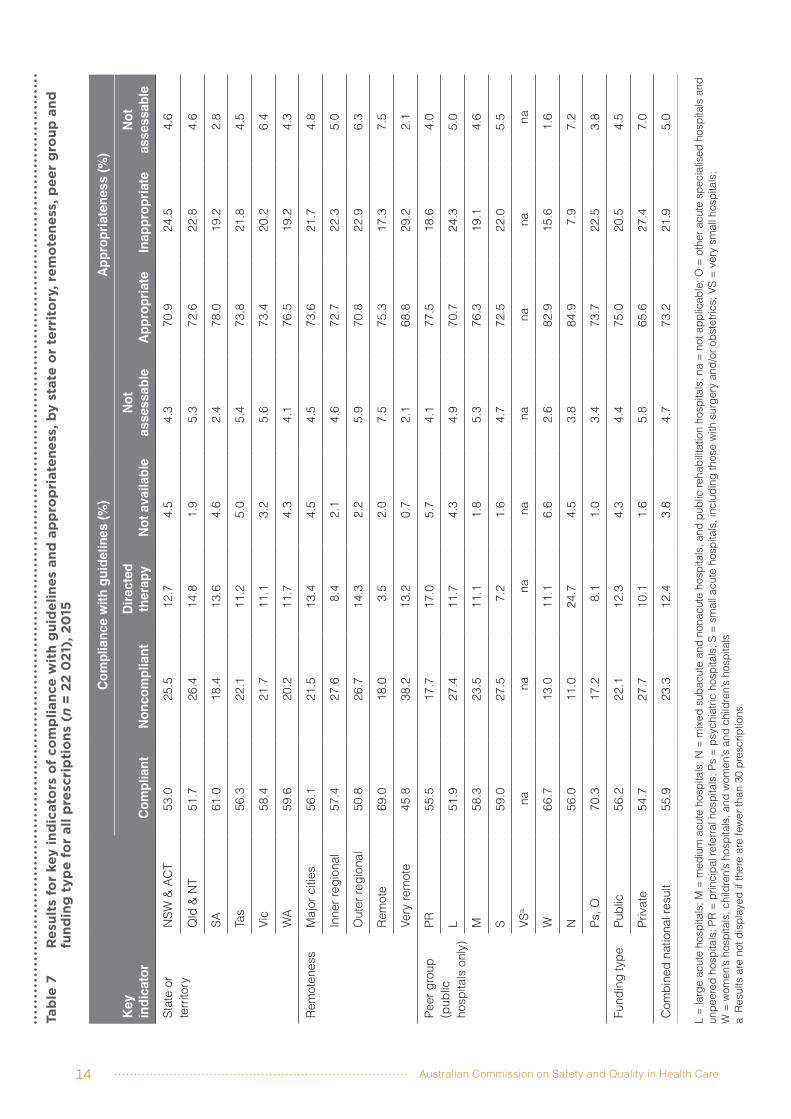
Table 6 Results for key indicators, by state or territory, remoteness, peer group and funding type, 2015
Key indicator
Number of
hospitalsNumber of
prescriptions
Indication documented
(%)a
Review or stop date
documented (%)b
Surgical prophylaxis
>24 hours (%)c
State or territory
NSW & ACT 94 7 539 75.7 33.7 36.6Qld & NT 44 3 078 69.0 31.1 35.3SA 15 1 654 77.6 36.4 24.1Tas 4 538 75.7 25.3 43.8Vic 97 6 740 70.3 39.0 19.9WA 27 2 472 68.8 37.4 21.7
Remoteness Major cities 140 4 228 72.0 37.2 26.8Inner regional 83 15 300 73.8 32.2 26.1Outer regional 48 2 094 71.6 32.7 42.3Remote 6 255 80.8 25.7 No dataVery remote 4 144 78.5 11.1 No data
Peer group (public hospitals only)
PR 24 6 483 75.6 32.2 39.2L 46 5 093 76.4 29.7 37.3M 28 1 428 79.7 35.6 23.2S 84 2 898 77.5 31.6 16.8VS 5 23 nad nad nad
W 10 1 215 76.8 35.1 43.5N 13 291 74.9 45.7 nad
Ps, O 3 209 82.8 52.2 nad
Funding type
Public 213 17 640 76.6 32.3 35.6Private 68 4 381 55.9 48.5 21.6
Combined national result 281 22 021 72.5 35.5 27.4
L = large acute hospitals; M = medium acute hospitals; N = mixed subacute and nonacute hospitals, and public rehabilitation hospitals; na = not applicable; O = other acute specialised hospitals and unpeered hospitals; PR = principal referral hospitals; Ps = psychiatric hospitals; S = small acute hospitals, including those with surgery and/or obstetrics; VS = very small hospitals; W = women’s hospitals, children’s hospitals, and women’s and children’s hospitalsa Percentage of prescriptions where an indication was documented.b Percentage of prescriptions with a review or stop date documented.c Where surgical prophylaxis was selected as the indication (3404 prescriptions).d Results are not displayed if there are fewer than 30 prescriptions.
Australian Commission on Safety and Quality in Health Care14
Tabl
e 7
Res
ults
for
key
indi
cato
rs o
f com
plia
nce
wit
h gu
idel
ines
and
app
ropr
iate
ness
, by
stat
e or
ter
rito
ry, r
emot
enes
s, p
eer
grou
p an
d fu
ndin
g ty
pe fo
r al
l pre
scri
ptio
ns (
n =
22 0
21),
20
15
Com
plian
ce w
ith g
uide
lines
(%)
Appr
opria
tene
ss (%
)Ke
y in
dica
tor
Com
plian
tNo
ncom
plian
tDi
rect
ed
ther
apy
Not a
vaila
ble
Not
asse
ssab
leAp
prop
riate
Inap
prop
riate
Not
asse
ssab
leSt
ate
or
terri
tory
NSW
& A
CT53
.025
.512
.74.
54.
370
.924
.54.
6
Qld
& NT
51.7
26.4
14.8
1.9
5.3
72.6
22.8
4.6
SA61
.018
.413
.64.
62.
478
.019
.22.
8
Tas
56.3
22.1
11.2
5.0
5.4
73.8
21.8
4.5
Vic
58.4
21.7
11.1
3.2
5.6
73.4
20.2
6.4
WA
59.6
20.2
11.7
4.3
4.1
76.5
19.2
4.3
Rem
oten
ess
Majo
r citie
s56
.121
.513
.44.
54.
573
.621
.74.
8
Inne
r reg
ional
57.4
27.6
8.4
2.1
4.6
72.7
22.3
5.0
Oute
r reg
ional
50.8
26.7
14.3
2.2
5.9
70.8
22.9
6.3
Rem
ote
69.0
18.0
3.5
2.0
7.5
75.3
17.3
7.5
Very
rem
ote
45.8
38.2
13.2
0.7
2.1
68.8
29.2
2.1
Peer
gro
up
(pub
lic
hosp
itals
only)
PR55
.517
.717
.05.
74.
177
.518
.64.
0
L51
.927
.411
.74.
34.
970
.724
.35.
0
M58
.323
.511
.11.
85.
376
.319
.14.
6
S59
.027
.57.
21.
64.
772
.522
.05.
5
VSa
nana
nana
nana
nana
W66
.713
.011
.16.
62.
682
.915
.61.
6
N56
.011
.024
.74.
53.
884
.97.
97.
2
Ps, O
70.3
17.2
8.1
1.0
3.4
73.7
22.5
3.8
Fund
ing ty
pePu
blic
56.2
22.1
12.3
4.3
4.4
75.0
20.5
4.5
Priva
te54
.727
.710
.11.
65.
865
.627
.47.
0
Com
bine
d na
tiona
l res
ult55
.923
.312
.43.
84.
773
.221
.95.
0
L =
large
acu
te h
ospi
tals;
M =
med
ium a
cute
hos
pita
ls; N
= m
ixed
suba
cute
and
non
acut
e ho
spita
ls, a
nd p
ublic
reha
bilita
tion
hosp
itals;
na
= no
t app
licab
le; O
= o
ther
acu
te sp
ecial
ised
hosp
itals
and
unpe
ered
hos
pita
ls; P
R =
princ
ipal
refe
rral h
ospi
tals;
Ps =
psy
chiat
ric h
ospi
tals;
S =
small
acu
te h
ospi
tals,
inclu
ding
thos
e wi
th su
rger
y and
/or o
bste
trics
; VS
= ve
ry sm
all h
ospi
tals;
W
= w
omen
’s ho
spita
ls, c
hildr
en’s
hosp
itals,
and
wom
en’s
and
child
ren’s
hos
pita
lsa
Resu
lts a
re n
ot d
isplay
ed if
ther
e ar
e fe
wer t
han
30 p
resc
riptio
ns.

Antimicrobial prescribing practice in Australian hospitals 15
Documentation of indicationIn the 2015 Hospital NAPS, documentation of indication improved for treatment indications (78.3% – 13 259 of 16 919) than prophylaxis indications (52.9% – 2161 of 3899). Documentation of indication was also better in public hospitals (76.6% – 13 509 of 17 640) than in private hospitals (55.9% – 2447 of 4381). However, all results remain below the best-practice target of more than 95%.
These differences were also observed in the results of the 2014 Hospital NAPS.
Documentation of review or stop dateDocumentation of a review or stop date was included as a new key indicator for the 2015 Hospital NAPS. Currently, there is no known best-practice target for review or stop date documentation. However, the Antimicrobial Stewardship Clinical Care Standard9 recommends that all prescriptions have the intended duration and review plan documented in the patient’s health record. Therefore, the decision was made to apply the best-practice target of more than 95%, for consistency with other benchmarks for appropriateness of antimicrobial prescribing. The results for this indicator were poor, with only about one-third (35.5%) of all prescriptions containing a review or stop date. This highlights documentation as a key area for future improvement across all hospital peer groups.
9 Australian Commission on Safety and Quality in Health Care. Antimicrobial Stewardship Clinical Care Standard. Sydney: ACSQHC, 2014.
‘By including all types of antimicrobial use, we are able to identify some areas that are not well captured by usual surveillance … (this) allows us to show areas of practice that are not well covered by Therapeutic Guidelines, but are relevant at our institution. This tells us where a local guideline might be useful.’ – metropolitan hospital pharmacist

Australian Commission on Safety and Quality in Health Care16
Surgical prophylaxis for more than 24 hoursResults from the 2015 Hospital NAPS showed that the proportion of surgical prophylaxis prescriptions extending for more than 24 hours declined to 27.4% in 2015, down from 35.9% in 2014 and 41.8% in 2013.
Figure 6 illustrates the gradual improvement in this indicator for both public and private hospitals since 2013. It is unclear whether this improvement is due to the increased number of participating hospitals, variations in casemix between public and private hospitals, or real improvement. The results for both hospital types fell well short of the best-practice target of less than 5%.
Compliance with guidelinesAbout one-quarter of prescriptions did not comply with guidelines (Therapeutic Guidelines: Antibiotic or local guidelines); this has remained fairly consistent since 2013. There appeared to be a slightly lower rate of noncompliance in public hospitals (22.1%) than in private hospitals (27.7%), and in major city hospitals (21.5%) than in regional (inner regional – 27.6%; outer regional – 26.7%) and very remote hospitals (38.2%). Noncompliance appeared to be lowest in remote hospitals (18.0%).
Public hospitals (4.3%) had a higher rate of prescriptions for which no guidelines were available than private hospitals (1.6%), possibly reflecting the greater complexity of patient casemix seen in public hospitals.
AppropriatenessAbout one in five antimicrobial prescriptions was deemed to be inappropriate from the 2015 Hospital NAPS. A greater proportion of private hospital prescriptions (27.4%) was assessed as being inappropriate than public hospital prescriptions (20.5%). Across all peer groups, appropriateness was highest for principal referral, medium acute, subacute, women’s, children’s, and women’s and children’s hospitals.
Interestingly, despite the reduction in the proportion of surgical prophylaxis prescriptions prescribed for longer than 24 hours, the rate of inappropriateness for surgical prophylaxis prescriptions has remained fairly steady across the three years (41.6% in 2013, 40.0% in 2014 and 40.5% in 2015). This indicates that there may be other reasons, not
yet identified, contributing to this sustained level of inappropriateness.
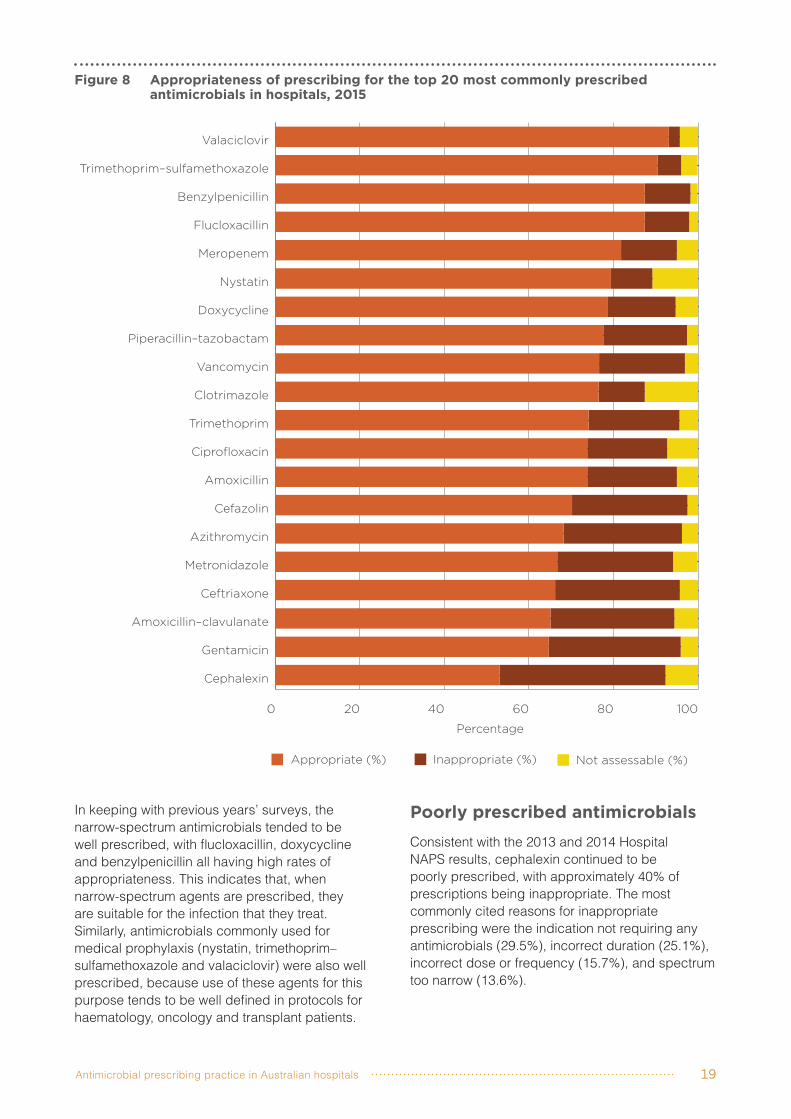
Most commonly prescribed antimicrobialsFor both public and private hospitals, the five most commonly prescribed antimicrobials were consistent with findings from the 2013 and 2014 Hospital NAPS: (1) cefazolin, (2) ceftriaxone, (3) metronidazole, (4) amoxicillin–clavulanate and (5) piperacillin–tazobactam. Figure 7 shows the 20 most commonly prescribed antimicrobials from 2013 to 2015.
In private hospitals, cefazolin accounted for the largest proportion of antimicrobial prescriptions (33.1%), followed by ceftriaxone (6.8%), cephalexin (6.5%), piperacillin–tazobactam (5.0%) and metronidazole (4.8%). In public hospitals, ceftriaxone was the most commonly prescribed antimicrobial (9.5%), followed by cefazolin (8.7%), metronidazole (6.9%), amoxicillin–clavulanate (6.9%) and piperacillin–tazobactam (6.6%).
In major city hospitals, and inner and outer regional hospitals, ceftriaxone and cefazolin were consistently the top two antimicrobials prescribed. Flucloxacillin featured more prominently in very remote and remote hospitals; it was the most common antimicrobial in very remote hospitals (20.8%) and the second most common antimicrobial in remote hospitals (6.5%, after ceftriaxone). A possible explanation is that remote and very remote hospitals tend to see lower acuity patients, so that narrower spectrum antimicrobials are more commonly used.
Appropriateness for the 20 most commonly prescribed antimicrobialsApproximately two-thirds of cefazolin, ceftriaxone, metronidazole and amoxicillin–clavulanate prescriptions were assessed to be appropriate (Figure 8). Most of the inappropriate cefazolin prescriptions (82.2%) were for surgical prophylaxis, for which the most common reasons for inappropriate prescribing were incorrect duration and incorrect dose. Of the five most commonly prescribed antimicrobials, a higher proportion of prescriptions for piperacillin–tazobactam were appropriate (77.6%).

Antimicrobial prescribing practice in Australian hospitals 17
Figure 6 Surgical prophylaxis given for >24 hours, by hospital funding type, 2013–15
0
10
20
30
40
50
Public (n = 133)
Private (n = 18)
2013
Public (n = 197)
Private (n = 51)
2014
Public (n = 213)
Private (n = 68)
2015
Per
cent
age
42.9
38.2 37.734.1
35.6
21.6
Num
ber
of
hosp
ital
s co
ntri
but
ing
to
dat
aa
Public (n = 133)
Private (n = 18)
2013
Public (n = 197)
Private (n = 51)
2014
Public (n = 213)
Private (n = 68)
2015
0
20
40
60
80
100
120
140
80
18
128
46
131
56
Num
ber
of
pre
scri
pti
ons
Public (n = 133)
Private (n = 18)
2013
Public (n = 197)
Private (n = 51)
2014
Public (n = 213)
Private (n = 68)
2015
0
500
1000
1500
2000
1038
435
14551330
1406
1998
a Number of hospitals that had at least one antimicrobial prescribed for surgical prophylaxis Note: Results are shown as a percentage of all surgical prophylaxis prescriptions. The number of contributing hospitals is given in brackets.

Australian Commission on Safety and Quality in Health Care18
Figure 7 The 20 most commonly prescribed antimicrobials as a percentage of all antimicrobials prescribed in Australian hospitals, 2013–15
Percentage
2015 2014 2013
0 2 4 6 8 10 12 14
Trimethoprim
Valaciclovir
Meropenem
Clotrimazole
Ciprofloxacin
Trimethoprim–sulfamethoxazole
Azithromycin
Vancomycin
Benzylpenicillin
Nystatin
Gentamicin
Amoxicillin
Doxycycline
Flucloxacillin
Cephalexin
Piperacillin–tazobactam
Amoxicillin–clavulanate
Metronidazole
Ceftriaxone
Cefazolin
13.6%1.1%
9.7%
9.0%9.1%
9.9%
6.5%6.5%
7.5%
6.3%6.0%
6.2%
6.3%6.1%
6.0%
5.0%5.0%
4.8%
4.1%4.5%4.6%
4.0%3.9%
3.4%
3.5%2.8%2.9%
3.2%2.9%3.0%
3.1%2.7%2.7%
2.9%3.2%
2.6%
2.9%3.1%
3.3%
2.7%3.1%3.2%
2.7%2.5%2.5%
2.5%2.7%
2.9%
1.6%1.4%
1.3%
1.4%1.3%
1.7%
1.4%1.4%
1.3%
1.3%1.6%
1.2%
(n = 22 021) (n = 19 944) (n = 12 800)
Antimicrobial prescribing practice in Australian hospitals 19
Figure 8 Appropriateness of prescribing for the top 20 most commonly prescribed antimicrobials in hospitals, 2015
Appropriate (%) Inappropriate (%) Not assessable (%)
Percentage
0 20 40 60 80 100
Cephalexin
Gentamicin
Amoxicillin–clavulanate
Ceftriaxone
Metronidazole
Azithromycin
Cefazolin
Amoxicillin
Ciprofloxacin
Trimethoprim
Clotrimazole
Vancomycin
Piperacillin–tazobactam
Doxycycline
Nystatin
Meropenem
Flucloxacillin
Benzylpenicillin
Trimethoprim–sulfamethoxazole
Valaciclovir
In keeping with previous years’ surveys, the narrow-spectrum antimicrobials tended to be well prescribed, with flucloxacillin, doxycycline and benzylpenicillin all having high rates of appropriateness. This indicates that, when narrow-spectrum agents are prescribed, they are suitable for the infection that they treat. Similarly, antimicrobials commonly used for medical prophylaxis (nystatin, trimethoprim–sulfamethoxazole and valaciclovir) were also well prescribed, because use of these agents for this purpose tends to be well defined in protocols for haematology, oncology and transplant patients.
Poorly prescribed antimicrobialsConsistent with the 2013 and 2014 Hospital NAPS results, cephalexin continued to be poorly prescribed, with approximately 40% of prescriptions being inappropriate. The most commonly cited reasons for inappropriate prescribing were the indication not requiring any antimicrobials (29.5%), incorrect duration (25.1%), incorrect dose or frequency (15.7%), and spectrum too narrow (13.6%).

Australian Commission on Safety and Quality in Health Care20
Table 8 lists the indications associated with reasons for inappropriate prescribing of cephalexin. Incorrect dosage, incorrect duration and lack of need for cephalexin for the indication were commonly seen for surgical prophylaxis and urinary tract infection indications. Additionally, it appeared that many prescribers did not recognise cephalexin’s inadequate cover for respiratory pathogens in community- and hospital-acquired pneumonia.
Gentamicin was poorly prescribed, with 31.2% of prescriptions being inappropriate – prescribing appeared to be poorer in private hospitals (58.5% inappropriate) than in public hospitals (20.2%). The most common reason for inappropriateness was incorrect dose (45.9%), followed by spectrum too broad (16.7%) and the indication not requiring any antimicrobials (16.2%).
Table 9 shows that surgical prophylaxis was the main indication for the gentamicin prescriptions deemed to have incorrect dosage.
Most common indicationsThe five most common indications were similar to those found in the 2014 Hospital NAPS (Figure 9). There has been a slight increase in the proportion of surgical prophylaxis prescriptions; this may be due to more private hospitals participating in the 2015 Hospital NAPS, since they are more likely to perform a higher volume of surgical procedures.
In public hospitals, community-acquired pneumonia (9.4%), medical prophylaxis (6.9%) and surgical prophylaxis (6.4%) were the most common indications for prescribing antimicrobials.In private hospitals, surgical prophylaxis was the most common indication (9.1%), followed by urinary tract infection (1.1%) and community-acquired pneumonia (1.1%).
Table 8 Common reasons for inappropriate prescribing of cephalexin, and associated common indications, in hospitals, 2015
Reason for inappropriateness Number of prescriptionsa Common indicationsb
Indication did not require any antimicrobials
104 Surgical prophylaxis (62%), urinary tract infection (14%)
Incorrect duration 103 Surgical prophylaxis (64%), urinary tract infection (14%)
Incorrect dose or frequency 67 Surgical prophylaxis (28%), urinary tract infection (28%), cystitis (9%), cellulitis (7%)
Spectrum too narrow 56 Community-acquired pneumonia (25%), hospital-acquired pneumonia (9%), urinary tract infection (9%)
a There were 434 cephalexin prescriptions that were marked as inappropriate. For these, this table shows the most common reasons for inappropriateness and their associated numbers.
b Percentages are rounded to the nearest whole number. tract infection (1.1%) and community-acquired pneumonia (1.1%).
Table 9 Common reasons for inappropriate prescribing of gentamicin, and associated common indications, in hospitals, 2015
Reason for inappropriateness Number of prescriptionsa Common indicationsb
Incorrect dose or frequency 97 Surgical prophylaxis (70%), sepsis (11%)Spectrum too broad 30 Surgical prophylaxis (30%), urinary tract
infection (20%)a There were 222 gentamicin prescriptions that were marked as inappropriate. For these, this table shows the most common reasons
for inappropriateness and their associated numbers.b Percentages are rounded to the nearest whole number.

Antimicrobial prescribing practice in Australian hospitals 21
Figure 9 The 20 most common indications for prescribing antimicrobials in public and private hospitals, 2013–15
Percentage2015 2014 2013
0 2 4 6 8 10 12 14 16
Cystitis
Pyelonephritis
Diabetic infection (including foot)
Peritonitis
Cutaneous and mucosal candidiasis
Febrile neutropenia
Osteomyelitis
Cholecystitis
Diverticulitis
Wound infection: surgical
Aspiration pneumonia
Oral candidiasis
Hospital-acquired pneumonia
Infective exacerbation of COPD
Cellulitis/erysipelas
Urinary tract infection
Sepsis (empiric and directed)
Medical prophylaxis (bacterial, viral, fungal)
Community-acquired pneumonia
Surgical prophylaxis15.5%
13.1%11.5%
10.5%11.3%
10.8%
7.6%8.3%
8.2%
5.7%5.8%
5.6%
5%6.7%6.6%
4.1%4.4%4.5%
3%3.2%3.4%
2.5%2.3%
2.6%
2.2%1.9%
1.6%
1.9%2.1%2.3%
1.8%2.1%2.3%
1.4%1.3%1.4%
1.4%1.2%1.4%
1.4%1.4%
1.2%
1.4%1.5%1.5%
1.2%0.6%
1.6%
1.2%0.7%
1.1%
1%1.1%1%
1%0.9%0.8%
0.9%0.1%
1.4%
(n = 22 021) (n = 19 944) (n = 12 800)
COPD = chronic obstructive pulmonary disease

Australian Commission on Safety and Quality in Health Care22
Appropriateness of prescribing for the 20 most common indicationsOf the 20 most common indications, surgical prophylaxis, infective exacerbation of chronic obstructive pulmonary disease (COPD) and cholecystitis were the conditions for which there were the highest proportions of inappropriate prescribing (Figure 10). In contrast, many of the other 20 indications had high rates of appropriateness, particularly medical prophylaxis, oral candidiasis and osteomyelitis.
ProphylaxisProphylaxis indications featured strongly in the 20 most common indications, with a combination of medical and surgical prophylaxis accounting for almost one-quarter (23.1%) of all antimicrobial prescriptions. Medical prophylaxis was well prescribed, with less than 10% of prescriptions deemed to be inappropriate; this is likely to reflect the use of protocols for medical prophylaxis for haematology, oncology and transplant patients.
In contrast, prescribing for surgical prophylaxis remains poor and does not appear to have improved from previous Hospital NAPS results. Approximately two in every five prescriptions for surgical prophylaxis were deemed to be inappropriate. The most commonly identified reasons for inappropriateness were incorrect duration (29.9%), incorrect dose (27.6%) and the procedure not requiring antimicrobials (22.0%).
Indications for which prescribing was most commonly assessed as inappropriateApproximately one in five (21.9%) prescriptions were inappropriate. Of these, 53.8% were suboptimal and 46.2% inadequate (for definitions, refer to Appendix 5). The most common reasons for inappropriateness were spectrum too broad, indication not requiring any antimicrobials and incorrect dose (Table 10).
Table 11 shows the 20 indications for which prescribing was most commonly assessed to be inappropriate; surgical prophylaxis and respiratory tract exacerbations feature prominently in this list.
Respiratory tract infectionsHigh rates of inappropriateness of prescribing were observed for a number of respiratory tract
infections. Rates of inappropriateness for infective exacerbation of COPD remained steady compared with 2014 (34.3% in 2015; 36.8% in 2014). They showed only a small decline for community- acquired pneumonia (24.4% in 2015; 25.0% in 2014). Rates of inappropriateness declined for bronchitis and exacerbations of asthma compared with 2014, but the numbers were low.
The most common reasons for inappropriate prescribing for these three conditions were spectrum too broad (49.8%) and the indication not requiring antimicrobials (15.5%).
Table 10 Most common reasons for inappropriate prescribing of antimicrobials in hospitals, as a percentage of all inappropriately prescribed antimicrobials, 2015a
Reason Yes (%) No (%)
Not specified
(%)Indication does not require antimicrobials
19.6 54.4 26.0
Spectrum too narrow
8.1 61.3 30.6
Spectrum too broad
25.2 48.8 26.0
Incorrect duration 17.8 54.1 28.0Incorrect dose 19.5 55.2 25.2Incorrect route 4.8 63.9 31.4
a n = 4823

Antimicrobial prescribing practice in Australian hospitals 23
Figure 10 Appropriateness of antimicrobial prescribing in hospitals for the 20 most common indications, 2015
Percentage
Appropriate (%) Inappropriate (%) Not assessable (%)
0 20 40 60 80 100
Surgical prophylaxis
Infective exacerbation of COPD
Cholecystitis
Aspiration pneumonia
Wound infection: surgical
Community–acquired pneumonia
Urinary tract infection
Cystitis
Hospital–acquired pneumonia
Cellulitis/erysipelas
Cutaneous and mucosal candidiasis
Diverticulitis
Pyelonephritis
Oral candidiasis
Peritonitis
Diabetic infection (including foot)
Sepsis (empiric and directed)
Medical prophylaxis (bacterial, viral, fungal)
Febrile neutropaenia
Osteomyelitis
COPD = chronic obstructive pulmonary disease

Australian Commission on Safety and Quality in Health Care24
Table 11 The 20 indications for which antimicrobials were most commonly prescribed inappropriately in hospitals, 2015a
IndicationNumber of
prescriptionsAppropriate
(%)Inappropriate
(%)Not assessable
(%)Bronchitis 68 57 41 2Surgical prophylaxis 3404 56.0 40.5 3.5Infective exacerbation of asthma 75 60 37 3Infective exacerbation of COPD 661 64.1 34.3 1.5Fever/pyrexia of unknown origin 152 59 31 10Pancreatitis 42 67 29 5Abscess (includes quinsy) 35 71 29 0Tonsillitis 39 67 28 5Cholecystitis 309 71 28 1Trauma (includes wound) 187 70 28 3Colitis 36 64 28 8Bronchiectasis 123 72 26 2Aspiration pneumonia 408 74 25 2Catheter-associated infection 69 70 25 6Community-acquired pneumonia 2315 74.6 24.4 1.0Premature rupture of membranes 30 77 23 0Empyema 66 74 23 3Abscess/boils/folliculitis 118 78 22 0Wound infection: surgical 404 74 22 5Cystitis 205 77 22 2
COPD = chronic obstructive pulmonary diseasea Percentages have been rounded to the nearest whole number for indications where there were fewer than 500 prescriptions.
Compliance with guidelines for the 20 most common indicationsOverall, 23.3% of prescriptions were deemed to be noncompliant with guidelines; of these, 29.0% were deemed to be appropriate. An example is where the antimicrobial dose or frequency does not fall within the recommended guidelines, but the antimicrobial is still determined to be a reasonable alternative (and therefore appropriate).
The most common reasons for noncompliance were spectrum too broad (26.4%), and incorrect dose or frequency (22.0%).
Figure 11 shows the level of compliance for the 20 most common indications. Indications with high levels of noncompliance were similar to those with
high levels of inappropriateness – namely, surgical prophylaxis, infective exacerbation of COPD and cholecystitis.
For some indications, a large proportion of prescriptions were directed therapy – that is, their use was guided by the availability of microbiology results. This was especially prominent for osteomyelitis treatment, surgical wound infections, sepsis and urinary tract infections.

Antimicrobial prescribing practice in Australian hospitals 25
Figure 11 Percentage of antimicrobial prescriptions compliant with guidelines for the 20 most common indications, 2015
Percentage
Compliant Directed therapy
Noncompliant None available/not assessable
0 20 40 60 80 100
Osteomyelitis
Wound infection: surgical
Cystitis
Urinary tract infection
Infective exacerbation of COPD
Sepsis (empiric and directed)
Surgical prophylaxis
Diabetic infection (including foot)
Cellulitis/erysipelas
Peritonitis
Pyelonephritis
Cholecystitis
Community-acquired pneumonia
Aspiration pneumonia
Hospital-acquired pneumonia
Diverticulitis
Cutaneous and mucosal candidiasis
Oral candidiasis
Febrile neutropenia
Medical prophylaxis (bacterial, viral, fungal)
COPD = chronic obstructive pulmonary disease

Australian Commission on Safety and Quality in Health Care26
FeedbackAll respondents indicated their willingness to participate again in the Hospital NAPS.
Most facilities (66.4%) required one to three surveyors to conduct the 2015 Hospital NAPS; 29.0% required four to 10 surveyors, and 4.7% required more than 10 surveyors.
Overall, 46.1% of hospitals completed the 2015 Hospital NAPS within one week, and one-third of hospitals required one month or longer. The length of time required to complete the survey was markedly longer for regional, rural and remote facilities than for metropolitan facilities; this is likely to be due to hospital size and the availability of staff to conduct the survey.
Most respondents (76.0%) indicated that they were able to assess compliance and appropriateness using clinical staff from within their hospital. A small proportion (5.8%) required assistance from staff outside their hospital, and 18.3% required assistance from the NAPS team. The proportion of hospitals that required assistance from the NAPS team was substantially higher in rural and remote hospitals (41.4%) than in regional (16.7%) and metropolitan (4.4%) hospitals. Assistance was also required more for nurses and ICPs (35.7%) than for pharmacists (5.3%).
Of the 19 respondents who requested expert assessments from the NAPS team, all were satisfied with the service they received, and 17 indicated that their level of understanding had either ‘greatly improved’ or ‘somewhat improved’; 11 indicated that they would require substantial ongoing support from the NAPS team for future participation. Comments from these 19 respondents reinforced that remote expert assessments and telephone or online support increased surveyors’ confidence in conducting the Hospital NAPS. The assistance also improved the credibility of their results when they were reported to medical staff.
Local use of NAPS resultsMany respondents indicated that their NAPS results were used as a basis for staff education, and were reported to AMS, medication advisory, and drug and therapeutics committees.
The reporting functionality, especially the ability to benchmark against hospitals in similar peer groups, has been highly valued by participants as a mechanism for providing feedback, and for monitoring improvement and appropriateness over time. Participants also commented that the results from the Hospital NAPS were used to promote the effectiveness of local AMS programs and included in business cases for acquisition of resources.
Clinically, results from the Hospital NAPS assist local facilities to identify areas of poor prescribing (such as prescribing for surgical prophylaxis and respiratory tract conditions, and poor recognition of penicillin allergies), as well as areas of practice that are not covered by guidelines or protocols.
We conduct a ‘pharmacy’ session with local GP VMOs [visiting medical officers] every two months … They found this very worthwhile, and the discussion that ensued was a terrific learning opportunity for the younger GPs present, and certainly I got to see things from the VMO’s perspective also. – rural hospital

Antimicrobial prescribing practice in Australian hospitals 27
Conclusion The collaboration between the Commission and the NCAS has resulted in NAPS diversifying and growing into a program that supports the challenges of AMS across Australian healthcare and aged-care settings. The consistent increase in the number and representation of participating hospitals since 2013 indicates that NAPS is able to meet the varying needs of the workforce across different geographical locations, levels of expertise and access to specialists. NAPS results have identified target areas for improvement, and helped to embed AMS across the hospital and aged-care sectors.
The Commission and the NCAS will promote continued increased participation in NAPS to ensure increasing representativeness of data across the range of Australian hospitals.
The 2015 Hospital NAPS confirmed many of the findings from the 2013 and 2014 surveys. It continued to highlight the need for improved prescribing and targeted education with regard to:• prescribing for surgical prophylaxis, particularly
in the area of prolonged duration of therapy and incorrect dosing
• prescribing for exacerbations of COPD, where the antimicrobials prescribed were either too broad in spectrum or not required
• the need for increased documentation in medical notes, particularly of review and stop dates
• high rates of inappropriate prescribing of cephalexin, particularly in the areas of surgical prophylaxis, urinary tract infections and pneumonia.
The NCAS, together with the Commission and other AURA Surveillance System partners, will continue to work to further improve antimicrobial prescribing in Australian hospitals.

Australian Commission on Safety and Quality in Health Care28
Appendix 1 Hospital NAPS data collection form
Antimicrobial prescribing practice in Australian hospitals 29
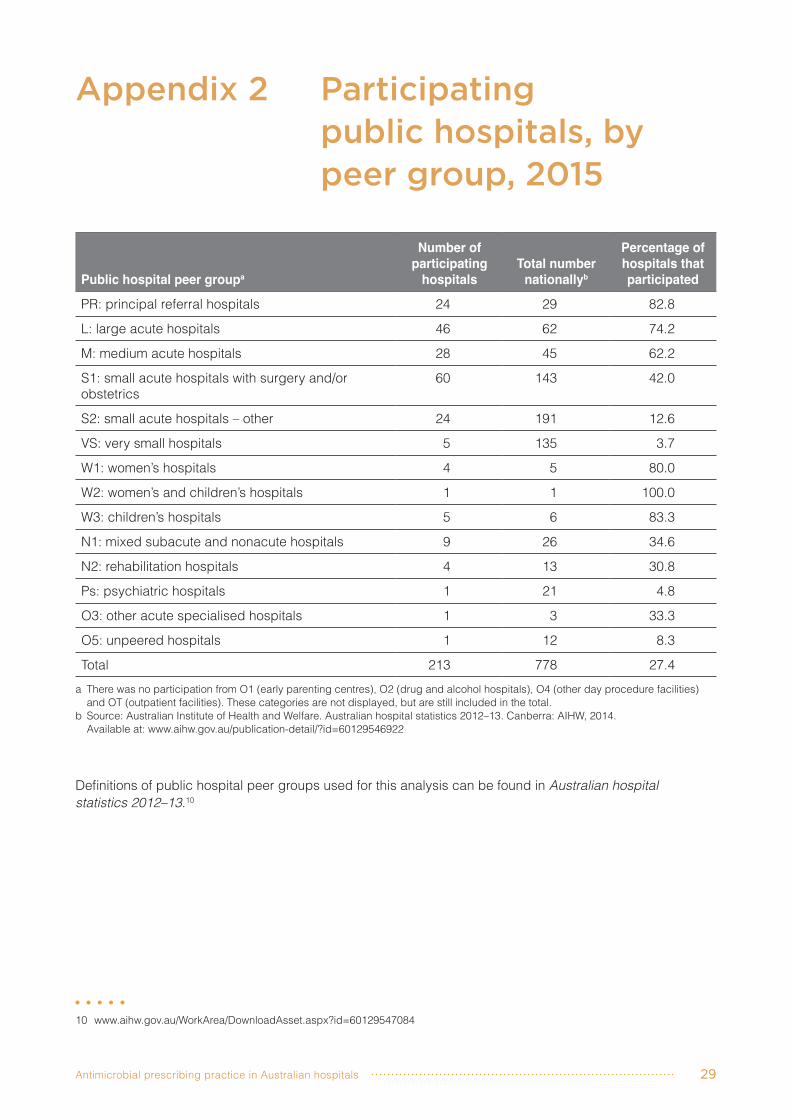
Appendix 2 Participating public hospitals, by peer group, 2015
Public hospital peer groupa
Number of participating
hospitalsTotal number
nationallyb
Percentage of hospitals that participated
PR: principal referral hospitals 24 29 82.8L: large acute hospitals 46 62 74.2M: medium acute hospitals 28 45 62.2S1: small acute hospitals with surgery and/or obstetrics
60 143 42.0
S2: small acute hospitals – other 24 191 12.6VS: very small hospitals 5 135 3.7W1: women’s hospitals 4 5 80.0W2: women’s and children’s hospitals 1 1 100.0W3: children’s hospitals 5 6 83.3N1: mixed subacute and nonacute hospitals 9 26 34.6N2: rehabilitation hospitals 4 13 30.8Ps: psychiatric hospitals 1 21 4.8O3: other acute specialised hospitals 1 3 33.3O5: unpeered hospitals 1 12 8.3Total 213 778 27.4
a There was no participation from O1 (early parenting centres), O2 (drug and alcohol hospitals), O4 (other day procedure facilities) and OT (outpatient facilities). These categories are not displayed, but are still included in the total.
b Source: Australian Institute of Health and Welfare. Australian hospital statistics 2012–13. Canberra: AIHW, 2014. Available at: www.aihw.gov.au/publication-detail/?id=60129546922
Definitions of public hospital peer groups used for this analysis can be found in Australian hospital statistics 2012–13.10
10 www.aihw.gov.au/WorkArea/DownloadAsset.aspx?id=60129547084

Australian Commission on Safety and Quality in Health Care30
Appendix 3 Participating private hospitals, by peer group, 2015
Private hospital peer groupa
Number of participating
hospitalsTotal number
nationallybPercentage of hospitals
that participatedPrivate acute group A hospitals 11 22 50.0Private acute group B hospitals 15 36 41.7Private acute group C hospitals 15 49 30.6Private acute group D hospitals 17 70 24.3Other acute specialised hospitals 3 16 18.8Private acute psychiatric hospitals 1 29 3.4Private rehabilitation hospitals 5 23 21.7Mixed day procedure hospitals 1 57 1.8Total 68 515 13.2
a There was no participation from the following types of facilities: dialysis clinics, drug and alcohol hospitals, endoscopy centres, eye surgery centres, fertility clinics, haematology and oncology clinics, hyperbaric health centres, mixed subacute and nonacute hospitals, oral and maxillofacial surgery centres, other women’s and children’s hospitals, plastic and reconstructive surgery centres, reproductive health centres, sleep centres, unpeered hospitals, very small hospitals, and women’s hospitals. These categories are not displayed, but are still included in the total.
b Source: Australian Institute of Health and Welfare. Australian hospital peer groups. Canberra: AIHW, 2014. Available at: www.aihw.gov.au/WorkArea/DownloadAsset.aspx?id=60129553443
Definitions of private hospital peer groups used for this analysis can be found in Australian hospital peer groups.11
11 www.aihw.gov.au/WorkArea/DownloadAsset.aspx?id=60129553443

Antimicrobial prescribing practice in Australian hospitals 31
Appendix 4 Numbers of prescriptions, by hospital peer group, 2015
Funding type Peer groupNumber of
prescriptions
Percentage of total
prescriptions
Public
Principal referral hospitals 6 483 29.4Large acute hospitals 5 093 23.1Medium acute hospitals 1 428 6.5Small acute hospitals – other 471 2.1Small acute hospitals with surgery and/or obstetrics 2 427 11.0Very small hospitals 23 0.1Children’s hospitals 799 3.6Women’s hospitals 301 1.4Women’s and children’s hospitals 115 0.5Other acute specialised hospitals 96 0.4Subacute and nonacute hospitals 213 1.0Unpeered hospitals 82 0.4Public rehabilitation hospitals 78 0.4Psychiatric hospitals 31 0.1
Private
Private acute group A hospitals 1 433 6.5Private acute group B hospitals 953 4.3Private acute group C hospitals 1 099 5.0Private acute group D hospitals 623 2.8Private acute psychiatric hospitals 34 0.2Other acute specialised hospitals 67 0.3Private rehabilitation hospitals 121 0.5Mixed day procedure hospitals 51 0.2
Total 22 021 100.0

Australian Commission on Safety and Quality in Health Care32
Appendix 5 Hospital NAPS definitions of appropriateness
App
ropr
iate
ness
If en
dors
ed g
uide
lines
are
pre
sent
If en
dors
ed g
uide
lines
are
abs
ent
App
ropr
iate
1O
ptim
al1
Antim
icro
bia
l pre
scription follo
ws e
ither
the T
hera
peutic
Guid
elin
es
2 o
r endors
ed local guid
elin
es o
ptim
ally
, in
clu
din
g
antim
icro
bia
l choic
e, dosage, ro
ute
and d
ura
tion
3, (inclu
din
g for
surg
ical pro
phyla
xis
)
The a
ntim
icro
bia
l pre
scription h
as b
een r
evie
wed a
nd e
ndors
ed
by a
clin
icia
n w
ith e
xpert
antim
icro
bia
l pre
scribin
g k
now
ledge.4
OR
The p
rescribed a
ntim
icro
bia
l w
ill c
over
the lik
ely
causative O
R
culture
d p
ath
ogens a
nd th
ere
is n
ot a n
arr
ow
er
spectr
um
or
more
appro
priate
antim
icro
bia
l choic
e, dosage, ro
ute
or
dura
tion
3
availa
ble
, (inclu
din
g for
su
rgic
al pro
phyla
xis
)
2A
dequ
ate
Antim
icro
bia
l pre
scription d
oes n
ot optim
ally
follo
w the
Thera
peutic G
uid
elin
es
2 o
r endors
ed local guid
elin
es, in
clu
din
g
antim
icro
bia
l choic
e, dosage, ro
ute
or
dura
tion
3, how
ever,
is
a re
ason
able
altern
ative c
hoic
e for
the lik
ely
causative o
r
culture
d p
ath
ogens
OR
For
surg
ical pro
ph
yla
xis
, as a
bove a
nd d
ura
tion
3 is less than
24 h
ours
Antim
icro
bia
l pre
scription inclu
din
g a
ntim
icro
bia
l choic
e, dosage,
route
and d
ura
tion
3 is n
ot
the m
ost optim
al, h
ow
ever,
is a
reas
onab
le a
ltern
ative c
hoic
e for
the lik
ely
causative o
r culture
d
path
ogens
OR
For
surg
ical pro
phyla
xis
, as a
bove a
nd d
ura
tion
3 is less than 2
4
hours
Inap
prop
riate
3Su
bopt
imal
Antim
icro
bia
l pre
scription inclu
din
g a
ntim
icro
bia
l choic
e, dosage, ro
ute
and d
ura
tion
3, is
an u
nrea
sona
ble
choic
e for
the lik
ely
causative o
r culture
d p
ath
ogens, in
clu
din
g:
• spectr
um
exce
ssiv
ely
bro
ad o
r an u
nnecessary
overlap in s
pectr
um
of activity
• fa
ilure
to a
ppro
priate
ly d
e-e
scala
te w
ith m
icro
bio
logic
al re
sults
OR
There
may b
e a
mild
or
non-life-t
hre
ate
nin
g a
llerg
y m
ism
atc
h
4In
adeq
uate
Antim
icro
bia
l pre
scription inclu
din
g a
ntim
icro
bia
l choic
e , d
osage, ro
ute
or
dura
tion
3 is u
nlik
ely
to tre
at th
e lik
ely
causative o
r
culture
d p
ath
ogens
OR
An a
ntim
icro
bia
l is
not in
dic
ate
d for
the d
ocum
ente
d o
r pre
sum
ed indic
ation
OR
There
may b
e a
severe
or
possib
ly life-t
hre
ate
nin
g a
llerg
y m
ism
atc
h, or
the p
ote
ntial risk o
f to
xic
ity d
ue to d
rug inte
raction
OR
For
surg
ical pro
phyla
xis
, th
e d
ura
tion
3 is g
reate
r th
an 2
4 h
ours
(except w
here
guid
elin
es e
ndors
e this
)
5N
ot
asse
ssab
le
The indic
ation is n
ot docum
ente
d a
nd u
nable
to b
e d
ete
rmin
ed fro
m the n
ote
s
OR
The n
ote
s a
re n
ot com
pre
hensiv
e e
nough to a
ssess a
ppro
priate
ness
OR
The p
atient is
too c
om
ple
x, due to m
ultip
le c
o-m
orb
iditie
s, alle
rgie
s o
r m
icro
bio
logy r
esults, etc
.
1 T
akin
g into
account accepta
ble
changes d
ue to the p
atient’s
age, w
eig
ht, r
enal fu
nction o
r oth
er
pre
scribed m
edic
ations, if this
info
rmation is a
vaila
ble
2 A
ntibio
tic E
xpert
Gro
up. T
hera
peutic G
uid
elin
es: A
ntibio
tic. V
ers
ion 1
5 (
2014).
http://o
nlin
e.tg.o
rg.a
u/ip/
3 D
ura
tion s
hould
only
be a
ssessed if th
e g
uid
elin
es s
tate
a r
ecom
men
ded d
ura
tion a
nd the a
ntim
icro
bia
l has a
lready b
een d
ispensed for
longer
than this
, or
if there
is a
cle
ar
pla
nned ‘end d
ate
’ docum
ente
d4 E
xam
ple
s inclu
de infe
ctious d
iseases p
hysic
ian o
r re
gis
trar,
clin
ical m
icro
bio
logis
t or
regis
trar,
or
specia
list pharm
acis
t