
REPORT ANNUAL
2015 16

This document has been printed on Enviro 100 paper:• Contains FSC certified
100% post-consumer fiber• Certified EcoLogo,
Processed Chlorine Free and FSC Recycled
• Manufactured using biogas energy
P.O. Box 500115 Market Square, Suite 1400Saint John, NBE2L 4Y9
Tel: (506) 658-2504 1-866-766-2782Fax: (506) 643-7300www.nbeub.ca
REPORT ANNUAL
2015 16

NEW BRUNSWICK ENERGY AND UTILITIES BOARD ANNUAL REPORT 2015-16
CONTENTS
Chairman’s Message
Overview
Organizational Chart
Board Members
Reliability & Compliance
Electricity
Natural Gas
Pipeline Safety
Petroleum Products
Motor Carrier
Financial Statements
1
2
4
5
6
7
8
9
10
11
12
TABLE OF

CHAIRMAN’S MESSAGE
Raymond Gorman, Q.C.Chairman
Pursuant to Sections 21 and 22 of the Energy and Utilities Board Act, I am pleased to present the Annual Report and Financial Statements of the New Brunswick Energy and Utilities Board (Board) for the year ending March 31, 2016.
During this reporting period the Board received 37 applications and delivered 31 decisions. These applications and decisions related to setting rates for NB Power and Enbridge Gas New Brunswick, approving pipeline permits and licenses, approving numerous electricity reliability standards and granting licenses for motor carriers. This year also saw a resumption of a matter related to NB Power’s Class Cost Allocation Methodology that had been previously adjourned, with the hearing taking place in February 2016.
In addition to applications and hearings, the Board also receives inquiries from the general public that range from questions about changes in energy prices to complaints about the actions of a petroleum retailer or a utility. In 2015–16 the Board responded to 68 inquiries.
I would like to take this opportunity to thank our staff and Board members for their hard work and dedication over the last year. The Board is dependent on the professionalism of our entire team, all of whom continue to dedicate themselves to the goal of providing New Brunswickers with effective regulation.
1

The Board regulates aspects of electricity and natural gas utilities to ensure that customers receive safe and reliable service at just and reasonable rates. In addition, the Board sets weekly retail prices for petroleum products sold within the province.
The Board’s regulatory functions are carried out through both written and oral proceedings and representative groups are encouraged to participate in the process. Participation helps to ensure that the Board is informed of the issues and that decisions are made in the public interest.
WHO WE ARE
WHAT WE DO
There is a staff of 20 including Board Members, advisors to the Board, administration employees, pipeline safety inspectors and compliance staff. The Board’s offices are located on the 14th floor of 15 Market Square in Saint John. The Board’s compliance staff are located in Fredericton.
Board hearings, which resemble court proceedings, are conducted by a panel of three or more Board Members. The panel hears evidence about the need for a rate increase or a change in service. Unlike courts, much of the evidence is filed prior to the actual hearing. Following the hearing, Board Members deliberate and issue a written decision.
The Board must balance the needs of the consumers for fair rates with a utility’s right to have a reasonable opportunity to earn a fair return on its investment.
The Energy and Utilities Board (Board) is an independent quasi-judicial board charged with regulating public utilities.
The Board is made up of a full-time Chair, Vice-Chair and three Board Members.
The New Brunswick Energy and Utility Board’s goal is to provide just and reasonable regulation for New Brunswickers in a timely and efficient manner.
OVERVIEW
2

NEW BRUNSWICK ENERGY AND UTILITIES BOARD ANNUAL REPORT 2015-163
WHAT IS THE PROCESS FOR A HEARING?
WHAT WE REGULATEIn each area, the Board has slightly different jurisdiction.
The Board regulates parts of the electricity sector. All rate increases must be approved by the Board. In addition, capital projects of more than 50 million dollars must also be approved by the Board.
The Board is also responsible for ensuring that the operators and users of the transmission system are in compliance with the North-America-wide standards that are monitored annually by Board Staff.
With respect to the natural gas industry, the Board regulates the distribution rates and customer service policies of Enbridge Gas New Brunswick. The Board only regulates the price that EGNB charges for delivering the gas to your door. The Board monitors, but doesn’t regulate, the price of the natural gas itself.
Each Thursday morning, the Board sets the maximum price that gasoline and heating fuel can be sold for in the province. This is done based on a formula established by legislation. Unlike other areas of Board regulation, there is no discretion involved. The price is set based on a strict average from the previous seven days of trading at the New York commodities market where gasoline is traded daily. More detailed information about the formula is available on our website: www.nbeub.ca/index.php/en/petroleum-products.
The Board reviews and oversees the construction of intraprovincial pipelines that carry hazardous material (extra-provincial pipelines are regulated by the National Energy Board). The vast majority of the pipelines regulated by the Board carry natural gas, although its jurisdiction also extends to pipelines that carry other hazardous substances such as oil, gasoline and brine.
1. The utility or other applicant files an application for a new service or a change in rates. This application usually contains most of the information needed to support the application.
2. A public notice is published – usually in the newspapers.
3. Any party that wants to participate in the proceeding notifies the Board.
4. The Board establishes a hearing process and sets a schedule.
5. The participants submit written questions to the applicant looking for more details about the application.
6. The applicant files written answers to the questions.7. The participants can file their own information or
evidence. Participants’ evidence often challenges the application or makes recommendations for a different rate or service.
8. The participants must then answer any written questions submitted on their evidence.
9. After all of the written questions have been answered, the hearing begins.
10. During the hearing, the applicant and the participants answer more questions about the evidence they have submitted through cross examination. Following the conclusion of the hearing, the participants make final submissions to the Board.
11. The Board deliberates and issues a decision.
While the Board has a typical process, it can be modified if the Board believes that the modification is in the public interest.

NEW BRUNSWICK ENERGY AND UTILITIES BOARD ANNUAL REPORT 2015-16 4
The Board also approves the rates and schedules for scheduled inter-city bus service. Any motor carrier company that wants to run a bus service between communities within NB must first get approval from the
Board. All rate increases and changes in services must also be reviewed by the Board. Charter buses are also licensed by the Board.
The Energy and Utilities Board does not receive funding from government - its costs are paid for by the industries
WHO PAYS FOR REGULATION?that it regulates including electricity, natural gas, petroleum and pipeline.
BOARD MEMBERS
Patrick Ervin, Member Raymond Gorman, Q.C., Chairman and CEOMichael Costello, Member
François Beaulieu, Vice-ChairpersonJohn P. Herron, Member
The Board is made up of five members including a full-time chair, vice-chair and three board members.

NEW BRUNSWICK ENERGY AND UTILITIES BOARD ANNUAL REPORT 2015-165
ORGANIZATION
There is a staff of 15 which includes advisors to the Board, a pipeline safety section, and administration.
Legal and Administration
Ellen Desmond, Q.C.Director
Caroline LeBlanc-ArseneauClerk
Kathleen MitchellChief Clerk
Tracy CyrClerk
Pipeline Safety
Todd McQuinnDirector
David RhydwenPipeline Inspector
Don PersaudPipeline Inspector
Reliability and Compliance
Donald Weaver Reliability Standards
Coordinator
Calvin DuncanDirector
Paul MacDonaldCompliance and Enforcement
Coordinator
Regulatory and Finance
John LawtonDirector
David KeenanAdvisor
David YoungSenior Advisor
Trudy Atherton HallAccounting
Administrator
Raymond Gorman, Q.C.Chairman and CEO
François BeaulieuVice-Chairperson
Michael CostelloMember
Patrick ErvinMember
John P. HerronMember
Michael DickieFinancial Analyst

NEW BRUNSWICK ENERGY AND UTILITIES BOARD ANNUAL REPORT 2015-16 6
COMPLIANCE
Because of the interconnected nature of the BPS, the Board’s reliability programs are closely aligned with those of the North American Electric Reliability Corporation. The Board engages the Northeast Power Coordinating Council to assist with compliance monitoring and to make recommendations on potential violations, mitigation plans and related enforcement actions.
To maintain alignment with neighboring systems, when a reliability standard receives regulatory approval in the United States, NB Power is required to submit a corresponding proposal to the Board for approval, along with any proposed modifications for
New Brunswick. The Board considered and approved 2 new reliability standards, revisions to 31 others and the retirement of 32 standards during the 2015 reporting period. Currently, there are 105 reliability standards enforced in New Brunswick consisting of more than 1200 individual requirements.
Owners, users and operators of the BPS who meet one of the prescribed functions set out in the Reliability Standards Regulation must register with the Board and comply with the reliability standards applicable to that function. In 2015, Saint John Energy was required to register with the Board as a Distribution Provider.
Each year the Board develops and implements an Annual Implementation Plan for compliance monitoring. In 2015, Canadian Hydro Developers and Caribou Wind Park were audited for reliability standards applicable to the Generator Owner and Generator Operator functions. In addition, Registered Entities submitted approximately 94 compliance self-certification and data submittal reports to the Board through the Compliance Monitoring and Reporting System.
If the Board has reason to believe that a Registered Entity is non-compliant with a reliability standard, it initiates enforcement action to ensure the non-compliance is corrected and the underlying causes are addressed to prevent reoccurrence.
In 2015, the Board initiated new enforcement action on 28 potential violations of reliability standards and closed out 4 other potential violations through the “Find Fix Track” enforcement process.
Going forward the Board is preparing to adjust the scope of its compliance monitoring plans to address new Registered Entity compliance responsibilities that will result from the implementation of a revised BPS list of elements in 2016.
RELIABILITY &
The Board has the responsibility, under the Electricity Act, to adopt and enforce electric reliability standards to address the reliability of the Bulk Power System (BPS). The Board implements the Reliability Standards Regulation which sets out specific requirements for the approval of standards, entity registrations and compliance monitoring and enforcement processes.

NEW BRUNSWICK ENERGY AND UTILITIES BOARD ANNUAL REPORT 2015-167
ELECTRICITY
In June 2015, the Board heard the first general rate application under the amended Electricity Act. The utility requested an increase of two percent for all customers.
The Board issued a partial decision on September 28, 2015, disallowing certain costs and required NB Power to find more savings than originally forecast. The Board also ruled that revenue lost due to timing of the hearing could not be recovered by NB Power from ratepayers. The final rate increase was 1.6 percent for all customers.
NB Power also applied for increased rates for third parties to attach to utility poles. NB Power proposed increasing rates from $19.29 per pole to $30.96 per pole. The Board separated this issue from the general rate application and held this portion of the hearing following the hearing on the main revenue requirement. The Board issue a decision on the pole attachment rate in November. The Board denied the proposed increase and set the rate at $20.77 per pole.
As part of the Board’s authority over the use of the transmission system, NB Power and Algonquin Tinker GenCo (Algonquin) - the two transmission providers in the province - applied for increases in the rate charged to transmission customers. While most of the transmission system is owned by NB Power, a small transmission line owned by Algonquin serves the community of Perth-Andover, connecting the village to the rest of the electric power system. Algonquin also serves as a connection to the electric system in Northern Maine.
At the beginning of this reporting year, the Board approved the NB Power rate increase but required more information from both NB Power and Algonquin before it could make a decision on the Algonquin revenue requirement. Algonquin was also seeking pre-approval of the prudency of installing an upgraded transformer on its system. NB Power filed the required information and Algonquin filed an updated revenue requirement in October of 2015. In January of this year the Board held a second hearing to consider Algonquin’s revenue requirement. A decision was issued in March, approving a new revenue requirement for the transmission provider and approving the replacement and upgrade of a transformer on the Algonquin system.
A central element in setting rates is determining the reasonable share of cost that each customer class should pay. After this cost allocation is completed, rates can be adjusted so that the customer classes pay their share of the costs. During the past year, the Board held hearings into the first full cost allocation of NB Power’s costs since the 1990s.
In some cases the process of cost allocation is straightforward. Fuel costs, for example, can be assigned based on the amount of energy each customer class uses. Other costs, like the cost of building a power generation plant, can be more complicated. The proceeding into the allocation of costs was started in October of 2014. The process was suspended, however, after the parties recommended more studies be completed. The studies, along with a new class cost allocation proposal, were filed in October of 2015.
A hearing was held in February of 2016 and the decision was issued in May of 2016. Among other factors, the Board determined that fixed costs relating to generation would be classified and allocated according to a “peak and average” method using multiple load peaks to determine the share of peak usage.
The second rate increase application under the amended Electricity Act was filed in late December of 2015. The application requested a two percent rate increase for the 2016-2017 year along with a request for an interim increase beginning April 1st. The Board denied the request for the interim increase, stating that the company had not demonstrated that the delay was outside NB Power’s control and that there would be a deleterious impact.The hearing was scheduled to be heard in May 2016.
The Board regulates the rates charged by New Brunswick Power Corporation (NB Power) and oversees the operation of the bulk power system which include the high voltage transmission system used by NB Power and other electric utilities.

NEW BRUNSWICK ENERGY AND UTILITIES BOARD ANNUAL REPORT 2015-16 8
Enbridge Gas New Brunswick (EGNB) holds the franchise to deliver natural gas by pipeline in the province. The company serves just under 12,000 customers in 7 communities.
In its rate application for 2016, EGNB proposed to continue with the program for another year. For 2016, however, the company proposed to finance the retention program through rates. EGNB argued before the Board that retaining commercial customers is in the interest of all customers, and therefore it is reasonable that all customers pay for the cost in rates. EGNB also proposed an incentive program to encourage new home builders to install natural gas.
The small general service class, which represents homeowners, has its distribution rates set based on a comparison between the total cost of electricity and the total cost of natural gas. With a drop in the cost of natural gas commodity, EGNB proposed to increase the distribution rates and still remain below the price of electricity. The Board held a three-day hearing into the matter and in a partial decision, approved the revenue requirement and proposed rates. A decision is pending.
In addition to the rate application, the Board reviewed the sale of natural gas by EGNB. While EGNB has the franchise to deliver natural gas, the sale of the commodity itself is subject to market competition. EGNB is allowed to sell natural gas only under conditions aimed at preventing EGNB from using its market position. Most significantly, EGNB cannot make – or lose – money on the sale of natural gas.
NATURAL GAS
Cost of Using Natural Gas (per gigajoule)
The Board is responsible for setting the rates charged for the delivery of natural gas to homes and businesses. Regulations enacted pursuant to the Gas Distribution Act require the Board to adopt either a rate that is based on the costs of serving those customers or a rate that is lower than a competitive fuel. The Board receives a rate application annually from Enbridge and reviews its costs to ensure that expenses are prudent while providing a reasonable opportunity to earn a profit. Last year, winter prices for natural gas remained high in the region because of a shortage of pipeline capacity in New England. While pipelines are being planned to address the shortage, relief from high winter prices may be more than a year away.
Costs for propane have been dropping due to an excess of supply in North America. For some medium size customers, the discounts offered on propane made it a viable alternative to natural gas. As a result, in 2015 EGNB initiated a customer retention program. The parent company invested $500 thousand in incentives to retain commercial customers that were converting to propane.
$-
$50.00
$100.00
$150.00
$200.00
$250.00
$300.00
April May June July August September October November December January February March
Average Cost per household (85 GJs per year)
Monthly Charge Distribution Charge Natural Gas Costs
AverageCost perHousehold (85 GJs per year)
$0
$50
$100
$150
$200
April
June Au
g
Oct
Feb
Dec
$-
$50.00
$100.00
$150.00
$200.00
$250.00
$300.00
April May June July August September October November December January February March
Average Cost per household (85 GJs per year)
Monthly Charge Distribution Charge Natural Gas Costs
$-
$50.00
$100.00
$150.00
$200.00
$250.00
$300.00
April May June July August September October November December January February March
Average Cost per household (85 GJs per year)
Monthly Charge Distribution Charge Natural Gas Costs
$-
$50.00
$100.00
$150.00
$200.00
$250.00
$300.00
April May June July August September October November December January February March
Average Cost per household (85 GJs per year)
Monthly Charge Distribution Charge Natural Gas Costs
$250
8

NEW BRUNSWICK ENERGY AND UTILITIES BOARD ANNUAL REPORT 2015-169
The Pipeline Safety Division’s mandate is to promote safety and to ensure that companies design, construct, operate and abandon pipelines under the Board’s jurisdiction in a manner that provides for the safety of the public and company employees, as well as the protection of property and the environment. This is accomplished through the Safety Division’s use of inspection, education, compliance audits and damage prevention programs.
The inspectors from the Pipeline Safety Division inspect the construction and testing of this pipe. Existing licenses (License to Operate pipelines) are amended for this expansion of the existing natural gas distribution systems once the determination is made that the construction and testing has been completed to the satisfaction of the Board.
EGNB was granted approval to relocate an 8” extra-high pressure pipeline in the Baker Brook area of Lincoln, NB. This work included the abandonment of a section of the existing pipeline and construction of an 8” replacement pipeline. The installation of a temporary pipeline was required for the continuation of natural gas service from the Lincoln Maritimes and Northeast Pipeline custody transfer station to the Fredericton area distribution system.
Potash Corporation of Saskatchewan (PCS) has shut down operations of their Picadilly Mine and Penobsquis processing facilities. Discussions are continuing regarding the continued maintenance and operation of 14 licensed pipelines.
Irving Oil Terminals and Pipelines, GP was granted approval to suspend the operations of the Coleson Cove fuel delivery pipeline from June to October, 2015 and November 2015 to February 2016. Approval was again granted for the suspension of operations in March 2016 until the fall of 2016. Approval for the abandonment of a lateral pipeline supplying fuel to the Irving Pulp and Paper mill in West Saint John was granted to Irving Oil Terminals and Pipelines, GP in May 2015.
Glencore Canada has applied for a Licence to Operate the Acid Rock Drainage (ARD) pipeline at their Brunswick Mine site in March 2016. This application is presently under review.
PIPELINE SAFETY
Enbridge Gas New Brunswick, who was awarded the provincial natural gas distribution franchise in 1999, continues to install infill low pressure (LP), intermediate pressure (IP), high pressure (HP), steel and polyethylene pipelines and extra-high pressure (XHP) steel pipelines (including mains and services) within the municipal limits of Moncton, Dieppe, Fredericton, Oromocto, Saint John, Sackville, St. Stephen, Dorchester, Hanwell and St. George.

NEW BRUNSWICK ENERGY AND UTILITIES BOARD ANNUAL REPORT 2015-16 10
The Board’s regulation of petroleum products in New Brunswick includes approving weekly maximum wholesale and retail prices for motor fuels and heating fuels. Those fuels include all grades of gasoline, ultra-low sulphur diesel fuel (ULSD), furnace oil and propane used for heating.
PETROLEUM PRODUCTS
10
New Brunswick Regulation 2006-41 describes the specific formula that the Board must follow to calculate the weekly maximum petroleum prices. Maximum prices are calculated using the weekly average spot price for refined petroleum products traded at the New York Harbour division of the New York Mercantile Exchange (NYMEX). Maximum prices include the fuel cost component, the regulated wholesale and retail margins, delivery costs and all applicable taxes. Maximum prices for all fuels are based on a seven-day trading week, from Wednesday to the following Tuesday and take effect at 12:01 a.m. each Thursday morning.
The Petroleum Products Pricing Act (PPPA) authorises the Board to adjust the maximum margins (wholesale and retail), maximum delivery costs and the maximum amount that motor fuel retailers may charge for dispensing fuel on a full service basis. Adjustments to the existing margins can only be made after a review of the existing margins, whether initiated by the Board or by an applicant.
The margins, delivery costs and full service charge in effect over the past year were:
Motor FuelsMaximum wholesale margin – 6.51 cents per litreMaximum retail margin – 6.4 cents per litreMaximum full service charge – 3.0 cents per litreMaximum delivery cost – 2.5 cents per litre
Furnace OilMaximum wholesale margin – 5.5 cents per litreMaximum retail margin – 18.2 cents per litreMaximum delivery cost – 5.0 cents per litre
PropaneMaximum wholesale margin – 25.0 cents per litreMaximum retail margin – 25.0 cents per litreMaximum delivery cost – 10.0 cents per litre
In November 2015, New Brunswick Regulation 2015-61 was approved amending Schedule A.1 of New Brunswick Regulation 2006-41. The amendments included a change to the pricing formula for New York Harbour base products from Cargo to Barge product prices.
As part of its ongoing market monitoring responsibility, Board staff conducted numerous site inspections and site visits with petroleum wholesalers and retailers over the past year. These inspections and visits took place in the spring and autumn of 2015. The Public regularly contacts the Board with questions about petroleum products and pricing. During 2015/2016 Board staff responded to 33 public inquiries regarding petroleum products.
April
June Aug
Oct
Dec Feb
40
60
80
100
120
0.0
20.0
40.0
60.0
80.0
100.0
120.0
Heating Oil (cents per litre)
0
40
80
120
Price of Regular Gasoline (cents per litre)
April
June Au
g
Oct
Dec Feb
Regular Gasoline New York Price
0.0
20.0
40.0
60.0
80.0
100.0
120.0
140.0
Price of Regulate Gasoline (cents per litre)
Regular Gasoline New York Price
100
60
20
Heating Oil (cents per litre)

NEW BRUNSWICK ENERGY AND UTILITIES BOARD ANNUAL REPORT 2015-1611
The Board regulates the motor coach industry through the licensing of charter buses and approval of the routes, schedules and passenger fares for intercity, scheduled service bus companies.
reducing the regulatory burden on the Applicant.” The approved fuel surcharge mechanism requires the Board to make adjustments to passenger fares on a quarterly basis, to reflect changes in the price of ultra-low sulphur diesel fuel. During the past year the Board made quarterly adjustments to the fuel surcharge on April 15th, July 15th, October 15th and January 15th. As a consequence of generally low prices for ultra-low sulphur diesel fuel over the past year, the fuel surcharge was set at 1.5% at the first adjustment (April 2015) and reduced to 0% at the second adjustment (July 2015). The fuel surcharge remained at 0% for the remainder of the year.
Owing to the inter-provincial nature of scheduled motor coach operations, the Board co-ordinates its decisions on Coach Atlantic’s fares, routes, schedules and fuel surcharges with the Nova Scotia Utility and Review Board. This coordination ensures that Coach Atlantic’s passengers enjoy uniform fares (based on distance travelled) within the three Maritime provinces and as far as Rivière-du-Loup in Quebec.
In addition to the above-noted items, over the past year the Board approved four applications for charter licences, renewed 35 motor carrier licences, issued 260 motor carrier plates and granted two temporary permits.
MOTOR CARRIER
Scheduled motor coach service in New Brunswick is provided by Coach Atlantic Transportation Group of Charlottetown (Coach Atlantic) which provides daily, inter-city service to most points in New Brunswick, with connecting service to Nova Scotia, Prince Edward Island and Quebec. Coach Atlantic operates this service under the business name Maritime Bus. Coach Atlantic commenced operations in New Brunswick on December 1, 2012 and requires Board approval of its fares, routes and schedules (Board Matter 192).
In its November 9, 2012, decision in Matter 192, the Board granted “approval in principle” to a fuel surcharge for Coach Atlantic, in order to “reduce the need for future fare applications thus

NEW BRUNSWICK ENERGY AND UTILITIES BOARD ANNUAL REPORT 2015-16 12
MARCH 31, 2016FINANCIAL STATEMENTS
Independent Auditors’ Report
Statement of Financial Position
Statement of Change in Accumulated Surplus (Deficit) by Sector
Statement of Change in Net Financial Assets
Statement of Operations
Statement of Cash Flows
Notes to Financial Statements
CONTENTS13
14
15
16
17
18
19

NEW BRUNSWICK ENERGY AND UTILITIES BOARD ANNUAL REPORT 2015-1613
To the Chairman and Members of the New Brunswick Energy and Utilities Board
We have audited the statement of financial position of the New Brunswick Energy and Utilities Board, as at March 31, 2016 and the statements of change in accumulated surplus (deficit) by sector, net financial assets, operations and cash flows for the year then ended, and a summary of significant accounting policies and other explanatory information.
Management’s Responsibility for the Financial Statements
Management is responsible for the preparation and fair presentation of these financial statements in accordance with Canadian public sector accounting standards, and for such internal control as management determines is necessary to enable the preparation of financial statements that are free from material misstatement, whether due to fraud or error.
Auditors’ Responsibility
Our responsibility is to express an opinion on these financial statements based on our audit. We conducted our audit in accordance with Canadian generally accepted auditing standards. Those standards require that we comply with ethical requirements and plan and perform the audit to obtain reasonable assurance about whether the financial statements are free from material misstatement.
An audit involves performing procedures to obtain audit evidence about the amounts and disclosures in the financial statements. The procedures selected depend on the auditors’ judgment, including the assessment of the risks of material misstatement of the financial statements, whether due to fraud or error. In making those risk assessments, the auditors consider internal control relevant to the entity’s preparation and fair presentation of the financial statements in order to design audit procedures that are appropriate in the circumstances, but not for the purpose of expressing an opinion on the effectiveness of the entity’s internal control. An audit also includes evaluating the appropriateness of accounting policies used and the reasonableness of accounting estimates made by management, as well as evaluating the overall presentation of the financial statements.
We believe that the audit evidence we have obtained is sufficient and appropriate to provide a basis for our audit opinion.
Opinion
In our opinion, the financial statements present fairly, in all material respects, the financial position of the New Brunswick Energy and Utilities Board as at March 31, 2016 and the results of its operations and cash flows for the year then ended in accordance with Canadian public sector accounting standards.
INDEPENDENT AUDITORS’ REPORT
CHARTERED PROFESSIONAL ACCOUNTANTSSaint John, NBMay 27, 2016
FINANCIAL STATEMENTS

NEW BRUNSWICK ENERGY AND UTILITIES BOARD ANNUAL REPORT 2015-16 14
STATEMENT OF FINANCIAL POSITION
2016 2015
In our opinion, the financial statements present fairly, in all material respects, the financial position of the New Brunswick Energy and Utilities Board as at March 31, 2016 and the results of its operations and cash flows for the year then ended in accordance with Canadian public sector accounting standards.
Teed Saunders Doyle & Co.Saint John, NBMay 27, 2016 CHARTERED PROFESSIONAL ACCOUNTANTS
STATEMENT OF FINANCIAL POSITION
AS AT MARCH 31, 2016
2016 2015
FINANCIAL ASSETSCash (Notes 2 and 3) $ 1,042,242 $ 1,004,043Accounts receivable (Notes 2, 3 and 4) 46,995 39,557
1,089,237 1,043,600
LIABILITIESAccounts payable and accrued
liabilities (Notes 2, 3 and 5) 71,961 111,400Reserve for future hearings (Notes 2, 3 and 12) 589,886 314,518Future employee benefits (Note 13) 200,413 171,271
862,260 597,189
NET FINANCIAL ASSETS 226,977 446,411
NON-FINANCIAL ASSETSTangible capital assets (Notes 2 and 6) 78,251 53,176Prepaid expenses 145,031 910
223,282 54,086
ACCUMULATED SURPLUS $ 450,259 $ 500,497
COMMITMENTS (Note 15)
APPROVED ON BEHALF OF THE BOARD:
_____________________________ Chairman
_____________________________ Board memberChairman
Vice-Chairperson
AS AT MARCH 31, 2016

NEW BRUNSWICK ENERGY AND UTILITIES BOARD ANNUAL REPORT 2015-1615
STATEMENT OF CHANGE IN ACCUMULATED SURPLUS (DEFICIT) BY SECTORFOR THE YEAR ENDED MARCH 31, 2016
Balance at Beginning of
YearSurplus/
(Defiicit)
Balance atEnd of
Year
FINANCIAL STATEMENTS
STATEMENT OF CHANGE IN ACCUMULATED SURPLUS (DEFICIT) BY SECTOR
FOR THE YEAR ENDED MARCH 31, 2016
Balance at Balance atBeginning of Surplus End of
Year (Deficit) Year
ELECTRICITY SECTOR $ 345,879 $ (81,823) $ 264,056
NATURAL GAS SECTOR 75,285 (29,508) 45,777
PIPELINE SECTOR 79,333 61,093 140,426
PETROLEUM SECTOR - - -
MOTOR CARRIER SECTOR - - -
$ 500,497 $ (50,238) $ 450,259
STATEMENT OF CHANGE IN NET FINANCIAL ASSETS
AS AT MARCH 31, 2016
2016 2015
Surplus (deficit) of revenue over expenses $ (50,238) $ 60,194
Purchase of tangible capital assets (58,779) (23,788)Proceeds on disposal of tangible capital assets 17,586 -Amortization of tangible capital assets 17,640 27,726Gain on disposal of tangible capital assets (1,523) -
(75,314) 64,132
(Increase) decrease in prepaid expenses (144,120) 7,963
INCREASE (DECREASE) IN NET FINANCIAL ASSETS (219,434)72,095
NET FINANCIAL ASSETS AT BEGINNING OF YEAR 446,411374,316
NET FINANCIAL ASSETS AT END OF YEAR $ 226,977 $ 446,41115

NEW BRUNSWICK ENERGY AND UTILITIES BOARD ANNUAL REPORT 2015-16 16
STATEMENT OF CHANGE IN NETFINANCIAL ASSETSAS AT MARCH 31, 2016
2016 2015
STATEMENT OF CHANGE IN ACCUMULATED SURPLUS (DEFICIT) BY SECTOR
FOR THE YEAR ENDED MARCH 31, 2016
Balance at Balance atBeginning of Surplus End of
Year (Deficit) Year
ELECTRICITY SECTOR $ 345,879 $ (81,823) $ 264,056
NATURAL GAS SECTOR 75,285 (29,508) 45,777
PIPELINE SECTOR 79,333 61,093 140,426
PETROLEUM SECTOR - - -
MOTOR CARRIER SECTOR - - -
$ 500,497 $ (50,238) $ 450,259
STATEMENT OF CHANGE IN NET FINANCIAL ASSETS
AS AT MARCH 31, 2016
2016 2015
Surplus (deficit) of revenue over expenses $ (50,238) $ 60,194
Purchase of tangible capital assets (58,779) (23,788)Proceeds on disposal of tangible capital assets 17,586 -Amortization of tangible capital assets 17,640 27,726Gain on disposal of tangible capital assets (1,523) -
(75,314) 64,132
(Increase) decrease in prepaid expenses (144,120) 7,963
INCREASE (DECREASE) IN NET FINANCIAL ASSETS (219,434) 72,095
NET FINANCIAL ASSETS AT BEGINNING OF YEAR 446,411 374,316
NET FINANCIAL ASSETS AT END OF YEAR $ 226,977 $ 446,411
STATEMENT OF OPERATIONS

NEW BRUNSWICK ENERGY AND UTILITIES BOARD ANNUAL REPORT 2015-1617
STATEMENT OF OPERATIONSFOR THE YEAR ENDED MARCH 31, 2016
2016Budget
2016 Actual
2015Actual
FINANCIAL STATEMENTS
FOR THE YEAR ENDED MARCH 31, 2016
2016 2016 2015Budget Actual Actual
REVENUE (Note 2)Electricity Sector (Note 7) $ 1,984,735 $ 1,786,889 $ 1,713,958Natural Gas Sector (Note 8) 526,730 455,200 447,019Pipeline Sector (Note 9) 684,542 607,312 662,711Petroleum Sector (Notes 10 and 12) 465,837 409,859 339,790
3,661,844 3,259,260 3,163,478
DIRECT EXPENSES (Note 2)Electricity Sector 303,000 284,341 124,731Natural Gas Sector 50,000 27,971 47,892Pipeline Sector 9,500 5,634 6,731Petroleum Sector (Note 12) 75,000 37,918 6,016
437,500 355,864 185,370
NET REVENUE BEFORE COMMON EXPENSES 3,224,344 2,903,396 2,978,108
COMMON EXPENSES (Note 2)Salaries and benefits 2,460,122 2,334,862 2,290,671Office and administration (Note 15) 608,900 498,231 486,734Training 118,000 102,901 112,783Amortization 37,322 17,640 27,726
3,224,344 2,953,634 2,917,914
SURPLUS (DEFICIT) OF REVENUE OVER EXPENSES $ - $ (50,238) $ 60,194
STATEMENT OF CASH FLOWS
FOR THE YEAR ENDED MARCH 31, 2016

NEW BRUNSWICK ENERGY AND UTILITIES BOARD ANNUAL REPORT 2015-16 18
STATEMENT OF CASH FLOWSFOR THE YEAR ENDED MARCH 31, 2016
2016 2015
STATEMENT OF CASH FLOWS
FOR THE YEAR ENDED MARCH 31, 2016
2016 2015
CASH PROVIDED BY (USED IN)Operating activities
Surplus (deficit) of revenue over expenses $ (50,238) $ 60,194Items not involving cash
Amortization 17,640 27,726Gain on disposal of tangible capital assets (1,523) -
(34,121) 87,920Changes in non-cash working capital balances
Accounts receivable (7,438) (1,682)Prepaid expenses (144,120) 7,963Accounts payable and accrued liabilities (39,439) (136,568)Reserve for future hearings 275,368 285,284Future employee benefits 29,142 30,858
79,392 273,775
Investing activitiesPurchase of tangible capital assets (58,779) (23,788)Proceeds on disposal of tangible capital assets 17,586 -
(41,193) (23,788)
INCREASE IN CASH 38,199 249,987
CASH AT BEGINNING OF YEAR 1,004,043 754,056
CASH AT END OF YEAR $ 1,042,242 $ 1,004,043
SUPPLEMENTARY CASH FLOW INFORMATIONInterest received $ 14,447 $ 14,954
1. PURPOSE OF THE ORGANIZATION
On February 1, 2007, the Public Utilities Act was replaced by the Energy and Utilities Board Act (the "Act"). As a result, the name of the Board was changed from the Board of Commissioners of Public Utilities of the Province of New Brunswick to the New Brunswick Energy and Utilities Board (the "Board"). Pursuant to amendments to the Act in 2013, the part time Board member positions were replaced with three full time members. The Board is now comprised of five full time members which include a chairperson and a vice chairperson.
The Board has regulatory responsibilities under various Acts primarily involving electricity, pipelines, natural gas, petroleum products and public motor busses. The Board operates with funds received from the industries it regulates.
The Government of New Brunswick on May 7th, 2013 introduced Bill 39, the “Electricity Act”. This new legislation became effective on October 1, 2013. As a result of the change in legislation, the Board’s mandate for the electricity sector changed, adding responsibility for approval of reliability standards, compliance monitoring and enforcement. As a result, the Board hired three new staff previously employed by the New Brunswick System Operator and opened a sub-office in Fredericton. The various companies operating within the New Brunswick Power group of companies were restructured into the New Brunswick Power Corporation and the Board’s regulatory responsibilities changed as a result of the restructuring.

NEW BRUNSWICK ENERGY AND UTILITIES BOARD ANNUAL REPORT 2015-1619
On February 1, 2007, the Public Utilities Act was replaced by the Energy and Utilities Board Act (the “Act”). As a result, the name of the Board was changed from the Board of Commissioners of Public Utilities of the Province of New Brunswick to the New Brunswick Energy and Utilities Board (the “Board”). Pursuant to amendments to the Act in 2013, the part time Board member positions were replaced with three full time members. The Board is now comprised of five full time members which include a chairperson and a vice chairperson.
The Board has regulatory responsibilities under various Acts primarily involving electricity, pipelines, natural gas, petroleum products and public motor busses. The Board operates with funds received from the industries it regulates.
The Government of New Brunswick on May 7th, 2013 introduced Bill 39, the “Electricity Act”. This new legislation became effective on October 1, 2013. As a result of the change in legislation, the Board’s mandate for the electricity sector changed, adding responsibility for approval of reliability standards, compliance monitoring and enforcement. As a result, the Board hired three new staff previously employed by the New Brunswick System Operator and opened a sub-office in Fredericton. The various companies operating within the New Brunswick Power group of companies were restructured into the New Brunswick Power Corporation and the Board’s regulatory responsibilities changed as a result of the restructuring.
The Board is exempt from income tax under Section 149(1)(d) of the Income Tax Act of Canada.
Basis of PresentationThe financial statements were prepared in accordance with Canadian public sector accounting standards (“PSAS”).
Tangible Capital AssetsTangible capital assets are recorded at cost. Minor expenditures for furniture and fixtures are expensed in the year of acquisition. Amortization is recorded using the straight-line method at the following annual rates: Computer equipment 33 1/3% Vehicles 20%, 25%
Revenue RecognitionThe Board follows the deferral method of accounting for revenue. Restricted revenue is recognized as revenue in the year in which the related expenses are incurred. Unrestricted revenue is recognized as revenue when received or receivable if the amount to be received can be reasonably estimated and collection is reasonably assured. Interest revenue is recorded on an accrual basis.
Common Expense AllocationsIn determining the surplus (deficit) for each of the sectors, common expenses have been allocated based on management’s best judgment and actual activity during the year.
2. SUMMARY OF SIGNIFICANT ACCOUNTING POLICIES
1. PURPOSE OF THE ORGANIZATION
NOTES TO FINANCIAL STATEMENTSMARCH 31, 2016
FINANCIAL STATEMENTS

NEW BRUNSWICK ENERGY AND UTILITIES BOARD ANNUAL REPORT 2015-16 20
3. FINANCIAL INSTRUMENTS
Direct ExpensesDirect expenses may include consultants’ fees, hearing costs, travel, training, out of pocket expenses and assessments from the North American Electric Reliability Corporation (NERC) directly attributable to a specific area of regulatory responsibility.
Financial InstrumentsFinancial instruments are recorded at fair value when acquired or issued. In subsequent periods, equity instruments with actively traded markets are reported at fair value, with any unrealized gains and losses reported in income. All other financial instruments are reported at amortized cost, and tested for impairment at each reporting date. Transaction costs on the acquisition, sale or issue of financial instruments are expensed when incurred.
Cash and Cash EquivalentsFor the purpose of the statement of cash flows, the Board considers cash on hand and balances with banks, net of overdrafts, as cash or cash equivalents.
Measurement UncertaintyThe preparation of financial statements in accordance with Canadian public sector accounting standards requires management to make estimates and assumptions that affect the reported amount of assets and liabilities and disclosure of contingent assets and liabilities at the date of the financial statements and the reported amount of revenues and expenses during the reporting period. These estimates are reviewed periodically, and as adjustments become necessary, they are reported in earnings in the period in which they become known.
Examples of significant estimates include:- the estimated useful lives of assets;- the recoverability of tangible capital assets; and- the calculation of future employee benefits.
The Board is exposed to various risks through its financial instruments and has a comprehensive risk management framework to monitor, evaluate and manage these risks. The following analysis provides information about the Board’s risk exposure and concentration as of March 31, 2016:
Credit RiskCredit risk arises from the potential that a counter party will fail to perform its obligations. The Board is subject to credit risk through accounts receivable. The Board minimizes its credit risk through ongoing credit management. The Board does not have significant credit risk exposure to any individual customer.
Liquidity RiskLiquidity risk is the risk that an entity will encounter difficulty in meeting obligations associated with financial liabilities. The Board is exposed to this risk mainly in respect of its receipt of funds from its customers and other related sources, accounts payable and accrued liabilities and other obligations.
Currency RiskCurrency risk is the risk to the Board that may arise from fluctuations of foreign exchange rates and the degree of volatility of these rates. The Board is exposed to foreign currency exchange risk for expenses incurred in U.S. dollars.
Interest Rate RiskInterest rate risk is the risk that the value of a financial instrument might be adversely affected by a change in the interest rates. In seeking to minimize the risks from interest rate fluctuations, the Board manages exposure through its normal operating and financing activities. The Board is not exposed to interest rate risk as it does not have any interest bearing debt.

NEW BRUNSWICK ENERGY AND UTILITIES BOARD ANNUAL REPORT 2015-1621
NOTES TO FINANCIAL STATEMENTS
Cost Amortization Net Net
Computer equipment $ 26,209 $ 9,259 $ 16,950 $ 13,770Vehicles 111,959 50,658 61,301 39,406
$ 138,168 $ 59,917 $ 78,251 $ 53,176
7. ELECTRICITY SECTOR REVENUE
In accordance with Section 50 of the Energy and Utilities Board Act, certain corporations are assessed each year for their estimated direct expenses together with their estimated share of the Board's common expense budget. Assessments are adjusted to include the audited surplus or deficit from the prior year.
2016 2015
Estimate of common expenses $ 1,681,734 $ 1,760,292Estimate of direct expenses 303,000 300,000
1,984,734 2,060,292Surplus from prior year (345,879) (358,760)
Assessment of electric utilities 1,638,855 1,701,532Add: NERC assessment 137,322 -Add: other income 800 -Add: interest income 9,912 12,426
$ 1,786,889 $ 1,713,958
8. NATURAL GAS SECTOR REVENUE
In accordance with Section 50 of the Energy and Utilities Board Act, natural gas distributors are assessed each year for their estimated direct expenses together with their estimated share of the Board's common expense budget. Assessments are adjusted to include the audited surplus or deficit from the prior year.
2016 2015
Estimate of common expenses $ 476,730 $ 438,191Estimate of direct expenses 51,000 50,000
527,730 488,191Surplus from prior year (75,285) (43,201)
Assessment of natural gas distributors 452,445 444,990Add: other income 400 500Add: interest income 2,355 1,529
$ 455,200 $ 447,019
9. PIPELINE SECTOR REVENUE
In accordance with Section 50 of the Energy and Utilities Board Act, certain pipeline owners are assessed each year for their estimated direct expenses together with their estimated share of the Board's common expense budget. Fees paid by single end use franchisees to the Department of Energy and Mines were submitted by the Department to the Board to be used to reduce common expenses for regulation of pipelines.
2016 2015
6. TANGIBLE CAPITAL ASSETS
2015 Net2016 Net
2016 Accumulated Amortization
2016Cost
FINANCIAL STATEMENTS
2016 2015
4. ACCOUNTS RECEIVABLE
- the estimated useful lives of assets;- the recoverability of tangible capital assets; and- the calculation of future employee benefits.
3. FINANCIAL INSTRUMENTS
The Board is exposed to various risks through its financial instruments and has a comprehensive risk management framework to monitor, evaluate and manage these risks. The following analysis provides information about the Board's risk exposure and concentration as of March 31, 2016:
Credit Risk
Credit risk arises from the potential that a counter party will fail to perform its obligations. The Board is subject to credit risk through accounts receivable. The Board minimizes its credit risk through ongoing credit management. The Board does not have significant credit risk exposure to any individual customer.
3. FINANCIAL INSTRUMENTS (cont'd)
Liquidity Risk
Liquidity risk is the risk that an entity will encounter difficulty in meeting obligations associated with financial liabilities. The Board is exposed to this risk mainly in respect of its receipt of funds from its customers and other related sources, accounts payable and accrued liabilities and other obligations.
Currency Risk
Currency risk is the risk to the Board that may arise from fluctuations of foreign exchange rates and the degree of volatility of these rates. The Board is exposed to foreign currency exchange risk for expenses incurred in U.S. dollars.
Interest Rate Risk
Interest rate risk is the risk that the value of a financial instrument might be adversely affected by a change in the interest rates. In seeking to minimize the risks from interest rate fluctuations, the Board manages exposure through its normal operating and financing activities. The Board is not exposed to interest rate risk as it does not have any interest bearing debt.
4. ACCOUNTS RECEIVABLE
2016 2015
Trade accounts receivable $ 7,319 $ 34 Employee vacation 9,494 5,693
HST receivable 24,944 27,583Travel advances 5,238 6,247
$ 46,995 $ 39,557
5. ACCOUNTS PAYABLE AND ACCRUED LIABILITIES
2016 2015
Trade accounts payable $ 28,206 $ 91,853Due to Province of New Brunswick 4,139 3,815Wages and benefits 39,616 15,732
$ 71,961 $ 111,400
5. ACCOUNTS PAYABLE AND ACCRUED LIABILITIES
2016 2015
3. FINANCIAL INSTRUMENTS
The Board is exposed to various risks through its financial instruments and has a comprehensive risk management framework to monitor, evaluate and manage these risks. The following analysis provides information about the Board's risk exposure and concentration as of March 31, 2016:
Credit Risk
Credit risk arises from the potential that a counter party will fail to perform its obligations. The Board is subject to credit risk through accounts receivable. The Board minimizes its credit risk through ongoing credit management. The Board does not have significant credit risk exposure to any individual customer.
3. FINANCIAL INSTRUMENTS (cont'd)
Liquidity Risk
Liquidity risk is the risk that an entity will encounter difficulty in meeting obligations associated with financial liabilities. The Board is exposed to this risk mainly in respect of its receipt of funds from its customers and other related sources, accounts payable and accrued liabilities and other obligations.
Currency Risk
Currency risk is the risk to the Board that may arise from fluctuations of foreign exchange rates and the degree of volatility of these rates. The Board is exposed to foreign currency exchange risk for expenses incurred in U.S. dollars.
Interest Rate Risk
Interest rate risk is the risk that the value of a financial instrument might be adversely affected by a change in the interest rates. In seeking to minimize the risks from interest rate fluctuations, the Board manages exposure through its normal operating and financing activities. The Board is not exposed to interest rate risk as it does not have any interest bearing debt.
4. ACCOUNTS RECEIVABLE
2016 2015
Trade accounts receivable $ 7,319 $ 34 Employee vacation 9,494 5,693
HST receivable 24,944 27,583Travel advances 5,238 6,247
$ 46,995 $ 39,557
5. ACCOUNTS PAYABLE AND ACCRUED LIABILITIES
2016 2015
Trade accounts payable $ 28,206 $ 91,853Due to Province of New Brunswick 4,139 3,815Wages and benefits 39,616 15,732
$ 71,961 $ 111,400
6. TANGIBLE CAPITAL ASSETS2016 2015
Accumulated
NEW BRUNSWICK ENERGY AND UTILITIES BOARD ANNUAL REPORT 2015-16 22
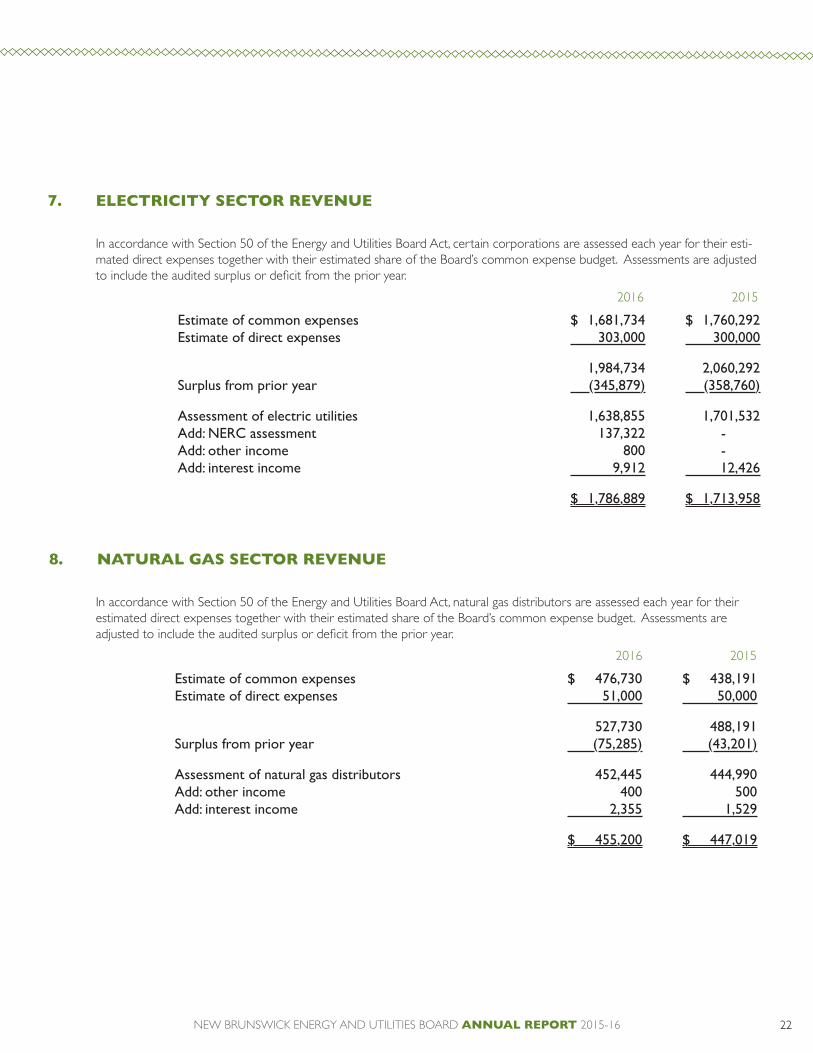
7. ELECTRICITY SECTOR REVENUE
In accordance with Section 50 of the Energy and Utilities Board Act, certain corporations are assessed each year for their esti-mated direct expenses together with their estimated share of the Board’s common expense budget. Assessments are adjusted to include the audited surplus or deficit from the prior year.
2016 2015
8. NATURAL GAS SECTOR REVENUE
In accordance with Section 50 of the Energy and Utilities Board Act, natural gas distributors are assessed each year for their estimated direct expenses together with their estimated share of the Board’s common expense budget. Assessments are adjusted to include the audited surplus or deficit from the prior year.
2016 2015
6. TANGIBLE CAPITAL ASSETS2016 2015
AccumulatedCost Amortization Net Net
Computer equipment $ 26,209 $ 9,259 $ 16,950 $ 13,770Vehicles 111,959 50,658 61,301 39,406
$ 138,168 $ 59,917 $ 78,251 $ 53,176
7. ELECTRICITY SECTOR REVENUE
In accordance with Section 50 of the Energy and Utilities Board Act, certain corporations are assessed each year for their estimated direct expenses together with their estimated share of the Board's common expense budget. Assessments are adjusted to include the audited surplus or deficit from the prior year.
2016 2015
Estimate of common expenses $ 1,681,734 $ 1,760,292Estimate of direct expenses 303,000 300,000
1,984,734 2,060,292Surplus from prior year (345,879) (358,760)
Assessment of electric utilities 1,638,855 1,701,532Add: NERC assessment 137,322 -Add: other income 800 -Add: interest income 9,912 12,426
$ 1,786,889 $ 1,713,958
8. NATURAL GAS SECTOR REVENUE
In accordance with Section 50 of the Energy and Utilities Board Act, natural gas distributors are assessed each year for their estimated direct expenses together with their estimated share of the Board's common expense budget. Assessments are adjusted to include the audited surplus or deficit from the prior year.
2016 2015
Estimate of common expenses $ 476,730 $ 438,191Estimate of direct expenses 51,000 50,000
527,730 488,191Surplus from prior year (75,285) (43,201)
Assessment of natural gas distributors 452,445 444,990Add: other income 400 500Add: interest income 2,355 1,529
$ 455,200 $ 447,019
9. PIPELINE SECTOR REVENUE
In accordance with Section 50 of the Energy and Utilities Board Act, certain pipeline owners are assessed each year for their estimated direct expenses together with their estimated share of the Board's common expense budget. Fees paid by single end use franchisees to the Department of Energy and Mines were submitted by the Department to the Board to be used to reduce common expenses for regulation of pipelines.

NEW BRUNSWICK ENERGY AND UTILITIES BOARD ANNUAL REPORT 2015-1623
In accordance with Section 50 of the Energy and Utilities Board Act, certain pipeline owners are assessed each year for their estimated direct expenses together with their estimated share of the Board’s common expense budget. Fees paid by single end use franchisees to the Department of Energy and Mines were submitted by the Department to the Board to be used to reduce common expenses for regulation of pipelines.
9. PIPELINE SECTOR REVENUE
Section 26 of the Petroleum Products Pricing Act (the “PPP Act”) requires each wholesaler, as defined in the Gasoline and Motive Fuel Act, to pay an annual levy to the Board. Per amended legislation passed on September 2014, the levy shall be based on the volume of gasoline and motive fuel, as defined by the Gasoline and Motive Fuel Tax Act, or based on each litre of gasoline and motive fuel sold in the twelve month period ending October 31st proceeding the calendar year for which its wholesaler’s license was issued. The levy is used to defray the Board’s expenses under the PPP Act as well as defraying the expenses incurred by the Public Intervenor for the Energy Sector as a result of a review conducted by the Board under subsection 14(1).
10. PETROLEUM SECTOR REVENUE
NOTES TO FINANCIAL STATEMENTS
2016 2015
Pursuant to Section 51 of the Act, the costs incurred by the Attorney General under Section 49 of the Act are to be collected by the Board and remitted to the Minister of Finance. During the year, $619,407 (2015 - $196,396) was remitted to the Min-ister of Finance. The funds remitted consisted of direct assessments collected from the Electricity, Natural Gas and Pipeline Sec-tors totaling $596,652 (2015 - $196,396), and $22,754 (2015 - nil) collected from the Petroleum Sector via levies. The amounts directly assessed to the Electricity, Natural Gas and Pipeline Sectors are not included in the revenue and expenses of the Board. There are no fees due to the Minister of Finance as at March 31, 2016 (2015 - nil).
11. ASSESSMENT FOR PUBLIC INTERVENER
FINANCIAL STATEMENTS
2016 2015
Estimate of common expenses $ 675,042 $ 688,053Less: amounts from Department of Energy and Mines 399,521 393,229
Estimate of net common expenses 275,521 294,824Estimate of direct expenses 9,500 12,000
285,021 306,824Surplus from prior year (79,333) (38,342)
Assessment of pipeline owners 205,688 268,482Add: amounts from Department of Energy and Mines 399,521 393,229Add: other income (expense) (77) -Add: interest income 2,180 1,000
$ 607,312 $ 662,711
10. PETROLEUM SECTOR REVENUE
Section 26 of the Petroleum Products Pricing Act (the "PPP Act") requires each wholesaler, as defined in the Gasoline and Motive Fuel Act, to pay an annual levy to the Board. Per amended legislation passed on September 2014, the levy shall be based on the volume of gasoline and motive fuel, as defined by the Gasoline and Motive Fuel Tax Act, or based on each litre of gasoline and motive fuel sold in the twelve month period ending October 31st proceeding the calendar year for which its wholesaler's license was issued. The levy is used to defray the Board's expenses under the PPP Act as well as defraying the expenses incurred by the Public Intervenor for the Energy Sector as a result of a review conducted by the Board under subsection 14(1).
11. ASSESSMENT FOR PUBLIC INTERVENER
Pursuant to Section 51 of the Act, the costs incurred by the Attorney General under Section 49 of the Act are to be collected by the Board and remitted to the Minister of Finance. During the year, $619,407 (2015 - $196,396) was remitted to the Minister of Finance. The funds remitted consisted of direct assessments collected from the Electricity, Natural Gas and Pipeline Sectors totaling $596,652 (2015 - $196,396), and $22,754 (2015 - nil) collected from the Petroleum Sector via levies. The amounts directly assessed to the Electricity, Natural Gas and Pipeline Sectors are not included in the revenue and expenses of the Board. There are no fees due to the Minister of Finance as at March 31, 2016 (2015 - nil).
12. RESERVE FOR FUTURE HEARINGS
The Board has established a reserve to assist in the cost of future hearings in the Petroleum Sector. The levies received to cover the costs of such hearings are included in the reserve and will be recognized when the hearing costs are incurred. The activity during the year was as follows:
2016 2015
Balance at beginning of year $ 314,518 $ 29,234Add: levies contributed to the reserve 275,368 285,284
Balance at end of year $ 589,886 $ 314,518
13. FUTURE EMPLOYEE BENEFITS
The Board has a liability related to the eligibility of the chairman for Deputy Minister pension/termination benefits including supplemental pension benefits of one year (or part year) of service to a maximum of five years of service. The Board has accrued $200,413 (2015 - $171,271) for this

NEW BRUNSWICK ENERGY AND UTILITIES BOARD ANNUAL REPORT 2015-16 24
The Board has established a reserve to assist in the cost of future hearings in the Petroleum Sector. The levies received to cover the costs of such hearings are included in the reserve and will be recognized when the hearing costs are incurred. The activity during the year was as follows:
12. RESERVE FOR FUTURE HEARINGS
The Board has a liability related to the eligibility of the chairman for Deputy Minister pension/termination benefits including supplemental pension benefits of one year (or part year) of service to a maximum of five years of service. The Board has accrued $200,413 (2015 - $171,271) for this future employee benefit.
13. FUTURE EMPLOYEE BENEFITS
On January 1, 2014, the Province replaced the Public Service Superannuation Act (“PSSA”) with the Public Service Shared Risk Plan (“PSSRP”). For pension entitlements earned after January 1, 2014, the employer will make defined contributions to the plan, with no guarantee of the benefit payout at retirement. The PSSRP will pay cost of living increases and other ancillary benefits only to the extent that funds are available for such benefits. The PSSRP is governed by an independent board of trustees. Other changes include retirement age as well as increases in pension reduction for early retirement.
14. PENSION PLAN
2016 2015
2016 2015
Estimate of common expenses $ 675,042 $ 688,053Less: amounts from Department of Energy and Mines 399,521 393,229
Estimate of net common expenses 275,521 294,824Estimate of direct expenses 9,500 12,000
285,021 306,824Surplus from prior year (79,333) (38,342)
Assessment of pipeline owners 205,688 268,482Add: amounts from Department of Energy and Mines 399,521 393,229Add: other income (expense) (77) -Add: interest income 2,180 1,000
$ 607,312 $ 662,711
10. PETROLEUM SECTOR REVENUE
Section 26 of the Petroleum Products Pricing Act (the "PPP Act") requires each wholesaler, as defined in the Gasoline and Motive Fuel Act, to pay an annual levy to the Board. Per amended legislation passed on September 2014, the levy shall be based on the volume of gasoline and motive fuel, as defined by the Gasoline and Motive Fuel Tax Act, or based on each litre of gasoline and motive fuel sold in the twelve month period ending October 31st proceeding the calendar year for which its wholesaler's license was issued. The levy is used to defray the Board's expenses under the PPP Act as well as defraying the expenses incurred by the Public Intervenor for the Energy Sector as a result of a review conducted by the Board under subsection 14(1).
11. ASSESSMENT FOR PUBLIC INTERVENER
Pursuant to Section 51 of the Act, the costs incurred by the Attorney General under Section 49 of the Act are to be collected by the Board and remitted to the Minister of Finance. During the year, $619,407 (2015 - $196,396) was remitted to the Minister of Finance. The funds remitted consisted of direct assessments collected from the Electricity, Natural Gas and Pipeline Sectors totaling $596,652 (2015 - $196,396), and $22,754 (2015 - nil) collected from the Petroleum Sector via levies. The amounts directly assessed to the Electricity, Natural Gas and Pipeline Sectors are not included in the revenue and expenses of the Board. There are no fees due to the Minister of Finance as at March 31, 2016 (2015 - nil).
12. RESERVE FOR FUTURE HEARINGS
The Board has established a reserve to assist in the cost of future hearings in the Petroleum Sector. The levies received to cover the costs of such hearings are included in the reserve and will be recognized when the hearing costs are incurred. The activity during the year was as follows:
2016 2015
Balance at beginning of year $ 314,518 $ 29,234Add: levies contributed to the reserve 275,368 285,284
Balance at end of year $ 589,886 $ 314,518
13. FUTURE EMPLOYEE BENEFITS
The Board has a liability related to the eligibility of the chairman for Deputy Minister pension/termination benefits including supplemental pension benefits of one year (or part year) of service to a maximum of five years of service. The Board has accrued $200,413 (2015 - $171,271) for this

NEW BRUNSWICK ENERGY AND UTILITIES BOARD ANNUAL REPORT 2015-1625
Saint JohnThe Board has signed a lease for its office premises for a ten year period commencing March 1, 2011.The minimum annual lease payments due are as follows:
15. COMMITMENTS
FrederictonThe Board has signed a lease for its office premises for a five year period commencing March 1, 2014.The minimum annual lease payments due are as follows:
FINANCIAL STATEMENTS
future employee benefit.
14. PENSION PLAN
On January 1, 2014, the Province replaced the Public Service Superannuation Act ("PSSA") with the Public Service Shared Risk Plan ("PSSRP"). For pension entitlements earned after January 1, 2014, the employer will make defined contributions to the plan, with no guarantee of the benefit payout at retirement. The PSSRP will pay cost of living increases and other ancillary benefits only to the extent that funds are available for such benefits. The PSSRP is governed by an independent board of trustees. Other changes include retirement age as well as increases in pension reduction for early retirement.
15. COMMITMENTS
Saint John
The Board has signed a lease for its office premises for a ten year period commencing March 1, 2011.
The minimum annual lease payments due are as follows:
2017 $ 171,9042018 177,9672019 177,9672020 177,9672021 163,136
$ 868,941
Fredericton
The Board has signed a lease for its office premises for a five year period commencing March 1, 2014.
The minimum annual lease payments due are as follows:
2017 $ 34,8212018 34,8212019 31,919
$ 101,561


