Blackwood High School Number: 905Partnership: Mitcham Hills
Name of School Principal: _______________________________________Name of Governing Council Chair: _______________________________________Date of Endorsement: _______________________________________
Blackwood High School2017 Annual Report
to the School Community
Sharon GoldmanHelen Keen6 March 2018
School Context and Highlights
Governing Council Report
| Blackwood High School2017 Annual Report to the School Community1
Throughout the 2017 school year the members of the Governing Council have met on a regular basis. In constructive meetingswith the school management we participated in discussions that spanned a range of issues to do with budgeting, buildingworks, uniform, policies, student free days and canteen.- Building Works included the renovations of the two classrooms in the main building (formerly known as Year 11 study) and thefront lawns of the school. Decisions were also made around the new STEM Centre and the relocation of the Resource Centreand Student Wellbeing Centre.- There was renewal of the uniform contract, as well as the adding of new uniform items such as the long sleeve polo, schoolcap and dark green woollen jumper.- Policies included updating the Mobile Communications and Social Media Policy, the Fundraising Policy, Material and ServicesCharges and the Bad Debts policy.- The Governing Council discussed the hire of school facilities and the associated charges.- Student Free Days were discussed with approval by the Governing Council.- Continued oversight of the Canteen operations.
I would like to express my thanks to the Principal, Sharon Goldman, the administrative and management team, the teachers,and the parent and student representatives, who gave up their time to be part of the Governing Council. It was great to see thatthe student representatives were actively involved in our deliberations. I hope that our meetings have made a contributiontowards ensuring that Blackwood High School remains an excellent place for learning and friendship.I wish everyone at Blackwood High School a successful year!
Blackwood High School is located in the foothills of Adelaide. The profile of student enrolments includes 17% of non-EnglishSpeaking Background, 5% English as an Additional Language or Dialect, 4% with an identified learning need and 1.5%Aboriginal and Torres Strait islander.
The school offers a comprehensive educational program catering for students who have diverse aspirations including tertiary,apprenticeship and other skilled employment pathways. Blackwood High School offers Specialist Sports programs includingFootball and Netball, as well as Vocational Education and Training (VET). Vet courses delivered at the school includeCertificate II Electrotechnology, Certificate III Sport and Recreation, Certificate II and III Dance and Certificate II and III Music
The school provides education for full fee paying International Students as well as Study Abroad and Short-Stay EnglishPrograms linked through DECD International Education Services.
At the beginning of Term 2 a new Principal was appointed to the school and worked with staff, students and families across theyear to determine the future directions of the school.
Staff continued to work on assessment task design supported by the delivery of two professional learning days through theInstitute of Educational Assessors (IEA).
Significant site funded works were completed during 2017 to support students learning and wellbeing. These included: - a multi-purpose courtyard- restructuring the front of the school to provide shelter for students along the school bus way- a shelter connection between the Resource Centre and the Senior Learning Centre- a new Resource Centre- a new Student Wellbeing Centre- a flexible teaching and learning space.
The school also had significant DECD/state government funded facility developments underway or completed:- 312 solar panels were installed on the Visual Arts building and the covered outdoor learning area.- Construction of the $2.5 million STEM Works began at the end of the year with a planned completion date of June 2018. Thisnew facility will bring together Science, Mathematics and Technology to support changes in curriculum and pedagogicalpractices. The Year 10 Extension Science 'Finding Wombats program', supported by the University of Adelaide, is an exampleof STEM innovation occurring at Blackwood High School.- 7M Building Better Schools program.

Improvement Planning and Outcomes
| Blackwood High School2017 Annual Report to the School Community 2
The school was held in a 'holding pattern' through Term 1 under the leadership of David Garrett, acting as Principal, while panelprocesses were conducted for the appointment of a new Principal.
Once appointed, the new Principal, Sharon Goldman, worked with staff, students and families across the year to determine thefuture directions of the school which would frame a new Improvement Plan and the instigation of an Improvement Team to drivethe incorporated strategies with staff, students and the community.
Extensive one-to-one consultation was undertaken by the Principal meeting with each staff member to gauge the success ofcurrent initiatives and determine the most significant opportunities for improvement. This process was also conducted withrepresentatives from the student body, the Governing Council and through Parent surveys.
At the same time, a comprehensive analysis of student achievement data was undertaken, along with a review of the school'sfinances and asset management plan.
Through theses processes, and subsequent staff meeting dialogue, key areas were determined as the foci for the next iterationof the Site Improvement Plan:- whole school performance and development processes- quality pedagogical practices- improved literacy outcomes- improved numeracy outcomes
To refine and drive these improvement imperatives, an Improvement Team was established at the end of the 2017 school yearwith additional vacancies left open for new staff to nominate at the beginning of 2018. The role of the Site Improvement Teamwas clarified to include identification of our greatest opportunities for improvement in regards to our journey from being a highperforming school to a school of excellence through:- working with staff and the community to develop shared responsibility for whole school strategies and processes- identification of key data and interrogation of those to drive improvement at whole school and classroom levels- establishing congruence in all we do and celebrate – site improvement plan, staff performance and development, professionallearning and student learning celebration.
The Site Improvement Plan for 2018 was developed as a 'work in progress' at the end of 2017 for further development andratification by the Improvement Team and Governing Council.

NAPLAN ProficiencyThe DECD Standard of Educational Achievement (SEA) is defined as children and young people progressing and achieving at or above their appropriate year level. For NAPLAN, this is students achieving in proficiency bands one or more above the National Minimum Standard for Reading and Numeracy. The graph below identifies the percentage of non-exempt students enrolled in the school at the time of NAPLAN testing, who have demonstrated achievement in NAPLAN proficiency bands at or above the DECD SEA for Reading and Numeracy.
Reading
Numeracy
Data Source: DECD special extract from National Assessment Program Literacy and Numeracy (NAPLAN) SA TAA data holdings, July 2017.*NOTE: Reporting of data not provided when less than six students in the respective cohort. A blank graph may imply student count being less than six across all cohorts.
Data Source: DECD special extract from National Assessment Program Literacy and Numeracy (NAPLAN) SA TAA data holdings, July 2017.*NOTE: Reporting of data not provided when less than six students in the respective cohort. A blank graph may imply student count being less than six across all cohorts.
Performance Summary
| Blackwood High School2017 Annual Report to the School Community3

NAPLAN ProgressThe data below represents the growth of students from 2015 to 2017 in the NAPLAN test relative to students with the same original score, presented in quartiles.
Reading
Numeracy
NAPLAN progression Year 5-7 Year 7-9 State (average)Upper progress group * 31% 25%
Middle progress group * 45% 50%
Lower progress group * 25% 25%
NAPLAN progression Year 7-9 Year 5-7 State (average)Upper progress group 22% * 25%
Middle progress group 50% * 50%
Lower progress group 28% * 25%
Data Source: DECD special extract from Student DataWarehouse, July 2017.*NOTE: Reporting of data not provided when less than six students in the respective cohort. Due to rounding of percentages, data may not add up to 100%.
Data Source: DECD special extract from Student DataWarehouse, July 2017.*NOTE: Reporting of data not provided when less than six students in the respective cohort. Due to rounding of percentages, data may not add up to 100%.
No. of students who sat the test^
No. of students achieving in the upper two bands
% of students achieving in the upper two bands**
Reading Numeracy Reading Numeracy Reading NumeracyYear 9 2017 166 166 30 21 18% 13%
Year 9 2015-17 Average 183.3 183.7 39.0 29.0 21% 16%
This measure shows the number of non-exempt students enrolled at the time of NAPLAN testing who have demonstrated achievement in the relevant NAPLAN higher bands.
NAPLAN Upper Two Bands Achievement
Data Source: DECD special extract from NAPLAN SA TAA data holdings, July 2017.^includes absent and withdrawn students.*Reporting of data not provided when less than six students in the respective cohort.**Percentages have been rounded off to the nearest whole number.
| Blackwood High School2017 Annual Report to the School Community 4

South Australian Certificate of Education - SACESACE Stage 2 Grades – Percentage of grades that are C- or above for attempted SACE subjects (SEA).
Data Source: SACE Schools Data reports, extracted February 2017.*NOTE: Reporting of data not provided when less than six students in the respective cohort.
SACE Stage 2 Grade distributionGrade 2014 2015 2016 2017
A+ 1% 0% 1%A 4% 5% 5%A- 8% 10% 9%B+ 13% 14% 15%B 12% 14% 17%B- 14% 16% 18%C+ 17% 14% 14%C 14% 16% 15%C- 8% 8% 7%D+ 3% 2% 1%D 2% 1% 0%D- 1% 0% 0%E+ 1% 0% 0%E 1% 0% 0%E- 0% 0% 0%N 0% 0% 0%
SACE Completion - Percentage of completers out of those students who had the potential to complete their SACE that year.
2014 2015 2016 201794% 96% 100%
Data Source: SACE Schools Data reports, extracted February 2017.*NOTE: Reporting of data not provided when less than six students in the respective cohort.
2014 2015 2016 201792% 97% 99%
2014 2015 2016 2017Percentage of year 12 students undertaking vocational training or trade training
Percentage of year 12 students attaining a year 12 certificate or equivalent VET qualification
Data Source: SACE Schools Data reports, extracted February 2017.*NOTE: Reporting of data not provided when less than six students in the respective cohort. Due to rounding of percentages, data may not add up to 100%.
| Blackwood High School2017 Annual Report to the School Community5
0.16%
0.16%
0.00%
0.00%
0.95%
6.31%
12.78%
15.93%
8.83%
15.14%
17.03%
15.62%
0.79%
0.32%
0.79%
5.21%
97.7%
99.19%
99.19
42.7
94%
45.87% 47.75% 49.22%
96% 100%

Year level 2014 2015 2016 2017Primary Other 85.8%
Year 8 94.5% 93.0% 92.9% 94.0%Year 9 91.5% 91.9% 91.3% 91.6%
Year 10 90.9% 91.0% 90.7% 90.4%Year 11 90.1% 89.3% 89.9% 91.1%Year 12 88.5% 92.4% 89.2% 87.5%
Secondary Other 70.1% 82.3% 83.7% 79.9%Total 91.0% 91.4% 90.7% 90.9%
Attendance
Data Source: Site Performance Reporting System, Semester 1 Attendance.Note: A blank cell indicates there were no students enrolled.
School Performance Comment
| Blackwood High School2017 Annual Report to the School Community 6
The participation rate for students who sat the Year 9 NAPLAN was between 84 - 86% with approximately 14 studentswithdrawn and 7 to 11 students absent. Overall fewer students were withdrawn and exempted, however more students wereabsent. In 2018 there will be a focus on NAPLAN attendance to improve participation rates.
Analysis of the Mean Scores for the Proficiency Bands indicates:- for writing and numeracy the score remained the same compared to 2016- there was a one band decrease in reading, spelling, grammar and punctuation.When results are compared to the 2015 mean scores, the scores are of similar nature and this has been attributed to thecomposition of students as there were a group of accelerated students in 2016. However, for the last 3 years the number ofstudents achieving the DECD Standard of Education Achievement (SEA) has declined and needs to be addressed.
Student progress between the 2015 and 2017 tests shows that there was an increase from the state average in the mid toupper progress group for Reading. Similarly in numeracy there are more students showing growth in the mid to upper progressgroups.
Moving forward we will work with students to move beyond the middle proficiency bands of 7 - 8, where the majority of ourstudents sit, across all 5 aspects, and look at key improvements and strategies to move students into the higher bands of 9-10.
SACE completion has improved over the last 3 years and has remained consistent; in 2017 99.2% of potential SACEcompleters achieved their SACE with 95 students receiving an ATAR. SACE completion has been higher than the stateaverage over the last 3 years. The highest ATAR was 99.65 and one Merit was awarded.
97.7% of the grades achieved were at a 'C' grade or higher. There were 105 A grades (A+ to A-) compared to 97 in 2016 and100 in 2015.The focus for 2018 will be to move more students from the B and C bands into the upper grade bands. Strategies forimprovement will include:- strategic monitoring and tracking of student progress to inform teaching practice and to identify strategic support for students
at grade point- case management of students 'at risk' to provide support for students’ academic and social-emotional needs- continued internal and external moderation processes to ensure consistency of teacher judgement- collaborative curriculum work on assessment task design to promote intellectual challenge and stretch- improved submission of work processes
48.36% of SACE completers also studied VET. 23 students would not have achieved their SACE without VET. 59 studentscompleted VET certificates, which included 2 students fully completing a Certificate I, 9 students successfully completing aCertificate II, and 20 students completed a full Certificate III.
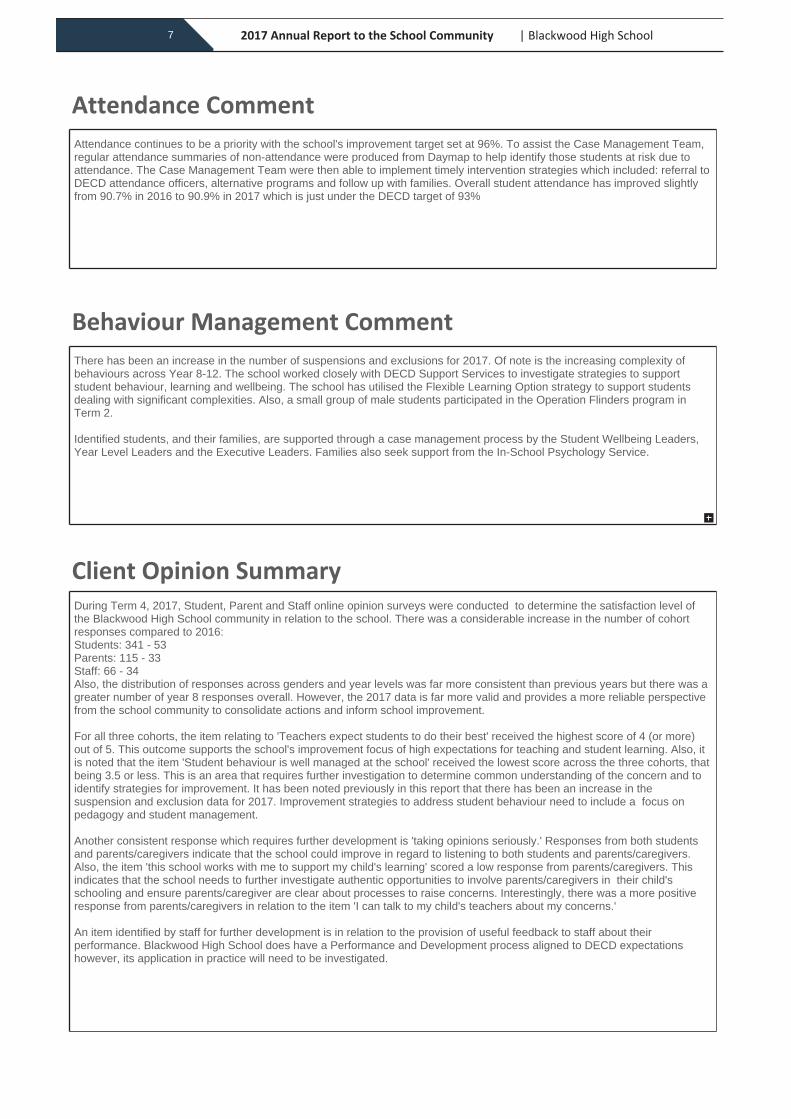
Behaviour Management Comment
Client Opinion Summary
Attendance Comment
| Blackwood High School2017 Annual Report to the School Community7
There has been an increase in the number of suspensions and exclusions for 2017. Of note is the increasing complexity ofbehaviours across Year 8-12. The school worked closely with DECD Support Services to investigate strategies to supportstudent behaviour, learning and wellbeing. The school has utilised the Flexible Learning Option strategy to support studentsdealing with significant complexities. Also, a small group of male students participated in the Operation Flinders program inTerm 2.
Identified students, and their families, are supported through a case management process by the Student Wellbeing Leaders,Year Level Leaders and the Executive Leaders. Families also seek support from the In-School Psychology Service.
During Term 4, 2017, Student, Parent and Staff online opinion surveys were conducted to determine the satisfaction level ofthe Blackwood High School community in relation to the school. There was a considerable increase in the number of cohortresponses compared to 2016:Students: 341 - 53Parents: 115 - 33Staff: 66 - 34Also, the distribution of responses across genders and year levels was far more consistent than previous years but there was agreater number of year 8 responses overall. However, the 2017 data is far more valid and provides a more reliable perspectivefrom the school community to consolidate actions and inform school improvement.
For all three cohorts, the item relating to 'Teachers expect students to do their best' received the highest score of 4 (or more)out of 5. This outcome supports the school's improvement focus of high expectations for teaching and student learning. Also, itis noted that the item 'Student behaviour is well managed at the school' received the lowest score across the three cohorts, thatbeing 3.5 or less. This is an area that requires further investigation to determine common understanding of the concern and toidentify strategies for improvement. It has been noted previously in this report that there has been an increase in thesuspension and exclusion data for 2017. Improvement strategies to address student behaviour need to include a focus onpedagogy and student management.
Another consistent response which requires further development is 'taking opinions seriously.' Responses from both studentsand parents/caregivers indicate that the school could improve in regard to listening to both students and parents/caregivers.Also, the item 'this school works with me to support my child's learning' scored a low response from parents/caregivers. Thisindicates that the school needs to further investigate authentic opportunities to involve parents/caregivers in their child'sschooling and ensure parents/caregiver are clear about processes to raise concerns. Interestingly, there was a more positiveresponse from parents/caregivers in relation to the item 'I can talk to my child's teachers about my concerns.'
An item identified by staff for further development is in relation to the provision of useful feedback to staff about theirperformance. Blackwood High School does have a Performance and Development process aligned to DECD expectationshowever, its application in practice will need to be investigated.
Attendance continues to be a priority with the school's improvement target set at 96%. To assist the Case Management Team,regular attendance summaries of non-attendance were produced from Daymap to help identify those students at risk due toattendance. The Case Management Team were then able to implement timely intervention strategies which included: referral toDECD attendance officers, alternative programs and follow up with families. Overall student attendance has improved slightlyfrom 90.7% in 2016 to 90.9% in 2017 which is just under the DECD target of 93%

Intended Destination
DECD Relevant History Screening
Data Source: Education Department School Administration System (EDSAS) Data extract Term 3 2017.
SchoolLeave Reason Number %
Employment 8 3.1%Interstate/Overseas 37 14.3%Other 2 0.8%Seeking Employment 2 0.8%Tertiary/TAFE/Training 4 1.5%Transfer to Non-Govt School 23 8.9%Transfer to SA Govt School 37 14.3%Unknown 146 56.4%Unknown (TG - Not Found) 0 NA
| Blackwood High School2017 Annual Report to the School Community 8
All staff, volunteers and external providers and contractors, as well as pre-service teachers, have current, relevant screeningrequirements including DCSI requirements. An extensive induction process and checklist is in place for all newly appointedstaff, temporary relief teachers and pre-service staff.

All teachers at this school are qualified and registered with the SA Teachers Registration Board.
Qualification Level Number of QualificationsBachelor Degrees or Diplomas 112Post Graduate Qualifications 54
Please note: Staff who have more than 1 qualification will be counted more than once in the above qualification table. Therefore the total number of staff by qualification type may be more than the total number of teaching staff.
Workforce Composition including Indigenous staff
Teaching Staff Non-Teaching StaffIndigenous Non-Indigenous Indigenous Non-Indigenous
Full-Time Equivalents 0.0 63.0 0.0 17.7Persons 0 70 0 22
Funding Source AmountGrants: State
Grants: Commonwealth
Parent Contributions
Fund Raising
Other
Data Source: DECD HR Management Reporting System, extracted Term 3 2017.
Data Source: DECD HR Management Reporting System, extracted Term 3 2017.
Data Source: Data Source: Education Department School Administration System (EDSAS).
Teacher Qualifications and Workforce Composition
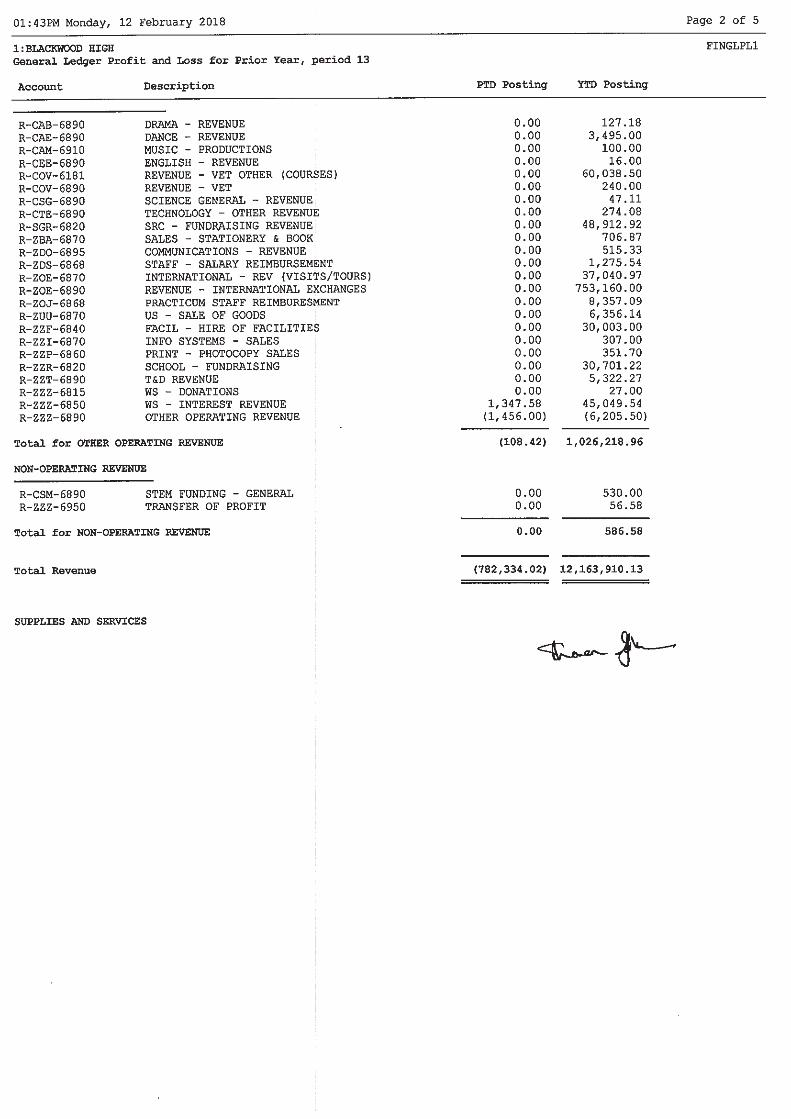
Financial Statement
| Blackwood High School2017 Annual Report to the School Community9
$30,701.22
$18,490.00
$10,206,771.49
$996,104.32
$911,843.10

2017
Sch
ool A
nnua
l Rep
ort:
Tier
2 F
undi
ng R
epor
t*
Tier
2 F
undi
ng
Sect
ion
Tier
2 C
ateg
ory
(whe
re a
pplic
able
to
the
site)
Brie
fly d
escr
ibe
how
the
2017
fund
ing
was
use
d to
impr
ove
the
rele
vant
St
anda
rd o
f Edu
catio
nal A
chie
vem
ent (
SEA)
out
com
esO
utco
mes
ach
ieve
d or
pro
gres
s to
war
ds th
ese
outc
omes
Impr
oved
Beh
avio
ur M
anag
emen
t and
En
gage
men
t
Targ
eted
Fun
ding
for
Indi
vidu
al S
tude
nts
Impr
oved
Out
com
es fo
r Stu
dent
s with
an
Add
ition
al L
angu
age
or D
iale
ct
Impr
oved
Out
com
es fo
r Stu
dent
s with
Di
sabi
litie
s
Targ
eted
Fun
ding
for
Grou
ps o
f Stu
dent
s
Impr
oved
Out
com
es fo
r - R
ural
& Is
olat
ed S
tude
nts
- Abo
rigin
al S
tude
nts
- Num
erac
y an
d Li
tera
cy
Firs
t Lan
guag
e M
aint
enan
ce &
De
velo
pmen
tSt
uden
ts ta
king
Alte
rnat
ive
Path
way
sSt
uden
ts w
ith L
earn
ing
Diffi
culti
es
Gran
t
Prog
ram
Fun
ding
for
all S
tude
nts
Aust
ralia
n Cu
rric
ulum
Abor
igin
al L
angu
ages
Pro
gram
s In
itiat
ives
Bett
er S
choo
ls Fu
ndin
g
Oth
er D
iscre
tiona
ry
Fund
ing
Spec
ialis
t Sch
ool R
epor
ting
(as
requ
ired)
Impr
oved
Out
com
es fo
r Gift
ed
Stud
ents
Prim
ary
Scho
ol C
ouns
ello
r (if
appl
icab
le)
*Tie
r 2 fu
ndin
g pr
ovid
es a
dditi
onal
reso
urce
s to
supp
ort s
tude
nts w
ho a
re u
nlik
ely
to o
btai
n th
e de
sired
out
com
es w
ithou
t fur
ther
supp
ort.
NA
Sta
ffing
ofth
eTe
achi
ngan
dLe
arni
ngC
entre
whi
chpr
ovid
esad
ditio
nall
earn
ing
supp
ortf
orst
uden
tsto
supp
ortl
itera
cyan
dnu
mer
acy
impr
ovem
enta
ndco
mpl
etio
nof
asse
ssm
entt
asks
.
Sch
oolS
uppo
rtst
affp
rovi
ded
supp
ortf
orid
entif
ied
stud
ents
toas
sist
lear
ning
and
beha
viou
r
Con
tinue
did
entif
icat
ion
and
acce
lera
tion
ofst
uden
tsfo
rsin
gle
and
grou
psof
subj
ects
.In
divi
dual
Edu
catio
nP
lans
deve
lope
das
part
ofth
eco
urse
coun
selli
ngpr
oces
san
das
need
ed.
Iden
tifie
dst
uden
tssu
ppor
ted
incl
ass
byan
SS
Ofo
rlite
racy
/num
erac
ysu
ppor
t.
EA
LDsu
ppor
tfor
iden
tifie
dst
uden
ts
NA
Abo
rigin
alst
uden
tsm
onito
red
and
supp
orte
dby
Stu
dent
Wel
lbei
ngLe
ader
san
dY
ear
Leve
ltea
ms
NA
99.1
9S
AC
Eco
mpl
etio
n;Im
prov
edgr
ades
inS
AC
E
Pro
gres
sin
enga
gem
enta
ndso
me
achi
evem
enti
nth
eA
ustra
lian
Cur
ricul
um.
100%
pass
atth
ehi
gher
year
leve
lof
subj
ects
Ach
ieve
men
tin
IBM
YP
ofgr
ade
3or
high
er
100%
ofel
igib
leE
ALD
stud
ents
achi
eved
the
SA
CE
.
Pro
gres
sin
enga
gem
enta
ndac
hiev
emen
tin
IBM
YP
ofgr
ade
3or
high
eran
dS
AC
EC
grad
eor
high
er